Eat well. Save time. Live beer. Annual Report 2019

Welcome message from author
This document is posted to help you gain knowledge. Please leave a comment to let me know what you think about it! Share it to your friends and learn new things together.
Transcript

Eat well. Save time. Live better. Annual Report 2019
Our growth drivers
In this year’s report
Strategic reportOur business
02 Our new purpose
03 Q&A with our CEO
06 Group highlights
07 At a glance
08 Our great local brands
17 Our Leading Together strategy
18 Our growth drivers18 – Omnichannel growth19 – Technology20 – Healthy and sustainable22 – Portfolio and scale
efficiencies23 – Best talent
24 Value creation
27 Creating value for our stakeholders
27 – Customers29 – Associates31 – Communities33 – Shareholders
Performance review
34 Group financial review
45 Group non-financial review
53 Financial review by segment
63 Outlook
64 Information about Ahold Delhaize shares
66 Five-year overview
68 Definitions: Performance measures
Appendix216 Contact information
217 Key dates
218 Cautionary notice
Financial performanceFinancial statements
120 Consolidated income statement
121 Consolidated statement of comprehensive income
122 Consolidated balance sheet
123 Consolidated statement of changes in equity
124 Consolidated statement of cash flows
125 Notes to the consolidated financial statements
193 Parent company financial statements
195 Notes to the parent company financial statements
Other information
204 Assurance report on the financial statements
213 Assurance report on non-financial information
215 Distribution of profit
215 Details of special shareholder rights
215 Details of shares without profit rights and non-voting shares
GovernanceGovernance
74 Our Management Board and Executive Committee
76 Our Supervisory Board
78 Corporate governance
84 Letter from the Supervisory Board Chairman
85 Supervisory Board report
91 How we manage risk
105 Declarations
Remuneration
106 Letter from the Remuneration Committee Chairman
107 Remuneration policy
110 2019 Remuneration
Our new purpose
page 2
Financial highlights
page 6
page 18
A guide to using this report
Use the tabs and contents button at the top of the page to navigate around the document
Page reference to more information elsewhere in this document
More information is available on our website and reporting hub
For best results, view this interactive pdf with Adobe Acrobat Reader or iBooks.
Financial statements Other informationStrategic Report Governance Financial performance AppendixGovernance RemunerationOur business Performance review Ahold Delhaize Annual Report 2019 01

Our new purpose
Eat well. Save time. Live better.Our new purpose helps us answer the question: what difference are we going to make?Millions of customers around the world turn to our great local brands for their daily needs – and our brands are well-positioned to make a positive difference in their well-being.People’s wants and needs are diverse, but there are three things we believe they all deserve, and that we can have an impact on:
People are busy. And in this hectic world, anything we can do to make things
quicker, smoother and easier is a good thing.
Not only do we want to make it easy for people to choose a
healthy, balanced diet, but also have access to products that are high quality, responsibly sourced
– and of course, delicious!
For some, this means healthy eating. For others, shopping more
inexpensively or more ethically. Whatever it means to our
customers, associates and communities, we’re committed
to helping make it happen.
Financial statements Other informationStrategic Report Governance Financial performance AppendixGovernance RemunerationOur business Performance review Ahold Delhaize Annual Report 2019 02
During the busy Easter period, the strike at Stop & Shop, in New England, had a significant impact on our results. In the end, Stop & Shop was able to reach fair and responsible agreements for local associates, and I am pleased and grateful that customers returned to its stores during the second half of the year.
Q How would you characterize our 2019 financial results?
A Thanks to our omnichannel strategy, we had a strong performance in 2019,
both in stores and online. Our net sales were €66.3 billion. We grew net consumer online sales 28.6% at constant exchange rates across the group; we saw it accelerate in the U.S. and continue at a very strong pace in Europe. In addition, we officially closed our merger integration efforts and overdelivered on the synergies we promised.
We exceeded our full-year 2019 guidance outlook for underlying earnings per share with 8.4% growth, and met our free cash flow guidance of €1.8 billion. I was pleased that we also surpassed our guidance for our Save for Our Customers program, generating €709 million in savings compared to our guidance of €600 million. In addition, we have proposed a 2019 dividend increase of 8.6%, which reflects our ambition to sustainably grow the dividend per share.
Since this is the last Annual Report our CFO Jeff Carr will be a part of before he leaves our company, I want to take the opportunity to thank him for all his contributions. He has been a great partner in shaping Ahold Delhaize over the past eight years, helping us drive our Save for Our Customers program and deliver on our commitments.
Q What were the most important achievements the company made on the growth drivers over the year?
A Our growth drivers are the areas that we need to focus on, working together as a
company, in the coming years to drive sustainable, profitable growth. We made a lot of progress on these in 2019 – you’ll find examples throughout this report, but I’ll mention three highlights.
First, omnichannel growth has been an important area of focus. We’ve expanded our store network with innovative new urban formats – such as Giant Heirloom in the U.S. and Fresh Atelier in Belgium. And we’re helping people save time by rolling out frictionless shopping solutions. Our U.S. businesses did a phenomenal job in expanding the number of click-and-collect points, resulting in a total of 692 locations at the end of 2019, boosting our omnichannel growth considerably.
Q How would you look back on 2019?
A It was our first full calendar year implementing our Leading Together
strategy and our growth drivers. These growth drivers have helped us to further strengthen our leading positions across the company.
Our local brands remained closely knit to their communities, working hand-in-hand with local suppliers and being good employers for our 380 thousand people. This “localness” is something we believe in, that our customers appreciate and that is benefiting our business.
In 2019, we also had our challenges. In October, we experienced a terrible tragedy when a bus accident in Romania took the lives of eight Mega Image associates and injured seven more. It’s so important that we come together in times like these, and I was moved by how colleagues across the company showed their sympathy by contributing to a fund in support of the victims and their families.
with Frans Muller President and CEO
We sat down with our CEO, Frans Muller, to talk about the highlights of the past year and what’s most important for driving Ahold Delhaize’s success.
Financial statements Other informationStrategic Report Governance Financial performance AppendixGovernance RemunerationOur business Performance review Ahold Delhaize Annual Report 2019 03
In both Europe and the U.S., we’re linking together with other companies and educational institutes to make sure we have the capabilities and the talent to drive advances in digital and technology.
Second, we continued to reduce CO2 emissions from our own operations as well as from the production of our own-brand products, investing in more efficient energy, refrigeration and transportation systems. We also made progress on plastic waste reduction; for example, we reduced the number of non-reusable bags used in our businesses by more than 600 million.
Finally, health is another big area of focus. In 2019, many of our brands continued reformulating their own-brand products to make them healthier and expanded their use of nutritional navigation programs such as Guiding Stars and Nutri-Score to help customers make healthier choices as they shop.
And “live better” has everything to do with how we can contribute as a company to make communities thrive, to improve health – especially for children and young people – and to support the well-being of our associates. People across our company feel a strong responsibility for doing our part to make our communities healthier, happier and more successful.
Q Why is the new healthy and sustainable ambition for 2025 so important?
A Our world today is facing serious challenges – many of which are related
to food and the food chain; for example, the rise of lifestyle-related diseases like diabetes, which places stress on global health systems, and climate change, which is putting pressure on global food production. We want to help make a positive change in people’s well-being and build the foundation of our business in the long run through our healthy and sustainable growth driver.
We are on track towards most of our 2020 Sustainable Retailing targets – which were quite ambitious when we set them in 2016. I was pleased that we once again ranked among industry leaders in the Dow Jones Sustainability World Index. We’ve made progress in almost every area we chose to focus on and have developed more professionalism around sustainable retailing within our company.
Q What does the new purpose mean to you?
A Being in the food business, we are very close to the daily lives of 54 million
customers each week, of our associates who work together with us as a team, and of our communities where we want to support health and well-being. To me, our new purpose radiates and reflects the passion we have for food and for our communities.
“Eat well” is about our passion for food, the respect we have for farming communities, our collaboration with the manufacturers of our products – all of which help us provide a wider variety of fresh, healthy food, and innovative new products for our customers to enjoy.
We know that customers’ lives are getting busier. We want to help people “save time” so they can dedicate their precious hours to the most important things in their lives. We’re doing this by helping them build lists and prepare for the shopping trip, by providing a more efficient shopping experience through a mix of stores, pick-up points and home delivery, and by offering easy recipes and meal solutions that help them get a healthy dinner on the table for their families.
Q&A with Frans Muller
We’re working to get to a more sustainable supply chain, together with our vendors and partners. This means partnering with suppliers to source sustainably-produced critical commodities. It means improving social compliance in high-risk countries. And it means using our influence where we can to ensure good working conditions for the people who make our products.
This is the second year that we’ve published an annual report combining both our financial and non-financial results. By openly sharing our performance towards our targets and having our numbers assured, we are showing how seriously we take our sustainable retailing agenda. In this year’s report, we proudly launch a new set of targets for 2025. They build on the progress we’ve already made and focus our efforts on the areas where we believe we can create the most value for our stakeholders and our business: helping customers make healthier and more informed choices, increasing product transparency and eliminating waste.
Q What were you most proud of during the year?
A I’m proud of the positive way we stepped up collaboration between teams – how
we came together across countries, brands and geographies – to fulfill our purpose, but also contribute more to our communities. We ramped up our digital strategy and organization and became more of an omnichannel company.Our growth drivers
Omnichannel growth
Technology Healthy and sustainable
Portfolio and scale efficiencies
Best talent
For more details on each of Our growth drivers, see pages 18–23
Financial statements Other informationStrategic Report Governance Financial performance AppendixGovernance RemunerationOur business Performance review Ahold Delhaize Annual Report 2019 04
Of course, everything we achieved comes down to our people. I’m proud of and grateful to our associates, whose hard work and dedication made it all happen. They are there for our customers and communities in countless ways, every day. One notable example from the year was the Food Lion team, who not only pledged to expand the fight against hunger and donate one billion meals to neighbors in need – a promise they are already well on their way to fulfilling – but also provided tireless support when Hurricane Dorian hit the U.S. East Coast. Local teams worked day in and day out to supply communities with food and other supplies – it showed me the meaningful ways that we can impact people’s lives.
And I’m also proud that we improved our associate engagement – which shows that we’re creating a culture where people feel included, can relate to our purpose and see growth opportunities. We also improved our performance in diversity and inclusion, an area that is very important to me as we strive towards a workforce that reflects the diversity of the communities we serve. I was especially proud to sign the UN CEO Statement of Support for the Women’s Empowerment Principles during the year, as a sign of my own personal commitment to gender equality.
And I want us to become a true omnichannel company, not just in terms of our store network, online, and pickup but in providing meal solutions and making fresh foods affordable and accessible so that they can occupy a bigger portion of the plate for the customers and communities we serve.
Q Any final thoughts you would like to share?
A Our great local brands operate 6,967 stores – many of which sit at the center of
their communities. In some small towns our brands are the last retailer remaining to supply a good grocery offer and healthy, fresh food.
I’m convinced we have a unique opportunity to set up customers and communities for success by making nutritious and healthy food accessible. We know that good health is very much linked to good food; and health in turn is linked to overall happiness and well-being, and the ability to create a good life.
As a food retailer, we are also able to support economic development in our communities by offering employment to people of different backgrounds, generations and education, including many who face challenges finding employment or might otherwise be left behind.
Contributing to our communities in this way is an important part of our values – and has been for a very long time. Many of our local brands started as family businesses, as far back as 150 years ago. It’s in our DNA to want to take care of the people living in our communities and working for our company, to maintain long-standing relationships with vendors, and to contribute wherever we can. As a food retailer, I believe we have a chance to do great things – and that’s why I’m happy to be a part of our company and our industry – Leading Together!
Q What are your expectations for the year ahead?
A I would like us to continue developing our proposition for customers, leveraging
the best from all of our brands, especially when it comes to health and nutrition, and the information and ideas we provide to help people make healthier choices. When customers think of fresh, healthy and tasty food for their families, I would like them to think of our brands first.
I would also like to see us make a big leap forward in technology and digital, getting customers more connected to our company but also helping them design their own lives in better, healthier ways. This is why our participation in initiatives like Kickstart AI, to boost the artificial intelligence ecosystem in the Netherlands, will continue to be so important. We want to connect with customers through an ecosystem that is broader than only selling products and involves advising people about food and innovations that can contribute to good health.
Q&A with Frans Muller
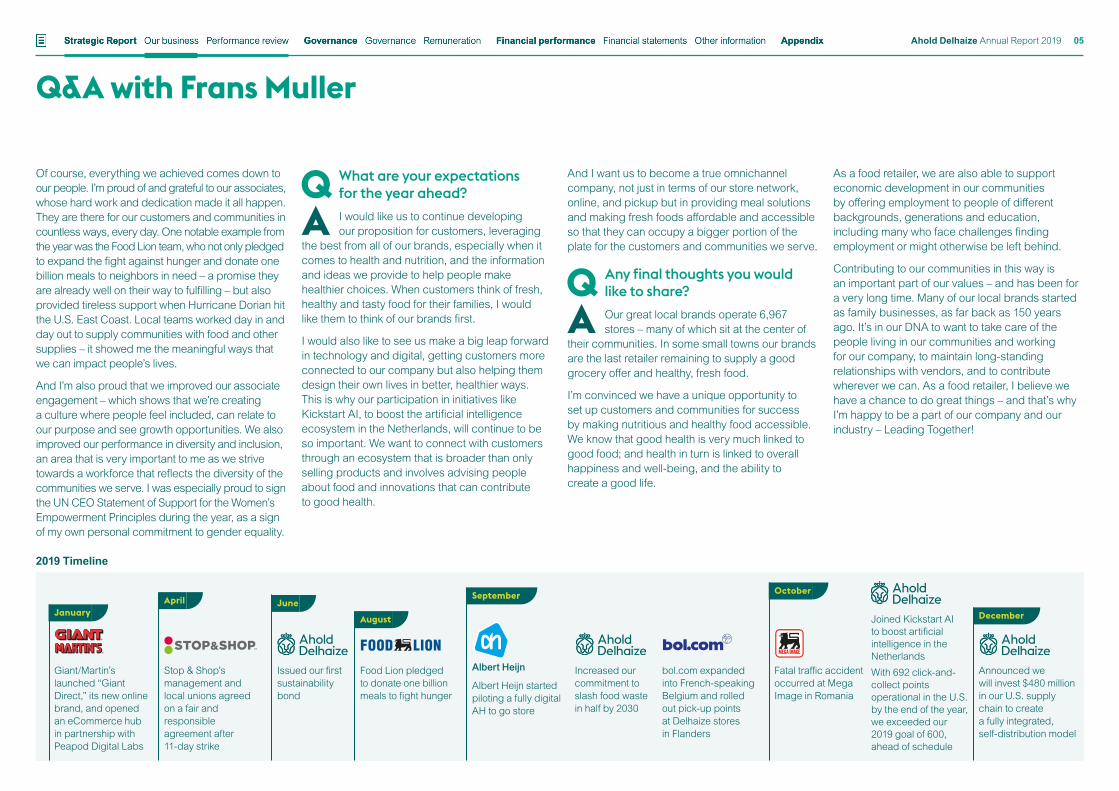
2019 Timeline
JuneAugust
September October
January DecemberApril
Stop & Shop’s management and local unions agreed on a fair and responsible agreement after 11-day strike
Issued our first sustainability bond
Food Lion pledged to donate one billion meals to fight hunger
Albert Heijn started piloting a fully digital AH to go store
Albert Heijn Increased our commitment to slash food waste in half by 2030
bol.com expanded into French-speaking Belgium and rolled out pick-up points at Delhaize stores in Flanders
Fatal traffic accident occurred at Mega Image in Romania
Joined Kickstart AI to boost artificial intelligence in the Netherlands
With 692 click-and-collect points operational in the U.S. by the end of the year, we exceeded our 2019 goal of 600, ahead of schedule
Announced we will invest $480 million in our U.S. supply chain to create a fully integrated, self-distribution model
Giant/Martin’s launched “Giant Direct,” its new online brand, and opened an eCommerce hub in partnership with Peapod Digital Labs
Financial statements Other informationStrategic Report Governance Financial performance AppendixGovernance RemunerationOur business Performance review Ahold Delhaize Annual Report 2019 05
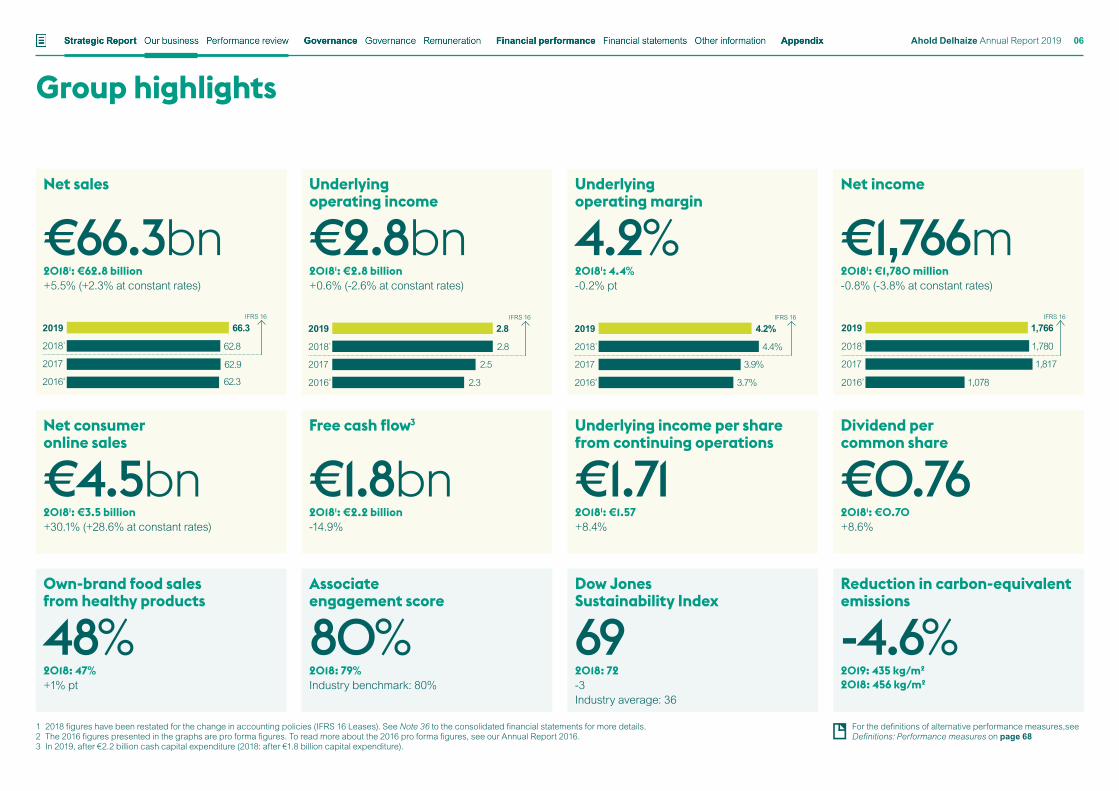
Group highlights
Net consumer online sales
€4.5bn20181: €3.5 billion +30.1% (+28.6% at constant rates)
Underlying income per share from continuing operations
€1.7120181: €1.57+8.4%
Dow Jones Sustainability Index
692018: 72-3 Industry average: 36
Dividend per common share
€0.7620181: €0.70+8.6%
Reduction in carbon-equivalent emissions
-4.6%2019: 435 kg/m2
2018: 456 kg/m2
Own-brand food sales from healthy products
48%2018: 47%+1% pt
Free cash flow3
€1.8bn20181: €2.2 billion-14.9%
Associate engagement score
80%2018: 79%Industry benchmark: 80%
1 2018 figures have been restated for the change in accounting policies (IFRS 16 Leases). See Note 36 to the consolidated financial statements for more details.2 The 2016 figures presented in the graphs are pro forma figures. To read more about the 2016 pro forma figures, see our Annual Report 2016.3 In 2019, after €2.2 billion cash capital expenditure (2018: after €1.8 billion capital expenditure).
For the definitions of alternative performance measures,see Definitions: Performance measures on page 68
Net sales
€66.3bn20181: €62.8 billion+5.5% (+2.3% at constant rates)
62.9
62.8
66.3
62.3
2019
20181
2017
20162
IFRS 16
Underlying operating income
€2.8bn20181: €2.8 billion+0.6% (-2.6% at constant rates)
2.5
2.8
2.8
2.3
2019
20181
2017
20162
IFRS 16
Underlying operating margin
4.2% 20181: 4.4% -0.2% pt
3.9%
4.4%
4.2%
3.7%
2019
20181
2017
20162
IFRS 16
Net income
€1,766m20181: €1,780 million-0.8% (-3.8% at constant rates)
1,817
1,780
1,766
1,078
2019
20181
2017
20162
IFRS 16
Financial statements Other informationStrategic Report Governance Financial performance AppendixGovernance RemunerationOur business Performance review Ahold Delhaize Annual Report 2019 06
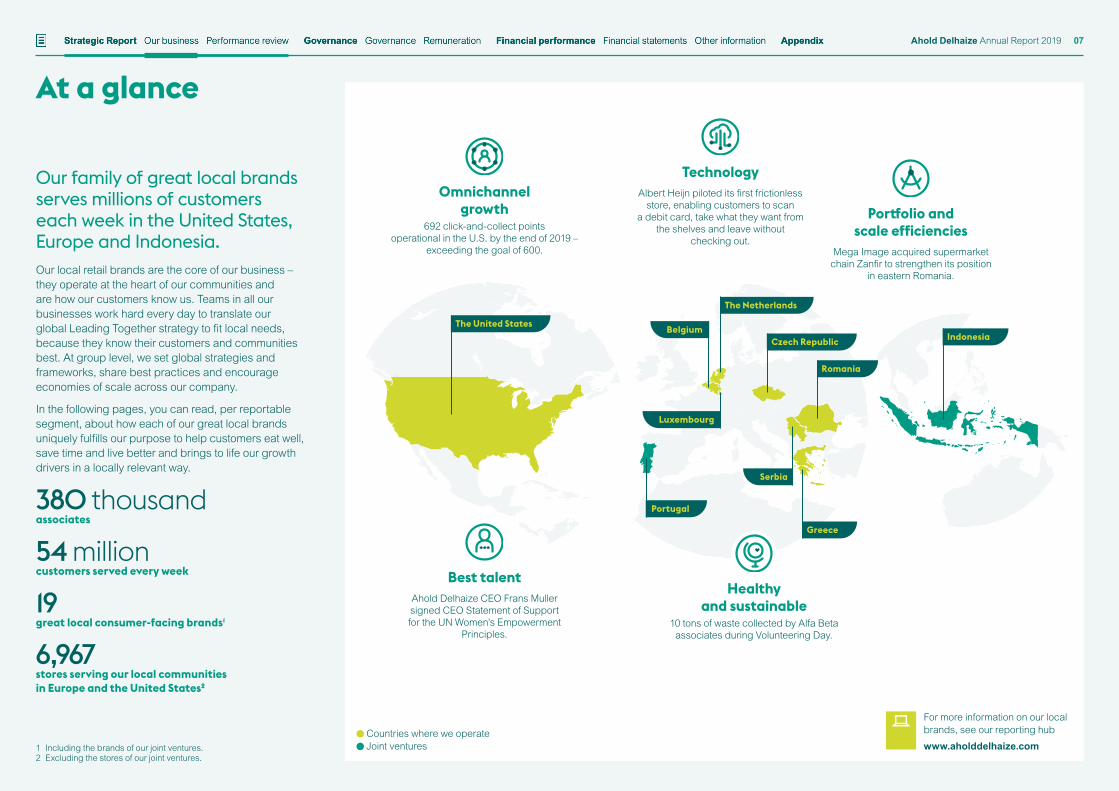
At a glance
Our family of great local brands serves millions of customers each week in the United States, Europe and Indonesia. Our local retail brands are the core of our business – they operate at the heart of our communities and are how our customers know us. Teams in all our businesses work hard every day to translate our global Leading Together strategy to fit local needs, because they know their customers and communities best. At group level, we set global strategies and frameworks, share best practices and encourage economies of scale across our company.
In the following pages, you can read, per reportable segment, about how each of our great local brands uniquely fulfills our purpose to help customers eat well, save time and live better and brings to life our growth drivers in a locally relevant way.
TechnologyAlbert Heijn piloted its first frictionless
store, enabling customers to scan a debit card, take what they want from
the shelves and leave without checking out.
Omnichannel growth
692 click-and-collect points operational in the U.S. by the end of 2019 –
exceeding the goal of 600.
Best talentAhold Delhaize CEO Frans Muller signed CEO Statement of Support for the UN Women’s Empowerment
Principles.
Countries where we operate Joint ventures
For more information on our local brands, see our reporting hub
www.aholddelhaize.com
The United States
The Netherlands
Czech Republic Indonesia
Romania
Greece
Portugal
Serbia
Belgium
Luxembourg
1 Including the brands of our joint ventures.2 Excluding the stores of our joint ventures.
Healthy and sustainable
10 tons of waste collected by Alfa Beta associates during Volunteering Day.
Portfolio and scale efficiencies
Mega Image acquired supermarket chain Zanfir to strengthen its position
in eastern Romania.
380 thousandassociates
54 millioncustomers served every week
19great local consumer-facing brands1
6,967stores serving our local communities in Europe and the United States2
Financial statements Other informationStrategic Report Governance Financial performance AppendixGovernance RemunerationOur business Performance review Ahold Delhaize Annual Report 2019 07
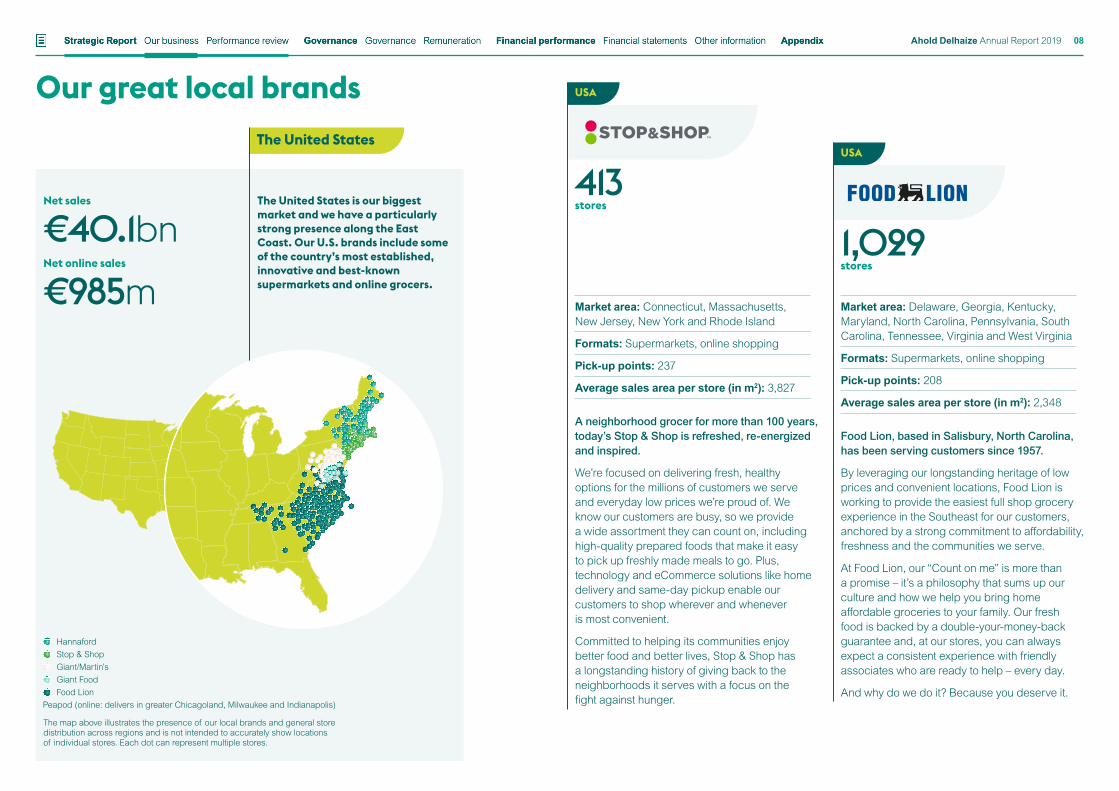
The United States
HannafordStop & ShopGiant/Martin’sGiant FoodFood Lion
The map above illustrates the presence of our local brands and general store distribution across regions and is not intended to accurately show locations of individual stores. Each dot can represent multiple stores.
Peapod (online: delivers in greater Chicagoland, Milwaukee and Indianapolis)
USA
USA
413stores
1,029stores
The United States is our biggest market and we have a particularly strong presence along the East Coast. Our U.S. brands include some of the country’s most established, innovative and best-known supermarkets and online grocers.
Net sales
€40.1bnNet online sales
€985m Market area: Delaware, Georgia, Kentucky, Maryland, North Carolina, Pennsylvania, South Carolina, Tennessee, Virginia and West Virginia
Formats: Supermarkets, online shopping
Pick-up points: 208
Average sales area per store (in m2): 2,348
Food Lion, based in Salisbury, North Carolina, has been serving customers since 1957.
By leveraging our longstanding heritage of low prices and convenient locations, Food Lion is working to provide the easiest full shop grocery experience in the Southeast for our customers, anchored by a strong commitment to affordability, freshness and the communities we serve.
At Food Lion, our “Count on me” is more than a promise – it’s a philosophy that sums up our culture and how we help you bring home affordable groceries to your family. Our fresh food is backed by a double-your-money-back guarantee and, at our stores, you can always expect a consistent experience with friendly associates who are ready to help – every day.
And why do we do it? Because you deserve it.
Market area: Connecticut, Massachusetts, New Jersey, New York and Rhode Island
Formats: Supermarkets, online shopping
Pick-up points: 237
Average sales area per store (in m2): 3,827
A neighborhood grocer for more than 100 years, today’s Stop & Shop is refreshed, re-energized and inspired.
We’re focused on delivering fresh, healthy options for the millions of customers we serve and everyday low prices we’re proud of. We know our customers are busy, so we provide a wide assortment they can count on, including high-quality prepared foods that make it easy to pick up freshly made meals to go. Plus, technology and eCommerce solutions like home delivery and same-day pickup enable our customers to shop wherever and whenever is most convenient.
Committed to helping its communities enjoy better food and better lives, Stop & Shop has a longstanding history of giving back to the neighborhoods it serves with a focus on the fight against hunger.
Our great local brandsFinancial statements Other informationStrategic Report Governance Financial performance AppendixGovernance RemunerationOur business Performance review Ahold Delhaize Annual Report 2019 08
Market area: Maine, Massachusetts, New Hampshire, New York and Vermont
Formats: Supermarkets, online shopping
Pick-up points: 78
Average sales area per store (in m2): 3,056
The Hannaford brothers began selling produce in Portland, Maine, in 1883, but it took a lot more than fresh tomatoes and apples to grow their business. The brothers looked at their customers and understood what they cared about most – family, community, quality, value – and built the business accordingly, with core values that show us the way today.
We’re still connected to those early roots as a local market, and the connection we have to the sources of our fresh foods is core to the way we do business. We’re proud to work with more than 900 local farms and producers, large and small, to bring you more than 7,000 high-quality local products made right here. We love local, and we know you do, too.
We make it easy for customers to shop for great fresh food and to find healthy options, both online and in our stores. We create innovative solutions to serve you in new ways and meet local needs. We treat customers like friends and neighbors because you are. Hannaford is in the community and a part of our customer’s day, every day.
Market area: Delaware, District of Columbia, Maryland and Virginia
Formats: Supermarkets, online shopping
Pick-up points: 111
Average sales area per store (in m2): 3,611
With flexible options and convenient solutions, Giant Food fits all the ways today’s busy consumers want to shop – whether in store, via Giant Pickup or through home delivery from Giant Delivers. Our commitment starts and ends with our customers. For over 75 years, we’ve operated our business with a single goal in mind: delivering unmatched selection, quality and value.
Since we opened Washington D.C.’s first supermarket in 1936, we’ve continued to grow and innovate, pioneering computer-assisted checkout scanning and opening over 150 stores.
At Giant, local is a commitment, not just a label. Each of our local products represents the cities and communities we’re proudly part of.
Market area: Maryland, Pennsylvania, Virginia and West Virginia
Formats: Supermarkets, small urban supermarkets, online shopping
Pick-up points: 135
Average sales area per store (in m2): 3,987
Founded in 1923 in Carlisle, Pennsylvania, Giant/Martin’s is passionate about creating a shopping experience that fits into the lives of our busy customers – no matter where or how they need us.
We’re an omni-channel retailer, proudly serving millions of neighbors in our stores, pharmacies, fuel stations, online pickup hubs and grocery delivery service in hundreds of zip codes.
We’re changing the customer experience, connecting families and creating healthier communities for a better future. All with a simple goal: no matter where you experience Giant, your life gets a little simpler and a little better – so you can get back to what matters most.
The Giant Food Stores family of brands includes:Giant; Martin’s Food Markets; Giant Heirloom Market; Giant Direct; and Martin’s Direct.
163stores182
stores186stores
Our great local brandsUSA
USA
USA
Market area: Greater Chicagoland area, Indianapolis (Indiana) and Milwaukee (Wisconsin)
Formats: Online grocery shopping
For more than 30 years, customers have trusted Peapod to deliver everyday meal solutions to their homes. Peapod delivers much more than groceries: the quality, convenience and value it promises brings ease, inspiration and joy to the customers it serves.
As the first online grocer, Peapod continues to take pride in its innovation and best-in-class service. Customers can shop via an intuitive website or award-winning mobile app with shoppable recipes, useful dietary shopping guides and many other convenient features. They can also choose from a full range of flexible delivery options including early morning and late-night delivery times, unattended service, and expanding same-day service.
Peapod is all about food. In addition to all the fresh variety and pantry staples a typical grocery store offers, Peapod also provides access to select fresh organic produce, easy-to-make “no subscription required” meal kits and artisanal products from smaller local vendors.
Online
USA
Financial statements Other informationStrategic Report Governance Financial performance AppendixGovernance RemunerationOur business Performance review Ahold Delhaize Annual Report 2019 09
Our great local brands
There are two organizations under Ahold Delhaize USA that provide services to support the growth of our consumer-facing brands.
Retail Business Services, LLC, is the services company of Ahold Delhaize USA, providing services to the U.S. brands.
Retail Business Services leverages the scale of the local brands to drive synergies and provides industry-leading expertise, insights and analytics to local brands to support their strategies with services including information technology, merchandising & marketing services, private brand products, pharmacy services, sourcing, not for resale, store services, financial services, legal services, communications, supply chain and people systems and services.
Peapod Digital Labs is the digital and eCommerce engine of Ahold Delhaize USA.
We power digital and eCommerce strategies aimed at engaging consumers no matter when, where or how they choose to shop, and support Ahold Delhaize USA’s great local brands to springboard growth through new eCommerce and digital capabilities.
Today’s consumer is changing, and at Peapod Digital Labs, we’re there for the great local brands we support, augmenting customer-centric online and mobile technologies, driving digitization and personalization, providing leading eCommerce technology and the infrastructure to deliver it, and pioneering the latest technologies in pickup, next-day and same-day delivery. Peapod Digital Labs is helping Ahold Delhaize USA’s local brands to create a better omnichannel experience for their dynamic grocery shoppers.
Services companyServices company
USA
USA
Financial statements Other informationStrategic Report Governance Financial performance AppendixGovernance RemunerationOur business Performance review Ahold Delhaize Annual Report 2019 10
The Netherlands
Belgium
The Netherlands
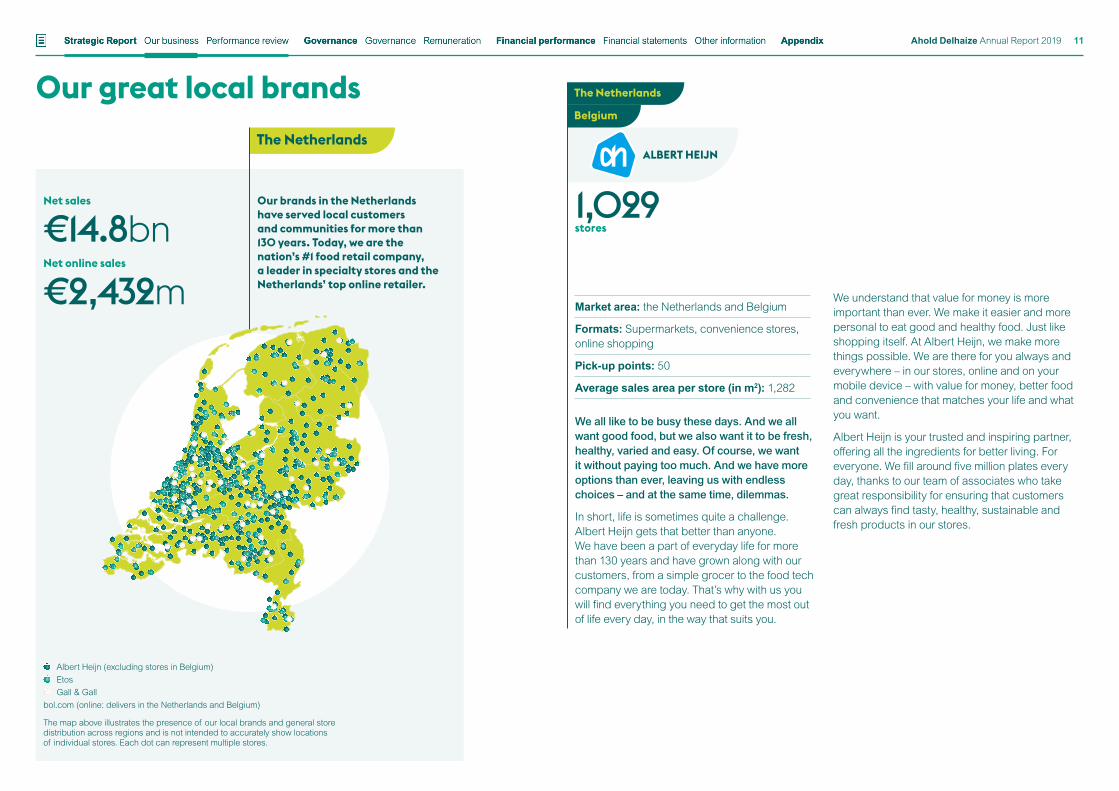
Albert Heijn (excluding stores in Belgium)EtosGall & Gall
The map above illustrates the presence of our local brands and general store distribution across regions and is not intended to accurately show locations of individual stores. Each dot can represent multiple stores.
bol.com (online: delivers in the Netherlands and Belgium)
Market area: the Netherlands and Belgium
Formats: Supermarkets, convenience stores, online shopping
Pick-up points: 50
Average sales area per store (in m2): 1,282
We all like to be busy these days. And we all want good food, but we also want it to be fresh, healthy, varied and easy. Of course, we want it without paying too much. And we have more options than ever, leaving us with endless choices – and at the same time, dilemmas.
In short, life is sometimes quite a challenge. Albert Heijn gets that better than anyone. We have been a part of everyday life for more than 130 years and have grown along with our customers, from a simple grocer to the food tech company we are today. That’s why with us you will find everything you need to get the most out of life every day, in the way that suits you.
We understand that value for money is more important than ever. We make it easier and more personal to eat good and healthy food. Just like shopping itself. At Albert Heijn, we make more things possible. We are there for you always and everywhere – in our stores, online and on your mobile device – with value for money, better food and convenience that matches your life and what you want.
Albert Heijn is your trusted and inspiring partner, offering all the ingredients for better living. For everyone. We fill around five million plates every day, thanks to our team of associates who take great responsibility for ensuring that customers can always find tasty, healthy, sustainable and fresh products in our stores.
Net sales
€14.8bnNet online sales
€2,432m
Our brands in the Netherlands have served local customers and communities for more than 130 years. Today, we are the nation’s #1 food retail company, a leader in specialty stores and the Netherlands’ top online retailer.
1,029stores
ALBERT HEIJN
Our great local brandsFinancial statements Other informationStrategic Report Governance Financial performance AppendixGovernance RemunerationOur business Performance review Ahold Delhaize Annual Report 2019 11
The Netherlands
The Netherlands
Market area: the Netherlands
Formats: Liquor stores, online shopping
Average sales area per store (in m2): 76
At Gall & Gall, we have been selling liquor since 1884 and are the largest specialist in the Netherlands.
Our logo refers to our strong roots. Founder Maria Gall had a motto: “No order too large, no order too small, no order too far.” And although times have changed, our passion to help and inspire customers has remained.
At Gall & Gall, everyone is a connoisseur. We promise that every customer can come home with the right bottle. Even if you don’t know anything about liquor.
Market area: the Netherlands
Formats: Drugstores, online shopping
Average sales area of own-operated stores (in m2): 209
The world has changed a lot in the last century, but so has Etos! One thing has remained the same: whatever your question is, we have been there for you with answers for 100 years.
With the acquisition of the Solvo-groep, Etos made an important step towards defining a new drugstore concept where physical stores are integrated with providing 24-7 information on health. Through the new web platform, Etos customers can ask questions relating to their health and, if desired, book a consultation with a medical service provider.
By joining forces, Etos has become the largest health and wellness platform in the Netherlands. Causes, symptoms, tips and treatments are described on the platform and wide-ranging questions are answered regarding health, beauty, exercise, nutrition and a balanced lifestyle. The online platform offers videos, a symptom checker and personal solutions. Customers can book consultations directly with medical service providers, receive personalized advice from the Etos staff in the stores – including our 2,400 certified druggists – and even find products that can be used to treat symptoms.
In the past eight years, Etos has been declared the Netherlands’ best drugstore by independent researchers GfK no less than seven times and was chosen last year as best personal care retailer chain.
585stores
542stores
Our great local brands
Market area: the Netherlands and Belgium
Formats: Online shopping with a focus on general merchandise
Bol.com started in March 1999. Today, 10.5 million Belgians and Dutch shop on our online retail platform.
With 22 million items, spread over more than 40 product categories, customers can choose from the widest range – including books, e-books, music, films, games, electronics, toys, jewelry and accessories, baby items, garden and DIY items and everything for living, animals, sports, leisure and personal care. To serve customers in the best possible way, bol.com works with more than 20,000 Belgian and Dutch entrepreneurs who sell through its platform.
At bol.com, customers can choose how to pay and when they want their packages delivered. Our competitive prices, great offers and always available customer service means people can shop without worry.
Today, bol.com is a fast-growing network, at the heart of society. We feel responsible for making a positive contribution, so we try to do better every day.
Online
The Netherlands
Belgium
Financial statements Other informationStrategic Report Governance Financial performance AppendixGovernance RemunerationOur business Performance review Ahold Delhaize Annual Report 2019 12
Belgium
Delhaize (excluding stores in Luxembourg)
The map above illustrates the presence of our local brands and general store distribution across regions and is not intended to accurately show locations of individual stores. Each dot can represent multiple stores.
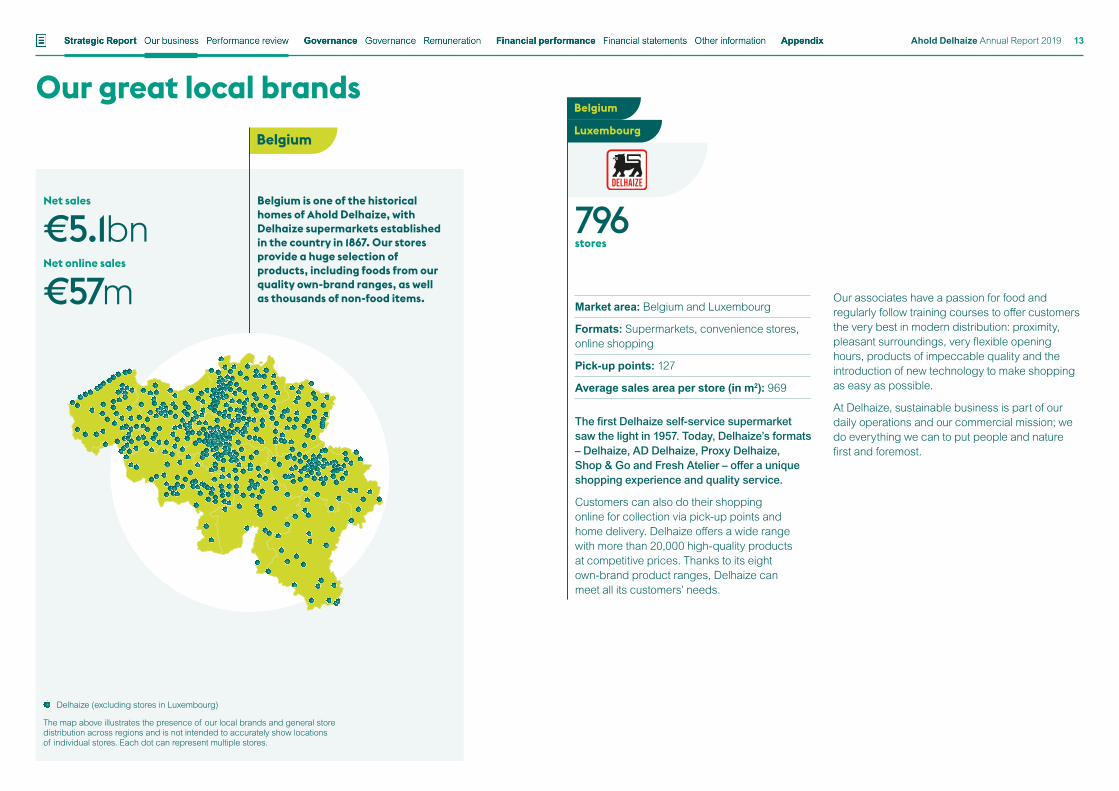
Market area: Belgium and Luxembourg
Formats: Supermarkets, convenience stores, online shopping
Pick-up points: 127
Average sales area per store (in m2): 969
The first Delhaize self-service supermarket saw the light in 1957. Today, Delhaize’s formats – Delhaize, AD Delhaize, Proxy Delhaize, Shop & Go and Fresh Atelier – offer a unique shopping experience and quality service.
Customers can also do their shopping online for collection via pick-up points and home delivery. Delhaize offers a wide range with more than 20,000 high-quality products at competitive prices. Thanks to its eight own-brand product ranges, Delhaize can meet all its customers’ needs.
Our associates have a passion for food and regularly follow training courses to offer customers the very best in modern distribution: proximity, pleasant surroundings, very flexible opening hours, products of impeccable quality and the introduction of new technology to make shopping as easy as possible.
At Delhaize, sustainable business is part of our daily operations and our commercial mission; we do everything we can to put people and nature first and foremost.
796stores
Net sales
€5.1bnNet online sales
€57m
Belgium is one of the historical homes of Ahold Delhaize, with Delhaize supermarkets established in the country in 1867. Our stores provide a huge selection of products, including foods from our quality own-brand ranges, as well as thousands of non-food items.
Our great local brandsLuxembourg
Belgium
Financial statements Other informationStrategic Report Governance Financial performance AppendixGovernance RemunerationOur business Performance review Ahold Delhaize Annual Report 2019 13
Central and Southeastern Europe
The map above illustrates the presence of our local brands and general store distribution across regions and is not intended to accurately show locations of individual stores. Each dot can represent multiple stores.
AlbertMega Image, Shop & GoMaxi, Shop & Go, TempoAlfa Beta, ENA
Greece
Czech Republic
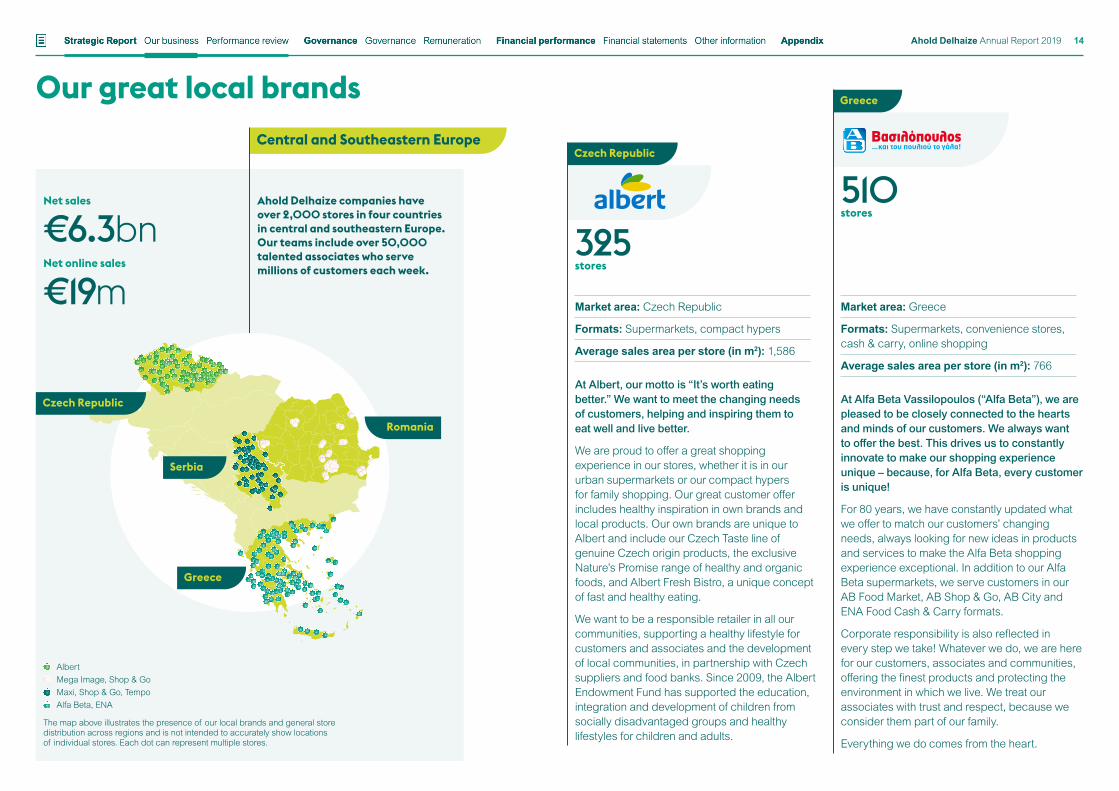
Ahold Delhaize companies have over 2,000 stores in four countries in central and southeastern Europe. Our teams include over 50,000 talented associates who serve millions of customers each week.
Market area: Greece
Formats: Supermarkets, convenience stores, cash & carry, online shopping
Average sales area per store (in m2): 766
At Alfa Beta Vassilopoulos (“Alfa Beta”), we are pleased to be closely connected to the hearts and minds of our customers. We always want to offer the best. This drives us to constantly innovate to make our shopping experience unique – because, for Alfa Beta, every customer is unique!
For 80 years, we have constantly updated what we offer to match our customers’ changing needs, always looking for new ideas in products and services to make the Alfa Beta shopping experience exceptional. In addition to our Alfa Beta supermarkets, we serve customers in our AB Food Market, AB Shop & Go, AB City and ENA Food Cash & Carry formats.
Corporate responsibility is also reflected in every step we take! Whatever we do, we are here for our customers, associates and communities, offering the finest products and protecting the environment in which we live. We treat our associates with trust and respect, because we consider them part of our family.
Everything we do comes from the heart.
Market area: Czech Republic
Formats: Supermarkets, compact hypers
Average sales area per store (in m2): 1,586
At Albert, our motto is “It’s worth eating better.” We want to meet the changing needs of customers, helping and inspiring them to eat well and live better.
We are proud to offer a great shopping experience in our stores, whether it is in our urban supermarkets or our compact hypers for family shopping. Our great customer offer includes healthy inspiration in own brands and local products. Our own brands are unique to Albert and include our Czech Taste line of genuine Czech origin products, the exclusive Nature’s Promise range of healthy and organic foods, and Albert Fresh Bistro, a unique concept of fast and healthy eating.
We want to be a responsible retailer in all our communities, supporting a healthy lifestyle for customers and associates and the development of local communities, in partnership with Czech suppliers and food banks. Since 2009, the Albert Endowment Fund has supported the education, integration and development of children from socially disadvantaged groups and healthy lifestyles for children and adults.
325stores
510stores
Net sales
€6.3bnNet online sales
€19m
Our great local brands
Romania
Greece
Serbia
Czech Republic
Financial statements Other informationStrategic Report Governance Financial performance AppendixGovernance RemunerationOur business Performance review Ahold Delhaize Annual Report 2019 14
Serbia
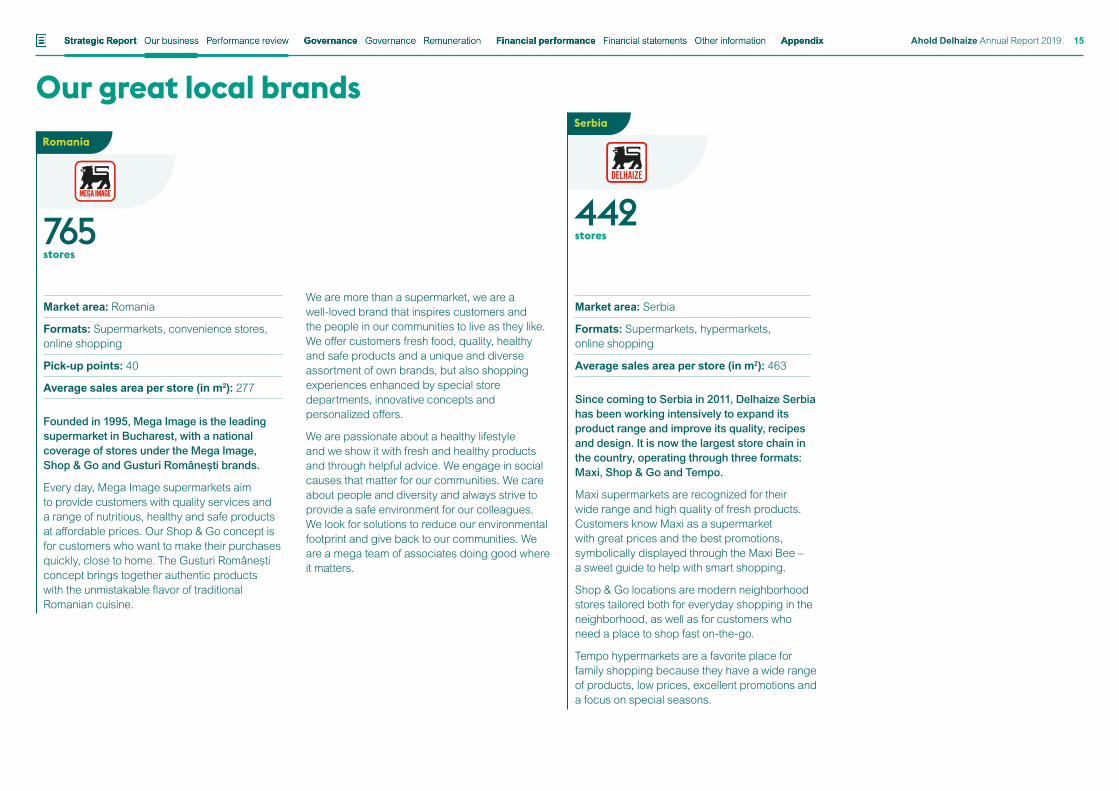
Market area: Serbia
Formats: Supermarkets, hypermarkets, online shopping
Average sales area per store (in m2): 463
Since coming to Serbia in 2011, Delhaize Serbia has been working intensively to expand its product range and improve its quality, recipes and design. It is now the largest store chain in the country, operating through three formats: Maxi, Shop & Go and Tempo.
Maxi supermarkets are recognized for their wide range and high quality of fresh products. Customers know Maxi as a supermarket with great prices and the best promotions, symbolically displayed through the Maxi Bee – a sweet guide to help with smart shopping.
Shop & Go locations are modern neighborhood stores tailored both for everyday shopping in the neighborhood, as well as for customers who need a place to shop fast on-the-go.
Tempo hypermarkets are a favorite place for family shopping because they have a wide range of products, low prices, excellent promotions and a focus on special seasons.
442stores
Our great local brandsRomania
Market area: Romania
Formats: Supermarkets, convenience stores, online shopping
Pick-up points: 40
Average sales area per store (in m2): 277
Founded in 1995, Mega Image is the leading supermarket in Bucharest, with a national coverage of stores under the Mega Image, Shop & Go and Gusturi Românești brands.
Every day, Mega Image supermarkets aim to provide customers with quality services and a range of nutritious, healthy and safe products at affordable prices. Our Shop & Go concept is for customers who want to make their purchases quickly, close to home. The Gusturi Românești concept brings together authentic products with the unmistakable flavor of traditional Romanian cuisine.
We are more than a supermarket, we are a well-loved brand that inspires customers and the people in our communities to live as they like. We offer customers fresh food, quality, healthy and safe products and a unique and diverse assortment of own brands, but also shopping experiences enhanced by special store departments, innovative concepts and personalized offers.
We are passionate about a healthy lifestyle and we show it with fresh and healthy products and through helpful advice. We engage in social causes that matter for our communities. We care about people and diversity and always strive to provide a safe environment for our colleagues. We look for solutions to reduce our environmental footprint and give back to our communities. We are a mega team of associates doing good where it matters.
765stores
Financial statements Other informationStrategic Report Governance Financial performance AppendixGovernance RemunerationOur business Performance review Ahold Delhaize Annual Report 2019 15
Joint ventures
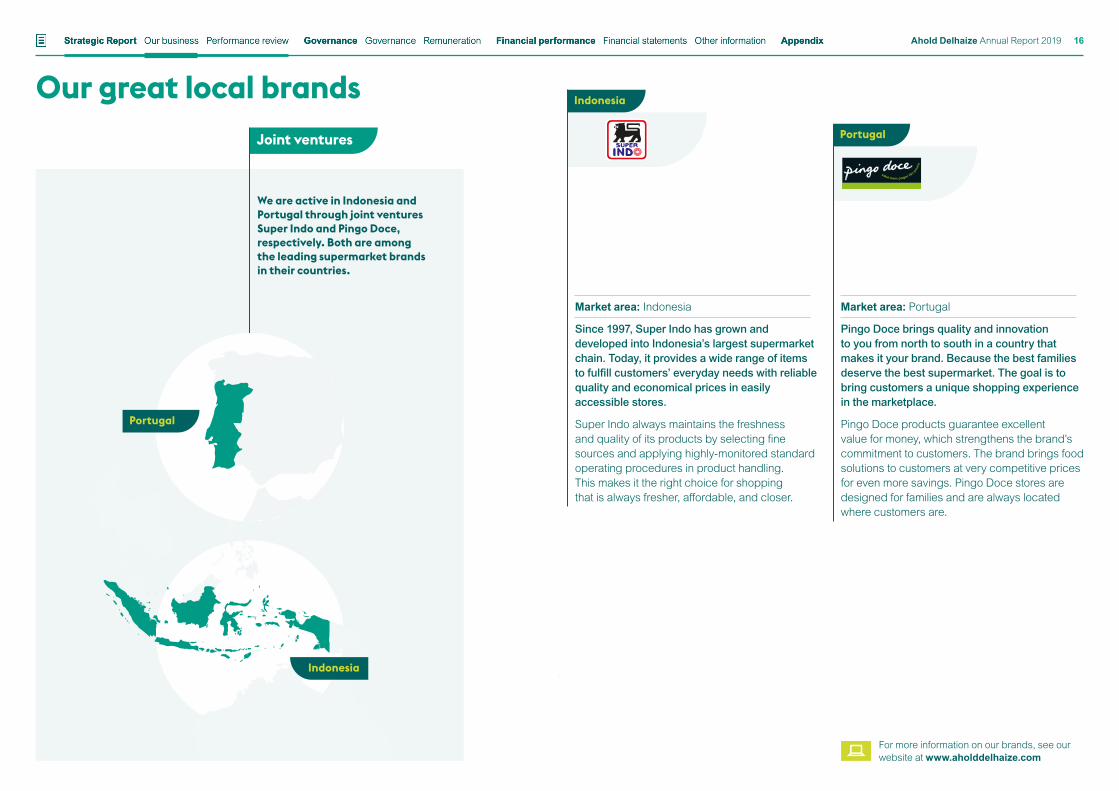
We are active in Indonesia and Portugal through joint ventures Super Indo and Pingo Doce, respectively. Both are among the leading supermarket brands in their countries.
Indonesia
Market area: Indonesia
Since 1997, Super Indo has grown and developed into Indonesia’s largest supermarket chain. Today, it provides a wide range of items to fulfill customers’ everyday needs with reliable quality and economical prices in easily accessible stores.
Super Indo always maintains the freshness and quality of its products by selecting fine sources and applying highly-monitored standard operating procedures in product handling. This makes it the right choice for shopping that is always fresher, affordable, and closer.
Our great local brands
For more information on our brands, see our website at www.aholddelhaize.com
Market area: Portugal
Pingo Doce brings quality and innovation to you from north to south in a country that makes it your brand. Because the best families deserve the best supermarket. The goal is to bring customers a unique shopping experience in the marketplace.
Pingo Doce products guarantee excellent value for money, which strengthens the brand’s commitment to customers. The brand brings food solutions to customers at very competitive prices for even more savings. Pingo Doce stores are designed for families and are always located where customers are.
Portugal
Indonesia
Portugal
Financial statements Other informationStrategic Report Governance Financial performance AppendixGovernance RemunerationOur business Performance review Ahold Delhaize Annual Report 2019 16
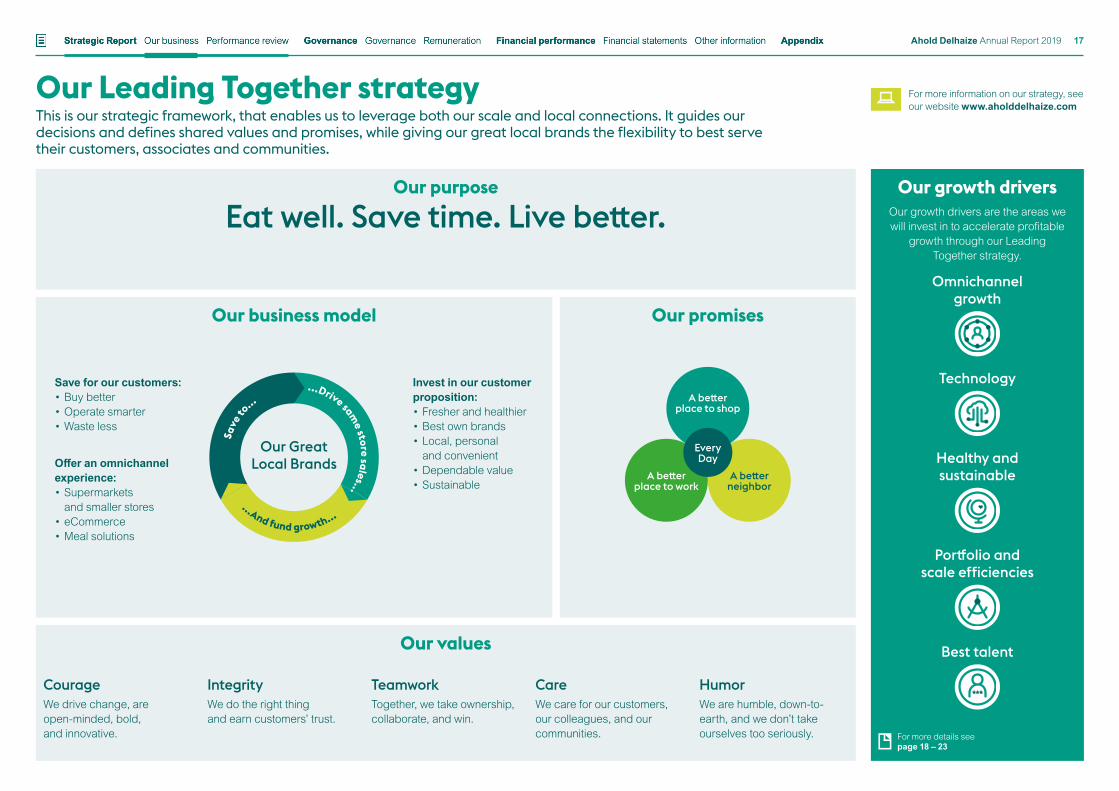
Our growth driversOur growth drivers are the areas we will invest in to accelerate profitable
growth through our Leading Together strategy.
Omnichannel growth
Technology
Healthy and sustainable
Portfolio and scale efficiencies
Best talent
Our Leading Together strategyThis is our strategic framework, that enables us to leverage both our scale and local connections. It guides our decisions and defines shared values and promises, while giving our great local brands the flexibility to best serve their customers, associates and communities.
Our business model Our promises
Our purpose
Eat well. Save time. Live better.
Our values
CourageWe drive change, are open-minded, bold, and innovative.
IntegrityWe do the right thing and earn customers’ trust.
TeamworkTogether, we take ownership, collaborate, and win.
CareWe care for our customers, our colleagues, and our communities.
HumorWe are humble, down-to-earth, and we don’t take ourselves too seriously.
Invest in our customer proposition:• Fresher and healthier• Best own brands• Local, personal
and convenient• Dependable value• Sustainable
Save for our customers:• Buy better• Operate smarter• Waste less
Offer an omnichannel experience:• Supermarkets
and smaller stores• eCommerce• Meal solutions
A better place to shop
A better neighbor
A better place to work
Every Day
Save
to
...
...And fund growth...
...Drive same store sales...
For more details see page 18 – 23
Our Great Local Brands
For more information on our strategy, see our website www.aholddelhaize.com
Financial statements Other informationStrategic Report Governance Financial performance AppendixGovernance RemunerationOur business Performance review Ahold Delhaize Annual Report 2019 17
Our growth driversTo help us fulfill our purpose today and prepare our business for tomorrow, we have intensified our focus and attention on the following growth areas across all our great local brands.
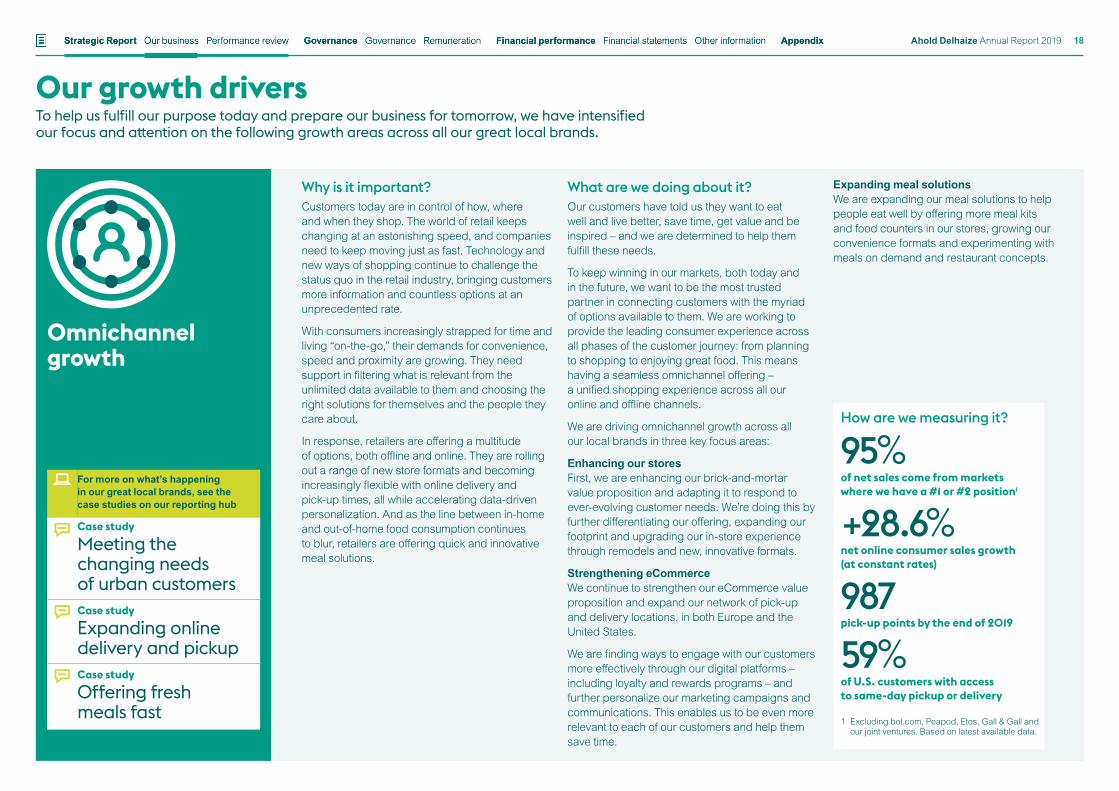
Omnichannel growth
What are we doing about it? Our customers have told us they want to eat well and live better, save time, get value and be inspired – and we are determined to help them fulfill these needs.
To keep winning in our markets, both today and in the future, we want to be the most trusted partner in connecting customers with the myriad of options available to them. We are working to provide the leading consumer experience across all phases of the customer journey: from planning to shopping to enjoying great food. This means having a seamless omnichannel offering – a unified shopping experience across all our online and offline channels.
We are driving omnichannel growth across all our local brands in three key focus areas:
Enhancing our storesFirst, we are enhancing our brick-and-mortar value proposition and adapting it to respond to ever-evolving customer needs. We’re doing this by further differentiating our offering, expanding our footprint and upgrading our in-store experience through remodels and new, innovative formats.
Strengthening eCommerceWe continue to strengthen our eCommerce value proposition and expand our network of pick-up and delivery locations, in both Europe and the United States.
We are finding ways to engage with our customers more effectively through our digital platforms – including loyalty and rewards programs – and further personalize our marketing campaigns and communications. This enables us to be even more relevant to each of our customers and help them save time.
Expanding meal solutionsWe are expanding our meal solutions to help people eat well by offering more meal kits and food counters in our stores, growing our convenience formats and experimenting with meals on demand and restaurant concepts.
Why is it important?Customers today are in control of how, where and when they shop. The world of retail keeps changing at an astonishing speed, and companies need to keep moving just as fast. Technology and new ways of shopping continue to challenge the status quo in the retail industry, bringing customers more information and countless options at an unprecedented rate.
With consumers increasingly strapped for time and living “on-the-go,” their demands for convenience, speed and proximity are growing. They need support in filtering what is relevant from the unlimited data available to them and choosing the right solutions for themselves and the people they care about.
In response, retailers are offering a multitude of options, both offline and online. They are rolling out a range of new store formats and becoming increasingly flexible with online delivery and pick-up times, all while accelerating data-driven personalization. And as the line between in-home and out-of-home food consumption continues to blur, retailers are offering quick and innovative meal solutions.
For more on what’s happening in our great local brands, see the case studies on our reporting hub
Case study Meeting the changing needs of urban customersCase study Expanding online delivery and pickupCase study Offering fresh meals fast
How are we measuring it?
95%of net sales come from markets where we have a #1 or #2 position1
+28.6%net online consumer sales growth (at constant rates)
987pick-up points by the end of 2019
59%of U.S. customers with access to same-day pickup or delivery
1 Excluding bol.com, Peapod, Etos, Gall & Gall and our joint ventures. Based on latest available data.
Financial statements Other informationStrategic Report Governance Financial performance AppendixGovernance RemunerationOur business Performance review Ahold Delhaize Annual Report 2019 18
Our growth drivers
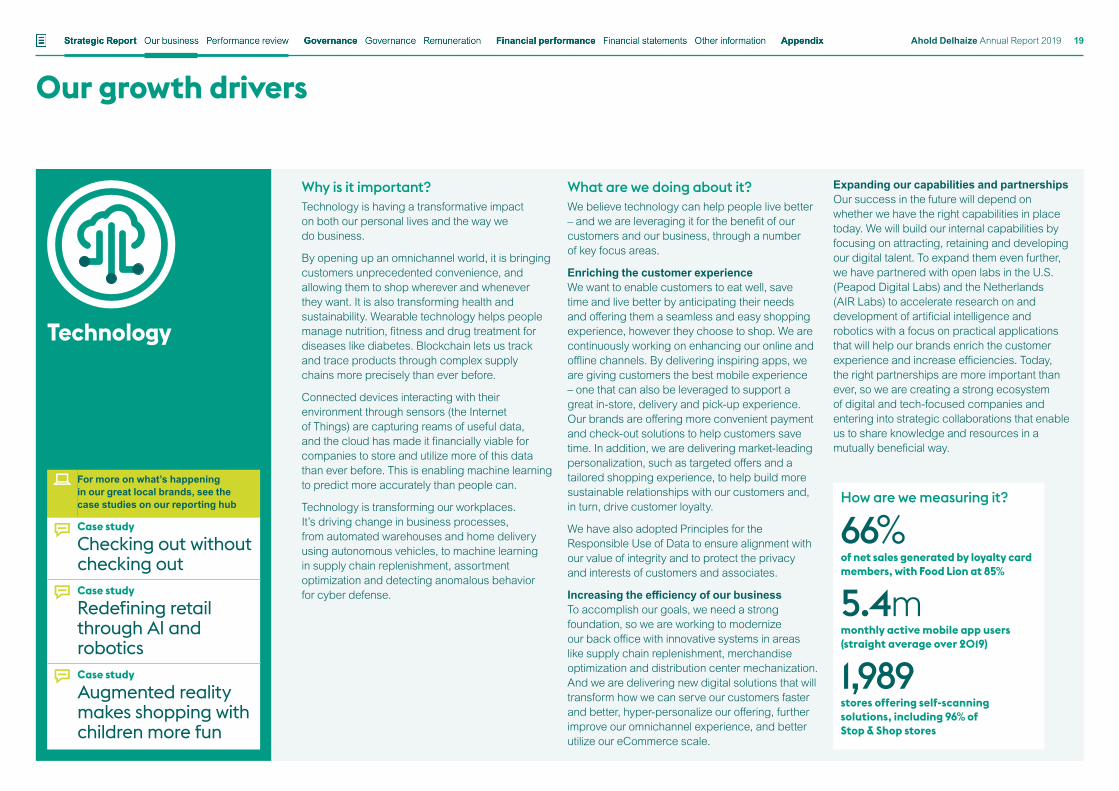
Technology
What are we doing about it? We believe technology can help people live better – and we are leveraging it for the benefit of our customers and our business, through a number of key focus areas.
Enriching the customer experienceWe want to enable customers to eat well, save time and live better by anticipating their needs and offering them a seamless and easy shopping experience, however they choose to shop. We are continuously working on enhancing our online and offline channels. By delivering inspiring apps, we are giving customers the best mobile experience – one that can also be leveraged to support a great in-store, delivery and pick-up experience. Our brands are offering more convenient payment and check-out solutions to help customers save time. In addition, we are delivering market-leading personalization, such as targeted offers and a tailored shopping experience, to help build more sustainable relationships with our customers and, in turn, drive customer loyalty.
We have also adopted Principles for the Responsible Use of Data to ensure alignment with our value of integrity and to protect the privacy and interests of customers and associates.
Increasing the efficiency of our businessTo accomplish our goals, we need a strong foundation, so we are working to modernize our back office with innovative systems in areas like supply chain replenishment, merchandise optimization and distribution center mechanization. And we are delivering new digital solutions that will transform how we can serve our customers faster and better, hyper-personalize our offering, further improve our omnichannel experience, and better utilize our eCommerce scale.
Why is it important?Technology is having a transformative impact on both our personal lives and the way we do business.
By opening up an omnichannel world, it is bringing customers unprecedented convenience, and allowing them to shop wherever and whenever they want. It is also transforming health and sustainability. Wearable technology helps people manage nutrition, fitness and drug treatment for diseases like diabetes. Blockchain lets us track and trace products through complex supply chains more precisely than ever before.
Connected devices interacting with their environment through sensors (the Internet of Things) are capturing reams of useful data, and the cloud has made it financially viable for companies to store and utilize more of this data than ever before. This is enabling machine learning to predict more accurately than people can.
Technology is transforming our workplaces. It’s driving change in business processes, from automated warehouses and home delivery using autonomous vehicles, to machine learning in supply chain replenishment, assortment optimization and detecting anomalous behavior for cyber defense.
For more on what’s happening in our great local brands, see the case studies on our reporting hub
Case study Checking out without checking outCase study Redefining retail through AI and roboticsCase study Augmented reality makes shopping with children more fun
Expanding our capabilities and partnershipsOur success in the future will depend on whether we have the right capabilities in place today. We will build our internal capabilities by focusing on attracting, retaining and developing our digital talent. To expand them even further, we have partnered with open labs in the U.S. (Peapod Digital Labs) and the Netherlands (AIR Labs) to accelerate research on and development of artificial intelligence and robotics with a focus on practical applications that will help our brands enrich the customer experience and increase efficiencies. Today, the right partnerships are more important than ever, so we are creating a strong ecosystem of digital and tech-focused companies and entering into strategic collaborations that enable us to share knowledge and resources in a mutually beneficial way.
How are we measuring it?
66%of net sales generated by loyalty card members, with Food Lion at 85%
5.4mmonthly active mobile app users (straight average over 2019)
1,989stores offering self-scanning solutions, including 96% of Stop & Shop stores
Financial statements Other informationStrategic Report Governance Financial performance AppendixGovernance RemunerationOur business Performance review Ahold Delhaize Annual Report 2019 19
Our growth drivers
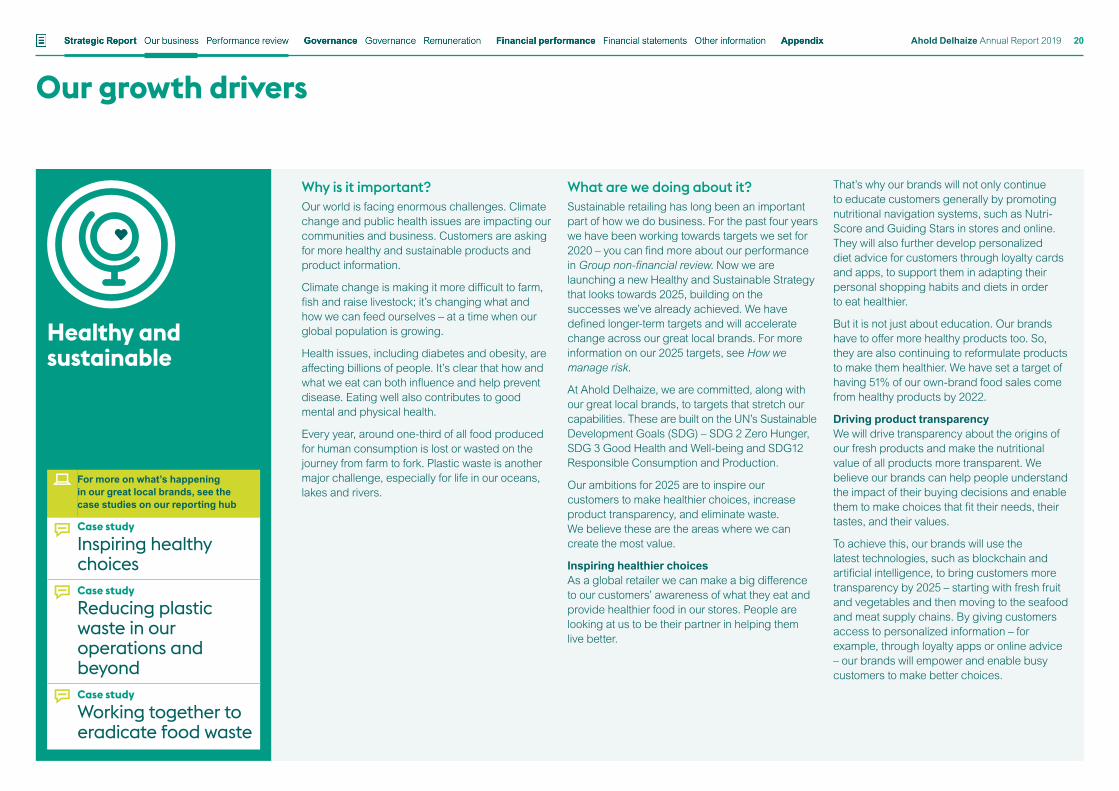
Healthy and sustainable
Why is it important?Our world is facing enormous challenges. Climate change and public health issues are impacting our communities and business. Customers are asking for more healthy and sustainable products and product information.
Climate change is making it more difficult to farm, fish and raise livestock; it’s changing what and how we can feed ourselves – at a time when our global population is growing.
Health issues, including diabetes and obesity, are affecting billions of people. It’s clear that how and what we eat can both influence and help prevent disease. Eating well also contributes to good mental and physical health.
Every year, around one-third of all food produced for human consumption is lost or wasted on the journey from farm to fork. Plastic waste is another major challenge, especially for life in our oceans, lakes and rivers.
For more on what’s happening in our great local brands, see the case studies on our reporting hub
Case study Inspiring healthy choicesCase study Reducing plastic waste in our operations and beyond Case study Working together to eradicate food waste
What are we doing about it? Sustainable retailing has long been an important part of how we do business. For the past four years we have been working towards targets we set for 2020 – you can find more about our performance in Group non-financial review. Now we are launching a new Healthy and Sustainable Strategy that looks towards 2025, building on the successes we’ve already achieved. We have defined longer-term targets and will accelerate change across our great local brands. For more information on our 2025 targets, see How we manage risk.
At Ahold Delhaize, we are committed, along with our great local brands, to targets that stretch our capabilities. These are built on the UN’s Sustainable Development Goals (SDG) – SDG 2 Zero Hunger, SDG 3 Good Health and Well-being and SDG12 Responsible Consumption and Production.
Our ambitions for 2025 are to inspire our customers to make healthier choices, increase product transparency, and eliminate waste. We believe these are the areas where we can create the most value.
Inspiring healthier choicesAs a global retailer we can make a big difference to our customers’ awareness of what they eat and provide healthier food in our stores. People are looking at us to be their partner in helping them live better.
That’s why our brands will not only continue to educate customers generally by promoting nutritional navigation systems, such as Nutri-Score and Guiding Stars in stores and online. They will also further develop personalized diet advice for customers through loyalty cards and apps, to support them in adapting their personal shopping habits and diets in order to eat healthier.
But it is not just about education. Our brands have to offer more healthy products too. So, they are also continuing to reformulate products to make them healthier. We have set a target of having 51% of our own-brand food sales come from healthy products by 2022.
Driving product transparencyWe will drive transparency about the origins of our fresh products and make the nutritional value of all products more transparent. We believe our brands can help people understand the impact of their buying decisions and enable them to make choices that fit their needs, their tastes, and their values.
To achieve this, our brands will use the latest technologies, such as blockchain and artificial intelligence, to bring customers more transparency by 2025 – starting with fresh fruit and vegetables and then moving to the seafood and meat supply chains. By giving customers access to personalized information – for example, through loyalty apps or online advice – our brands will empower and enable busy customers to make better choices.
Financial statements Other informationStrategic Report Governance Financial performance AppendixGovernance RemunerationOur business Performance review Ahold Delhaize Annual Report 2019 20
Our growth drivers
Healthy and sustainable continued
Eliminating wasteWe are working hard to reduce food waste, both inside our own operations and across our supply chain, together with customers and suppliers. Within our own operations, we aim to reduce food waste by 50% by 2030 compared to our 2016 baseline. We will accomplish this objective by making replenishment systems more effective and by applying innovative methods, such as dynamic pricing based on sell-by date. We are a founding member of the World Resources Institute’s “10x20x30” initiative, which brings together 10 global food retailers that will each engage with 20 of their priority suppliers to halve their rates of food loss and waste by 2030.
Plastic waste is another major challenge, particularly for life in our oceans, lakes and rivers. That’s why, as a global retailer, we have signed up to the New Plastics Economy Global Commitment – to work on ways to significantly reduce plastic in our overall supply chain.
Concretely, brands across Ahold Delhaize are working towards zero plastic waste from own-brand packaging by 2025. One way is by selling more fruits and vegetables that are not wrapped in plastic; some of our brands are already piloting plastic-free fruit and vegetable sections in stores.
Managing risksAs the global context around our business rapidly changes, we are also accelerating our work to protect Ahold Delhaize from potential risks.
We are working to understand how climate change will impact our business. And we are also mapping the emissions from our supply chain to understand how we are impacting climate change. We have committed to setting long-term, science-based targets to reduce our impact in both our own operations as well as in our supply chains.
To promote future food security, we are developing partnerships and taking action to combat negative impacts on biodiversity.
On human rights, we are conducting due diligence exercises to guide a continuous improvement plan that will ensure our businesses and supply chains are protecting the rights of customers, associates and community members.
Our brands are also focused on improving safety in our workplaces.
Finally, across our brands, we are increasing standards for the sustainability of products we sell, while maintaining best-in-class standards for food safety and quality.
How are we measuring it?
48%of total own-brand food sales from healthy products
9%food waste reduction compared to our 2016 baseline
4.6%reduction of CO₂-equivalent emissions per m2 sales area compared to 2018, a 32% reduction compared to our 2008 baseline – location-based approach (kg CO₂-eq/m2)
Financial statements Other informationStrategic Report Governance Financial performance AppendixGovernance RemunerationOur business Performance review Ahold Delhaize Annual Report 2019 21
Our growth drivers
Portfolio and scale efficiencies
What are we doing about it? We operate a portfolio of strong brands and want to be the consolidator of choice in our markets. Our ambition and the opportunity we have to grow in the fragmented retail market is supported by our strong and predictable cash flow, successful merger integration and synergy delivery, efficient platforms for growth and strong omnichannel proposition.
We will continue to evolve our portfolio in line with the following principles:• Maintaining a portfolio of great local brands
that aim to have #1 or #2 positions in their markets.
• Prioritizing potential partners with advantageous positions in attractive markets according to their size and growth prospects.
• Ensuring we have sufficient global scale to attract a strong ecosystem of partners and share best practices among our brands.
In addition, we have always worked to be as efficient as possible, and we are constantly on the lookout for new ways to save money to reinvest in our business. What we call “Save for Our Customers” is in our DNA, and we believe there are many more efficiencies to go after and to scale across our group. We have committed to deliver €1.9 billion of savings in the period from 2019-2021, and we will reach this target partly through best-practice sharing.
In December, we announced that Ahold Delhaize USA is investing $480 million to transform and expand its supply chain operations on the U.S. East Coast, in support of a new three-year strategy to move the U.S. supply chain into a fully integrated, self-distribution model.
Why is it important?The grocery industry is in the midst of continued consolidation, as retailers look to mergers and acquisitions as a means to grow and seek synergies to counter decreasing margins. Scale continues to be critical for enabling businesses to make the required capital investments to remain relevant in the long term.
Companies also continue to embrace vertical integration. Grocers are integrating backwards, investing in farms and processing plants to guarantee product supply and quality and lower costs. Consumer packaged goods companies are integrating forward, using eCommerce to develop direct relationships with customers.
Companies across industries remain focused on seeking efficiencies and streamlining their operations to further invest in their value propositions and drive sustainable growth.
For more on what’s happening in our great local brands, see the case studies on our reporting hub
Case study Strengthening our brick-and-mortar baseCase study Bringing experts into the family to help us serve customers betterCase study Leveraging our scale to bring customers more
How are we measuring it?
€709mSave for Our Customers savings in 2019
3.3%total cash capital expenditures as a percentage of net sales
95% of net sales come from markets where we have a #1 or #2 position1
1 Excluding bol.com, Peapod, Etos, Gall & Gall and our joint ventures. Based on latest available data.
Financial statements Other informationStrategic Report Governance Financial performance AppendixGovernance RemunerationOur business Performance review Ahold Delhaize Annual Report 2019 22
Our growth drivers
Best talent
What are we doing about it? We want to play a part in creating the future of work by investing in developing our associates, becoming a more purpose-driven organization with a much stronger focus on diversity and inclusion, and building the capabilities of our workforce. We have four strategic focus areas under our best talent growth driver.
Creating the future of workOur local brands are working to take our vision of the future of work and bring it to life by putting in place customer-centric operating models and strategic workforce plans that will support our omnichannel and digital ambitions.
Pivoting our cultureWe want to embed our company’s purpose deeply within the organization because we believe it will drive personal accountability. As part of this, we are supporting associates in defining their own unique contributions in line with our purpose. We want to help them maximize their potential by nurturing a mindset of continuous growth and life-long learning. Our values will guide this process, and we want to amp up the focus we place on Courage, Care and Teamwork, in particular.
Transforming our capabilitiesWe are working to understand what capabilities we need today, and in years to come, and then to develop them in our workforce. We are supporting our brands as they continue building a digital and data mindset and reskilling their workforces for the future.
Why is it important?The world of work is changing dramatically, and employers are evolving to meet the needs of today’s employees. Technology is not only transforming the shopping experience, it is reshaping the workplace. First, in creating the need for people to gain new skills. Companies are looking for ways to support their employees’ development and make sure they have the right capabilities for the future. Secondly, artificial intelligence and automation are improving our efficiency and helping us to work smarter, so people have more time to devote to deploying creative strategies and driving market growth.
In an environment of rapid change, companies have to be more externally focused and agile. They will need to find ways to create a more flexible workforce by hiring great people through both new and innovative talent sourcing opportunities as well as traditional employment models. The need for stronger partnerships and even recruiting from within the customer base are just some of the exciting ways retailers are finding the best talent.
Like today’s customers, today’s workers are more socially and environmentally aware, and seek to work for a company that has an authentic culture, in an environment that is inclusive and supportive of their individual growth. They want to feel inspired by and able to make a unique contribution to the mission and purpose of the organization. Offering a great associate experience continues to be critical for attracting and retaining talent.
For more on what’s happening in our great local brands, see the case studies on our reporting hub
Case study Building a digital mindsetCase study Improving associate engagementCase study Best places to work for LGBTQ equality
How are we measuring it?
80%associate engagement score
72%associate development score
78%inclusive workplace score
Cultivating our talentWe want to cultivate our talent so that we have the right people and leaders for the future. By building robust, diverse talent pipelines we will ensure we have the best talent – people who can help us drive the growth of our business. We’re putting a much stronger focus on diversity and inclusion by making sure we have balanced slates of candidates for open roles, developing associates from all backgrounds, building more diverse succession pools and creating a more inclusive environment, overall.
Financial statements Other informationStrategic Report Governance Financial performance AppendixGovernance RemunerationOur business Performance review Ahold Delhaize Annual Report 2019 23
Creating value for stakeholdersSupply chain
Value creation
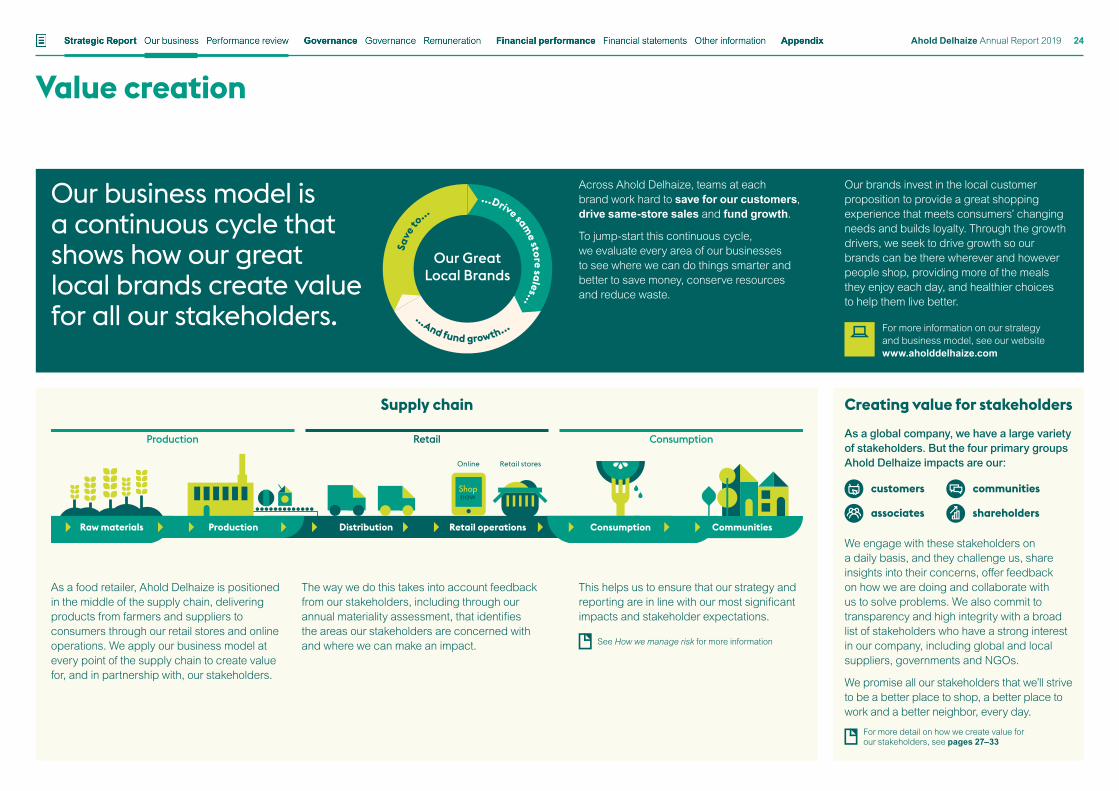
As a global company, we have a large variety of stakeholders. But the four primary groups Ahold Delhaize impacts are our:
customers communities
associates shareholders
We engage with these stakeholders on a daily basis, and they challenge us, share insights into their concerns, offer feedback on how we are doing and collaborate with us to solve problems. We also commit to transparency and high integrity with a broad list of stakeholders who have a strong interest in our company, including global and local suppliers, governments and NGOs.
We promise all our stakeholders that we’ll strive to be a better place to shop, a better place to work and a better neighbor, every day.
For more detail on how we create value for our stakeholders, see pages 27–33
Shopnow
Raw materials Production Distribution
Production
Retail storesOnline
CommunitiesConsumptionRetail operations
Retail Consumption
Our business model is a continuous cycle that shows how our great local brands create value for all our stakeholders.
Our brands invest in the local customer proposition to provide a great shopping experience that meets consumers’ changing needs and builds loyalty. Through the growth drivers, we seek to drive growth so our brands can be there wherever and however people shop, providing more of the meals they enjoy each day, and healthier choices to help them live better.
For more information on our strategy and business model, see our websitewww.aholddelhaize.com
Across Ahold Delhaize, teams at each brand work hard to save for our customers, drive same-store sales and fund growth.
To jump-start this continuous cycle, we evaluate every area of our businesses to see where we can do things smarter and better to save money, conserve resources and reduce waste.
Save
to
...
...And fund growth...
...Drive same store sales...
Our Great Local Brands
As a food retailer, Ahold Delhaize is positioned in the middle of the supply chain, delivering products from farmers and suppliers to consumers through our retail stores and online operations. We apply our business model at every point of the supply chain to create value for, and in partnership with, our stakeholders.
The way we do this takes into account feedback from our stakeholders, including through our annual materiality assessment, that identifies the areas our stakeholders are concerned with and where we can make an impact.
This helps us to ensure that our strategy and reporting are in line with our most significant impacts and stakeholder expectations.
See How we manage risk for more information
Financial statements Other informationStrategic Report Governance Financial performance AppendixGovernance RemunerationOur business Performance review Ahold Delhaize Annual Report 2019 24
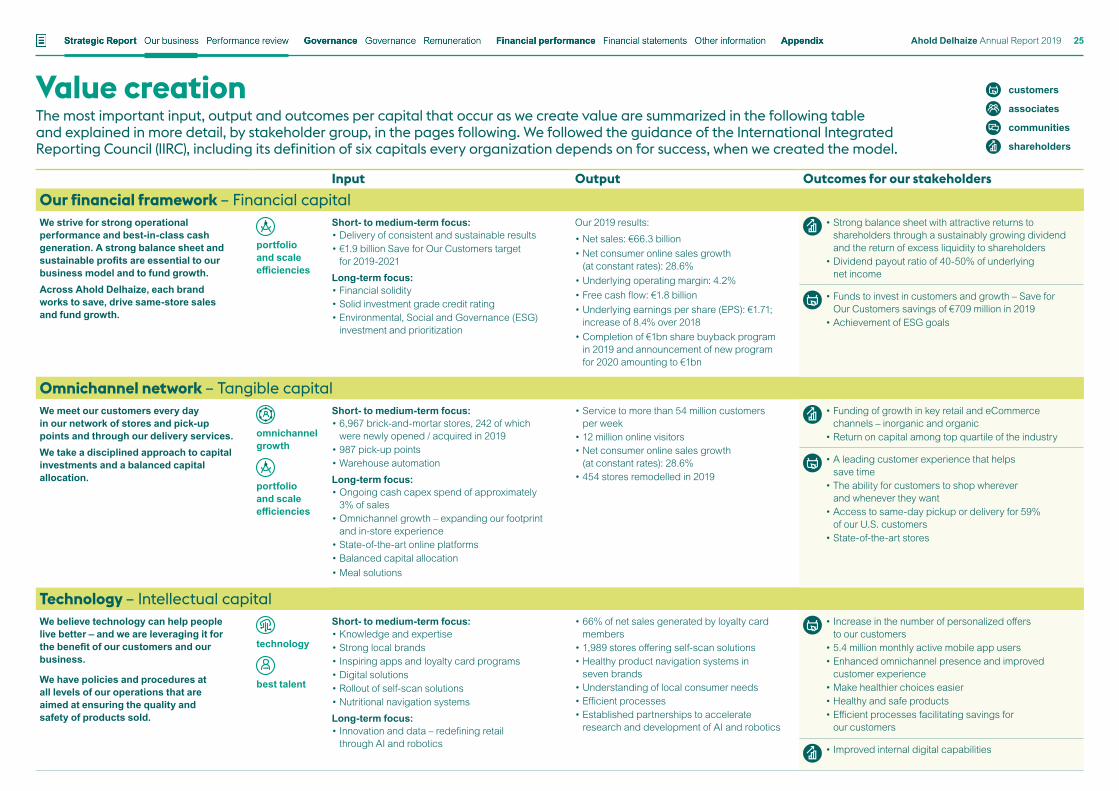
Value creationThe most important input, output and outcomes per capital that occur as we create value are summarized in the following table and explained in more detail, by stakeholder group, in the pages following. We followed the guidance of the International Integrated Reporting Council (IIRC), including its definition of six capitals every organization depends on for success, when we created the model.
Input Output Outcomes for our stakeholdersOur financial framework – Financial capitalWe strive for strong operational performance and best-in-class cash generation. A strong balance sheet and sustainable profits are essential to our business model and to fund growth.
Across Ahold Delhaize, each brand works to save, drive same-store sales and fund growth.
portfolio and scale efficiencies
Short- to medium-term focus:• Delivery of consistent and sustainable results• €1.9 billion Save for Our Customers target
for 2019-2021
Long-term focus:• Financial solidity• Solid investment grade credit rating• Environmental, Social and Governance (ESG)
investment and prioritization
Our 2019 results:
• Net sales: €66.3 billion• Net consumer online sales growth
(at constant rates): 28.6%• Underlying operating margin: 4.2%• Free cash flow: €1.8 billion• Underlying earnings per share (EPS): €1.71;
increase of 8.4% over 2018• Completion of €1bn share buyback program
in 2019 and announcement of new program for 2020 amounting to €1bn
• Strong balance sheet with attractive returns to shareholders through a sustainably growing dividend and the return of excess liquidity to shareholders
• Dividend payout ratio of 40-50% of underlying net income
• Funds to invest in customers and growth – Save for Our Customers savings of €709 million in 2019
• Achievement of ESG goals
Omnichannel network – Tangible capitalWe meet our customers every day in our network of stores and pick-up points and through our delivery services.
We take a disciplined approach to capital investments and a balanced capital allocation.
omnichannel growth
portfolio and scale efficiencies
Short- to medium-term focus:• 6,967 brick-and-mortar stores, 242 of which
were newly opened / acquired in 2019 • 987 pick-up points• Warehouse automation
Long-term focus:• Ongoing cash capex spend of approximately
3% of sales• Omnichannel growth – expanding our footprint
and in-store experience• State-of-the-art online platforms• Balanced capital allocation• Meal solutions
• Service to more than 54 million customers per week
• 12 million online visitors• Net consumer online sales growth
(at constant rates): 28.6%• 454 stores remodelled in 2019
• Funding of growth in key retail and eCommerce channels – inorganic and organic
• Return on capital among top quartile of the industry
• A leading customer experience that helps save time
• The ability for customers to shop wherever and whenever they want
• Access to same-day pickup or delivery for 59% of our U.S. customers
• State-of-the-art stores
Technology – Intellectual capitalWe believe technology can help people live better – and we are leveraging it for the benefit of our customers and our business.
We have policies and procedures at all levels of our operations that are aimed at ensuring the quality and safety of products sold.
technology
best talent
Short- to medium-term focus:• Knowledge and expertise • Strong local brands• Inspiring apps and loyalty card programs• Digital solutions• Rollout of self-scan solutions• Nutritional navigation systems
Long-term focus:• Innovation and data – redefining retail
through AI and robotics
• 66% of net sales generated by loyalty card members
• 1,989 stores offering self-scan solutions• Healthy product navigation systems in
seven brands• Understanding of local consumer needs• Efficient processes• Established partnerships to accelerate
research and development of AI and robotics
• Increase in the number of personalized offers to our customers
• 5.4 million monthly active mobile app users• Enhanced omnichannel presence and improved
customer experience• Make healthier choices easier • Healthy and safe products• Efficient processes facilitating savings for
our customers
• Improved internal digital capabilities
customers
associates
communities
shareholders
Financial statements Other informationStrategic Report Governance Financial performance AppendixGovernance RemunerationOur business Performance review Ahold Delhaize Annual Report 2019 25
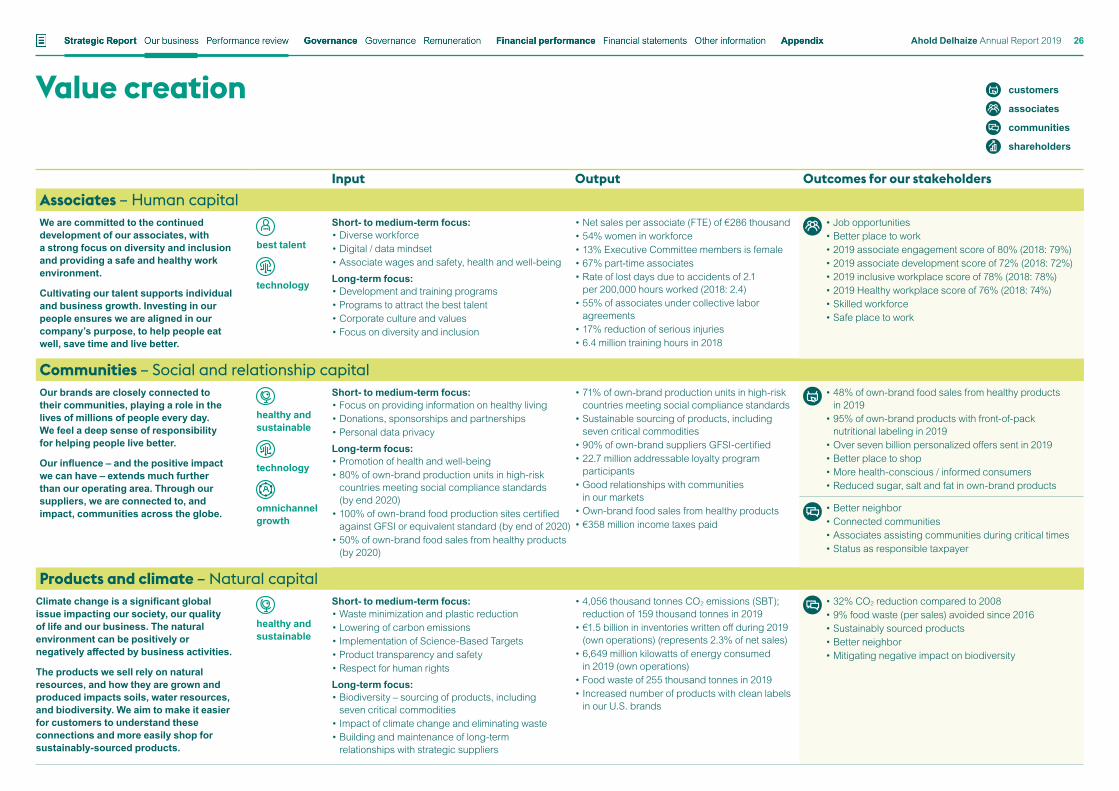
Value creation
Input Output Outcomes for our stakeholdersAssociates – Human capitalWe are committed to the continued development of our associates, with a strong focus on diversity and inclusion and providing a safe and healthy work environment.
Cultivating our talent supports individual and business growth. Investing in our people ensures we are aligned in our company’s purpose, to help people eat well, save time and live better.
best talent
technology
Short- to medium-term focus:• Diverse workforce • Digital / data mindset • Associate wages and safety, health and well-being
Long-term focus:• Development and training programs • Programs to attract the best talent• Corporate culture and values• Focus on diversity and inclusion
• Net sales per associate (FTE) of €286 thousand• 54% women in workforce• 13% Executive Committee members is female • 67% part-time associates• Rate of lost days due to accidents of 2.1
per 200,000 hours worked (2018: 2.4)• 55% of associates under collective labor
agreements • 17% reduction of serious injuries• 6.4 million training hours in 2018
• Job opportunities• Better place to work• 2019 associate engagement score of 80% (2018: 79%)• 2019 associate development score of 72% (2018: 72%) • 2019 inclusive workplace score of 78% (2018: 78%)• 2019 Healthy workplace score of 76% (2018: 74%)• Skilled workforce• Safe place to work
Communities – Social and relationship capitalOur brands are closely connected to their communities, playing a role in the lives of millions of people every day. We feel a deep sense of responsibility for helping people live better.
Our influence – and the positive impact we can have – extends much further than our operating area. Through our suppliers, we are connected to, and impact, communities across the globe.
healthy and sustainable
technology
omnichannel growth
Short- to medium-term focus:• Focus on providing information on healthy living • Donations, sponsorships and partnerships • Personal data privacy
Long-term focus:• Promotion of health and well-being• 80% of own-brand production units in high-risk
countries meeting social compliance standards (by end 2020)
• 100% of own-brand food production sites certified against GFSI or equivalent standard (by end of 2020)
• 50% of own-brand food sales from healthy products (by 2020)
• 71% of own-brand production units in high-risk countries meeting social compliance standards
• Sustainable sourcing of products, including seven critical commodities
• 90% of own-brand suppliers GFSI-certified• 22.7 million addressable loyalty program
participants• Good relationships with communities
in our markets • Own-brand food sales from healthy products• €358 million income taxes paid
• 48% of own-brand food sales from healthy products in 2019
• 95% of own-brand products with front-of-pack nutritional labeling in 2019
• Over seven billion personalized offers sent in 2019• Better place to shop• More health-conscious / informed consumers• Reduced sugar, salt and fat in own-brand products
• Better neighbor• Connected communities• Associates assisting communities during critical times• Status as responsible taxpayer
Products and climate – Natural capitalClimate change is a significant global issue impacting our society, our quality of life and our business. The natural environment can be positively or negatively affected by business activities.
The products we sell rely on natural resources, and how they are grown and produced impacts soils, water resources, and biodiversity. We aim to make it easier for customers to understand these connections and more easily shop for sustainably-sourced products.
healthy and sustainable
Short- to medium-term focus:• Waste minimization and plastic reduction• Lowering of carbon emissions• Implementation of Science-Based Targets• Product transparency and safety• Respect for human rights
Long-term focus:• Biodiversity – sourcing of products, including
seven critical commodities • Impact of climate change and eliminating waste• Building and maintenance of long-term
relationships with strategic suppliers
• 4,056 thousand tonnes CO2 emissions (SBT); reduction of 159 thousand tonnes in 2019
• €1.5 billion in inventories written off during 2019 (own operations) (represents 2.3% of net sales)
• 6,649 million kilowatts of energy consumed in 2019 (own operations)
• Food waste of 255 thousand tonnes in 2019 • Increased number of products with clean labels
in our U.S. brands
• 32% CO2 reduction compared to 2008• 9% food waste (per sales) avoided since 2016• Sustainably sourced products • Better neighbor• Mitigating negative impact on biodiversity
customers
associates
communities
shareholders
Financial statements Other informationStrategic Report Governance Financial performance AppendixGovernance RemunerationOur business Performance review Ahold Delhaize Annual Report 2019 26
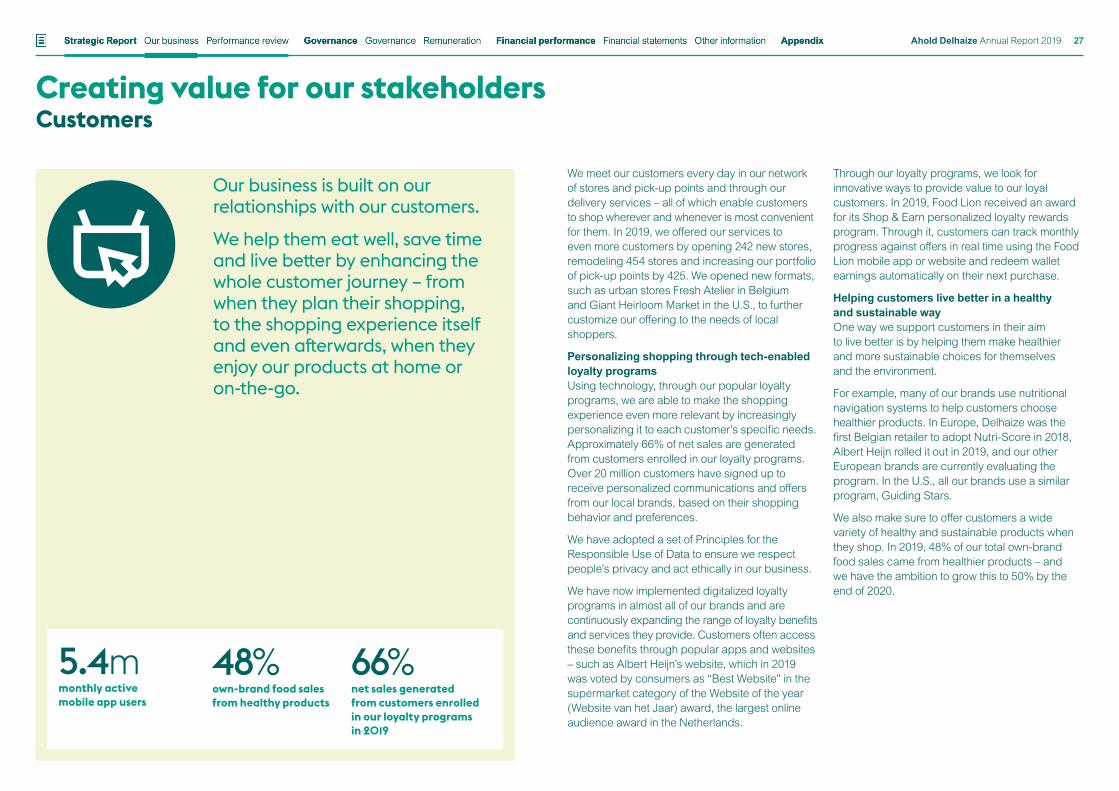
Creating value for our stakeholdersCustomers
We meet our customers every day in our network of stores and pick-up points and through our delivery services – all of which enable customers to shop wherever and whenever is most convenient for them. In 2019, we offered our services to even more customers by opening 242 new stores, remodeling 454 stores and increasing our portfolio of pick-up points by 425. We opened new formats, such as urban stores Fresh Atelier in Belgium and Giant Heirloom Market in the U.S., to further customize our offering to the needs of local shoppers.
Personalizing shopping through tech-enabled loyalty programsUsing technology, through our popular loyalty programs, we are able to make the shopping experience even more relevant by increasingly personalizing it to each customer’s specific needs. Approximately 66% of net sales are generated from customers enrolled in our loyalty programs. Over 20 million customers have signed up to receive personalized communications and offers from our local brands, based on their shopping behavior and preferences.
We have adopted a set of Principles for the Responsible Use of Data to ensure we respect people’s privacy and act ethically in our business.
We have now implemented digitalized loyalty programs in almost all of our brands and are continuously expanding the range of loyalty benefits and services they provide. Customers often access these benefits through popular apps and websites – such as Albert Heijn’s website, which in 2019 was voted by consumers as “Best Website” in the supermarket category of the Website of the year (Website van het Jaar) award, the largest online audience award in the Netherlands.
Through our loyalty programs, we look for innovative ways to provide value to our loyal customers. In 2019, Food Lion received an award for its Shop & Earn personalized loyalty rewards program. Through it, customers can track monthly progress against offers in real time using the Food Lion mobile app or website and redeem wallet earnings automatically on their next purchase.
Helping customers live better in a healthy and sustainable way One way we support customers in their aim to live better is by helping them make healthier and more sustainable choices for themselves and the environment.
For example, many of our brands use nutritional navigation systems to help customers choose healthier products. In Europe, Delhaize was the first Belgian retailer to adopt Nutri-Score in 2018, Albert Heijn rolled it out in 2019, and our other European brands are currently evaluating the program. In the U.S., all our brands use a similar program, Guiding Stars.
We also make sure to offer customers a wide variety of healthy and sustainable products when they shop. In 2019, 48% of our total own-brand food sales came from healthier products – and we have the ambition to grow this to 50% by the end of 2020.
Our business is built on our relationships with our customers.We help them eat well, save time and live better by enhancing the whole customer journey – from when they plan their shopping, to the shopping experience itself and even afterwards, when they enjoy our products at home or on-the-go.
5.4mmonthly active mobile app users
48%own-brand food sales from healthy products
66%net sales generated from customers enrolled in our loyalty programs in 2019
Financial statements Other informationStrategic Report Governance Financial performance AppendixGovernance RemunerationOur business Performance review Ahold Delhaize Annual Report 2019 27

Creating value for our stakeholders Customers continued
Staying engaged with customers to better serve their needsOur associates help to develop and maintain close relationships with our customers through their everyday interactions. They provide advice and support as customers shop in our stores, make sure online orders are accurate and complete and staff the strong customer service departments we operate at each of our brands, where customers can ask questions and get assistance.
We make sure to stay tuned in to what customers want through third-party surveys, consumer studies, focus groups and through the immediate feedback they provide to our customer service departments, associates and websites and through social media. This way we know what they want and how we can keep adding value to their shopping experience both in the short and the long term.
We ensure the products we offer customers are safe, of high quality and are sourced and produced taking into account their environmental and social impact. In 2019, 71% of the production units of our own-brand products in high-risk countries were audited against acceptable social compliance standards.
We have identified seven critical commodities linked to major environmental and social issues such as deforestation, carbon emissions, child labor, forced labor, illegal fishing and overfishing. We have embedded programs in our operations to make sure these commodities – coffee, tea, cocoa, palm oil, soy, seafood and wood fibers – are sourced in a way that mitigates the negative impacts on the environment and communities where they come from.
Alfa Beta has helped develop a new internationally recognized certificate for sea bream and sea bass, as part of its efforts to offer customers seafood from sustainable and responsible sources. The brand is the first Greek retailer to carry the certified product in its stores, under its own-brand label AB Choice. For more details on our progress on the critical commodities, see Performance review: Group non-financial review.
Saving to provide more for our customersWe leverage our scale to save for our customers and ensure we can offer them the best prices and service. In 2019, we exceeded our target, delivering €709 million in savings over the year through our Save for Our Customers program.
We continuously look for ways to add more of the services customers want to our portfolio. In 2019, Albert Heijn acquired the FoodFirst Network – which provides subscribers with advice and tips from experts on nutrition, health, exercise and relaxation – to accelerate its ability to inspire people to live a healthy lifestyle and create a shopping experience that fits the personal needs of each customer.
Our Dutch drugstore chain, Etos, took over the Solvo Group, owner of popular health-related websites in the Netherlands, making it the largest provider of health and wellness information and products for consumers in the country. This marked an important step for Etos towards establishing a new drugstore concept that serves customers around the clock through a combination of physical stores and 24-7 online health information.
For more details on our progress on the critical commodities, see Performance review: Group non-financial review
Financial statements Other informationStrategic Report Governance Financial performance AppendixGovernance RemunerationOur business Performance review Ahold Delhaize Annual Report 2019 28
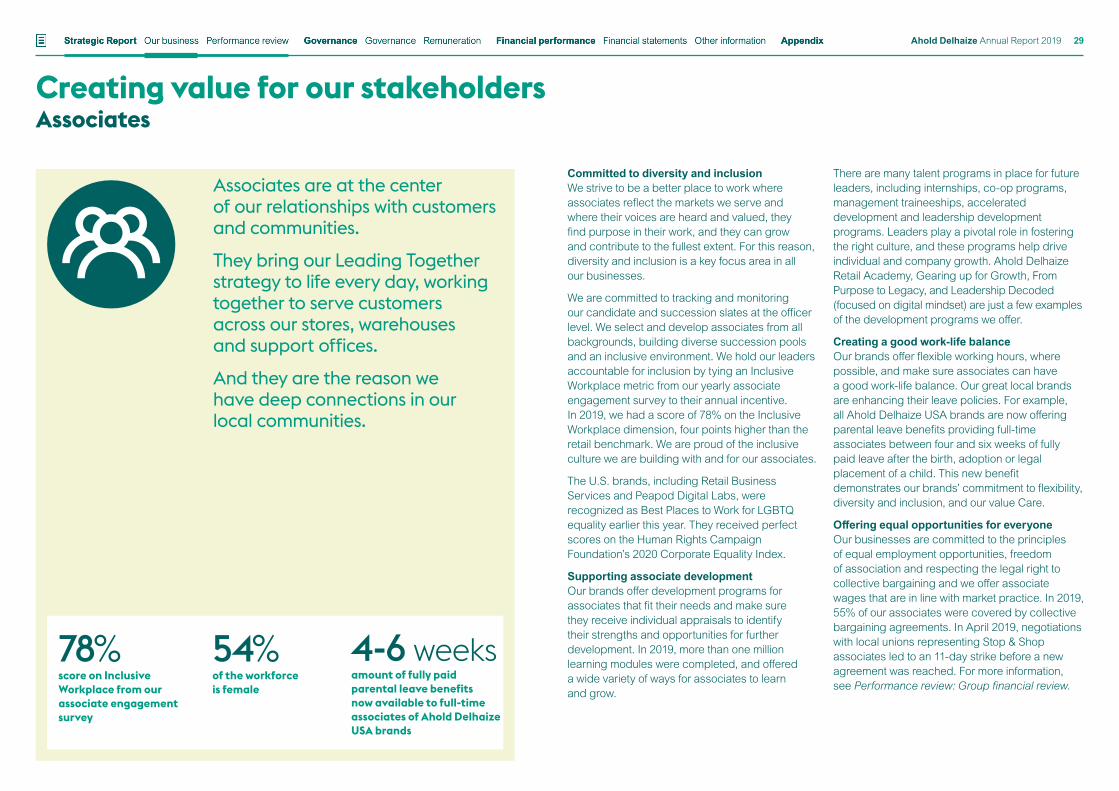
Creating value for our stakeholdersAssociates
Committed to diversity and inclusionWe strive to be a better place to work where associates reflect the markets we serve and where their voices are heard and valued, they find purpose in their work, and they can grow and contribute to the fullest extent. For this reason, diversity and inclusion is a key focus area in all our businesses.
We are committed to tracking and monitoring our candidate and succession slates at the officer level. We select and develop associates from all backgrounds, building diverse succession pools and an inclusive environment. We hold our leaders accountable for inclusion by tying an Inclusive Workplace metric from our yearly associate engagement survey to their annual incentive. In 2019, we had a score of 78% on the Inclusive Workplace dimension, four points higher than the retail benchmark. We are proud of the inclusive culture we are building with and for our associates.
The U.S. brands, including Retail Business Services and Peapod Digital Labs, were recognized as Best Places to Work for LGBTQ equality earlier this year. They received perfect scores on the Human Rights Campaign Foundation’s 2020 Corporate Equality Index.
Supporting associate developmentOur brands offer development programs for associates that fit their needs and make sure they receive individual appraisals to identify their strengths and opportunities for further development. In 2019, more than one million learning modules were completed, and offered a wide variety of ways for associates to learn and grow.
There are many talent programs in place for future leaders, including internships, co-op programs, management traineeships, accelerated development and leadership development programs. Leaders play a pivotal role in fostering the right culture, and these programs help drive individual and company growth. Ahold Delhaize Retail Academy, Gearing up for Growth, From Purpose to Legacy, and Leadership Decoded (focused on digital mindset) are just a few examples of the development programs we offer.
Creating a good work-life balanceOur brands offer flexible working hours, where possible, and make sure associates can have a good work-life balance. Our great local brands are enhancing their leave policies. For example, all Ahold Delhaize USA brands are now offering parental leave benefits providing full-time associates between four and six weeks of fully paid leave after the birth, adoption or legal placement of a child. This new benefit demonstrates our brands’ commitment to flexibility, diversity and inclusion, and our value Care.
Offering equal opportunities for everyoneOur businesses are committed to the principles of equal employment opportunities, freedom of association and respecting the legal right to collective bargaining and we offer associate wages that are in line with market practice. In 2019, 55% of our associates were covered by collective bargaining agreements. In April 2019, negotiations with local unions representing Stop & Shop associates led to an 11-day strike before a new agreement was reached. For more information, see Performance review: Group financial review.
Associates are at the center of our relationships with customers and communities. They bring our Leading Together strategy to life every day, working together to serve customers across our stores, warehouses and support offices. And they are the reason we have deep connections in our local communities.
78%score on Inclusive Workplace from our associate engagement survey
54%of the workforce is female
4-6 weeksamount of fully paid parental leave benefits now available to full-time associates of Ahold Delhaize USA brands
Financial statements Other informationStrategic Report Governance Financial performance AppendixGovernance RemunerationOur business Performance review Ahold Delhaize Annual Report 2019 29
Creating value for our stakeholders Associates continued
In 2019, 54% of the workforce across all brands consisted of females. Our Supervisory Board is currently 33% female, and our Management Board will be 25% female as of April 2020. Of the total associates in leadership positions (director and above), 31% are female. We continue to focus on gender balance and in 2019, we signed the CEO Statement of Support for the UN Women’s Empowerment Principles. We have also signed the LEAD Network Europe’s CEO Pledge to accelerate gender parity and inclusion in our industry.
Providing a healthy and safe place to workWorkplace safety is another important priority for us. We strive to make sure associates are working in a healthy and safe environment, through several company-wide focus areas.
Ahold Delhaize brands have established executive safety committees as a forum to review and discuss operational risks within the business. They have increased the awareness and prioritization of safety in their communications, at management meetings and through events such as World Day for Safety that support our commitment to ensure a safe place to work and shop.
All of the brands are focused on reducing work-related injuries and have initiated a global focus on activities that lead to Serious Injury and Fatality (SIF) risk. This includes prevention and risk reduction for high-risk activities, such as associates working at heights. We also report the frequency of SIF injuries, to provide more accurate insights into the effectiveness of safety prevention programs. In 2019, the rate of lost days due to accidents decreased by 12.5% and serious injuries decreased by 17%.
Despite the focus on keeping associates safe, in 2019, our Mega Image brand experienced a tragic road accident involving a bus transporting 15 store associates to work in Bucharest, Romania. Eight of them died and seven others were seriously injured in the collision. After many people both inside and outside of the company expressed a desire to help, the brand set up a fund to benefit the victims and their families.
Situations like this increase our dedication and focus on safety, and we strive to learn from tragedy so we can review and enhance safety standards and requirements in our operations.
Making sure associates have a voiceEach year we conduct a global engagement survey to hear from associates about what’s working well and where the company can improve. In 2019, we had a participation rate of 80% and an overall engagement score of 80%. The survey showed that associates feel they work in a safe environment, have clear job expectations, are empowered to make decisions and are treated with respect. In addition, associates provided constructive feedback related to career opportunities and increasing cooperation across the various functions.
Building deep connections to our communitiesAssociates connect our brands to their neighborhoods and communities – after all, this is where they live and work. Their knowledge of local needs and passion for being of service enables the brands to do good in a relevant way in all our communities and be better neighbors.
Financial statements Other informationStrategic Report Governance Financial performance AppendixGovernance RemunerationOur business Performance review Ahold Delhaize Annual Report 2019 30
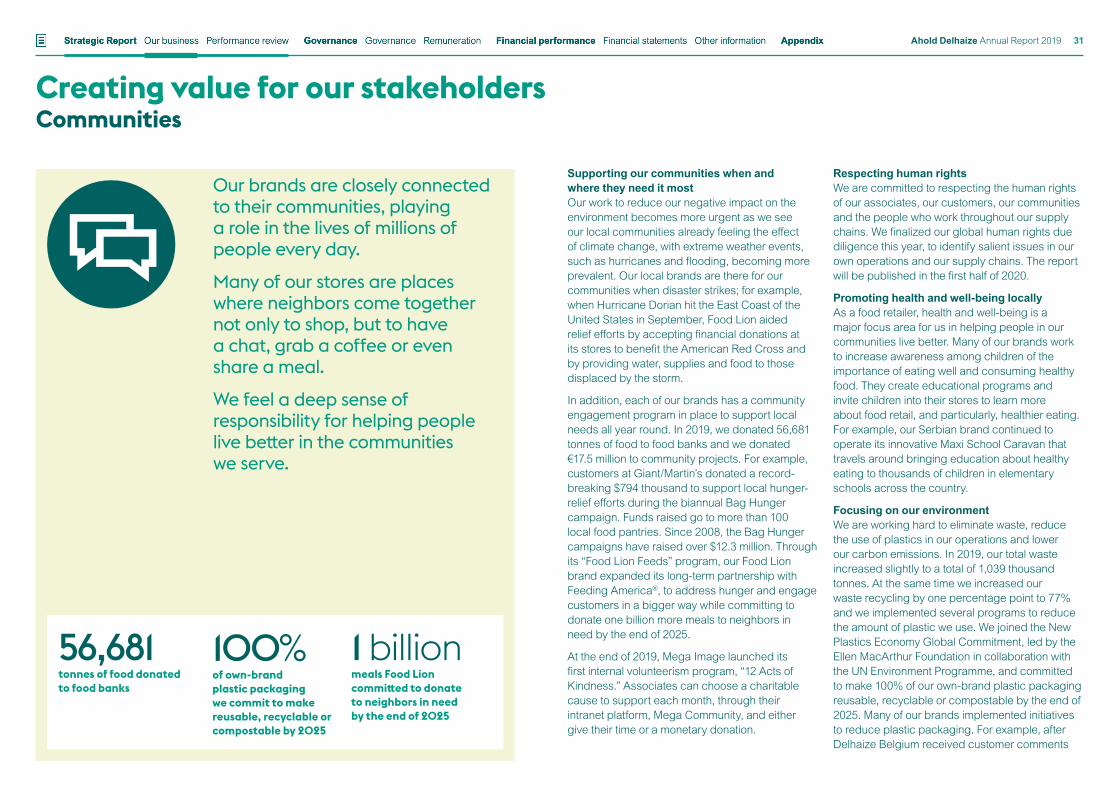
Creating value for our stakeholdersCommunities
Supporting our communities when and where they need it mostOur work to reduce our negative impact on the environment becomes more urgent as we see our local communities already feeling the effect of climate change, with extreme weather events, such as hurricanes and flooding, becoming more prevalent. Our local brands are there for our communities when disaster strikes; for example, when Hurricane Dorian hit the East Coast of the United States in September, Food Lion aided relief efforts by accepting financial donations at its stores to benefit the American Red Cross and by providing water, supplies and food to those displaced by the storm.
In addition, each of our brands has a community engagement program in place to support local needs all year round. In 2019, we donated 56,681 tonnes of food to food banks and we donated €17.5 million to community projects. For example, customers at Giant/Martin’s donated a record-breaking $794 thousand to support local hunger-relief efforts during the biannual Bag Hunger campaign. Funds raised go to more than 100 local food pantries. Since 2008, the Bag Hunger campaigns have raised over $12.3 million. Through its “Food Lion Feeds” program, our Food Lion brand expanded its long-term partnership with Feeding America®, to address hunger and engage customers in a bigger way while committing to donate one billion more meals to neighbors in need by the end of 2025.
At the end of 2019, Mega Image launched its first internal volunteerism program, “12 Acts of Kindness.” Associates can choose a charitable cause to support each month, through their intranet platform, Mega Community, and either give their time or a monetary donation.
Respecting human rightsWe are committed to respecting the human rights of our associates, our customers, our communities and the people who work throughout our supply chains. We finalized our global human rights due diligence this year, to identify salient issues in our own operations and our supply chains. The report will be published in the first half of 2020.
Promoting health and well-being locallyAs a food retailer, health and well-being is a major focus area for us in helping people in our communities live better. Many of our brands work to increase awareness among children of the importance of eating well and consuming healthy food. They create educational programs and invite children into their stores to learn more about food retail, and particularly, healthier eating. For example, our Serbian brand continued to operate its innovative Maxi School Caravan that travels around bringing education about healthy eating to thousands of children in elementary schools across the country.
Focusing on our environmentWe are working hard to eliminate waste, reduce the use of plastics in our operations and lower our carbon emissions. In 2019, our total waste increased slightly to a total of 1,039 thousand tonnes. At the same time we increased our waste recycling by one percentage point to 77% and we implemented several programs to reduce the amount of plastic we use. We joined the New Plastics Economy Global Commitment, led by the Ellen MacArthur Foundation in collaboration with the UN Environment Programme, and committed to make 100% of our own-brand plastic packaging reusable, recyclable or compostable by the end of 2025. Many of our brands implemented initiatives to reduce plastic packaging. For example, after Delhaize Belgium received customer comments
Our brands are closely connected to their communities, playing a role in the lives of millions of people every day. Many of our stores are places where neighbors come together not only to shop, but to have a chat, grab a coffee or even share a meal. We feel a deep sense of responsibility for helping people live better in the communities we serve.
56,681tonnes of food donated to food banks
100%of own-brand plastic packaging we commit to make reusable, recyclable or compostable by 2025
1 billionmeals Food Lion committed to donate to neighbors in need by the end of 2025
Financial statements Other informationStrategic Report Governance Financial performance AppendixGovernance RemunerationOur business Performance review Ahold Delhaize Annual Report 2019 31
Creating value for our stakeholders Communities continued
Tax transparency and responsibilityAnother way we seek to make a positive impact in the communities where we operate and be a better neighbor is by paying taxes. In doing so, we take into consideration social and corporate responsibility and the interests of all our stakeholders. Our risk appetite for non-tax compliance is very low.
We aim to file our taxes in full compliance with local laws and regulations. Our tax compliance is based on a reasonable and responsible interpretation of tax laws. We recognize the risk that non-compliance with applicable tax laws and regulations could result in damage to Ahold Delhaize’s reputation or to the relationship with our host countries. We also recognize that not contributing our share in taxes could impact the economic development of these countries due to reduced tax receipts.
Ahold Delhaize engages with tax authorities based on mutual trust, and we seek open and transparent working relationships with them. This helps both the tax authorities and Ahold Delhaize ensure timely and efficient compliance. In the U.S., we participate in the IRS Compliance Assurance Program (CAP) and in the Netherlands we concluded a covenant (horizontal monitoring) with the Dutch tax authorities. Starting in 2020, a new arrangement with the Dutch Tax Authorities will be implemented. We attempt to discuss and clarify uncertainties about the tax treatment up-front with the tax authorities.
Additional information on our tax position and tax paid is disclosed in Note 10 to the consolidated financial statements and in our tax policy as published on the Ahold Delhaize website.
asking why they needed to wrap multi-packs of apples in plastic, the produce team put their heads together to think of a solution, together with the supplier. They came up with an idea to use a carton made from cardboard alone. This has resulted in impressive plastic reduction.
While reducing carbon emissions from our operations, we are working to better understand how climate change will impact our business. We are mapping the emissions from our supply chain and have committed to setting long-term, science-based climate targets covering our operations and supply chain. In 2019, we reduced emissions from our stores, distribution centers and transportation by 159 thousand tonnes to 4,056 thousand tonnes.
Partnering with suppliers to improve lives outside of our marketsOur influence – and the positive affect we can have – extends much further than our operating area. Through our suppliers, we are connected to, and impact, communities across the globe.
Input from our suppliers, both local and global, helps us to create better products for customers, find new ways to reduce food waste, and increase economic, social and environmental value for the communities we source from throughout the supply chain. To this end, we maintain multiple communication channels with our suppliers, including face-to-face meetings, online communication and supplier events. We aim for long-term relationships and have several strategic partnerships with key suppliers.
In 2019, 71% of own-brand production units in high-risk countries were audited on social compliance.
Collaborating across the industry to have a global impactIn addition, we collaborate with other retailers and manufacturers, through memberships in industry associations and other partnerships, to improve global health, sustainability, product transparency, compliance monitoring and the well-being of workers in our communities and around the world.
Ahold Delhaize has a strong collaboration with the Consumer Goods Forum, a platform to work on non-competitive issues such as sustainability and health and wellness. Other memberships include regional and local industry associations, such as the Food Marketing Institute, the Dutch Food Retail Association (“Centraal Bureau Levensmiddelenhandel”), the European Retail Round Table, and Eurocommerce.
Ahold Delhaize is a signatory of the United Nations Global Compact – an initiative for businesses committed to aligning their operations and strategies with 10 universally accepted principles in the areas of human rights, labor, environment and anti-corruption. These principles are addressed in our policies, practices and Leading Together strategy.
Financial statements Other informationStrategic Report Governance Financial performance AppendixGovernance RemunerationOur business Performance review Ahold Delhaize Annual Report 2019 32
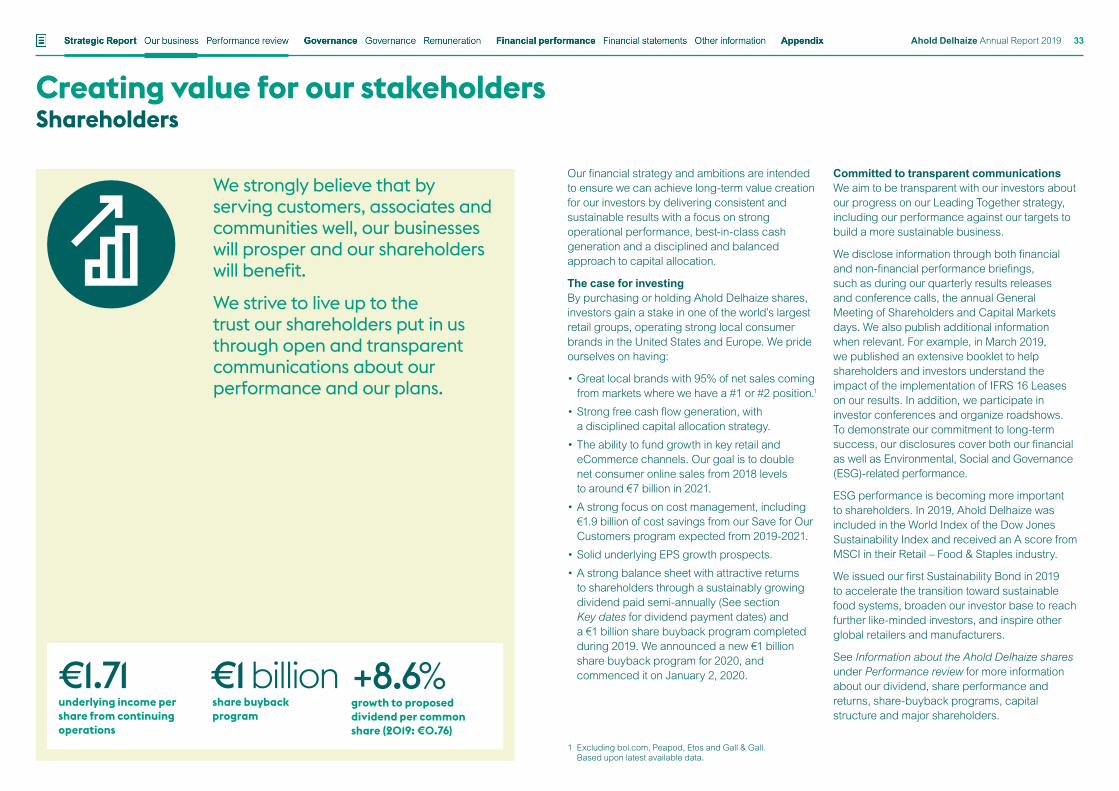
Creating value for our stakeholdersShareholders
Our financial strategy and ambitions are intended to ensure we can achieve long-term value creation for our investors by delivering consistent and sustainable results with a focus on strong operational performance, best-in-class cash generation and a disciplined and balanced approach to capital allocation.
The case for investingBy purchasing or holding Ahold Delhaize shares, investors gain a stake in one of the world’s largest retail groups, operating strong local consumer brands in the United States and Europe. We pride ourselves on having:
• Great local brands with 95% of net sales coming from markets where we have a #1 or #2 position.1
• Strong free cash flow generation, with a disciplined capital allocation strategy.
• The ability to fund growth in key retail and eCommerce channels. Our goal is to double net consumer online sales from 2018 levels to around €7 billion in 2021.
• A strong focus on cost management, including €1.9 billion of cost savings from our Save for Our Customers program expected from 2019-2021.
• Solid underlying EPS growth prospects.
• A strong balance sheet with attractive returns to shareholders through a sustainably growing dividend paid semi-annually (See section Key dates for dividend payment dates) and a €1 billion share buyback program completed during 2019. We announced a new €1 billion share buyback program for 2020, and commenced it on January 2, 2020.
Committed to transparent communicationsWe aim to be transparent with our investors about our progress on our Leading Together strategy, including our performance against our targets to build a more sustainable business.
We disclose information through both financial and non-financial performance briefings, such as during our quarterly results releases and conference calls, the annual General Meeting of Shareholders and Capital Markets days. We also publish additional information when relevant. For example, in March 2019, we published an extensive booklet to help shareholders and investors understand the impact of the implementation of IFRS 16 Leases on our results. In addition, we participate in investor conferences and organize roadshows. To demonstrate our commitment to long-term success, our disclosures cover both our financial as well as Environmental, Social and Governance (ESG)-related performance.
ESG performance is becoming more important to shareholders. In 2019, Ahold Delhaize was included in the World Index of the Dow Jones Sustainability Index and received an A score from MSCI in their Retail – Food & Staples industry.
We issued our first Sustainability Bond in 2019 to accelerate the transition toward sustainable food systems, broaden our investor base to reach further like-minded investors, and inspire other global retailers and manufacturers.
See Information about the Ahold Delhaize shares under Performance review for more information about our dividend, share performance and returns, share-buyback programs, capital structure and major shareholders.
We strongly believe that by serving customers, associates and communities well, our businesses will prosper and our shareholders will benefit.We strive to live up to the trust our shareholders put in us through open and transparent communications about our performance and our plans.
1 Excluding bol.com, Peapod, Etos and Gall & Gall. Based upon latest available data.
€1.71underlying income per share from continuing operations
€1 billionshare buyback program
+8.6%growth to proposed dividend per common share (2019: €0.76)
Financial statements Other informationStrategic Report Governance Financial performance AppendixGovernance RemunerationOur business Performance review Ahold Delhaize Annual Report 2019 33
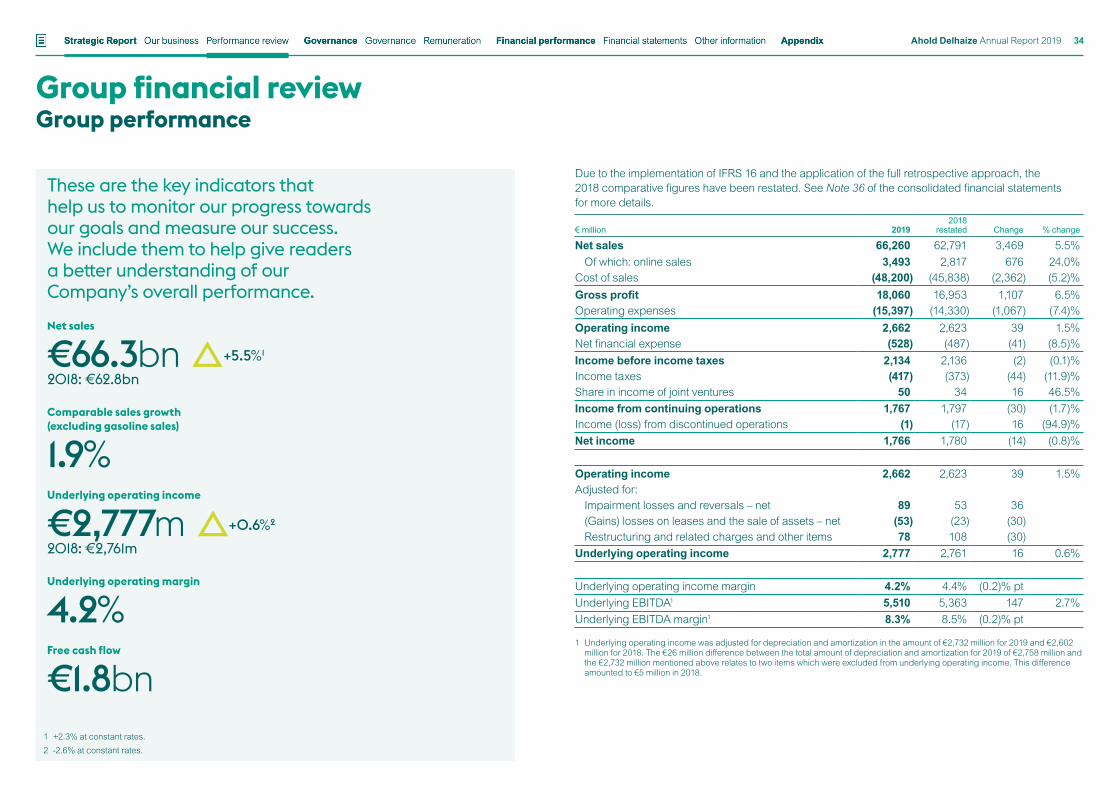
Net sales
€66.3bn2018: €62.8bn
Comparable sales growth (excluding gasoline sales)
1.9%Underlying operating income
€2,777m2018: €2,761m
Underlying operating margin
4.2%Free cash flow
€1.8bn
+5.5%1
+0.6%2
1 +2.3% at constant rates.2 -2.6% at constant rates.
Due to the implementation of IFRS 16 and the application of the full retrospective approach, the 2018 comparative figures have been restated. See Note 36 of the consolidated financial statements for more details.
€ million 20192018
restated Change % change
Net sales 66,260 62,791 3,469 5.5%Of which: online sales 3,493 2,817 676 24.0%
Cost of sales (48,200) (45,838) (2,362) (5.2)%Gross profit 18,060 16,953 1,107 6.5%Operating expenses (15,397) (14,330) (1,067) (7.4)%Operating income 2,662 2,623 39 1.5%Net financial expense (528) (487) (41) (8.5)%Income before income taxes 2,134 2,136 (2) (0.1)%Income taxes (417) (373) (44) (11.9)%Share in income of joint ventures 50 34 16 46.5%Income from continuing operations 1,767 1,797 (30) (1.7)%Income (loss) from discontinued operations (1) (17) 16 (94.9)%Net income 1,766 1,780 (14) (0.8)%
Operating income 2,662 2,623 39 1.5%Adjusted for:
Impairment losses and reversals – net 89 53 36(Gains) losses on leases and the sale of assets – net (53) (23) (30)Restructuring and related charges and other items 78 108 (30)
Underlying operating income 2,777 2,761 16 0.6%
Underlying operating income margin 4.2% 4.4% (0.2)% ptUnderlying EBITDA1 5,510 5,363 147 2.7%Underlying EBITDA margin1 8.3% 8.5% (0.2)% pt
1 Underlying operating income was adjusted for depreciation and amortization in the amount of €2,732 million for 2019 and €2,602 million for 2018. The €26 million difference between the total amount of depreciation and amortization for 2019 of €2,758 million and the €2,732 million mentioned above relates to two items which were excluded from underlying operating income. This difference amounted to €5 million in 2018.
Group financial reviewGroup performance
These are the key indicators that help us to monitor our progress towards our goals and measure our success. We include them to help give readers a better understanding of our Company’s overall performance.
Financial statements Other informationStrategic Report Governance Financial performance AppendixGovernance RemunerationOur business Performance review Ahold Delhaize Annual Report 2019 34
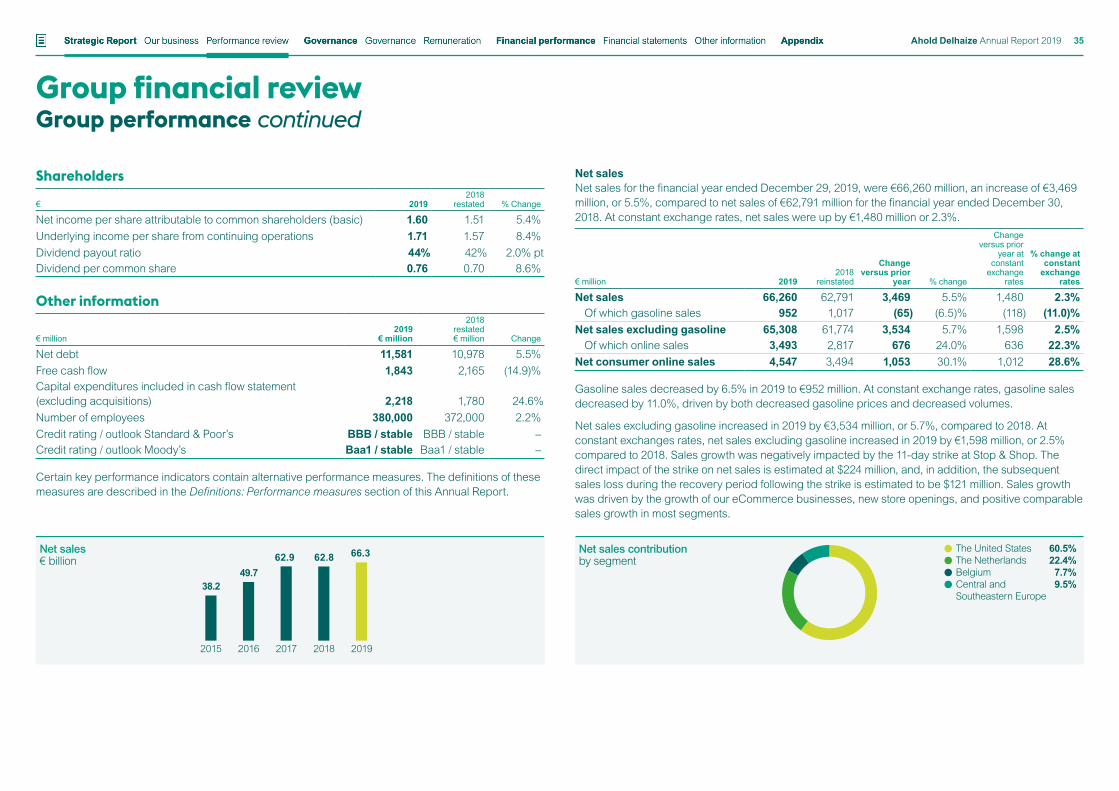
Net salesNet sales for the financial year ended December 29, 2019, were €66,260 million, an increase of €3,469 million, or 5.5%, compared to net sales of €62,791 million for the financial year ended December 30, 2018. At constant exchange rates, net sales were up by €1,480 million or 2.3%.
€ million 20192018
reinstated
Change versus prior
year % change
Change versus prior
year at constant
exchange rates
% change at constant
exchange rates
Net sales 66,260 62,791 3,469 5.5% 1,480 2.3%Of which gasoline sales 952 1,017 (65) (6.5)% (118) (11.0)%
Net sales excluding gasoline 65,308 61,774 3,534 5.7% 1,598 2.5%Of which online sales 3,493 2,817 676 24.0% 636 22.3%
Net consumer online sales 4,547 3,494 1,053 30.1% 1,012 28.6%
Gasoline sales decreased by 6.5% in 2019 to €952 million. At constant exchange rates, gasoline sales decreased by 11.0%, driven by both decreased gasoline prices and decreased volumes.
Net sales excluding gasoline increased in 2019 by €3,534 million, or 5.7%, compared to 2018. At constant exchanges rates, net sales excluding gasoline increased in 2019 by €1,598 million, or 2.5% compared to 2018. Sales growth was negatively impacted by the 11-day strike at Stop & Shop. The direct impact of the strike on net sales is estimated at $224 million, and, in addition, the subsequent sales loss during the recovery period following the strike is estimated to be $121 million. Sales growth was driven by the growth of our eCommerce businesses, new store openings, and positive comparable sales growth in most segments.
Shareholders
€ 2019 2018
restated % Change
Net income per share attributable to common shareholders (basic) 1.60 1.51 5.4%Underlying income per share from continuing operations 1.71 1.57 8.4%Dividend payout ratio 44% 42% 2.0% ptDividend per common share 0.76 0.70 8.6%
Other information
€ million2019
€ million
2018 restated € million Change
Net debt 11,581 10,978 5.5%Free cash flow 1,843 2,165 (14.9)%Capital expenditures included in cash flow statement (excluding acquisitions) 2,218 1,780 24.6%Number of employees 380,000 372,000 2.2%Credit rating / outlook Standard & Poor’s BBB / stable BBB / stable –Credit rating / outlook Moody’s Baa1 / stable Baa1 / stable –
Certain key performance indicators contain alternative performance measures. The definitions of these measures are described in the Definitions: Performance measures section of this Annual Report.
Group financial reviewGroup performance continued
Net sales contributionby segment
The United States The Netherlands Belgium Central and Southeastern Europe
60.5%22.4%7.7%9.5%
Net sales€ billion
38.249.7
62.9 62.8 66.3
2015 2016 2017 2018 2019
Financial statements Other informationStrategic Report Governance Financial performance AppendixGovernance RemunerationOur business Performance review Ahold Delhaize Annual Report 2019 35
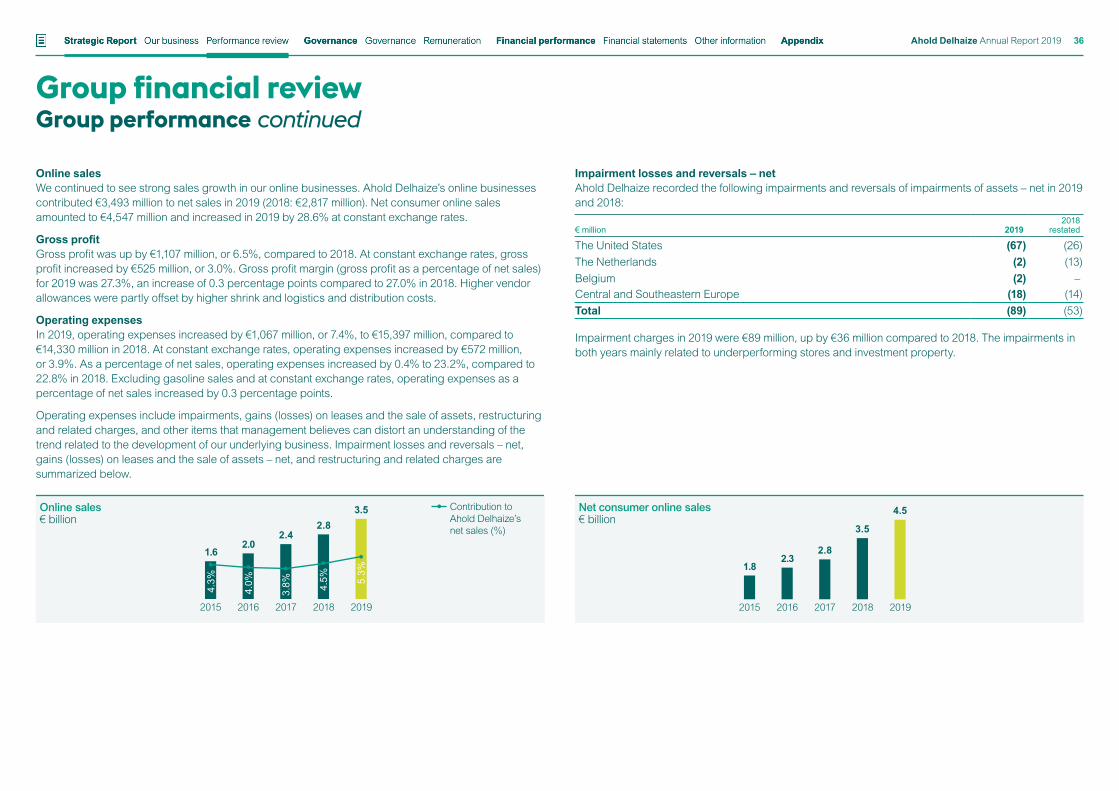
Impairment losses and reversals – netAhold Delhaize recorded the following impairments and reversals of impairments of assets – net in 2019 and 2018:
€ million 2019 2018
restated
The United States (67) (26)The Netherlands (2) (13)Belgium (2) –Central and Southeastern Europe (18) (14)Total (89) (53)
Impairment charges in 2019 were €89 million, up by €36 million compared to 2018. The impairments in both years mainly related to underperforming stores and investment property.
Online salesWe continued to see strong sales growth in our online businesses. Ahold Delhaize’s online businesses contributed €3,493 million to net sales in 2019 (2018: €2,817 million). Net consumer online sales amounted to €4,547 million and increased in 2019 by 28.6% at constant exchange rates.
Gross profitGross profit was up by €1,107 million, or 6.5%, compared to 2018. At constant exchange rates, gross profit increased by €525 million, or 3.0%. Gross profit margin (gross profit as a percentage of net sales) for 2019 was 27.3%, an increase of 0.3 percentage points compared to 27.0% in 2018. Higher vendor allowances were partly offset by higher shrink and logistics and distribution costs.
Operating expensesIn 2019, operating expenses increased by €1,067 million, or 7.4%, to €15,397 million, compared to €14,330 million in 2018. At constant exchange rates, operating expenses increased by €572 million, or 3.9%. As a percentage of net sales, operating expenses increased by 0.4% to 23.2%, compared to 22.8% in 2018. Excluding gasoline sales and at constant exchange rates, operating expenses as a percentage of net sales increased by 0.3 percentage points.
Operating expenses include impairments, gains (losses) on leases and the sale of assets, restructuring and related charges, and other items that management believes can distort an understanding of the trend related to the development of our underlying business. Impairment losses and reversals – net, gains (losses) on leases and the sale of assets – net, and restructuring and related charges are summarized below.
Group financial reviewGroup performance continued
Online sales€ billion
1.62.0
2.42.8
3.5
2015 2016 2017 2018 2019
4.3%
4.0%
3.8% 4.5% 5.
3%
Contribution to Ahold Delhaize’s net sales (%)
Net consumer online sales€ billion
1.82.3
2.8
3.5
4.5
2015 2016 2017 2018 2019
Financial statements Other informationStrategic Report Governance Financial performance AppendixGovernance RemunerationOur business Performance review Ahold Delhaize Annual Report 2019 36
Operating incomeOperating income in 2019 was up by €39 million, or 1.5%, to €2,662 million compared to €2,623 million in 2018. The increase of €39 million is explained by the changes in gross profit and operating expenses, which are explained above. At constant rates, operating income was down (1.7)%.
Net financial expensesNet financial expenses in 2019 increased by €41 million, or 8.5%, to €528 million compared to €487 million in 2018. The increase was primarily due to other gains (losses). This related to transaction results from the redemption of the cumulative preferred shares, which resulted in a one-off cost of €22 million, and a cancellation of mortgages payable in the Czech Republic, which resulted in a one-off cost of €13 million.
Income taxesIn 2019, income tax expense excluding the impact of statutory corporate income tax rate changes was €412 million, up by €20 million compared to €392 million in 2018 (excluding the impact of statutory corporate income tax rate changes).
The effective tax rate, calculated as a percentage of income before income tax, excluding the impact of statutory corporate income tax rate changes, was 19.3% in 2019 (2018: 18.4%). The increase in the effective tax rate from 18.4% to 19.3% and the increase in income tax expense are mainly the result of one-time items in 2018 and 2019.
The 2019 tax expense, including the one-time impact of statutory corporate income tax rate changes, was €417 million. The effective tax rate, calculated as a percentage of income before income tax, including the one-time impact of statutory corporate income tax rate changes, was 19.6% in 2019 (2018: 17.5%). The impact of the statutory corporate income tax rate changes was a tax expense of €5 million in 2019 and a tax benefit of €19 million in 2018.
Gains (losses) on leases and the sale of assets – netAhold Delhaize recorded the following gains (losses) on leases and the sale of assets – net in 2019 and 2018:
€ million 2019 2018
restated
The United States 39 17The Netherlands 13 1Belgium (5) 2Central and Southeastern Europe 2 3Global support office 4 –Total 53 23
The gains (losses) in 2019 were €53 million, which was €30 million higher than 2018, mainly due to the €22 million increase in the United States, explained by the sale of non-strategic investment property, pharmacy scripts, stores and properties, and the €12 million increase in the Netherlands, mainly explained by a gain on leases and subleases at Albert Heijn.
Restructuring and related charges and other itemsRestructuring and related charges and other items in 2019 and 2018 were as follows:
€ million 2019 2018
restated
The United States (16) (57)The Netherlands (22) (5)Belgium (13) (14)Central and Southeastern Europe (18) (1)Global Support Office (10) (31)Total (78) (108)
Restructuring and related charges and other items in 2019 were €78 million, down by €30 million compared to 2018. This decrease is mainly explained by €55 million lower integration costs related to the merger between Ahold and Delhaize, as the merger was fully completed in Q2 2019, partially offset by higher one-time costs mainly in the Netherlands, due to restructuring, and CSE, mainly due to assets write-down.
Group financial reviewGroup performance continued
Financial statements Other informationStrategic Report Governance Financial performance AppendixGovernance RemunerationOur business Performance review Ahold Delhaize Annual Report 2019 37
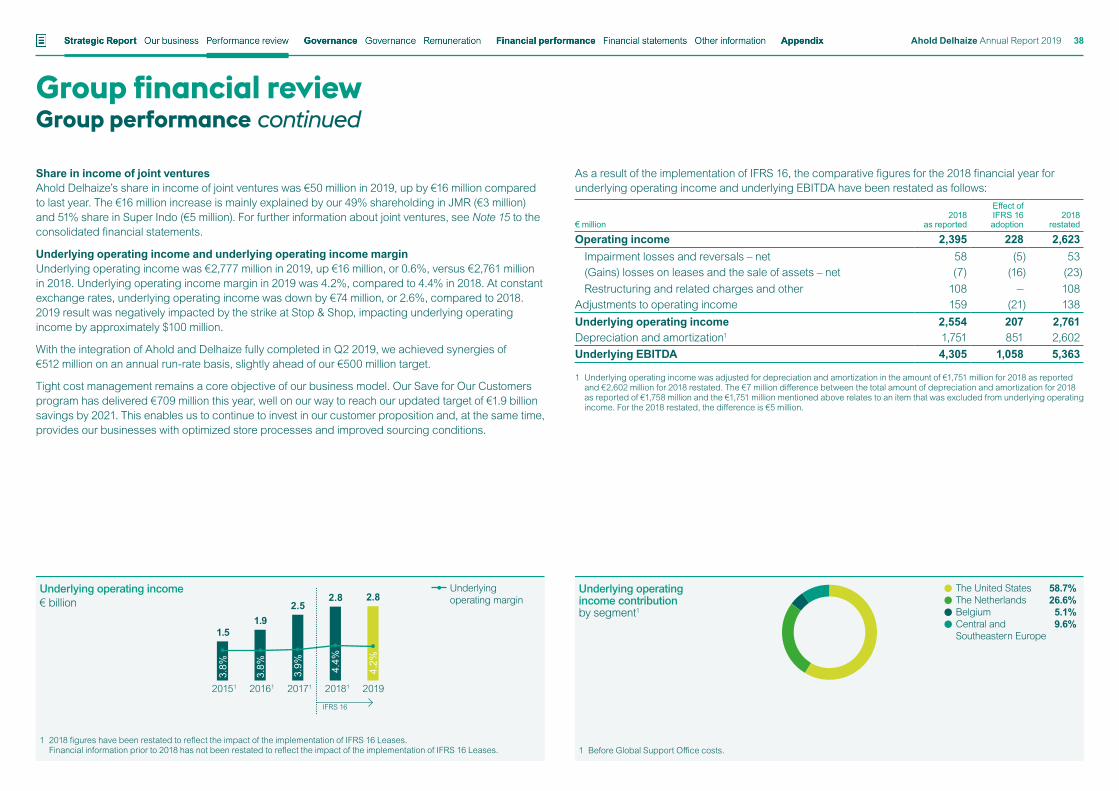
Share in income of joint venturesAhold Delhaize’s share in income of joint ventures was €50 million in 2019, up by €16 million compared to last year. The €16 million increase is mainly explained by our 49% shareholding in JMR (€3 million) and 51% share in Super Indo (€5 million). For further information about joint ventures, see Note 15 to the consolidated financial statements.
Underlying operating income and underlying operating income marginUnderlying operating income was €2,777 million in 2019, up €16 million, or 0.6%, versus €2,761 million in 2018. Underlying operating income margin in 2019 was 4.2%, compared to 4.4% in 2018. At constant exchange rates, underlying operating income was down by €74 million, or 2.6%, compared to 2018. 2019 result was negatively impacted by the strike at Stop & Shop, impacting underlying operating income by approximately $100 million.
With the integration of Ahold and Delhaize fully completed in Q2 2019, we achieved synergies of €512 million on an annual run-rate basis, slightly ahead of our €500 million target.
Tight cost management remains a core objective of our business model. Our Save for Our Customers program has delivered €709 million this year, well on our way to reach our updated target of €1.9 billion savings by 2021. This enables us to continue to invest in our customer proposition and, at the same time, provides our businesses with optimized store processes and improved sourcing conditions.
As a result of the implementation of IFRS 16, the comparative figures for the 2018 financial year for underlying operating income and underlying EBITDA have been restated as follows:
€ million2018
as reported
Effect ofIFRS 16 adoption
2018 restated
Operating income 2,395 228 2,623Impairment losses and reversals – net 58 (5) 53(Gains) losses on leases and the sale of assets – net (7) (16) (23)Restructuring and related charges and other 108 — 108
Adjustments to operating income 159 (21) 138Underlying operating income 2,554 207 2,761Depreciation and amortization1 1,751 851 2,602Underlying EBITDA 4,305 1,058 5,363
1 Underlying operating income was adjusted for depreciation and amortization in the amount of €1,751 million for 2018 as reported and €2,602 million for 2018 restated. The €7 million difference between the total amount of depreciation and amortization for 2018 as reported of €1,758 million and the €1,751 million mentioned above relates to an item that was excluded from underlying operating income. For the 2018 restated, the difference is €5 million.
Group financial reviewGroup performance continued
Underlying operating income€ billion
Underlying operating margin
1.51.9
2.52.8 2.8
20151 20161 20171 20181 2019
3.8%
3.8%
3.9% 4.4%
4.2%
IFRS 16
1 2018 figures have been restated to reflect the impact of the implementation of IFRS 16 Leases. Financial information prior to 2018 has not been restated to reflect the impact of the implementation of IFRS 16 Leases.
Underlying operating income contributionby segment1
The United States The Netherlands Belgium Central and Southeastern Europe
58.7%26.6%5.1%9.6%
1 Before Global Support Office costs.
Financial statements Other informationStrategic Report Governance Financial performance AppendixGovernance RemunerationOur business Performance review Ahold Delhaize Annual Report 2019 38
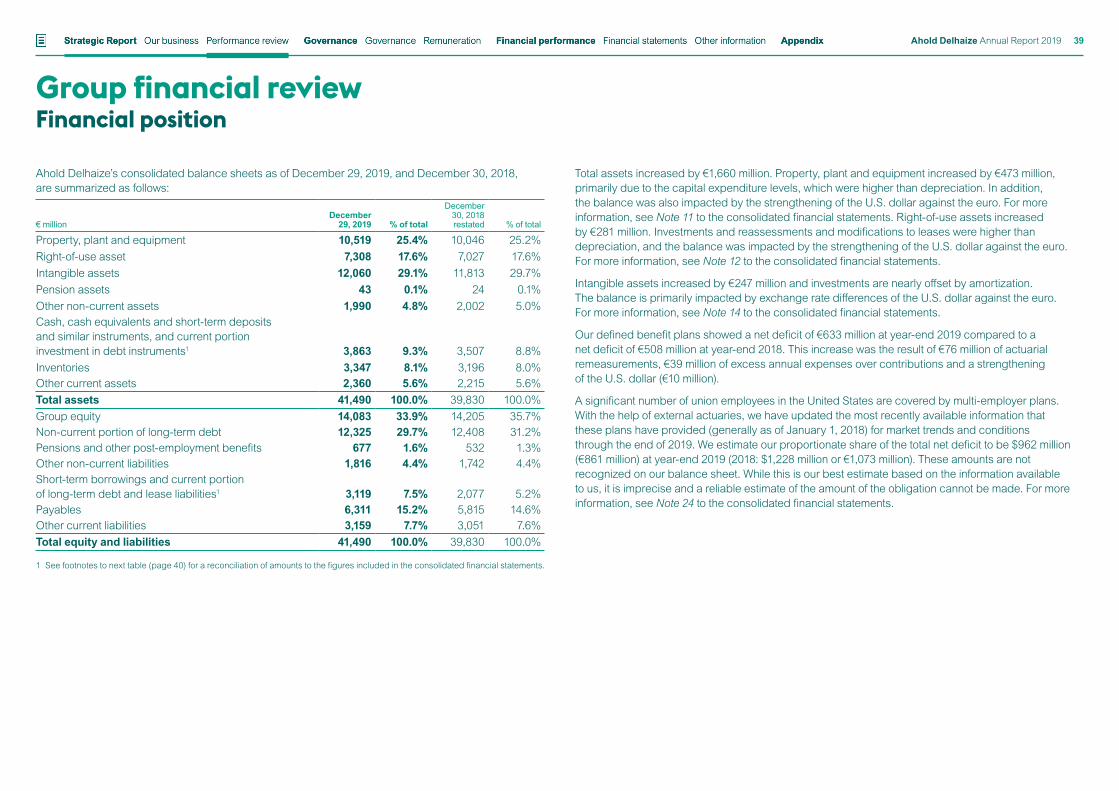
Ahold Delhaize’s consolidated balance sheets as of December 29, 2019, and December 30, 2018, are summarized as follows:
€ millionDecember
29, 2019 % of total
December 30, 2018 restated % of total
Property, plant and equipment 10,519 25.4% 10,046 25.2%Right-of-use asset 7,308 17.6% 7,027 17.6%Intangible assets 12,060 29.1% 11,813 29.7%Pension assets 43 0.1% 24 0.1%Other non-current assets 1,990 4.8% 2,002 5.0%Cash, cash equivalents and short-term deposits and similar instruments, and current portion investment in debt instruments1 3,863 9.3% 3,507 8.8%Inventories 3,347 8.1% 3,196 8.0%Other current assets 2,360 5.6% 2,215 5.6%Total assets 41,490 100.0% 39,830 100.0%Group equity 14,083 33.9% 14,205 35.7%Non-current portion of long-term debt 12,325 29.7% 12,408 31.2%Pensions and other post-employment benefits 677 1.6% 532 1.3%Other non-current liabilities 1,816 4.4% 1,742 4.4%Short-term borrowings and current portion of long-term debt and lease liabilities1 3,119 7.5% 2,077 5.2%Payables 6,311 15.2% 5,815 14.6%Other current liabilities 3,159 7.7% 3,051 7.6%Total equity and liabilities 41,490 100.0% 39,830 100.0%
1 See footnotes to next table (page 40) for a reconciliation of amounts to the figures included in the consolidated financial statements.
Group financial reviewFinancial position
Total assets increased by €1,660 million. Property, plant and equipment increased by €473 million, primarily due to the capital expenditure levels, which were higher than depreciation. In addition, the balance was also impacted by the strengthening of the U.S. dollar against the euro. For more information, see Note 11 to the consolidated financial statements. Right-of-use assets increased by €281 million. Investments and reassessments and modifications to leases were higher than depreciation, and the balance was impacted by the strengthening of the U.S. dollar against the euro. For more information, see Note 12 to the consolidated financial statements.
Intangible assets increased by €247 million and investments are nearly offset by amortization. The balance is primarily impacted by exchange rate differences of the U.S. dollar against the euro. For more information, see Note 14 to the consolidated financial statements.
Our defined benefit plans showed a net deficit of €633 million at year-end 2019 compared to a net deficit of €508 million at year-end 2018. This increase was the result of €76 million of actuarial remeasurements, €39 million of excess annual expenses over contributions and a strengthening of the U.S. dollar (€10 million).
A significant number of union employees in the United States are covered by multi-employer plans. With the help of external actuaries, we have updated the most recently available information that these plans have provided (generally as of January 1, 2018) for market trends and conditions through the end of 2019. We estimate our proportionate share of the total net deficit to be $962 million (€861 million) at year-end 2019 (2018: $1,228 million or €1,073 million). These amounts are not recognized on our balance sheet. While this is our best estimate based on the information available to us, it is imprecise and a reliable estimate of the amount of the obligation cannot be made. For more information, see Note 24 to the consolidated financial statements.
Financial statements Other informationStrategic Report Governance Financial performance AppendixGovernance RemunerationOur business Performance review Ahold Delhaize Annual Report 2019 39
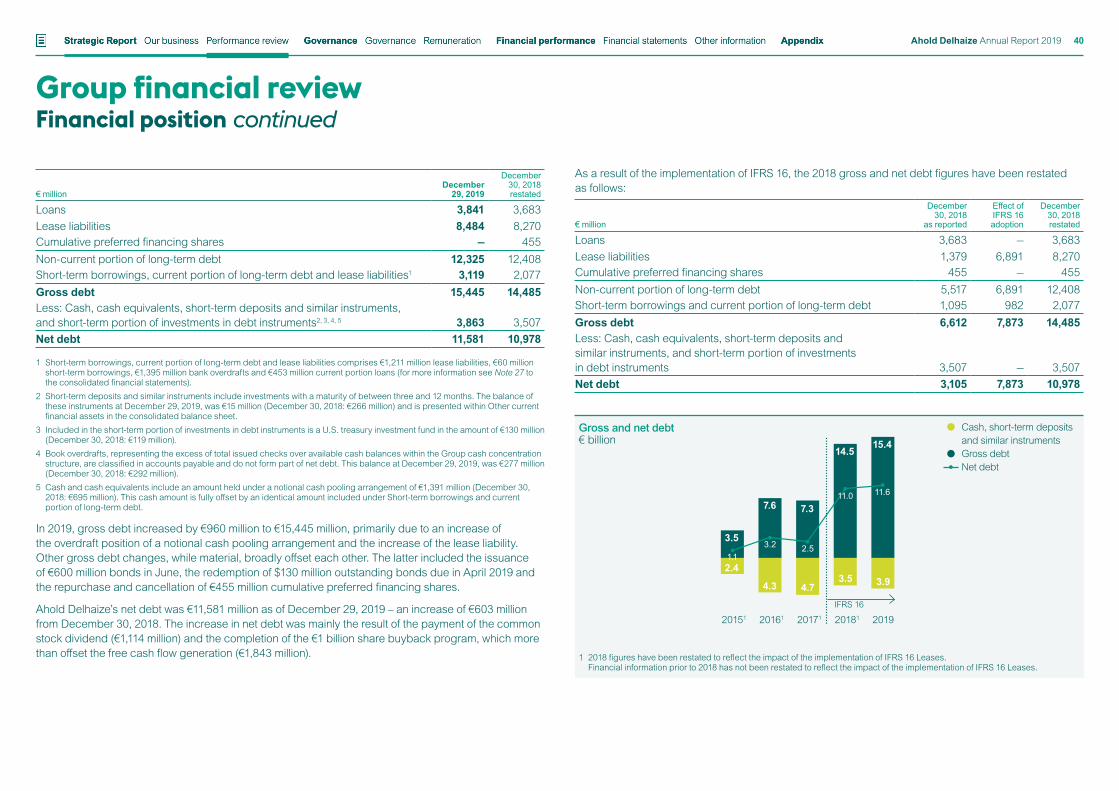
Gross and net debt€ billion
20151 20161 20171 20181 2019IFRS 16
3.5
2.4
7.6
4.3
7.3
4.73.5 3.9
14.515.4
1.13.2
11.0 11.6
2.5
Cash, short-term depositsand similar instrumentsGross debtNet debt
As a result of the implementation of IFRS 16, the 2018 gross and net debt figures have been restated as follows:
€ million
December 30, 2018
as reported
Effect ofIFRS 16 adoption
December 30, 2018restated
Loans 3,683 — 3,683Lease liabilities 1,379 6,891 8,270Cumulative preferred financing shares 455 — 455Non-current portion of long-term debt 5,517 6,891 12,408Short-term borrowings and current portion of long-term debt 1,095 982 2,077Gross debt 6,612 7,873 14,485Less: Cash, cash equivalents, short-term deposits and similar instruments, and short-term portion of investments in debt instruments 3,507 — 3,507Net debt 3,105 7,873 10,978
Group financial reviewFinancial position continued
€ millionDecember
29, 2019
December 30, 2018 restated
Loans 3,841 3,683Lease liabilities 8,484 8,270Cumulative preferred financing shares — 455Non-current portion of long-term debt 12,325 12,408Short-term borrowings, current portion of long-term debt and lease liabilities1 3,119 2,077Gross debt 15,445 14,485Less: Cash, cash equivalents, short-term deposits and similar instruments, and short-term portion of investments in debt instruments2, 3, 4, 5 3,863 3,507Net debt 11,581 10,978
1 Short-term borrowings, current portion of long-term debt and lease liabilities comprises €1,211 million lease liabilities, €60 million short-term borrowings, €1,395 million bank overdrafts and €453 million current portion loans (for more information see Note 27 to the consolidated financial statements).
2 Short-term deposits and similar instruments include investments with a maturity of between three and 12 months. The balance of these instruments at December 29, 2019, was €15 million (December 30, 2018: €266 million) and is presented within Other current financial assets in the consolidated balance sheet.
3 Included in the short-term portion of investments in debt instruments is a U.S. treasury investment fund in the amount of €130 million (December 30, 2018: €119 million).
4 Book overdrafts, representing the excess of total issued checks over available cash balances within the Group cash concentration structure, are classified in accounts payable and do not form part of net debt. This balance at December 29, 2019, was €277 million (December 30, 2018: €292 million).
5 Cash and cash equivalents include an amount held under a notional cash pooling arrangement of €1,391 million (December 30, 2018: €695 million). This cash amount is fully offset by an identical amount included under Short-term borrowings and current portion of long-term debt.
In 2019, gross debt increased by €960 million to €15,445 million, primarily due to an increase of the overdraft position of a notional cash pooling arrangement and the increase of the lease liability. Other gross debt changes, while material, broadly offset each other. The latter included the issuance of €600 million bonds in June, the redemption of $130 million outstanding bonds due in April 2019 and the repurchase and cancellation of €455 million cumulative preferred financing shares.
Ahold Delhaize’s net debt was €11,581 million as of December 29, 2019 – an increase of €603 million from December 30, 2018. The increase in net debt was mainly the result of the payment of the common stock dividend (€1,114 million) and the completion of the €1 billion share buyback program, which more than offset the free cash flow generation (€1,843 million). 1 2018 figures have been restated to reflect the impact of the implementation of IFRS 16 Leases.
Financial information prior to 2018 has not been restated to reflect the impact of the implementation of IFRS 16 Leases.
Financial statements Other informationStrategic Report Governance Financial performance AppendixGovernance RemunerationOur business Performance review Ahold Delhaize Annual Report 2019 40
Group credit facilityAhold Delhaize has access to a €1.0 billion committed, unsecured, multi-currency and syndicated credit facility. In February 2015, the facility was amended and extended to 2020 with two 1-year extension options. In 2017, the Company exercised its option to extend until 2022.
The credit facility contains customary covenants and a financial covenant that requires Ahold Delhaize, in the event that its corporate rating from Standard & Poor’s and Moody’s is lower than BBB / Baa2 respectively, not to exceed a specified maximum leverage ratio. On May 3, 2019, the lenders agreed to amend the maximum leverage ratio from 4.0:1 to 5.5:1 as a result of the implementation of IFRS 16.
During 2019 and 2018, the Company was in compliance with these covenants. However, it was not required to test the financial covenant due its credit rating. As of December 29, 2019, there were no outstanding borrowings under the facility other than letters of credit to an aggregate amount of $165 million (€148 million).
Credit ratingsMaintaining investment grade credit ratings is a cornerstone of Ahold Delhaize’s financial strategy because such ratings lower the cost of funds and facilitate access to a variety of lenders and markets. Ahold Delhaize’s current credit ratings from the solicited rating agencies are as follows:
• Standard & Poor’s: corporate credit rating BBB, with a stable outlook since June 2009 (previous rating BBB- assigned in 2007).
• Moody’s: issuer credit rating Baa1, with a stable outlook since February 2018 (previous rating Baa2 assigned in August 2015).
December 29, 2019
December 30, 2018 restated
Total cash and cash equivalents (Note 20) 3,717 3,122Short-term deposits and similar instruments (Note 19) 15 266Investments in debt instruments (FVPL) – current portion (Note 19) 130 119Cash, cash equivalents, short-term deposits and similar instruments, and short-term portion of investments in debt instruments 3,863 3,507Less: Notional cash pooling arrangement 1,391 695Liquidity position 2,472 2,812
Ahold Delhaize views available cash balances and funds from operating activities as its primary sources of liquidity, complemented by external sources of funds when deemed to be required. Ahold Delhaize manages short-term liquidity based on projected cash flows. As of December 29, 2019, the Company’s liquidity position primarily consisted of €2,472 million of cash (including short-term deposits and similar instruments and current portion of investments in debt instruments, adjusted for cash held under a notional cash pooling arrangement), and the undrawn portion of the €1 billion revolving credit facility.
Based on the current operating performance and liquidity position, the Company believes that cash provided by operating activities and available cash balances will be sufficient to fund working capital needs, capital expenditures, interest payments, dividends, the announced €1 billion share buyback program, and scheduled debt repayments for the next 12 months. In addition, the Company has access to the amount available on its revolving credit facility and to the debt capital markets based on its current credit ratings.
Group financial reviewLiquidity
Financial statements Other informationStrategic Report Governance Financial performance AppendixGovernance RemunerationOur business Performance review Ahold Delhaize Annual Report 2019 41
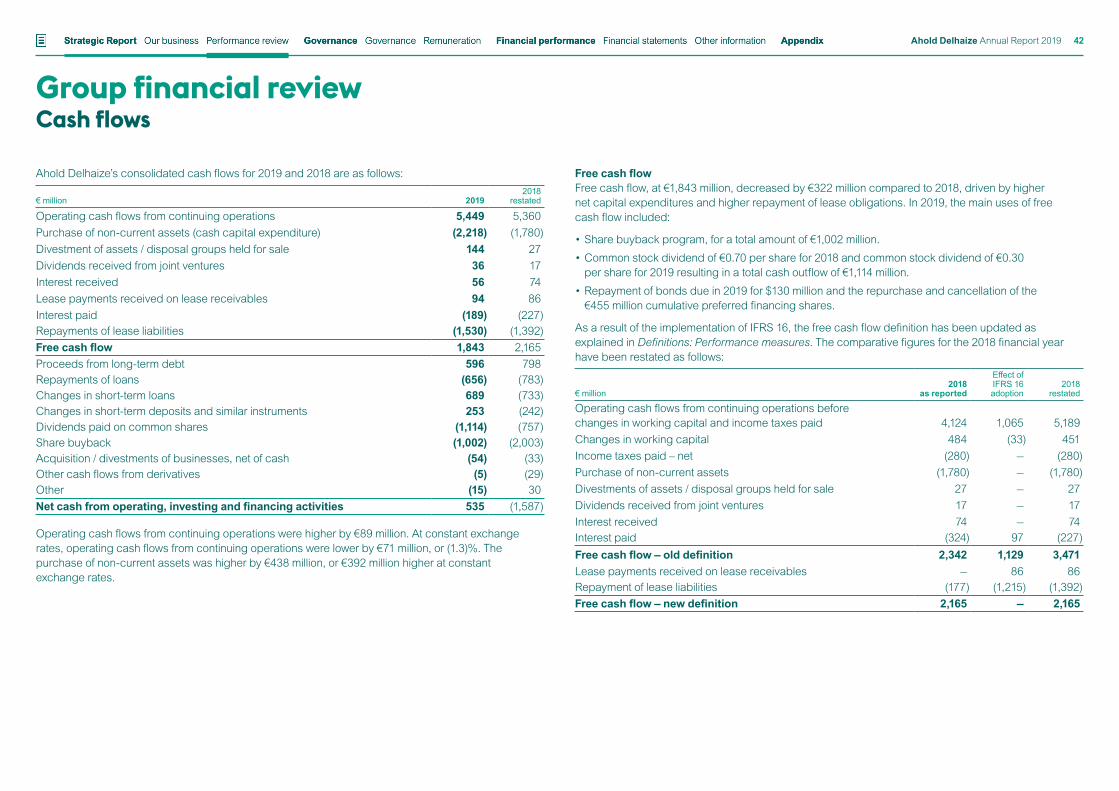
Free cash flowFree cash flow, at €1,843 million, decreased by €322 million compared to 2018, driven by higher net capital expenditures and higher repayment of lease obligations. In 2019, the main uses of free cash flow included:
• Share buyback program, for a total amount of €1,002 million.
• Common stock dividend of €0.70 per share for 2018 and common stock dividend of €0.30 per share for 2019 resulting in a total cash outflow of €1,114 million.
• Repayment of bonds due in 2019 for $130 million and the repurchase and cancellation of the €455 million cumulative preferred financing shares.
As a result of the implementation of IFRS 16, the free cash flow definition has been updated as explained in Definitions: Performance measures. The comparative figures for the 2018 financial year have been restated as follows:
€ million2018
as reported
Effect ofIFRS 16 adoption
2018 restated
Operating cash flows from continuing operations before changes in working capital and income taxes paid 4,124 1,065 5,189Changes in working capital 484 (33) 451Income taxes paid – net (280) — (280)Purchase of non-current assets (1,780) — (1,780)Divestments of assets / disposal groups held for sale 27 — 27Dividends received from joint ventures 17 — 17Interest received 74 — 74Interest paid (324) 97 (227)Free cash flow – old definition 2,342 1,129 3,471Lease payments received on lease receivables — 86 86Repayment of lease liabilities (177) (1,215) (1,392)Free cash flow – new definition 2,165 — 2,165
Ahold Delhaize’s consolidated cash flows for 2019 and 2018 are as follows:
€ million 20192018
restated
Operating cash flows from continuing operations 5,449 5,360Purchase of non-current assets (cash capital expenditure) (2,218) (1,780)Divestment of assets / disposal groups held for sale 144 27Dividends received from joint ventures 36 17Interest received 56 74Lease payments received on lease receivables 94 86Interest paid (189) (227)Repayments of lease liabilities (1,530) (1,392)Free cash flow 1,843 2,165Proceeds from long-term debt 596 798Repayments of loans (656) (783)Changes in short-term loans 689 (733)Changes in short-term deposits and similar instruments 253 (242)Dividends paid on common shares (1,114) (757)Share buyback (1,002) (2,003)Acquisition / divestments of businesses, net of cash (54) (33)Other cash flows from derivatives (5) (29)Other (15) 30Net cash from operating, investing and financing activities 535 (1,587)
Operating cash flows from continuing operations were higher by €89 million. At constant exchange rates, operating cash flows from continuing operations were lower by €71 million, or (1.3)%. The purchase of non-current assets was higher by €438 million, or €392 million higher at constant exchange rates.
Group financial reviewCash flows
Financial statements Other informationStrategic Report Governance Financial performance AppendixGovernance RemunerationOur business Performance review Ahold Delhaize Annual Report 2019 42
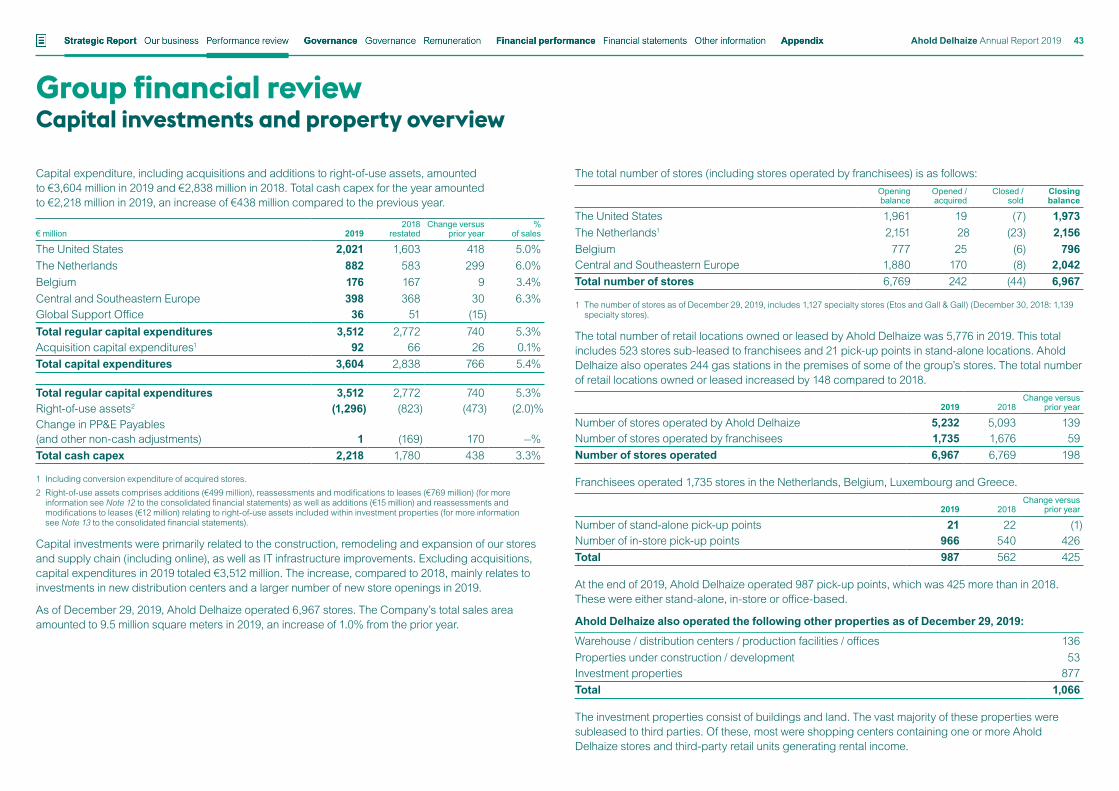
The total number of stores (including stores operated by franchisees) is as follows:Openingbalance
Opened / acquired
Closed / sold
Closingbalance
The United States 1,961 19 (7) 1,973The Netherlands1 2,151 28 (23) 2,156Belgium 777 25 (6) 796Central and Southeastern Europe 1,880 170 (8) 2,042Total number of stores 6,769 242 (44) 6,967
1 The number of stores as of December 29, 2019, includes 1,127 specialty stores (Etos and Gall & Gall) (December 30, 2018: 1,139 specialty stores).
The total number of retail locations owned or leased by Ahold Delhaize was 5,776 in 2019. This total includes 523 stores sub-leased to franchisees and 21 pick-up points in stand-alone locations. Ahold Delhaize also operates 244 gas stations in the premises of some of the group’s stores. The total number of retail locations owned or leased increased by 148 compared to 2018.
2019 2018Change versus
prior year
Number of stores operated by Ahold Delhaize 5,232 5,093 139Number of stores operated by franchisees 1,735 1,676 59Number of stores operated 6,967 6,769 198
Franchisees operated 1,735 stores in the Netherlands, Belgium, Luxembourg and Greece.
2019 2018Change versus
prior year
Number of stand-alone pick-up points 21 22 (1)Number of in-store pick-up points 966 540 426Total 987 562 425
At the end of 2019, Ahold Delhaize operated 987 pick-up points, which was 425 more than in 2018. These were either stand-alone, in-store or office-based.
Ahold Delhaize also operated the following other properties as of December 29, 2019:
Warehouse / distribution centers / production facilities / offices 136Properties under construction / development 53Investment properties 877Total 1,066
The investment properties consist of buildings and land. The vast majority of these properties were subleased to third parties. Of these, most were shopping centers containing one or more Ahold Delhaize stores and third-party retail units generating rental income.
Capital expenditure, including acquisitions and additions to right-of-use assets, amounted to €3,604 million in 2019 and €2,838 million in 2018. Total cash capex for the year amounted to €2,218 million in 2019, an increase of €438 million compared to the previous year.
€ million 20192018
restatedChange versus
prior year%
of sales
The United States 2,021 1,603 418 5.0%The Netherlands 882 583 299 6.0%Belgium 176 167 9 3.4%Central and Southeastern Europe 398 368 30 6.3%Global Support Office 36 51 (15)Total regular capital expenditures 3,512 2,772 740 5.3%Acquisition capital expenditures1 92 66 26 0.1%Total capital expenditures 3,604 2,838 766 5.4%
Total regular capital expenditures 3,512 2,772 740 5.3%Right-of-use assets2 (1,296) (823) (473) (2.0)%Change in PP&E Payables (and other non-cash adjustments) 1 (169) 170 —%Total cash capex 2,218 1,780 438 3.3%
1 Including conversion expenditure of acquired stores.2 Right-of-use assets comprises additions (€499 million), reassessments and modifications to leases (€769 million) (for more
information see Note 12 to the consolidated financial statements) as well as additions (€15 million) and reassessments and modifications to leases (€12 million) relating to right-of-use assets included within investment properties (for more information see Note 13 to the consolidated financial statements).
Capital investments were primarily related to the construction, remodeling and expansion of our stores and supply chain (including online), as well as IT infrastructure improvements. Excluding acquisitions, capital expenditures in 2019 totaled €3,512 million. The increase, compared to 2018, mainly relates to investments in new distribution centers and a larger number of new store openings in 2019.
As of December 29, 2019, Ahold Delhaize operated 6,967 stores. The Company’s total sales area amounted to 9.5 million square meters in 2019, an increase of 1.0% from the prior year.
Group financial reviewCapital investments and property overview
Financial statements Other informationStrategic Report Governance Financial performance AppendixGovernance RemunerationOur business Performance review Ahold Delhaize Annual Report 2019 43
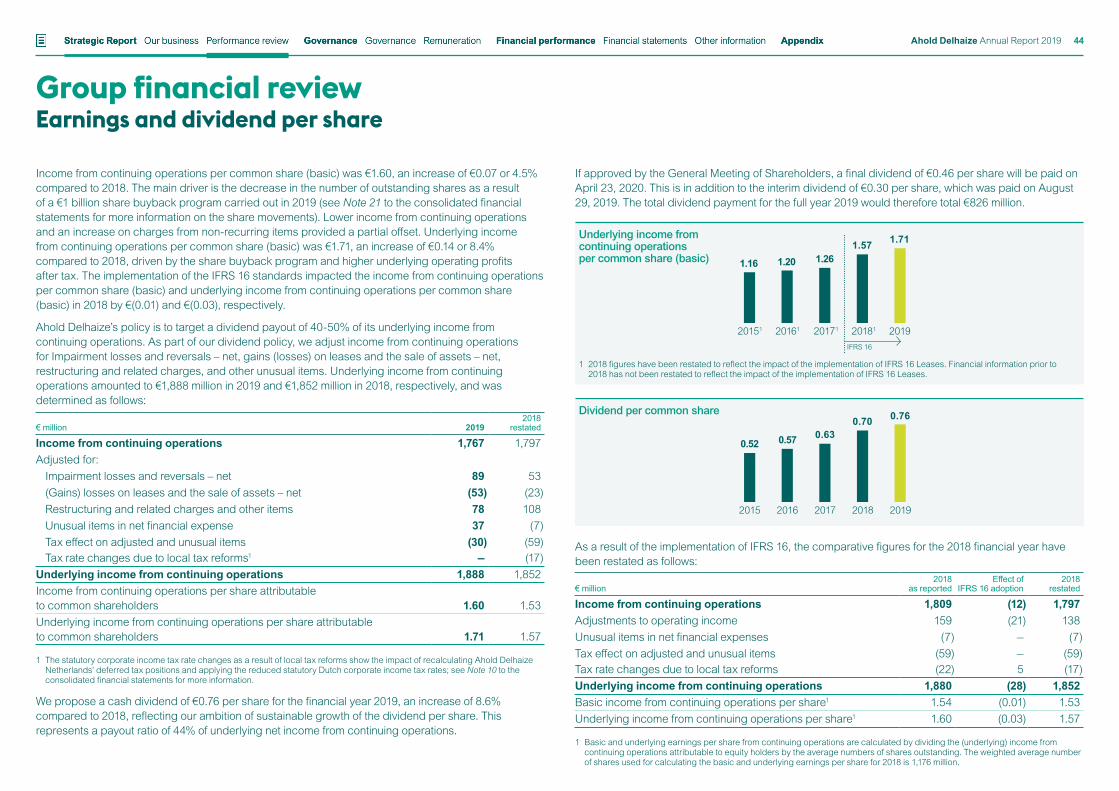
Income from continuing operations per common share (basic) was €1.60, an increase of €0.07 or 4.5% compared to 2018. The main driver is the decrease in the number of outstanding shares as a result of a €1 billion share buyback program carried out in 2019 (see Note 21 to the consolidated financial statements for more information on the share movements). Lower income from continuing operations and an increase on charges from non-recurring items provided a partial offset. Underlying income from continuing operations per common share (basic) was €1.71, an increase of €0.14 or 8.4% compared to 2018, driven by the share buyback program and higher underlying operating profits after tax. The implementation of the IFRS 16 standards impacted the income from continuing operations per common share (basic) and underlying income from continuing operations per common share (basic) in 2018 by €(0.01) and €(0.03), respectively.
Ahold Delhaize’s policy is to target a dividend payout of 40-50% of its underlying income from continuing operations. As part of our dividend policy, we adjust income from continuing operations for Impairment losses and reversals – net, gains (losses) on leases and the sale of assets – net, restructuring and related charges, and other unusual items. Underlying income from continuing operations amounted to €1,888 million in 2019 and €1,852 million in 2018, respectively, and was determined as follows:
€ million 20192018
restated
Income from continuing operations 1,767 1,797Adjusted for:
Impairment losses and reversals – net 89 53(Gains) losses on leases and the sale of assets – net (53) (23)Restructuring and related charges and other items 78 108Unusual items in net financial expense 37 (7)Tax effect on adjusted and unusual items (30) (59)Tax rate changes due to local tax reforms1 — (17)
Underlying income from continuing operations 1,888 1,852Income from continuing operations per share attributable to common shareholders 1.60 1.53Underlying income from continuing operations per share attributable to common shareholders 1.71 1.57
1 The statutory corporate income tax rate changes as a result of local tax reforms show the impact of recalculating Ahold Delhaize Netherlands’ deferred tax positions and applying the reduced statutory Dutch corporate income tax rates; see Note 10 to the consolidated financial statements for more information.
We propose a cash dividend of €0.76 per share for the financial year 2019, an increase of 8.6% compared to 2018, reflecting our ambition of sustainable growth of the dividend per share. This represents a payout ratio of 44% of underlying net income from continuing operations.
If approved by the General Meeting of Shareholders, a final dividend of €0.46 per share will be paid on April 23, 2020. This is in addition to the interim dividend of €0.30 per share, which was paid on August 29, 2019. The total dividend payment for the full year 2019 would therefore total €826 million.
As a result of the implementation of IFRS 16, the comparative figures for the 2018 financial year have been restated as follows:
€ million2018
as reportedEffect of
IFRS 16 adoption2018
restated
Income from continuing operations 1,809 (12) 1,797Adjustments to operating income 159 (21) 138Unusual items in net financial expenses (7) — (7)Tax effect on adjusted and unusual items (59) — (59)Tax rate changes due to local tax reforms (22) 5 (17)Underlying income from continuing operations 1,880 (28) 1,852Basic income from continuing operations per share1 1.54 (0.01) 1.53Underlying income from continuing operations per share1 1.60 (0.03) 1.57
1 Basic and underlying earnings per share from continuing operations are calculated by dividing the (underlying) income from continuing operations attributable to equity holders by the average numbers of shares outstanding. The weighted average number of shares used for calculating the basic and underlying earnings per share for 2018 is 1,176 million.
Group financial reviewEarnings and dividend per share
Dividend per common share
0.57 0.630.70 0.76
2015 2016 2017 2018 2019
0.52
Underlying income from continuing operations per common share (basic) 1.261.201.16
1.57 1.71
20171 2018120151 20161 2019IFRS 16
1 2018 figures have been restated to reflect the impact of the implementation of IFRS 16 Leases. Financial information prior to 2018 has not been restated to reflect the impact of the implementation of IFRS 16 Leases.
Financial statements Other informationStrategic Report Governance Financial performance AppendixGovernance RemunerationOur business Performance review Ahold Delhaize Annual Report 2019 44
Group non-financial review
We have celebrated a diverse and inclusive workforce and helped associates to reach their potential so they can thrive. And we have further reduced our climate impact by continuing to lower our carbon emissions.
In addition to the focus areas outlined above, we have continued our journey to improve performance in: associate development, climate impact, product safety and sustainability, safety at work and local community connection. The following section shows how we performed in 2019 on the targets we set in our Sustainable Retailing 2020 strategy.
Now that 2020 is upon us, we have developed our healthy and sustainable ambition for 2025, which describes how and where we aim to accelerate toward food systems that are healthier for people and the planet. For more information, see Our growth drivers: Healthy and sustainable.
How we manage sustainable retailingThe Executive Committee, supervised and advised by the Supervisory Board (and its Sustainability and Innovation Committee) has accountability for setting strategy and driving performance. Brand leadership is responsible for establishing implementation plans, resourcing their plans and monitoring performance. The Sustainable Retailing function reports directly to the President and CEO at the global level. The Vice President Sustainable Retailing and the Group Support Office Sustainable Retailing team are responsible for advising on Ahold Delhaize’s Sustainable Retailing strategy, reporting global performance internally and externally, engaging external stakeholders, supporting the brands in implementation, monitoring trends, and tracking related issues and risks. A global Sustainable Retailing Steering Committee, made up of Executive Sponsors from the local brands and relevant global functional leaders, reviews and recommends the strategic direction and public targets, and tracks overall performance.
This year’s annual report on fiscal year 2019 contains sustainable retailing data from all Ahold Delhaize brands except bol.com, Etos, Gall & Gall and Peapod, unless otherwise noted.
From an operational scope perspective, the data includes the following parts of the business, unless specifically noted otherwise:
• All stores (company-owned and franchise / affiliated stores)
• Offices
• Company-owned distribution centers, including all transportation from distribution centers to stores, regardless of whether the transportation companies are owned by Ahold Delhaize.
When we did not achieve full alignment in reporting on an indicator for 2019, we have explained it in the footnotes.
Global Reporting InitiativeWe use the GRI Standards: Core option to report on our progress. An overview of how we followed the GRI standards can be found at www.aholddelhaize.com. For more information on the definitions used see Definitions: Performance measures.
Our 2020 Sustainable Retailing ambitionFor the past four years we have been working towards a set of ambitions for 2020, outlined in our Sustainable Retailing strategy, which supports the achievement of our Leading Together strategy. Our Sustainable Retailing 2020 strategy was shaped by our most material topics, the UN Sustainable Development Goals (SDGs) and market knowledge from our great local brands. We also considered trends in our markets and around the world, integrated stakeholder feedback, and referenced other global frameworks (such as the OECD Guidelines for Multinational Enterprises).To reach these ambitions by the end of 2020, we have taken steps that make it easier for our customers to eat more nutritious food, which helps to reduce the prevalence of diseases and increase overall vitality.We have reduced food waste, in line with our aim to responsibly manage the earth’s resources, and worked with food banks to feed the undernourished in our communities.
Financial statements Other informationStrategic Report Governance Financial performance AppendixGovernance RemunerationOur business Performance review Ahold Delhaize Annual Report 2019 45
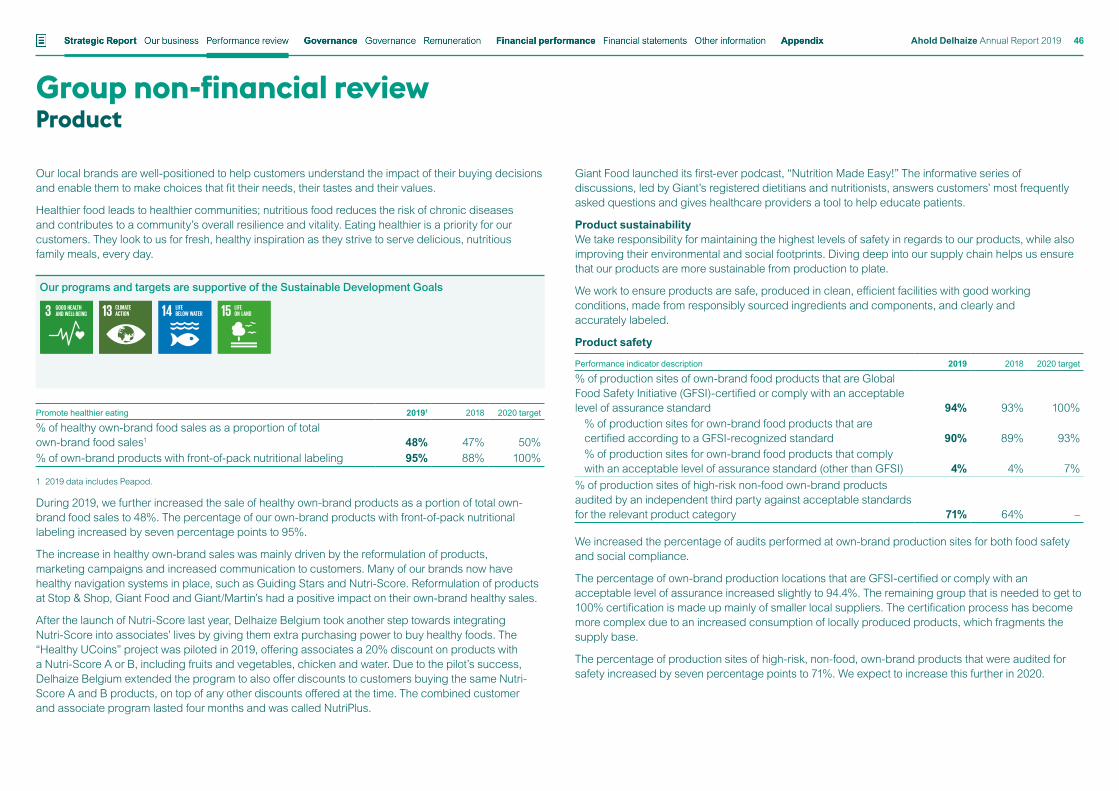
Group non-financial reviewProduct
Our local brands are well-positioned to help customers understand the impact of their buying decisions and enable them to make choices that fit their needs, their tastes and their values.
Healthier food leads to healthier communities; nutritious food reduces the risk of chronic diseases and contributes to a community’s overall resilience and vitality. Eating healthier is a priority for our customers. They look to us for fresh, healthy inspiration as they strive to serve delicious, nutritious family meals, every day.
Promote healthier eating 20191 2018 2020 target
% of healthy own-brand food sales as a proportion of total own-brand food sales1 48% 47% 50%% of own-brand products with front-of-pack nutritional labeling 95% 88% 100%
1 2019 data includes Peapod.
During 2019, we further increased the sale of healthy own-brand products as a portion of total own-brand food sales to 48%. The percentage of our own-brand products with front-of-pack nutritional labeling increased by seven percentage points to 95%.
The increase in healthy own-brand sales was mainly driven by the reformulation of products, marketing campaigns and increased communication to customers. Many of our brands now have healthy navigation systems in place, such as Guiding Stars and Nutri-Score. Reformulation of products at Stop & Shop, Giant Food and Giant/Martin’s had a positive impact on their own-brand healthy sales.
After the launch of Nutri-Score last year, Delhaize Belgium took another step towards integrating Nutri-Score into associates’ lives by giving them extra purchasing power to buy healthy foods. The “Healthy UCoins” project was piloted in 2019, offering associates a 20% discount on products with a Nutri-Score A or B, including fruits and vegetables, chicken and water. Due to the pilot’s success, Delhaize Belgium extended the program to also offer discounts to customers buying the same Nutri-Score A and B products, on top of any other discounts offered at the time. The combined customer and associate program lasted four months and was called NutriPlus.
Giant Food launched its first-ever podcast, “Nutrition Made Easy!” The informative series of discussions, led by Giant’s registered dietitians and nutritionists, answers customers’ most frequently asked questions and gives healthcare providers a tool to help educate patients.
Product sustainabilityWe take responsibility for maintaining the highest levels of safety in regards to our products, while also improving their environmental and social footprints. Diving deep into our supply chain helps us ensure that our products are more sustainable from production to plate.
We work to ensure products are safe, produced in clean, efficient facilities with good working conditions, made from responsibly sourced ingredients and components, and clearly and accurately labeled.
Product safety
Performance indicator description 2019 2018 2020 target
% of production sites of own-brand food products that are Global Food Safety Initiative (GFSI)-certified or comply with an acceptable level of assurance standard 94% 93% 100%
% of production sites for own-brand food products that are certified according to a GFSI-recognized standard 90% 89% 93%% of production sites for own-brand food products that comply with an acceptable level of assurance standard (other than GFSI) 4% 4% 7%
% of production sites of high-risk non-food own-brand products audited by an independent third party against acceptable standards for the relevant product category 71% 64% –
We increased the percentage of audits performed at own-brand production sites for both food safety and social compliance.
The percentage of own-brand production locations that are GFSI-certified or comply with an acceptable level of assurance increased slightly to 94.4%. The remaining group that is needed to get to 100% certification is made up mainly of smaller local suppliers. The certification process has become more complex due to an increased consumption of locally produced products, which fragments the supply base.
The percentage of production sites of high-risk, non-food, own-brand products that were audited for safety increased by seven percentage points to 71%. We expect to increase this further in 2020.
Our programs and targets are supportive of the Sustainable Development Goals
Financial statements Other informationStrategic Report Governance Financial performance AppendixGovernance RemunerationOur business Performance review Ahold Delhaize Annual Report 2019 46
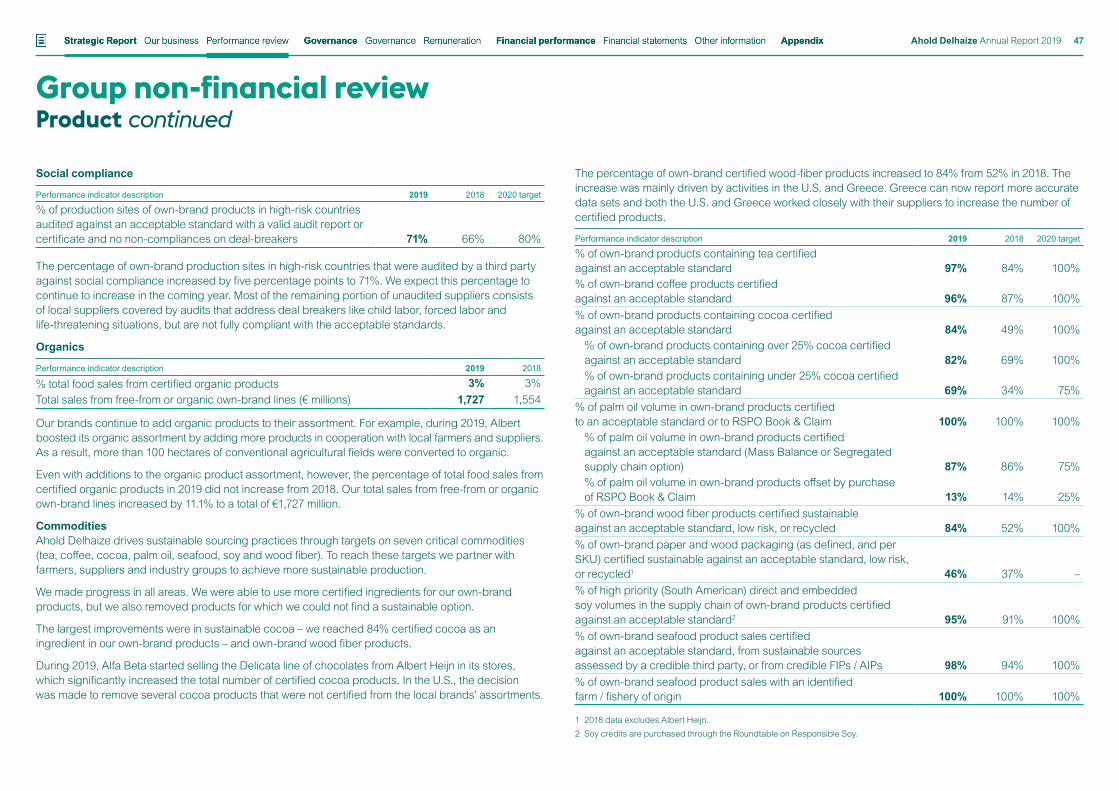
Group non-financial reviewProduct continued
Social compliance
Performance indicator description 2019 2018 2020 target
% of production sites of own-brand products in high-risk countries audited against an acceptable standard with a valid audit report or certificate and no non-compliances on deal-breakers 71% 66% 80%
The percentage of own-brand production sites in high-risk countries that were audited by a third party against social compliance increased by five percentage points to 71%. We expect this percentage to continue to increase in the coming year. Most of the remaining portion of unaudited suppliers consists of local suppliers covered by audits that address deal breakers like child labor, forced labor and life-threatening situations, but are not fully compliant with the acceptable standards.
Organics
Performance indicator description 2019 2018
% total food sales from certified organic products 3% 3%Total sales from free-from or organic own-brand lines (€ millions) 1,727 1,554
Our brands continue to add organic products to their assortment. For example, during 2019, Albert boosted its organic assortment by adding more products in cooperation with local farmers and suppliers. As a result, more than 100 hectares of conventional agricultural fields were converted to organic.
Even with additions to the organic product assortment, however, the percentage of total food sales from certified organic products in 2019 did not increase from 2018. Our total sales from free-from or organic own-brand lines increased by 11.1% to a total of €1,727 million.
CommoditiesAhold Delhaize drives sustainable sourcing practices through targets on seven critical commodities (tea, coffee, cocoa, palm oil, seafood, soy and wood fiber). To reach these targets we partner with farmers, suppliers and industry groups to achieve more sustainable production.
We made progress in all areas. We were able to use more certified ingredients for our own-brand products, but we also removed products for which we could not find a sustainable option.
The largest improvements were in sustainable cocoa – we reached 84% certified cocoa as an ingredient in our own-brand products – and own-brand wood fiber products.
During 2019, Alfa Beta started selling the Delicata line of chocolates from Albert Heijn in its stores, which significantly increased the total number of certified cocoa products. In the U.S., the decision was made to remove several cocoa products that were not certified from the local brands’ assortments.
The percentage of own-brand certified wood-fiber products increased to 84% from 52% in 2018. The increase was mainly driven by activities in the U.S. and Greece. Greece can now report more accurate data sets and both the U.S. and Greece worked closely with their suppliers to increase the number of certified products.
Performance indicator description 2019 2018 2020 target
% of own-brand products containing tea certified against an acceptable standard 97% 84% 100%% of own-brand coffee products certified against an acceptable standard 96% 87% 100%% of own-brand products containing cocoa certified against an acceptable standard 84% 49% 100%
% of own-brand products containing over 25% cocoa certified against an acceptable standard 82% 69% 100%% of own-brand products containing under 25% cocoa certified against an acceptable standard 69% 34% 75%
% of palm oil volume in own-brand products certified to an acceptable standard or to RSPO Book & Claim 100% 100% 100%
% of palm oil volume in own-brand products certified against an acceptable standard (Mass Balance or Segregated supply chain option) 87% 86% 75%% of palm oil volume in own-brand products offset by purchase of RSPO Book & Claim 13% 14% 25%
% of own-brand wood fiber products certified sustainable against an acceptable standard, low risk, or recycled 84% 52% 100%% of own-brand paper and wood packaging (as defined, and per SKU) certified sustainable against an acceptable standard, low risk, or recycled1 46% 37% –% of high priority (South American) direct and embedded soy volumes in the supply chain of own-brand products certified against an acceptable standard2 95% 91% 100%% of own-brand seafood product sales certified against an acceptable standard, from sustainable sources assessed by a credible third party, or from credible FIPs / AIPs 98% 94% 100%% of own-brand seafood product sales with an identified farm / fishery of origin 100% 100% 100%
1 2018 data excludes Albert Heijn.2 Soy credits are purchased through the Roundtable on Responsible Soy.
Financial statements Other informationStrategic Report Governance Financial performance AppendixGovernance RemunerationOur business Performance review Ahold Delhaize Annual Report 2019 47
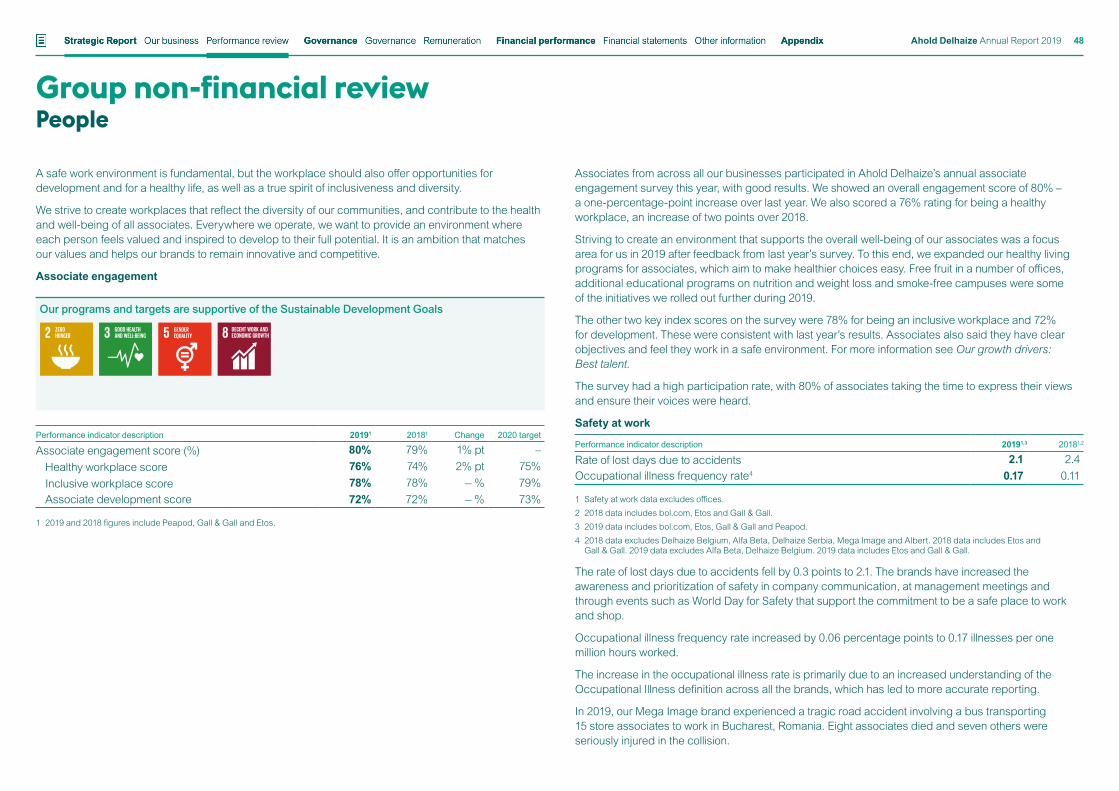
Group non-financial review People
A safe work environment is fundamental, but the workplace should also offer opportunities for development and for a healthy life, as well as a true spirit of inclusiveness and diversity.
We strive to create workplaces that reflect the diversity of our communities, and contribute to the health and well-being of all associates. Everywhere we operate, we want to provide an environment where each person feels valued and inspired to develop to their full potential. It is an ambition that matches our values and helps our brands to remain innovative and competitive.
Associate engagement
Performance indicator description 20191 20181 Change 2020 target
Associate engagement score (%) 80% 79% 1% pt –Healthy workplace score 76% 74% 2% pt 75%Inclusive workplace score 78% 78% — % 79%Associate development score 72% 72% — % 73%
1 2019 and 2018 figures include Peapod, Gall & Gall and Etos.
Associates from across all our businesses participated in Ahold Delhaize’s annual associate engagement survey this year, with good results. We showed an overall engagement score of 80% – a one-percentage-point increase over last year. We also scored a 76% rating for being a healthy workplace, an increase of two points over 2018.
Striving to create an environment that supports the overall well-being of our associates was a focus area for us in 2019 after feedback from last year’s survey. To this end, we expanded our healthy living programs for associates, which aim to make healthier choices easy. Free fruit in a number of offices, additional educational programs on nutrition and weight loss and smoke-free campuses were some of the initiatives we rolled out further during 2019.
The other two key index scores on the survey were 78% for being an inclusive workplace and 72% for development. These were consistent with last year’s results. Associates also said they have clear objectives and feel they work in a safe environment. For more information see Our growth drivers: Best talent.
The survey had a high participation rate, with 80% of associates taking the time to express their views and ensure their voices were heard.
Safety at work
Performance indicator description 20191,3 20181,2
Rate of lost days due to accidents 2.1 2.4Occupational illness frequency rate4 0.17 0.11
1 Safety at work data excludes offices.2 2018 data includes bol.com, Etos and Gall & Gall.3 2019 data includes bol.com, Etos, Gall & Gall and Peapod.4 2018 data excludes Delhaize Belgium, Alfa Beta, Delhaize Serbia, Mega Image and Albert. 2018 data includes Etos and
Gall & Gall. 2019 data excludes Alfa Beta, Delhaize Belgium. 2019 data includes Etos and Gall & Gall.
The rate of lost days due to accidents fell by 0.3 points to 2.1. The brands have increased the awareness and prioritization of safety in company communication, at management meetings and through events such as World Day for Safety that support the commitment to be a safe place to work and shop.
Occupational illness frequency rate increased by 0.06 percentage points to 0.17 illnesses per one million hours worked.
The increase in the occupational illness rate is primarily due to an increased understanding of the Occupational Illness definition across all the brands, which has led to more accurate reporting.
In 2019, our Mega Image brand experienced a tragic road accident involving a bus transporting 15 store associates to work in Bucharest, Romania. Eight associates died and seven others were seriously injured in the collision.
Our programs and targets are supportive of the Sustainable Development Goals
Financial statements Other informationStrategic Report Governance Financial performance AppendixGovernance RemunerationOur business Performance review Ahold Delhaize Annual Report 2019 48
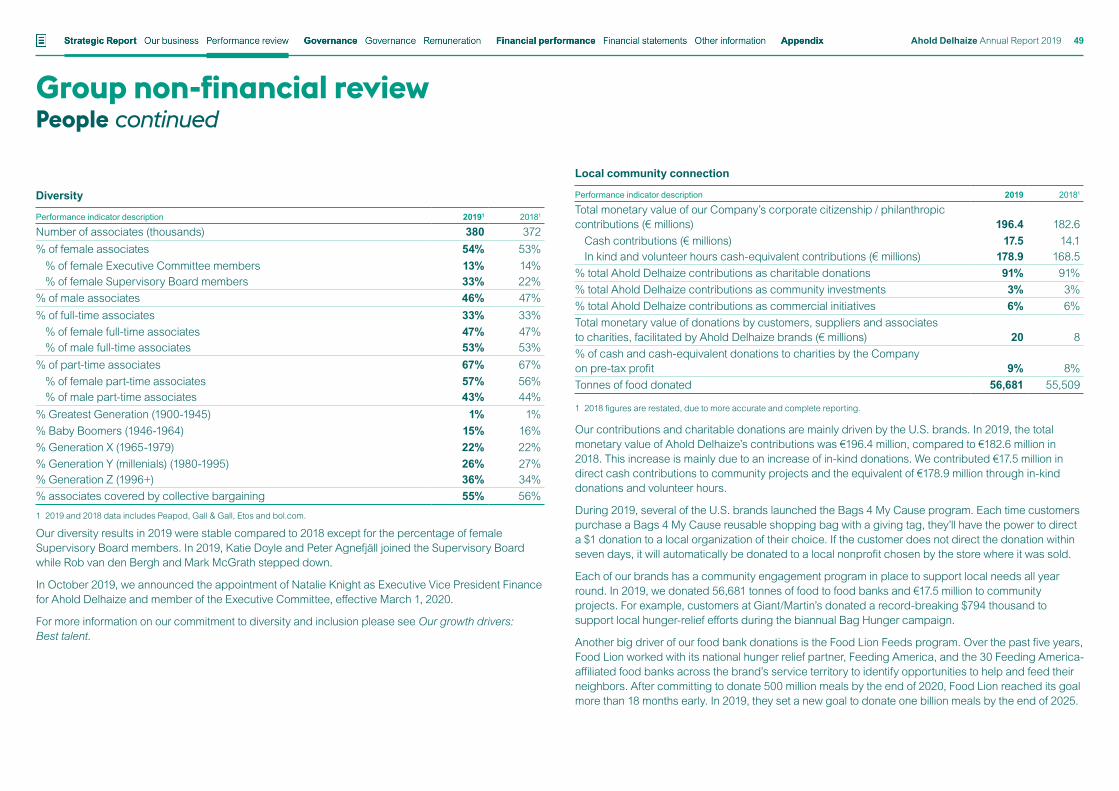
Diversity
Performance indicator description 20191 20181
Number of associates (thousands) 380 372% of female associates 54% 53%
% of female Executive Committee members 13% 14%% of female Supervisory Board members 33% 22%
% of male associates 46% 47%% of full-time associates 33% 33%
% of female full-time associates 47% 47%% of male full-time associates 53% 53%
% of part-time associates 67% 67%% of female part-time associates 57% 56%% of male part-time associates 43% 44%
% Greatest Generation (1900-1945) 1% 1%% Baby Boomers (1946-1964) 15% 16%% Generation X (1965-1979) 22% 22%% Generation Y (millenials) (1980-1995) 26% 27%% Generation Z (1996+) 36% 34%% associates covered by collective bargaining 55% 56%
1 2019 and 2018 data includes Peapod, Gall & Gall, Etos and bol.com.
Our diversity results in 2019 were stable compared to 2018 except for the percentage of female Supervisory Board members. In 2019, Katie Doyle and Peter Agnefjäll joined the Supervisory Board while Rob van den Bergh and Mark McGrath stepped down.
In October 2019, we announced the appointment of Natalie Knight as Executive Vice President Finance for Ahold Delhaize and member of the Executive Committee, effective March 1, 2020.
For more information on our commitment to diversity and inclusion please see Our growth drivers: Best talent.
Local community connection
Performance indicator description 2019 20181
Total monetary value of our Company’s corporate citizenship / philanthropic contributions (€ millions) 196.4 182.6
Cash contributions (€ millions) 17.5 14.1In kind and volunteer hours cash-equivalent contributions (€ millions) 178.9 168.5
% total Ahold Delhaize contributions as charitable donations 91% 91%% total Ahold Delhaize contributions as community investments 3% 3%% total Ahold Delhaize contributions as commercial initiatives 6% 6%Total monetary value of donations by customers, suppliers and associates to charities, facilitated by Ahold Delhaize brands (€ millions) 20 8% of cash and cash-equivalent donations to charities by the Company on pre-tax profit 9% 8%Tonnes of food donated 56,681 55,509
1 2018 figures are restated, due to more accurate and complete reporting.
Our contributions and charitable donations are mainly driven by the U.S. brands. In 2019, the total monetary value of Ahold Delhaize’s contributions was €196.4 million, compared to €182.6 million in 2018. This increase is mainly due to an increase of in-kind donations. We contributed €17.5 million in direct cash contributions to community projects and the equivalent of €178.9 million through in-kind donations and volunteer hours.
During 2019, several of the U.S. brands launched the Bags 4 My Cause program. Each time customers purchase a Bags 4 My Cause reusable shopping bag with a giving tag, they’ll have the power to direct a $1 donation to a local organization of their choice. If the customer does not direct the donation within seven days, it will automatically be donated to a local nonprofit chosen by the store where it was sold.
Each of our brands has a community engagement program in place to support local needs all year round. In 2019, we donated 56,681 tonnes of food to food banks and €17.5 million to community projects. For example, customers at Giant/Martin’s donated a record-breaking $794 thousand to support local hunger-relief efforts during the biannual Bag Hunger campaign.
Another big driver of our food bank donations is the Food Lion Feeds program. Over the past five years, Food Lion worked with its national hunger relief partner, Feeding America, and the 30 Feeding America-affiliated food banks across the brand’s service territory to identify opportunities to help and feed their neighbors. After committing to donate 500 million meals by the end of 2020, Food Lion reached its goal more than 18 months early. In 2019, they set a new goal to donate one billion meals by the end of 2025.
Group non-financial reviewPeople continued
Financial statements Other informationStrategic Report Governance Financial performance AppendixGovernance RemunerationOur business Performance review Ahold Delhaize Annual Report 2019 49
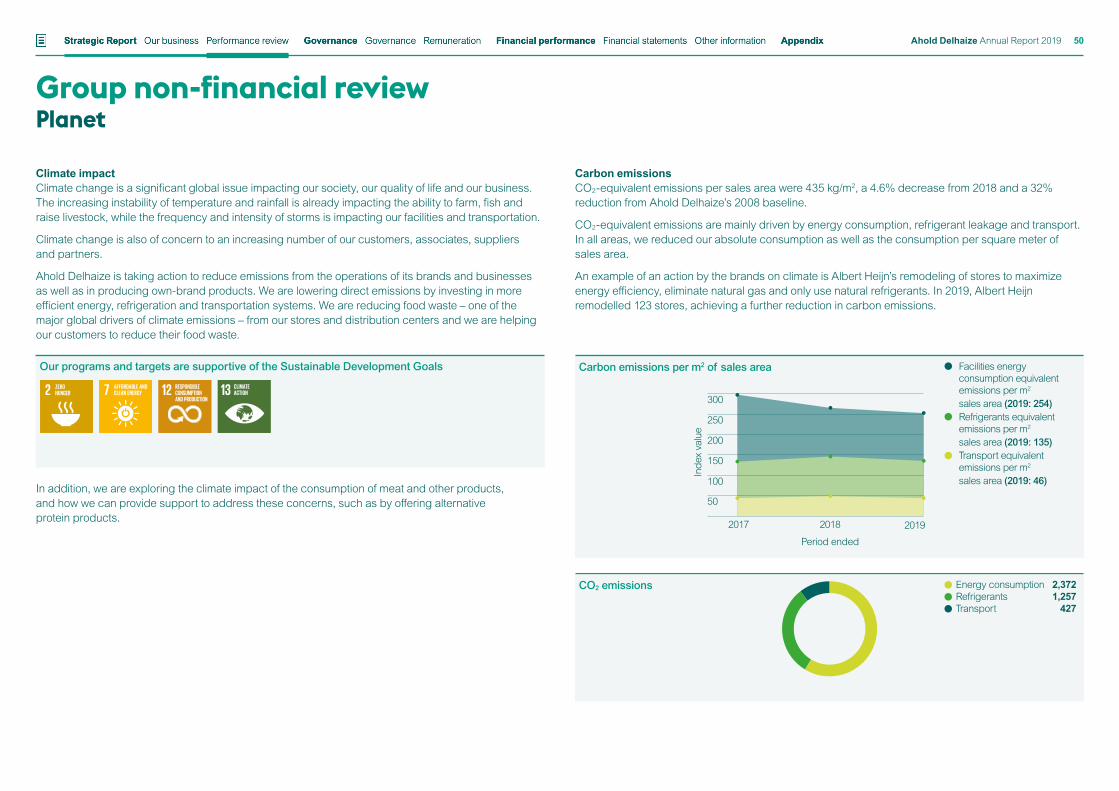
Climate impactClimate change is a significant global issue impacting our society, our quality of life and our business. The increasing instability of temperature and rainfall is already impacting the ability to farm, fish and raise livestock, while the frequency and intensity of storms is impacting our facilities and transportation.
Climate change is also of concern to an increasing number of our customers, associates, suppliers and partners.
Ahold Delhaize is taking action to reduce emissions from the operations of its brands and businesses as well as in producing own-brand products. We are lowering direct emissions by investing in more efficient energy, refrigeration and transportation systems. We are reducing food waste – one of the major global drivers of climate emissions – from our stores and distribution centers and we are helping our customers to reduce their food waste.
In addition, we are exploring the climate impact of the consumption of meat and other products, and how we can provide support to address these concerns, such as by offering alternative protein products.
Carbon emissionsCO2-equivalent emissions per sales area were 435 kg/m2, a 4.6% decrease from 2018 and a 32% reduction from Ahold Delhaize’s 2008 baseline.
CO2-equivalent emissions are mainly driven by energy consumption, refrigerant leakage and transport. In all areas, we reduced our absolute consumption as well as the consumption per square meter of sales area.
An example of an action by the brands on climate is Albert Heijn’s remodeling of stores to maximize energy efficiency, eliminate natural gas and only use natural refrigerants. In 2019, Albert Heijn remodelled 123 stores, achieving a further reduction in carbon emissions.
Group non-financial review Planet
CO2 emissions 2,3721,257
427
Energy consumptionRefrigerantsTransport
Carbon emissions per m2 of sales area
Facilities energy consumption equivalent emissions per m2 sales area (2019: 254)Refrigerants equivalent emissions per m2 sales area (2019: 135)Transport equivalent emissions per m2 sales area (2019: 46)
2017 2018 2019
Period ended
300
250
200
150
100
50
Inde
x va
lue
Our programs and targets are supportive of the Sustainable Development Goals
Financial statements Other informationStrategic Report Governance Financial performance AppendixGovernance RemunerationOur business Performance review Ahold Delhaize Annual Report 2019 50
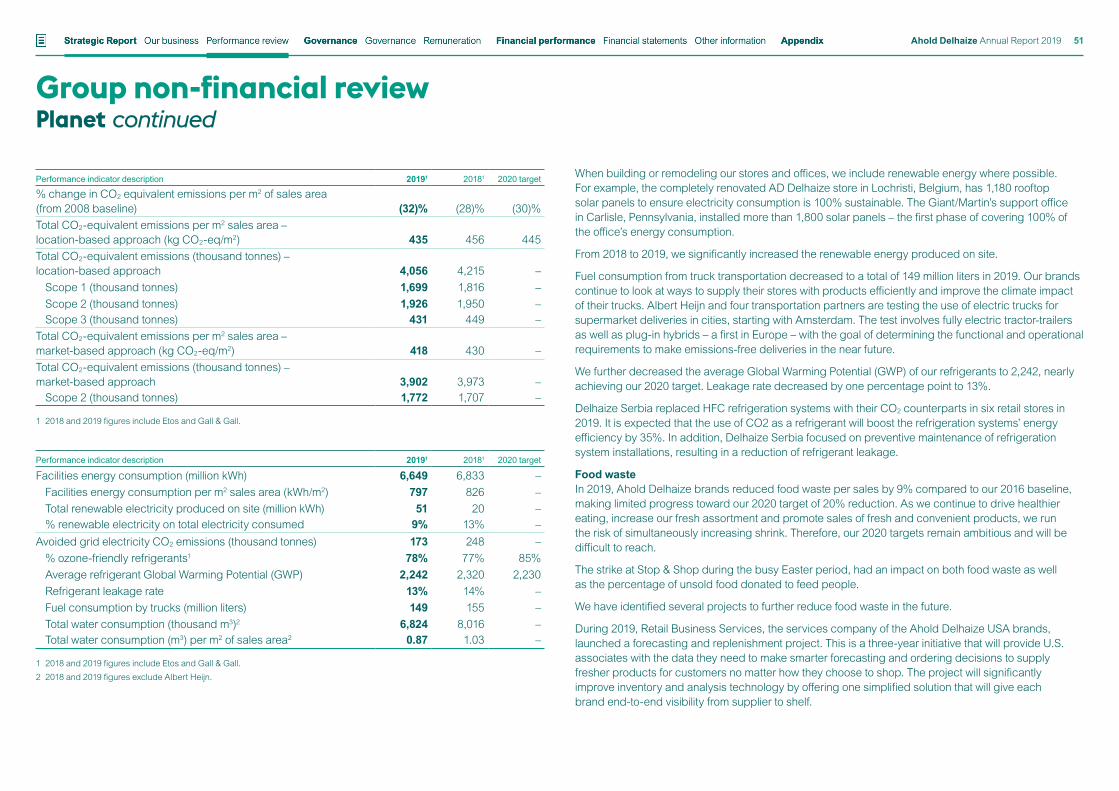
Performance indicator description 20191 20181 2020 target
% change in CO2 equivalent emissions per m2 of sales area (from 2008 baseline) (32)% (28)% (30)%Total CO2-equivalent emissions per m2 sales area – location-based approach (kg CO2-eq/m2) 435 456 445Total CO2-equivalent emissions (thousand tonnes) – location-based approach 4,056 4,215 –
Scope 1 (thousand tonnes) 1,699 1,816 –Scope 2 (thousand tonnes) 1,926 1,950 –Scope 3 (thousand tonnes) 431 449 –
Total CO2-equivalent emissions per m2 sales area – market-based approach (kg CO2-eq/m2) 418 430 –Total CO2-equivalent emissions (thousand tonnes) – market-based approach 3,902 3,973 –
Scope 2 (thousand tonnes) 1,772 1,707 –
1 2018 and 2019 figures include Etos and Gall & Gall.
Performance indicator description 20191 20181 2020 target
Facilities energy consumption (million kWh) 6,649 6,833 –Facilities energy consumption per m2 sales area (kWh/m2) 797 826 –Total renewable electricity produced on site (million kWh) 51 20 –% renewable electricity on total electricity consumed 9% 13% –
Avoided grid electricity CO2 emissions (thousand tonnes) 173 248 –% ozone-friendly refrigerants1 78% 77% 85%Average refrigerant Global Warming Potential (GWP) 2,242 2,320 2,230Refrigerant leakage rate 13% 14% –Fuel consumption by trucks (million liters) 149 155 –Total water consumption (thousand m3)2 6,824 8,016 –Total water consumption (m3) per m2 of sales area2 0.87 1.03 –
1 2018 and 2019 figures include Etos and Gall & Gall.2 2018 and 2019 figures exclude Albert Heijn.
When building or remodeling our stores and offices, we include renewable energy where possible. For example, the completely renovated AD Delhaize store in Lochristi, Belgium, has 1,180 rooftop solar panels to ensure electricity consumption is 100% sustainable. The Giant/Martin’s support office in Carlisle, Pennsylvania, installed more than 1,800 solar panels – the first phase of covering 100% of the office’s energy consumption.
From 2018 to 2019, we significantly increased the renewable energy produced on site.
Fuel consumption from truck transportation decreased to a total of 149 million liters in 2019. Our brands continue to look at ways to supply their stores with products efficiently and improve the climate impact of their trucks. Albert Heijn and four transportation partners are testing the use of electric trucks for supermarket deliveries in cities, starting with Amsterdam. The test involves fully electric tractor-trailers as well as plug-in hybrids – a first in Europe – with the goal of determining the functional and operational requirements to make emissions-free deliveries in the near future.
We further decreased the average Global Warming Potential (GWP) of our refrigerants to 2,242, nearly achieving our 2020 target. Leakage rate decreased by one percentage point to 13%.
Delhaize Serbia replaced HFC refrigeration systems with their CO2 counterparts in six retail stores in 2019. It is expected that the use of CO2 as a refrigerant will boost the refrigeration systems’ energy efficiency by 35%. In addition, Delhaize Serbia focused on preventive maintenance of refrigeration system installations, resulting in a reduction of refrigerant leakage.
Food wasteIn 2019, Ahold Delhaize brands reduced food waste per sales by 9% compared to our 2016 baseline, making limited progress toward our 2020 target of 20% reduction. As we continue to drive healthier eating, increase our fresh assortment and promote sales of fresh and convenient products, we run the risk of simultaneously increasing shrink. Therefore, our 2020 targets remain ambitious and will be difficult to reach.
The strike at Stop & Shop during the busy Easter period, had an impact on both food waste as well as the percentage of unsold food donated to feed people.
We have identified several projects to further reduce food waste in the future.
During 2019, Retail Business Services, the services company of the Ahold Delhaize USA brands, launched a forecasting and replenishment project. This is a three-year initiative that will provide U.S. associates with the data they need to make smarter forecasting and ordering decisions to supply fresher products for customers no matter how they choose to shop. The project will significantly improve inventory and analysis technology by offering one simplified solution that will give each brand end-to-end visibility from supplier to shelf.
Group non-financial reviewPlanet continued
Financial statements Other informationStrategic Report Governance Financial performance AppendixGovernance RemunerationOur business Performance review Ahold Delhaize Annual Report 2019 51
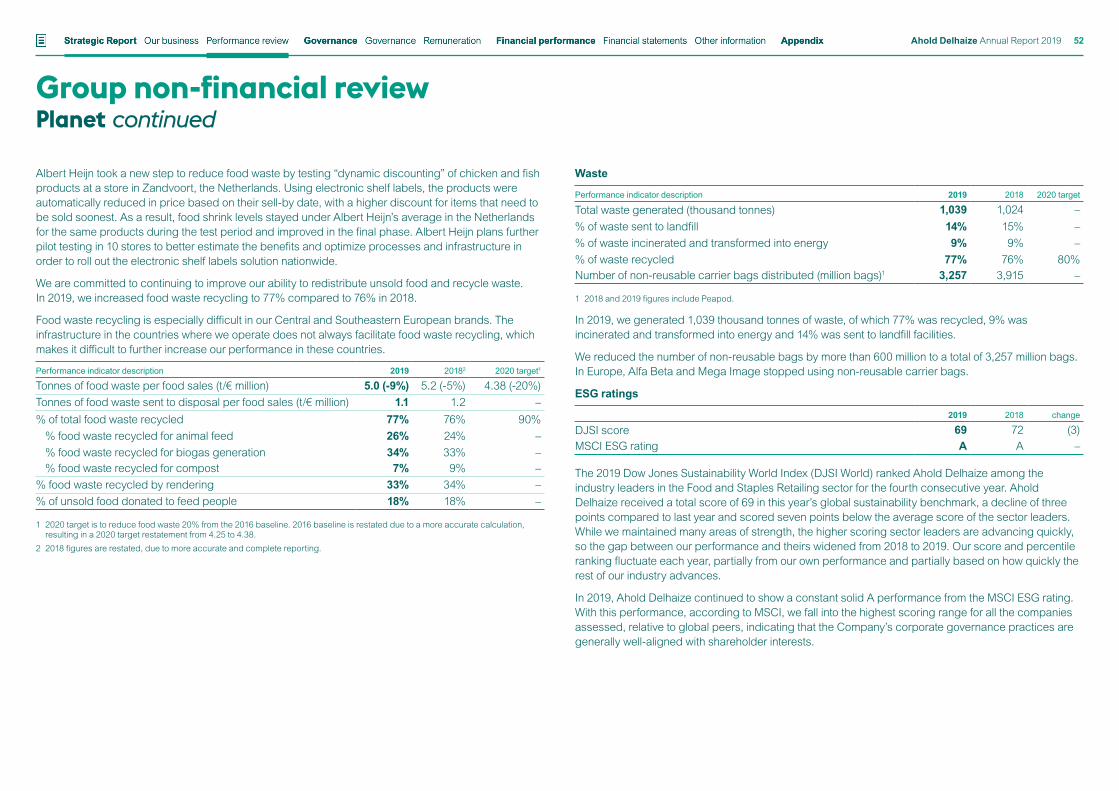
Albert Heijn took a new step to reduce food waste by testing “dynamic discounting” of chicken and fish products at a store in Zandvoort, the Netherlands. Using electronic shelf labels, the products were automatically reduced in price based on their sell-by date, with a higher discount for items that need to be sold soonest. As a result, food shrink levels stayed under Albert Heijn’s average in the Netherlands for the same products during the test period and improved in the final phase. Albert Heijn plans further pilot testing in 10 stores to better estimate the benefits and optimize processes and infrastructure in order to roll out the electronic shelf labels solution nationwide.
We are committed to continuing to improve our ability to redistribute unsold food and recycle waste. In 2019, we increased food waste recycling to 77% compared to 76% in 2018.
Food waste recycling is especially difficult in our Central and Southeastern European brands. The infrastructure in the countries where we operate does not always facilitate food waste recycling, which makes it difficult to further increase our performance in these countries.
Performance indicator description 2019 20182 2020 target1
Tonnes of food waste per food sales (t/€ million) 5.0 (-9%) 5.2 (-5%) 4.38 (-20%)Tonnes of food waste sent to disposal per food sales (t/€ million) 1.1 1.2 –% of total food waste recycled 77% 76% 90%
% food waste recycled for animal feed 26% 24% –% food waste recycled for biogas generation 34% 33% –% food waste recycled for compost 7% 9% –
% food waste recycled by rendering 33% 34% –% of unsold food donated to feed people 18% 18% –
1 2020 target is to reduce food waste 20% from the 2016 baseline. 2016 baseline is restated due to a more accurate calculation, resulting in a 2020 target restatement from 4.25 to 4.38.
2 2018 figures are restated, due to more accurate and complete reporting.
Waste
Performance indicator description 2019 2018 2020 target
Total waste generated (thousand tonnes) 1,039 1,024 –% of waste sent to landfill 14% 15% –% of waste incinerated and transformed into energy 9% 9% –% of waste recycled 77% 76% 80%Number of non-reusable carrier bags distributed (million bags)1 3,257 3,915 –
1 2018 and 2019 figures include Peapod.
In 2019, we generated 1,039 thousand tonnes of waste, of which 77% was recycled, 9% was incinerated and transformed into energy and 14% was sent to landfill facilities.
We reduced the number of non-reusable bags by more than 600 million to a total of 3,257 million bags. In Europe, Alfa Beta and Mega Image stopped using non-reusable carrier bags.
ESG ratings
2019 2018 change
DJSI score 69 72 (3)MSCI ESG rating A A –
The 2019 Dow Jones Sustainability World Index (DJSI World) ranked Ahold Delhaize among the industry leaders in the Food and Staples Retailing sector for the fourth consecutive year. Ahold Delhaize received a total score of 69 in this year’s global sustainability benchmark, a decline of three points compared to last year and scored seven points below the average score of the sector leaders. While we maintained many areas of strength, the higher scoring sector leaders are advancing quickly, so the gap between our performance and theirs widened from 2018 to 2019. Our score and percentile ranking fluctuate each year, partially from our own performance and partially based on how quickly the rest of our industry advances.
In 2019, Ahold Delhaize continued to show a constant solid A performance from the MSCI ESG rating. With this performance, according to MSCI, we fall into the highest scoring range for all the companies assessed, relative to global peers, indicating that the Company’s corporate governance practices are generally well-aligned with shareholder interests.
Group non-financial reviewPlanet continued
Financial statements Other informationStrategic Report Governance Financial performance AppendixGovernance RemunerationOur business Performance review Ahold Delhaize Annual Report 2019 52
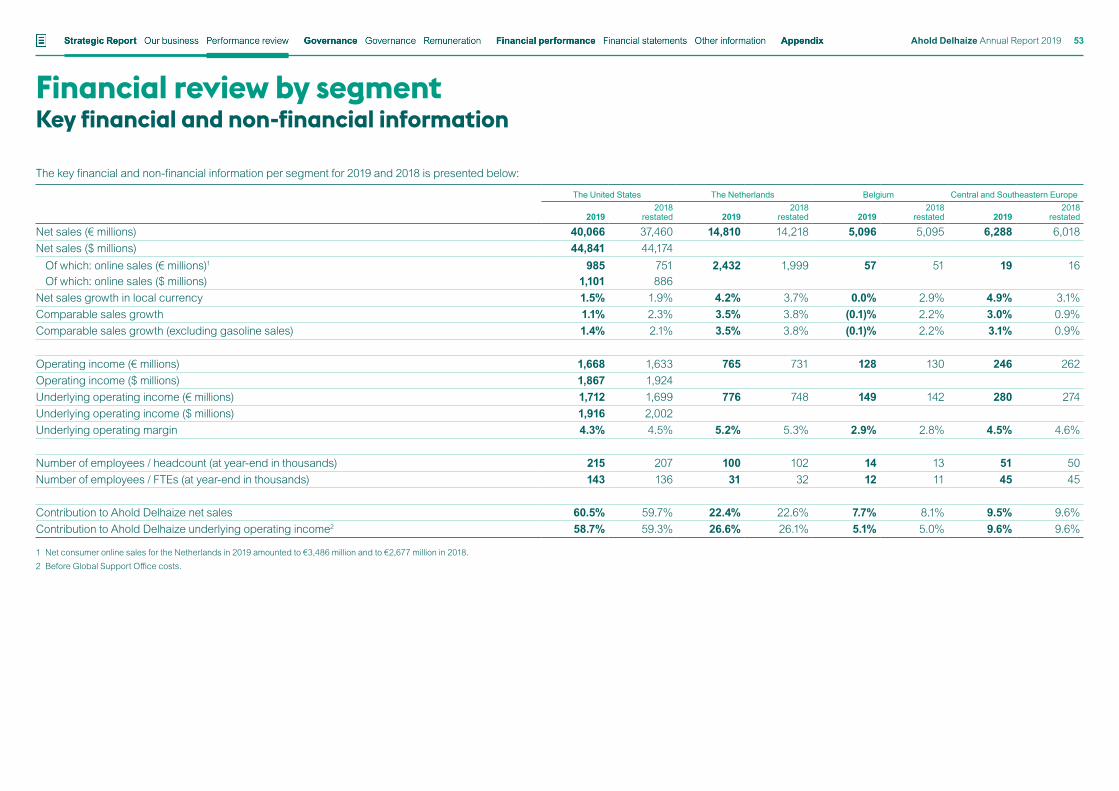
The key financial and non-financial information per segment for 2019 and 2018 is presented below:
The United States The Netherlands Belgium Central and Southeastern Europe
20192018
restated 20192018
restated 20192018
restated 20192018
restated
Net sales (€ millions) 40,066 37,460 14,810 14,218 5,096 5,095 6,288 6,018Net sales ($ millions) 44,841 44,174
Of which: online sales (€ millions)1 985 751 2,432 1,999 57 51 19 16Of which: online sales ($ millions) 1,101 886
Net sales growth in local currency 1.5% 1.9% 4.2% 3.7% 0.0% 2.9% 4.9% 3.1%Comparable sales growth 1.1% 2.3% 3.5% 3.8% (0.1)% 2.2% 3.0% 0.9%Comparable sales growth (excluding gasoline sales) 1.4% 2.1% 3.5% 3.8% (0.1)% 2.2% 3.1% 0.9%
Operating income (€ millions) 1,668 1,633 765 731 128 130 246 262Operating income ($ millions) 1,867 1,924Underlying operating income (€ millions) 1,712 1,699 776 748 149 142 280 274Underlying operating income ($ millions) 1,916 2,002Underlying operating margin 4.3% 4.5% 5.2% 5.3% 2.9% 2.8% 4.5% 4.6%
Number of employees / headcount (at year-end in thousands) 215 207 100 102 14 13 51 50Number of employees / FTEs (at year-end in thousands) 143 136 31 32 12 11 45 45
Contribution to Ahold Delhaize net sales 60.5% 59.7% 22.4% 22.6% 7.7% 8.1% 9.5% 9.6%Contribution to Ahold Delhaize underlying operating income2 58.7% 59.3% 26.6% 26.1% 5.1% 5.0% 9.6% 9.6%
1 Net consumer online sales for the Netherlands in 2019 amounted to €3,486 million and to €2,677 million in 2018.2 Before Global Support Office costs.
Financial review by segmentKey financial and non-financial information
Financial statements Other informationStrategic Report Governance Financial performance AppendixGovernance RemunerationOur business Performance review Ahold Delhaize Annual Report 2019 53
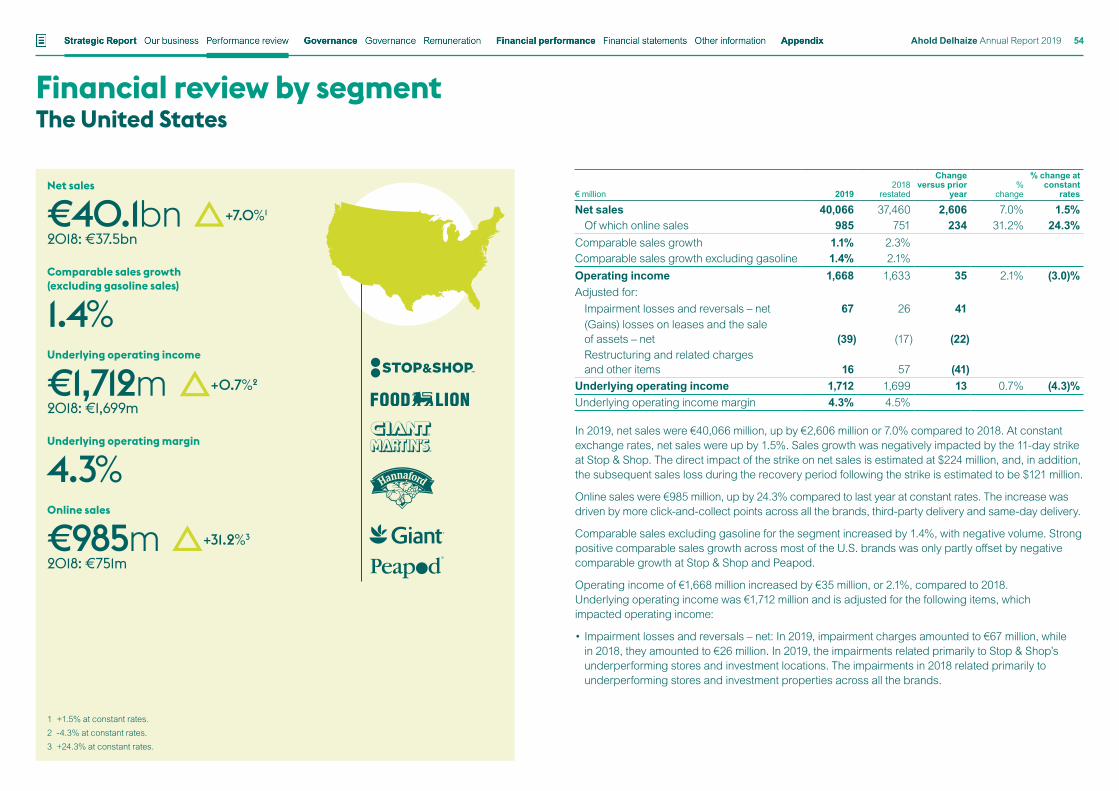
In 2019, net sales were €40,066 million, up by €2,606 million or 7.0% compared to 2018. At constant exchange rates, net sales were up by 1.5%. Sales growth was negatively impacted by the 11-day strike at Stop & Shop. The direct impact of the strike on net sales is estimated at $224 million, and, in addition, the subsequent sales loss during the recovery period following the strike is estimated to be $121 million.
Online sales were €985 million, up by 24.3% compared to last year at constant rates. The increase was driven by more click-and-collect points across all the brands, third-party delivery and same-day delivery.
Comparable sales excluding gasoline for the segment increased by 1.4%, with negative volume. Strong positive comparable sales growth across most of the U.S. brands was only partly offset by negative comparable growth at Stop & Shop and Peapod.
Operating income of €1,668 million increased by €35 million, or 2.1%, compared to 2018. Underlying operating income was €1,712 million and is adjusted for the following items, which impacted operating income:
• Impairment losses and reversals – net: In 2019, impairment charges amounted to €67 million, while in 2018, they amounted to €26 million. In 2019, the impairments related primarily to Stop & Shop’s underperforming stores and investment locations. The impairments in 2018 related primarily to underperforming stores and investment properties across all the brands.
Financial review by segmentThe United States
Net sales
€40.1bn2018: €37.5bn
Comparable sales growth (excluding gasoline sales)
1.4%Underlying operating income
€1,712m2018: €1,699m
Underlying operating margin
4.3%Online sales
€985m2018: €751m
€ million 20192018
restated
Change versus prior
year%
change
% change atconstant
rates
Net sales 40,066 37,460 2,606 7.0% 1.5%Of which online sales 985 751 234 31.2% 24.3%
Comparable sales growth 1.1% 2.3%Comparable sales growth excluding gasoline 1.4% 2.1%Operating income 1,668 1,633 35 2.1% (3.0)%Adjusted for:
Impairment losses and reversals – net 67 26 41(Gains) losses on leases and the sale of assets – net (39) (17) (22)Restructuring and related charges and other items 16 57 (41)
Underlying operating income 1,712 1,699 13 0.7% (4.3)%Underlying operating income margin 4.3% 4.5%
+7.0%1
+0.7%2
1 +1.5% at constant rates.2 -4.3% at constant rates.3 +24.3% at constant rates.
+31.2%3
Financial statements Other informationStrategic Report Governance Financial performance AppendixGovernance RemunerationOur business Performance review Ahold Delhaize Annual Report 2019 54
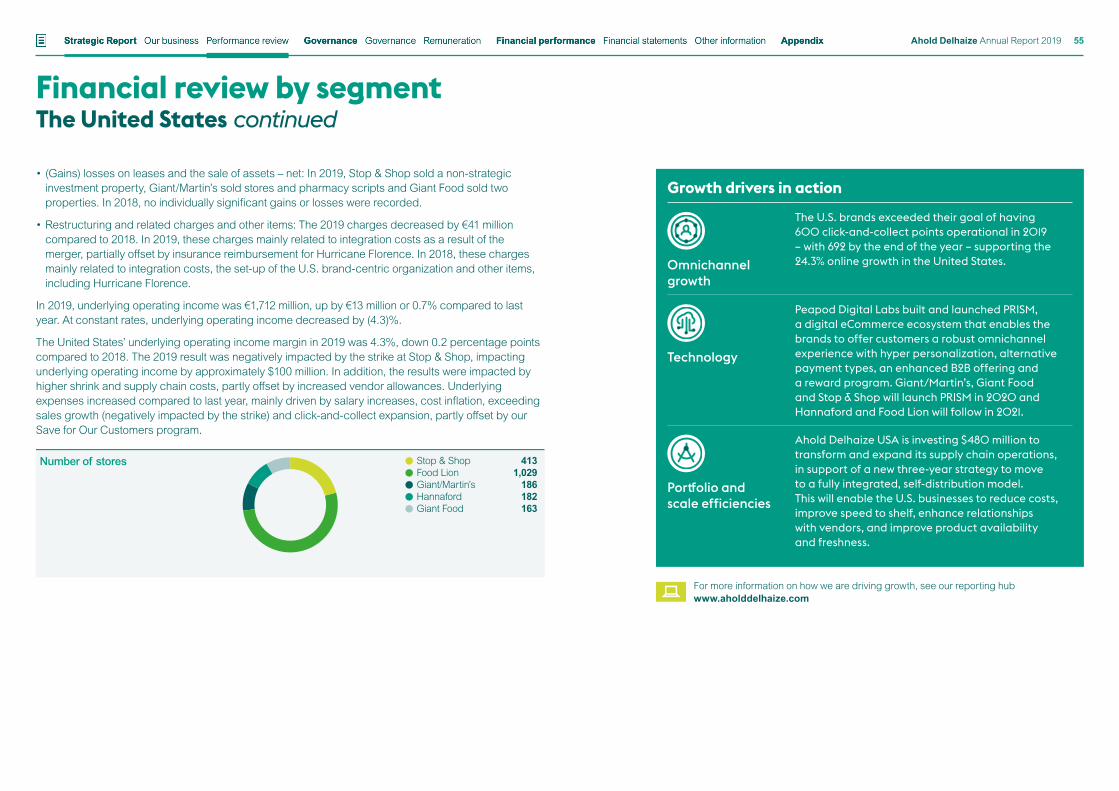
• (Gains) losses on leases and the sale of assets – net: In 2019, Stop & Shop sold a non-strategic investment property, Giant/Martin’s sold stores and pharmacy scripts and Giant Food sold two properties. In 2018, no individually significant gains or losses were recorded.
• Restructuring and related charges and other items: The 2019 charges decreased by €41 million compared to 2018. In 2019, these charges mainly related to integration costs as a result of the merger, partially offset by insurance reimbursement for Hurricane Florence. In 2018, these charges mainly related to integration costs, the set-up of the U.S. brand-centric organization and other items, including Hurricane Florence.
In 2019, underlying operating income was €1,712 million, up by €13 million or 0.7% compared to last year. At constant rates, underlying operating income decreased by (4.3)%.
The United States’ underlying operating income margin in 2019 was 4.3%, down 0.2 percentage points compared to 2018. The 2019 result was negatively impacted by the strike at Stop & Shop, impacting underlying operating income by approximately $100 million. In addition, the results were impacted by higher shrink and supply chain costs, partly offset by increased vendor allowances. Underlying expenses increased compared to last year, mainly driven by salary increases, cost inflation, exceeding sales growth (negatively impacted by the strike) and click-and-collect expansion, partly offset by our Save for Our Customers program.
Financial review by segment The United States continued
For more information on how we are driving growth, see our reporting hubwww.aholddelhaize.com
Number of stores 4131,029
186182163
Stop & ShopFood Lion Giant/Martin’sHannaford Giant Food
Growth drivers in action
Omnichannel growth
The U.S. brands exceeded their goal of having 600 click-and-collect points operational in 2019 – with 692 by the end of the year – supporting the 24.3% online growth in the United States.
Technology
Peapod Digital Labs built and launched PRISM, a digital eCommerce ecosystem that enables the brands to offer customers a robust omnichannel experience with hyper personalization, alternative payment types, an enhanced B2B offering and a reward program. Giant/Martin’s, Giant Food and Stop & Shop will launch PRISM in 2020 and Hannaford and Food Lion will follow in 2021.
Portfolio and scale efficiencies
Ahold Delhaize USA is investing $480 million to transform and expand its supply chain operations, in support of a new three-year strategy to move to a fully integrated, self-distribution model. This will enable the U.S. businesses to reduce costs, improve speed to shelf, enhance relationships with vendors, and improve product availability and freshness.
Financial statements Other informationStrategic Report Governance Financial performance AppendixGovernance RemunerationOur business Performance review Ahold Delhaize Annual Report 2019 55
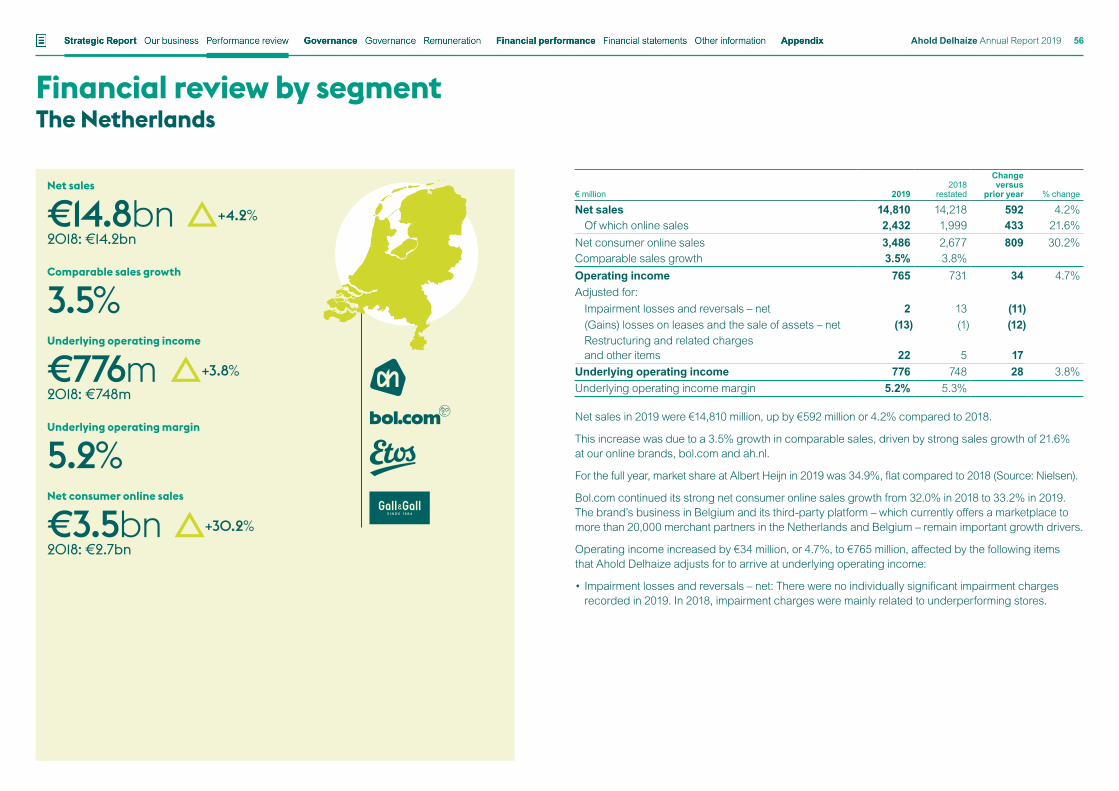
Net sales in 2019 were €14,810 million, up by €592 million or 4.2% compared to 2018.
This increase was due to a 3.5% growth in comparable sales, driven by strong sales growth of 21.6% at our online brands, bol.com and ah.nl.
For the full year, market share at Albert Heijn in 2019 was 34.9%, flat compared to 2018 (Source: Nielsen).
Bol.com continued its strong net consumer online sales growth from 32.0% in 2018 to 33.2% in 2019. The brand’s business in Belgium and its third-party platform – which currently offers a marketplace to more than 20,000 merchant partners in the Netherlands and Belgium – remain important growth drivers.
Operating income increased by €34 million, or 4.7%, to €765 million, affected by the following items that Ahold Delhaize adjusts for to arrive at underlying operating income:
• Impairment losses and reversals – net: There were no individually significant impairment charges recorded in 2019. In 2018, impairment charges were mainly related to underperforming stores.
Financial review by segmentThe Netherlands
Net sales
€14.8bn2018: €14.2bn
Comparable sales growth
3.5%Underlying operating income
€776m2018: €748m
Underlying operating margin
5.2%Net consumer online sales
€3.5bn2018: €2.7bn
€ million 20192018
restated
Change versus
prior year % change
Net sales 14,810 14,218 592 4.2%Of which online sales 2,432 1,999 433 21.6%
Net consumer online sales 3,486 2,677 809 30.2%Comparable sales growth 3.5% 3.8%Operating income 765 731 34 4.7%Adjusted for:
Impairment losses and reversals – net 2 13 (11)(Gains) losses on leases and the sale of assets – net (13) (1) (12)Restructuring and related charges and other items 22 5 17
Underlying operating income 776 748 28 3.8%Underlying operating income margin 5.2% 5.3%
+4.2%
+3.8%
+30.2%
Financial statements Other informationStrategic Report Governance Financial performance AppendixGovernance RemunerationOur business Performance review Ahold Delhaize Annual Report 2019 56
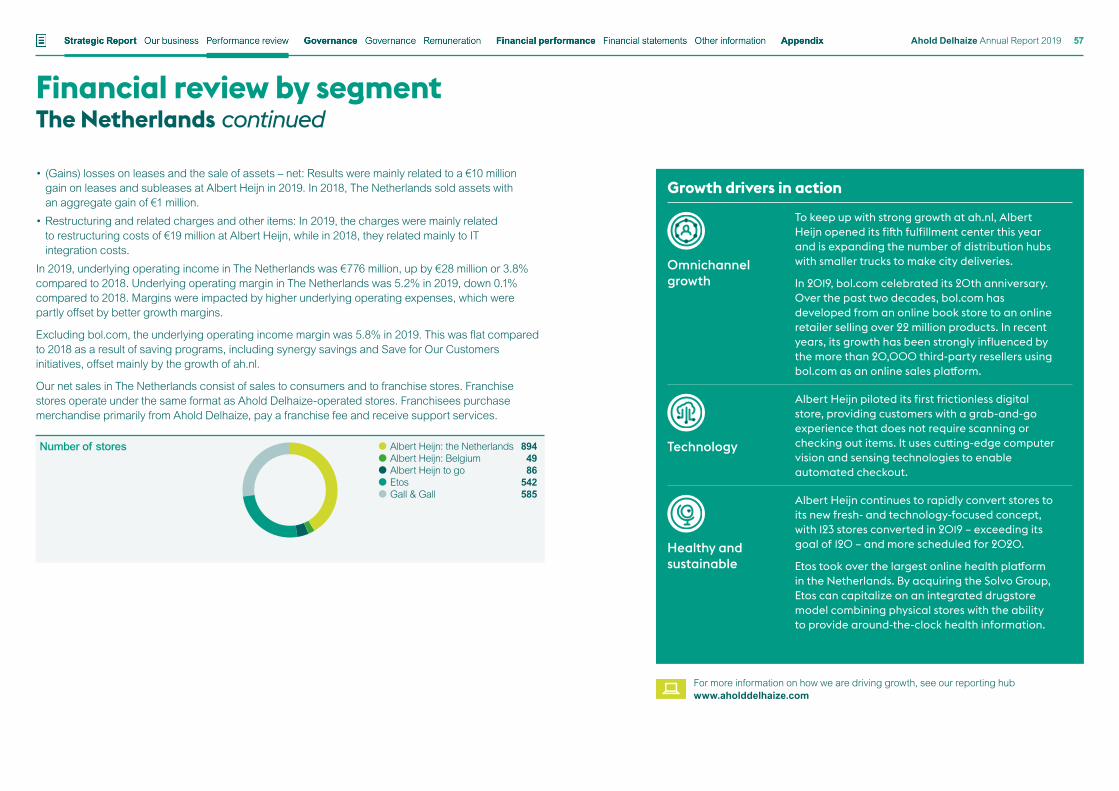
• (Gains) losses on leases and the sale of assets – net: Results were mainly related to a €10 million gain on leases and subleases at Albert Heijn in 2019. In 2018, The Netherlands sold assets with an aggregate gain of €1 million.
• Restructuring and related charges and other items: In 2019, the charges were mainly related to restructuring costs of €19 million at Albert Heijn, while in 2018, they related mainly to IT integration costs.
In 2019, underlying operating income in The Netherlands was €776 million, up by €28 million or 3.8% compared to 2018. Underlying operating margin in The Netherlands was 5.2% in 2019, down 0.1% compared to 2018. Margins were impacted by higher underlying operating expenses, which were partly offset by better growth margins.
Excluding bol.com, the underlying operating income margin was 5.8% in 2019. This was flat compared to 2018 as a result of saving programs, including synergy savings and Save for Our Customers initiatives, offset mainly by the growth of ah.nl.
Our net sales in The Netherlands consist of sales to consumers and to franchise stores. Franchise stores operate under the same format as Ahold Delhaize-operated stores. Franchisees purchase merchandise primarily from Ahold Delhaize, pay a franchise fee and receive support services.
Financial review by segment The Netherlands continued
For more information on how we are driving growth, see our reporting hubwww.aholddelhaize.com
Number of stores 8944986
542585
Albert Heijn: the NetherlandsAlbert Heijn: BelgiumAlbert Heijn to go EtosGall & Gall
Growth drivers in action
Omnichannel growth
To keep up with strong growth at ah.nl, Albert Heijn opened its fifth fulfillment center this year and is expanding the number of distribution hubs with smaller trucks to make city deliveries.
In 2019, bol.com celebrated its 20th anniversary. Over the past two decades, bol.com has developed from an online book store to an online retailer selling over 22 million products. In recent years, its growth has been strongly influenced by the more than 20,000 third-party resellers using bol.com as an online sales platform.
Technology
Albert Heijn piloted its first frictionless digital store, providing customers with a grab-and-go experience that does not require scanning or checking out items. It uses cutting-edge computer vision and sensing technologies to enable automated checkout.
Healthy and sustainable
Albert Heijn continues to rapidly convert stores to its new fresh- and technology-focused concept, with 123 stores converted in 2019 – exceeding its goal of 120 – and more scheduled for 2020.
Etos took over the largest online health platform in the Netherlands. By acquiring the Solvo Group, Etos can capitalize on an integrated drugstore model combining physical stores with the ability to provide around-the-clock health information.
Financial statements Other informationStrategic Report Governance Financial performance AppendixGovernance RemunerationOur business Performance review Ahold Delhaize Annual Report 2019 57
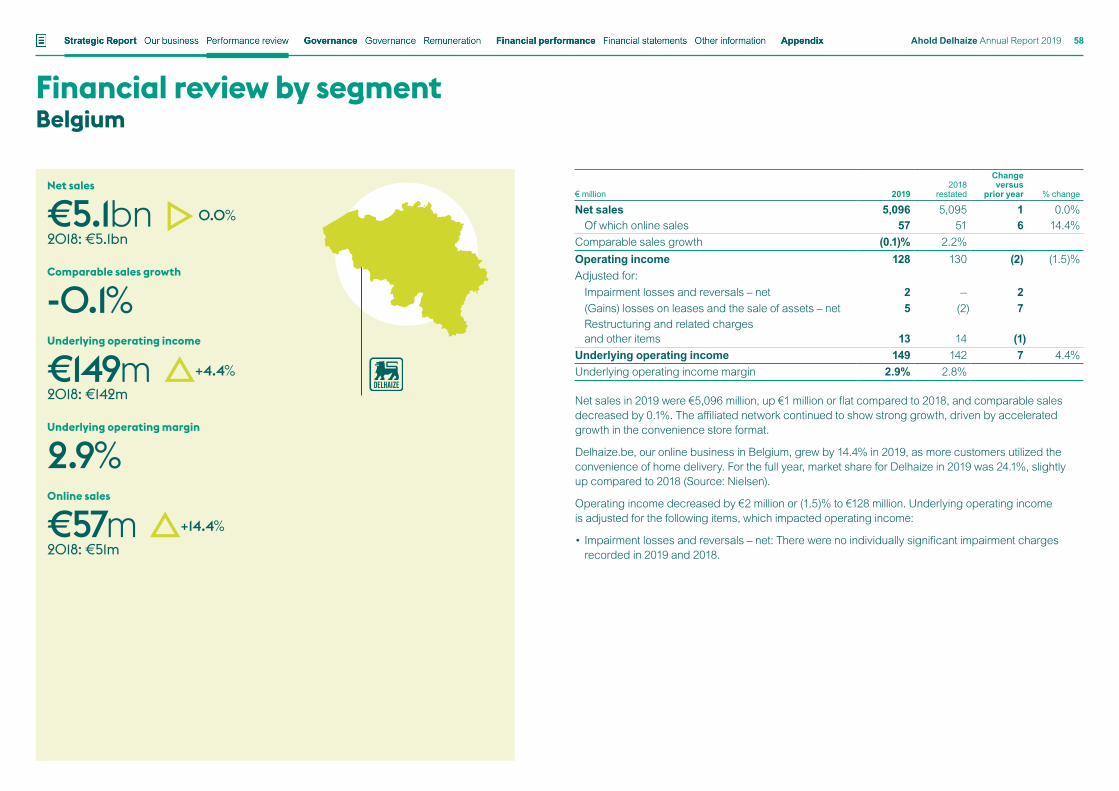
Net sales in 2019 were €5,096 million, up €1 million or flat compared to 2018, and comparable sales decreased by 0.1%. The affiliated network continued to show strong growth, driven by accelerated growth in the convenience store format.
Delhaize.be, our online business in Belgium, grew by 14.4% in 2019, as more customers utilized the convenience of home delivery. For the full year, market share for Delhaize in 2019 was 24.1%, slightly up compared to 2018 (Source: Nielsen).
Operating income decreased by €2 million or (1.5)% to €128 million. Underlying operating income is adjusted for the following items, which impacted operating income:
• Impairment losses and reversals – net: There were no individually significant impairment charges recorded in 2019 and 2018.
Financial review by segmentBelgium
Net sales
€5.1bn2018: €5.1bn
Comparable sales growth
-0.1%Underlying operating income
€149m2018: €142m
Underlying operating margin
2.9%Online sales
€57m2018: €51m
€ million 20192018
restated
Change versus
prior year % change
Net sales 5,096 5,095 1 0.0%Of which online sales 57 51 6 14.4%
Comparable sales growth (0.1)% 2.2%Operating income 128 130 (2) (1.5)%Adjusted for:
Impairment losses and reversals – net 2 — 2(Gains) losses on leases and the sale of assets – net 5 (2) 7Restructuring and related charges and other items 13 14 (1)
Underlying operating income 149 142 7 4.4%Underlying operating income margin 2.9% 2.8%
0.0%
+4.4%
+14.4%
Financial statements Other informationStrategic Report Governance Financial performance AppendixGovernance RemunerationOur business Performance review Ahold Delhaize Annual Report 2019 58
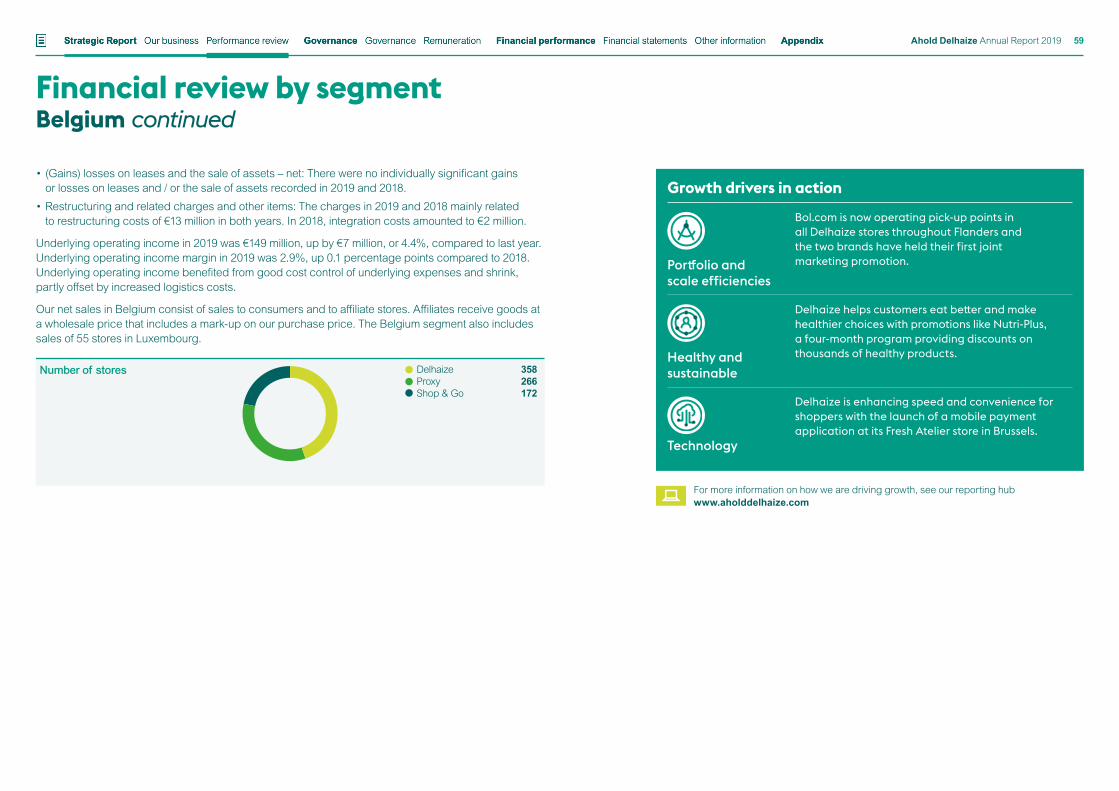
• (Gains) losses on leases and the sale of assets – net: There were no individually significant gains or losses on leases and / or the sale of assets recorded in 2019 and 2018.
• Restructuring and related charges and other items: The charges in 2019 and 2018 mainly related to restructuring costs of €13 million in both years. In 2018, integration costs amounted to €2 million.
Underlying operating income in 2019 was €149 million, up by €7 million, or 4.4%, compared to last year. Underlying operating income margin in 2019 was 2.9%, up 0.1 percentage points compared to 2018. Underlying operating income benefited from good cost control of underlying expenses and shrink, partly offset by increased logistics costs.
Our net sales in Belgium consist of sales to consumers and to affiliate stores. Affiliates receive goods at a wholesale price that includes a mark-up on our purchase price. The Belgium segment also includes sales of 55 stores in Luxembourg.
Financial review by segmentBelgium continued
For more information on how we are driving growth, see our reporting hubwww.aholddelhaize.com
Number of stores 358266172
DelhaizeProxyShop & Go
Growth drivers in action
Portfolio and scale efficiencies
Bol.com is now operating pick-up points in all Delhaize stores throughout Flanders and the two brands have held their first joint marketing promotion.
Healthy and sustainable
Delhaize helps customers eat better and make healthier choices with promotions like Nutri-Plus, a four-month program providing discounts on thousands of healthy products.
Technology
Delhaize is enhancing speed and convenience for shoppers with the launch of a mobile payment application at its Fresh Atelier store in Brussels.
Financial statements Other informationStrategic Report Governance Financial performance AppendixGovernance RemunerationOur business Performance review Ahold Delhaize Annual Report 2019 59
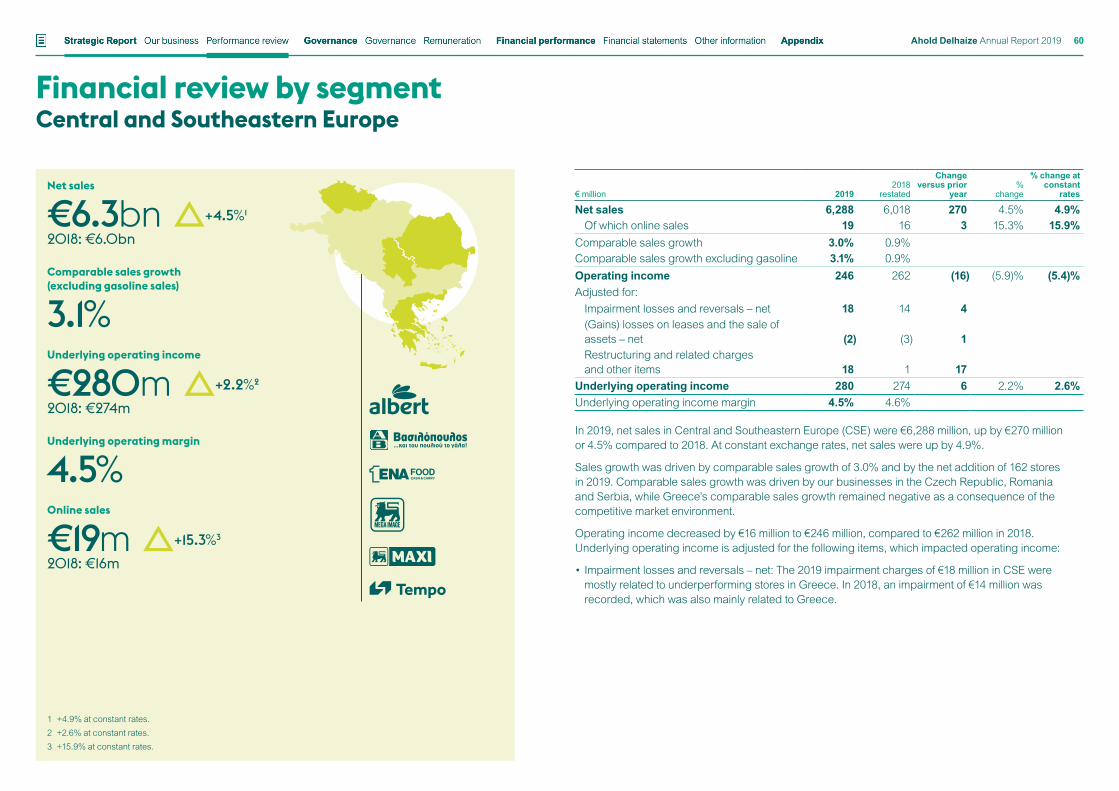
In 2019, net sales in Central and Southeastern Europe (CSE) were €6,288 million, up by €270 million or 4.5% compared to 2018. At constant exchange rates, net sales were up by 4.9%.
Sales growth was driven by comparable sales growth of 3.0% and by the net addition of 162 stores in 2019. Comparable sales growth was driven by our businesses in the Czech Republic, Romania and Serbia, while Greece’s comparable sales growth remained negative as a consequence of the competitive market environment.
Operating income decreased by €16 million to €246 million, compared to €262 million in 2018. Underlying operating income is adjusted for the following items, which impacted operating income:
• Impairment losses and reversals – net: The 2019 impairment charges of €18 million in CSE were mostly related to underperforming stores in Greece. In 2018, an impairment of €14 million was recorded, which was also mainly related to Greece.
Financial review by segmentCentral and Southeastern Europe
Net sales
€6.3bn2018: €6.0bn
Comparable sales growth (excluding gasoline sales)
3.1%Underlying operating income
€280m2018: €274m
Underlying operating margin
4.5%Online sales
€19m2018: €16m
€ million 20192018
restated
Change versus prior
year%
change
% change atconstant
rates
Net sales 6,288 6,018 270 4.5% 4.9%Of which online sales 19 16 3 15.3% 15.9%
Comparable sales growth 3.0% 0.9%Comparable sales growth excluding gasoline 3.1% 0.9%Operating income 246 262 (16) (5.9)% (5.4)%Adjusted for:
Impairment losses and reversals – net 18 14 4(Gains) losses on leases and the sale of assets – net (2) (3) 1Restructuring and related charges and other items 18 1 17
Underlying operating income 280 274 6 2.2% 2.6%Underlying operating income margin 4.5% 4.6%
1 +4.9% at constant rates.2 +2.6% at constant rates.3 +15.9% at constant rates.
+4.5%1
+2.2%2
+15.3%3
Financial statements Other informationStrategic Report Governance Financial performance AppendixGovernance RemunerationOur business Performance review Ahold Delhaize Annual Report 2019 60
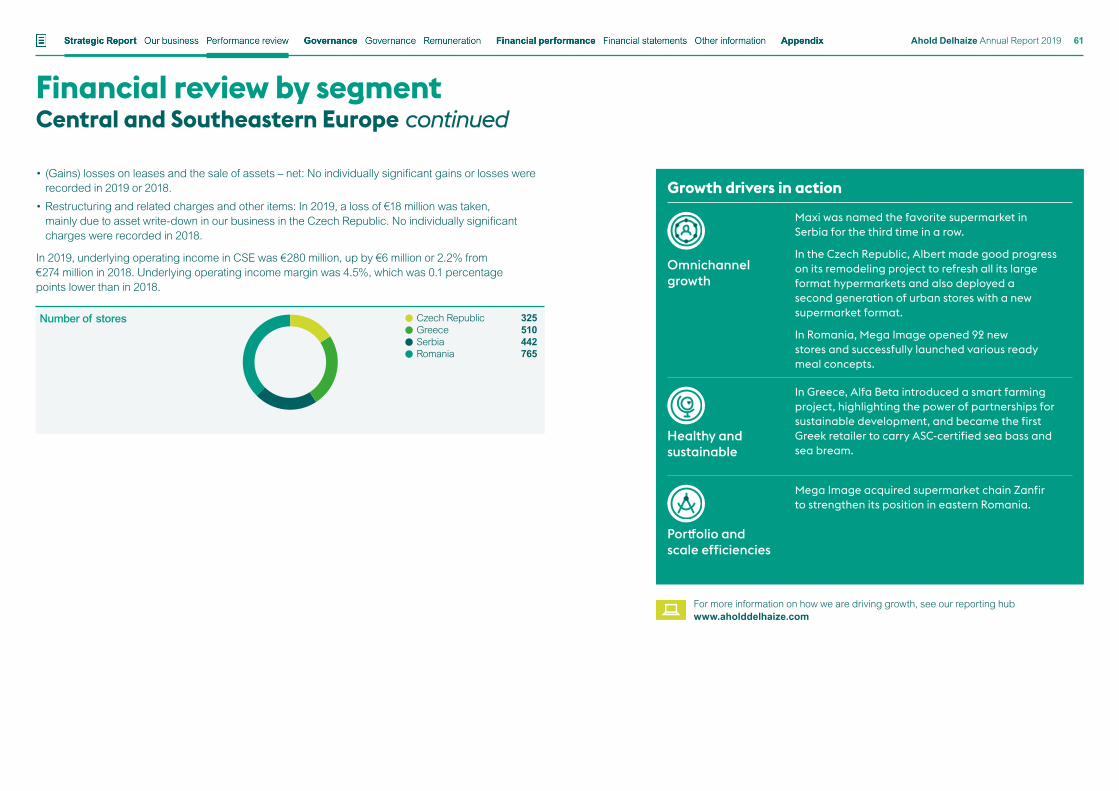
Financial review by segment Central and Southeastern Europe continued
For more information on how we are driving growth, see our reporting hubwww.aholddelhaize.com
• (Gains) losses on leases and the sale of assets – net: No individually significant gains or losses were recorded in 2019 or 2018.
• Restructuring and related charges and other items: In 2019, a loss of €18 million was taken, mainly due to asset write-down in our business in the Czech Republic. No individually significant charges were recorded in 2018.
In 2019, underlying operating income in CSE was €280 million, up by €6 million or 2.2% from €274 million in 2018. Underlying operating income margin was 4.5%, which was 0.1 percentage points lower than in 2018.
Number of stores 325510442765
Czech RepublicGreece SerbiaRomania
Growth drivers in action
Omnichannel growth
Maxi was named the favorite supermarket in Serbia for the third time in a row.
In the Czech Republic, Albert made good progress on its remodeling project to refresh all its large format hypermarkets and also deployed a second generation of urban stores with a new supermarket format.
In Romania, Mega Image opened 92 new stores and successfully launched various ready meal concepts.
Healthy and sustainable
In Greece, Alfa Beta introduced a smart farming project, highlighting the power of partnerships for sustainable development, and became the first Greek retailer to carry ASC-certified sea bass and sea bream.
Portfolio and scale efficiencies
Mega Image acquired supermarket chain Zanfir to strengthen its position in eastern Romania.
Financial statements Other informationStrategic Report Governance Financial performance AppendixGovernance RemunerationOur business Performance review Ahold Delhaize Annual Report 2019 61
€ million 20192018
restated
Changes versus
prior year%
change
Global Support Office costs (146) (133) (13) (9.0)%of which restructuring and related charges and other items (6) (31) 25 80.9%
Underlying Global Support Office costs (140) (102) (38) (35.9)%of which related to self-insurance activities 4 50 (46) (92.8)%
Underlying Global Support Office costs excluding self-insurance (143) (153) 10 6.2%
Global Support Office costs in 2019 were €146 million, up €13 million compared to last year. Global Support Office costs were adjusted for restructuring and related charges and other items that amounted to €6 million in 2019, or €25 million lower than last year. This is mainly caused by fewer integration costs in 2019, as the merger was fully completed in Q2 2019.
Underlying Global Support Office costs were €140 million, €38 million higher than 2018. The €46 million decrease in self-insurance activities was caused by movements in the discount rates offset in part by a favorable impact from the change in the composition of expected losses increasing the overall duration of the loss reserves versus last year. Underlying Global Support Office costs excluding self-insurance were €143 million, or €10 million lower than last year.
Financial review by segmentGlobal Support Office
For more information on how we are driving growth, see our reporting hubwww.aholddelhaize.com
Growth drivers in action
Technology
In October, the AI for Retail (AIR) Lab in Delft, the Netherlands, held its official launch. The facility is an expansion of Ahold Delhaize’s AIR Lab in Amsterdam, created in partnership with Delft University. The focus of the lab is to research the future of robotics and develop state-of-the-art innovations in the retail industry.
Portfolio and scale efficiencies
After successfully rolling out the Office 365 platform company-wide last year, in 2019, teams across Ahold Delhaize focused on using its tools to transform the way we work, improve productivity and collaborate better.
Best talent
Our senior leaders across the Company, at Vice President level and above, were invited to attend “The Digital Mindset,” a course that builds awareness around data analytics, cybersecurity and digital innovation.
Financial statements Other informationStrategic Report Governance Financial performance AppendixGovernance RemunerationOur business Performance review Ahold Delhaize Annual Report 2019 62
While group margin should benefit from lapping the effect of the U.S. strike in 2019, this is offset by the margin dilution related to transition expenses from the U.S. supply chain initiative announced in December, as well as an increased non-cash service charge for the Netherlands employee pension plan, resulting from lower discount rates in the Netherlands. Excluding the impact of the U.S. supply chain transition expenses and non-cash service charge for the Netherlands employee pension plan, underlying operating margin would be up from the prior year.
Additionally, we expect underlying earnings per share growth for the year to be in the mid-single-digit range.
We expect group free cash flow of around €1.5 billion for the full year 2020, affected by the cash impact of €270 million in capital expenditure related to the U.S. supply chain transformation. We expect to spend €2.5 billion in capital expenditures in 2020, impacted by the aforementioned investment in the U.S. supply chain transformation. The free cash flow and capital expenditure guidance expressly excludes M&A activity. Also, as announced in December 2019, a new €1 billion share buyback program is in place for 2020.
Outlook
We anticipate that underlying operating margin for the group in 2020 will be broadly in line with 2019, and note that the 53rd week does not significantly impact underlying operating margin.
Financial statements Other informationStrategic Report Governance Financial performance AppendixGovernance RemunerationOur business Performance review Ahold Delhaize Annual Report 2019 63
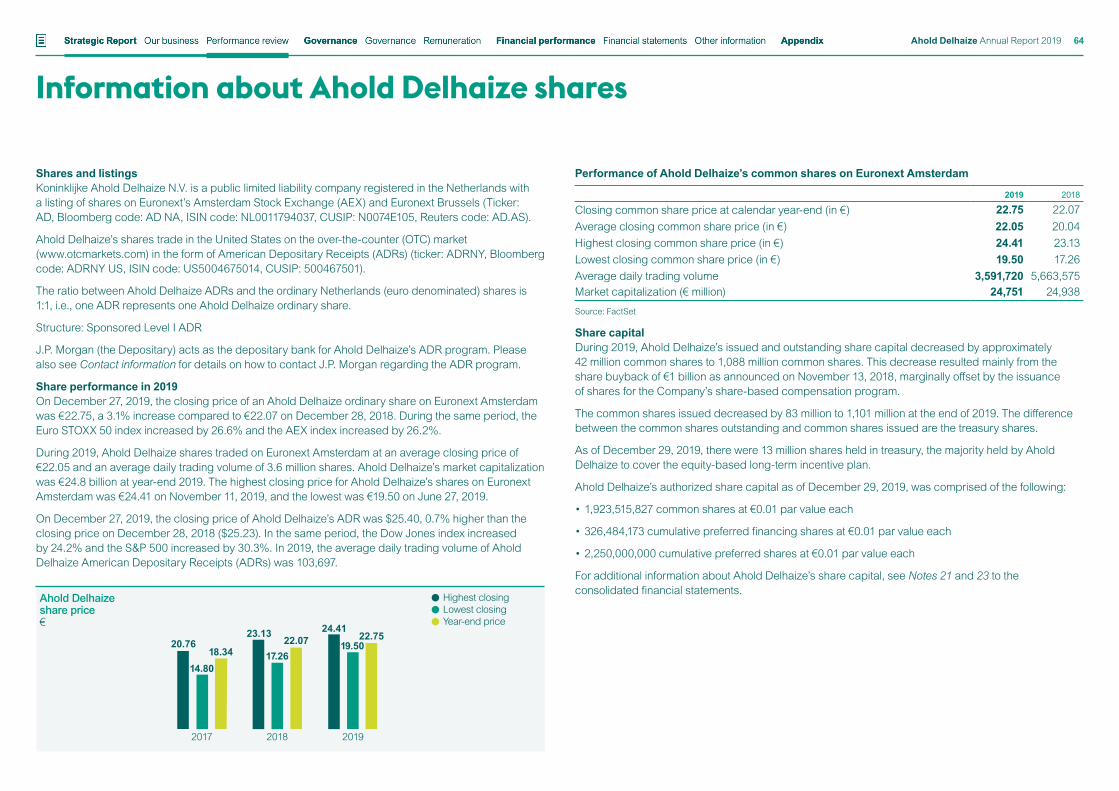
Shares and listingsKoninklijke Ahold Delhaize N.V. is a public limited liability company registered in the Netherlands with a listing of shares on Euronext’s Amsterdam Stock Exchange (AEX) and Euronext Brussels (Ticker: AD, Bloomberg code: AD NA, ISIN code: NL0011794037, CUSIP: N0074E105, Reuters code: AD.AS).
Ahold Delhaize’s shares trade in the United States on the over-the-counter (OTC) market (www.otcmarkets.com) in the form of American Depositary Receipts (ADRs) (ticker: ADRNY, Bloomberg code: ADRNY US, ISIN code: US5004675014, CUSIP: 500467501).
The ratio between Ahold Delhaize ADRs and the ordinary Netherlands (euro denominated) shares is 1:1, i.e., one ADR represents one Ahold Delhaize ordinary share.
Structure: Sponsored Level I ADR
J.P. Morgan (the Depositary) acts as the depositary bank for Ahold Delhaize’s ADR program. Please also see Contact information for details on how to contact J.P. Morgan regarding the ADR program.
Share performance in 2019On December 27, 2019, the closing price of an Ahold Delhaize ordinary share on Euronext Amsterdam was €22.75, a 3.1% increase compared to €22.07 on December 28, 2018. During the same period, the Euro STOXX 50 index increased by 26.6% and the AEX index increased by 26.2%.
During 2019, Ahold Delhaize shares traded on Euronext Amsterdam at an average closing price of €22.05 and an average daily trading volume of 3.6 million shares. Ahold Delhaize’s market capitalization was €24.8 billion at year-end 2019. The highest closing price for Ahold Delhaize’s shares on Euronext Amsterdam was €24.41 on November 11, 2019, and the lowest was €19.50 on June 27, 2019.
On December 27, 2019, the closing price of Ahold Delhaize’s ADR was $25.40, 0.7% higher than the closing price on December 28, 2018 ($25.23). In the same period, the Dow Jones index increased by 24.2% and the S&P 500 increased by 30.3%. In 2019, the average daily trading volume of Ahold Delhaize American Depositary Receipts (ADRs) was 103,697.
Performance of Ahold Delhaize’s common shares on Euronext Amsterdam
2019 2018
Closing common share price at calendar year-end (in €) 22.75 22.07Average closing common share price (in €) 22.05 20.04Highest closing common share price (in €) 24.41 23.13Lowest closing common share price (in €) 19.50 17.26Average daily trading volume 3,591,720 5,663,575Market capitalization (€ million) 24,751 24,938
Source: FactSet
Share capitalDuring 2019, Ahold Delhaize’s issued and outstanding share capital decreased by approximately 42 million common shares to 1,088 million common shares. This decrease resulted mainly from the share buyback of €1 billion as announced on November 13, 2018, marginally offset by the issuance of shares for the Company’s share-based compensation program.
The common shares issued decreased by 83 million to 1,101 million at the end of 2019. The difference between the common shares outstanding and common shares issued are the treasury shares.
As of December 29, 2019, there were 13 million shares held in treasury, the majority held by Ahold Delhaize to cover the equity-based long-term incentive plan.
Ahold Delhaize’s authorized share capital as of December 29, 2019, was comprised of the following:
• 1,923,515,827 common shares at €0.01 par value each
• 326,484,173 cumulative preferred financing shares at €0.01 par value each
• 2,250,000,000 cumulative preferred shares at €0.01 par value each
For additional information about Ahold Delhaize’s share capital, see Notes 21 and 23 to the consolidated financial statements.
Information about Ahold Delhaize shares
Highest closingLowest closingYear-end price
Ahold Delhaize share price€
2017 2018 2019
22.7519.50
24.4122.07
17.26
23.1320.76
14.80
18.34
Financial statements Other informationStrategic Report Governance Financial performance AppendixGovernance RemunerationOur business Performance review Ahold Delhaize Annual Report 2019 64
Distribution of sharesShareholders by region1:
February 2020 2020 2019
U.K. / Ireland 12.8 16.1North America 29.2 26.9Rest of Europe 9.1 9.2France 8.5 8.6The Netherlands2 5.4 4.4Rest of the world 4.9 4.5Germany 3.7 3.5Undisclosed2 26.4 26.8
1 Source: CMi2i.2 The Netherlands excludes the percentage of shareholdings of all retail holdings and treasury shares, which are included
in Undisclosed.
Significant ownership of voting sharesAccording to the Dutch Financial Markets Supervision Act, any person or legal entity who, directly or indirectly, acquires or disposes of an interest in Ahold Delhaize’s capital or voting rights must immediately give written notice to the Netherlands Authority for the Financial Markets (Autoriteit Financiële Markten or AFM) if the acquisition or disposal causes the percentage of outstanding capital interest or voting rights held by that person or legal entity to reach, exceed or fall below any of the following thresholds:
3% 5% 10% 15% 20%
25% 30% 40% 50% 60%
75% 95%
The obligation to notify the AFM also applies when the percentage of capital interest or voting rights referred to above changes as a result of a change in Ahold Delhaize’s total outstanding capital or voting rights. In addition, local rules may apply to investors.
The following table lists the shareholders on record in the AFM register on February 24, 2020, that hold an interest of 3% or more in the share capital of the Company1.
• BlackRock, Inc – 5.35% shareholding (6.4% voting rights) disclosed on November 5, 2019.
• State Street Corporation – 3.49% shareholding (2.7% voting rights) disclosed on July 18, 2019.1 In accordance with the filing requirements, the percentages shown include both direct and indirect capital interests and voting
rights and both real and potential capital interests and voting rights. Further details can be found at www.afm.nl.
For further details on the number of outstanding shares, and the percentages of the issued share capital they represent, see Note 21 to the consolidated financial statements.
Shareholder returnsFor the 2018 financial year, a cash dividend of €0.70 per common share was approved by the annual General Meeting of Shareholders on April 10, 2019, and paid on April 25, 2019.
We propose a cash dividend of €0.76 for the financial year 2019, an increase of 8.6% compared to 2018, reflecting our ambition of sustainable growth of the dividend per share. This represents a payout ratio of 44%, based on the expected dividend payment on underlying income from continuing operations.
If approved by the General Meeting of Shareholders, a final dividend of €0.46 per share will be paid on April 23, 2020. This is in addition to the interim dividend of €0.30 per share, which was paid on August 29, 2019.
Shareholders key performance indicators 2015-2019:
2019 2018 2017 2016 20152
Dividend per common share1 0.76 0.70 0.63 0.57 0.52Final dividend 0.46 0.70 0.63 0.57 0.52Interim dividend 0.30 N/A N/A N/A N/A
Dividend yield 3.3% 3.2% 3.4% 2.8% 2.7%Payout ratio3 44% 42% 47% 48% 49%
1 2019 dividend subject to the approval of the annual General Meeting of Shareholders.2 2015 numbers refer to Ahold only.3 Dividend payout ratio for 2015 is based on adjusted income from continuing operations. For 2017 and 2016, the payout ratio
is based on underlying income from continuing operations (on a pro forma basis).
Dividends on cumulative preferred financing sharesAhold Delhaize paid a dividend on cumulative preferred financing shares in 2019. The cumulative preferred financing shares were cancelled on July 16, 2019.
Share buybackOn November 13, 2018, Ahold Delhaize announced it will return €1 billion to shareholders by means of a share buyback program, which was completed on December 11, 2019. An additional €1 billion share buyback program was announced on December 4, 2019, which is expected to be completed before the end of 2020. Maintaining a balanced approach between funding growth in key channels and returning excess liquidity to shareholders is part of Ahold Delhaize’s financial framework to support our Leading Together strategy. The purpose of the program is to reduce Ahold Delhaize’s capital, by cancelling all or part of the common shares acquired through the program.
Information about Ahold Delhaize sharesFinancial statements Other informationStrategic Report Governance Financial performance AppendixGovernance RemunerationOur business Performance review Ahold Delhaize Annual Report 2019 65
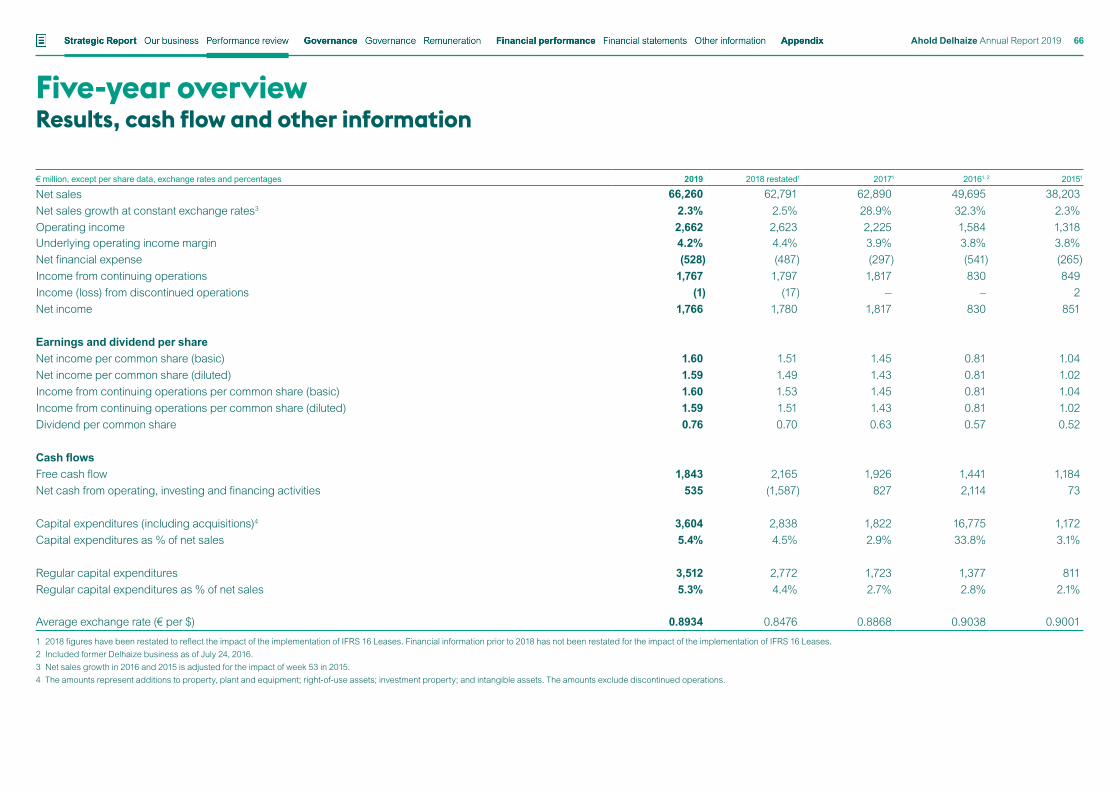
€ million, except per share data, exchange rates and percentages 2019 2018 restated1 20171 20161, 2 20151
Net sales 66,260 62,791 62,890 49,695 38,203Net sales growth at constant exchange rates3 2.3% 2.5% 28.9% 32.3% 2.3%Operating income 2,662 2,623 2,225 1,584 1,318Underlying operating income margin 4.2% 4.4% 3.9% 3.8% 3.8%Net financial expense (528) (487) (297) (541) (265)Income from continuing operations 1,767 1,797 1,817 830 849Income (loss) from discontinued operations (1) (17) — – 2Net income 1,766 1,780 1,817 830 851
Earnings and dividend per shareNet income per common share (basic) 1.60 1.51 1.45 0.81 1.04Net income per common share (diluted) 1.59 1.49 1.43 0.81 1.02Income from continuing operations per common share (basic) 1.60 1.53 1.45 0.81 1.04Income from continuing operations per common share (diluted) 1.59 1.51 1.43 0.81 1.02Dividend per common share 0.76 0.70 0.63 0.57 0.52
Cash flowsFree cash flow 1,843 2,165 1,926 1,441 1,184Net cash from operating, investing and financing activities 535 (1,587) 827 2,114 73
Capital expenditures (including acquisitions)4 3,604 2,838 1,822 16,775 1,172Capital expenditures as % of net sales 5.4% 4.5% 2.9% 33.8% 3.1%
Regular capital expenditures 3,512 2,772 1,723 1,377 811Regular capital expenditures as % of net sales 5.3% 4.4% 2.7% 2.8% 2.1%
Average exchange rate (€ per $) 0.8934 0.8476 0.8868 0.9038 0.9001
1 2018 figures have been restated to reflect the impact of the implementation of IFRS 16 Leases. Financial information prior to 2018 has not been restated for the impact of the implementation of IFRS 16 Leases.2 Included former Delhaize business as of July 24, 2016.3 Net sales growth in 2016 and 2015 is adjusted for the impact of week 53 in 2015.4 The amounts represent additions to property, plant and equipment; right-of-use assets; investment property; and intangible assets. The amounts exclude discontinued operations.
Five-year overviewResults, cash flow and other information
Financial statements Other informationStrategic Report Governance Financial performance AppendixGovernance RemunerationOur business Performance review Ahold Delhaize Annual Report 2019 66
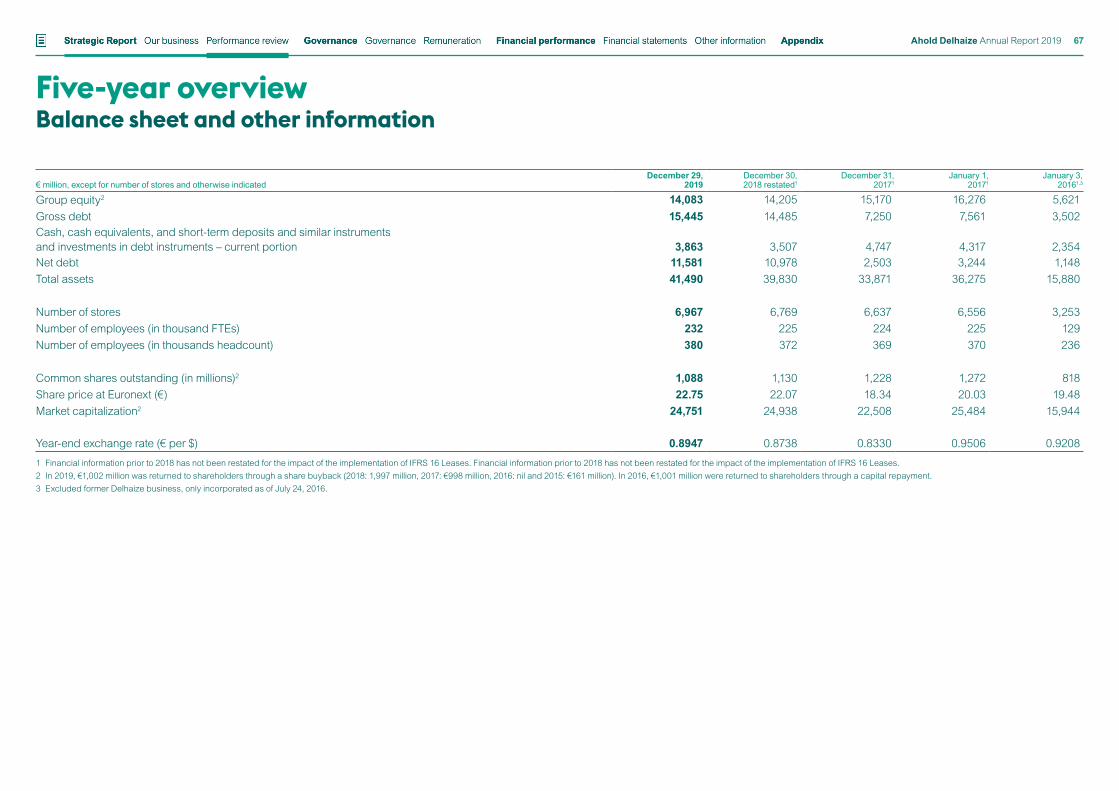
€ million, except for number of stores and otherwise indicatedDecember 29,
2019December 30, 2018 restated1
December 31, 20171
January 1, 20171
January 3, 20161,3
Group equity2 14,083 14,205 15,170 16,276 5,621Gross debt 15,445 14,485 7,250 7,561 3,502Cash, cash equivalents, and short-term deposits and similar instruments and investments in debt instruments – current portion 3,863 3,507 4,747 4,317 2,354Net debt 11,581 10,978 2,503 3,244 1,148Total assets 41,490 39,830 33,871 36,275 15,880
Number of stores 6,967 6,769 6,637 6,556 3,253Number of employees (in thousand FTEs) 232 225 224 225 129Number of employees (in thousands headcount) 380 372 369 370 236
Common shares outstanding (in millions)2 1,088 1,130 1,228 1,272 818Share price at Euronext (€) 22.75 22.07 18.34 20.03 19.48Market capitalization2 24,751 24,938 22,508 25,484 15,944
Year-end exchange rate (€ per $) 0.8947 0.8738 0.8330 0.9506 0.9208
1 Financial information prior to 2018 has not been restated for the impact of the implementation of IFRS 16 Leases. Financial information prior to 2018 has not been restated for the impact of the implementation of IFRS 16 Leases.2 In 2019, €1,002 million was returned to shareholders through a share buyback (2018: 1,997 million, 2017: €998 million, 2016: nil and 2015: €161 million). In 2016, €1,001 million were returned to shareholders through a capital repayment.3 Excluded former Delhaize business, only incorporated as of July 24, 2016.
Five-year overviewBalance sheet and other information
Financial statements Other informationStrategic Report Governance Financial performance AppendixGovernance RemunerationOur business Performance review Ahold Delhaize Annual Report 2019 67
Financial performance measuresThe financial information included in this Annual Report is prepared in accordance with International Financial Reporting Standards as adopted by the European Union and as explained in Note 2 and Note 3 to the consolidated financial statements, unless otherwise indicated.
This Annual Report also includes alternative performance measures (also known as non-GAAP measures). The definitions of these financial and non-financial alternative performance measures can be found below.
Financial alternative performance measuresManagement believes that financial alternative performance (non-GAAP) measures allow for a better understanding of Ahold Delhaize’s operating and financial performance. These alternative performance measures should be considered in addition to, but not as substitutes for, the most directly comparable IFRS measures.
Comparable salesComparable sales are net sales, in local currency, from exactly the same stores – including stores that are replaced within the same market area – and online sales in existing market areas for the most recent comparable period. Ahold Delhaize measures a store for comparable sales after it is open for a full 56 weeks. Comparable stores are locations that were open for both the full time period being reported on and the full comparable time period in the preceding year.
For markets that sell gasoline, Ahold Delhaize also calculates the comparable sales excluding gasoline sales, to eliminate gasoline price volatility in the comparison.
Comparable sales and comparable sales excluding gasoline sales are not reflected in Ahold Delhaize’s financial statements. However, the Company believes that disclosing comparable sales and comparable sales excluding gasoline sales provides additional useful analytical information to investors regarding the operating performance of Ahold Delhaize as it neutralizes the impact of, for example, newly acquired stores, in the calculation of sales growth.
Earnings before interest, taxes, depreciation and amortization, or EBITDAAhold Delhaize defines EBITDA as operating income / (loss) plus depreciation and amortization. EBITDA is considered to be a useful measure for investors to analyze profitability by eliminating the effects of financing (i.e., net financial expense), capital investments and the impact of the purchase price allocation (i.e., depreciation and amortization).
Free cash flowFollowing the adoption of IFRS 16, Ahold Delhaize defines free cash flow as operating cash flows from continuing operations minus net capital expenditures, net repayment of lease liabilities and receivables (both interest and principal portions) and net interest paid plus dividends received.
Previously, Ahold Delhaize did not include the repayment of finance lease liabilities under IAS 17 in free cash flow. In addition, Ahold Delhaize did not previously have lease receivables and all rent income was included in operating cash flows from continuing operations. However, after the adoption of IFRS 16, some lessor contracts were classified as finance leases resulting in the recognition of lease receivables. Rent payments received on such lease receivables continue to be included in free cash flow.
Ahold Delhaize has included free cash flow as the Company believes it is a useful measure for investors, because it provides insight into the cash flows available to, among other things, reduce debt and pay dividends. Free cash flow is derived from the financial statements; however, this is not a measure calculated in accordance with IFRS and may not be comparable to similar measures presented by other companies. Accordingly, free cash flow should not be considered as an alternative to operating cash flow.
Global Support Office costsGlobal Support Office (GSO) costs relate to the responsibilities of the Global Support Office, including Finance, Strategy, Mergers & Acquisitions, Internal Audit, Legal, Compliance, Human Resources, Information Technology, Insurance, Tax, Treasury, Communications, Investor Relations, Sustainable Retailing and the majority of the Executive Committee. Global Support Office costs also include results from other activities coordinated centrally but not allocated to any subsidiary. Underlying Global Support Office costs exclude impairments of non-current assets, gains (losses) on leases and the sale of assets, and restructuring and related charges and other items, including business acquisition transaction costs.
Net consumer online salesNet consumer online sales is defined as online sales including sales of third parties via bol.com’s Plaza. Net consumer online sales excludes Value Added Tax (VAT). Ahold Delhaize’s management believes that this measure provides more insight into the growth of our online businesses. Online sales is net sales generated through electronic ordering by the final customer at the fair value of the consideration received or receivable.
Net debtNet debt is the difference between (i) the sum of loans, lease liabilities, cumulative preferred financing shares and short-term debt (i.e., gross debt) and (ii) cash, cash equivalents, current portion of investment in debt instruments, and short-term deposits and similar instruments. In management’s view, because cash, cash equivalents, current portion of investments in debt instruments, and short-term deposits and similar instruments can be used, among other things, to repay indebtedness, netting this against gross debt is a useful measure for investors to judge Ahold Delhaize’s leverage. Net debt may include certain cash items that are not readily available for repaying debt. The definition remains unchanged following the adoption of IFRS 16.
Definitions: Performance measuresFinancial statements Other informationStrategic Report Governance Financial performance AppendixGovernance RemunerationOur business Performance review Ahold Delhaize Annual Report 2019 68
Net sales at constant exchange ratesNet sales at constant exchange rates excludes the impact of using different currency exchange rates to translate the financial information of Ahold Delhaize subsidiaries or joint ventures to euros. Ahold Delhaize’s management believes this measure provides a better insight into the operating performance of Ahold Delhaize’s foreign subsidiaries or joint ventures.
Net sales in local currencyIn certain instances, net sales are presented in local currency. Ahold Delhaize’s management believes this measure provides a better insight into the operating performance of Ahold Delhaize’s foreign subsidiaries.
Operating income in local currencyIn certain instances, operating income is presented in local currency. Ahold Delhaize’s management believes this measure provides better insight into the operating performance of Ahold Delhaize’s foreign subsidiaries.
Regular capex expenditureThe amounts represent additions to property, plant and equipment; right-of-use assets; investment property; and intangible assets. The amounts exclude discontinued operations.
Return on capitalReturn on capital (RoC) is calculated as underlying operating income before depreciation, amortization divided by the annual rolling average of the sum of company-owned property, plant and equipment at purchase price, intangible assets (excluding goodwill) at purchase price, operating working capital components and repayment of lease liabilities, divided by 8%.
Underlying operating income and marginUnderlying operating income is defined as total operating income, adjusted for impairments of non-current assets, gains and losses on the sale of assets, gains and losses on leases and subleases, restructuring and related charges, and other items considered not to be directly related to the underlying operating performance.
Prior to the adoption of IFRS 16, gains and losses on lease and sublease were not adjusted for to determine underlying operating income but the amounts were not significant.
Ahold Delhaize’s management believes this measure provides better insight into the underlying operating performance of the Company’s operations. Underlying operating income margin is calculated as underlying operating income as a percentage of net sales.
Underlying income from continuing operationsAhold Delhaize defines underlying income from continuing operations as income from continuing operations adjusted for impairments of non-current assets, gains and losses on the sale of assets, gains and losses on leases and subleases, restructuring and related charges, and other items considered not to be directly related to the underlying operating performance, as well as material non-recurring finance costs and income tax expense, and the potential effect of income tax on all these items.
Prior to the adoption of IFRS 16, gains and losses on lease and sublease were not adjusted for to determine underlying operating income but the amounts were not significant.
Underlying income per share from continuing operationsUnderlying income per share from continuing operations is calculated as underlying income from continuing operations, divided by the weighted average number of shares outstanding, also referred to as “underlying earnings per share” or “underlying EPS.”
Underlying earnings before interest, taxes, depreciation and amortization, or underlying EBITDA and marginAhold Delhaize defines underlying EBITDA as underlying operating income plus depreciation and amortization. Underlying EBITDA is considered to be a useful measure for investors to analyze profitability by eliminating the effects of financing (i.e., net financial expense), capital investments and the impact of the purchase price allocation (i.e., depreciation and amortization). Underlying EBITDA margin is calculated as underlying EBITDA as a percentage of net sales.
Non-financial performance measuresThe specific definitions outlined below add context to our non-financial performance measures, as well as detail to some of the specific calculations.
Acceptable standards and certifications for commoditiesAhold Delhaize defines acceptable standards as multi-stakeholder initiatives or standards supported by multiple stakeholders. They include third-party verification and focus on mitigating the main environmental and / or social issues associated with a commodity’s production. Acceptable standards are globally consistent and focus on continuously improving production and supply chain practices. Acceptable standards for tea, coffee and cocoa include UTZ Certification, Rainforest Alliance, Fairtrade USA / Fairtrade International or equivalent standards. Acceptable standards for palm oil include Roundtable on Sustainable Palm Oil (RSPO) Principles & Criteria, Rainforest Alliance SAN Standard or equivalent standards. Acceptable standards for wood fiber are the Forest Stewardship Council (FSC) Chain of Custody, Program for Endorsement of Forest Certification (PEFC) Grade A standards, Sustainable Forestry Initiative (SFI) or equivalent standards. Acceptable standards for soy are Roundtable on Responsible Soy (RTRS) standard for Responsible Soy Production, ProTerra, or equivalent standards. We purchase area-based RTRS credits from the Cerrado Region. Acceptable standards for seafood products include certification against a program that is recognized by the Global Sustainable Seafood Initiative (GSSI) or Aquaculture Stewardship Council (ASC) farm standards.
Definitions: Performance measuresFinancial statements Other informationStrategic Report Governance Financial performance AppendixGovernance RemunerationOur business Performance review Ahold Delhaize Annual Report 2019 69
Palm oil RSPO-certifiedThe Roundtable for Sustainable Palm Oil (RSPO) initiated a certification program to promote the use of sustainable palm oil, with different supply chain options: RSPO Segregated, RSPO Mass Balance and RSPO Book & Claim. RSPO Segregated certifies that palm oil only comes from RSPO-certified palm plantations. RSPO Mass Balance certifies that palm oil comes from a mix of RSPO-certified and RSPO-uncertified palm plantations. RSPO Book & Claim enables companies to buy credits from RSPO-certified growers, crushers and independent smallholders. To comply with RSPO Certification requirements, any supplier that uses palm-based ingredients must be RSPO Chain of Custody-Certified, and purchase RSPO-Certified (Mass Balance or Segregated) palm oil.
amfori BSCIamfori BSCI (Business Social Compliance Initiative): a non-profit organization that supports more than 1,000 international companies in the process of monitoring and improving working conditions in the global supply chain through its own auditing program. We consider the following standards to be “BSCI Equivalent”: Ethical Trading Initiative (ETI) / SMETA; Fair for Life / For Life; Fair Labor Association (FLA)†; Fair Trade USA††; Fairtrade Hired Labor; Fairtrade Textile; Florverde††; Initiative Clause Sociale (ICS); Kenya Flower Council (KFC); MPS – Socially Qualified (SQ); Proterra; Rainforest Alliance (RA) / Sustainable Agriculture Network (SAN); Sustainable Agriculture in South Africa (SIZA); Sustainably Grown; Social Accountability (SA) 8000; UTZ Certified††; Wine and Agricultural Ethical Trade Association (WIETA).† Only audit reports conducted by external, independent auditors are considered equivalent.†† Only applicable if the production unit is a farm.
Associate engagement surveyAssociate engagement is measured through an annual survey of all associates employed by Ahold Delhaize and its brands. A number of items in the survey are used to derive and calculate an associate engagement score.
• Healthy workplace: Associates are asked about the support they receive to have healthier lives.
• Inclusive workplace: Associates are asked about the support they receive to have a more inclusive workplace.
• Associate development: Associates are asked about the support they receive to develop their careers with Ahold Delhaize.
Associate engagement benchmarksGlobal retail benchmark: This is a reflection of companies in the retail sector that have a brick-and-mortar and online presence globally. Ahold Delhaize defines this more broadly than just grocery retailers and the countries we have a presence in because we compete for talent with all retailers globally and we want to understand our strengths and opportunities against the global talent competition.
BiodiversityThe variety of species present on earth, or in a specific habitat or ecosystem.
Carbon footprint methodology and data scopeThe carbon footprint methodology follows the guidelines of the World Business Council for Sustainable Development (WBCSD) / World Resources Institute (WRI) Greenhouse Gas (GHG) Protocol regarding corporate greenhouse gas accounting and reporting. Our Ahold Delhaize carbon footprint reporting takes into account Scope 1, Scope 2 and limited Scope 3 emissions.
Scope 1 (direct GHG emissions): emissions from sources that are owned or controlled by Ahold Delhaize. Scope 1 emissions include emissions from refrigerant leakages, owned trucking and on-site fuel usage (natural gas, propane, light fuel).
Scope 2 (indirect GHG emissions): emissions from the generation of purchased electricity, heat or steam consumed by the Company. They are not “direct” emissions in that they arise from third-party installations but are attributed to the Company’s operations as the end user of the electricity, heat or steam.
Limited Scope 3 (other indirect emissions): emissions from franchise stores (including estimates) and affiliated stores and trucking emissions from subcontracted trucks that deliver Ahold Delhaize products from operated distribution centers to stores.
The Group’s total CO2-equivalent emissions and energy figures include all energy and related emissions data as defined by the scopes above, including data from facilities that closed or opened during 2019.
We use the latest available emission factors in our reporting. We source electricity emission factors from the International Energy Agency (IEA, 2018 edition; 2016 data) for European countries and from GHG Protocol 2014 (based on eGrid 2016 values, issued in February 2018 by the U.S. Environmental Protection Agency – EPA) for the United States. We source fuel emission factors from GHG Protocol 2014 wherever available, and otherwise from other appropriate sources. For refrigerant leakages, we apply the Global Warming Potentials (GWP) for refrigerant blends used in Ahold Delhaize facilities based on Intergovernmental Panel for Climate Change Assessment Report data IPCC, AR5 (2014).
We do not extend our reporting to include all Scope 3 emissions, but we work with our peer companies and suppliers to better understand the climate change impact we have throughout our entire value chain. Scope 3 defined by the GHG Protocol accounts for all the remaining emissions that result from our activities, ranging from products transportation to affiliated stores to emissions from our supply chain, including emissions from growing and packaging the food we sell.
Definitions: Performance measuresFinancial statements Other informationStrategic Report Governance Financial performance AppendixGovernance RemunerationOur business Performance review Ahold Delhaize Annual Report 2019 70
CO2 emissions / CO2 equivalent (CO2e)The CO2 (carbon dioxide) emissions data we report consists of a calculated CO2 equivalent: actual CO2 emitted plus equivalent emissions from other greenhouse gases (such as CH4, N2O and F-gases).
Location-based approachThe GHG Protocol Scope 2 Guidance defines the location-based approach as “a method that reflects the average emissions intensity of grids on which energy consumption occurs (using mostly grid-average emission factor data).”
Market-based approachThe GHG Protocol Scope 2 Guidance defines the market-based approach as “a method that reflects emissions from electricity that companies have purposefully chosen (or their lack of choice). It derives emission factors from contractual instruments, which include any type of contract between two parties for the sale and purchase of energy bundled with attributes about the energy generation, or for unbundled attribute claims. Markets differ as to what contractual instruments are commonly available or used by companies to purchase energy or claim specific attributes about it, but they can include energy attribute certificates (RECs, GOs, etc.), direct contracts (for both low-carbon, renewable, or fossil fuel generation), supplier-specific emission rates, and other default emission factors representing the untracked or unclaimed energy and emissions (termed the ‘residual mix’) if a company does not have other contractual information that meets the Scope 2 Quality Criteria.”
DeforestationThe removal of a forest or stand of trees from land which is then converted to a non-forest use. Deforestation can involve conversion of forest land to farms, ranches, or urban use. The most concentrated deforestation occurs in tropical rainforests.
Food wasteAs defined by the Food and Agriculture Organization of the United Nations (FAO), food waste is any removal of food from the food supply chain that is or was at some point fit for human consumption, but has been disposed of, or has spoiled or expired, mainly as a result of economic behavior, poor stock management or neglect. In our calculations, in contrast to shrink, food waste excludes donations from hunger relief organizations, theft, and cash shortages. We measure food waste using the Food Loss and Waste Protocol.
Food Loss and Waste ProtocolA multi-stakeholder effort to develop the global accounting and reporting standard (known as the FLW Standard) for quantifying food and associated inedible parts removed from the food supply chain (referred to for simplicity’s sake as “food loss and waste”). For more information, see www.flwprotocol.org.
Free from products“Free from” products exclude certain ingredients, such as allergens, synthetic colors or artificial flavors. The excluded ingredients are normally referenced on the packaging or product marketing materials.
Front-of-pack nutritional labelingNutritional labeling (showing the amount of certain nutrients) that is on the front of a product package. At a minimum, it comprises the calories per serving.
GFSIGlobal Food Safety Initiative: a Consumer Goods Forum activity that enables continuous improvement of food safety management across the supply chain, through benchmarking, collaboration and harmonization of food safety certification programs.
Greenhouse gasesGases such as carbon dioxide or methane that contribute to climate change.
Global Reporting Initiative (GRI)An independent international not-for-profit organization that developed the GRI Sustainability Reporting Standards and works to support their implementation.
Global Sustainable Seafood Initiative (GSSI)A global platform and partnership of seafood companies, NGOs, experts and governmental and intergovernmental organizations working towards more sustainable seafood. GSSI’s Global Benchmark Tool includes GSSI Essential Components that are based on the Code of Conduct for Responsible Fisheries (CCRF) and the FAO Guidelines and seafood certification schemes must meet to be recognized by GSSI.
Global Warming Potential (GWP)Defined by the GHG Protocol as “a factor describing the radiative forcing impact (degree of harm to the atmosphere) of one unit of a given GHG relative to one unit of CO2.” By using GWP, GHG emissions can be standardized to a carbon dioxide equivalent (CO2e) that allows expressing the emissions of different greenhouse gases using carbon dioxide as a reference. For example, for a 100-year time horizon, the impact of one unit of methane is 25 times greater than one unit of CO2 (according to IPCC’s 4th assessment report). Hence, methane’s global warming potential (GWP) is 25. Hence, methane’s global warming potential (GWP) is 25.
Average GWPThe GWP of all refrigerants we use in our systems (including stores and distribution centers) weighted in relation to their total charge.
Definitions: Performance measuresFinancial statements Other informationStrategic Report Governance Financial performance AppendixGovernance RemunerationOur business Performance review Ahold Delhaize Annual Report 2019 71
Healthy productsProducts that meet nutritional criteria as determined by Guiding Stars (in the U.S.) and Choices nutrition criteria (in Europe). See guidingstars.com or www.choicesprogramme.org.
Last-stage of production unitThe entity that performs the last stage of production or processing in the supply chain where food and non-food safety and / or working conditions are impacted. The last stage of production (LSOP) is:
• For food safety: the location where the final consumer product (including packing) is handled.
• For non-food safety: the location where the final consumer product (excluding packing) is assembled.
• For social compliance: the location where labor is involved in producing or processing the final product – (re-)packing in a non-high-risk country is excluded.
National brandsProducts that are distributed nationally under a brand name owned by the producer or distributor.
Occupational illness frequency rateWork-related illnesses or diseases occurring in the course or scope of employment. Occupational illnesses or diseases are only measured if a patient requires a medical professional to administer direct care or evaluate the illness or disease. In the U.S., information from our local claims management or insurance providers is used to monitor performance in this area. Since local claims management or insurance providers need to comply with local legislation, the acceptance of illnesses or diseases as work-related can deviate across brands. Occupational illnesses are calculated per one million hours worked.
Own brandsOwn-brand products, at Ahold Delhaize company-operated and affiliated stores, include: private labels, fancy brands (proprietary private labels that are a fantasy name owned by Ahold Delhaize), exclusive brands (brands that are not international, national or regional brands), store-prepared products (in-store food preparation, even if derived from branded stock), non-branded products (such as bulk fruit and vegetables or no name non-food products) and promotional items relating to the former. In short, every product that is not an international, national or regional brand is considered to be an own-brand product.
Ozone-friendly refrigerantA refrigerant that has no ozone depletion potential (ODP=0), meaning there is no degradation to the ozone layer. The data are based on the 2015 Report from United Nations Environment Programme (UNEP), “TOC Refrigeration, A/C and Heat Pumps Assessment Report 2015.”
Pick-up pointA pick-up point (PUP) is a location that serves as a point where customers can pick up groceries they have ordered online. PUPs with pick-from-store capability are also referred to as click-and-collect points.
Private label productsPrivate label products are a sub-set of Ahold Delhaize own brands, consisting of products with a visible proprietary label from an Ahold Delhaize brand.
Rate of lost days due to accidentsNumber of days lost that are directly related to work-related accidents per 200,000 hours worked. The number of days lost are days scheduled to be worked according to each associate’s schedule. An accident is a non-fatal or fatal injury arising in the course of work.
Sales areaThe sum of the store areas (in square meters) where products are sold and services provided, taken at the end of the year.
Sustainable Development Goals (SDGs)The United Nations SDGs are a universal call to action to end poverty, protect the planet and ensure that all people enjoy peace and prosperity. The 17 goals replace the Millennium Development Goals and are set on a 2016-2030 time frame.
United Nations Global CompactAn initiative for businesses committed to aligning their operations and strategies with 10 universally accepted principles in the areas of human rights, labor, environmental and anti-corruption.
Waste“Total Waste Generated” includes all waste, regardless of the waste management (recycling, incineration or landfill). It is broken down by percentage sent to landfill, recycled and sent to incinerators that produce energy. Waste data covers all types of facilities (stores, distribution centers, and offices). Information about all waste disposal methods has been determined through information provided by the waste disposal contractors.
Waste recyclingAll methods that do not include sending waste to landfill or incineration. For food waste, this includes four methods: recycling through animal feed, recycling through biogas generation for energy, composting and rendering. For other waste streams, such as cardboard, paper, plastic and other waste, recycling refers to applied methods for each specific waste type.
Definitions: Performance measuresFinancial statements Other informationStrategic Report Governance Financial performance AppendixGovernance RemunerationOur business Performance review Ahold Delhaize Annual Report 2019 72
GovernanceGovernance74 Our Management Board and Executive Committee
76 Our Supervisory Board
78 Corporate governance
84 Letter from the Supervisory Board Chairman
85 Supervisory Board report
91 How we manage risk
105 Declarations
Remuneration106 Letter from the Remuneration Committee Chairman
107 Remuneration policy
110 2019 Remuneration
Financial statements Other informationStrategic Report Governance Financial performance AppendixGovernance RemunerationOur business Performance review Ahold Delhaize Annual Report 2019 73

Frans MullerPresident and Chief Executive Officer; Chairman and member of the Management Board and Executive CommitteeFrans Muller started as President and Chief Executive Officer of Ahold Delhaize on July 1, 2018. Before that, he served as Deputy Chief Executive Officer and Chief Integration Officer since 2016. He was also Acting Chief Operating Officer for Delhaize America from October 2016 until January 2018. Prior to Ahold Delhaize, Frans served for three years as President and CEO of Delhaize Group.
Before joining Delhaize Group, Frans worked for German retailer Metro AG for more than 15 years, serving in various leadership positions at Metro AG, including managing director of Makro, member of the board of Metro Cash & Carry International, president for Asia Pacific and Russia / Ukraine, and CEO of Metro Group Buying. From 2006 until 2013, he was a member of the Metro AG Management Board and served as CEO of Metro Cash & Carry from 2008 until 2013. From 1988 to 1997, Frans held various management and executive positions at KLM Cargo in Amsterdam, Frankfurt, Vienna and Singapore.
Frans is president of the European Retail Round Table and serves as chairman of the board of directors of the Vlerick Business School and a board member of the Consumer Goods Forum.
Age: 58Nationality: Dutch
Jeff CarrChief Financial Officer; Member Management Board and Executive CommitteeJeff Carr has served as Chief Financial Officer of Ahold Delhaize since July 24, 2016. Jeff joined Ahold on November 14, 2011, as acting member of the Management Board and CFO. Ahold’s shareholders appointed him to the Management Board on April 17, 2012. Ahold Delhaize announced in September 2019 that Jeff will not stand for another term as member of the Management Board when his current term expires at the time of the annual General Meeting of Shareholders in April 2020.
Jeff began his career at Unilever, and held senior roles in finance at Grand Metropolitan plc, Reckitt Benckiser and Associated British Foods. From 2005 to 2009, he was group finance director and a member of the board at easyJet plc. Jeff was then appointed to the role of group finance director and a member of the board at FirstGroup plc, a leading transport operator in the UK and the United States.
Jeff serves as non-executive director of Kingfisher plc, Europe’s leading home improvement retailer.
Jeff has lived and worked in Europe and the United States.
Age: 58Nationality: British
Kevin HoltChief Executive Officer Ahold Delhaize USA; Member Management Board and Executive CommitteeKevin Holt has served as Chief Executive Officer Ahold Delhaize USA since January 1, 2018. Prior to that, Kevin had been Chief Operating Officer Ahold USA since October 2016, after serving as COO Delhaize America since July 24, 2016. He had earlier served as Executive Vice President of Delhaize Group and CEO of Delhaize America, starting in 2014.
Before joining Delhaize Group, Kevin was president of retail operations for SuperValu. During his tenure there, the company owned the Albertsons, Jewel-Osco and Save-A-Lot chains and was the third largest food retailing company in the United States.
Prior to SuperValu, Kevin worked for three years with Sears Holding Company and 14 years with Meijer, serving in various leadership positions, including executive vice president of retail operations and senior vice president of information technology / services and strategic planning.
Before joining the retail industry, Kevin spent nine years at NCR delivering technology solutions to large and complex organizations.
Age: 61Nationality: American
Wouter KolkChief Executive Officer Europe and Indonesia; Member Management Board and Executive CommitteeWouter Kolk started as Chief Executive Officer Europe and Indonesia on October 1, 2018. He had been Chief Operating Officer the Netherlands and Belgium and member of the Executive Committee of Ahold Delhaize since September 8, 2017.
Wouter re-joined Ahold in 2013 as EVP Specialty Stores and New Markets at Albert Heijn following a six-year period as CEO of international retailer WE Fashion. He became Chief Executive Officer Albert Heijn in January 2015. He first started at Ahold in 1991, and over the next 16 years served in several international commercial and general management roles, including Commercial Director Asia-Pacific based in Singapore, Regional Director Albert Heijn, General Manager Gall & Gall and General Manager of Etos.
Wouter is a member of the supervisory boards of the Hortus Botanicus Amsterdam and concert hall Paradiso.
Age: 53Nationality: Dutch
Our Management Board and Executive CommitteeOur Management Board
Executive Committee diversityGender1
Female13%
Male87%
1 With the arrival of Natalie Knight, gender diversity will shift to 25% female and 75% male.
Financial statements Other informationStrategic Report Governance Financial performance AppendixGovernance RemunerationOur business Performance review Ahold Delhaize Annual Report 2019 74

Abbe LuersmanChief Human Resources Officer; Member Executive CommitteeAbbe Luersman has served as Chief Human Resources Officer and member of Ahold Delhaize’s Executive Committee since July 24, 2016. She is responsible for Global Human Resources, including Talent and Diversity; Leadership and Development; Organizational Effectiveness and Design; and Total Rewards. Prior to this, Abbe had served as Ahold’s Chief Human Resources Officer and member of the Executive Committee from November 1, 2013.
Before that, Abbe worked for Unilever, where she held various HR leadership roles, most recently as head of human resources for Unilever Europe. Prior to Unilever, Abbe worked at Whirlpool Corporation, holding a number of senior roles in human resources, both in the United States and internationally.
Abbe is a member of the boards of directors of the Network of Executive Women and the Netherlands American Chamber of Commerce and a member of the Gartner CHRO Global Leadership Board.
Age: 52Nationality: American
Jan Ernst de GrootChief Legal Officer; Member Executive CommitteeJan Ernst de Groot has served as Chief Legal Officer and member of Ahold Delhaize’s Executive Committee since July 24, 2016. Prior to that, he was Chief Legal Officer and member of Ahold’s Executive Committee since February 1, 2015. Jan Ernst is responsible for Ahold Delhaize’s legal affairs, governance and compliance functions, safety, public affairs, and product integrity.
Before joining Ahold, Jan Ernst was general counsel and managing director at TNT Express. Prior to that, he worked for KLM Royal Dutch Airlines in a wide range of business and corporate roles, most recently as managing director and a member of the board of management. Jan Ernst started his career at law firm De Brauw Blackstone Westbroek.
Jan Ernst is chairman of the supervisory council of Hivos, a supervisory board member of ADG Dienstengroep and a board member of the Hermitage Museum Amsterdam.
Age: 56Nationality: Dutch
Ben WishartGlobal Chief Information Officer; Member Executive CommitteeBen Wishart became a member of Ahold Delhaize’s Executive Committee on January 1, 2018. Ben joined Ahold in 2013 in the role of Global Chief Information Officer and has continued in this role for Ahold Delhaize. He is responsible for leadership and governance on technology matters globally, including strategy and solution delivery, enabling digital platforms, cyber defense and sourcing.
He previously served as CIO of Morrisons plc and Whitbread plc and held various senior Information Technology roles at Tesco plc following early career roles in consulting with Cap Gemini and sales and marketing with American Express.
Ben is an independent non-executive director at PayPoint. He serves as a member of the nomination and remuneration committees together with the audit committee and its sub-committee, the cyber and IT committee.
Age: 57Nationality: British
Farhan SiddiqiChief Digital Officer; Member Executive CommitteeFarhan Siddiqi joined Ahold Delhaize as Chief Digital Officer and member of the Executive Committee on January 28, 2019. He is responsible for driving digital transformation and innovation across Ahold Delhaize’s local brands, focusing on loyalty, data analytics and personalization.
Before joining Ahold Delhaize, Farhan served as chief digital officer at McDonald’s, and led the restaurant chain’s digital transformation, including the launch of mobile commerce in 20,000 restaurants, a new mobile app and an upgrade of its self-service ordering kiosks. He was also responsible for data analytics and extending the chain’s Customer Relationship Management capabilities.
Prior to this, Farhan held various key leadership positions within Bank of America, Target and General Electric, where he focused on implementing successful customer loyalty programs and digital payment solutions and launching strategic partnerships.
Farhan serves on the board of directors of Alliant Credit Union.
Age: 51Nationality: American
Our Management Board and Executive CommitteeOur Executive Committee
Executive Committee diversityNationality1
American38%
British24%
Dutch38%
1 With the arrival of Natalie Knight, nationality diversity will shift to 50% American, 37.5% Dutch and 12.5% British.
Financial statements Other informationStrategic Report Governance Financial performance AppendixGovernance RemunerationOur business Performance review Ahold Delhaize Annual Report 2019 75
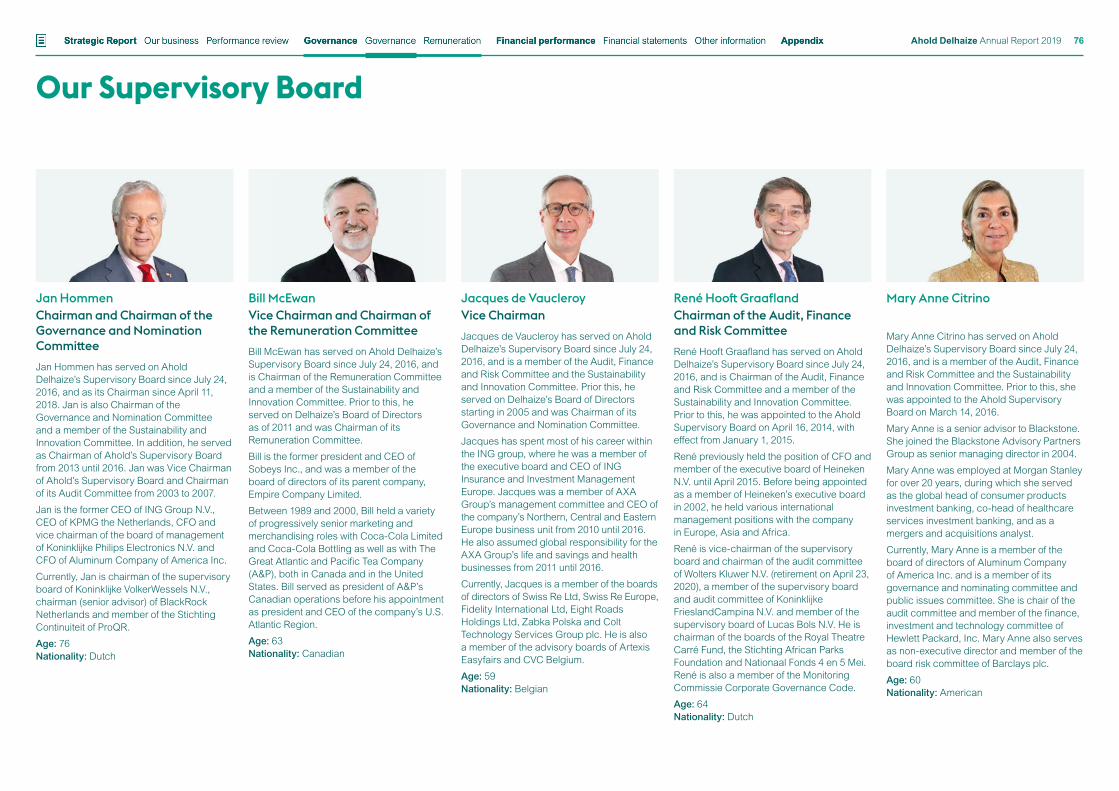
Jan HommenChairman and Chairman of the Governance and Nomination CommitteeJan Hommen has served on Ahold Delhaize’s Supervisory Board since July 24, 2016, and as its Chairman since April 11, 2018. Jan is also Chairman of the Governance and Nomination Committee and a member of the Sustainability and Innovation Committee. In addition, he served as Chairman of Ahold’s Supervisory Board from 2013 until 2016. Jan was Vice Chairman of Ahold’s Supervisory Board and Chairman of its Audit Committee from 2003 to 2007.
Jan is the former CEO of ING Group N.V., CEO of KPMG the Netherlands, CFO and vice chairman of the board of management of Koninklijke Philips Electronics N.V. and CFO of Aluminum Company of America Inc.
Currently, Jan is chairman of the supervisory board of Koninklijke VolkerWessels N.V., chairman (senior advisor) of BlackRock Netherlands and member of the Stichting Continuiteit of ProQR.
Age: 76Nationality: Dutch
René Hooft GraaflandChairman of the Audit, Finance and Risk CommitteeRené Hooft Graafland has served on Ahold Delhaize’s Supervisory Board since July 24, 2016, and is Chairman of the Audit, Finance and Risk Committee and a member of the Sustainability and Innovation Committee. Prior to this, he was appointed to the Ahold Supervisory Board on April 16, 2014, with effect from January 1, 2015.
René previously held the position of CFO and member of the executive board of Heineken N.V. until April 2015. Before being appointed as a member of Heineken’s executive board in 2002, he held various international management positions with the company in Europe, Asia and Africa.
René is vice-chairman of the supervisory board and chairman of the audit committee of Wolters Kluwer N.V. (retirement on April 23, 2020), a member of the supervisory board and audit committee of Koninklijke FrieslandCampina N.V. and member of the supervisory board of Lucas Bols N.V. He is chairman of the boards of the Royal Theatre Carré Fund, the Stichting African Parks Foundation and Nationaal Fonds 4 en 5 Mei. René is also a member of the Monitoring Commissie Corporate Governance Code.
Age: 64Nationality: Dutch
Jacques de VaucleroyVice ChairmanJacques de Vaucleroy has served on Ahold Delhaize’s Supervisory Board since July 24, 2016, and is a member of the Audit, Finance and Risk Committee and the Sustainability and Innovation Committee. Prior this, he served on Delhaize’s Board of Directors starting in 2005 and was Chairman of its Governance and Nomination Committee.
Jacques has spent most of his career within the ING group, where he was a member of the executive board and CEO of ING Insurance and Investment Management Europe. Jacques was a member of AXA Group’s management committee and CEO of the company’s Northern, Central and Eastern Europe business unit from 2010 until 2016. He also assumed global responsibility for the AXA Group’s life and savings and health businesses from 2011 until 2016.
Currently, Jacques is a member of the boards of directors of Swiss Re Ltd, Swiss Re Europe, Fidelity International Ltd, Eight Roads Holdings Ltd, Zabka Polska and Colt Technology Services Group plc. He is also a member of the advisory boards of Artexis Easyfairs and CVC Belgium.
Age: 59Nationality: Belgian
Our Supervisory Board
Bill McEwanVice Chairman and Chairman of the Remuneration CommitteeBill McEwan has served on Ahold Delhaize’s Supervisory Board since July 24, 2016, and is Chairman of the Remuneration Committee and a member of the Sustainability and Innovation Committee. Prior to this, he served on Delhaize’s Board of Directors as of 2011 and was Chairman of its Remuneration Committee.
Bill is the former president and CEO of Sobeys Inc., and was a member of the board of directors of its parent company, Empire Company Limited.
Between 1989 and 2000, Bill held a variety of progressively senior marketing and merchandising roles with Coca-Cola Limited and Coca-Cola Bottling as well as with The Great Atlantic and Pacific Tea Company (A&P), both in Canada and in the United States. Bill served as president of A&P’s Canadian operations before his appointment as president and CEO of the company’s U.S. Atlantic Region.
Age: 63Nationality: Canadian
Mary Anne Citrino
Mary Anne Citrino has served on Ahold Delhaize’s Supervisory Board since July 24, 2016, and is a member of the Audit, Finance and Risk Committee and the Sustainability and Innovation Committee. Prior to this, she was appointed to the Ahold Supervisory Board on March 14, 2016.
Mary Anne is a senior advisor to Blackstone. She joined the Blackstone Advisory Partners Group as senior managing director in 2004.
Mary Anne was employed at Morgan Stanley for over 20 years, during which she served as the global head of consumer products investment banking, co-head of healthcare services investment banking, and as a mergers and acquisitions analyst.
Currently, Mary Anne is a member of the board of directors of Aluminum Company of America Inc. and is a member of its governance and nominating committee and public issues committee. She is chair of the audit committee and member of the finance, investment and technology committee of Hewlett Packard, Inc. Mary Anne also serves as non-executive director and member of the board risk committee of Barclays plc.
Age: 60Nationality: American
Financial statements Other informationStrategic Report Governance Financial performance AppendixGovernance RemunerationOur business Performance review Ahold Delhaize Annual Report 2019 76
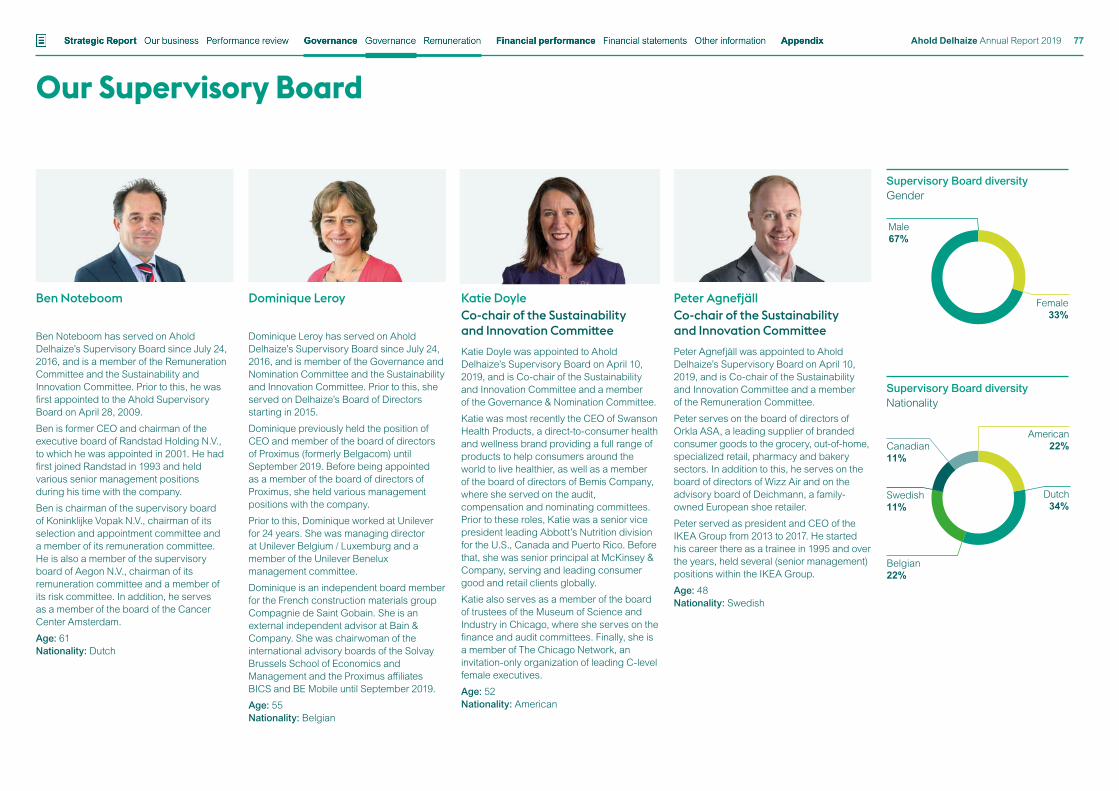
Peter AgnefjällCo-chair of the Sustainability and Innovation CommitteePeter Agnefjäll was appointed to Ahold Delhaize’s Supervisory Board on April 10, 2019, and is Co-chair of the Sustainability and Innovation Committee and a member of the Remuneration Committee.
Peter serves on the board of directors of Orkla ASA, a leading supplier of branded consumer goods to the grocery, out-of-home, specialized retail, pharmacy and bakery sectors. In addition to this, he serves on the board of directors of Wizz Air and on the advisory board of Deichmann, a family-owned European shoe retailer.
Peter served as president and CEO of the IKEA Group from 2013 to 2017. He started his career there as a trainee in 1995 and over the years, held several (senior management) positions within the IKEA Group.
Age: 48Nationality: Swedish
Katie DoyleCo-chair of the Sustainability and Innovation CommitteeKatie Doyle was appointed to Ahold Delhaize’s Supervisory Board on April 10, 2019, and is Co-chair of the Sustainability and Innovation Committee and a member of the Governance & Nomination Committee.
Katie was most recently the CEO of Swanson Health Products, a direct-to-consumer health and wellness brand providing a full range of products to help consumers around the world to live healthier, as well as a member of the board of directors of Bemis Company, where she served on the audit, compensation and nominating committees. Prior to these roles, Katie was a senior vice president leading Abbott’s Nutrition division for the U.S., Canada and Puerto Rico. Before that, she was senior principal at McKinsey & Company, serving and leading consumer good and retail clients globally.
Katie also serves as a member of the board of trustees of the Museum of Science and Industry in Chicago, where she serves on the finance and audit committees. Finally, she is a member of The Chicago Network, an invitation-only organization of leading C-level female executives.
Age: 52Nationality: American
Our Supervisory Board
Dominique Leroy
Dominique Leroy has served on Ahold Delhaize’s Supervisory Board since July 24, 2016, and is member of the Governance and Nomination Committee and the Sustainability and Innovation Committee. Prior to this, she served on Delhaize’s Board of Directors starting in 2015.
Dominique previously held the position of CEO and member of the board of directors of Proximus (formerly Belgacom) until September 2019. Before being appointed as a member of the board of directors of Proximus, she held various management positions with the company.
Prior to this, Dominique worked at Unilever for 24 years. She was managing director at Unilever Belgium / Luxemburg and a member of the Unilever Benelux management committee.
Dominique is an independent board member for the French construction materials group Compagnie de Saint Gobain. She is an external independent advisor at Bain & Company. She was chairwoman of the international advisory boards of the Solvay Brussels School of Economics and Management and the Proximus affiliates BICS and BE Mobile until September 2019.
Age: 55Nationality: Belgian
Supervisory Board diversityGender
Female33%
Male67%
Supervisory Board diversity
Nationality
Belgian22%
Canadian11%
Swedish11%
American22%
Dutch34%
Ben Noteboom
Ben Noteboom has served on Ahold Delhaize’s Supervisory Board since July 24, 2016, and is a member of the Remuneration Committee and the Sustainability and Innovation Committee. Prior to this, he was first appointed to the Ahold Supervisory Board on April 28, 2009.
Ben is former CEO and chairman of the executive board of Randstad Holding N.V., to which he was appointed in 2001. He had first joined Randstad in 1993 and held various senior management positions during his time with the company.
Ben is chairman of the supervisory board of Koninklijke Vopak N.V., chairman of its selection and appointment committee and a member of its remuneration committee. He is also a member of the supervisory board of Aegon N.V., chairman of its remuneration committee and a member of its risk committee. In addition, he serves as a member of the board of the Cancer Center Amsterdam.
Age: 61Nationality: Dutch
Financial statements Other informationStrategic Report Governance Financial performance AppendixGovernance RemunerationOur business Performance review Ahold Delhaize Annual Report 2019 77
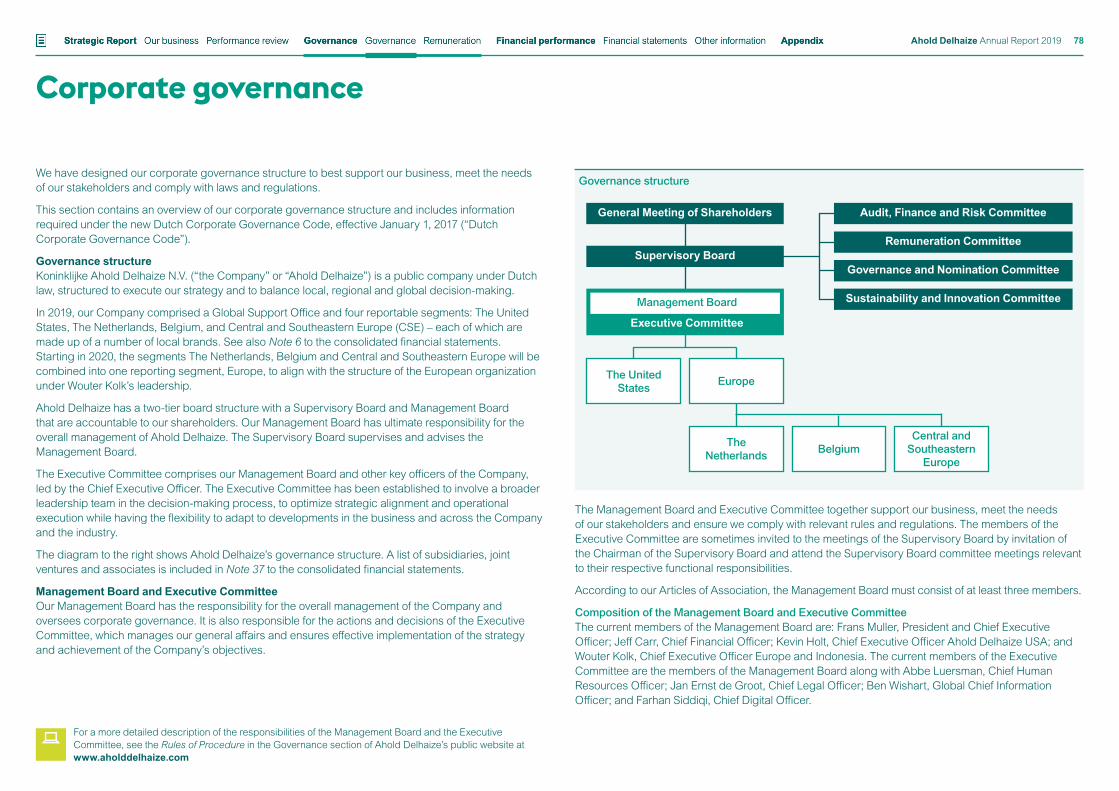
Corporate governance
We have designed our corporate governance structure to best support our business, meet the needs of our stakeholders and comply with laws and regulations.
This section contains an overview of our corporate governance structure and includes information required under the new Dutch Corporate Governance Code, effective January 1, 2017 (“Dutch Corporate Governance Code”).
Governance structureKoninklijke Ahold Delhaize N.V. (“the Company” or “Ahold Delhaize”) is a public company under Dutch law, structured to execute our strategy and to balance local, regional and global decision-making.
In 2019, our Company comprised a Global Support Office and four reportable segments: The United States, The Netherlands, Belgium, and Central and Southeastern Europe (CSE) – each of which are made up of a number of local brands. See also Note 6 to the consolidated financial statements. Starting in 2020, the segments The Netherlands, Belgium and Central and Southeastern Europe will be combined into one reporting segment, Europe, to align with the structure of the European organization under Wouter Kolk’s leadership.
Ahold Delhaize has a two-tier board structure with a Supervisory Board and Management Board that are accountable to our shareholders. Our Management Board has ultimate responsibility for the overall management of Ahold Delhaize. The Supervisory Board supervises and advises the Management Board.
The Executive Committee comprises our Management Board and other key officers of the Company, led by the Chief Executive Officer. The Executive Committee has been established to involve a broader leadership team in the decision-making process, to optimize strategic alignment and operational execution while having the flexibility to adapt to developments in the business and across the Company and the industry.
The diagram to the right shows Ahold Delhaize’s governance structure. A list of subsidiaries, joint ventures and associates is included in Note 37 to the consolidated financial statements.
Management Board and Executive CommitteeOur Management Board has the responsibility for the overall management of the Company and oversees corporate governance. It is also responsible for the actions and decisions of the Executive Committee, which manages our general affairs and ensures effective implementation of the strategy and achievement of the Company’s objectives.
The Management Board and Executive Committee together support our business, meet the needs of our stakeholders and ensure we comply with relevant rules and regulations. The members of the Executive Committee are sometimes invited to the meetings of the Supervisory Board by invitation of the Chairman of the Supervisory Board and attend the Supervisory Board committee meetings relevant to their respective functional responsibilities.
According to our Articles of Association, the Management Board must consist of at least three members.
Composition of the Management Board and Executive CommitteeThe current members of the Management Board are: Frans Muller, President and Chief Executive Officer; Jeff Carr, Chief Financial Officer; Kevin Holt, Chief Executive Officer Ahold Delhaize USA; and Wouter Kolk, Chief Executive Officer Europe and Indonesia. The current members of the Executive Committee are the members of the Management Board along with Abbe Luersman, Chief Human Resources Officer; Jan Ernst de Groot, Chief Legal Officer; Ben Wishart, Global Chief Information Officer; and Farhan Siddiqi, Chief Digital Officer.
For a more detailed description of the responsibilities of the Management Board and the Executive Committee, see the Rules of Procedure in the Governance section of Ahold Delhaize’s public website at www.aholddelhaize.com
Governance structure
Audit, Finance and Risk Committee
Governance and Nomination Committee
Remuneration Committee
Sustainability and Innovation Committee
General Meeting of Shareholders
Supervisory Board
Executive Committee
Management Board
The UnitedStates
The Netherlands
Europe
Central and Southeastern
EuropeBelgium
Financial statements Other informationStrategic Report Governance Financial performance AppendixGovernance RemunerationOur business Performance review Ahold Delhaize Annual Report 2019 78
Corporate governance
At the annual General Meeting of Shareholders on April 10, 2019, Frans Muller was reappointed by the Company’s shareholders for a term of four years ending on the day of the annual General Meeting of Shareholders in 2023. On September 9, 2019, it was announced that Jeff Carr informed the Company that he will not stand for another term as member of the Management Board. Natalie Knight will be nominated by the Supervisory Board to be appointed as a member of the Management Board at the annual General Meeting of Shareholders in April 2020.
At Ahold Delhaize, we believe that having a diverse and fully representative Management Board and Executive Committee contributes to well-balanced decision-making processes and the optimal functioning of both the Management Board and the Executive Committee. In accordance with provision 2.1.5 of the Dutch Corporate Governance Code, Ahold Delhaize’s diversity policy states that the composition of the Executive Committee and the Management Board and the combined experience and expertise of their members should reflect the profile of the Company as it relates to nationality, age, education, gender and professional background. At the same time, we aim for the best fit, in combination with the availability of qualified candidates.
At this moment, Ahold Delhaize has a Management Board in which all four members are male and an Executive Committee in which one member is female and seven members are male. The nomination of Natalie Knight as a new member of the Management Board serves as a next step in our process to continuously improve diversity in the Company. We recognize there is still room for improvement. In order to meet our diversity ambitions and comply with statutory guidelines for gender diversity in the coming years, we continue to work to ensure we build robust development and succession plans; generate diverse, balanced slates; and take the necessary actions to retain our current diverse talents so we can build our talent pipeline and drive greater diversity at all levels in our organization.
Appointment, suspension and dismissalThe General Meeting of Shareholders can appoint, suspend or dismiss a Management Board member by an absolute majority of votes cast, upon a proposal made by the Supervisory Board. If another party makes the proposal, an absolute majority of votes cast, representing at least one-third of the issued share capital, is required. If this qualified majority is not achieved, but an absolute majority of the votes exercised was in favor of the proposal, then a second meeting may be held. In the second meeting, only an absolute majority of votes exercised, regardless of the number of shares represented at the meeting, is required to adopt the proposal.
Management Board members are appointed for four-year terms and may be reappointed for additional terms not exceeding four years. The Supervisory Board may at any time suspend a Management Board member. The other members of the Executive Committee are appointed, suspended and dismissed by the Supervisory Board, at the proposal of the CEO.
RemunerationOn April 10, 2019, Ahold Delhaize’s General Meeting of Shareholders adopted the current remuneration policy for Management Board members.
You can find details of this policy in Remuneration. For detailed information on the individual remuneration of Management Board members, see Notes 32 and 33 to the consolidated financial statements.
Reappointment schedule Management Board
Name Date of first appointmentYear of possible
reappointment
Frans Muller March 14, 20161 2023Jeff Carr April 17, 2012 20202
Kevin Holt March 14, 20161 20203
Wouter Kolk April 11, 2018 2022
1 Effective July 24, 2016.2 On September 9, 2019, it was announced that Jeff Carr informed the Company that he will not stand for another term as member
of the Management Board.3 The Supervisory Board will nominate Kevin Holt for reappointment for an additional term of four years at the annual General
Meeting of Shareholders in April 2020.
EvaluationIn 2020, the Management Board and the Executive Committee conducted a self-assessment by means of a structured dialogue chaired by the CEO. Items that were assessed and discussed included diversity in relation to the composition of the Management Board and the Executive Committee, meeting processes and procedures, discussions and decision-making, and team dynamics. Findings and follow-up actions included the conclusion that, overall, the team functions in an open and constructive way and that there is a need to further improve meeting efficiency and the robustness of the decision-making process.
Supervisory BoardThe Supervisory Board is responsible for supervising and advising our Management Board and overseeing the general course of affairs, strategy, operational performance and corporate governance of the Company. The Supervisory Board is guided in its duties by the interests of the Company and the enterprise connected with the Company, taking into consideration the overall well-being of the enterprise and the relevant interests of all its stakeholders. The Supervisory Board is responsible for monitoring and assessing its own performance.
Financial statements Other informationStrategic Report Governance Financial performance AppendixGovernance RemunerationOur business Performance review Ahold Delhaize Annual Report 2019 79
Corporate governance
Ahold Delhaize’s Articles of Association require the approval of the Supervisory Board for certain major resolutions by the Management Board, including:
• Issuance of shares
• Acquisitions, repurchases of shares, and any reduction in issued and outstanding capital
• Allocation of duties within the Management Board and the adoption or amendment of the Rules of Procedure of the Management Board and the Executive Committee
• Significant changes in the identity or the nature of the Company or its enterprise
Appointment, suspension and dismissalThe General Meeting of Shareholders can appoint, suspend or dismiss a Supervisory Board member by an absolute majority of votes cast, upon a proposal made by the Supervisory Board. If another party makes the proposal, an absolute majority of votes cast, representing at least one-third of the issued share capital, is required. If this qualified majority is not achieved but an absolute majority of the votes exercised was in favor of the proposal, then a second meeting may be held. In the second meeting, only an absolute majority of votes exercised is required, regardless of the number of shares represented at the meeting.
A Supervisory Board member is appointed for a four-year term and may be reappointed for another four-year period. The Supervisory Board member may subsequently be reappointed for a period of two years, which may be extended by, at most, two years.
Conflict of interestA member of the Supervisory Board is required to immediately report any potential conflict of interest to the Chairman of the Supervisory Board and the other members of the Supervisory Board and provide them with all relevant information. Similarly, in the event of a potential conflict of interest concerning a member of the Management Board, he or she is required to immediately report this to the Chairman of the Supervisory Board and to the other members of the Management Board and provide them with all relevant information.
Should a conflict of interest arise, the Supervisory Board or the relevant Management Board member may not participate in the discussions and decision-making process on subjects or transactions relating to the conflict of interest.
We will record any such facts or transactions in the annual report for the relevant year, with reference to the conflict of interest and a confirmation that we have complied with best practice provisions 2.7.3 and 2.7.4 of the Dutch Corporate Governance Code. During 2019, no member of the Supervisory Board or the Management Board had a conflict of interest that was of material significance to the Company.
In addition, no transactions between the Company and legal or natural persons who hold at least 10% of the shares in the Company occurred in 2019, corresponding to the best practice provision 2.7.5 of the Code.
Shares and shareholders’ rightsGeneral Meeting of ShareholdersAhold Delhaize’s shareholders exercise their rights through annual and extraordinary General Meetings of Shareholders. The Company is required to convene an annual General Meeting of Shareholders in the Netherlands each year, no later than six months after the end of the Company’s financial year. Extraordinary General Meetings of Shareholders may be convened at any time by the Supervisory Board, the Management Board, or by one or more shareholders (and / or holders of depository receipts) representing at least 10% of the issued share capital.
The agenda for the annual General Meeting of Shareholders must contain certain matters as specified in Ahold Delhaize’s Articles of Association and under Dutch law, including the adoption of our annual financial statements. The General Meeting of Shareholders is also entitled to vote on important decisions regarding Ahold Delhaize’s identity or character, including major acquisitions and divestments.
Shareholders (and / or holders of depository receipts) are entitled to propose items for the agenda of the annual General Meeting of Shareholders provided that they hold at least 1% of the issued share capital or the shares or depository receipts that they hold represent a market value of at least €50 million. Proposals for agenda items for the annual General Meeting of Shareholders must be submitted at least 60 days prior to the date of the meeting.
Adoption of resolutionsSubject to certain exceptions provided by Dutch law or our Articles of Association, resolutions are passed by an absolute majority of votes cast without a requirement for a quorum.
Proposals submitted to the agenda by shareholders require an absolute majority of votes cast at the annual General Meeting of Shareholders representing at least one-third of the issued shares. If this qualified majority is not achieved but an absolute majority of the votes exercised was in favor of the proposal, then a second meeting may be held. In the second meeting, an absolute majority of votes exercised is required to adopt the proposal, regardless of the number of shares represented at the meeting (unless the law or our Articles of Association provide otherwise).
A resolution to dissolve the Company may be adopted by the annual General Meeting of Shareholders following a proposal of the Management Board made with the approval of the Supervisory Board. Any proposed resolution to wind up the Company must be disclosed in the notice calling the annual General Meeting of Shareholders at which that proposal is to be considered.
For a more detailed description of the responsibilities of the Management Board and the Executive Committee, see the Rules of Procedure in the Governance section of Ahold Delhaize’s public website at www.aholddelhaize.com
Financial statements Other informationStrategic Report Governance Financial performance AppendixGovernance RemunerationOur business Performance review Ahold Delhaize Annual Report 2019 80
Corporate governance
Voting rightsEach common share entitles its holder to cast one vote. Dutch law prescribes a record date to be set 28 days prior to the date of the annual General Meeting of Shareholders to determine whether a person may attend and exercise the rights relating to the annual General Meeting of Shareholders. Shareholders registered at that date are entitled to attend and to exercise their rights as shareholders in relation to the annual General Meeting of Shareholders, regardless of a sale of shares after the record date. Shareholders may be represented by written proxy.
We encourage participation in our General Meetings of Shareholders. We use J.P. Morgan Chase Bank N.A., the Depositary for the Company’s American Depositary Receipt (ADR) facility, to enable ADR holders to exercise their voting rights, which are represented by the common shares underlying the ADRs.
Neither Ahold Delhaize nor any of its subsidiaries may cast a vote on any share they hold in the Company. These shares are not taken into account for the purpose of determining how many shareholders are represented or how much of the share capital is represented at the General Meeting of Shareholders.
Repurchase and cancellation of cumulative preferred financing sharesOn April 10, 2019, the General Meeting of Shareholders authorized the Management Board to acquire all cumulative preferred financing shares in the Company. On May 10, 2019, the Company acquired all 223,415,103 cumulative preferred financing shares. The cumulative preferred financing shares were cancelled on July 16, 2019. The Stichting Administratiekantoor Preferente Financierings Aandelen was dissolved on January 17, 2020.
For further details on cumulative preferred financing shares, see Note 23 to the consolidated financial statements.
Cumulative preferred sharesIn March 1989, the Company entered into an agreement with the Dutch foundation Stichting Continuïteit Ahold Delhaize (SCAD, previously named Stichting Ahold Continuïteit), as amended and restated in April 1994, March 1997, December 2001, December 2003 and May 2018 (the “Option Agreement”). The Option Agreement was designed to, in accordance with the purpose of SCAD under its articles, potentially exercise influence in the event of a public offer or a potential change of control over the Company, to safeguard the interests of the Company and its stakeholders and to potentially avert, to the best of its ability, influences that might conflict with those interests by affecting the Company’s continuity, independence or identity.
Pursuant to the Option Agreement, SCAD has been granted an option to acquire cumulative preferred shares from the Company from time to time for no consideration.
SCAD and the members of its board are independent from the Company. As of February 25, 2020, the members of the board of SCAD are:
Name Year of possible reappointment
W.G. van Hassel, chairman Lawyer and former chairman of Dutch Bar AssociationG.H.N.L. van Woerkom Former chairman of Detailhandel NederlandJ. van den Belt Former CFO OcéB. Vree Former CEO APM Terminals Europe
For further details on Ahold Delhaize’s cumulative preferred shares, including restrictions on transfer, see Note 21 to the consolidated financial statements. The related documents are available on our public website at www.aholddelhaize.com.
Issuance of additional shares and preemptive rightsShares may be issued following a resolution by the General Meeting of Shareholders on a proposal of the Management Board made with the approval of the Supervisory Board. The General Meeting of Shareholders may resolve to delegate this authority to the Management Board for a period of time not exceeding five years. A resolution of the General Meeting of Shareholders to issue shares, or to authorize the Management Board to do so, is also subject to the approval of each class of shares whose rights would be adversely affected by the proposed issuance or delegation. On April 10, 2019, the General Meeting of Shareholders approved a delegation of this authority to the Management Board, relating to the issuance and / or granting of rights to acquire common shares up to a maximum of 10% of the issued share capital until and including October 10, 2020, and subject to the approval of the Supervisory Board.
Upon the issuance of new common shares, holders of Ahold Delhaize’s common shares have a preemptive right to subscribe to common shares in proportion to the total amount of their existing holdings of Ahold Delhaize’s common shares. According to the Company’s Articles of Association, this preemptive right does not apply to any issuance of shares to associates. The General Meeting of Shareholders may decide to restrict or exclude preemptive rights. The General Meeting of Shareholders may also resolve to designate the Management Board as the corporate body authorized to restrict or exclude preemptive rights for a period not exceeding five years.
On April 10, 2019, the General Meeting of Shareholders delegated to the Management Board, subject to the approval of the Supervisory Board, the authority to restrict or exclude the preemptive rights of holders of common shares upon the issuance of common shares and / or upon the granting of rights to subscribe for common shares until and including October 10, 2020.
Financial statements Other informationStrategic Report Governance Financial performance AppendixGovernance RemunerationOur business Performance review Ahold Delhaize Annual Report 2019 81
Corporate governance
Repurchase by Ahold Delhaize of its own sharesAhold Delhaize may only acquire fully paid-up shares of any class in its capital for consideration following authorization by the General Meeting of Shareholders and subject to the approval of the Supervisory Board and certain provisions of Dutch law and the Company’s Articles of Association, if:
1. Shareholders’ equity minus the payment required to make the acquisition is not less than the sum of paid-in and called-up capital and any reserves required by Dutch law or Ahold Delhaize’s Articles of Association; and
2. Ahold Delhaize and its subsidiaries would not, as a result, hold a number of shares exceeding a total nominal value of 10% of the issued share capital.
In line with the above, the Management Board has been authorized by the General Meeting of Shareholders on April 10, 2019, to acquire a number of shares in the Company. Such acquisition of shares, at the stock exchange or otherwise, will, for common shares, take place at a price between par value and 110% of the opening price of the shares at Euronext Amsterdam by NYSE Euronext on the date of their acquisition, provided that the Company and its subsidiaries will not hold more than 10% of the issued capital. Ahold Delhaize may acquire shares in its capital for no consideration or for the purpose of transferring these shares to associates through share plans or option plans, without authorization of the General Meeting of Shareholders. The share buyback program of €1 billion that started on January 2, 2019, was successfully completed on December 11, 2019. In total, 45,621,384 of the Company’s own shares were repurchased at an average price of €21.92 per share. On January 2, 2020, the Company commenced the €1 billion share buyback program that was announced on December 4, 2019. The program is expected to be completed before the end of 2020.
Major shareholdersAhold Delhaize is not directly or indirectly owned or controlled by another corporation or by any government. The Company does not know of any arrangements that may, at a subsequent date, result in a change of control, except as described under Cumulative preferred shares.
Articles of AssociationOur Articles of Association outline certain of the Company’s basic principles relating to corporate governance and organization. The current text of the Articles of Association is available at the Trade Register of the Chamber of Commerce and Industry for Amsterdam and on our public website at www.aholddelhaize.com.
The Articles of Association may be amended by the General Meeting of Shareholders. A resolution to amend the Articles of Association may be adopted by an absolute majority of the votes cast upon a proposal of the Management Board. If another party makes the proposal, an absolute majority of votes cast representing at least one-third of the issued share capital is required. If this qualified majority is not achieved but an absolute majority of the votes is in favor of the proposal, then a second meeting may be held. In the second meeting, only an absolute majority of votes, regardless of the number of shares represented at the meeting, is required.
The prior approval of a meeting of holders of a particular class of shares is required for a proposal to amend the Articles of Association that makes any change in the rights that vest in the holders of shares of that particular class.
Right of inquiryThe thresholds for shareholders to exercise the right of inquiry (“het enquêterecht”) are based on article 2:346 sub clause 1 under c of the Dutch Civil Code, regardless of the current nominal share capital of the Company. More information on the nominal value of shares can be found in Note 21 and Note 23 to the consolidated financial statements.
External independent auditorThe General Meeting of Shareholders appoints the external independent auditor. The Audit, Finance and Risk Committee recommends to the Supervisory Board the external independent auditor to be proposed for (re)appointment by the General Meeting of Shareholders. In addition, the Audit, Finance and Risk Committee evaluates and, where appropriate, recommends the replacement of the external independent auditor.
On April 10, 2019, the General Meeting of Shareholders appointed PricewaterhouseCoopers Accountants N.V. as external independent auditor for the Company for the financial year 2019.
Financial statements Other informationStrategic Report Governance Financial performance AppendixGovernance RemunerationOur business Performance review Ahold Delhaize Annual Report 2019 82
Corporate governance
Decree Article 10 EU Takeover DirectiveAccording to the Decree Article 10 EU Takeover Directive, we have to report on, among other things, our capital structure; restrictions on voting rights and the transfer of securities; significant shareholdings in Ahold Delhaize; the rules governing the appointment and dismissal of members of the Management Board and the Supervisory Board and the amendment of the Articles of Association; the powers of the Management Board (in particular the power to issue shares or to repurchase shares); significant agreements to which Ahold Delhaize is a party and which are put into effect, changed or dissolved upon a change of control of Ahold Delhaize following a takeover bid; and any agreements between Ahold Delhaize and the members of the Management Board or associates providing for compensation if their employment ceases because of a takeover bid.
The information required by the Decree Article 10 EU Takeover Directive is included in this Corporate governance section, in the Information about Ahold Delhaize shares section, as well as in the notes referred to in these sections or included in the description of any relevant contract.
Compliance with Dutch Corporate Governance CodeAhold Delhaize complies with the relevant principles and best practices of the Dutch Corporate Governance Code applicable to the Company in 2019, as reported in the Governance section. The Dutch Corporate Governance Code can be found at www.mccg.nl.
At the Extraordinary General Meeting of Shareholders on March 3, 2004, our shareholders consented to apply the Dutch Corporate Governance Code. Ahold Delhaize continues to seek ways to improve its corporate governance, including by measuring itself against international best practice.
Corporate Governance statementThe Dutch Corporate Governance Code requires companies to publish a statement concerning their approach to corporate governance and compliance with the Code. This is referred to in article 2a of the decree on additional requirements for management reports “Besluit inhoud bestuursverslag” last amended on January 1, 2018 (the “Decree”). The information required to be included in this corporate governance statement as described in articles 3, 3a and 3b of the Decree, which are incorporated and repeated here by reference, can be found in the following sections of this Annual Report:
• The information concerning compliance with the Dutch Corporate Governance Code, as required by article 3 of the Decree, can be found in the section Compliance with the Dutch Corporate Governance Code.
• The information concerning Ahold Delhaize’s diversity policy, as required by article 3a sub d of the Decree, can be found in the Management Board and Executive Committee and Supervisory Board sections of Corporate governance as well as in the Supervisory Board report.
• The information concerning Ahold Delhaize’s risk management and control frameworks relating to the financial reporting process, as required by article 3a sub a of the Decree, can be found in the relevant section under How we manage risk.
• The information regarding the functioning of Ahold Delhaize’s General Meeting of Shareholders and the authority and rights of our shareholders, as required by article 3a sub b of the Decree, can be found in the relevant sections under Shares and shareholders’ rights.
• The information regarding the composition and functioning of Ahold Delhaize’s Management Board, Executive Committee and Supervisory Board and its committees, as required by article 3a sub c of the Decree, can be found in the Management Board and Executive Committee and Supervisory Board sections included in Corporate governance as well as in the Supervisory Board report.
• The information concerning the inclusion of the information required by the Decree Article 10 EU Takeover Directive, as required by article 3b of the Decree, can be found in the section Decree Article 10 EU Takeover Directive.
Financial statements Other informationStrategic Report Governance Financial performance AppendixGovernance RemunerationOur business Performance review Ahold Delhaize Annual Report 2019 83
Jan HommenChairman of the Supervisory Board
Letter from the Supervisory Board Chairman
The Company continued to evolve its governance during 2019. In a period of only three years’ time, five members of the Supervisory Board are retiring and need to be replaced. In 2019, we welcomed two new members to the Supervisory Board, Katie Doyle and Peter Agnefjäll. And, in 2020, we are proposing another two new members to the Board, Helen Weir and Frank van Zanten, for approval by shareholders at the annual General Meeting of Shareholders in April. At that same meeting, Jacques de Vaucleroy will retire from the Board after many years of distinguished service to our Supervisory Board and our Company. We are also pleased to be nominating Natalie Knight to become CFO and new member of the Management Board.
At the same time, we thank Jeff Carr for his significant contributions to the Company and his continued partnership in helping shape Ahold Delhaize, drive our Save for Our Customers program and deliver on our commitments. We are also pleased to nominate Kevin Holt for an extension of his term as Management Board member given his strong tenure as CEO of Ahold Delhaize USA.
During the year, we saw continued discussion in society on a number of broader topics, such as executive remuneration and wages, diversity, climate change, technological and digital developments impacting the workforce and the role companies can and need to play to address these topics. Our Innovation & Sustainability Committee, in which all Board members participate, is very much involved in these topics. We have stepped up the non-financial targets for management in these areas going forward.
The Supervisory Board’s relationship with the Management Board and Executive Committee is open and transparent. Detailed information on strategic and operational performance is available and is discussed in a constructive, but critical, dialogue.
From time to time, small delegations of the Supervisory Board pay visits to the brands to better understand performance and the strategic choices that are made locally. These visits also provide an excellent first-hand view of local management and talent. In 2019, visits were made to Greece, Romania and a number of the U.S. brands.
We are pleased to report that 2019 was a successful year, which makes us comfortable that the Company is on track with its Leading Together strategy.
We thank the members of the Management Board and the Executive Committee and all associates across the Company for their commitment and support.
You can find more details on our 2019 focus areas, meetings and other governance-related topics in this Supervisory Board report.
On behalf of the Supervisory Board,
Jan Hommen
Significant investments were made in omnichannel retail solutions, supporting double-digit growth in online sales, and in making supply chain management in the United States more efficient. Both are examples of the Company’s commitment to invest with a view to the long term.
The rapidly changing environment in consumer behavior, together with massive technological changes, requires that, as a Supervisory Board, we constantly review the strategic risks of our Company, including the business models used to bring our products to market. Risk reviews also include the safety of our operations. The tragic road accident in Romania, that took the lives of eight associates and seriously wounded another seven, while they were on their way to work, more than supports the importance of this.
Dear shareholder,
I am pleased to present our Supervisory Board report for 2019.
2019 was the first full year Ahold Delhaize worked on the implementation of its Leading Together strategy and the five strategic growth drivers that help the Company to create sustainable long-term value for all its stakeholders.
Financial statements Other informationStrategic Report Governance Financial performance AppendixGovernance RemunerationOur business Performance review Ahold Delhaize Annual Report 2019 84
Supervisory Board report
Composition of the Supervisory BoardAhold Delhaize’s Supervisory Board determines the number of its members. The Supervisory Board profile is published on Ahold Delhaize’s public website at www.aholddelhaize.com and is updated regularly.
In accordance with provision 2.1.5 of the Dutch Corporate Governance Code, Ahold Delhaize’s diversity policy states that the composition of the Supervisory Board and the combined experience and expertise of its members should reflect the profile of the Company as it relates to nationality, age, education, gender and professional background. In addition, the composition of the Board, including its members’ combined experience, expertise and independence, should reflect the best fit for Ahold Delhaize’s profile and strategy. Three members of Ahold Delhaize’s Supervisory Board are female and six members are male. Currently we are satisfied with the size of our Board, and we will continue to look for improvement in our diversity, which will remain a key aspect in the selection process for new Supervisory Board members.
Rules of ProcedureThe Rules of Procedure of the Supervisory Board state that if a member is concurrently a member of another company’s supervisory board, the main duties arising from and / or the number and nature of any other supervisory board memberships must not conflict or interfere with that individual’s duties as a member of Ahold Delhaize’s Supervisory Board.
Appointments and other changesAfter the annual General Meeting of Shareholders on April 10, 2019, Rob van den Bergh and Mark McGrath stepped down from the Supervisory Board and were succeeded by Katie Doyle and Peter Agnefjäll, who were appointed by our shareholders during the same meeting.
Ongoing educationAs part of its ongoing education, the Supervisory Board attended several deep dives on various topics to enable its members to gain greater insight into Ahold Delhaize’s key priorities. In addition, the Supervisory Board attended a workshop focusing on the specific risks associated with the digital and omnichannel ambitions of the Company.
For our new members, Katie Doyle and Peter Agnefjäll, a multiple-day induction program was organized at our businesses in the U.S. and the Netherlands as well as at the Global Support Office in Zaandam. As part of the onboarding program, the two new members were briefed on their responsibilities and informed by senior management on the financial, commercial, technological, digital, social, sustainability, human resources, governance, legal and reporting affairs of our Company and its businesses. In addition, the new members visited the brands in Greece and Romania and several brands in the U.S.
EvaluationThe Supervisory Board conducted a self-assessment in early 2020. The Board assessed its own performance as well as the performance of its committees and its individual members. The performance of the Management Board and its individual members was also assessed during a private meeting.
Overall, the Supervisory Board was positive about its functioning. The Board has an open and constructive relationship with the Management Board. The Supervisory Board paid special attention to its composition and succession and concluded that searches for new members should focus on financial skills and eCommerce and leadership experience.
Financial statements Other informationStrategic Report Governance Financial performance AppendixGovernance RemunerationOur business Performance review Ahold Delhaize Annual Report 2019 85
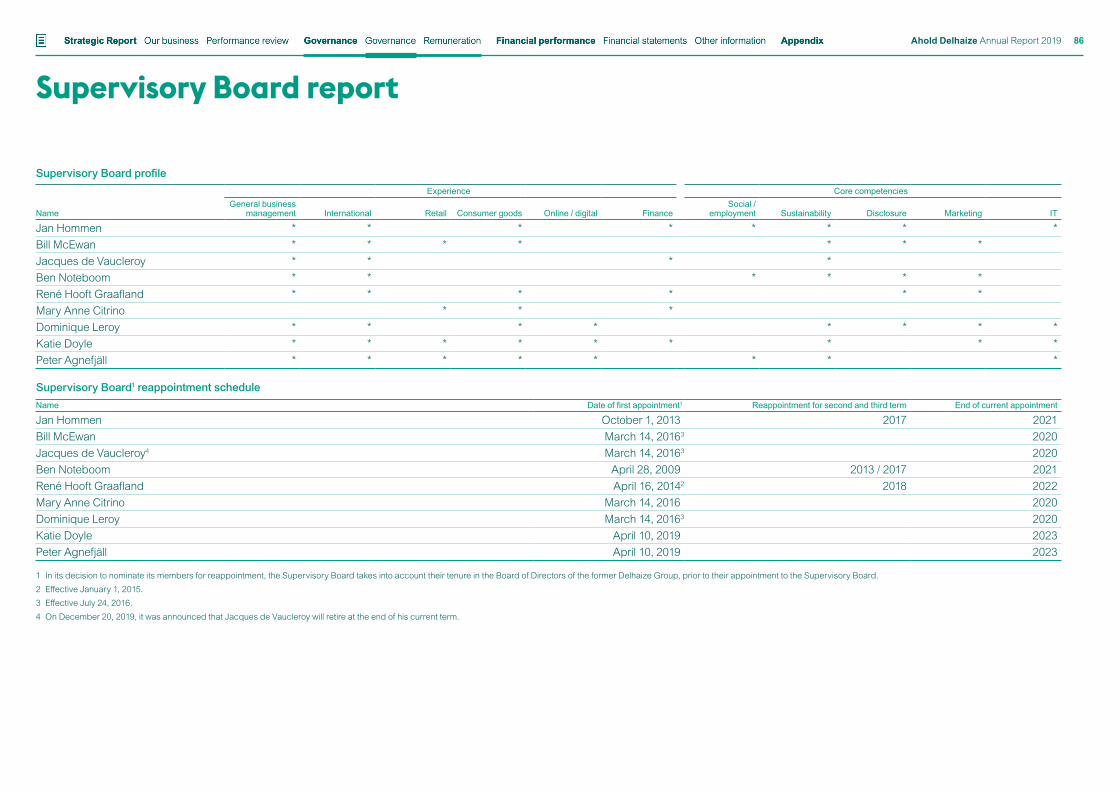
Supervisory Board report
Supervisory Board profileExperience Core competencies
NameGeneral business
management International Retail Consumer goods Online / digital FinanceSocial /
employment Sustainability Disclosure Marketing IT
Jan Hommen * * * * * * * *Bill McEwan * * * * * * *Jacques de Vaucleroy * * * *Ben Noteboom * * * * * *René Hooft Graafland * * * * * *Mary Anne Citrino * * *Dominique Leroy * * * * * * * *Katie Doyle * * * * * * * * *Peter Agnefjäll * * * * * * * *
Supervisory Board1 reappointment schedule Name Date of first appointment1 Reappointment for second and third term End of current appointment
Jan Hommen October 1, 2013 2017 2021Bill McEwan March 14, 20163 2020Jacques de Vaucleroy4 March 14, 20163 2020Ben Noteboom April 28, 2009 2013 / 2017 2021René Hooft Graafland April 16, 20142 2018 2022Mary Anne Citrino March 14, 2016 2020Dominique Leroy March 14, 20163 2020Katie Doyle April 10, 2019 2023Peter Agnefjäll April 10, 2019 2023
1 In its decision to nominate its members for reappointment, the Supervisory Board takes into account their tenure in the Board of Directors of the former Delhaize Group, prior to their appointment to the Supervisory Board.2 Effective January 1, 2015.3 Effective July 24, 2016.4 On December 20, 2019, it was announced that Jacques de Vaucleroy will retire at the end of his current term.
Financial statements Other informationStrategic Report Governance Financial performance AppendixGovernance RemunerationOur business Performance review Ahold Delhaize Annual Report 2019 86
Supervisory Board report
Supervisory Board engagementDuring 2019, 10 Supervisory Board meetings took place. Five of these meetings were held in person in Europe and the United States and five by means of a conference call. The Management Board attended these meetings and the other members of the Executive Committee, as well as other senior management, were regularly invited to be present.
The Supervisory Board held several private meetings without other attendees to independently review certain issues and to discuss matters related to the functioning of the Management Board, Executive Committee and Supervisory Board itself. The Supervisory Board also held several private meetings with only the CEO present, to obtain his view on certain matters and discuss the functioning of the members of the Management Board and Executive Committee. The external independent auditor attended the meeting of February 25, 2019, at which the 2018 Annual Report and financial statements were recommended for adoption by the annual General Meeting of Shareholders. The external independent auditor also attended the quarterly meetings, at which the financial results were discussed.
In addition, the Chairman and the CEO held regular one-to-one meetings to discuss progress and key topics.
During its meetings throughout the year, the Supervisory Board reviewed reports from its various committees and regularly evaluated the Company’s progress on its Leading Together strategy, talent management and succession planning. The Board members had regular contact with associates in various levels of management to ensure that the Supervisory Board remained well-informed about the Company’s operations.
The Company organized a trip for four Board members to visit the Alfa Beta brand in Greece and the Maxi brand in Romania and another trip for five Board members to visit the Food Lion and Giant/Martin’s brands and the RBS support organization in the U.S. During these trips, the Board members met with senior management of the local brands and visited their local operations and stores.
• January 2019: The Supervisory Board held a conference call to discuss and approve Ahold Delhaize’s Q4 / full year 2018 trading statement and to start preparations for the upcoming annual General Meeting of Shareholders.
• February 2019: During a two-day meeting, the Supervisory Board discussed and approved Ahold Delhaize’s Q4 / full year 2018 results, as well as the Annual Report 2018. In addition, the Supervisory Board approved the dividend proposal. During the same meeting, the agenda and explanatory notes for the April 2019 annual General Meeting of Shareholders were approved. On the recommendation of the Remuneration Committee, the Supervisory Board resolved to approve the 2018 Executive Committee Incentive Plan Payout, in addition to the salary review and salary adjustment of the Executive Committee members. In addition, the Supervisory Board reviewed and approved the updated Rules of Procedure for the Management Board and the Executive Committee as well as the Rules of Procedure for the Supervisory Board. Lastly, the Supervisory Board was updated on specific IT projects, the IFRS 16 “Leases” implementation, post-investment reviews and significant litigation with potential impact on the Company.
• April 2019: During a two-day meeting, the Supervisory Board received an extensive update on the performance, risks and opportunities of the brands in Europe and the United States and discussed the upcoming annual General Meeting of Shareholders. The Supervisory Board approved issuing a sustainability bond.
• May 2019: During a conference call, the Supervisory Board reflected on the Stop & Shop strike (including the learnings gained) and the update on the financial guidance following the strike. The Board also discussed and approved the Q1 2019 Interim Report. In addition, the Supervisory Board discussed reports from the external independent auditor and internal auditor as well as the internal control report and the governance, risk management and compliance report.
• June 2019: During a three-day meeting, the Supervisory Board visited Peapod Digital Labs in Chicago. The Supervisory Board performed a review of the Company’s portfolio strategy in view of the “portfolio and scale efficiencies” growth driver. The Board reviewed the Peapod Digital Labs’ strategy and the way it supports the brands in the United States. The Peapod Digital Labs leadership team, along with a number of talents across the Company, presented demos of initiatives in the digital domain. Lastly, the Supervisory Board received an update on the Peapod brand and visited several retail chains offering interesting omnichannel experiences.
• August 2019: The Q2 2019 Interim Report was presented to and subsequently approved by the Supervisory Board. The Board discussed and approved the interim dividend pay out.
• September 2019: The Supervisory Board held a three-day meeting in which it received status updates on Stop & Shop, Giant Food and IT. The Board discussed the report from the Governance & Nomination Committee on the Company’s talent pipeline and the succession tables for the brand presidents. The Board also reviewed progress on the five strategic growth drivers. During the last day of the meeting, the Board visited several stores of the Giant Food brand as well as the competition.
• November 2019: During a two-day meeting, the Supervisory Board approved the Q3 2019 interim results, together with the Company’s annual budget plan for 2020 and the plan for 2021-2022. In addition, the Supervisory Board discussed reports from the external independent auditor and internal auditor as well as the internal control report and the governance, risk management and compliance report. The Board discussed the digital strategy and the digital organization’s new operating model. Lastly, the Board approved Ahold Delhaize USA’s investment in its supply chain to create a fully integrated self-distribution model.
• December 2019: During a call, the Supervisory Board and the Management Board reflected on the past year and approved several investment proposals.
Financial statements Other informationStrategic Report Governance Financial performance AppendixGovernance RemunerationOur business Performance review Ahold Delhaize Annual Report 2019 87
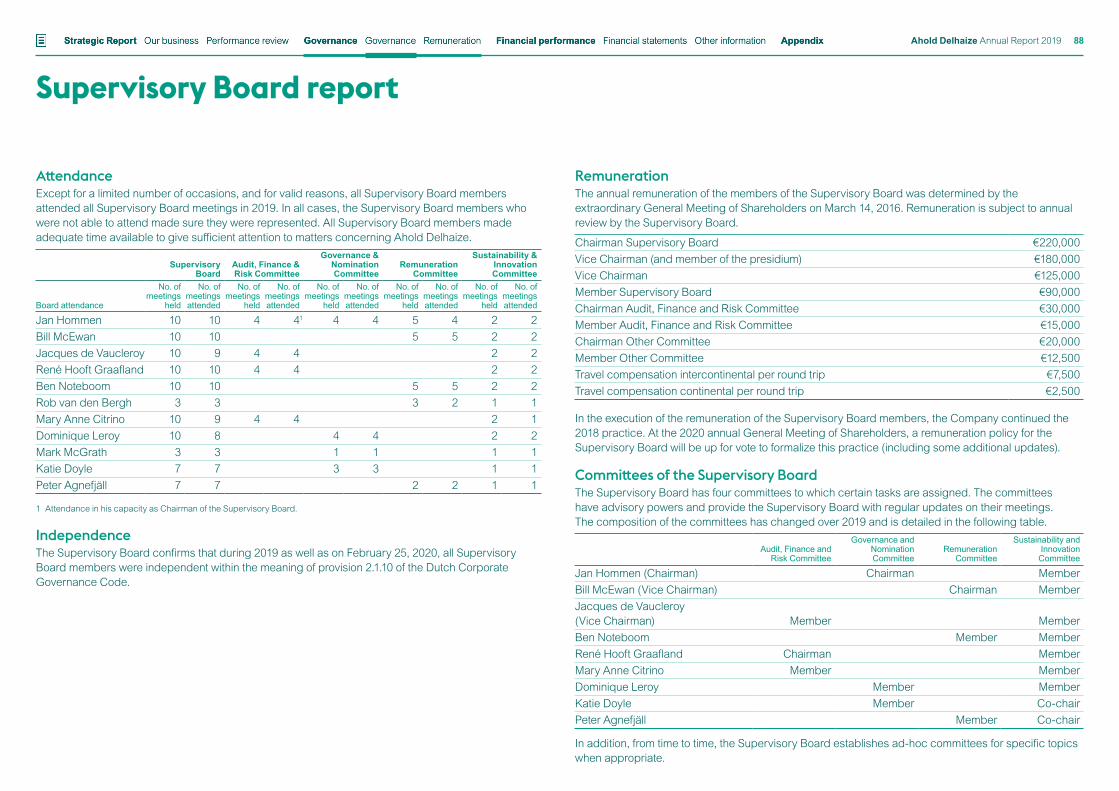
Supervisory Board report
AttendanceExcept for a limited number of occasions, and for valid reasons, all Supervisory Board members attended all Supervisory Board meetings in 2019. In all cases, the Supervisory Board members who were not able to attend made sure they were represented. All Supervisory Board members made adequate time available to give sufficient attention to matters concerning Ahold Delhaize.
Supervisory Board
Audit, Finance & Risk Committee
Governance & Nomination Committee
Remuneration Committee
Sustainability & Innovation Committee
Board attendance
No. of meetings
held
No. of meetings attended
No. of meetings
held
No. of meetings attended
No. of meetings
held
No. of meetings attended
No. of meetings
held
No. of meetings attended
No. of meetings
held
No. of meetings attended
Jan Hommen 10 10 4 41 4 4 5 4 2 2Bill McEwan 10 10 5 5 2 2Jacques de Vaucleroy 10 9 4 4 2 2René Hooft Graafland 10 10 4 4 2 2Ben Noteboom 10 10 5 5 2 2Rob van den Bergh 3 3 3 2 1 1Mary Anne Citrino 10 9 4 4 2 1Dominique Leroy 10 8 4 4 2 2Mark McGrath 3 3 1 1 1 1Katie Doyle 7 7 3 3 1 1Peter Agnefjäll 7 7 2 2 1 1
1 Attendance in his capacity as Chairman of the Supervisory Board.
IndependenceThe Supervisory Board confirms that during 2019 as well as on February 25, 2020, all Supervisory Board members were independent within the meaning of provision 2.1.10 of the Dutch Corporate Governance Code.
RemunerationThe annual remuneration of the members of the Supervisory Board was determined by the extraordinary General Meeting of Shareholders on March 14, 2016. Remuneration is subject to annual review by the Supervisory Board.
Chairman Supervisory Board €220,000Vice Chairman (and member of the presidium) €180,000Vice Chairman €125,000Member Supervisory Board €90,000Chairman Audit, Finance and Risk Committee €30,000Member Audit, Finance and Risk Committee €15,000Chairman Other Committee €20,000Member Other Committee €12,500Travel compensation intercontinental per round trip €7,500Travel compensation continental per round trip €2,500
In the execution of the remuneration of the Supervisory Board members, the Company continued the 2018 practice. At the 2020 annual General Meeting of Shareholders, a remuneration policy for the Supervisory Board will be up for vote to formalize this practice (including some additional updates).
Committees of the Supervisory BoardThe Supervisory Board has four committees to which certain tasks are assigned. The committees have advisory powers and provide the Supervisory Board with regular updates on their meetings. The composition of the committees has changed over 2019 and is detailed in the following table.
Audit, Finance and Risk Committee
Governance and Nomination Committee
Remuneration Committee
Sustainability and Innovation
Committee
Jan Hommen (Chairman) Chairman MemberBill McEwan (Vice Chairman) Chairman MemberJacques de Vaucleroy (Vice Chairman) Member MemberBen Noteboom Member MemberRené Hooft Graafland Chairman MemberMary Anne Citrino Member MemberDominique Leroy Member MemberKatie Doyle Member Co-chairPeter Agnefjäll Member Co-chair
In addition, from time to time, the Supervisory Board establishes ad-hoc committees for specific topics when appropriate.
Financial statements Other informationStrategic Report Governance Financial performance AppendixGovernance RemunerationOur business Performance review Ahold Delhaize Annual Report 2019 88
Supervisory Board report
Audit, Finance and Risk CommitteeThe Audit, Finance and Risk Committee assists the Supervisory Board in its responsibility to oversee Ahold Delhaize’s financing, financial statements, financial reporting process and system of internal business controls and risk management. The Chief Executive Officer, Chief Financial Officer, Chief Legal Officer, Senior Vice President Internal Audit, Senior Vice President Tax and Accounting and representatives of the external independent auditor are invited to, and attend, the Audit, Finance and Risk Committee meetings.
The Audit, Finance and Risk Committee determines how the external independent auditor should be involved in the content and publication of financial reports other than the financial statements. The Management Board and the Audit, Finance and Risk Committee report to the Supervisory Board annually on their cooperation with the external independent auditor, including the auditor’s independence. The Supervisory Board takes these reports into account when deciding on the nomination for the appointment of an external independent auditor that is submitted to the General Meeting of Shareholders.
In 2019, the Audit, Finance and Risk Committee held two meetings in person and two by means of a conference call. The attendance rate of the Board members of this Committee was 100%. Throughout the year, the Audit, Finance and Risk Committee closely monitored the financial closing process and reviewed the publication of quarterly results. Updates on internal controls were provided during all Committee meetings. The Audit, Finance and Risk Committee was informed regularly on compliance and reviewed and received regular updates on fraud and health and safety (including fatalities).
The Audit, Finance and Risk Committee also discussed items including:
• Quarterly interim reports
• Ahold Delhaize’s 2018 Annual Report including the financial statements
• Review and approval of the internal audit plan
• Management report on internal controls over financial reporting
• The findings in the internal audit letters and the external independent auditor’s findings in relation to the internal controls over financial reporting
• The Company’s finance structure
• IFRS 16 “Leases”, the implementation of the new lease accounting standard
• Quarterly internal control report and the governance risk and compliance report
• Treasury
• Taxation, including being a responsible tax payer
• Guarantees
• Self-insurance programs
• Recognition of vendor allowances
• Impairment testing of goodwill
• Associate benefits (including pensions and multi-employer pension plans) measurement and disclosure
• Appointment of the external independent auditor
• Cyber security
• Compliance, fraud, ethics and safety matters
• Sustainability reporting
The Audit, Finance and Risk Committee and the Chairman of the Audit, Finance and Risk Committee also held private meetings together with the Chief Financial Officer, the Senior Vice President Internal Audit and the external independent auditor.
The Supervisory Board has determined that René Hooft Graafland, Mary Anne Citrino and Jacques de Vaucleroy are “Audit Committee Financial Experts” within the meaning of the Dutch Corporate Governance Code, provision 2.1.4.
Financial statements Other informationStrategic Report Governance Financial performance AppendixGovernance RemunerationOur business Performance review Ahold Delhaize Annual Report 2019 89
Supervisory Board report
Governance and Nomination CommitteeIn 2019, the Governance and Nomination Committee held four meetings in person, all of which the Chief Executive Officer and the Chief HR Officer were invited to attend. The attendance rate of the Board members of this Committee was 100%. The Committee focused on the Company’s talent pipeline and the succession tables for the brand presidents as well as the associate engagement survey. The status of the Company’s diversity ambitions and plans was discussed, as well as the expected impact of technological and digital developments on our workforce. The Committee evaluated the performance of the Supervisory Board and the Executive Committee. The Committee led the search process for a successor for Jeff Carr, resulting in the nomination of Natalie Knight as new member of the Management Board. The Committee proposed to the Supervisory Board to nominate Kevin Holt for reappointment as member of the Management Board. The Committee was also involved in key organizational and management changes, as well as other governance matters.
The Committee led the search for new Supervisory Board members. At the upcoming annual General Meeting of Shareholders in April, two new members, Helen Weir and Frank van Zanten, will be proposed to the Supervisory Board for approval by shareholders.
Remuneration CommitteeIn 2019, the Remuneration Committee held four meetings in person and one by means of a conference call, all of which the Chief Executive Officer and the Chief HR Officer were invited to attend. The attendance rate of the Board members of this Committee was 93%. The Committee’s main area of focus was the implementation of the Shareholder Rights Directive and the remuneration packages for Natalie Knight and Kevin Holt. As a result of the Shareholder Rights Directive, the Committee prepared a proposal for the Supervisory Board for a Supervisory Board Remuneration Policy and a supplement to the Remuneration Policy for the Management Board. Lastly, the Committee reviewed options to increase the level of transparency with respect to the disclosure of our performance measures in the short- and long-term incentive programs.
See Remuneration for more information on our remuneration policy, which aims to help us attract, motivate and retain the best-qualified workforce, in a cost-effective way.
Sustainability and Innovation CommitteeDuring the course of 2019, the Sustainability and Innovation Committee held two meetings in person, both of which the Chief Executive Officer was invited to attend. The attendance rate of the Board members of this Committee was 94%. During the first meeting, the Committee received an update on the Sustainable Retailing 2018 results and targets for 2019, as well as an update on the latest developments on digital in Europe and the United States. During its second meeting, the Committee focused on how the Company can help customers and associates to make healthier choices.
ConclusionThe Supervisory Board is of the opinion that during the year 2019, its composition, mix and depth of available expertise, working processes, level and frequency of engagement across all prominent Company activities, and access to all necessary and relevant information and the Company’s management and staff were satisfactory and enabled it to carry out its duties towards all of the Company’s stakeholders.
The Supervisory Board would like to thank Rob van den Bergh and Mark McGrath for their outstanding contributions to the Supervisory Board and to the Company.
The Supervisory Board would also like to thank Ahold Delhaize’s shareholders for their continued support and trust in the Company, its strategy and its management team. Finally, the Board would like to express its gratitude for the continued hard work and commitment of the Management Board and all associates during 2019.
Supervisory Board Zaandam, the NetherlandsFebruary 25, 2020
Financial statements Other informationStrategic Report Governance Financial performance AppendixGovernance RemunerationOur business Performance review Ahold Delhaize Annual Report 2019 90
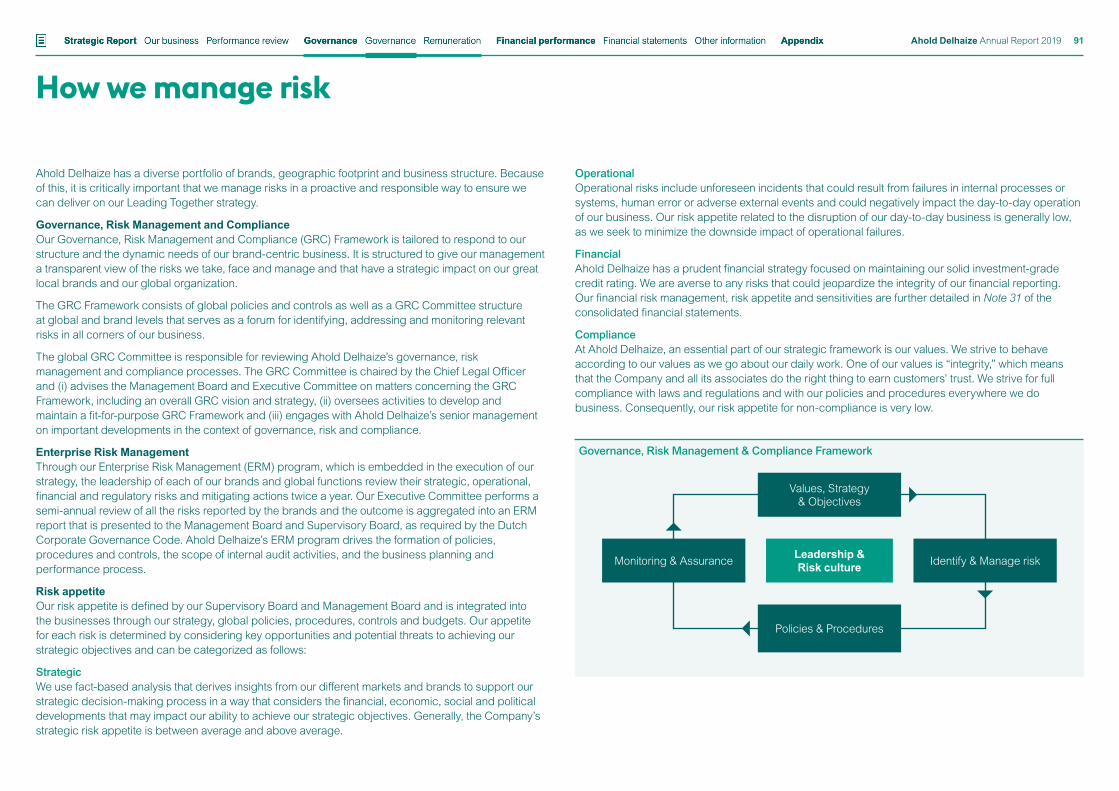
How we manage risk
Ahold Delhaize has a diverse portfolio of brands, geographic footprint and business structure. Because of this, it is critically important that we manage risks in a proactive and responsible way to ensure we can deliver on our Leading Together strategy.
Governance, Risk Management and ComplianceOur Governance, Risk Management and Compliance (GRC) Framework is tailored to respond to our structure and the dynamic needs of our brand-centric business. It is structured to give our management a transparent view of the risks we take, face and manage and that have a strategic impact on our great local brands and our global organization.
The GRC Framework consists of global policies and controls as well as a GRC Committee structure at global and brand levels that serves as a forum for identifying, addressing and monitoring relevant risks in all corners of our business.
The global GRC Committee is responsible for reviewing Ahold Delhaize’s governance, risk management and compliance processes. The GRC Committee is chaired by the Chief Legal Officer and (i) advises the Management Board and Executive Committee on matters concerning the GRC Framework, including an overall GRC vision and strategy, (ii) oversees activities to develop and maintain a fit-for-purpose GRC Framework and (iii) engages with Ahold Delhaize’s senior management on important developments in the context of governance, risk and compliance.
Enterprise Risk ManagementThrough our Enterprise Risk Management (ERM) program, which is embedded in the execution of our strategy, the leadership of each of our brands and global functions review their strategic, operational, financial and regulatory risks and mitigating actions twice a year. Our Executive Committee performs a semi-annual review of all the risks reported by the brands and the outcome is aggregated into an ERM report that is presented to the Management Board and Supervisory Board, as required by the Dutch Corporate Governance Code. Ahold Delhaize’s ERM program drives the formation of policies, procedures and controls, the scope of internal audit activities, and the business planning and performance process.
Risk appetiteOur risk appetite is defined by our Supervisory Board and Management Board and is integrated into the businesses through our strategy, global policies, procedures, controls and budgets. Our appetite for each risk is determined by considering key opportunities and potential threats to achieving our strategic objectives and can be categorized as follows:
StrategicWe use fact-based analysis that derives insights from our different markets and brands to support our strategic decision-making process in a way that considers the financial, economic, social and political developments that may impact our ability to achieve our strategic objectives. Generally, the Company’s strategic risk appetite is between average and above average.
OperationalOperational risks include unforeseen incidents that could result from failures in internal processes or systems, human error or adverse external events and could negatively impact the day-to-day operation of our business. Our risk appetite related to the disruption of our day-to-day business is generally low, as we seek to minimize the downside impact of operational failures.
FinancialAhold Delhaize has a prudent financial strategy focused on maintaining our solid investment-grade credit rating. We are averse to any risks that could jeopardize the integrity of our financial reporting. Our financial risk management, risk appetite and sensitivities are further detailed in Note 31 of the consolidated financial statements.
ComplianceAt Ahold Delhaize, an essential part of our strategic framework is our values. We strive to behave according to our values as we go about our daily work. One of our values is “integrity,” which means that the Company and all its associates do the right thing to earn customers’ trust. We strive for full compliance with laws and regulations and with our policies and procedures everywhere we do business. Consequently, our risk appetite for non-compliance is very low.
Governance, Risk Management & Compliance Framework
Leadership & Risk culture
Policies & Procedures
Values, Strategy & Objectives
Identify & Manage riskMonitoring & Assurance
Financial statements Other informationStrategic Report Governance Financial performance AppendixGovernance RemunerationOur business Performance review Ahold Delhaize Annual Report 2019 91
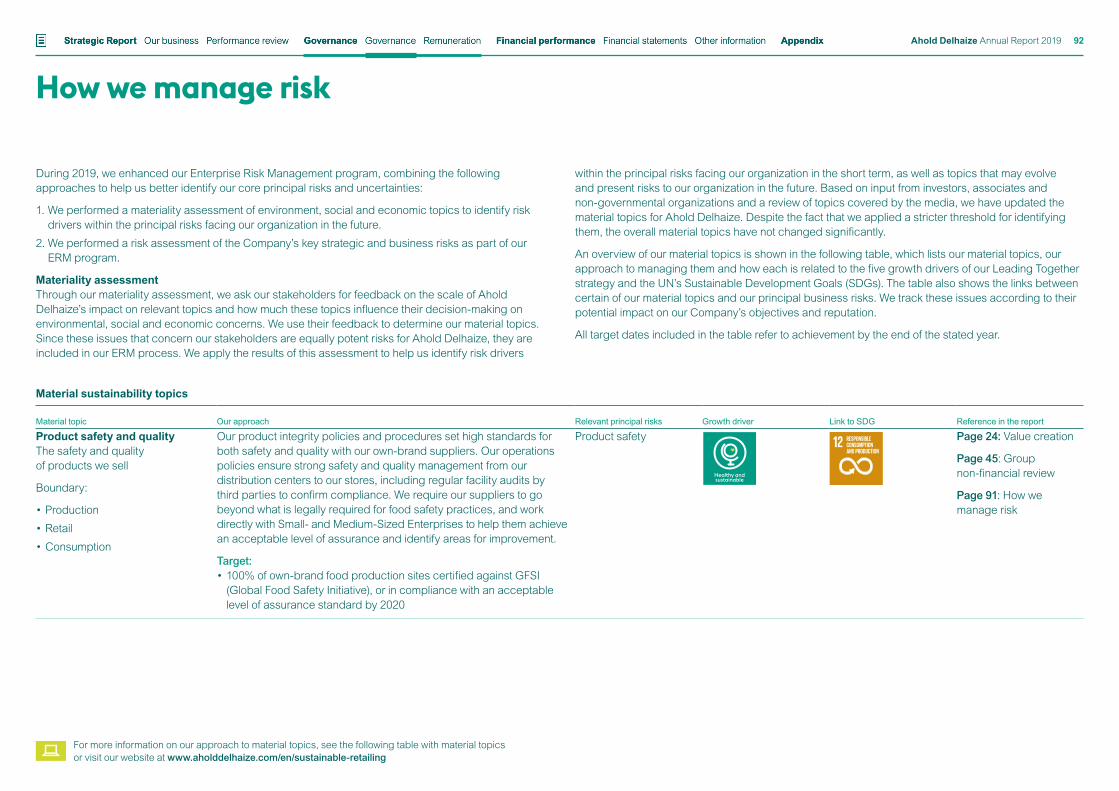
How we manage risk
For more information on our approach to material topics, see the following table with material topics or visit our website at www.aholddelhaize.com/en/sustainable-retailing
Material sustainability topics
Material topic Our approach Relevant principal risks Growth driver Link to SDG Reference in the report
Product safety and qualityThe safety and quality of products we sell
Boundary:
• Production
• Retail
• Consumption
Our product integrity policies and procedures set high standards for both safety and quality with our own-brand suppliers. Our operations policies ensure strong safety and quality management from our distribution centers to our stores, including regular facility audits by third parties to confirm compliance. We require our suppliers to go beyond what is legally required for food safety practices, and work directly with Small- and Medium-Sized Enterprises to help them achieve an acceptable level of assurance and identify areas for improvement.
Target: • 100% of own-brand food production sites certified against GFSI
(Global Food Safety Initiative), or in compliance with an acceptable level of assurance standard by 2020
Product safety Page 24: Value creation
Page 45: Group non-financial review
Page 91: How we manage risk
Healthy and sustainable
During 2019, we enhanced our Enterprise Risk Management program, combining the following approaches to help us better identify our core principal risks and uncertainties:
1. We performed a materiality assessment of environment, social and economic topics to identify risk drivers within the principal risks facing our organization in the future.
2. We performed a risk assessment of the Company’s key strategic and business risks as part of our ERM program.
Materiality assessmentThrough our materiality assessment, we ask our stakeholders for feedback on the scale of Ahold Delhaize’s impact on relevant topics and how much these topics influence their decision-making on environmental, social and economic concerns. We use their feedback to determine our material topics. Since these issues that concern our stakeholders are equally potent risks for Ahold Delhaize, they are included in our ERM process. We apply the results of this assessment to help us identify risk drivers
within the principal risks facing our organization in the short term, as well as topics that may evolve and present risks to our organization in the future. Based on input from investors, associates and non-governmental organizations and a review of topics covered by the media, we have updated the material topics for Ahold Delhaize. Despite the fact that we applied a stricter threshold for identifying them, the overall material topics have not changed significantly.
An overview of our material topics is shown in the following table, which lists our material topics, our approach to managing them and how each is related to the five growth drivers of our Leading Together strategy and the UN’s Sustainable Development Goals (SDGs). The table also shows the links between certain of our material topics and our principal business risks. We track these issues according to their potential impact on our Company’s objectives and reputation.
All target dates included in the table refer to achievement by the end of the stated year.
Financial statements Other informationStrategic Report Governance Financial performance AppendixGovernance RemunerationOur business Performance review Ahold Delhaize Annual Report 2019 92
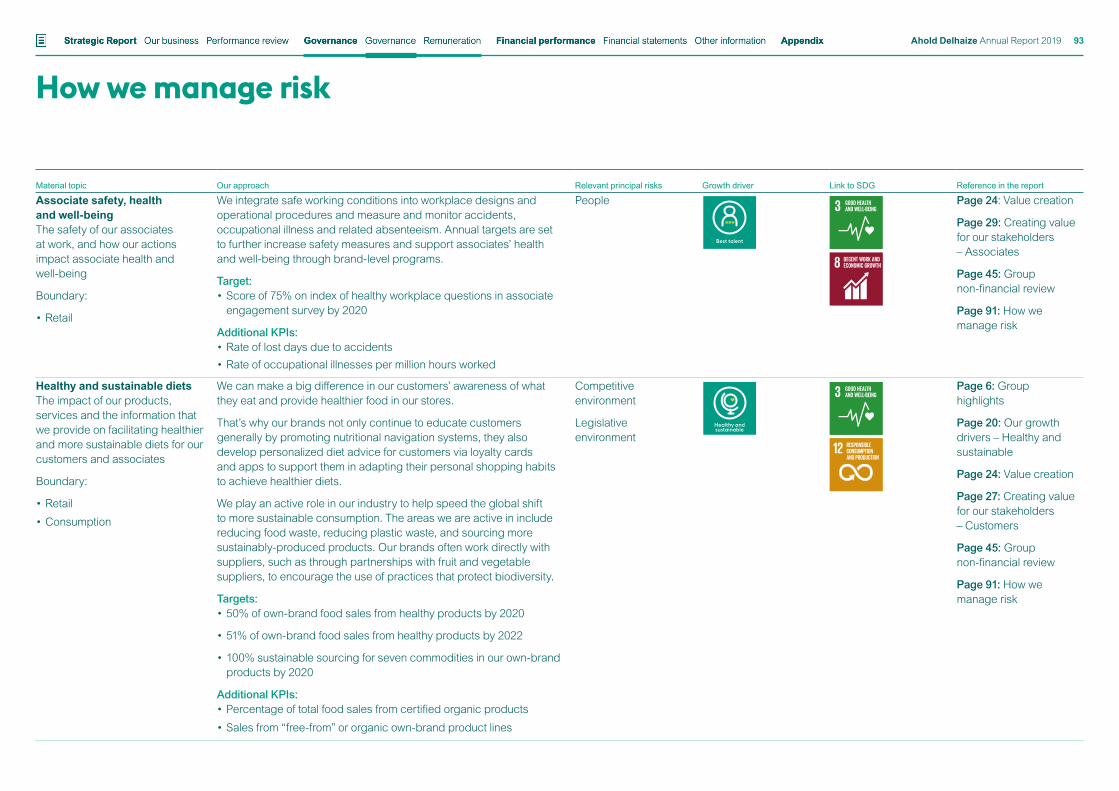
How we manage risk
Material topic Our approach Relevant principal risks Growth driver Link to SDG Reference in the report
Associate safety, health and well-beingThe safety of our associates at work, and how our actions impact associate health and well-being
Boundary:
• Retail
We integrate safe working conditions into workplace designs and operational procedures and measure and monitor accidents, occupational illness and related absenteeism. Annual targets are set to further increase safety measures and support associates’ health and well-being through brand-level programs.
Target:• Score of 75% on index of healthy workplace questions in associate
engagement survey by 2020
Additional KPIs:• Rate of lost days due to accidents• Rate of occupational illnesses per million hours worked
People Page 24: Value creation
Page 29: Creating value for our stakeholders – Associates
Page 45: Group non-financial review
Page 91: How we manage risk
Healthy and sustainable dietsThe impact of our products, services and the information that we provide on facilitating healthier and more sustainable diets for our customers and associates
Boundary:
• Retail
• Consumption
We can make a big difference in our customers’ awareness of what they eat and provide healthier food in our stores.
That’s why our brands not only continue to educate customers generally by promoting nutritional navigation systems, they also develop personalized diet advice for customers via loyalty cards and apps to support them in adapting their personal shopping habits to achieve healthier diets.
We play an active role in our industry to help speed the global shift to more sustainable consumption. The areas we are active in include reducing food waste, reducing plastic waste, and sourcing more sustainably-produced products. Our brands often work directly with suppliers, such as through partnerships with fruit and vegetable suppliers, to encourage the use of practices that protect biodiversity.
Targets:• 50% of own-brand food sales from healthy products by 2020
• 51% of own-brand food sales from healthy products by 2022
• 100% sustainable sourcing for seven commodities in our own-brand products by 2020
Additional KPIs:• Percentage of total food sales from certified organic products
• Sales from “free-from” or organic own-brand product lines
Competitive environment
Legislative environment
Page 6: Group highlights
Page 20: Our growth drivers – Healthy and sustainable
Page 24: Value creation
Page 27: Creating value for our stakeholders – Customers
Page 45: Group non-financial review
Page 91: How we manage risk
Healthy and sustainable
Best talent
Financial statements Other informationStrategic Report Governance Financial performance AppendixGovernance RemunerationOur business Performance review Ahold Delhaize Annual Report 2019 93
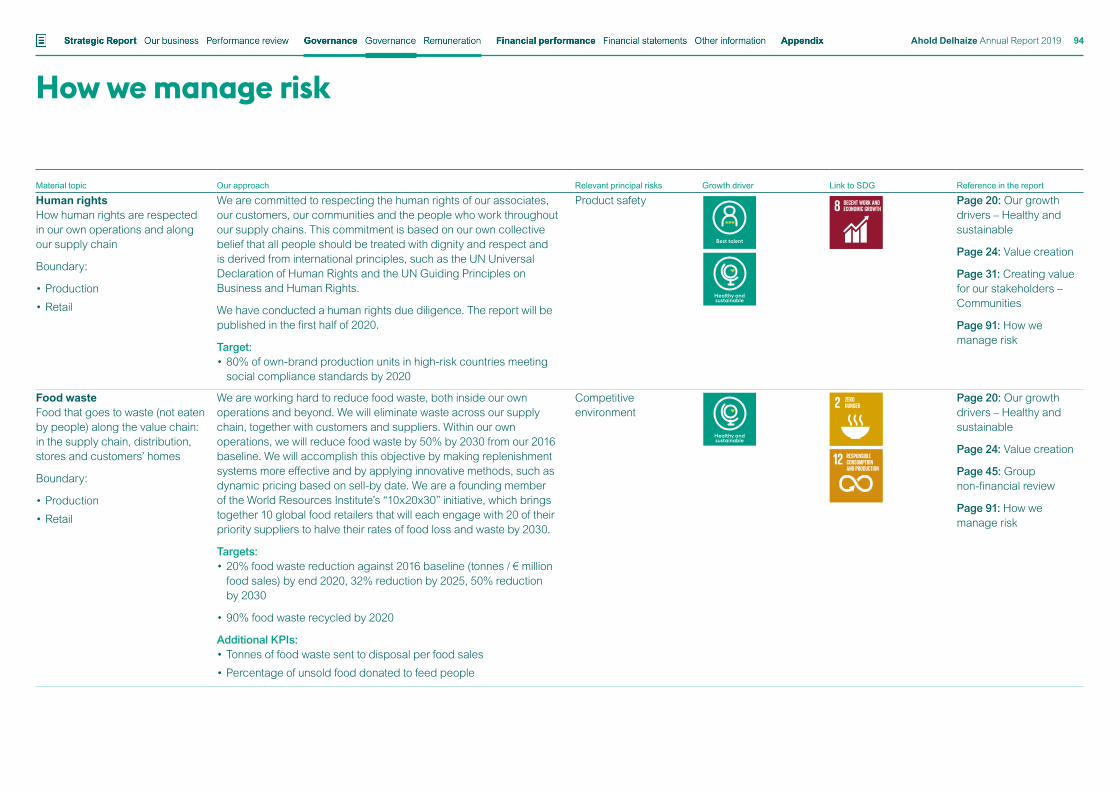
How we manage risk
Material topic Our approach Relevant principal risks Growth driver Link to SDG Reference in the report
Human rightsHow human rights are respected in our own operations and along our supply chain
Boundary:
• Production
• Retail
We are committed to respecting the human rights of our associates, our customers, our communities and the people who work throughout our supply chains. This commitment is based on our own collective belief that all people should be treated with dignity and respect and is derived from international principles, such as the UN Universal Declaration of Human Rights and the UN Guiding Principles on Business and Human Rights.
We have conducted a human rights due diligence. The report will be published in the first half of 2020.
Target:• 80% of own-brand production units in high-risk countries meeting
social compliance standards by 2020
Product safety Page 20: Our growth drivers – Healthy and sustainable
Page 24: Value creation
Page 31: Creating value for our stakeholders – Communities
Page 91: How we manage risk
Food wasteFood that goes to waste (not eaten by people) along the value chain: in the supply chain, distribution, stores and customers’ homes
Boundary:
• Production
• Retail
We are working hard to reduce food waste, both inside our own operations and beyond. We will eliminate waste across our supply chain, together with customers and suppliers. Within our own operations, we will reduce food waste by 50% by 2030 from our 2016 baseline. We will accomplish this objective by making replenishment systems more effective and by applying innovative methods, such as dynamic pricing based on sell-by date. We are a founding member of the World Resources Institute’s “10x20x30” initiative, which brings together 10 global food retailers that will each engage with 20 of their priority suppliers to halve their rates of food loss and waste by 2030.
Targets:• 20% food waste reduction against 2016 baseline (tonnes / € million
food sales) by end 2020, 32% reduction by 2025, 50% reduction by 2030
• 90% food waste recycled by 2020
Additional KPIs:• Tonnes of food waste sent to disposal per food sales
• Percentage of unsold food donated to feed people
Competitive environment
Page 20: Our growth drivers – Healthy and sustainable
Page 24: Value creation
Page 45: Group non-financial review
Page 91: How we manage risk
Healthy and sustainable
Best talent
Healthy and sustainable
Financial statements Other informationStrategic Report Governance Financial performance AppendixGovernance RemunerationOur business Performance review Ahold Delhaize Annual Report 2019 94
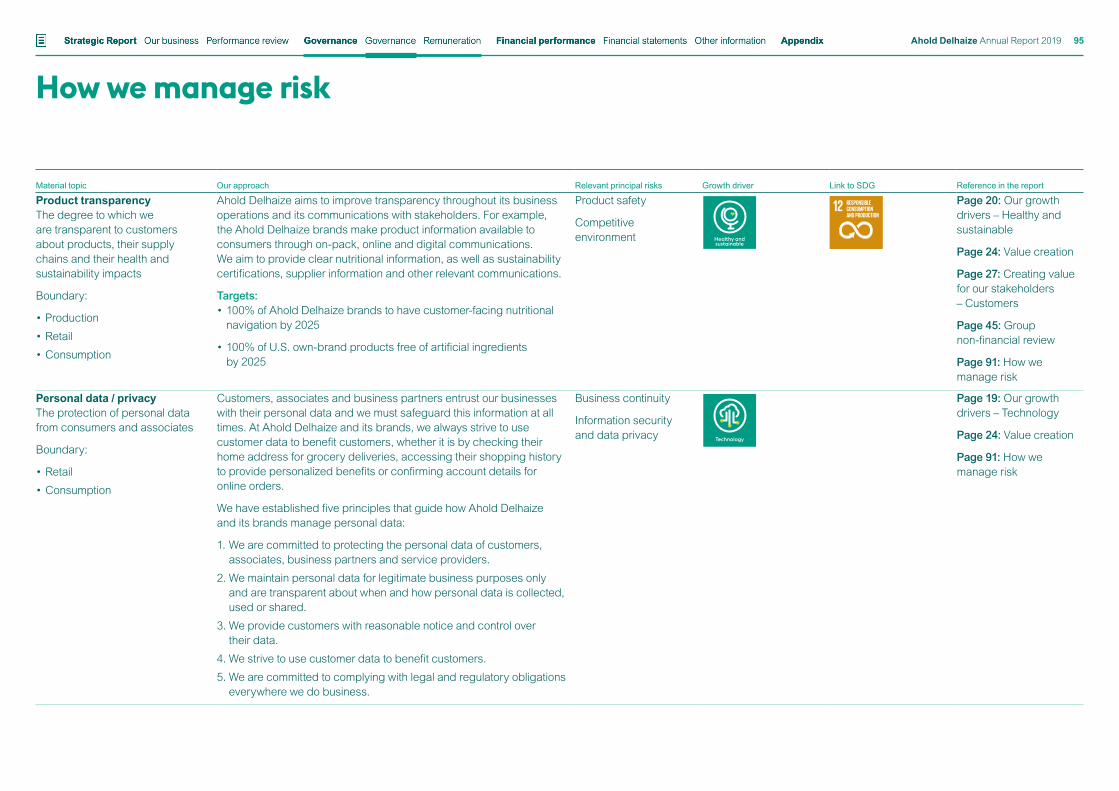
How we manage risk
Material topic Our approach Relevant principal risks Growth driver Link to SDG Reference in the report
Product transparencyThe degree to which we are transparent to customers about products, their supply chains and their health and sustainability impacts
Boundary:
• Production
• Retail
• Consumption
Ahold Delhaize aims to improve transparency throughout its business operations and its communications with stakeholders. For example, the Ahold Delhaize brands make product information available to consumers through on-pack, online and digital communications. We aim to provide clear nutritional information, as well as sustainability certifications, supplier information and other relevant communications.
Targets:• 100% of Ahold Delhaize brands to have customer-facing nutritional
navigation by 2025
• 100% of U.S. own-brand products free of artificial ingredients by 2025
Product safety
Competitive environment
Page 20: Our growth drivers – Healthy and sustainable
Page 24: Value creation
Page 27: Creating value for our stakeholders – Customers
Page 45: Group non-financial review
Page 91: How we manage risk
Personal data / privacyThe protection of personal data from consumers and associates
Boundary:
• Retail
• Consumption
Customers, associates and business partners entrust our businesses with their personal data and we must safeguard this information at all times. At Ahold Delhaize and its brands, we always strive to use customer data to benefit customers, whether it is by checking their home address for grocery deliveries, accessing their shopping history to provide personalized benefits or confirming account details for online orders.
We have established five principles that guide how Ahold Delhaize and its brands manage personal data:
1. We are committed to protecting the personal data of customers, associates, business partners and service providers.
2. We maintain personal data for legitimate business purposes only and are transparent about when and how personal data is collected, used or shared.
3. We provide customers with reasonable notice and control over their data.
4. We strive to use customer data to benefit customers.
5. We are committed to complying with legal and regulatory obligations everywhere we do business.
Business continuity
Information security and data privacy
Page 19: Our growth drivers – Technology
Page 24: Value creation
Page 91: How we manage risk
Technology
Healthy and sustainable
Financial statements Other informationStrategic Report Governance Financial performance AppendixGovernance RemunerationOur business Performance review Ahold Delhaize Annual Report 2019 95
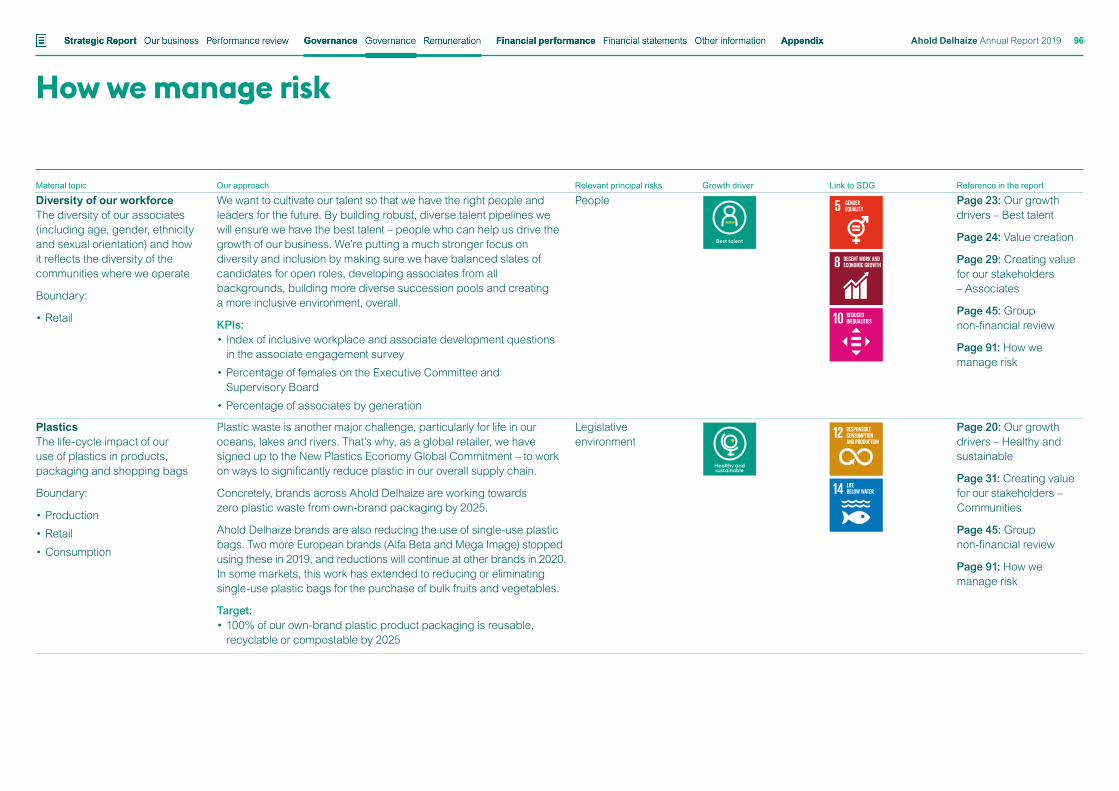
How we manage risk
Material topic Our approach Relevant principal risks Growth driver Link to SDG Reference in the report
Diversity of our workforceThe diversity of our associates (including age, gender, ethnicity and sexual orientation) and how it reflects the diversity of the communities where we operate
Boundary:
• Retail
We want to cultivate our talent so that we have the right people and leaders for the future. By building robust, diverse talent pipelines we will ensure we have the best talent – people who can help us drive the growth of our business. We’re putting a much stronger focus on diversity and inclusion by making sure we have balanced slates of candidates for open roles, developing associates from all backgrounds, building more diverse succession pools and creating a more inclusive environment, overall.
KPIs:• Index of inclusive workplace and associate development questions
in the associate engagement survey
• Percentage of females on the Executive Committee and Supervisory Board
• Percentage of associates by generation
People Page 23: Our growth drivers – Best talent
Page 24: Value creation
Page 29: Creating value for our stakeholders – Associates
Page 45: Group non-financial review
Page 91: How we manage risk
PlasticsThe life-cycle impact of our use of plastics in products, packaging and shopping bags
Boundary:
• Production
• Retail
• Consumption
Plastic waste is another major challenge, particularly for life in our oceans, lakes and rivers. That’s why, as a global retailer, we have signed up to the New Plastics Economy Global Commitment – to work on ways to significantly reduce plastic in our overall supply chain.
Concretely, brands across Ahold Delhaize are working towards zero plastic waste from own-brand packaging by 2025.
Ahold Delhaize brands are also reducing the use of single-use plastic bags. Two more European brands (Alfa Beta and Mega Image) stopped using these in 2019, and reductions will continue at other brands in 2020. In some markets, this work has extended to reducing or eliminating single-use plastic bags for the purchase of bulk fruits and vegetables.
Target:• 100% of our own-brand plastic product packaging is reusable,
recyclable or compostable by 2025
Legislative environment
Page 20: Our growth drivers – Healthy and sustainable
Page 31: Creating value for our stakeholders – Communities
Page 45: Group non-financial review
Page 91: How we manage risk
Healthy and sustainable
Best talent
Financial statements Other informationStrategic Report Governance Financial performance AppendixGovernance RemunerationOur business Performance review Ahold Delhaize Annual Report 2019 96
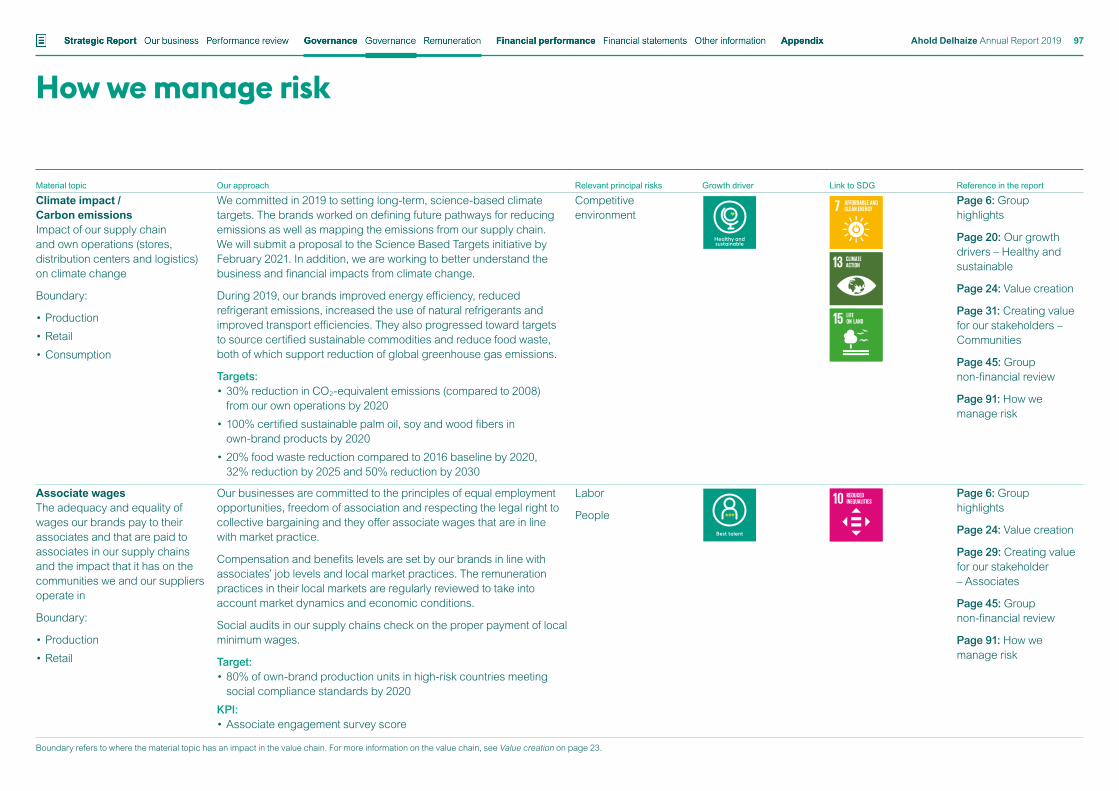
How we manage risk
Material topic Our approach Relevant principal risks Growth driver Link to SDG Reference in the report
Climate impact / Carbon emissionsImpact of our supply chain and own operations (stores, distribution centers and logistics) on climate change
Boundary:
• Production
• Retail
• Consumption
We committed in 2019 to setting long-term, science-based climate targets. The brands worked on defining future pathways for reducing emissions as well as mapping the emissions from our supply chain. We will submit a proposal to the Science Based Targets initiative by February 2021. In addition, we are working to better understand the business and financial impacts from climate change.
During 2019, our brands improved energy efficiency, reduced refrigerant emissions, increased the use of natural refrigerants and improved transport efficiencies. They also progressed toward targets to source certified sustainable commodities and reduce food waste, both of which support reduction of global greenhouse gas emissions.
Targets:• 30% reduction in CO2-equivalent emissions (compared to 2008)
from our own operations by 2020
• 100% certified sustainable palm oil, soy and wood fibers in own-brand products by 2020
• 20% food waste reduction compared to 2016 baseline by 2020, 32% reduction by 2025 and 50% reduction by 2030
Competitive environment
Page 6: Group highlights
Page 20: Our growth drivers – Healthy and sustainable
Page 24: Value creation
Page 31: Creating value for our stakeholders – Communities
Page 45: Group non-financial review
Page 91: How we manage risk
Associate wagesThe adequacy and equality of wages our brands pay to their associates and that are paid to associates in our supply chains and the impact that it has on the communities we and our suppliers operate in
Boundary:
• Production
• Retail
Our businesses are committed to the principles of equal employment opportunities, freedom of association and respecting the legal right to collective bargaining and they offer associate wages that are in line with market practice.
Compensation and benefits levels are set by our brands in line with associates’ job levels and local market practices. The remuneration practices in their local markets are regularly reviewed to take into account market dynamics and economic conditions.
Social audits in our supply chains check on the proper payment of local minimum wages.
Target:• 80% of own-brand production units in high-risk countries meeting
social compliance standards by 2020
KPI:• Associate engagement survey score
Labor
People
Page 6: Group highlights
Page 24: Value creation
Page 29: Creating value for our stakeholder – Associates
Page 45: Group non-financial review
Page 91: How we manage risk
Best talent
Boundary refers to where the material topic has an impact in the value chain. For more information on the value chain, see Value creation on page 23.
Healthy and sustainable
Financial statements Other informationStrategic Report Governance Financial performance AppendixGovernance RemunerationOur business Performance review Ahold Delhaize Annual Report 2019 97
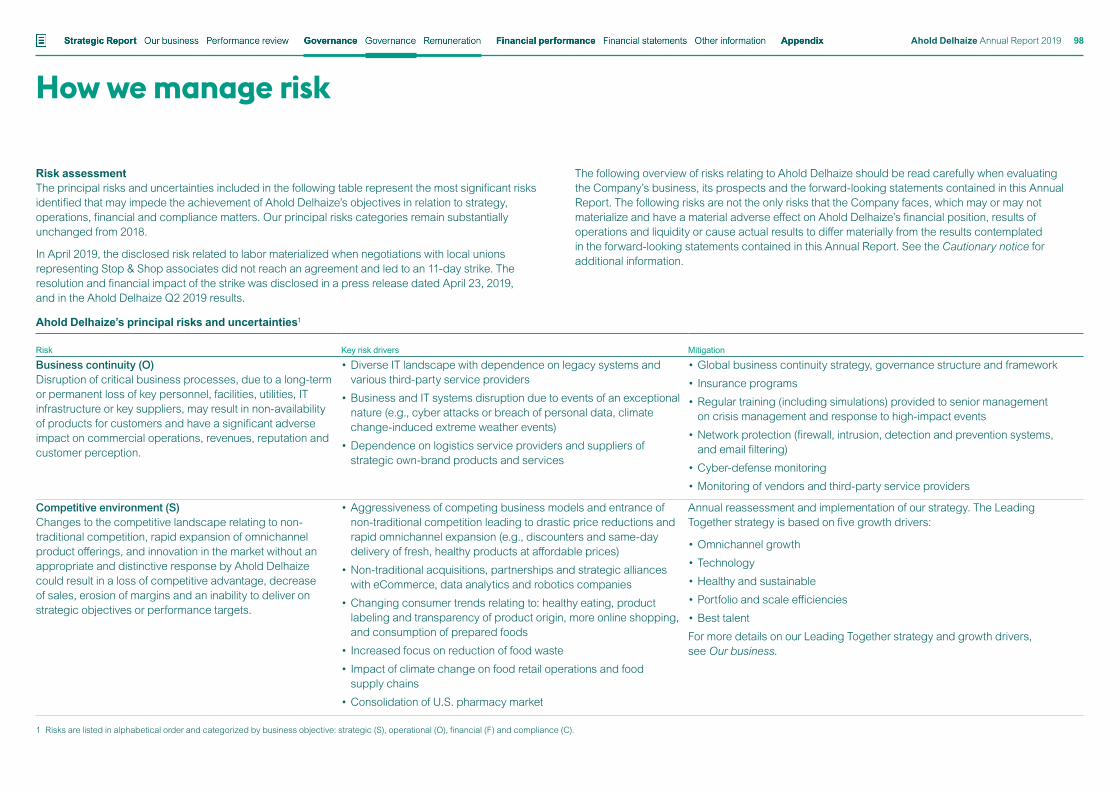
Ahold Delhaize’s principal risks and uncertainties1
Risk Key risk drivers Mitigation
Business continuity (O) Disruption of critical business processes, due to a long-term or permanent loss of key personnel, facilities, utilities, IT infrastructure or key suppliers, may result in non-availability of products for customers and have a significant adverse impact on commercial operations, revenues, reputation and customer perception.
• Diverse IT landscape with dependence on legacy systems and various third-party service providers
• Business and IT systems disruption due to events of an exceptional nature (e.g., cyber attacks or breach of personal data, climate change-induced extreme weather events)
• Dependence on logistics service providers and suppliers of strategic own-brand products and services
• Global business continuity strategy, governance structure and framework
• Insurance programs
• Regular training (including simulations) provided to senior management on crisis management and response to high-impact events
• Network protection (firewall, intrusion, detection and prevention systems, and email filtering)
• Cyber-defense monitoring
• Monitoring of vendors and third-party service providers
Competitive environment (S) Changes to the competitive landscape relating to non-traditional competition, rapid expansion of omnichannel product offerings, and innovation in the market without an appropriate and distinctive response by Ahold Delhaize could result in a loss of competitive advantage, decrease of sales, erosion of margins and an inability to deliver on strategic objectives or performance targets.
• Aggressiveness of competing business models and entrance of non-traditional competition leading to drastic price reductions and rapid omnichannel expansion (e.g., discounters and same-day delivery of fresh, healthy products at affordable prices)
• Non-traditional acquisitions, partnerships and strategic alliances with eCommerce, data analytics and robotics companies
• Changing consumer trends relating to: healthy eating, product labeling and transparency of product origin, more online shopping, and consumption of prepared foods
• Increased focus on reduction of food waste
• Impact of climate change on food retail operations and food supply chains
• Consolidation of U.S. pharmacy market
Annual reassessment and implementation of our strategy. The Leading Together strategy is based on five growth drivers:
• Omnichannel growth
• Technology
• Healthy and sustainable
• Portfolio and scale efficiencies
• Best talent
For more details on our Leading Together strategy and growth drivers, see Our business.
1 Risks are listed in alphabetical order and categorized by business objective: strategic (S), operational (O), financial (F) and compliance (C).
How we manage risk
Risk assessmentThe principal risks and uncertainties included in the following table represent the most significant risks identified that may impede the achievement of Ahold Delhaize’s objectives in relation to strategy, operations, financial and compliance matters. Our principal risks categories remain substantially unchanged from 2018.
In April 2019, the disclosed risk related to labor materialized when negotiations with local unions representing Stop & Shop associates did not reach an agreement and led to an 11-day strike. The resolution and financial impact of the strike was disclosed in a press release dated April 23, 2019, and in the Ahold Delhaize Q2 2019 results.
The following overview of risks relating to Ahold Delhaize should be read carefully when evaluating the Company’s business, its prospects and the forward-looking statements contained in this Annual Report. The following risks are not the only risks that the Company faces, which may or may not materialize and have a material adverse effect on Ahold Delhaize’s financial position, results of operations and liquidity or cause actual results to differ materially from the results contemplated in the forward-looking statements contained in this Annual Report. See the Cautionary notice for additional information.
Financial statements Other informationStrategic Report Governance Financial performance AppendixGovernance RemunerationOur business Performance review Ahold Delhaize Annual Report 2019 98
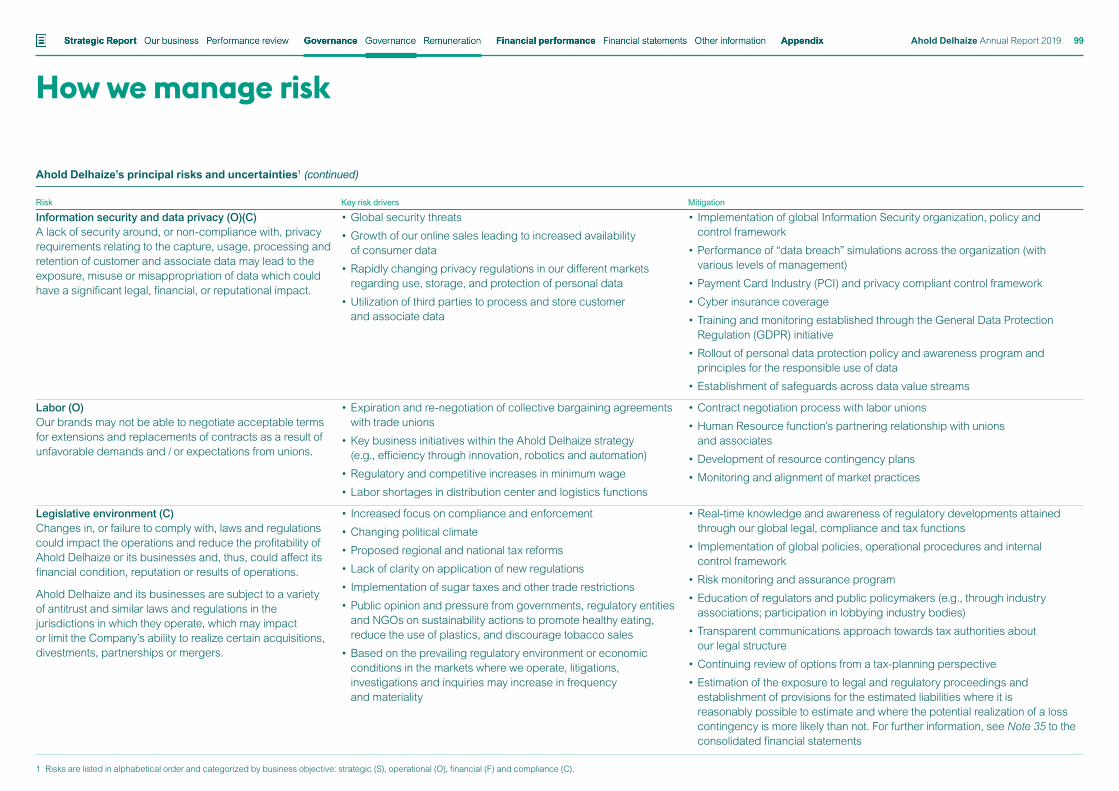
Ahold Delhaize’s principal risks and uncertainties1 (continued)
Risk Key risk drivers Mitigation
Information security and data privacy (O)(C) A lack of security around, or non-compliance with, privacy requirements relating to the capture, usage, processing and retention of customer and associate data may lead to the exposure, misuse or misappropriation of data which could have a significant legal, financial, or reputational impact.
• Global security threats
• Growth of our online sales leading to increased availability of consumer data
• Rapidly changing privacy regulations in our different markets regarding use, storage, and protection of personal data
• Utilization of third parties to process and store customer and associate data
• Implementation of global Information Security organization, policy and control framework
• Performance of “data breach” simulations across the organization (with various levels of management)
• Payment Card Industry (PCI) and privacy compliant control framework
• Cyber insurance coverage
• Training and monitoring established through the General Data Protection Regulation (GDPR) initiative
• Rollout of personal data protection policy and awareness program and principles for the responsible use of data
• Establishment of safeguards across data value streams
Labor (O) Our brands may not be able to negotiate acceptable terms for extensions and replacements of contracts as a result of unfavorable demands and / or expectations from unions.
• Expiration and re-negotiation of collective bargaining agreements with trade unions
• Key business initiatives within the Ahold Delhaize strategy (e.g., efficiency through innovation, robotics and automation)
• Regulatory and competitive increases in minimum wage
• Labor shortages in distribution center and logistics functions
• Contract negotiation process with labor unions
• Human Resource function’s partnering relationship with unions and associates
• Development of resource contingency plans
• Monitoring and alignment of market practices
Legislative environment (C) Changes in, or failure to comply with, laws and regulations could impact the operations and reduce the profitability of Ahold Delhaize or its businesses and, thus, could affect its financial condition, reputation or results of operations.
Ahold Delhaize and its businesses are subject to a variety of antitrust and similar laws and regulations in the jurisdictions in which they operate, which may impact or limit the Company’s ability to realize certain acquisitions, divestments, partnerships or mergers.
• Increased focus on compliance and enforcement
• Changing political climate
• Proposed regional and national tax reforms
• Lack of clarity on application of new regulations
• Implementation of sugar taxes and other trade restrictions
• Public opinion and pressure from governments, regulatory entities and NGOs on sustainability actions to promote healthy eating, reduce the use of plastics, and discourage tobacco sales
• Based on the prevailing regulatory environment or economic conditions in the markets where we operate, litigations, investigations and inquiries may increase in frequency and materiality
• Real-time knowledge and awareness of regulatory developments attained through our global legal, compliance and tax functions
• Implementation of global policies, operational procedures and internal control framework
• Risk monitoring and assurance program
• Education of regulators and public policymakers (e.g., through industry associations; participation in lobbying industry bodies)
• Transparent communications approach towards tax authorities about our legal structure
• Continuing review of options from a tax-planning perspective
• Estimation of the exposure to legal and regulatory proceedings and establishment of provisions for the estimated liabilities where it is reasonably possible to estimate and where the potential realization of a loss contingency is more likely than not. For further information, see Note 35 to the consolidated financial statements
1 Risks are listed in alphabetical order and categorized by business objective: strategic (S), operational (O), financial (F) and compliance (C).
How we manage riskFinancial statements Other informationStrategic Report Governance Financial performance AppendixGovernance RemunerationOur business Performance review Ahold Delhaize Annual Report 2019 99
Ahold Delhaize’s principal risks and uncertainties1 (continued)
Risk Key risk drivers Mitigation
Pension and other post-employment benefits (F) Pension and healthcare funding in the U.S. and the Netherlands. Ahold Delhaize is exposed to the financial consequences of a number of defined benefit pension plans covering a large number of associates in the Netherlands and the United States.
Multi-employer plans A significant number of union employees in the United States are covered by Multi-Employer Plans (MEPs) based on obligations arising from collective bargaining agreements. Ahold Delhaize’s brands participate in 11 MEPs and some of these have a critical (Red Zone) funding deficiency.
Under normal circumstances, when an MEP reaches insolvency, it must reduce all accrued benefits to the maximum level guaranteed by the United States’ Pension Benefit Guaranty Corporation (PBGC). MEPs pay annual insurance premiums to the PBGC for such benefit insurance.
For more information on the financial risks related to our MEPs see Multi-employer plans in Note 24 to the consolidated financial statements.
More details on this risk, its related risk drivers and current mitigating actions can be found in Note 24 to the financial statements.
• Pension and healthcare funding is impacted by low interest rates, stock market performance, changing pension laws, longevity of participants and increased costs in specific markets.
• The Company’s contributions to an MEP in which it participates may be used to fund benefits of employees of other participating employers.
• If the Company seeks to withdraw from some of its MEPs, it must obtain the agreement of the applicable unions and, in connection with this, may be required to pay those plans an amount based on its allocable share of the unfunded vested benefits of the plan, referred to as a withdrawal liability.
• If another participating employer stops contributing to an MEP in which the Company participates (e.g., due to bankruptcy), the Company and other remaining participating employers may have to increase their contributions to fund the unfunded obligations of the plan allocable to the withdrawing employer.
• An MEP in which the Company participates may become insolvent and the Company may be required, in certain circumstances, to increase its contributions to fund the payment of benefits by the MEP.
• PBGC currently projects that its multi-employer insurance program will become insolvent by the end of the PBGC’s 2025 fiscal year. If the PBGC’s multi-employer insurance program becomes insolvent, it may become unable to fund the PBGC-guaranteed benefits owed by insolvent multi-employer plans, which might impact our future contributions. Various legislative initiatives to assist the PBGC and / or the multi-employer pension system in the United States are under consideration by the United States Congress, but it is unclear whether any of these initiatives will be enacted.
• Our governance structure, with a pension committee responsible for monitoring pension plan funding as well as Multi-Employer Plans.
• Management of each MEP by a board of trustees appointed by the management of the participating employers (plan sponsors) and the participating unions. Ahold Delhaize has been appointed as board of trustee member on several MEP boards and, through these positions, manages and monitors the MEPs’ funding.
• The MEPs’ contribution levels (funding) are set for each participating employer and are based on the benefit level as agreed in the collective bargaining agreement (CBA) and the agreed-upon funding. The rate of pension contributions is one of the terms of the CBA and considered to be a part of the overall agreed-upon benefit package. After the expiration of a CBA, all provisions within it are subject to negotiation and could be changed going forward, including, among others, pension and healthcare benefit levels and funding for the agreed benefit level.
1 Risks are listed in alphabetical order and categorized by business objective: strategic (S), operational (O), financial (F) and compliance (C).
How we manage riskFinancial statements Other informationStrategic Report Governance Financial performance AppendixGovernance RemunerationOur business Performance review Ahold Delhaize Annual Report 2019 100
How we manage risk
Ahold Delhaize’s principal risks and uncertainties1 (continued)
Risk Key risk drivers Mitigation
People (O) (S) The brands may not be able to attract, develop and retain top talent in support of current and long-term needs and capabilities.
• Availability of top talent in key locations
• Shift in skillset for elements of our evolving business model (data analytics, omnichannel, modernized DCs, robotics, etc.)
• More mobile workforce with people being more eager to change jobs
• Ability to ensure the safety, health, and well-being of our associates
• Embedding of associate value propositions within each brand to attract top talent
• Identification and building of workforce based on strategic capability plans and needs
• Associate engagement survey distribution and results, and the execution of action plans
• Performance and talent management cycle and development conversations
• Further embedding of our leadership journey, shared values, capabilities and behaviors
• Diversity initiatives to drive a workforce that is representative of the markets we serve
Product safety (O)(C) There is a risk that customers may become injured or ill from the use or consumption of food and non-food products sold by Ahold Delhaize brands, whether they are contaminated or defective, intentionally tampered with, or impacted by food fraud in the supply chain.
Additionally, negative impacts on human rights or the environment during the production of our products (e.g., human rights violations by suppliers) may negatively impact the reputation or results of Ahold Delhaize and / or its brands.
• Internationalization of the supply chain and poor agricultural practices lead to product integrity and sustainability incidents occurring across the world (e.g., related to foodborne illness and manufacturers’ labor conditions)
• Increased speed of communications and amplification of incidents via NGOs and social media (e.g., product recalls or human rights in the supply chain)
• Retailers being held accountable and scrutinized for incidents occurring at any point in the supply chain
• Overall increase in demand by customers for accuracy and transparency in the food supply chain
• Increased number of own-brand products being developed, carried and sold by Ahold Delhaize brands
• Product safety policies, control framework and standard operating procedures
• Ahold Delhaize’s Standards of Engagement for third parties
• Monitoring of performance and training of food safety procedures in the business
• Tracing of product origins and conditions of production
• Pilot of blockchain technology for tracing products in the supply chain
• Insurance programs
1 Risks are listed in alphabetical order and categorized by business objective: strategic (S), operational (O), financial (F) and compliance (C).
Financial statements Other informationStrategic Report Governance Financial performance AppendixGovernance RemunerationOur business Performance review Ahold Delhaize Annual Report 2019 101
How we manage risk
Additional risks and uncertaintiesIn addition to the principal risks identified, the following risks were identified and considered in conjunction with our annual ERM assessment:
Insurance risksAhold Delhaize manages its insurable risks through a combination of self-insurance and commercial insurance coverage for workers’ compensation, general liability, property, vehicle accident and certain healthcare-related claims. Our self-insurance liabilities are estimated based on actuarial valuations. While we believe that the actuarial estimates are reasonable, they are subject to changes caused by claim reporting patterns, claim settlement patterns, regulatory economic conditions and adverse litigation results. Our process enables us to monitor claim and settlement patterns and evaluate third-party risk.
Other financial risksOther financial risks include foreign currency translation risk, credit risk, interest risk, liquidity risk, income tax-related risks, liabilities to third parties relating to lease guarantees, contingent liabilities and risks related to the legislative and regulatory environment, including litigation. For information relating to these financial risks, see Notes 25, 31 and 35 to the consolidated financial statements.
Sensitivity analysisAt Ahold Delhaize, we follow closely the impact of different internal and external risk factors on our operations. The purpose of our sensitivity analysis is to assess these risks on the Company’s current strategy to determine their impact on our business and the viability of our business model, as well as our ability to meet our financial liabilities and other obligations.
Our strategy is based on assumptions relating to: the global economic climate, changes in consumer behavior, competitor actions, market dynamics and our current and planned structure, among other factors.
The following are two extreme risk scenarios related to our strategy that, according to our sensitivity analysis, are considered severe but possible. Neither of these scenarios individually threaten the viability of the Company, however, the compound impact of these scenarios has been evaluated as the most severe stress scenario.
Scenario Associated principal risks Description
Competitive pressure
• Competitive environment
A sustained failure to effectively design and execute our strategic promises could lead to an inability to adapt to new market dynamics driven by consumer behaviors and competition and result in a loss of market share to new market entrants or new shopping channels.
These factors may have a material adverse effect on the Company’s financial position, results of operations and liquidity.
Information security and / or data breach and business disruption
• Business continuity
• Information security and data privacy
In the event of a successful data breach, the Company could be subject to material monetary penalties, loss of customers and damage to our corporate reputation; it could also lead to potential litigation.
A serious breach could also impact the operation of significant business processes and result in non-availability of products for customers and the inability to operate our day-to-day business at the stores and distribution centers and at brand level.
Financial statements Other informationStrategic Report Governance Financial performance AppendixGovernance RemunerationOur business Performance review Ahold Delhaize Annual Report 2019 102
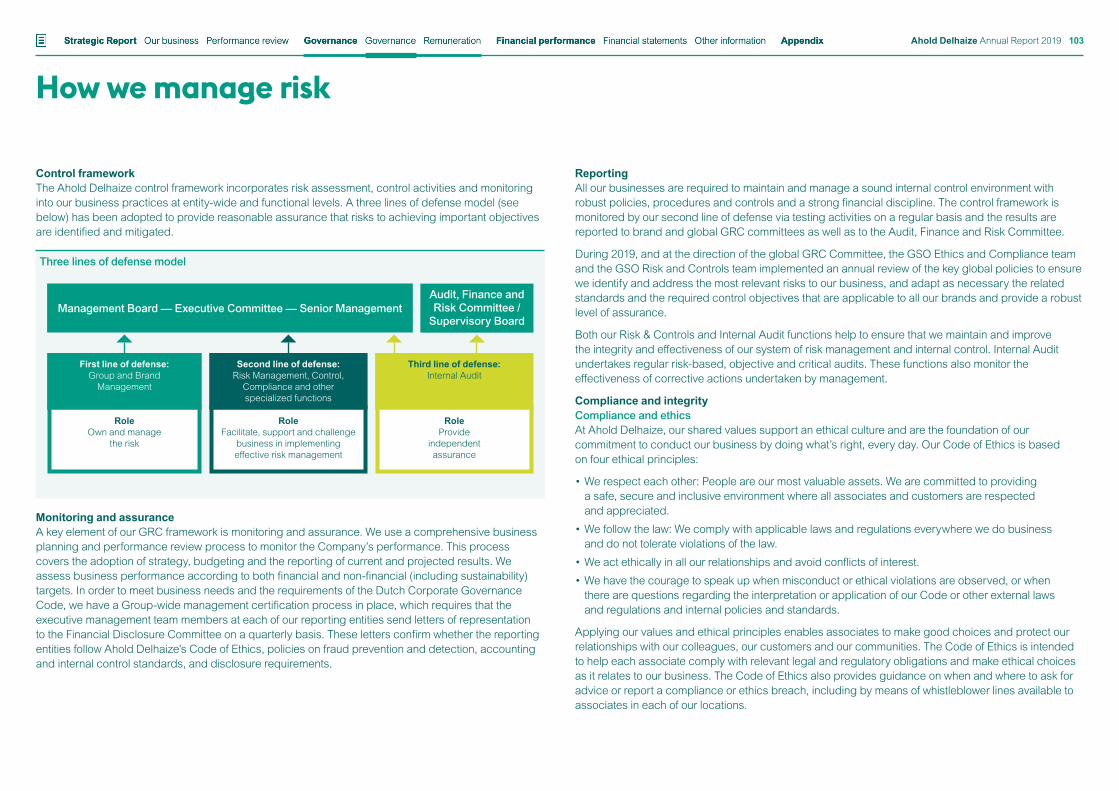
How we manage risk
Control frameworkThe Ahold Delhaize control framework incorporates risk assessment, control activities and monitoring into our business practices at entity-wide and functional levels. A three lines of defense model (see below) has been adopted to provide reasonable assurance that risks to achieving important objectives are identified and mitigated.
Monitoring and assuranceA key element of our GRC framework is monitoring and assurance. We use a comprehensive business planning and performance review process to monitor the Company’s performance. This process covers the adoption of strategy, budgeting and the reporting of current and projected results. We assess business performance according to both financial and non-financial (including sustainability) targets. In order to meet business needs and the requirements of the Dutch Corporate Governance Code, we have a Group-wide management certification process in place, which requires that the executive management team members at each of our reporting entities send letters of representation to the Financial Disclosure Committee on a quarterly basis. These letters confirm whether the reporting entities follow Ahold Delhaize’s Code of Ethics, policies on fraud prevention and detection, accounting and internal control standards, and disclosure requirements.
ReportingAll our businesses are required to maintain and manage a sound internal control environment with robust policies, procedures and controls and a strong financial discipline. The control framework is monitored by our second line of defense via testing activities on a regular basis and the results are reported to brand and global GRC committees as well as to the Audit, Finance and Risk Committee.
During 2019, and at the direction of the global GRC Committee, the GSO Ethics and Compliance team and the GSO Risk and Controls team implemented an annual review of the key global policies to ensure we identify and address the most relevant risks to our business, and adapt as necessary the related standards and the required control objectives that are applicable to all our brands and provide a robust level of assurance.
Both our Risk & Controls and Internal Audit functions help to ensure that we maintain and improve the integrity and effectiveness of our system of risk management and internal control. Internal Audit undertakes regular risk-based, objective and critical audits. These functions also monitor the effectiveness of corrective actions undertaken by management.
Compliance and integrityCompliance and ethicsAt Ahold Delhaize, our shared values support an ethical culture and are the foundation of our commitment to conduct our business by doing what’s right, every day. Our Code of Ethics is based on four ethical principles:
• We respect each other: People are our most valuable assets. We are committed to providing a safe, secure and inclusive environment where all associates and customers are respected and appreciated.
• We follow the law: We comply with applicable laws and regulations everywhere we do business and do not tolerate violations of the law.
• We act ethically in all our relationships and avoid conflicts of interest.
• We have the courage to speak up when misconduct or ethical violations are observed, or when there are questions regarding the interpretation or application of our Code or other external laws and regulations and internal policies and standards.
Applying our values and ethical principles enables associates to make good choices and protect our relationships with our colleagues, our customers and our communities. The Code of Ethics is intended to help each associate comply with relevant legal and regulatory obligations and make ethical choices as it relates to our business. The Code of Ethics also provides guidance on when and where to ask for advice or report a compliance or ethics breach, including by means of whistleblower lines available to associates in each of our locations.
Three lines of defense model
Role Own and manage
the risk
First line of defense:Group and Brand
Management
Role Facilitate, support and challenge
business in implementing effective risk management
Second line of defense:Risk Management, Control,
Compliance and other specialized functions
Role Provide
independent assurance
Third line of defense:Internal Audit
Audit, Finance and Risk Committee /
Supervisory BoardManagement Board — Executive Committee — Senior Management
Financial statements Other informationStrategic Report Governance Financial performance AppendixGovernance RemunerationOur business Performance review Ahold Delhaize Annual Report 2019 103
How we manage risk
The principles in the Code apply to all associates of Ahold Delhaize and its businesses. Associates of certain defined grade levels are trained in compliance with the Code on an annual basis. The full Code is available in the corporate governance section of Ahold Delhaize’s public website at www.aholddelhaize.com.
In addition to our Code of Ethics, we have a global policy and control framework that addresses and monitors key risks to our business. These policies and controls relate to internal processes (e.g., financial reporting, capital investments, purchasing and tax) as well as to legal and regulatory risks (e.g., data privacy, competition and antitrust, and corruption and bribery).
Whistleblower reportingAhold Delhaize and its brands provide reporting options for associates, including the Speak Up line, a global reporting line that is monitored by Navex, a third-party provider. The Speak Up line is available to report potential misconduct or to seek guidance regarding ethical issues, and is accessible either by telephone or internet, 24 hours a day, seven days a week.
In 2019, our whistleblower lines received 6,653 reports, over 86% of which were related to routine HR issues. The remaining reports relate primarily to misconduct or inappropriate behavior; unfair treatment; and bullying or threats of violence. Approximately 40.5% of the reports were made anonymously. On average, reports were investigated and resolved within 19 days. In 2019, there were no substantiated reports of significant financial reporting, accounting, fraud or ethical violations.
Additionally, the Ahold Delhaize Compliance and Ethics team maintains and monitors an email box ([email protected]) that can be used to report potential ethical or compliance concerns and to seek guidance regarding ethical dilemmas.
Corruption and briberyAhold Delhaize and its brands are committed to conducting business in an ethically responsible manner and complying with the law in all countries and jurisdictions in which we operate. This commitment specifically includes compliance with laws relating to anti-corruption and bribery. The Ahold Delhaize Code of Ethics and our Global Anti-Corruption and Bribery Policy prohibit any form of corruption or bribery, including facilitation payments.
Financial statements Other informationStrategic Report Governance Financial performance AppendixGovernance RemunerationOur business Performance review Ahold Delhaize Annual Report 2019 104
Declarations
IntroductionThis 2019 Ahold Delhaize Annual Report dated February 25, 2020, (the Annual Report) comprises regulated information within the meaning of sections 1:1 and 5:25c of the Dutch Act on Financial Supervision “Wet op het financieel toezicht.”
For the consolidated and the parent company’s 2019 financial statements “jaarrekening” within the meaning of section 2:361 of the Dutch Civil Code, see Financial performance: Financial statements. The members of the Management Board and the Supervisory Board have signed the 2019 financial statements pursuant to their obligation under section 2:101, paragraph 2 of the Dutch Civil Code. The following sections of this Annual Report together form the management report, or the “bestuursverslag” within the meaning of section 2:391 of the Dutch Civil Code: Strategic report, Our Management Board and Executive Committee, Our Supervisory Board, Corporate governance, How we manage risk, Remuneration and the subsection Remuneration included in the Supervisory Board report.
For other information, or “overige gegevens” within the meaning of section 2:392 of the Dutch Civil Code, see section Other information under Financial performance.
DeclarationsThe members of the Management Board, as required by section 5:25c, paragraph 2, under c of the Dutch Act on Financial Supervision, confirm that to the best of their knowledge:
• The 2019 financial statements included in this Annual Report give a true and fair view of the assets, liabilities, financial position and profit or loss of the Company and the undertakings included in the consolidation taken as a whole.
• The management report included in this Annual Report gives a true and fair view of the position of the Company and the undertakings included in the consolidation taken as a whole as of December 29, 2019, and of the development and performance of the business for the financial year then ended.
• The management report includes a description of the principal risks and uncertainties that the Company faces.
Annual declaration on internal risk management and control systemsThe Management Board, as required by section 1.4.3 of the Dutch Corporate Governance Code, makes the following declaration:
The Management Board is responsible for establishing and maintaining adequate internal risk management and control systems. Such systems are designed to manage rather than eliminate the risk of failure to achieve important business objectives, and can only provide reasonable and not absolute assurance against material misstatement or loss. This report provides sufficient insights into any significant deficiencies in the effectiveness of the internal risk management and control systems. Management is not aware of any critical failings of these systems during 2019.
This report includes those material risks and uncertainties that are relevant to the expectation of the Company’s continuity for the period of twelve months after the preparation of the report.
With respect to financial reporting based on the current state of affairs, it is justified that the financial reporting is prepared on a going concern basis and management has assessed whether the risk management and control systems provide reasonable assurance that the 2019 financial statements do not contain any material misstatements. This assessment was based on the criteria set out in COSO: Internal Control – Integrated Framework 2013 and our internal control framework. It included tests of the design and operating effectiveness of entity-level controls, transactional controls at significant locations and relevant general computer controls. Any control weaknesses not fully remediated at year-end were evaluated. Based on this assessment, the Management Board determined that the Company’s financial reporting systems are adequately designed, operated effectively in 2019 and provide reasonable assurance that the financial statements are free of material misstatement.
Management BoardFrans Muller President and Chief Executive Officer
Jeff Carr Chief Financial Officer
Kevin Holt Chief Executive Officer Ahold Delhaize USA
Wouter Kolk Chief Executive Officer Europe and Indonesia
This Annual Report, including the 2019 financial statements, which are audited by PricewaterhouseCoopers Accountants N.V., has been presented to the Supervisory Board.
The 2019 financial statements and the independent auditor’s report relating to the audit of the 2019 financial statements were discussed with the Audit, Finance and Risk Committee in the presence of the Management Board and the external independent auditor. The Supervisory Board recommends that the General Meeting of Shareholders adopt the 2019 financial statements included in this Annual Report and recommends the proposal to pay a cash dividend for the financial year 2019 of €0.76 per common share. An amount of €0.30 per common share was paid as interim dividend on August 22, 2019. The remaining amount of €0.46 per common share shall be payable on April 23, 2020.
Supervisory BoardJan Hommen (Chairman) Bill McEwan (Vice Chairman) Jacques de Vaucleroy (Vice Chairman) René Hooft Graafland Ben Noteboom Mary Anne Citrino Dominique Leroy Katie Doyle Peter Agnefjäll
Financial statements Other informationStrategic Report Governance Financial performance AppendixGovernance RemunerationOur business Performance review Ahold Delhaize Annual Report 2019 105
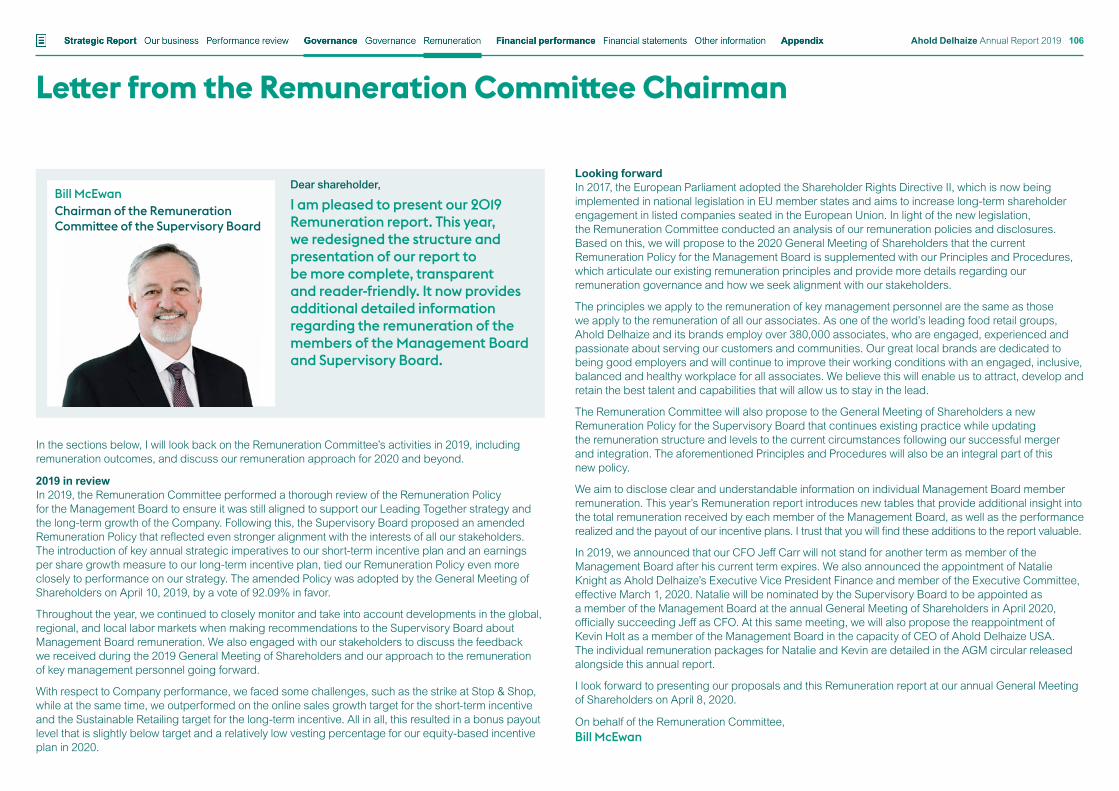
Letter from the Remuneration Committee Chairman
Looking forwardIn 2017, the European Parliament adopted the Shareholder Rights Directive II, which is now being implemented in national legislation in EU member states and aims to increase long-term shareholder engagement in listed companies seated in the European Union. In light of the new legislation, the Remuneration Committee conducted an analysis of our remuneration policies and disclosures. Based on this, we will propose to the 2020 General Meeting of Shareholders that the current Remuneration Policy for the Management Board is supplemented with our Principles and Procedures, which articulate our existing remuneration principles and provide more details regarding our remuneration governance and how we seek alignment with our stakeholders.
The principles we apply to the remuneration of key management personnel are the same as those we apply to the remuneration of all our associates. As one of the world’s leading food retail groups, Ahold Delhaize and its brands employ over 380,000 associates, who are engaged, experienced and passionate about serving our customers and communities. Our great local brands are dedicated to being good employers and will continue to improve their working conditions with an engaged, inclusive, balanced and healthy workplace for all associates. We believe this will enable us to attract, develop and retain the best talent and capabilities that will allow us to stay in the lead.
The Remuneration Committee will also propose to the General Meeting of Shareholders a new Remuneration Policy for the Supervisory Board that continues existing practice while updating the remuneration structure and levels to the current circumstances following our successful merger and integration. The aforementioned Principles and Procedures will also be an integral part of this new policy.
We aim to disclose clear and understandable information on individual Management Board member remuneration. This year’s Remuneration report introduces new tables that provide additional insight into the total remuneration received by each member of the Management Board, as well as the performance realized and the payout of our incentive plans. I trust that you will find these additions to the report valuable.
In 2019, we announced that our CFO Jeff Carr will not stand for another term as member of the Management Board after his current term expires. We also announced the appointment of Natalie Knight as Ahold Delhaize’s Executive Vice President Finance and member of the Executive Committee, effective March 1, 2020. Natalie will be nominated by the Supervisory Board to be appointed as a member of the Management Board at the annual General Meeting of Shareholders in April 2020, officially succeeding Jeff as CFO. At this same meeting, we will also propose the reappointment of Kevin Holt as a member of the Management Board in the capacity of CEO of Ahold Delhaize USA. The individual remuneration packages for Natalie and Kevin are detailed in the AGM circular released alongside this annual report.
I look forward to presenting our proposals and this Remuneration report at our annual General Meeting of Shareholders on April 8, 2020.
On behalf of the Remuneration Committee,Bill McEwan
In the sections below, I will look back on the Remuneration Committee’s activities in 2019, including remuneration outcomes, and discuss our remuneration approach for 2020 and beyond.
2019 in reviewIn 2019, the Remuneration Committee performed a thorough review of the Remuneration Policy for the Management Board to ensure it was still aligned to support our Leading Together strategy and the long-term growth of the Company. Following this, the Supervisory Board proposed an amended Remuneration Policy that reflected even stronger alignment with the interests of all our stakeholders. The introduction of key annual strategic imperatives to our short-term incentive plan and an earnings per share growth measure to our long-term incentive plan, tied our Remuneration Policy even more closely to performance on our strategy. The amended Policy was adopted by the General Meeting of Shareholders on April 10, 2019, by a vote of 92.09% in favor.
Throughout the year, we continued to closely monitor and take into account developments in the global, regional, and local labor markets when making recommendations to the Supervisory Board about Management Board remuneration. We also engaged with our stakeholders to discuss the feedback we received during the 2019 General Meeting of Shareholders and our approach to the remuneration of key management personnel going forward.
With respect to Company performance, we faced some challenges, such as the strike at Stop & Shop, while at the same time, we outperformed on the online sales growth target for the short-term incentive and the Sustainable Retailing target for the long-term incentive. All in all, this resulted in a bonus payout level that is slightly below target and a relatively low vesting percentage for our equity-based incentive plan in 2020.
Dear shareholder,
I am pleased to present our 2019 Remuneration report. This year, we redesigned the structure and presentation of our report to be more complete, transparent and reader-friendly. It now provides additional detailed information regarding the remuneration of the members of the Management Board and Supervisory Board.
Bill McEwanChairman of the Remuneration Committee of the Supervisory Board
Financial statements Other informationStrategic Report Governance Financial performance AppendixGovernance RemunerationOur business Performance review Ahold Delhaize Annual Report 2019 106
Remuneration policy
Ahold Delhaize’s remuneration policy for the Management Board was prepared in accordance with the Dutch Corporate Governance Code. It was adapted by the General Meeting of Shareholders on April 10, 2019. The remuneration policy became effective retroactively as of January 1, 2019.
Ahold Delhaize’s remuneration policy aims at attracting, motivating and retaining the best qualified talent. The Supervisory Board designed the Management Board Remuneration Policy to align with the Company’s strategy and to support the pay-for-performance culture, with an effective and transparent remuneration policy.
The policy contemplates the various risks and scenarios associated with variable compensation elements.
Remuneration philosophyThe basic elements of the Total Direct Compensation provided to Management Board members are (1) a base salary, (2) an annual cash incentive, and (3) a long-term equity-based program. In addition to the Total Direct Compensation, members of the Management Board are offered pensions and additional arrangements in line with local practices.
In support of the Company’s strategy and performance culture, the Total Direct Compensation for the Management Board is structured with variable short- and long-term incentives tied to the realization of financial and non-financial performance criteria. These performance criteria are cornerstone elements of the Company’s strategy.
The short-term incentive is focused on the fundamental key financial metrics of a retail organization: sales growth, underlying operating margin and operating cash flow. Our Company’s goal is to expand market share, while focusing on margins to increase profitability and prudently managing capital spending and expenses to secure strong and sustainable cash flow. In addition to these financial metrics, the short-term incentive includes specific goals for key strategic imperatives that reflect and support the Company’s vision and strategic goals.
The long-term incentive is measured against (i) an internal measure on Return on Capital (“RoC”), (ii) an internal measure of the Company’s growth in profitability (earnings per share growth or “EPS”), (iii) an external measure of the Company’s share performance relative to that of its peers (Total Shareholder Return or “TSR”) and (iv) the Company’s contribution to society through sustainability objectives. Performance for long-term incentives is calculated over a revolving three-year period.
The structure of the Management Board Remuneration Policy aligns the focus of the Management Board with the interests of the Company’s shareholders, the Company’s stakeholders and society at large. Compensation and awards are tied to and dependent on the delivery of the Company’s strategy in a socially responsible and sustainable manner.
Market competitive payThe competitiveness of the Management Board remuneration is benchmarked annually. The benchmark peer group consists of a total of 18 peer companies in Europe and the United States as well as AEX and BEL20 listed companies. This labor market peer group reflects the Company’s geographic operating areas and the markets most relevant in relation to the recruitment and retention of top management. European peers U.S. peers AEX and BEL20
Tesco Kroger UnileverCarrefour Costco PhilipsMetro Cash & Carry Target HeinekenCasino Guichard Perrachon Walgreens Boots
AllianceRandstad
J Sainsbury Best Buy Akzo NobelW M Morrison Lowe’s Companies AB InBev
To accommodate potential changes in the labor market peer group due to delistings, mergers or other extraordinary circumstances, the Supervisory Board may exercise discretion to substitute comparable companies. In general, geographical composition leads replacement determination. For example, if a U.S.-based company drops out, it is generally replaced by a U.S.-based company.
The composition (risk profile) of the Total Direct Compensation levels is considered when benchmarking base salary levels. The target Total Direct Compensation level is typically at or near the median, while consideration is given to the size of Ahold Delhaize relative to the peer group, with a fixed to variable pay ratio that supports the pay for performance culture and a long-term strategic focus.
An individual exception to the Management Board Remuneration Policy has been applied for the CEO Ahold Delhaize USA (Kevin Holt). The Supervisory Board has and will determine the remuneration for the CEO Ahold Delhaize USA on the basis of a local reference market, the U.S. retail labor market reference group.
Base salaryThe level of the base salary of the members of the Management Board is derived, as one component, from the benchmarking of Total Direct Compensation. Adjustment of individual base salaries is at the discretion of the Supervisory Board.
Financial statements Other informationStrategic Report Governance Financial performance AppendixGovernance RemunerationOur business Performance review Ahold Delhaize Annual Report 2019 107
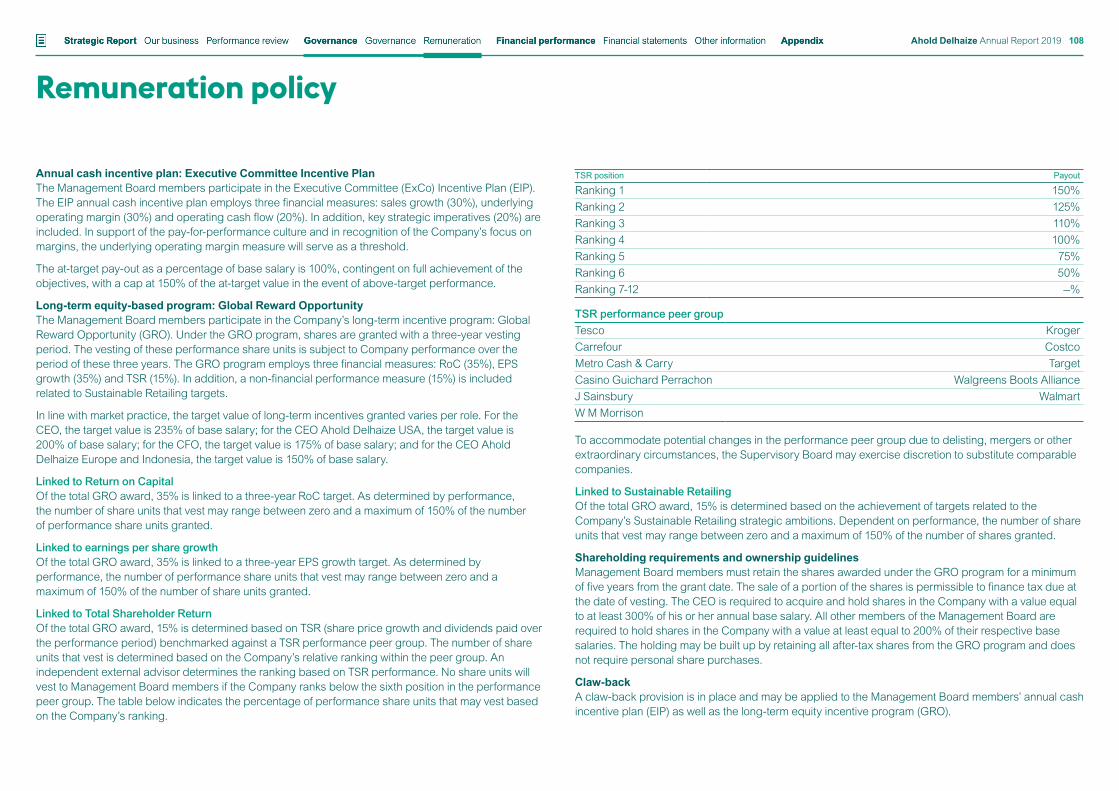
Remuneration policy
Annual cash incentive plan: Executive Committee Incentive PlanThe Management Board members participate in the Executive Committee (ExCo) Incentive Plan (EIP). The EIP annual cash incentive plan employs three financial measures: sales growth (30%), underlying operating margin (30%) and operating cash flow (20%). In addition, key strategic imperatives (20%) are included. In support of the pay-for-performance culture and in recognition of the Company’s focus on margins, the underlying operating margin measure will serve as a threshold.
The at-target pay-out as a percentage of base salary is 100%, contingent on full achievement of the objectives, with a cap at 150% of the at-target value in the event of above-target performance.
Long-term equity-based program: Global Reward OpportunityThe Management Board members participate in the Company’s long-term incentive program: Global Reward Opportunity (GRO). Under the GRO program, shares are granted with a three-year vesting period. The vesting of these performance share units is subject to Company performance over the period of these three years. The GRO program employs three financial measures: RoC (35%), EPS growth (35%) and TSR (15%). In addition, a non-financial performance measure (15%) is included related to Sustainable Retailing targets.
In line with market practice, the target value of long-term incentives granted varies per role. For the CEO, the target value is 235% of base salary; for the CEO Ahold Delhaize USA, the target value is 200% of base salary; for the CFO, the target value is 175% of base salary; and for the CEO Ahold Delhaize Europe and Indonesia, the target value is 150% of base salary.
Linked to Return on CapitalOf the total GRO award, 35% is linked to a three-year RoC target. As determined by performance, the number of share units that vest may range between zero and a maximum of 150% of the number of performance share units granted.
Linked to earnings per share growthOf the total GRO award, 35% is linked to a three-year EPS growth target. As determined by performance, the number of performance share units that vest may range between zero and a maximum of 150% of the number of share units granted.
Linked to Total Shareholder ReturnOf the total GRO award, 15% is determined based on TSR (share price growth and dividends paid over the performance period) benchmarked against a TSR performance peer group. The number of share units that vest is determined based on the Company’s relative ranking within the peer group. An independent external advisor determines the ranking based on TSR performance. No share units will vest to Management Board members if the Company ranks below the sixth position in the performance peer group. The table below indicates the percentage of performance share units that may vest based on the Company’s ranking.
TSR position Payout
Ranking 1 150%Ranking 2 125%Ranking 3 110%Ranking 4 100%Ranking 5 75%Ranking 6 50%Ranking 7-12 —%
TSR performance peer groupTesco KrogerCarrefour CostcoMetro Cash & Carry TargetCasino Guichard Perrachon Walgreens Boots AllianceJ Sainsbury WalmartW M Morrison
To accommodate potential changes in the performance peer group due to delisting, mergers or other extraordinary circumstances, the Supervisory Board may exercise discretion to substitute comparable companies.
Linked to Sustainable RetailingOf the total GRO award, 15% is determined based on the achievement of targets related to the Company’s Sustainable Retailing strategic ambitions. Dependent on performance, the number of share units that vest may range between zero and a maximum of 150% of the number of shares granted.
Shareholding requirements and ownership guidelinesManagement Board members must retain the shares awarded under the GRO program for a minimum of five years from the grant date. The sale of a portion of the shares is permissible to finance tax due at the date of vesting. The CEO is required to acquire and hold shares in the Company with a value equal to at least 300% of his or her annual base salary. All other members of the Management Board are required to hold shares in the Company with a value at least equal to 200% of their respective base salaries. The holding may be built up by retaining all after-tax shares from the GRO program and does not require personal share purchases.
Claw-backA claw-back provision is in place and may be applied to the Management Board members’ annual cash incentive plan (EIP) as well as the long-term equity incentive program (GRO).
Financial statements Other informationStrategic Report Governance Financial performance AppendixGovernance RemunerationOur business Performance review Ahold Delhaize Annual Report 2019 108
Remuneration policy
Pensions and other contract termsPensionAll existing pension arrangements in the Netherlands are in line with the applicable fiscal pension regulations. The pension plan for Management Board members is calculated in a way that is consistent with plans for all other associates of the Company in the Netherlands and is referred to as a defined benefit plan, based on career average salary. The (current) retirement age is 68. The pensionable salary is capped at or near €100,000 (2019: €102,487). Each Management Board member working under a Dutch contract pays a pension premium contribution identical to that of all other associates of the Company in the Netherlands.
In addition, Management Board members working under a Dutch contract receive a gross (age-dependent) pension allowance and can choose to participate in a Net Pension Arrangement by investing the net (after tax) amount of the pension allowance. The Net Pension Arrangement is identical to that of all other associates of the Company in the Netherlands whose pensionable salary exceeds the cap. Participation in this Net Pension Arrangement is voluntary.
Members of the Management Board working under a non-Dutch contract are offered pensions in line with local practices.
LoansThe Company does not provide loans to members of the Management Board, nor does the Company issue guarantees to the benefit of members of the Management Board.
Additional arrangementsIn addition to the remuneration of the Management Board members, a number of additional arrangements apply. These include expense allowances, insurance, use of company cars and, where applicable, expatriate allowances, which apply to other senior associates and are in line with practice in the relevant market. In addition, third-party tax services are provided to ensure compliance with the relevant legislative requirements.
(Service) AgreementsThe term of appointment for all Management Board members is four years. If the Company terminates the (service) agreement of any member of the Management Board, the severance payment is limited to one year’s base salary. The agreement may be terminated by the Company with a notice period of twelve months and by the Management Board member with a notice period of six months.
Financial statements Other informationStrategic Report Governance Financial performance AppendixGovernance RemunerationOur business Performance review Ahold Delhaize Annual Report 2019 109
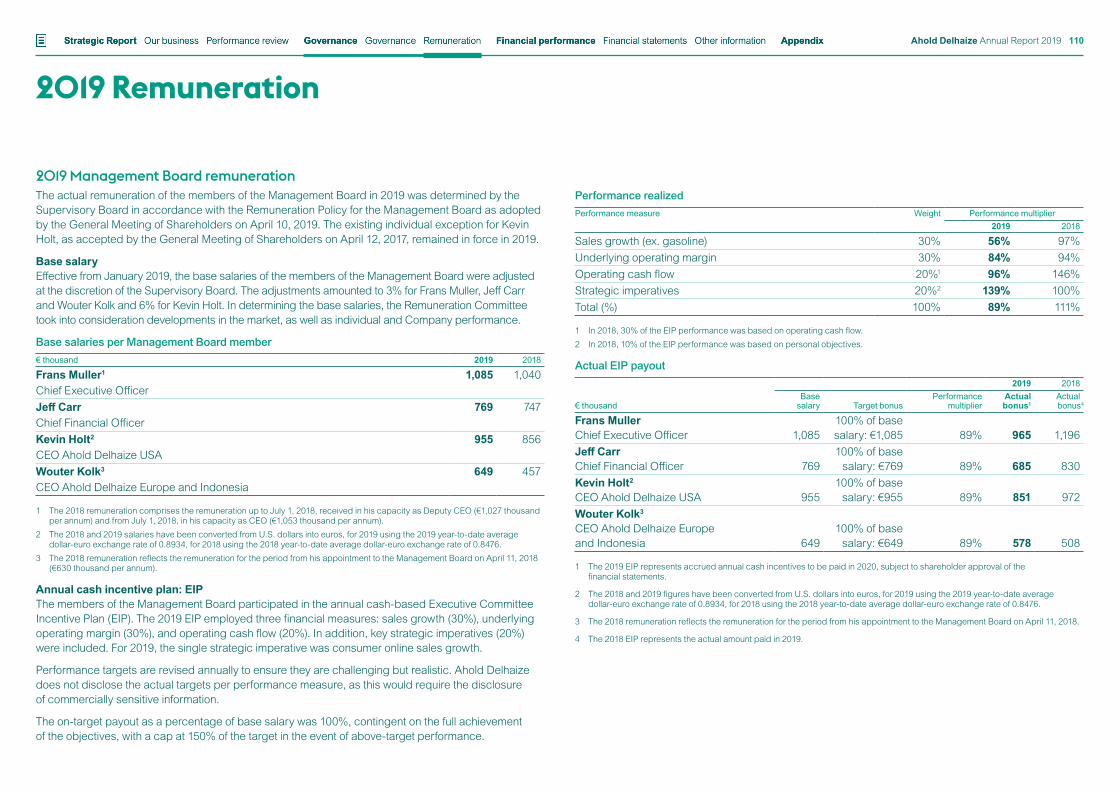
2019 Remuneration
2019 Management Board remuneration The actual remuneration of the members of the Management Board in 2019 was determined by the Supervisory Board in accordance with the Remuneration Policy for the Management Board as adopted by the General Meeting of Shareholders on April 10, 2019. The existing individual exception for Kevin Holt, as accepted by the General Meeting of Shareholders on April 12, 2017, remained in force in 2019.
Base salaryEffective from January 2019, the base salaries of the members of the Management Board were adjusted at the discretion of the Supervisory Board. The adjustments amounted to 3% for Frans Muller, Jeff Carr and Wouter Kolk and 6% for Kevin Holt. In determining the base salaries, the Remuneration Committee took into consideration developments in the market, as well as individual and Company performance.
Base salaries per Management Board member€ thousand 2019 2018
Frans Muller1 1,085 1,040Chief Executive OfficerJeff Carr 769 747Chief Financial OfficerKevin Holt2 955 856CEO Ahold Delhaize USAWouter Kolk3 649 457CEO Ahold Delhaize Europe and Indonesia
1 The 2018 remuneration comprises the remuneration up to July 1, 2018, received in his capacity as Deputy CEO (€1,027 thousand per annum) and from July 1, 2018, in his capacity as CEO (€1,053 thousand per annum).
2 The 2018 and 2019 salaries have been converted from U.S. dollars into euros, for 2019 using the 2019 year-to-date average dollar-euro exchange rate of 0.8934, for 2018 using the 2018 year-to-date average dollar-euro exchange rate of 0.8476.
3 The 2018 remuneration reflects the remuneration for the period from his appointment to the Management Board on April 11, 2018 (€630 thousand per annum).
Annual cash incentive plan: EIPThe members of the Management Board participated in the annual cash-based Executive Committee Incentive Plan (EIP). The 2019 EIP employed three financial measures: sales growth (30%), underlying operating margin (30%), and operating cash flow (20%). In addition, key strategic imperatives (20%) were included. For 2019, the single strategic imperative was consumer online sales growth.
Performance targets are revised annually to ensure they are challenging but realistic. Ahold Delhaize does not disclose the actual targets per performance measure, as this would require the disclosure of commercially sensitive information.
The on-target payout as a percentage of base salary was 100%, contingent on the full achievement of the objectives, with a cap at 150% of the target in the event of above-target performance.
Performance realizedPerformance measure Weight Performance multiplier
2019 2018
Sales growth (ex. gasoline) 30% 56% 97%Underlying operating margin 30% 84% 94%Operating cash flow 20%1 96% 146%Strategic imperatives 20%2 139% 100%Total (%) 100% 89% 111%
1 In 2018, 30% of the EIP performance was based on operating cash flow.2 In 2018, 10% of the EIP performance was based on personal objectives.
Actual EIP payout2019 2018
€ thousandBase
salary Target bonusPerformance
multiplierActualbonus1
Actualbonus4
Frans Muller Chief Executive Officer 1,085
100% of base salary: €1,085 89% 965 1,196
Jeff Carr Chief Financial Officer 769
100% of base salary: €769 89% 685 830
Kevin Holt2 CEO Ahold Delhaize USA 955
100% of base salary: €955 89% 851 972
Wouter Kolk3
CEO Ahold Delhaize Europe and Indonesia 649
100% of base salary: €649 89% 578 508
1 The 2019 EIP represents accrued annual cash incentives to be paid in 2020, subject to shareholder approval of the financial statements.
2 The 2018 and 2019 figures have been converted from U.S. dollars into euros, for 2019 using the 2019 year-to-date average dollar-euro exchange rate of 0.8934, for 2018 using the 2018 year-to-date average dollar-euro exchange rate of 0.8476.
3 The 2018 remuneration reflects the remuneration for the period from his appointment to the Management Board on April 11, 2018.
4 The 2018 EIP represents the actual amount paid in 2019.
Financial statements Other informationStrategic Report Governance Financial performance AppendixGovernance RemunerationOur business Performance review Ahold Delhaize Annual Report 2019 110
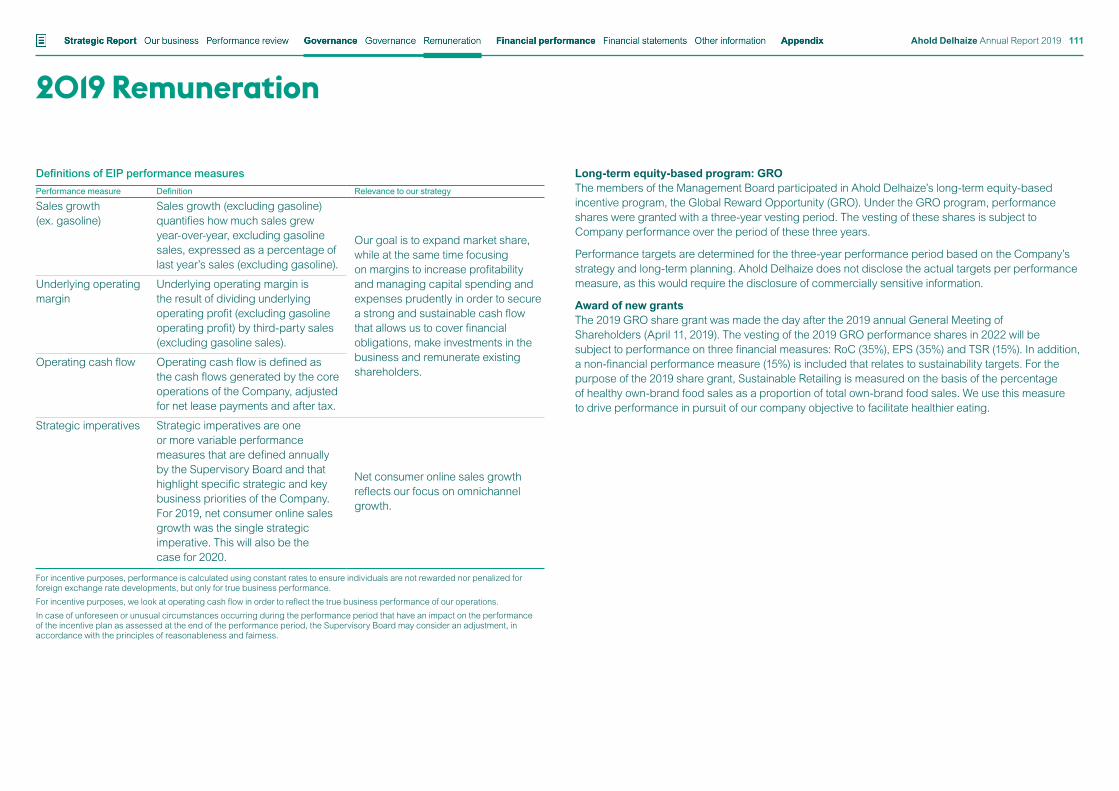
2019 Remuneration
Definitions of EIP performance measuresPerformance measure Definition Relevance to our strategy
Sales growth (ex. gasoline)
Sales growth (excluding gasoline) quantifies how much sales grew year-over-year, excluding gasoline sales, expressed as a percentage of last year’s sales (excluding gasoline).
Our goal is to expand market share, while at the same time focusing on margins to increase profitability and managing capital spending and expenses prudently in order to secure a strong and sustainable cash flow that allows us to cover financial obligations, make investments in the business and remunerate existing shareholders.
Underlying operating margin
Underlying operating margin is the result of dividing underlying operating profit (excluding gasoline operating profit) by third-party sales (excluding gasoline sales).
Operating cash flow Operating cash flow is defined as the cash flows generated by the core operations of the Company, adjusted for net lease payments and after tax.
Strategic imperatives Strategic imperatives are one or more variable performance measures that are defined annually by the Supervisory Board and that highlight specific strategic and key business priorities of the Company. For 2019, net consumer online sales growth was the single strategic imperative. This will also be the case for 2020.
Net consumer online sales growth reflects our focus on omnichannel growth.
For incentive purposes, performance is calculated using constant rates to ensure individuals are not rewarded nor penalized for foreign exchange rate developments, but only for true business performance.For incentive purposes, we look at operating cash flow in order to reflect the true business performance of our operations.In case of unforeseen or unusual circumstances occurring during the performance period that have an impact on the performance of the incentive plan as assessed at the end of the performance period, the Supervisory Board may consider an adjustment, in accordance with the principles of reasonableness and fairness.
Long-term equity-based program: GROThe members of the Management Board participated in Ahold Delhaize’s long-term equity-based incentive program, the Global Reward Opportunity (GRO). Under the GRO program, performance shares were granted with a three-year vesting period. The vesting of these shares is subject to Company performance over the period of these three years.
Performance targets are determined for the three-year performance period based on the Company’s strategy and long-term planning. Ahold Delhaize does not disclose the actual targets per performance measure, as this would require the disclosure of commercially sensitive information.
Award of new grantsThe 2019 GRO share grant was made the day after the 2019 annual General Meeting of Shareholders (April 11, 2019). The vesting of the 2019 GRO performance shares in 2022 will be subject to performance on three financial measures: RoC (35%), EPS (35%) and TSR (15%). In addition, a non-financial performance measure (15%) is included that relates to sustainability targets. For the purpose of the 2019 share grant, Sustainable Retailing is measured on the basis of the percentage of healthy own-brand food sales as a proportion of total own-brand food sales. We use this measure to drive performance in pursuit of our company objective to facilitate healthier eating.
Financial statements Other informationStrategic Report Governance Financial performance AppendixGovernance RemunerationOur business Performance review Ahold Delhaize Annual Report 2019 111
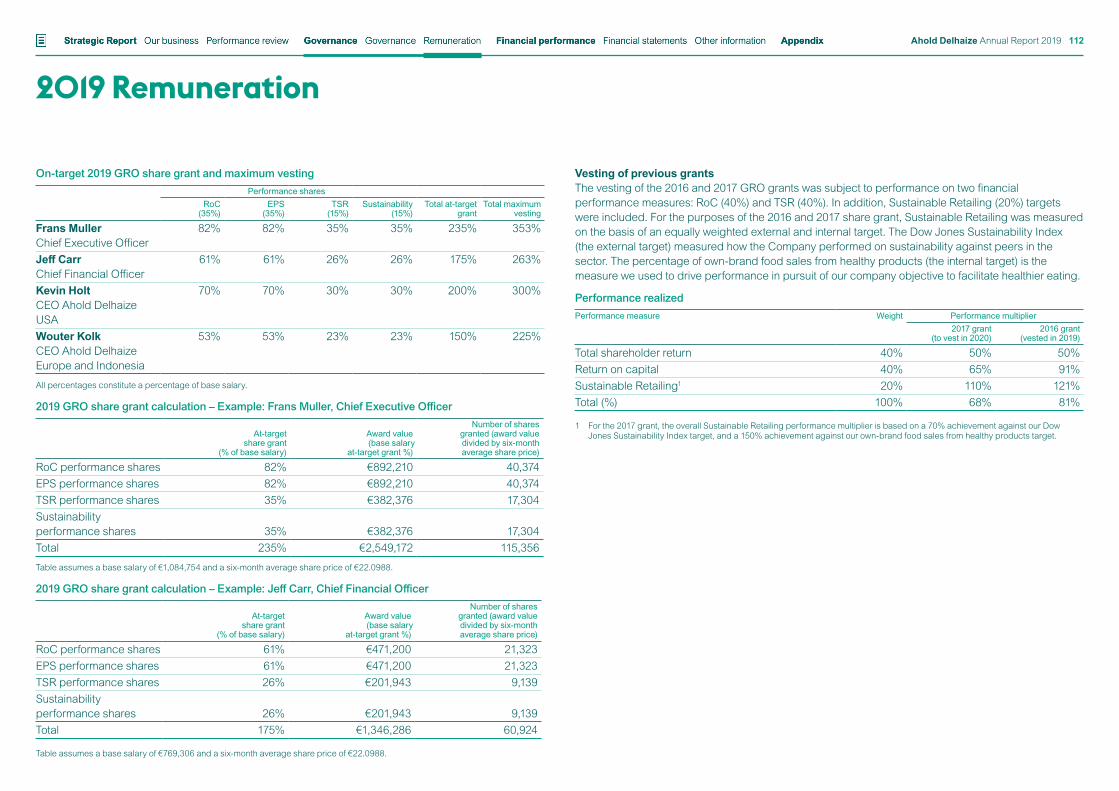
2019 Remuneration
On-target 2019 GRO share grant and maximum vestingPerformance shares
RoC (35%)
EPS (35%)
TSR (15%)
Sustainability (15%)
Total at-target grant
Total maximum vesting
Frans Muller Chief Executive Officer
82% 82% 35% 35% 235% 353%
Jeff Carr Chief Financial Officer
61% 61% 26% 26% 175% 263%
Kevin Holt CEO Ahold Delhaize USA
70% 70% 30% 30% 200% 300%
Wouter Kolk CEO Ahold Delhaize Europe and Indonesia
53% 53% 23% 23% 150% 225%
All percentages constitute a percentage of base salary.
2019 GRO share grant calculation – Example: Frans Muller, Chief Executive Officer
At-target share grant
(% of base salary)
Award value(base salary
at-target grant %)
Number of shares granted (award value divided by six-month average share price)
RoC performance shares 82% €892,210 40,374EPS performance shares 82% €892,210 40,374TSR performance shares 35% €382,376 17,304Sustainability performance shares 35% €382,376 17,304Total 235% €2,549,172 115,356
Table assumes a base salary of €1,084,754 and a six-month average share price of €22.0988.
2019 GRO share grant calculation – Example: Jeff Carr, Chief Financial Officer
At-target share grant
(% of base salary)
Award value(base salary
at-target grant %)
Number of shares granted (award value divided by six-month average share price)
RoC performance shares 61% €471,200 21,323EPS performance shares 61% €471,200 21,323TSR performance shares 26% €201,943 9,139Sustainability performance shares 26% €201,943 9,139Total 175% €1,346,286 60,924
Table assumes a base salary of €769,306 and a six-month average share price of €22.0988.
Vesting of previous grantsThe vesting of the 2016 and 2017 GRO grants was subject to performance on two financial performance measures: RoC (40%) and TSR (40%). In addition, Sustainable Retailing (20%) targets were included. For the purposes of the 2016 and 2017 share grant, Sustainable Retailing was measured on the basis of an equally weighted external and internal target. The Dow Jones Sustainability Index (the external target) measured how the Company performed on sustainability against peers in the sector. The percentage of own-brand food sales from healthy products (the internal target) is the measure we used to drive performance in pursuit of our company objective to facilitate healthier eating.
Performance realizedPerformance measure Weight Performance multiplier
2017 grant (to vest in 2020)
2016 grant (vested in 2019)
Total shareholder return 40% 50% 50%Return on capital 40% 65% 91%Sustainable Retailing1 20% 110% 121%Total (%) 100% 68% 81%
1 For the 2017 grant, the overall Sustainable Retailing performance multiplier is based on a 70% achievement against our Dow Jones Sustainability Index target, and a 150% achievement against our own-brand food sales from healthy products target.
Financial statements Other informationStrategic Report Governance Financial performance AppendixGovernance RemunerationOur business Performance review Ahold Delhaize Annual Report 2019 112
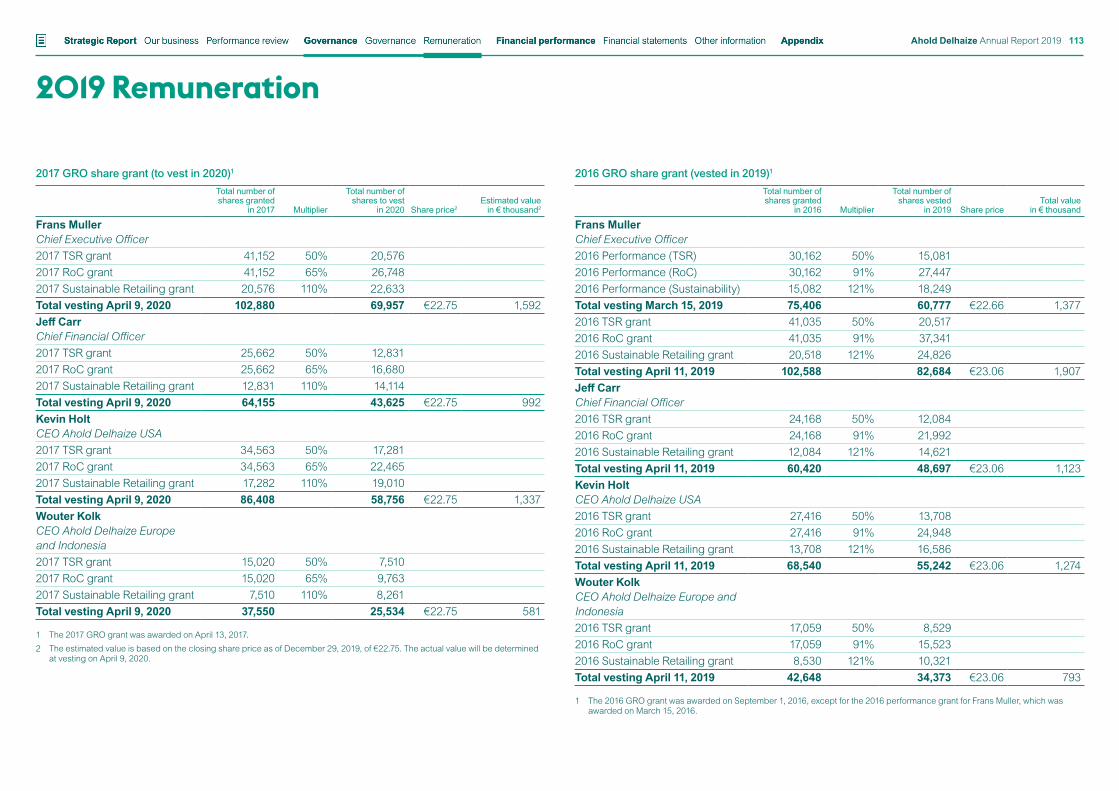
2019 Remuneration
2017 GRO share grant (to vest in 2020)1
Total number of shares granted
in 2017 Multiplier
Total number of shares to vest
in 2020 Share price2Estimated value
in € thousand2
Frans Muller Chief Executive Officer2017 TSR grant 41,152 50% 20,5762017 RoC grant 41,152 65% 26,7482017 Sustainable Retailing grant 20,576 110% 22,633Total vesting April 9, 2020 102,880 69,957 €22.75 1,592Jeff Carr Chief Financial Officer2017 TSR grant 25,662 50% 12,8312017 RoC grant 25,662 65% 16,6802017 Sustainable Retailing grant 12,831 110% 14,114Total vesting April 9, 2020 64,155 43,625 €22.75 992Kevin Holt CEO Ahold Delhaize USA2017 TSR grant 34,563 50% 17,2812017 RoC grant 34,563 65% 22,4652017 Sustainable Retailing grant 17,282 110% 19,010Total vesting April 9, 2020 86,408 58,756 €22.75 1,337Wouter Kolk CEO Ahold Delhaize Europe and Indonesia2017 TSR grant 15,020 50% 7,5102017 RoC grant 15,020 65% 9,7632017 Sustainable Retailing grant 7,510 110% 8,261Total vesting April 9, 2020 37,550 25,534 €22.75 581
1 The 2017 GRO grant was awarded on April 13, 2017.2 The estimated value is based on the closing share price as of December 29, 2019, of €22.75. The actual value will be determined
at vesting on April 9, 2020.
2016 GRO share grant (vested in 2019)1
Total number of shares granted
in 2016 Multiplier
Total number of shares vested
in 2019 Share priceTotal value
in € thousand
Frans Muller Chief Executive Officer2016 Performance (TSR) 30,162 50% 15,0812016 Performance (RoC) 30,162 91% 27,4472016 Performance (Sustainability) 15,082 121% 18,249Total vesting March 15, 2019 75,406 60,777 €22.66 1,3772016 TSR grant 41,035 50% 20,5172016 RoC grant 41,035 91% 37,3412016 Sustainable Retailing grant 20,518 121% 24,826Total vesting April 11, 2019 102,588 82,684 €23.06 1,907Jeff Carr Chief Financial Officer2016 TSR grant 24,168 50% 12,0842016 RoC grant 24,168 91% 21,9922016 Sustainable Retailing grant 12,084 121% 14,621Total vesting April 11, 2019 60,420 48,697 €23.06 1,123Kevin Holt CEO Ahold Delhaize USA2016 TSR grant 27,416 50% 13,7082016 RoC grant 27,416 91% 24,9482016 Sustainable Retailing grant 13,708 121% 16,586Total vesting April 11, 2019 68,540 55,242 €23.06 1,274Wouter Kolk CEO Ahold Delhaize Europe and Indonesia2016 TSR grant 17,059 50% 8,5292016 RoC grant 17,059 91% 15,5232016 Sustainable Retailing grant 8,530 121% 10,321Total vesting April 11, 2019 42,648 34,373 €23.06 793
1 The 2016 GRO grant was awarded on September 1, 2016, except for the 2016 performance grant for Frans Muller, which was awarded on March 15, 2016.
Financial statements Other informationStrategic Report Governance Financial performance AppendixGovernance RemunerationOur business Performance review Ahold Delhaize Annual Report 2019 113
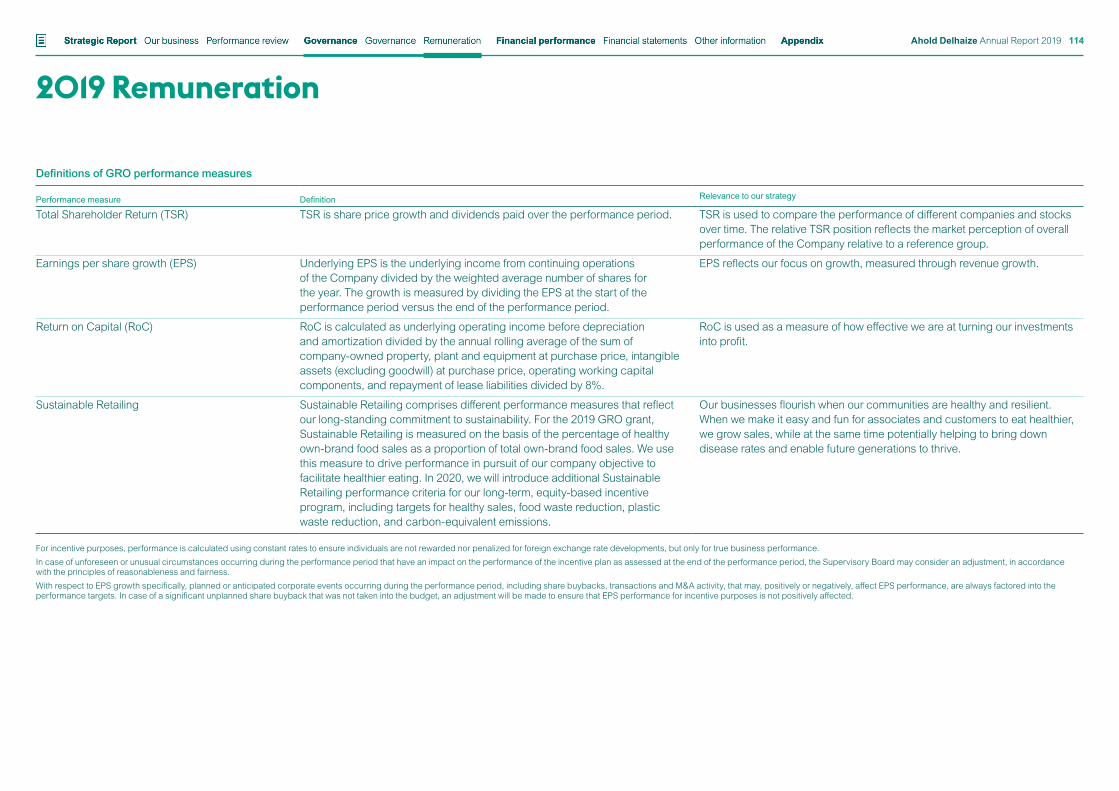
2019 Remuneration
Definitions of GRO performance measures
Performance measure Definition Relevance to our strategy
Total Shareholder Return (TSR) TSR is share price growth and dividends paid over the performance period. TSR is used to compare the performance of different companies and stocks over time. The relative TSR position reflects the market perception of overall performance of the Company relative to a reference group.
Earnings per share growth (EPS) Underlying EPS is the underlying income from continuing operations of the Company divided by the weighted average number of shares for the year. The growth is measured by dividing the EPS at the start of the performance period versus the end of the performance period.
EPS reflects our focus on growth, measured through revenue growth.
Return on Capital (RoC) RoC is calculated as underlying operating income before depreciation and amortization divided by the annual rolling average of the sum of company-owned property, plant and equipment at purchase price, intangible assets (excluding goodwill) at purchase price, operating working capital components, and repayment of lease liabilities divided by 8%.
RoC is used as a measure of how effective we are at turning our investments into profit.
Sustainable Retailing Sustainable Retailing comprises different performance measures that reflect our long-standing commitment to sustainability. For the 2019 GRO grant, Sustainable Retailing is measured on the basis of the percentage of healthy own-brand food sales as a proportion of total own-brand food sales. We use this measure to drive performance in pursuit of our company objective to facilitate healthier eating. In 2020, we will introduce additional Sustainable Retailing performance criteria for our long-term, equity-based incentive program, including targets for healthy sales, food waste reduction, plastic waste reduction, and carbon-equivalent emissions.
Our businesses flourish when our communities are healthy and resilient. When we make it easy and fun for associates and customers to eat healthier, we grow sales, while at the same time potentially helping to bring down disease rates and enable future generations to thrive.
For incentive purposes, performance is calculated using constant rates to ensure individuals are not rewarded nor penalized for foreign exchange rate developments, but only for true business performance.In case of unforeseen or unusual circumstances occurring during the performance period that have an impact on the performance of the incentive plan as assessed at the end of the performance period, the Supervisory Board may consider an adjustment, in accordance with the principles of reasonableness and fairness.With respect to EPS growth specifically, planned or anticipated corporate events occurring during the performance period, including share buybacks, transactions and M&A activity, that may, positively or negatively, affect EPS performance, are always factored into the performance targets. In case of a significant unplanned share buyback that was not taken into the budget, an adjustment will be made to ensure that EPS performance for incentive purposes is not positively affected.
Financial statements Other informationStrategic Report Governance Financial performance AppendixGovernance RemunerationOur business Performance review Ahold Delhaize Annual Report 2019 114
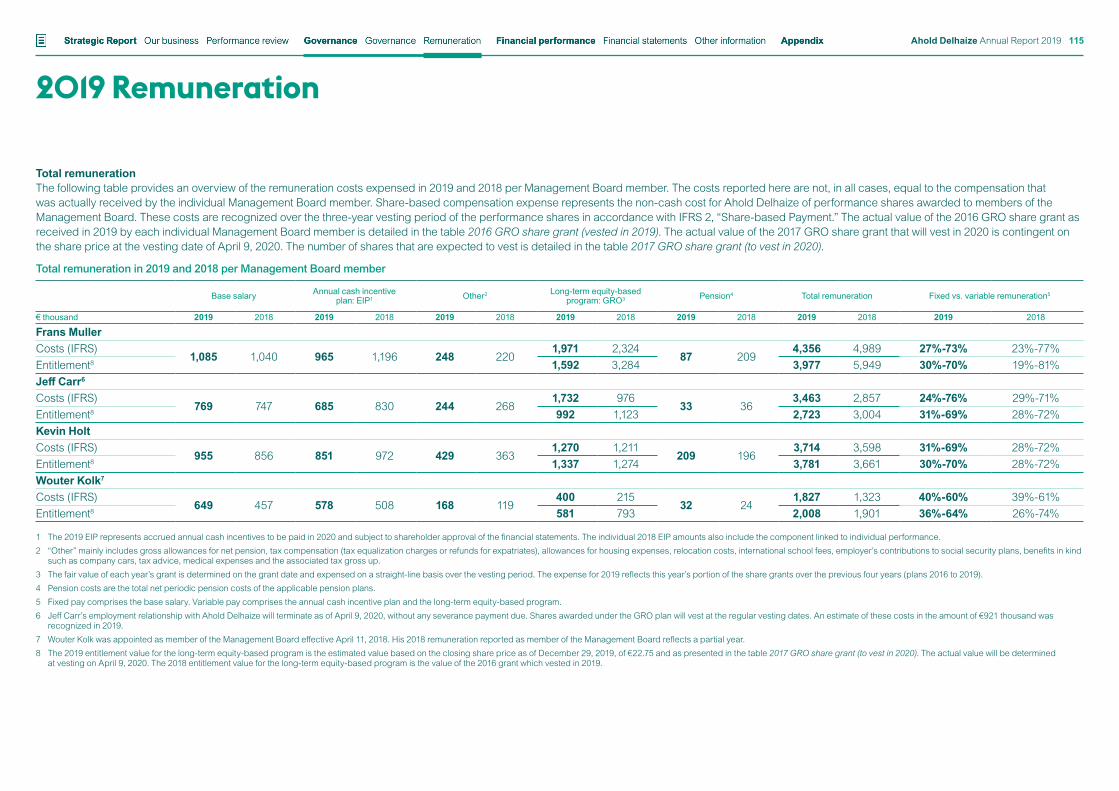
Total remunerationThe following table provides an overview of the remuneration costs expensed in 2019 and 2018 per Management Board member. The costs reported here are not, in all cases, equal to the compensation that was actually received by the individual Management Board member. Share-based compensation expense represents the non-cash cost for Ahold Delhaize of performance shares awarded to members of the Management Board. These costs are recognized over the three-year vesting period of the performance shares in accordance with IFRS 2, “Share-based Payment.” The actual value of the 2016 GRO share grant as received in 2019 by each individual Management Board member is detailed in the table 2016 GRO share grant (vested in 2019). The actual value of the 2017 GRO share grant that will vest in 2020 is contingent on the share price at the vesting date of April 9, 2020. The number of shares that are expected to vest is detailed in the table 2017 GRO share grant (to vest in 2020).
Total remuneration in 2019 and 2018 per Management Board member
Base salary Annual cash incentive plan: EIP1 Other2 Long-term equity-based
program: GRO3 Pension4 Total remuneration Fixed vs. variable remuneration5
€ thousand 2019 2018 2019 2018 2019 2018 2019 2018 2019 2018 2019 2018 2019 2018
Frans MullerCosts (IFRS)
1,085 1,040 965 1,196 248 2201,971 2,324
87 2094,356 4,989 27%-73% 23%-77%
Entitlement8 1,592 3,284 3,977 5,949 30%-70% 19%-81%Jeff Carr6
Costs (IFRS)769 747 685 830 244 268
1,732 97633 36
3,463 2,857 24%-76% 29%-71%Entitlement8 992 1,123 2,723 3,004 31%-69% 28%-72%Kevin HoltCosts (IFRS)
955 856 851 972 429 3631,270 1,211
209 1963,714 3,598 31%-69% 28%-72%
Entitlement8 1,337 1,274 3,781 3,661 30%-70% 28%-72%Wouter Kolk7
Costs (IFRS)649 457 578 508 168 119
400 21532 24
1,827 1,323 40%-60% 39%-61%Entitlement8 581 793 2,008 1,901 36%-64% 26%-74%
1 The 2019 EIP represents accrued annual cash incentives to be paid in 2020 and subject to shareholder approval of the financial statements. The individual 2018 EIP amounts also include the component linked to individual performance.2 “Other” mainly includes gross allowances for net pension, tax compensation (tax equalization charges or refunds for expatriates), allowances for housing expenses, relocation costs, international school fees, employer’s contributions to social security plans, benefits in kind
such as company cars, tax advice, medical expenses and the associated tax gross up.3 The fair value of each year’s grant is determined on the grant date and expensed on a straight-line basis over the vesting period. The expense for 2019 reflects this year’s portion of the share grants over the previous four years (plans 2016 to 2019).4 Pension costs are the total net periodic pension costs of the applicable pension plans.5 Fixed pay comprises the base salary. Variable pay comprises the annual cash incentive plan and the long-term equity-based program.6 Jeff Carr’s employment relationship with Ahold Delhaize will terminate as of April 9, 2020, without any severance payment due. Shares awarded under the GRO plan will vest at the regular vesting dates. An estimate of these costs in the amount of €921 thousand was
recognized in 2019.7 Wouter Kolk was appointed as member of the Management Board effective April 11, 2018. His 2018 remuneration reported as member of the Management Board reflects a partial year.8 The 2019 entitlement value for the long-term equity-based program is the estimated value based on the closing share price as of December 29, 2019, of €22.75 and as presented in the table 2017 GRO share grant (to vest in 2020). The actual value will be determined
at vesting on April 9, 2020. The 2018 entitlement value for the long-term equity-based program is the value of the 2016 grant which vested in 2019.
2019 RemunerationFinancial statements Other informationStrategic Report Governance Financial performance AppendixGovernance RemunerationOur business Performance review Ahold Delhaize Annual Report 2019 115
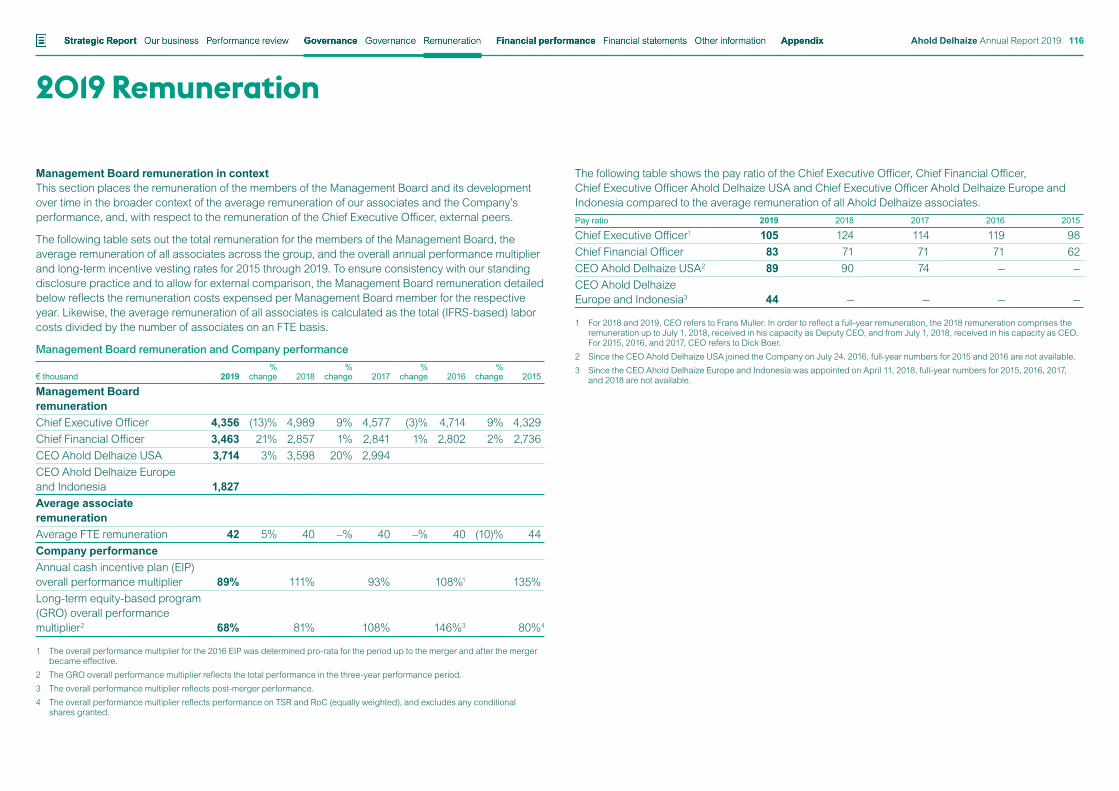
2019 Remuneration
Management Board remuneration in contextThis section places the remuneration of the members of the Management Board and its development over time in the broader context of the average remuneration of our associates and the Company’s performance, and, with respect to the remuneration of the Chief Executive Officer, external peers.
The following table sets out the total remuneration for the members of the Management Board, the average remuneration of all associates across the group, and the overall annual performance multiplier and long-term incentive vesting rates for 2015 through 2019. To ensure consistency with our standing disclosure practice and to allow for external comparison, the Management Board remuneration detailed below reflects the remuneration costs expensed per Management Board member for the respective year. Likewise, the average remuneration of all associates is calculated as the total (IFRS-based) labor costs divided by the number of associates on an FTE basis.
Management Board remuneration and Company performance
€ thousand 2019%
change 2018%
change 2017%
change 2016%
change 2015
Management Board remunerationChief Executive Officer 4,356 (13)% 4,989 9% 4,577 (3)% 4,714 9% 4,329Chief Financial Officer 3,463 21% 2,857 1% 2,841 1% 2,802 2% 2,736CEO Ahold Delhaize USA 3,714 3% 3,598 20% 2,994CEO Ahold Delhaize Europe and Indonesia 1,827Average associate remunerationAverage FTE remuneration 42 5% 40 –% 40 –% 40 (10)% 44Company performanceAnnual cash incentive plan (EIP) overall performance multiplier 89% 111% 93% 108%1 135%Long-term equity-based program (GRO) overall performance multiplier2 68% 81% 108% 146%3 80%4
1 The overall performance multiplier for the 2016 EIP was determined pro-rata for the period up to the merger and after the merger became effective.
2 The GRO overall performance multiplier reflects the total performance in the three-year performance period.3 The overall performance multiplier reflects post-merger performance.4 The overall performance multiplier reflects performance on TSR and RoC (equally weighted), and excludes any conditional
shares granted.
The following table shows the pay ratio of the Chief Executive Officer, Chief Financial Officer, Chief Executive Officer Ahold Delhaize USA and Chief Executive Officer Ahold Delhaize Europe and Indonesia compared to the average remuneration of all Ahold Delhaize associates.Pay ratio 2019 2018 2017 2016 2015
Chief Executive Officer1 105 124 114 119 98Chief Financial Officer 83 71 71 71 62CEO Ahold Delhaize USA2 89 90 74 — —CEO Ahold Delhaize Europe and Indonesia3 44 — — — —
1 For 2018 and 2019, CEO refers to Frans Muller. In order to reflect a full-year remuneration, the 2018 remuneration comprises the remuneration up to July 1, 2018, received in his capacity as Deputy CEO, and from July 1, 2018, received in his capacity as CEO. For 2015, 2016, and 2017, CEO refers to Dick Boer.
2 Since the CEO Ahold Delhaize USA joined the Company on July 24, 2016, full-year numbers for 2015 and 2016 are not available.3 Since the CEO Ahold Delhaize Europe and Indonesia was appointed on April 11, 2018, full-year numbers for 2015, 2016, 2017,
and 2018 are not available.
Financial statements Other informationStrategic Report Governance Financial performance AppendixGovernance RemunerationOur business Performance review Ahold Delhaize Annual Report 2019 116
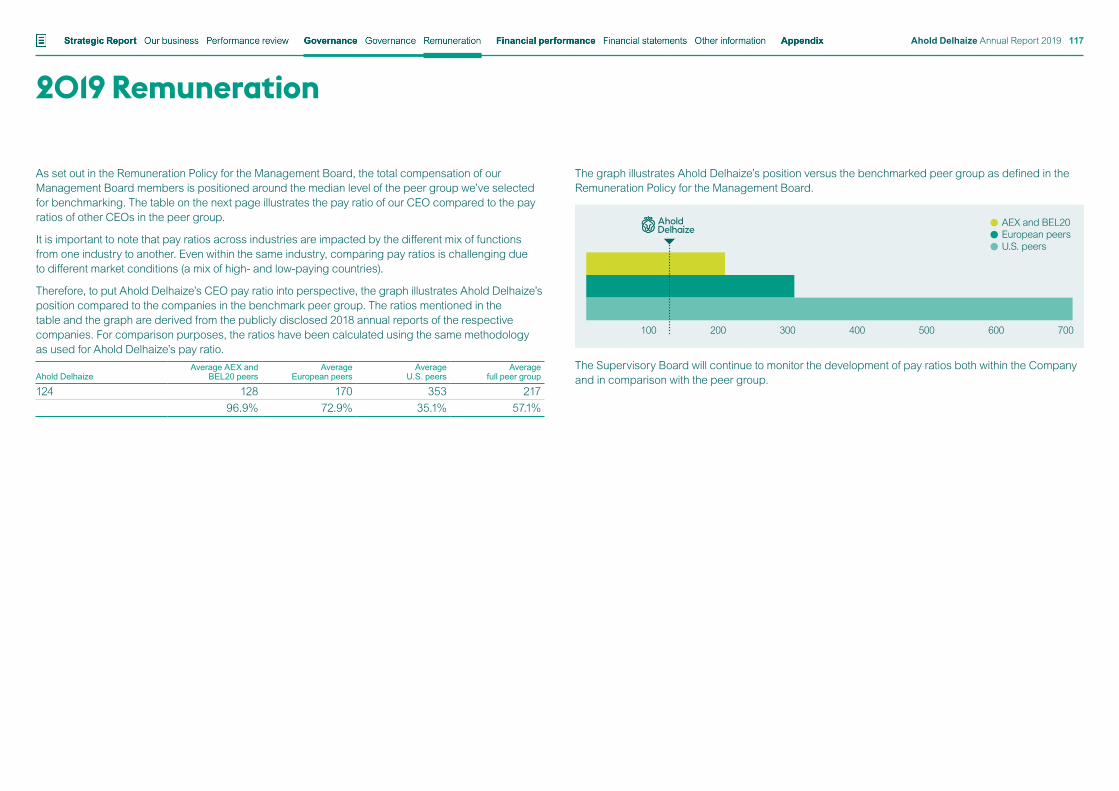
As set out in the Remuneration Policy for the Management Board, the total compensation of our Management Board members is positioned around the median level of the peer group we’ve selected for benchmarking. The table on the next page illustrates the pay ratio of our CEO compared to the pay ratios of other CEOs in the peer group.
It is important to note that pay ratios across industries are impacted by the different mix of functions from one industry to another. Even within the same industry, comparing pay ratios is challenging due to different market conditions (a mix of high- and low-paying countries).
Therefore, to put Ahold Delhaize’s CEO pay ratio into perspective, the graph illustrates Ahold Delhaize’s position compared to the companies in the benchmark peer group. The ratios mentioned in the table and the graph are derived from the publicly disclosed 2018 annual reports of the respective companies. For comparison purposes, the ratios have been calculated using the same methodology as used for Ahold Delhaize’s pay ratio.
Ahold DelhaizeAverage AEX and
BEL20 peersAverage
European peersAverage
U.S. peersAverage
full peer group
124 128 170 353 21796.9% 72.9% 35.1% 57.1%
The graph illustrates Ahold Delhaize’s position versus the benchmarked peer group as defined in the Remuneration Policy for the Management Board.
The Supervisory Board will continue to monitor the development of pay ratios both within the Company and in comparison with the peer group.
2019 Remuneration
200100 300 700600500400
AEX and BEL20European peersU.S. peers
Financial statements Other informationStrategic Report Governance Financial performance AppendixGovernance RemunerationOur business Performance review Ahold Delhaize Annual Report 2019 117
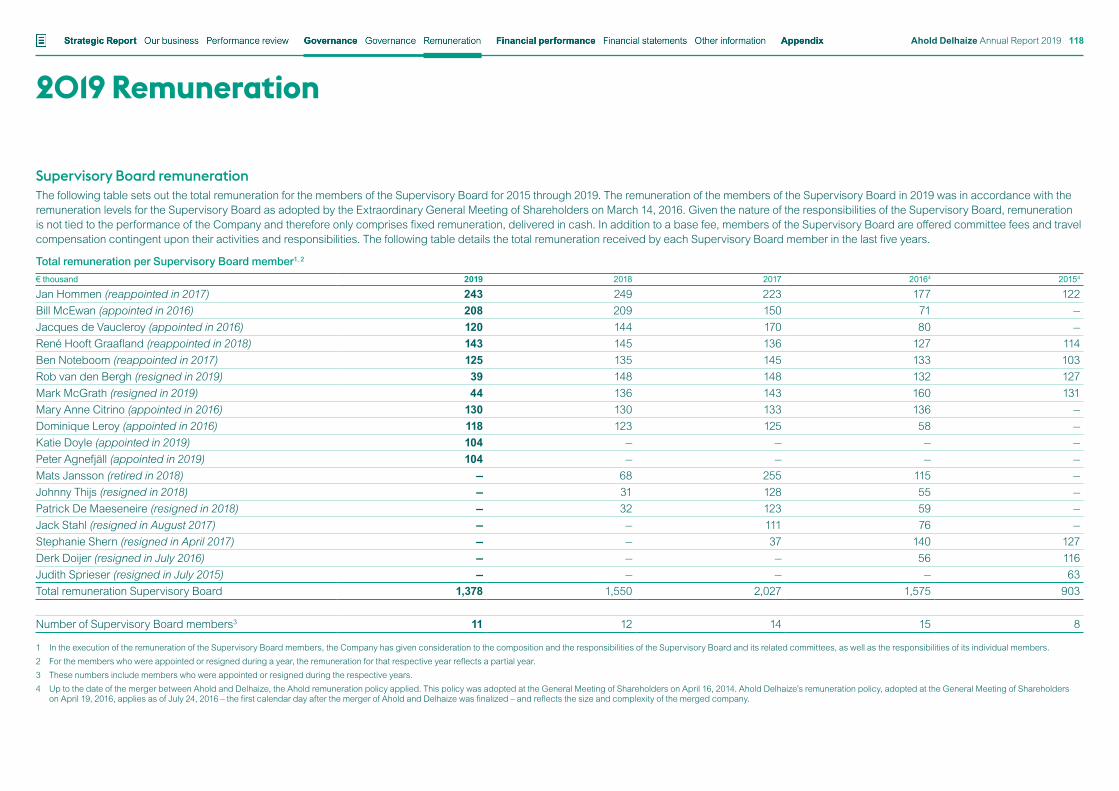
2019 Remuneration
Supervisory Board remunerationThe following table sets out the total remuneration for the members of the Supervisory Board for 2015 through 2019. The remuneration of the members of the Supervisory Board in 2019 was in accordance with the remuneration levels for the Supervisory Board as adopted by the Extraordinary General Meeting of Shareholders on March 14, 2016. Given the nature of the responsibilities of the Supervisory Board, remuneration is not tied to the performance of the Company and therefore only comprises fixed remuneration, delivered in cash. In addition to a base fee, members of the Supervisory Board are offered committee fees and travel compensation contingent upon their activities and responsibilities. The following table details the total remuneration received by each Supervisory Board member in the last five years.
Total remuneration per Supervisory Board member1, 2
€ thousand 2019 2018 2017 20164 20154
Jan Hommen (reappointed in 2017) 243 249 223 177 122Bill McEwan (appointed in 2016) 208 209 150 71 —Jacques de Vaucleroy (appointed in 2016) 120 144 170 80 —René Hooft Graafland (reappointed in 2018) 143 145 136 127 114Ben Noteboom (reappointed in 2017) 125 135 145 133 103Rob van den Bergh (resigned in 2019) 39 148 148 132 127Mark McGrath (resigned in 2019) 44 136 143 160 131Mary Anne Citrino (appointed in 2016) 130 130 133 136 —Dominique Leroy (appointed in 2016) 118 123 125 58 —Katie Doyle (appointed in 2019) 104 — — — —Peter Agnefjäll (appointed in 2019) 104 — — — —Mats Jansson (retired in 2018) — 68 255 115 —Johnny Thijs (resigned in 2018) — 31 128 55 —Patrick De Maeseneire (resigned in 2018) — 32 123 59 —Jack Stahl (resigned in August 2017) — — 111 76 —Stephanie Shern (resigned in April 2017) — — 37 140 127Derk Doijer (resigned in July 2016) — — — 56 116Judith Sprieser (resigned in July 2015) — — — — 63Total remuneration Supervisory Board 1,378 1,550 2,027 1,575 903
Number of Supervisory Board members3 11 12 14 15 8
1 In the execution of the remuneration of the Supervisory Board members, the Company has given consideration to the composition and the responsibilities of the Supervisory Board and its related committees, as well as the responsibilities of its individual members.2 For the members who were appointed or resigned during a year, the remuneration for that respective year reflects a partial year.3 These numbers include members who were appointed or resigned during the respective years.4 Up to the date of the merger between Ahold and Delhaize, the Ahold remuneration policy applied. This policy was adopted at the General Meeting of Shareholders on April 16, 2014. Ahold Delhaize’s remuneration policy, adopted at the General Meeting of Shareholders
on April 19, 2016, applies as of July 24, 2016 – the first calendar day after the merger of Ahold and Delhaize was finalized – and reflects the size and complexity of the merged company.
Financial statements Other informationStrategic Report Governance Financial performance AppendixGovernance RemunerationOur business Performance review Ahold Delhaize Annual Report 2019 118
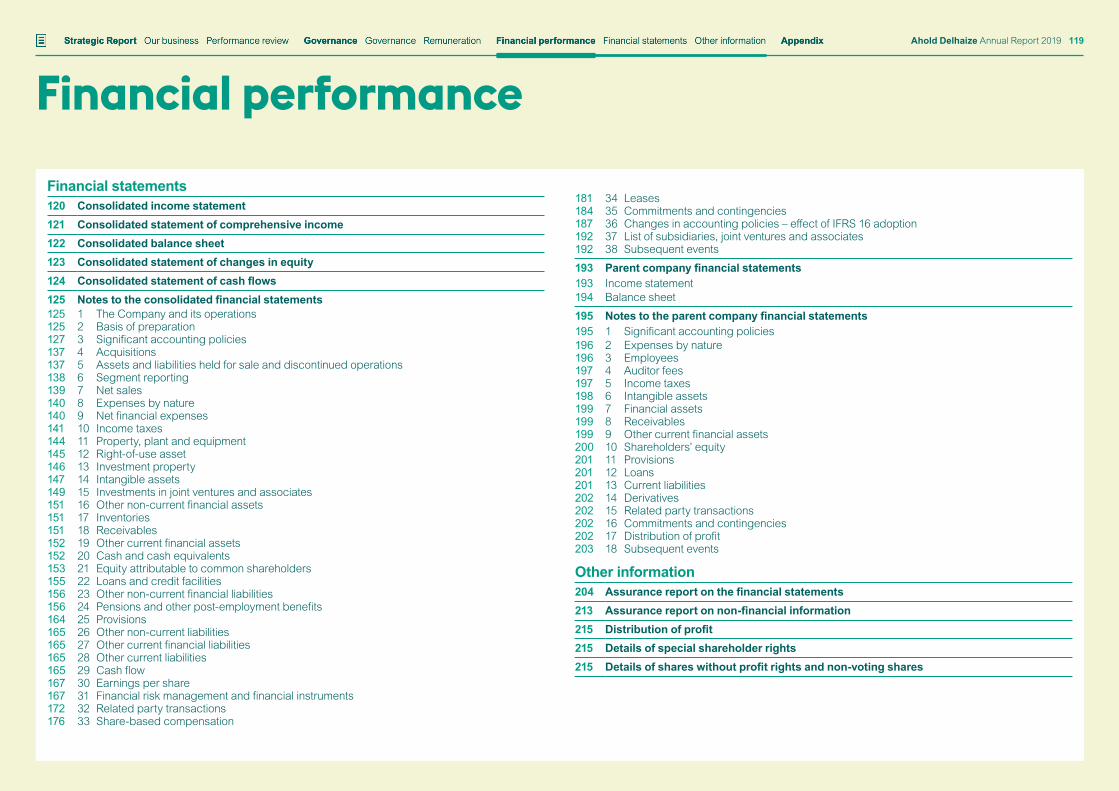
Financial statements120 Consolidated income statement
121 Consolidated statement of comprehensive income
122 Consolidated balance sheet
123 Consolidated statement of changes in equity
124 Consolidated statement of cash flows
125 Notes to the consolidated financial statements125 1 The Company and its operations125 2 Basis of preparation127 3 Significant accounting policies137 4 Acquisitions137 5 Assets and liabilities held for sale and discontinued operations138 6 Segment reporting139 7 Net sales140 8 Expenses by nature140 9 Net financial expenses141 10 Income taxes144 11 Property, plant and equipment145 12 Right-of-use asset146 13 Investment property147 14 Intangible assets149 15 Investments in joint ventures and associates151 16 Other non-current financial assets151 17 Inventories151 18 Receivables152 19 Other current financial assets152 20 Cash and cash equivalents153 21 Equity attributable to common shareholders155 22 Loans and credit facilities156 23 Other non-current financial liabilities156 24 Pensions and other post-employment benefits164 25 Provisions165 26 Other non-current liabilities165 27 Other current financial liabilities165 28 Other current liabilities165 29 Cash flow167 30 Earnings per share167 31 Financial risk management and financial instruments172 32 Related party transactions176 33 Share-based compensation
181 34 Leases184 35 Commitments and contingencies187 36 Changes in accounting policies – effect of IFRS 16 adoption192 37 List of subsidiaries, joint ventures and associates192 38 Subsequent events
193 Parent company financial statements193 Income statement194 Balance sheet
195 Notes to the parent company financial statements195 1 Significant accounting policies196 2 Expenses by nature196 3 Employees197 4 Auditor fees197 5 Income taxes198 6 Intangible assets199 7 Financial assets199 8 Receivables199 9 Other current financial assets200 10 Shareholders’ equity201 11 Provisions201 12 Loans201 13 Current liabilities202 14 Derivatives202 15 Related party transactions202 16 Commitments and contingencies202 17 Distribution of profit203 18 Subsequent events
Other information204 Assurance report on the financial statements
213 Assurance report on non-financial information
215 Distribution of profit
215 Details of special shareholder rights
215 Details of shares without profit rights and non-voting shares
Financial performanceFinancial statements Other informationStrategic Report Governance Financial performance AppendixGovernance RemunerationOur business Performance review Ahold Delhaize Annual Report 2019 119
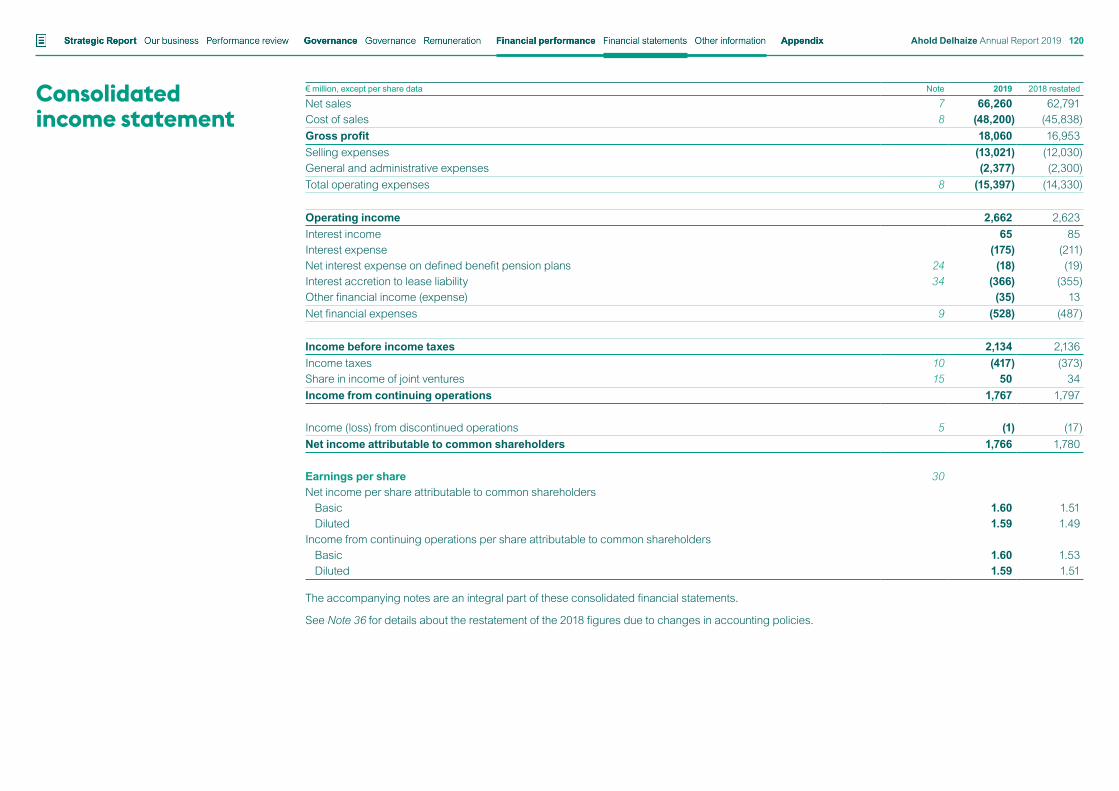
Consolidated income statement
€ million, except per share data Note 2019 2018 restated
Net sales 7 66,260 62,791Cost of sales 8 (48,200) (45,838)Gross profit 18,060 16,953Selling expenses (13,021) (12,030)General and administrative expenses (2,377) (2,300)Total operating expenses 8 (15,397) (14,330)
Operating income 2,662 2,623Interest income 65 85Interest expense (175) (211)Net interest expense on defined benefit pension plans 24 (18) (19)Interest accretion to lease liability 34 (366) (355)Other financial income (expense) (35) 13Net financial expenses 9 (528) (487)
Income before income taxes 2,134 2,136Income taxes 10 (417) (373)Share in income of joint ventures 15 50 34Income from continuing operations 1,767 1,797
Income (loss) from discontinued operations 5 (1) (17)Net income attributable to common shareholders 1,766 1,780
Earnings per share 30Net income per share attributable to common shareholders
Basic 1.60 1.51Diluted 1.59 1.49
Income from continuing operations per share attributable to common shareholdersBasic 1.60 1.53Diluted 1.59 1.51
The accompanying notes are an integral part of these consolidated financial statements.
See Note 36 for details about the restatement of the 2018 figures due to changes in accounting policies.
Financial statements Other informationStrategic Report Governance Financial performance AppendixGovernance RemunerationOur business Performance review Ahold Delhaize Annual Report 2019 120
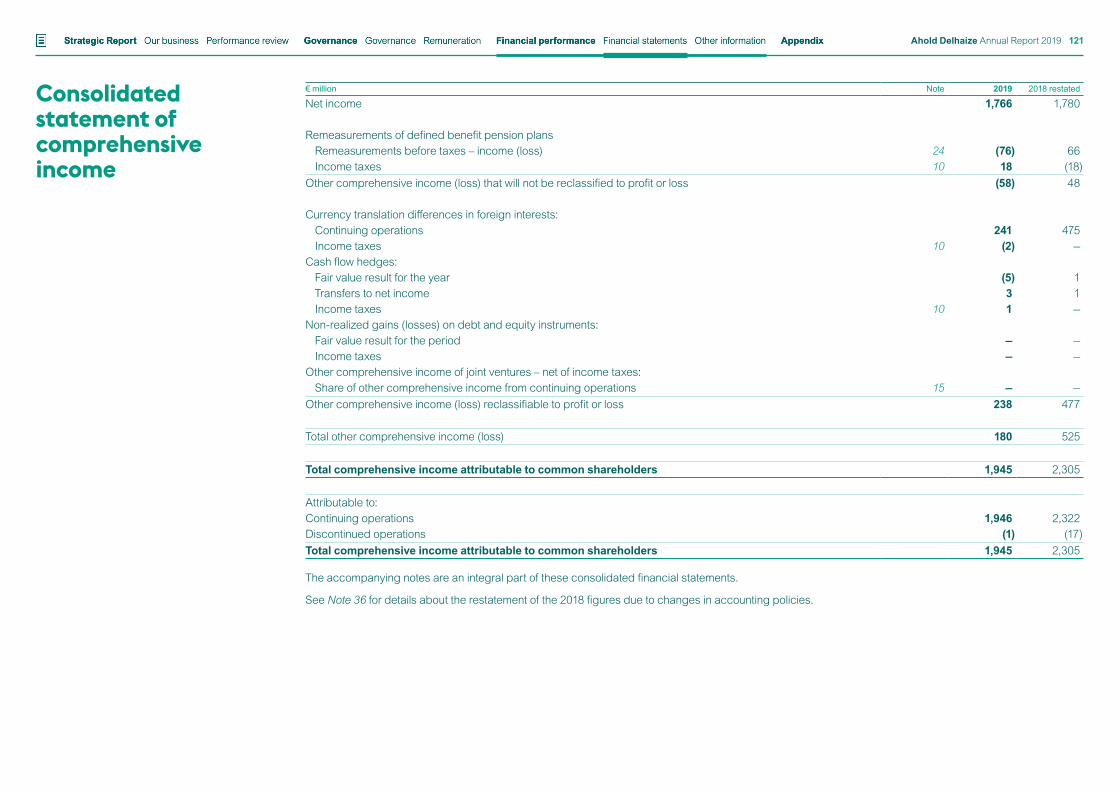
Consolidated statement of comprehensive income
€ million Note 2019 2018 restated
Net income 1,766 1,780
Remeasurements of defined benefit pension plansRemeasurements before taxes – income (loss) 24 (76) 66Income taxes 10 18 (18)
Other comprehensive income (loss) that will not be reclassified to profit or loss (58) 48
Currency translation differences in foreign interests:Continuing operations 241 475Income taxes 10 (2) —
Cash flow hedges:Fair value result for the year (5) 1Transfers to net income 3 1Income taxes 10 1 —
Non-realized gains (losses) on debt and equity instruments:Fair value result for the period — —Income taxes — —
Other comprehensive income of joint ventures – net of income taxes:Share of other comprehensive income from continuing operations 15 — —
Other comprehensive income (loss) reclassifiable to profit or loss 238 477
Total other comprehensive income (loss) 180 525
Total comprehensive income attributable to common shareholders 1,945 2,305
Attributable to:Continuing operations 1,946 2,322Discontinued operations (1) (17)Total comprehensive income attributable to common shareholders 1,945 2,305
The accompanying notes are an integral part of these consolidated financial statements.
See Note 36 for details about the restatement of the 2018 figures due to changes in accounting policies.
Financial statements Other informationStrategic Report Governance Financial performance AppendixGovernance RemunerationOur business Performance review Ahold Delhaize Annual Report 2019 121
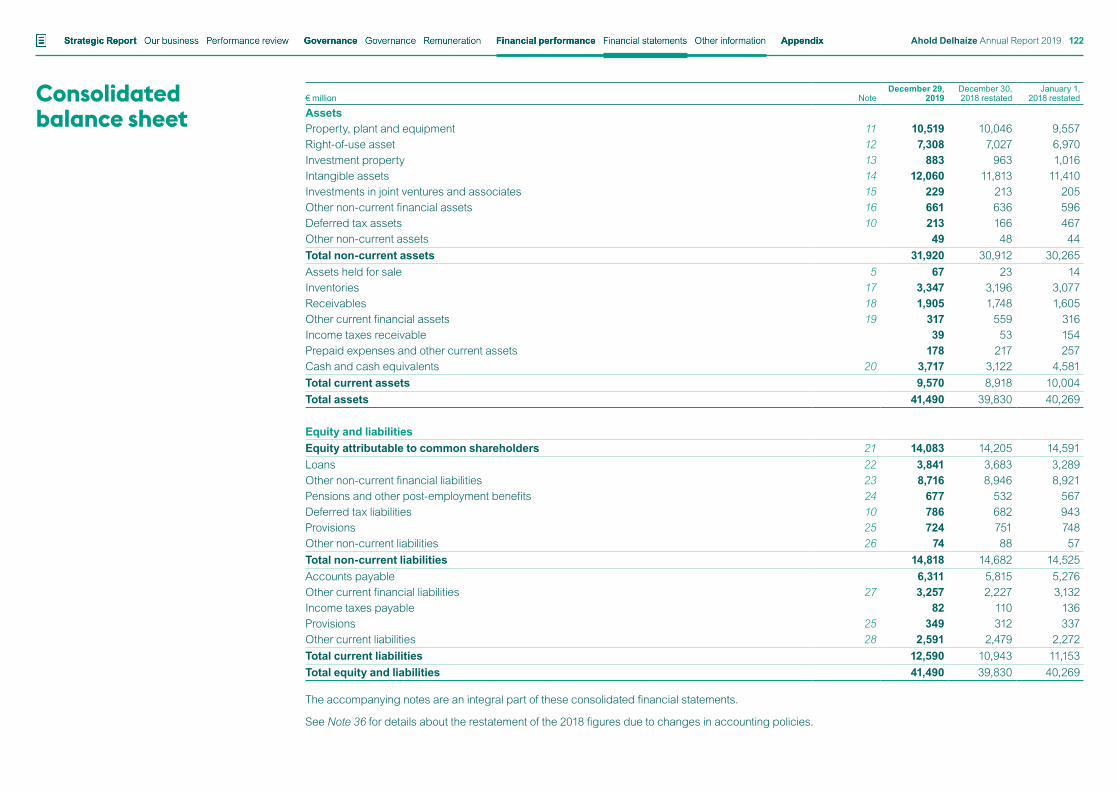
Consolidated balance sheet
€ million NoteDecember 29,
2019December 30, 2018 restated
January 1, 2018 restated
AssetsProperty, plant and equipment 11 10,519 10,046 9,557Right-of-use asset 12 7,308 7,027 6,970Investment property 13 883 963 1,016Intangible assets 14 12,060 11,813 11,410Investments in joint ventures and associates 15 229 213 205Other non-current financial assets 16 661 636 596Deferred tax assets 10 213 166 467Other non-current assets 49 48 44Total non-current assets 31,920 30,912 30,265Assets held for sale 5 67 23 14Inventories 17 3,347 3,196 3,077Receivables 18 1,905 1,748 1,605Other current financial assets 19 317 559 316Income taxes receivable 39 53 154Prepaid expenses and other current assets 178 217 257Cash and cash equivalents 20 3,717 3,122 4,581Total current assets 9,570 8,918 10,004Total assets 41,490 39,830 40,269
Equity and liabilitiesEquity attributable to common shareholders 21 14,083 14,205 14,591Loans 22 3,841 3,683 3,289Other non-current financial liabilities 23 8,716 8,946 8,921Pensions and other post-employment benefits 24 677 532 567Deferred tax liabilities 10 786 682 943Provisions 25 724 751 748Other non-current liabilities 26 74 88 57Total non-current liabilities 14,818 14,682 14,525Accounts payable 6,311 5,815 5,276Other current financial liabilities 27 3,257 2,227 3,132Income taxes payable 82 110 136Provisions 25 349 312 337Other current liabilities 28 2,591 2,479 2,272Total current liabilities 12,590 10,943 11,153Total equity and liabilities 41,490 39,830 40,269
The accompanying notes are an integral part of these consolidated financial statements.
See Note 36 for details about the restatement of the 2018 figures due to changes in accounting policies.
Financial statements Other informationStrategic Report Governance Financial performance AppendixGovernance RemunerationOur business Performance review Ahold Delhaize Annual Report 2019 122
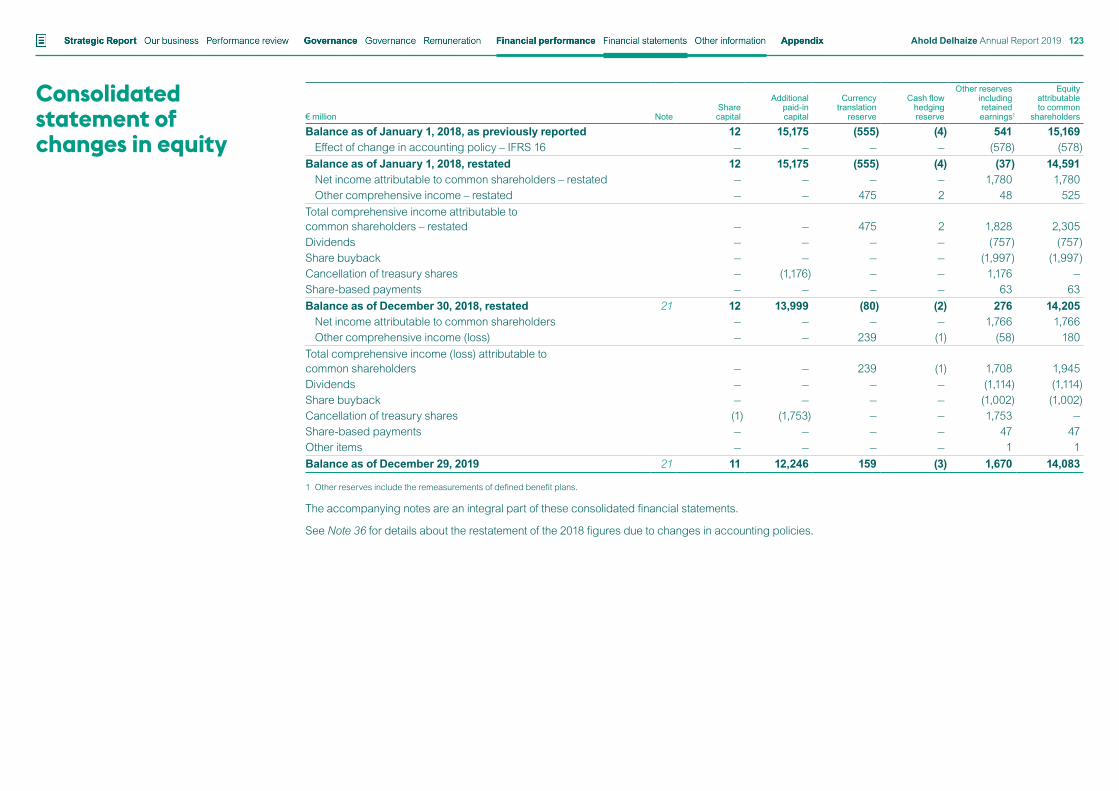
Consolidated statement of changes in equity
€ million NoteShare capital
Additional paid-in capital
Currency translation
reserve
Cash flow hedging reserve
Other reserves including retained earnings1
Equity attributable to common
shareholders
Balance as of January 1, 2018, as previously reported 12 15,175 (555) (4) 541 15,169Effect of change in accounting policy – IFRS 16 — — — — (578) (578)
Balance as of January 1, 2018, restated 12 15,175 (555) (4) (37) 14,591Net income attributable to common shareholders – restated — — — — 1,780 1,780Other comprehensive income – restated — — 475 2 48 525
Total comprehensive income attributable to common shareholders – restated — — 475 2 1,828 2,305Dividends — — — — (757) (757)Share buyback — — — — (1,997) (1,997)Cancellation of treasury shares — (1,176) — — 1,176 —Share-based payments — — — — 63 63Balance as of December 30, 2018, restated 21 12 13,999 (80) (2) 276 14,205
Net income attributable to common shareholders — — — — 1,766 1,766Other comprehensive income (loss) — — 239 (1) (58) 180
Total comprehensive income (loss) attributable to common shareholders — — 239 (1) 1,708 1,945Dividends — — — — (1,114) (1,114)Share buyback — — — — (1,002) (1,002)Cancellation of treasury shares (1) (1,753) — — 1,753 —Share-based payments — — — — 47 47Other items — — — — 1 1Balance as of December 29, 2019 21 11 12,246 159 (3) 1,670 14,083
1 Other reserves include the remeasurements of defined benefit plans.
The accompanying notes are an integral part of these consolidated financial statements.
See Note 36 for details about the restatement of the 2018 figures due to changes in accounting policies.
Financial statements Other informationStrategic Report Governance Financial performance AppendixGovernance RemunerationOur business Performance review Ahold Delhaize Annual Report 2019 123
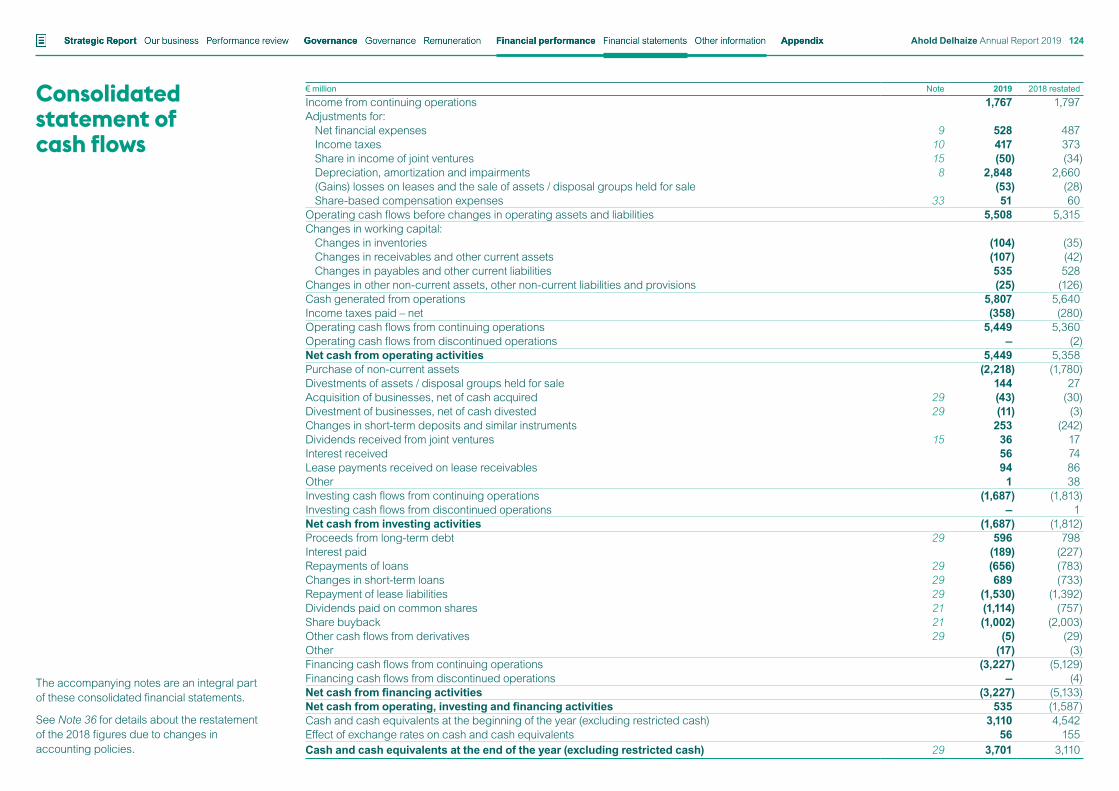
Consolidated statement of cash flows
€ million Note 2019 2018 restated
Income from continuing operations 1,767 1,797Adjustments for:
Net financial expenses 9 528 487Income taxes 10 417 373Share in income of joint ventures 15 (50) (34)Depreciation, amortization and impairments 8 2,848 2,660(Gains) losses on leases and the sale of assets / disposal groups held for sale (53) (28)Share-based compensation expenses 33 51 60
Operating cash flows before changes in operating assets and liabilities 5,508 5,315Changes in working capital:
Changes in inventories (104) (35)Changes in receivables and other current assets (107) (42)Changes in payables and other current liabilities 535 528
Changes in other non-current assets, other non-current liabilities and provisions (25) (126)Cash generated from operations 5,807 5,640Income taxes paid – net (358) (280)Operating cash flows from continuing operations 5,449 5,360Operating cash flows from discontinued operations — (2)Net cash from operating activities 5,449 5,358Purchase of non-current assets (2,218) (1,780)Divestments of assets / disposal groups held for sale 144 27Acquisition of businesses, net of cash acquired 29 (43) (30)Divestment of businesses, net of cash divested 29 (11) (3)Changes in short-term deposits and similar instruments 253 (242)Dividends received from joint ventures 15 36 17Interest received 56 74Lease payments received on lease receivables 94 86Other 1 38Investing cash flows from continuing operations (1,687) (1,813)Investing cash flows from discontinued operations — 1Net cash from investing activities (1,687) (1,812)Proceeds from long-term debt 29 596 798Interest paid (189) (227)Repayments of loans 29 (656) (783)Changes in short-term loans 29 689 (733)Repayment of lease liabilities 29 (1,530) (1,392)Dividends paid on common shares 21 (1,114) (757)Share buyback 21 (1,002) (2,003)Other cash flows from derivatives 29 (5) (29)Other (17) (3)Financing cash flows from continuing operations (3,227) (5,129)Financing cash flows from discontinued operations — (4)Net cash from financing activities (3,227) (5,133)Net cash from operating, investing and financing activities 535 (1,587)Cash and cash equivalents at the beginning of the year (excluding restricted cash) 3,110 4,542Effect of exchange rates on cash and cash equivalents 56 155Cash and cash equivalents at the end of the year (excluding restricted cash) 29 3,701 3,110
The accompanying notes are an integral part of these consolidated financial statements.
See Note 36 for details about the restatement of the 2018 figures due to changes in accounting policies.
Financial statements Other informationStrategic Report Governance Financial performance AppendixGovernance RemunerationOur business Performance review Ahold Delhaize Annual Report 2019 124
Notes to the consolidated financial statements
1 The Company and its operationsThe principal activity of Koninklijke Ahold Delhaize N.V. (“Ahold Delhaize” or the “Company” or “Group” or “Ahold Delhaize Group”), a public limited liability company with its registered seat and head office in Zaandam, the Netherlands, is the operation of retail food stores and eCommerce primarily in the United States and Europe. The Company is registered with the Dutch Trade Register under number 35000363.
On February 25, 2020, the Management Board authorized the financial statements. The Company has the ability to amend and reissue the financial statements up to the moment the financial statements have been adopted by the General Meeting of Shareholders. The financial statements, as presented in this Annual Report, are subject to adoption by the Ahold Delhaize General Meeting of Shareholders.
Ahold Delhaize’s significant subsidiaries, joint ventures and associates are listed in Note 37.
2 Basis of preparation These financial statements have been prepared in accordance with International Financial Reporting Standards (IFRSs) as adopted by the European Union (EU) and also comply with the financial reporting requirements included in Part 9 of Book 2 of the Dutch Civil Code.
Historical cost is used as the measurement basis unless otherwise indicated.
Due to the implementation of IFRS 16 and the application of the full retrospective approach, the 2018 comparative figures have been restated. See Note 36 for more details. Also, for more detailed information on the IFRS 16 implementation and the restatement of the 2018 figures, including a quarterly split and explanations, see our IFRS 16 restatement booklet issued on March 25, 2019, and available on our website.
Ahold Delhaize’s financial year is a 52- or 53-week period ending on the Sunday nearest to December 31. Financial year 2019 consisted of 52 weeks and ended on December 29, 2019. The comparative financial year 2018 consisted of 52 weeks and ended on December 30, 2018.
These consolidated financial statements are presented in millions of euros (€), unless otherwise stated. Due to rounding, numbers presented may not add up precisely to the totals provided.
Financial statements Other informationStrategic Report Governance Financial performance AppendixGovernance RemunerationOur business Performance review Ahold Delhaize Annual Report 2019 125
2 Basis of preparation continued The following exchange rates of the euro against the U.S. dollar ($), the Czech crown (CZK), the Romanian leu (RON), and the Serbian dinar (RSD) have been used in the preparation of these financial statements:
2019 2018
U.S. dollarAverage exchange rate 0.8934 0.8476Year-end closing exchange rate 0.8947 0.8738Czech crownAverage exchange rate 0.0390 0.0390Year-end closing exchange rate 0.0393 0.0388Romanian leuAverage exchange rate 0.2108 0.2149Year-end closing exchange rate 0.2090 0.2146Serbian dinarAverage exchange rate 0.0085 0.0085Year-end closing exchange rate 0.0085 0.0085
Significant estimates, assumptions and judgmentsThe preparation of financial statements requires management to make a number of estimates and assumptions that affect the reported amounts of assets and liabilities, revenues and expenses, and the disclosure of contingent assets and liabilities which, by definition, will seldom equal the actual results. All assumptions, expectations and forecasts used as a basis for certain estimates within these financial statements represent good faith assessments of Ahold Delhaize’s current and future performance for which management believes there is a reasonable basis. They involve risks, uncertainties and other factors that could cause the Company’s actual future results, performance and achievements to differ materially from those forecasted. The estimates, assumptions and judgments that management considers most critical relate to:
Vendor allowances (Notes 3, 17 and 18)When vendor allowances cannot specifically be identified in the purchase price of products, the Company must estimate the allowances that are earned based on the fulfillment of its related obligations. These estimates may require management to estimate the volume of purchases that will be made during a period of time. The Company must also estimate the amount of related product that has been sold and the amount that remains in ending inventories and allocate the allowance to cost of sales or inventories accordingly.
Income taxes (Notes 3, 10 and 35)The ultimate tax effects of transactions may be uncertain for a considerable period of time, requiring management to estimate the related current and deferred tax positions. The Company recognizes liabilities for uncertain tax positions when it is probable that additional tax will be due or recognizes assets for uncertain tax positions when it is probable that the benefit will flow to the Company and the benefit can be reliably measured. Probability is estimated using the Company’s interpretation of legislation and relevant case law and the Company assumes that the taxation authorities have full knowledge of all facts and circumstances.
Management is required to make judgments in determining whether deferred tax assets are realizable and, therefore, recognized in the balance sheet. The Company assesses and weighs all positive and negative evidence to support this determination.
Intangible assets (Notes 3, 4 and 14)Intangible assets acquired in a business acquisition are stated at fair value, as determined at the date of the acquisition. To determine the fair value at the acquisition date, judgments and estimates are required.
Leases and sale and leaseback transactions (Notes 3, 12 and 34)Where the Company is the lessee, management is required to make judgments about whether an arrangement contains a lease, the lease term and the appropriate discount rate to calculate the present value of the lease payments.
The lease payments are discounted using the interest rate implicit in the lease. If that rate cannot be readily determined, which is generally the case for leases entered into by the Company as lessee, management uses the incremental borrowing rate, being the rate that the Company would have to pay to borrow the funds necessary to obtain an asset of similar value to the right-of-use asset in a similar economic environment with similar terms, security and conditions.
To determine the incremental borrowing rate, the Company uses a build-up approach that starts with a risk-free interest rate adjusted for credit risk for leases held by the Company and makes adjustments specific to the lease, for example related to term, country, currency and security. On a quarterly basis, the Company calculates incremental borrowing rates for each country, broken down into buckets of duration and underlying asset leased.
In determining the lease term, management considers all facts and circumstances that create an economic incentive to exercise an extension option, or not exercise a termination option. Extension options (or periods after termination options) are only included in the lease term if it is reasonably certain that the lease will be extended (or not terminated) and, as such, included within lease liabilities.
For leases of stores, distribution centers and warehouses, the following factors are normally the most relevant:
• If any leasehold improvements are expected to have a significant remaining value, the Company is typically reasonably certain to extend (or not terminate).
• If there are significant penalties to terminate (or not extend), the Company is typically reasonably certain to extend (or not terminate).
• Otherwise, the Company considers other factors, including historical lease durations and the costs and business disruption required to replace the leased asset.
The lease term is reassessed if an option is actually exercised (or not exercised) or the Company becomes obliged to exercise (or not exercise) it. The assessment of reasonable certainty is only revised if a significant event or a significant change in circumstances occurs, which affects this assessment, and is within the lessee’s control, for example, when significant investment in the store is made which has a useful life beyond the current lease term.
Financial statements Other informationStrategic Report Governance Financial performance AppendixGovernance RemunerationOur business Performance review Ahold Delhaize Annual Report 2019 126
2 Basis of preparation continued Where the Company is the lessor, the classification of leases as finance leases or operating leases requires judgments about the fair value of the leased asset, the economic life of the asset, whether or not to include renewal or termination options in the lease term and the appropriate discount rate to use to calculate the present value of the lease payments to be received.
Revenue recognition with respect to sale and leaseback transactions is dependent on management’s judgment of whether the Company has satisfied all of its performance obligations and control of the asset is transferred to the buyer, and the determination of the fair value of the asset.
Impairments (Notes 3, 6, 8, 11, 12, 13 and 14)Judgments and estimates are required, not only to determine whether there is an indication that an asset may be impaired, but also whether indications exist that impairment losses previously recognized may no longer exist or may have decreased (impairment reversal). After indications of impairment have been identified, judgments and estimates are also involved in the determination of the recoverable amount of a non-current asset. These involve estimates of expected future cash flows (based on future growth rates and remaining useful life) and residual value assumptions, as well as discount rates to calculate the present value of the future cash flows.
Company and multi-employer pension obligations (Notes 3 and 24)The present value of the pension obligations depends on a number of assumptions that are determined on an actuarial basis. The assumptions used in determining the net cost (income) for pensions include the discount rate that should be used to determine the present value of estimated future cash outflows expected to be required to settle the pension obligations. Other key assumptions include longevity and future salary and pension increases. Additional information is disclosed in Note 24.
Provisions and contingencies (Notes 3, 25 and 35)The recognition of provisions requires estimates and judgment regarding the timing and the amount of outflow of resources. The main estimates are as follows:
• Self-insurance program: estimates and assumptions include an estimate of claims incurred but not yet reported, historical loss experience, projected loss development factors, estimated changes in claim reporting patterns, claim settlement patterns, judicial decisions and legislation. It is possible that the final resolution of claims may result in significant expenditures in excess of existing reserves.
• Loyalty programs: estimating the cost of benefits to which customers participating in the loyalty program are entitled includes assumptions on redemption rates. These estimates and assumptions apply to all loyalty programs, irrespective of whether they are accounted for as sales deferrals or provisions for future payments made at redemption.
• Claims and legal disputes: management, supported by internal and external legal counsel, where appropriate, determines whether it is probable that an outflow of resources will be required to settle an obligation. If this is the case, the best estimate of the outflow of resources is recognized.
• Severance and termination benefits: the provisions relate to separation plans and agreements and use the best estimate, based on information available to management, of the cash flows that will likely occur. The amounts that are ultimately incurred may change as the plans are executed.
• Onerous contracts: mainly relate to unfavorable contracts and include the excess of the unavoidable costs of meeting the contractual obligations over the benefits expected to be received under such contracts.
Fair value measurementsFor financial reporting purposes, fair value measurements are categorized into Level 1, 2 or 3, based on the degree to which the inputs to the fair value measurements are observable and the significance of the inputs to the fair value measurement in its entirety, which are described as follows:
• Level 1 inputs are quoted prices (unadjusted) for identical assets or liabilities in active markets that the Company can access at the measurement date.
• Level 2 inputs are inputs, other than quoted prices included within Level 1, that are observable for the asset or liability, either directly (i.e., as prices) or indirectly (i.e., derived from prices).
• Level 3 inputs are unobservable inputs for the asset or liability.
3 Significant accounting policiesConsolidationThe consolidated financial statements incorporate the financial figures of the Company and its subsidiaries. Subsidiaries are entities over which the Company has control. The Company controls an entity when it is exposed to, or has rights to, variable returns from its involvement with the entity and has the ability to affect those returns through its power over the entity. Subsidiaries are fully consolidated from the date that control commences until the date that control ceases. All intra-group transactions, balances, income and expenses are eliminated upon consolidation. Unrealized losses on intra-group transactions are eliminated, unless the transaction provides evidence of an impairment of the assets transferred.
Non-controlling interests are recorded, as appropriate, on the consolidated balance sheet, in the consolidated income statement, and in the consolidated statement of comprehensive income for the non-controlling shareholders’ share in the net assets and the income or loss of subsidiaries. Non-controlling shareholders’ interest in an acquired subsidiary is initially measured at the non-controlling interest’s proportion of the net fair value of the assets, liabilities and contingent liabilities recognized. Ahold Delhaize does not have subsidiaries with non-controlling interests that are material to the Group.
Business combinationsThe Company accounts for business combinations using the acquisition method when control is transferred to the Group. The consideration transferred in the acquisition is generally measured at fair value, as are the identifiable net assets acquired and the liabilities assumed. Transaction costs are expensed as incurred. Any contingent consideration is measured at fair value at the acquisition date. If the contingent consideration is classified as equity, then it is not remeasured and settlement is accounted for within equity. Otherwise, subsequent changes in the fair value of the contingent consideration are recognized in profit or loss.
Financial statements Other informationStrategic Report Governance Financial performance AppendixGovernance RemunerationOur business Performance review Ahold Delhaize Annual Report 2019 127
3 Significant accounting policies continuedForeign currency translationThe financial statements of subsidiaries, joint ventures and associates are prepared in their functional currencies, which are determined based on the primary economic environment in which they operate. Transactions in currencies other than the functional currency are recorded at the rates of exchange prevailing on the transaction dates. At each balance sheet date, monetary items denominated in foreign currencies are translated into the entity’s functional currency at the then prevailing rates. Exchange differences arising on the settlement and translation of monetary items are included in net income for the period. Goodwill and fair value adjustments arising on the acquisition of a foreign entity are considered as assets and liabilities denominated in the functional currency of the foreign entity.
Upon consolidation, the assets and liabilities of subsidiaries with a functional currency other than the euro are translated into euros using the exchange rates prevailing at the balance sheet date. Income and expense items are translated at the average exchange rates for the respective periods. Exchange rate differences arising during consolidation and on the translation of investments in subsidiaries are included in other comprehensive income and in equity, in the currency translation reserve. Intercompany loans to and from foreign entities for which settlement is neither planned nor likely to occur in the foreseeable future are considered to increase or decrease the net investment in that foreign entity; therefore the exchange rate differences relating to these loans are also included in other comprehensive income and in equity, in the currency translation reserve.
On the disposal of a foreign operation resulting in loss of control, loss of joint control or loss of significant influence, the related cumulative exchange rate difference that was included in equity is transferred to the consolidated income statement.
Statement of cash flowsThe Company has chosen to prepare the statement of cash flows using the indirect method, which presents cash flows from operating activities as the income from continuing operations adjusted for non-cash transactions, deferrals or accruals of past or future operating cash receipts or payments, and items of income or expense associated with investing or financing cash flows. Cash flows in foreign currencies have been translated using weighted average periodic exchange rates. Interest paid on loans is presented as a financing activity, while interest received is presented as an investing activity. Acquisitions and divestments of businesses are presented net of cash and cash equivalents acquired or disposed of, respectively. The Company has chosen to present dividends paid to its shareholders as a financing activity cash flow.
In the cash flow statement, the Company has classified the principal portion of lease payments, as well as the interest portion, within financing activities. Lease payments are not split between interest and principal portions but are shown as one line, “Repayment of lease liabilities,” in the cash flow statement. Lease payments for short-term leases, lease payments for leases of low-value assets and variable lease payments not included in the measurement of the lease liability are classified as cash flows from operating activities.
The Company has classified cash flows from operating leases as operating activities. Cash flows representing the collection of principal and interest payments for finance lease receivables are classified as investing activities and disclosed using a single line in the cash flow statement, “Lease payments received on lease receivables.”
SegmentationAhold Delhaize’s operating segments are its retail operating companies that engage in business activities from which they earn revenues and incur expenses, and whose operating results are regularly reviewed by the Executive Committee to make decisions about resources to be allocated to the segments and to assess their performance. In establishing the reportable segments, certain operating segments with similar economic characteristics have been aggregated. As Ahold Delhaize’s operating segments offer similar products using complementary business models, and there is no discernible difference in customer bases, Ahold Delhaize’s policy on aggregating its operating segments into reportable segments is based on geography, macro-economic environment and management oversight.
The segments’ performance is evaluated against several measures, of which operating income is the most important. Intersegment sales are executed under normal commercial terms and conditions that would also be available to unrelated third parties.
Net salesAhold Delhaize generates and recognizes net sales to retail customers as it satisfies its performance obligation at the point of sale in its stores and upon delivery of goods through its online channel. The Company also generates revenues from the sale of products to retail franchisees and affiliates that are recognized upon delivery. Ahold Delhaize recognizes fees to franchisees and affiliates as revenue as services are performed or the granted rights are used. Revenue from the sale of gift cards and gift certificates is recognized when the gift card or gift certificate is redeemed by the retail customer. Future discounts earned by customers in connection with bonus or loyalty cards and other Company-sponsored programs are deferred on the balance sheet at the time of the sale and subsequently recognized in the income statement when redeemed. When the Company expects that gift cards and future discounts under bonus and loyalty programs will not be redeemed, the breakage that is able to be estimated is recognized proportionately as revenue at the time that the Company’s performance obligations are satisfied (e.g., as customers redeem their award credits or purchase goods using gift cards or vouchers).
The sales activities of Ahold Delhaize do not result in a material amount of unperformed obligations of the Company and, therefore, no contract assets are recognized separately from receivables. The Company does enter into transactions with customers where contract liabilities result from consideration being received from the customer prior to the Company satisfying its performance obligations. These contract liabilities are presented on the balance sheet and in the notes as deferred income and gift card liabilities.
Generally, net sales and cost of sales are recorded based on the gross amount received from the customer for products sold and the amount paid to the vendor for products purchased, excluding sales taxes and value-added taxes. However, for certain products or services, such as sales through bol.com’s seller platform and the sale of lottery tickets, third-party prepaid phone cards, stamps and public transportation tickets, Ahold Delhaize acts as an agent and, consequently, records the amount of commission income in its net sales. Net sales also reflects the value of products sold to customers for which the Company anticipates returns from customers, when such returns are considered to be material. Currently, customer returns are only considered material with regards to Ahold Delhaize’s online general merchandise sales. Past customer return practices provide the basis for determining the anticipated returns that the Company is exposed to at the balance sheet date.
Financial statements Other informationStrategic Report Governance Financial performance AppendixGovernance RemunerationOur business Performance review Ahold Delhaize Annual Report 2019 128
3 Significant accounting policies continuedCost of salesCost of sales includes the purchase price of the products sold and other costs incurred in bringing the inventories to the location and condition ready for sale. These costs include costs of purchasing; storing; rent; depreciation of property, plant and equipment and right-of-use assets; salaries; and transporting products to the extent that it relates to bringing the inventories to the location and condition ready for sale.
Vendor allowancesAhold Delhaize receives various types of vendor allowances. The most common allowances vendors offer are (i) volume allowances, which are off-invoice or amounts billed back to vendors based on the quantity of products sold to customers or purchased from the vendor and (ii) promotional allowances, which relate to cooperative advertising and market development efforts. Volume allowances are recognized as a reduction of the cost of the related products as they are sold. Promotional allowances are recognized as a reduction of the cost of the related products when the Company has performed the activities specified in the contract with the vendor. If the contract does not specify any performance criteria, the allowance is recognized over the term of the contract.
Vendor allowances are generally deducted from cost of sales, unless there is clear evidence that they should be classified as revenue resulting from the Company providing a distinct good or service to the vendor. Ahold Delhaize recognizes vendor allowances only where there is evidence of a binding arrangement with the vendor, the amount can be estimated reliably and receipt is probable.
The accounting for vendor allowances requires management to apply judgments and assumptions, mainly surrounding the timing of when performance obligations have been met, the volume of purchases that will be made during a period of time, the product remaining in ending inventory, and the probability that funds can be collected from vendors. Using these judgments and assumptions, management’s practice is to allocate earned vendor allowances between cost of sales and inventory based upon the amount of related product that was sold and the amount that remains in ending inventories. This practice is based upon the turnover of the inventories.
Selling expensesSelling expenses relate to our store and online operations and consist of employees’ salaries and wages, store expenses, depreciation related to owned and leased stores, advertising costs and other selling expenses. Other revenue derived from operational activities that does not qualify as net sales to retail customers is included as an offset to selling expenses.
General and administrative expensesGeneral and administrative expenses consist of support office employees’ salaries and wages, rent and depreciation of support offices, impairment losses and reversals, gains and losses on the sale of non-current assets and disposal groups held for sale, restructuring costs, and other general and administrative expenses. Revenue from contracts that do not qualify as net sales to retail customers from operational activities is included as an offset to general and administrative expenses.
Share-based compensation The grant date fair value of equity-settled share-based compensation plans is expensed, with a corresponding increase in equity, on a straight-line basis over the vesting periods of the grants. The cumulative expense recognized at each balance sheet date reflects the extent to which the vesting period has expired and the Company’s best estimate of the number of shares that will eventually vest.
No expense is recognized for awards that do not ultimately vest, except for awards where vesting is conditional upon a market condition (e.g., total shareholder return). Those are treated as vested irrespective of whether or not the market condition is ultimately satisfied, provided that all non-market conditions (e.g., continued employment) are satisfied.
Income taxesIncome tax expense represents the sum of current and deferred tax. Income tax is recognized in the income statement except to the extent that it relates to items recognized directly in equity or other comprehensive income. Current tax expense is based on the best estimate of taxable income for the year, using tax rates that have been enacted or substantively enacted at the balance sheet date and adjustments for current taxes payable (receivable) for prior years. Deferred tax is the tax expected to be payable or recoverable on differences between the carrying amounts of assets and liabilities and the corresponding tax basis used in the computation of taxable income. Deferred tax assets and liabilities are generally recognized for all temporary differences. However, deferred tax liabilities are not recognized if they arise from the initial recognition of goodwill. Deferred income tax is not accounted for if it arises from the initial recognition of an asset or liability in a transaction other than a business combination that, at the time of the transaction, affects neither accounting nor taxable profit or loss. Deferred income tax is determined using tax rates (and laws) that have been enacted or substantially enacted by the end of the reporting period and are expected to apply when the related deferred income tax asset is realized or the deferred income tax liability is settled.
Deferred tax assets, including deferred tax assets for tax loss carryforward positions and tax credit carryforward positions, are recognized to the extent that it is probable that future taxable income will be available against which temporary differences, unused tax losses or unused tax credits can be utilized. The carrying amount of deferred tax assets is reviewed at each balance sheet date and reduced to the extent that it is no longer probable that sufficient taxable income will be available to allow all or part of the assets to be recovered.
Deferred tax assets and liabilities are not discounted. Deferred income tax assets and liabilities are offset on the balance sheet when there is a legally enforceable right to offset current tax assets against current tax liabilities and when the deferred income taxes relate to income taxes levied by the same fiscal authority. Current income tax assets and liabilities are offset on the balance sheet when there is a legally enforceable right to offset and when the Company intends either to settle on a net basis or to realize the asset and settle the liability simultaneously.
The ultimate tax effects of some transactions can be uncertain for a considerable period of time, requiring management to estimate the related current and deferred tax positions. The Company recognizes liabilities for uncertain tax positions when it is probable that additional taxes will be due or recognizes assets for uncertain tax positions when it is probable that the benefit will flow to the Company and the benefit can be reliably measured. To measure the liability for the uncertain tax position, management determines whether uncertainties need to be considered separately or together based on which approach better predicts the resolution of the uncertainty. The Company also recognizes the liability for either the most likely amount or the expected value (probability weighted average), depending on which method it expects to better predict the resolution.
Financial statements Other informationStrategic Report Governance Financial performance AppendixGovernance RemunerationOur business Performance review Ahold Delhaize Annual Report 2019 129
3 Significant accounting policies continuedThese liabilities are presented as current income taxes payable, except in jurisdictions where prior tax losses are being carried forward to be used to offset future taxes that will be due; in these instances, the liabilities are presented as a reduction of deferred tax assets. Interest accrued on uncertain tax positions is considered to be a financial expense of the Company. Any other adjustments to uncertain tax position liabilities are recognized within income tax expense.
Earnings per shareBasic net income per share is calculated by dividing net income attributable to common shareholders by the weighted average number of common shares outstanding during the year. Basic income from continuing operations per share is calculated by dividing income from continuing operations attributable to common shareholders by the weighted average number of common shares outstanding during the year.
Diluted income per share is calculated by dividing the diluted net income / diluted income from continuing operations attributable to shareholders by the diluted weighted average number of common shares outstanding. To determine the diluted income, net income and income from continuing operations are adjusted by the expense for preferred dividends on the cumulative preferred financing shares. This preferred dividend is reversed when the cumulative preferred financing shares have a dilutive effect on the earnings per share calculation. To determine the diluted weighted average number of common shares outstanding, the weighted average number of shares outstanding is adjusted for (i) the effect of the cumulative preferred financing shares and (ii) the conditional shares from the share-based compensation programs. The effect of the cumulative preferred financing shares is determined by calculating the number of common shares that would be issued upon conversion. However, the effect is only adjusted for if it has a dilutive effect on the income per share. Ahold Delhaize’s cumulative preferred financing shares are dilutive whenever their interest per common share obtainable on conversion is lower than basic income per share.
Non-current assets held for sale and discontinued operationsNon-current assets and disposal groups are classified as held for sale if their carrying amount will be recovered through a sale transaction rather than through continuing use. For this to be the case, the asset (or disposal group) must be available for immediate sale in its present condition and its sale must be highly probable. Non-current assets (or disposal groups) classified as held for sale are measured at the lower of the asset’s carrying amount or the fair value less costs of disposal. Depreciation or amortization of an asset ceases when it is classified as held for sale. Equity accounting ceases for an investment in a joint venture or associate when it is classified as held for sale; instead, dividends received are recognized in the consolidated income statement.
A discontinued operation is a component of the Company that either has been disposed of or is classified as held for sale, and represents a separate major line of business or geographical area of operations or is part of a single coordinated plan to dispose of a separate major line of business or geographical area of operations. Results from discontinued operations that are clearly identifiable as part of the component disposed of and that will not be recognized subsequent to the disposal are presented separately as a single amount in the consolidated income statement. Results and cash flows from discontinued operations are reclassified for prior periods and presented in the financial statements so that the results and cash flows from discontinued operations relate to all operations that have been discontinued as of the balance sheet date for the latest period presented.
Property, plant and equipmentItems of property, plant and equipment are stated at cost less accumulated depreciation and impairment losses. Cost includes expenditures that are directly attributable to the acquisition or construction of an asset and borrowing costs incurred during construction. Where applicable, estimated asset retirement costs are added to the cost of an asset. Subsequent expenditures are capitalized only when it is probable that future economic benefits associated with the item will flow to the Company and the costs can be measured reliably. All other subsequent expenditures represent repairs and maintenance and are expensed as incurred.
Depreciation is computed using the straight-line method based on the estimated useful lives of the items of property, plant and equipment, taking into account the estimated residual value. Where an item of property, plant and equipment comprises major components having different useful lives, each such part is depreciated separately.
The ranges of estimated useful lives of property, plant and equipment are:
Land indefiniteBuildings 30–40 yearsCertain structural components of buildings 10–20 yearsFinish components of buildings 5–10 yearsMachinery and equipment 3–15 yearsOther 5–10 years
The useful lives, depreciation method and residual value are reviewed at each balance sheet date and adjusted, if appropriate.
Depreciation of leasehold improvements is calculated on a straight-line basis over either the lease term (including renewal periods when renewal is reasonably assured) or the estimated useful life of the asset, whichever is shorter.
Right-of-use assets See paragraph New accounting policies effective for 2019 – IFRS 16, “Leases” below.
Investment propertyInvestment property consists of land and buildings held by Ahold Delhaize to earn rental income or for capital appreciation, or both. These properties are not used by the Company in the ordinary course of business. The Company often owns (or leases) shopping centers containing both an Ahold Delhaize and third-party retail units. In these cases, the third-party retail units generate rental income, but are primarily of strategic importance for operating purposes to Ahold Delhaize in its retail operations. The Company recognizes the part of an owned (or leased) shopping center that is leased to third-party retailers as investment property, unless it represents an insignificant portion of the property. Land and buildings leased to franchisees are not considered to be investment property as they contribute directly to Ahold Delhaize’s retail operations. Investment property is measured on the same basis as property, plant and equipment.
See paragraph New accounting policies effective for 2019 – IFRS 16, “Leases” below for the accounting policy on right-of-use asset investment property.
Financial statements Other informationStrategic Report Governance Financial performance AppendixGovernance RemunerationOur business Performance review Ahold Delhaize Annual Report 2019 130
3 Significant accounting policies continuedIntangible assetsGoodwill and impairment of goodwillGoodwill arises on the acquisition of subsidiaries and represents the excess of the consideration transferred over the Company’s interest in the net fair value of the identifiable assets, liabilities and assumed contingent liabilities at the date of acquisition. It is carried at cost less accumulated impairment losses. Goodwill on acquisitions of joint ventures and associates is included in the carrying amount of the investment.
For the purposes of impairment testing, goodwill is allocated to each of the cash-generating units (or groups of cash-generating units) that is expected to benefit from the synergies of a business combination. Goodwill is allocated to a cash-generating unit (or group of cash-generating units) representing the lowest level within the Company at which the goodwill is monitored for internal management purposes and is never larger than an operating segment before aggregation. Cash-generating units to which goodwill has been allocated are tested for impairment annually, or more frequently when there is an indication that the cash-generating unit may be impaired. Goodwill on acquisitions of joint ventures and associates is assessed for impairment as part of the investment whenever there is an indication that the investment may be impaired. An impairment loss is recognized for the amount by which the cash-generating unit’s carrying amount exceeds its recoverable amount. The recoverable amount is the higher of a cash-generating unit’s fair value less costs of disposal or its value in use. See Note 14 for explanations of how the Company determines fair value less costs of disposal and value in use. An impairment loss is allocated first to reduce the carrying amount of the goodwill and then to the other assets of the cash-generating unit pro rata on the basis of the carrying amount of each asset. An impairment loss recognized for goodwill is not reversed in subsequent periods.
On the partial or complete disposal of an operation, the goodwill attributable to that operation is included in the determination of the gain or loss on disposal.
Other intangible assetsSeparately acquired intangible assets and internally developed software are carried at cost less accumulated amortization and impairment losses. Intangible assets acquired in a business combination are recognized at fair value at the date of acquisition (which is regarded as their cost).
Brand names and customer, franchise and affiliate relationships acquired in business acquisitions are stated at fair value determined using an income approach. Direct costs related to the development of software for internal use are capitalized only if the costs can be measured reliably, technological feasibility has been established, future economic benefits are probable, and the Company intends to complete development and use the software. All other costs, including all overhead, general and administrative, and training costs, are expensed as incurred.
Amortization is computed using the straight-line method based on estimated useful lives, which are as follows:
Software 3–10 yearsCustomer relationships 7–25 yearsRetail brands indefiniteOwn brands 10–15 yearsFranchise and affiliate relationships 14–40 yearsOther 5–indefinite
The useful lives, amortization method and residual value are reviewed at each balance sheet date and adjusted, if appropriate. Brand names, intangible assets under development and other intangible assets with indefinite lives are assessed for impairment annually, or whenever there is an indication that the asset may be impaired.
Investments in joint arrangements and associatesInvestments in joint arrangements are classified as either joint operations or joint ventures depending on the contractual rights and obligations each investor has rather than the legal structure of the joint arrangement. Joint operations arise where Ahold Delhaize has both rights to the assets and obligations for the liabilities relating to the arrangement and, therefore, the Company accounts for its share of assets, liabilities, revenue and expenses. Joint ventures arise where Ahold Delhaize has rights to the net assets of the arrangement and, therefore, the Company equity accounts for its interest.
Associates are entities over which Ahold Delhaize has significant influence but not control, generally accompanying a shareholding of between 20% and 50% of the voting rights. Significant influence is defined as the power to participate in the financial and operating policy decisions of the entity but not control or joint control over those policies. Associates are accounted for using the equity method.
Under the equity method, investments in joint ventures and associates are measured initially at cost and subsequently adjusted for post-acquisition changes in Ahold Delhaize’s share of the net assets of the investment (net of any accumulated impairment in the value of individual investments). Where necessary, adjustments are made to the financial figures of joint ventures and associates to ensure consistency with the accounting policies of the Company.
Unrealized gains on transactions between Ahold Delhaize and its joint ventures and associates are eliminated to the extent of the Company’s stake in these investments. Unrealized losses are also eliminated unless the transaction provides evidence of an impairment of the assets transferred.
Impairment of non-current assets other than goodwillAhold Delhaize assesses on a quarterly basis whether there is any indication that non-current assets may be impaired. If indicators of impairment exist, the Company estimates the recoverable amount of the asset. If it is not possible to estimate the recoverable amount of an individual asset, the Company estimates the recoverable amount of the cash-generating unit to which it belongs. Individual stores are considered separate cash-generating units for impairment testing purposes. The carrying value of the store includes mainly its property, plant and equipment and right-of-use assets (if held under a lease arrangement).
The recoverable amount is the higher of an asset’s fair value less costs of disposal or the asset’s value in use. In assessing value in use, the estimated future cash flows are discounted to their present value using a pre-tax discount rate that reflects current market assessments of the time value of money and the risks specific to the asset. The estimated future cash flows exclude lease payments if the cash-generating unit is held under a lease arrangement, but include a replacement capex if needed to maintain the ongoing operation during the forecast period.
An impairment loss is recognized in the income statement for the amount by which the asset’s carrying amount exceeds its recoverable amount.
Financial statements Other informationStrategic Report Governance Financial performance AppendixGovernance RemunerationOur business Performance review Ahold Delhaize Annual Report 2019 131
3 Significant accounting policies continuedIn subsequent years, Ahold Delhaize assesses whether indications exist that impairment losses previously recognized for non-current assets other than goodwill may no longer exist or may have decreased. If any such indication exists, the recoverable amount of that asset is recalculated and, if required, its carrying amount is increased to the revised recoverable amount. The increase is recognized in operating income as an impairment reversal. An impairment reversal is recognized only if it arises from a change in the assumptions that were used to calculate the recoverable amount. The increase in an asset’s carrying amount due to an impairment reversal is limited to the depreciated amount that would have been recognized had the original impairment not occurred.
InventoriesInventories are stated at the lower of cost or net realizable value. Cost consists of all costs of purchase, cost of conversion and other costs incurred in bringing the inventories to their location and condition ready for sale, net of vendor allowances attributable to inventories. For certain inventories, cost is approximated using the retail method, in which the sales value of the inventories is reduced by the appropriate percentage of gross margin. The cost of inventories is determined using either the first-in, first-out (FIFO) method or the weighted average cost method, depending on their nature or use. Net realizable value is the estimated selling price in the ordinary course of business, less the estimated marketing, distribution and selling expenses.
Included in the value of inventory is an amount representing the estimated value of inventories that have already been sold that the Company expects to be returned for a refund by customers.
Financial instrumentsFinancial assetsFinancial assets are recognized when the Company becomes a party to the contractual provisions of a financial instrument. Financial assets are derecognized when the rights to receive cash flows from the financial assets expire, or if the Company transfers the financial asset to another party and does not retain control or substantially all risks and rewards of the asset. Purchases and sales of financial assets in the normal course of business are accounted for at settlement date (i.e., the date that the asset is delivered to or by the Company).
At initial recognition, the Company measures its financial assets at its fair value plus, in the case of a financial asset not at fair value through profit or loss, transaction costs that are directly attributable to the acquisition or issue of the financial asset.
After initial recognition, the Company classifies its financial assets as subsequently measured at either i) amortized cost, ii) fair value through other comprehensive income or iii) fair value through profit or loss on the basis of both:
• The Company’s business model for managing the financial assets
• The contractual cash flow characteristics of the financial asset
Subsequent to initial recognition, financial assets are measured as described below. At each balance sheet date, the Company assesses whether there is objective evidence that a financial asset or a group of financial assets is impaired and recognizes a loss allowance for expected credit losses for financial assets measured at either amortized costs or at fair value through other comprehensive income. If, at the reporting date, the credit risk on a financial instrument has not increased significantly since initial recognition, the Company measures the loss allowance for that financial instrument at an amount equal to 12 months of expected credit losses. If, at the reporting date, the credit risk on a financial instrument has increased significantly since initial recognition, the Company measures the loss allowance for the financial instrument at an amount equal to the lifetime expected credit losses. The Company always measures the loss allowance at an amount equal to lifetime expected credit losses for trade receivables, contract assets and lease receivables.
Financial assets at amortized costFinancial assets are measured at amortized cost if both i) the financial asset is held within a business model whose objective is to hold financial assets in order to collect contractual cash flows; and ii) the contractual terms of the financial asset give rise on specified dates to cash flows that are solely payments of principal and interest on the principal amount outstanding.
A financial asset measured at amortized cost is initially recognized at fair value plus transaction cost directly attributable to the asset. After initial recognition, the carrying amount of the financial asset measured at amortized cost is determined using the effective interest method, less any impairment losses.
The Company’s financial assets measured at amortized cost comprise loans receivable, net investment in leases, trade and other (non-)current receivables, cash and cash equivalents, short-term deposits and similar instruments.
Financial assets at fair value through other comprehensive income (FVOCI)A financial asset is measured at fair value through other comprehensive income if both i) the financial asset is held within a business model whose objective is achieved by both collecting contractual cash flows and selling financial assets; and ii) the contractual terms of the financial asset give rise on specified dates to cash flows that are solely payments of principal and interest on the principal amount outstanding.
Investments in debt instruments measured at fair value through other comprehensive income are recognized initially at fair value plus transaction cost directly attributable to the asset. After initial recognition, the asset is measured at fair value with changes in fair value included in other comprehensive income. Accumulated gains or losses recognized through other comprehensive income are directly transferred to profit or loss when debt instrument is derecognized.
There is no subsequent reclassification of fair value gains and losses to profit or loss following the derecognition of the investments in equity instruments that are not held for trading and for which the Company made an irrevocable election at the time of initial recognition to account for the equity investment at fair value through other comprehensive income.
Financial statements Other informationStrategic Report Governance Financial performance AppendixGovernance RemunerationOur business Performance review Ahold Delhaize Annual Report 2019 132
3 Significant accounting policies continuedFinancial assets at fair value through profit or loss (FVPL)When any of the above-mentioned conditions for classification of financial assets are not met, a financial asset is classified as “at fair value through profit or loss” and measured at fair value with changes in fair value recognized in profit or loss.
A financial asset measured at fair value through profit or loss is recognized initially at fair value and its transaction cost is recognized in profit or loss when incurred. A gain or loss on a financial asset measured at fair value through profit or loss is recognized in the consolidated statement of income for the reporting period in which it arises.
The Company may, at initial recognition, irrevocably designate a financial asset as measured at fair value through profit or loss if doing so eliminates or significantly reduces a measurement or recognition inconsistency that would otherwise arise from measuring assets or liabilities or recognizing the gains and losses on them on different bases.
The Company’s financial instruments measured at fair value through profit or loss comprise reinsurance assets, derivatives and certain investments in debt instruments.
Financial liabilitiesFinancial liabilities are recognized when the Company becomes a party to the contractual provisions of a financial instrument. Financial liabilities are derecognized when the Company’s obligations specified in the contract expire or are discharged or cancelled.
All financial liabilities are recognized initially at fair value and, in the case of loans and borrowings, net of directly attributable transaction costs.
The Company classifies all financial liabilities as subsequently measured at amortized cost, except for derivatives and reinsurance liabilities. Any difference between the proceeds and redemption value is recognized in the income statement over the period of the loans and short-term borrowings using the effective interest method.
Financial liabilities are classified as current liabilities unless the Company has an unconditional right to defer settlement of the liability for at least 12 months after the balance sheet date.
Derivative financial instrumentsAll derivative financial instruments are initially recognized at fair value at the date the derivative contracts are entered into and are subsequently remeasured to their fair value at the end of each reporting period. Gains and losses resulting from the fair value remeasurement are recognized in the income statement as fair value gains (losses) on financial instruments, unless the derivative qualifies and is effective as a hedging instrument in a designated hedging relationship. In order for a derivative financial instrument to qualify as a hedging instrument for accounting purposes, the Company must document (i) at the inception of the transaction, the relationship between the hedging instrument and the hedged item, as well as its risk management objectives and strategy for undertaking various hedging transactions and (ii) its assessment, both at hedge inception and on an ongoing basis, of whether the derivative that is used in the hedging transaction is highly effective in offsetting changes in fair values or cash flows of hedged items. Derivatives that are designated as hedges are accounted for as either cash flow hedges or fair value hedges.
The effective portion of changes in the fair value of derivatives that are designated and qualify as cash flow hedges is recognized initially in the cash flow hedging reserve, a separate component of equity. The gain or loss relating to the ineffective portion is recognized immediately in the income statement. Amounts accumulated in equity are reclassified into the income statement in the same period in which the related exposure impacts the income statement. When a cash flow hedge no longer meets the criteria for hedge accounting, any cumulative gain or loss existing in equity at that time remains in equity and is recognized when the forecasted transaction is ultimately recognized in the income statement. When a forecasted transaction is no longer expected to occur, the cumulative gain or loss existing in equity is immediately recognized in the income statement.
Fair value changes of derivative instruments that qualify for fair value hedge accounting treatment are recognized in the income statement in the periods in which they arise, together with any changes in fair value of the hedged asset or liability. If the hedging instrument no longer meets the criteria for hedge accounting, the adjustment to the carrying amount of the hedged item is amortized in the income statement over the hedged item’s remaining period to maturity.
Reinsurance assets and liabilitiesUnder Ahold Delhaize’s self-insurance program, part of the insurance risk is ceded under a reinsurance treaty, which is a pooling arrangement between unrelated companies. In accordance with the pooling arrangement, the Company assumes a share of the reinsurance treaty risks that is measured in relation to the percentage of Ahold Delhaize’s participation in the treaty. Reinsurance assets include estimated receivable balances related to reinsurance contracts purchased by the Company. Reinsurance liabilities represent the expected insurance risks related to reinsurance contracts sold by the Company. Reinsurance assets and liabilities are measured on a discounted basis using accepted actuarial methods.
Financial guaranteesFinancial guarantees made by Ahold Delhaize to third parties that may require the Company to incur future cash outflows if called upon to satisfy are recognized at inception as liabilities at fair value. Fair value is measured as the premium received, if any, or calculated using a scenario analysis. Subsequently, the liability is measured at the higher of the best estimate of the expenditure required to settle the obligation or the amount initially recognized less cumulative amortization corresponding to the expiration or repayment of the underlying amount guaranteed.
EquityEquity instruments issued by the Company are recorded at the value of proceeds received. Own equity instruments that are bought back (treasury shares) are deducted from equity. When reissued or cancelled, shares are removed from the treasury shares on a first-in, first-out basis. Incremental costs that are directly attributable to issuing or buying back own equity instruments are recognized directly in equity, net of the related tax. No gain or loss is recognized in the income statement on the purchase, sale, issuance or cancellation of the Company’s own equity instruments.
Financial statements Other informationStrategic Report Governance Financial performance AppendixGovernance RemunerationOur business Performance review Ahold Delhaize Annual Report 2019 133
3 Significant accounting policies continuedCumulative preferred financing sharesCumulative preferred financing shares, for which dividend payments are not at the discretion of the Company, are classified as non-current financial liabilities and are stated at amortized cost. The dividends on these cumulative preferred financing shares are recognized as interest expense in the income statement, using the effective interest method. From the date on which Ahold Delhaize receives irrevocable notification from a holder of cumulative preferred financing shares to convert these shares into common shares, the cumulative preferred financing shares are classified as a separate class of equity.
Pension and other post-employment benefitsThe net assets and net liabilities recognized on the consolidated balance sheet for defined benefit plans represent the actual surplus or deficit in Ahold Delhaize’s defined benefit plans measured as the present value of the defined benefit obligations less the fair value of plan assets. Any surplus resulting from this calculation is limited to the present value of available refunds and reductions in future contributions to the plan.
Defined benefit obligations are actuarially calculated on the balance sheet date using the projected unit credit method. The present value of the defined benefit obligations is determined by discounting the estimated future cash outflows using market yields on high-quality corporate bonds (i.e., bonds rated AA or higher), denominated in the currency in which the benefits will be paid, and that have an average duration similar to the expected duration of the related pension liabilities.
Defined benefit costs are split into three categories:
• Service cost, past service cost, gains and losses on curtailment and settlements
• Net interest expense or income
• Remeasurement
The first category is presented as labor costs within operating earnings. Past-service costs are recognized in the income statement in the period of plan amendment. Results from curtailments or settlements are recognized immediately.
Past service years within the Dutch pension plan are calculated based upon a methodology that uses the maximum past service years based on accrued benefits or a participant’s actual date of hire.
Net interest is calculated by applying the discount rate to the net defined benefit liability or asset and is presented within net financial expenses.
Remeasurements, comprising actuarial gains and losses, the effect of the asset ceiling (if applicable), and the return on plan assets (excluding interest) are recognized immediately in the balance sheet with a charge or credit to other comprehensive income in the period in which it occurs. Remeasurements recorded in other comprehensive income are not recycled to the income statement.
Contributions to defined contribution plans are recognized as an expense when employees have rendered service entitling them to the contributions. Post-employment benefits provided through industry multi-employer plans, managed by third parties, are generally accounted for under defined contribution criteria.
For other long-term employee benefits, such as long-service awards, provisions are recognized on the basis of estimates that are consistent with the estimates used for the defined benefit obligations, but discounted using Ahold Delhaize’s cost of debt rate. For these, all actuarial gains and losses are recognized in the income statement immediately.
ProvisionsProvisions are recognized when (i) the Company has a present (legal or constructive) obligation as a result of past events, (ii) it is probable that an outflow of resources will be required to settle the obligation, and (iii) the amount can be reliably estimated. The amount recognized is the best estimate of the expenditure required to settle the obligation. Provisions are discounted whenever the effect of the time value of money is significant.
The provision for the Company’s self-insurance program is recorded based on claims filed and an estimate of claims incurred but not yet reported. The provision includes expenses incurred in the claim settlement process that can be directly associated with specific claims. Other expenses incurred in the claim settlement process are expensed when incurred. The Company’s estimate of the required liability of such claims is recorded on a discounted basis, utilizing an actuarial method based upon various assumptions that include, but are not limited to, historical loss experience, projected loss development factors and actual payroll costs.
Restructuring-related provisions for severance and termination benefits are recognized when the Company has approved a detailed formal restructuring plan and the restructuring has either commenced or has been announced to those affected by it. Onerous contract provisions are measured at the amount by which the unavoidable costs to fulfill agreements exceeds the expected benefits from such agreements.
New accounting policies effective for 2019IFRS 16, “Leases”Definition of a leaseUnder IFRS 16, a contract is, or contains, a lease if the contract conveys a right to control the use of an identified asset for a period of time in exchange for consideration. At inception, or on reassessment of a contract that contains a lease component, the Company allocates the consideration in the contract to each lease and non-lease component on the basis of its relative stand-alone price.
The Company applies the recognition exemptions for short-term leases (less than 12 months) and leases of low-value items, defined by the Company to be below $5,000 per item (on acquisition). The payments for these exempted leases are recognized in the income statement on a straight-line basis over the lease terms.
Financial statements Other informationStrategic Report Governance Financial performance AppendixGovernance RemunerationOur business Performance review Ahold Delhaize Annual Report 2019 134
3 Significant accounting policies continuedAs a lesseeThe Company recognizes a right-of-use asset, representing its right to use the underlying asset, and a lease liability, representing its obligation to make lease payments, at the lease commencement date.
The right-of-use asset is initially measured at cost, which comprises the initial amount of the lease liability adjusted for any lease payments made at or before the commencement date, plus any initial direct costs incurred (for example, key money and lease contract commissions), less any incentives received. The right-of-use asset for acquired leases is adjusted for any favorable or unfavorable lease rights recognized as part of the purchase price allocation. The right-of-use asset is subsequently depreciated using the straight-line method over the shorter of the lease term or the useful life of the underlying asset. In addition, the right-of-use asset is reduced by impairment losses, if any, and adjusted for certain remeasurements of the lease liability.
Right-of-use assets are separately disclosed as a line in the balance sheet, but right-of-use assets that meet the definition of investment property are included in “Investment property” and separately disclosed in the notes.
The lease liability is initially measured at the present value of the lease payments that are not paid at the commencement date, discounted using the interest rate implicit in the lease or, if that rate cannot be readily determined, the Company’s incremental borrowing rate. Generally, the Company uses its incremental borrowing rate as the discount rate.
The Company has elected to separate lease and non-lease components included in lease payments for all leases. Lease payments included in the measurement of the lease liability comprise the following:
• Fixed payments, including in-substance fixed payments
• Variable lease payments that depend on an index or a rate, which are initially measured using the index or rate at the commencement date
• Amounts expected to be payable under a residual value guarantee
• The exercise price of a purchase option that the Company is reasonably certain to exercise
• Lease payments in an optional renewal period if the Company is reasonably certain to exercise an extension option, and penalties for early termination of a lease unless the Company is reasonably certain not to terminate early.
The lease liability is measured at amortized cost using the effective interest rate method. The lease liability is subsequently increased by the interest cost on the lease liability and decreased by lease payments made. It is remeasured when there is a change in future lease payments arising from a change in an index or rate, if there is a change in the Company’s estimate of the amount expected to be payable under a residual value guarantee, or if the Company changes its assessment of whether it will exercise a purchase, extension or termination option.
When the lease liability is remeasured in this way, a corresponding adjustment is made to the carrying amount of the right-of-use asset, or is recorded in the income statement if the carrying amount of the right-of-use asset has been reduced to zero.
The lease liability is included in “Other current financial liabilities” and “Other non-current financial liabilities.”
The Company applies judgment to determine the lease term for the lease contracts in which it is a lessee that include renewal and termination options. The assessment of whether the Company is reasonably certain to exercise such options impacts the lease term, which significantly affects the amount of lease liabilities and right-of-use assets recognized. See Note 2 for more information on judgments relating to leases.
As a lessorLessor accounting remains similar to the previous standard and the Company continues to classify leases as finance or operating leases at lease inception based upon whether the lease transfers substantially all of the risks and rewards incidental to ownership of the underlying asset. As part of this assessment, the Company considers certain indicators, such as whether the lease is for the majority of the economic life of the asset.
Leases classified as finance leases result in the recognition of a net investment in a lease representing the Company’s right to receive rent payments. The value of the net investment in a lease is the value of the future rent payments to be received and the unguaranteed residual value of the underlying asset discounted using the rate implicit in the lease.
When the Company is an intermediate lessor, it accounts for its interests in the head lease and the sublease separately. It assesses the lease classification of a sublease with reference to the right-of-use asset arising from the head lease, not with reference to the underlying asset. If a head lease is a short-term lease to which the Company applies the exemption described above, then it classifies the sublease as an operating lease.
If an arrangement contains lease and non-lease components, the Company applies IFRS 15 to allocate the consideration in the contract.
The Company recognizes lease payments received under operating leases as income on a straight-line basis over the lease term as part of “Rent income.”
The adoption of IFRS 16 has resulted in restatements of Ahold Delhaize’s 2018 comparative amounts; see Note 36 for more information.
Sale and leasebackSale and leaseback transactions are defined as transactions that lead to a sale according to IFRS 15 “Revenue from Contracts with Customers.” Under IFRS 15, the seller-lessee must determine if the transaction qualifies as a sale for which revenue is recognized (i.e., if the transaction is a genuine sale, where all performance obligations are satisfied and control has transferred to the buyer-lessor), or whether the transaction is a collateralized borrowing. More specifically, a sale is considered as such if there is no repurchase option on the asset at the end of the lease term.
If the sale by the Company as seller-lessee qualifies as a sale, the Company derecognizes the asset and recognizes a gain (or loss) that is limited to the proportion of the total gain (or loss) relating to the rights transferred to the buyer-lessor. In addition, the Company recognizes a right-of-use asset arising from the leaseback and measures it at the proportion of the previous carrying amount of the asset relating to the right of use retained. In addition, the Company recognizes the lease liability.
Financial statements Other informationStrategic Report Governance Financial performance AppendixGovernance RemunerationOur business Performance review Ahold Delhaize Annual Report 2019 135
3 Significant accounting policies continuedIf the fair value of the consideration for the sale does not equal the fair value of the asset, or if the payments for the lease are not at market rates, adjustments are made to measure the sales proceeds at fair value as follows:
a. Any below-market terms should be accounted for as a prepayment of lease payments.
b. Any above-market terms should be accounted for as additional financing provided by the buyer-lessor.
If the sale by the Company does not qualify as a sale, the Company keeps the asset transferred on its balance sheet and recognizes a financing obligation (financing) equal to the transferred proceeds or cash received.
Amendments to IAS 19, “Plan Amendments, Curtailment or Settlement”The amendments to IAS 19 clarify the accounting for defined benefit plan amendments, curtailments and settlements. They confirm that entities must (i) calculate the current service cost and net interest for the remainder of the reporting period after a plan amendment, curtailment or settlement by using the updated assumptions from the date of the change; (ii) recognize any reduction in a surplus immediately in profit or loss either as part of past service cost, or as a gain or loss on settlement; and (iii) separately recognize any changes in the asset ceiling through other comprehensive income. These amendments have no impact on the consolidated financial statements.
Amendments to IAS 28, “Long-term Interests in Associates and Joint Ventures”The amendments to IAS 28 were made to clarify that IFRS 9, “Financial Instruments,” applies to long-term interests in an associate or joint venture that form part of the net investment in the associate or joint venture but to which the equity method is not applied. These amendments have no impact on the consolidated financial statements.
Amendments to IFRS 3, “Business Combinations”The amendments to IFRS 3 clarify that when an entity obtains control of a business that is a joint operation, it remeasures previously held interests in that business. The amendments to IFRS 3 apply prospectively for annual periods beginning on or after January 1, 2019. These amendments have no impact on the consolidated financial statements.
IFRIC 23, “Uncertainty over Income Tax Treatments”IFRIC 23 clarifies the accounting for income tax treatments that have yet to be accepted by tax authorities, while also aiming to enhance transparency. IFRIC 23 became effective on January 1, 2019. The interpretation does not have an impact on the consolidated financial statements.
Annual improvements to IFRSs 2015-2017A number of amendments were made to various IFRSs that do not have a significant effect on the consolidated financial statements.
New accounting policies not yet effective for 2019The IASB issued several standards, or revisions to standards, that are not yet effective for 2019, but will become effective in coming years.
IFRS 17, “Insurance Contracts” IFRS 17 replaces IFRS 4, “Insurance Contracts.” It requires a current measurement model where estimates are remeasured each reporting period. The standard allows a choice between recognizing changes in discount rates either in the income statement or directly in other comprehensive income. IFRS 17 is effective for annual periods beginning on or after January 1, 2021; however the IASB, in November 2018, tentatively decided to defer the effective date to annual periods beginning on or after January 1, 2022. The Company has yet to assess the standard’s full impact.
Amendments to IAS 1 and IAS 8, “Definition of Material”The amendments to IAS 1 and IAS 8 clarify the definition of material and how it should be applied by stating that information is material if omitting, misstating or obscuring it could reasonably be expected to influence the decisions that the primary users of general purpose financial statements make on the basis of those financial statements, which provide financial information about a specific reporting entity. The amendments to IAS 1 and IAS 8 apply prospectively for annual periods beginning on or after January 1, 2020. The Company does not anticipate that the application of these amendments will have a significant effect on the future consolidated financial statements.
Amendments to IFRS 3, “Definition of a Business”The amended definition of a business requires an acquisition to include an input and a substantive process that together significantly contribute to the ability to create outputs. The definition of the term “outputs” is amended to focus on goods and services provided to customers, generating investment income and other income, and it excludes returns in the form of lower costs and other economic benefits. The amendments to IFRS 3 apply prospectively for annual periods beginning on or after January 1, 2020. The Company anticipates that the amendments could result in more acquisitions being accounted for as asset acquisitions.
Amendments to IFRS 9, IAS 39 and IFRS 7, “Interest Rate Benchmark Reform”The IASB has issued amendments to IFRS 9, IAS 39 and IFRS 7 that provide certain reliefs in connection with interest rate benchmark reform. The reliefs relate to hedge accounting and have the effect that IBOR reform should not generally cause hedge accounting to terminate. However, any hedge ineffectiveness should continue to be recorded in the income statement. The amendments apply prospectively for annual periods beginning on or after January 1, 2020. The Company does not anticipate that the application of these amendments will have an effect on the future consolidated financial statements.
There are no other IFRSs or IFRIC interpretations that have been issued but are not yet effective that are expected to have a material effect on the future consolidated financial statements.
Financial statements Other informationStrategic Report Governance Financial performance AppendixGovernance RemunerationOur business Performance review Ahold Delhaize Annual Report 2019 136
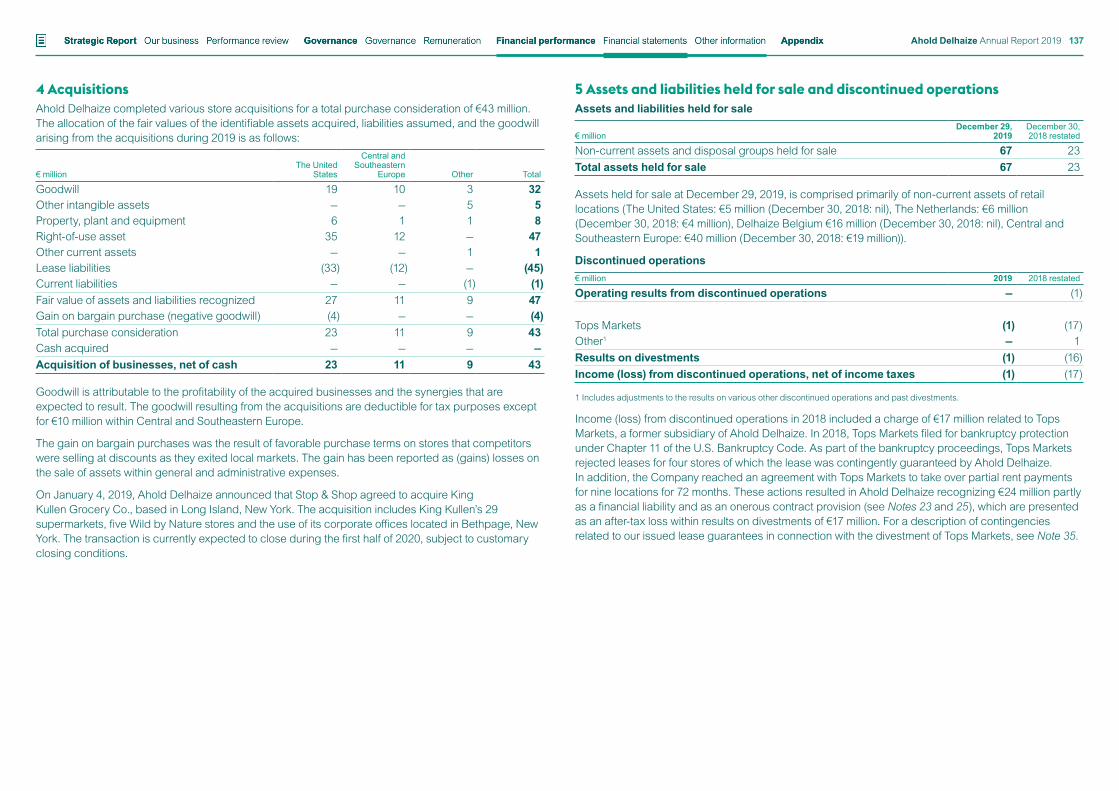
4 AcquisitionsAhold Delhaize completed various store acquisitions for a total purchase consideration of €43 million. The allocation of the fair values of the identifiable assets acquired, liabilities assumed, and the goodwill arising from the acquisitions during 2019 is as follows:
€ million
The United States
Central and Southeastern
Europe Other Total
Goodwill 19 10 3 32Other intangible assets — — 5 5Property, plant and equipment 6 1 1 8Right-of-use asset 35 12 — 47Other current assets — — 1 1Lease liabilities (33) (12) — (45)Current liabilities — — (1) (1)Fair value of assets and liabilities recognized 27 11 9 47Gain on bargain purchase (negative goodwill) (4) — — (4)Total purchase consideration 23 11 9 43Cash acquired — — — —Acquisition of businesses, net of cash 23 11 9 43
Goodwill is attributable to the profitability of the acquired businesses and the synergies that are expected to result. The goodwill resulting from the acquisitions are deductible for tax purposes except for €10 million within Central and Southeastern Europe.
The gain on bargain purchases was the result of favorable purchase terms on stores that competitors were selling at discounts as they exited local markets. The gain has been reported as (gains) losses on the sale of assets within general and administrative expenses.
On January 4, 2019, Ahold Delhaize announced that Stop & Shop agreed to acquire King Kullen Grocery Co., based in Long Island, New York. The acquisition includes King Kullen’s 29 supermarkets, five Wild by Nature stores and the use of its corporate offices located in Bethpage, New York. The transaction is currently expected to close during the first half of 2020, subject to customary closing conditions.
5 Assets and liabilities held for sale and discontinued operationsAssets and liabilities held for sale
€ millionDecember 29,
2019December 30, 2018 restated
Non-current assets and disposal groups held for sale 67 23Total assets held for sale 67 23
Assets held for sale at December 29, 2019, is comprised primarily of non-current assets of retail locations (The United States: €5 million (December 30, 2018: nil), The Netherlands: €6 million (December 30, 2018: €4 million), Delhaize Belgium €16 million (December 30, 2018: nil), Central and Southeastern Europe: €40 million (December 30, 2018: €19 million)).
Discontinued operations€ million 2019 2018 restated
Operating results from discontinued operations — (1)
Tops Markets (1) (17)Other1 — 1Results on divestments (1) (16)Income (loss) from discontinued operations, net of income taxes (1) (17)
1 Includes adjustments to the results on various other discontinued operations and past divestments.
Income (loss) from discontinued operations in 2018 included a charge of €17 million related to Tops Markets, a former subsidiary of Ahold Delhaize. In 2018, Tops Markets filed for bankruptcy protection under Chapter 11 of the U.S. Bankruptcy Code. As part of the bankruptcy proceedings, Tops Markets rejected leases for four stores of which the lease was contingently guaranteed by Ahold Delhaize. In addition, the Company reached an agreement with Tops Markets to take over partial rent payments for nine locations for 72 months. These actions resulted in Ahold Delhaize recognizing €24 million partly as a financial liability and as an onerous contract provision (see Notes 23 and 25), which are presented as an after-tax loss within results on divestments of €17 million. For a description of contingencies related to our issued lease guarantees in connection with the divestment of Tops Markets, see Note 35.
Financial statements Other informationStrategic Report Governance Financial performance AppendixGovernance RemunerationOur business Performance review Ahold Delhaize Annual Report 2019 137
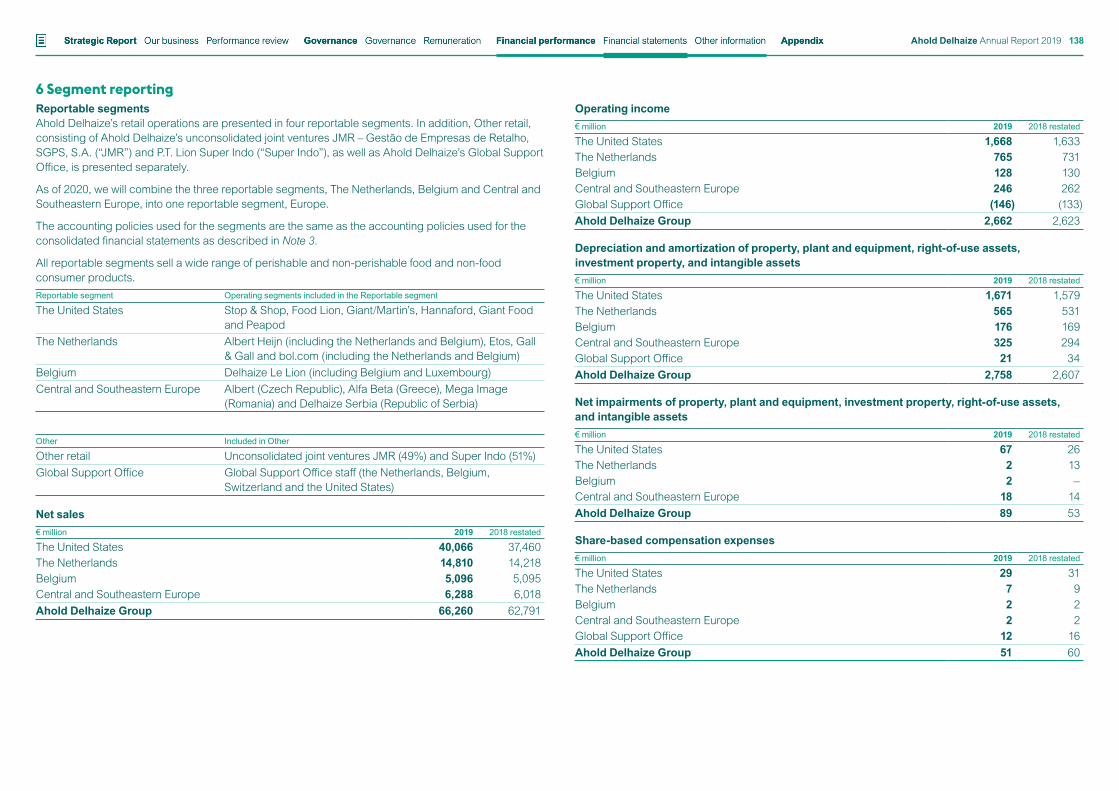
6 Segment reportingReportable segmentsAhold Delhaize’s retail operations are presented in four reportable segments. In addition, Other retail, consisting of Ahold Delhaize’s unconsolidated joint ventures JMR – Gestão de Empresas de Retalho, SGPS, S.A. (“JMR”) and P.T. Lion Super Indo (“Super Indo”), as well as Ahold Delhaize’s Global Support Office, is presented separately.
As of 2020, we will combine the three reportable segments, The Netherlands, Belgium and Central and Southeastern Europe, into one reportable segment, Europe.
The accounting policies used for the segments are the same as the accounting policies used for the consolidated financial statements as described in Note 3.
All reportable segments sell a wide range of perishable and non-perishable food and non-food consumer products.Reportable segment Operating segments included in the Reportable segment
The United States Stop & Shop, Food Lion, Giant/Martin’s, Hannaford, Giant Food and Peapod
The Netherlands Albert Heijn (including the Netherlands and Belgium), Etos, Gall & Gall and bol.com (including the Netherlands and Belgium)
Belgium Delhaize Le Lion (including Belgium and Luxembourg)Central and Southeastern Europe Albert (Czech Republic), Alfa Beta (Greece), Mega Image
(Romania) and Delhaize Serbia (Republic of Serbia)
Other Included in Other
Other retail Unconsolidated joint ventures JMR (49%) and Super Indo (51%)Global Support Office Global Support Office staff (the Netherlands, Belgium,
Switzerland and the United States)
Net sales€ million 2019 2018 restated
The United States 40,066 37,460The Netherlands 14,810 14,218Belgium 5,096 5,095Central and Southeastern Europe 6,288 6,018Ahold Delhaize Group 66,260 62,791
Operating income€ million 2019 2018 restated
The United States 1,668 1,633The Netherlands 765 731Belgium 128 130Central and Southeastern Europe 246 262Global Support Office (146) (133)Ahold Delhaize Group 2,662 2,623
Depreciation and amortization of property, plant and equipment, right-of-use assets, investment property, and intangible assets€ million 2019 2018 restated
The United States 1,671 1,579The Netherlands 565 531Belgium 176 169Central and Southeastern Europe 325 294Global Support Office 21 34Ahold Delhaize Group 2,758 2,607
Net impairments of property, plant and equipment, investment property, right-of-use assets, and intangible assets€ million 2019 2018 restated
The United States 67 26The Netherlands 2 13Belgium 2 —Central and Southeastern Europe 18 14Ahold Delhaize Group 89 53
Share-based compensation expenses€ million 2019 2018 restated
The United States 29 31The Netherlands 7 9Belgium 2 2Central and Southeastern Europe 2 2Global Support Office 12 16Ahold Delhaize Group 51 60
Financial statements Other informationStrategic Report Governance Financial performance AppendixGovernance RemunerationOur business Performance review Ahold Delhaize Annual Report 2019 138
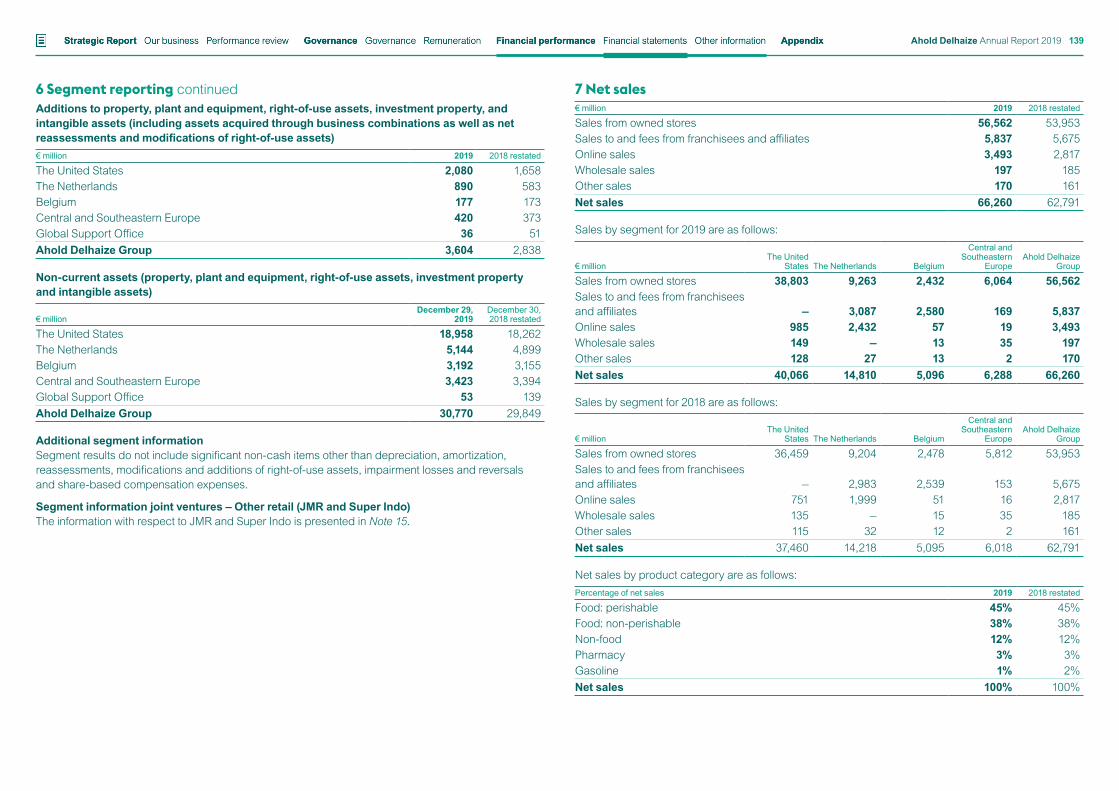
6 Segment reporting continuedAdditions to property, plant and equipment, right-of-use assets, investment property, and intangible assets (including assets acquired through business combinations as well as net reassessments and modifications of right-of-use assets)€ million 2019 2018 restated
The United States 2,080 1,658The Netherlands 890 583Belgium 177 173Central and Southeastern Europe 420 373Global Support Office 36 51Ahold Delhaize Group 3,604 2,838
Non-current assets (property, plant and equipment, right-of-use assets, investment property and intangible assets)
€ millionDecember 29,
2019December 30, 2018 restated
The United States 18,958 18,262The Netherlands 5,144 4,899Belgium 3,192 3,155Central and Southeastern Europe 3,423 3,394Global Support Office 53 139Ahold Delhaize Group 30,770 29,849
Additional segment informationSegment results do not include significant non-cash items other than depreciation, amortization, reassessments, modifications and additions of right-of-use assets, impairment losses and reversals and share-based compensation expenses.
Segment information joint ventures – Other retail (JMR and Super Indo)The information with respect to JMR and Super Indo is presented in Note 15.
7 Net sales€ million 2019 2018 restated
Sales from owned stores 56,562 53,953Sales to and fees from franchisees and affiliates 5,837 5,675Online sales 3,493 2,817Wholesale sales 197 185Other sales 170 161Net sales 66,260 62,791
Sales by segment for 2019 are as follows:
€ millionThe United
States The Netherlands Belgium
Central and Southeastern
EuropeAhold Delhaize
Group
Sales from owned stores 38,803 9,263 2,432 6,064 56,562Sales to and fees from franchisees and affiliates — 3,087 2,580 169 5,837Online sales 985 2,432 57 19 3,493Wholesale sales 149 — 13 35 197Other sales 128 27 13 2 170Net sales 40,066 14,810 5,096 6,288 66,260
Sales by segment for 2018 are as follows:
€ millionThe United
States The Netherlands Belgium
Central and Southeastern
EuropeAhold Delhaize
Group
Sales from owned stores 36,459 9,204 2,478 5,812 53,953Sales to and fees from franchisees and affiliates — 2,983 2,539 153 5,675Online sales 751 1,999 51 16 2,817Wholesale sales 135 — 15 35 185Other sales 115 32 12 2 161Net sales 37,460 14,218 5,095 6,018 62,791
Net sales by product category are as follows:Percentage of net sales 2019 2018 restated
Food: perishable 45% 45%Food: non-perishable 38% 38%Non-food 12% 12%Pharmacy 3% 3%Gasoline 1% 2%Net sales 100% 100%
Financial statements Other informationStrategic Report Governance Financial performance AppendixGovernance RemunerationOur business Performance review Ahold Delhaize Annual Report 2019 139
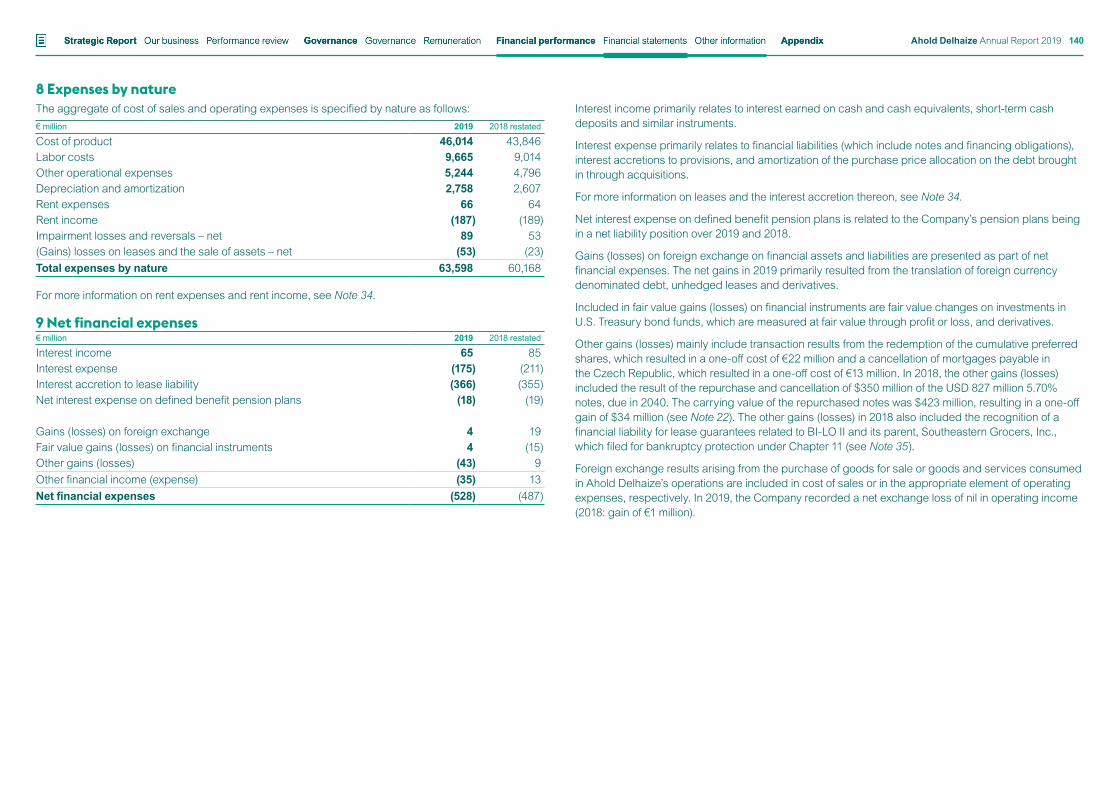
8 Expenses by natureThe aggregate of cost of sales and operating expenses is specified by nature as follows: € million 2019 2018 restated
Cost of product 46,014 43,846Labor costs 9,665 9,014Other operational expenses 5,244 4,796Depreciation and amortization 2,758 2,607Rent expenses 66 64Rent income (187) (189)Impairment losses and reversals – net 89 53(Gains) losses on leases and the sale of assets – net (53) (23)Total expenses by nature 63,598 60,168
For more information on rent expenses and rent income, see Note 34.
9 Net financial expenses€ million 2019 2018 restated
Interest income 65 85Interest expense (175) (211)Interest accretion to lease liability (366) (355)Net interest expense on defined benefit pension plans (18) (19)
Gains (losses) on foreign exchange 4 19Fair value gains (losses) on financial instruments 4 (15)Other gains (losses) (43) 9Other financial income (expense) (35) 13Net financial expenses (528) (487)
Interest income primarily relates to interest earned on cash and cash equivalents, short-term cash deposits and similar instruments.
Interest expense primarily relates to financial liabilities (which include notes and financing obligations), interest accretions to provisions, and amortization of the purchase price allocation on the debt brought in through acquisitions.
For more information on leases and the interest accretion thereon, see Note 34.
Net interest expense on defined benefit pension plans is related to the Company’s pension plans being in a net liability position over 2019 and 2018.
Gains (losses) on foreign exchange on financial assets and liabilities are presented as part of net financial expenses. The net gains in 2019 primarily resulted from the translation of foreign currency denominated debt, unhedged leases and derivatives.
Included in fair value gains (losses) on financial instruments are fair value changes on investments in U.S. Treasury bond funds, which are measured at fair value through profit or loss, and derivatives.
Other gains (losses) mainly include transaction results from the redemption of the cumulative preferred shares, which resulted in a one-off cost of €22 million and a cancellation of mortgages payable in the Czech Republic, which resulted in a one-off cost of €13 million. In 2018, the other gains (losses) included the result of the repurchase and cancellation of $350 million of the USD 827 million 5.70% notes, due in 2040. The carrying value of the repurchased notes was $423 million, resulting in a one-off gain of $34 million (see Note 22). The other gains (losses) in 2018 also included the recognition of a financial liability for lease guarantees related to BI-LO II and its parent, Southeastern Grocers, Inc., which filed for bankruptcy protection under Chapter 11 (see Note 35).
Foreign exchange results arising from the purchase of goods for sale or goods and services consumed in Ahold Delhaize’s operations are included in cost of sales or in the appropriate element of operating expenses, respectively. In 2019, the Company recorded a net exchange loss of nil in operating income (2018: gain of €1 million).
Financial statements Other informationStrategic Report Governance Financial performance AppendixGovernance RemunerationOur business Performance review Ahold Delhaize Annual Report 2019 140
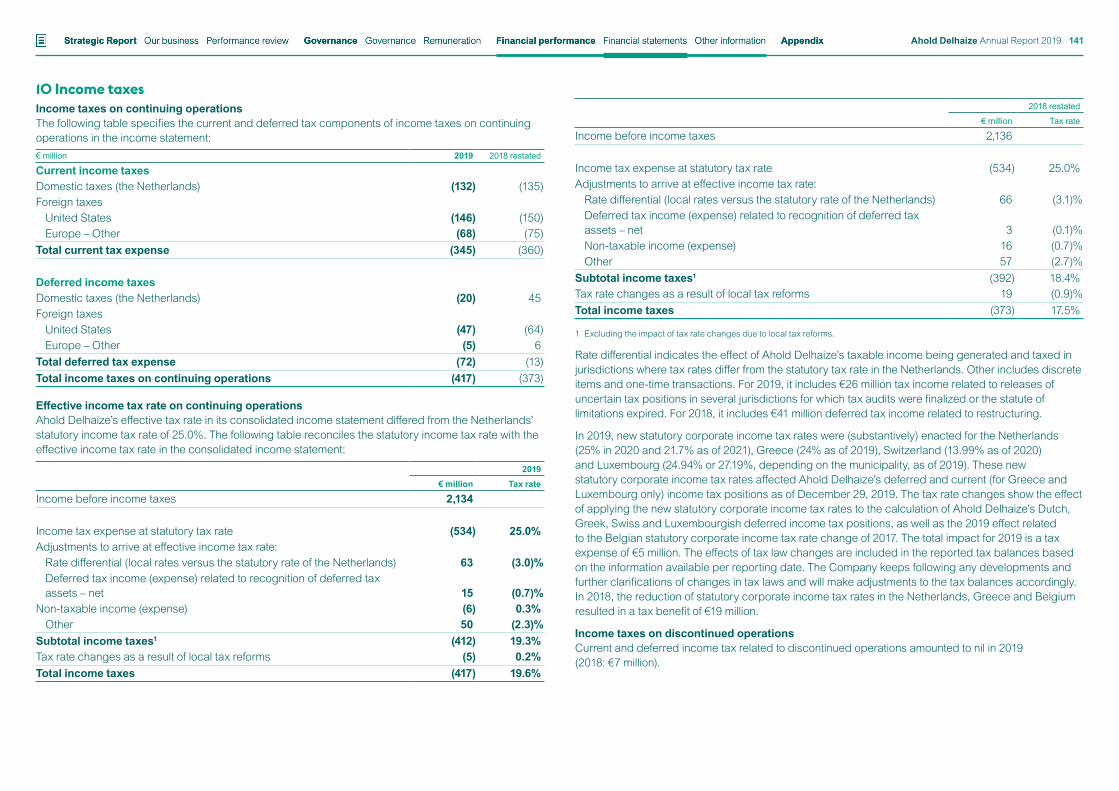
10 Income taxesIncome taxes on continuing operationsThe following table specifies the current and deferred tax components of income taxes on continuing operations in the income statement: € million 2019 2018 restated
Current income taxesDomestic taxes (the Netherlands) (132) (135)Foreign taxes
United States (146) (150)Europe – Other (68) (75)
Total current tax expense (345) (360)
Deferred income taxesDomestic taxes (the Netherlands) (20) 45Foreign taxes
United States (47) (64)Europe – Other (5) 6
Total deferred tax expense (72) (13)Total income taxes on continuing operations (417) (373)
Effective income tax rate on continuing operationsAhold Delhaize’s effective tax rate in its consolidated income statement differed from the Netherlands’ statutory income tax rate of 25.0%. The following table reconciles the statutory income tax rate with the effective income tax rate in the consolidated income statement:
2019
€ million Tax rate
Income before income taxes 2,134
Income tax expense at statutory tax rate (534) 25.0%Adjustments to arrive at effective income tax rate:
Rate differential (local rates versus the statutory rate of the Netherlands) 63 (3.0)%Deferred tax income (expense) related to recognition of deferred tax assets – net 15 (0.7)%
Non-taxable income (expense) (6) 0.3%Other 50 (2.3)%
Subtotal income taxes1 (412) 19.3%Tax rate changes as a result of local tax reforms (5) 0.2%Total income taxes (417) 19.6%
2018 restated
€ million Tax rate
Income before income taxes 2,136
Income tax expense at statutory tax rate (534) 25.0%Adjustments to arrive at effective income tax rate:
Rate differential (local rates versus the statutory rate of the Netherlands) 66 (3.1)%Deferred tax income (expense) related to recognition of deferred tax assets – net 3 (0.1)%Non-taxable income (expense) 16 (0.7)%Other 57 (2.7)%
Subtotal income taxes1 (392) 18.4%Tax rate changes as a result of local tax reforms 19 (0.9)%Total income taxes (373) 17.5%
1 Excluding the impact of tax rate changes due to local tax reforms.
Rate differential indicates the effect of Ahold Delhaize’s taxable income being generated and taxed in jurisdictions where tax rates differ from the statutory tax rate in the Netherlands. Other includes discrete items and one-time transactions. For 2019, it includes €26 million tax income related to releases of uncertain tax positions in several jurisdictions for which tax audits were finalized or the statute of limitations expired. For 2018, it includes €41 million deferred tax income related to restructuring.
In 2019, new statutory corporate income tax rates were (substantively) enacted for the Netherlands (25% in 2020 and 21.7% as of 2021), Greece (24% as of 2019), Switzerland (13.99% as of 2020) and Luxembourg (24.94% or 27.19%, depending on the municipality, as of 2019). These new statutory corporate income tax rates affected Ahold Delhaize’s deferred and current (for Greece and Luxembourg only) income tax positions as of December 29, 2019. The tax rate changes show the effect of applying the new statutory corporate income tax rates to the calculation of Ahold Delhaize’s Dutch, Greek, Swiss and Luxembourgish deferred income tax positions, as well as the 2019 effect related to the Belgian statutory corporate income tax rate change of 2017. The total impact for 2019 is a tax expense of €5 million. The effects of tax law changes are included in the reported tax balances based on the information available per reporting date. The Company keeps following any developments and further clarifications of changes in tax laws and will make adjustments to the tax balances accordingly. In 2018, the reduction of statutory corporate income tax rates in the Netherlands, Greece and Belgium resulted in a tax benefit of €19 million.
Income taxes on discontinued operationsCurrent and deferred income tax related to discontinued operations amounted to nil in 2019 (2018: €7 million).
Financial statements Other informationStrategic Report Governance Financial performance AppendixGovernance RemunerationOur business Performance review Ahold Delhaize Annual Report 2019 141
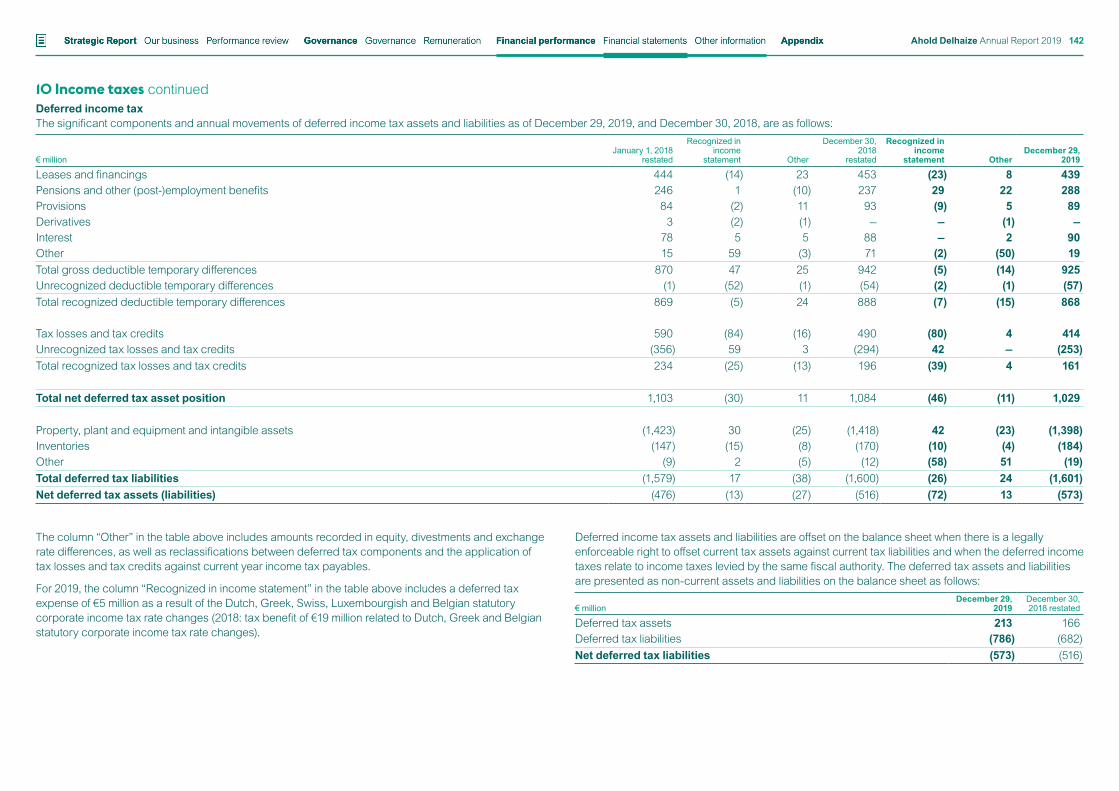
10 Income taxes continuedDeferred income taxThe significant components and annual movements of deferred income tax assets and liabilities as of December 29, 2019, and December 30, 2018, are as follows:
€ millionJanuary 1, 2018
restated
Recognized in income
statement Other
December 30, 2018
restated
Recognized in income
statement OtherDecember 29,
2019
Leases and financings 444 (14) 23 453 (23) 8 439Pensions and other (post-)employment benefits 246 1 (10) 237 29 22 288Provisions 84 (2) 11 93 (9) 5 89Derivatives 3 (2) (1) — — (1) —Interest 78 5 5 88 — 2 90Other 15 59 (3) 71 (2) (50) 19Total gross deductible temporary differences 870 47 25 942 (5) (14) 925Unrecognized deductible temporary differences (1) (52) (1) (54) (2) (1) (57)Total recognized deductible temporary differences 869 (5) 24 888 (7) (15) 868
Tax losses and tax credits 590 (84) (16) 490 (80) 4 414Unrecognized tax losses and tax credits (356) 59 3 (294) 42 — (253)Total recognized tax losses and tax credits 234 (25) (13) 196 (39) 4 161
Total net deferred tax asset position 1,103 (30) 11 1,084 (46) (11) 1,029
Property, plant and equipment and intangible assets (1,423) 30 (25) (1,418) 42 (23) (1,398)Inventories (147) (15) (8) (170) (10) (4) (184)Other (9) 2 (5) (12) (58) 51 (19)Total deferred tax liabilities (1,579) 17 (38) (1,600) (26) 24 (1,601)Net deferred tax assets (liabilities) (476) (13) (27) (516) (72) 13 (573)
The column “Other” in the table above includes amounts recorded in equity, divestments and exchange rate differences, as well as reclassifications between deferred tax components and the application of tax losses and tax credits against current year income tax payables.
For 2019, the column “Recognized in income statement” in the table above includes a deferred tax expense of €5 million as a result of the Dutch, Greek, Swiss, Luxembourgish and Belgian statutory corporate income tax rate changes (2018: tax benefit of €19 million related to Dutch, Greek and Belgian statutory corporate income tax rate changes).
Deferred income tax assets and liabilities are offset on the balance sheet when there is a legally enforceable right to offset current tax assets against current tax liabilities and when the deferred income taxes relate to income taxes levied by the same fiscal authority. The deferred tax assets and liabilities are presented as non-current assets and liabilities on the balance sheet as follows:
€ millionDecember 29,
2019December 30, 2018 restated
Deferred tax assets 213 166Deferred tax liabilities (786) (682)Net deferred tax liabilities (573) (516)
Financial statements Other informationStrategic Report Governance Financial performance AppendixGovernance RemunerationOur business Performance review Ahold Delhaize Annual Report 2019 142
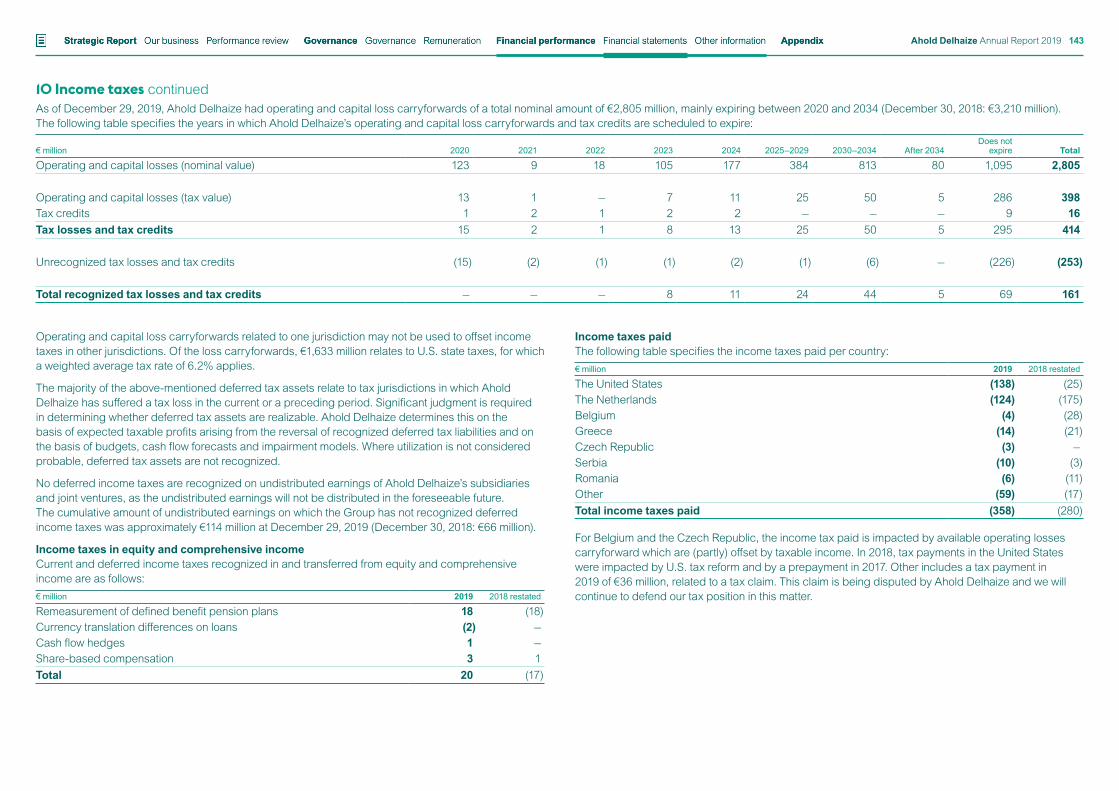
10 Income taxes continuedAs of December 29, 2019, Ahold Delhaize had operating and capital loss carryforwards of a total nominal amount of €2,805 million, mainly expiring between 2020 and 2034 (December 30, 2018: €3,210 million). The following table specifies the years in which Ahold Delhaize’s operating and capital loss carryforwards and tax credits are scheduled to expire:
€ million 2020 2021 2022 2023 2024 2025–2029 2030–2034 After 2034Does not
expire Total
Operating and capital losses (nominal value) 123 9 18 105 177 384 813 80 1,095 2,805
Operating and capital losses (tax value) 13 1 — 7 11 25 50 5 286 398Tax credits 1 2 1 2 2 — — — 9 16Tax losses and tax credits 15 2 1 8 13 25 50 5 295 414
Unrecognized tax losses and tax credits (15) (2) (1) (1) (2) (1) (6) — (226) (253)
Total recognized tax losses and tax credits — — — 8 11 24 44 5 69 161
Operating and capital loss carryforwards related to one jurisdiction may not be used to offset income taxes in other jurisdictions. Of the loss carryforwards, €1,633 million relates to U.S. state taxes, for which a weighted average tax rate of 6.2% applies.
The majority of the above-mentioned deferred tax assets relate to tax jurisdictions in which Ahold Delhaize has suffered a tax loss in the current or a preceding period. Significant judgment is required in determining whether deferred tax assets are realizable. Ahold Delhaize determines this on the basis of expected taxable profits arising from the reversal of recognized deferred tax liabilities and on the basis of budgets, cash flow forecasts and impairment models. Where utilization is not considered probable, deferred tax assets are not recognized.
No deferred income taxes are recognized on undistributed earnings of Ahold Delhaize’s subsidiaries and joint ventures, as the undistributed earnings will not be distributed in the foreseeable future. The cumulative amount of undistributed earnings on which the Group has not recognized deferred income taxes was approximately €114 million at December 29, 2019 (December 30, 2018: €66 million).
Income taxes in equity and comprehensive income Current and deferred income taxes recognized in and transferred from equity and comprehensive income are as follows:€ million 2019 2018 restated
Remeasurement of defined benefit pension plans 18 (18)Currency translation differences on loans (2) —Cash flow hedges 1 —Share-based compensation 3 1Total 20 (17)
Income taxes paidThe following table specifies the income taxes paid per country: € million 2019 2018 restated
The United States (138) (25)The Netherlands (124) (175)Belgium (4) (28)Greece (14) (21)Czech Republic (3) —Serbia (10) (3)Romania (6) (11)Other (59) (17)Total income taxes paid (358) (280)
For Belgium and the Czech Republic, the income tax paid is impacted by available operating losses carryforward which are (partly) offset by taxable income. In 2018, tax payments in the United States were impacted by U.S. tax reform and by a prepayment in 2017. Other includes a tax payment in 2019 of €36 million, related to a tax claim. This claim is being disputed by Ahold Delhaize and we will continue to defend our tax position in this matter.
Financial statements Other informationStrategic Report Governance Financial performance AppendixGovernance RemunerationOur business Performance review Ahold Delhaize Annual Report 2019 143
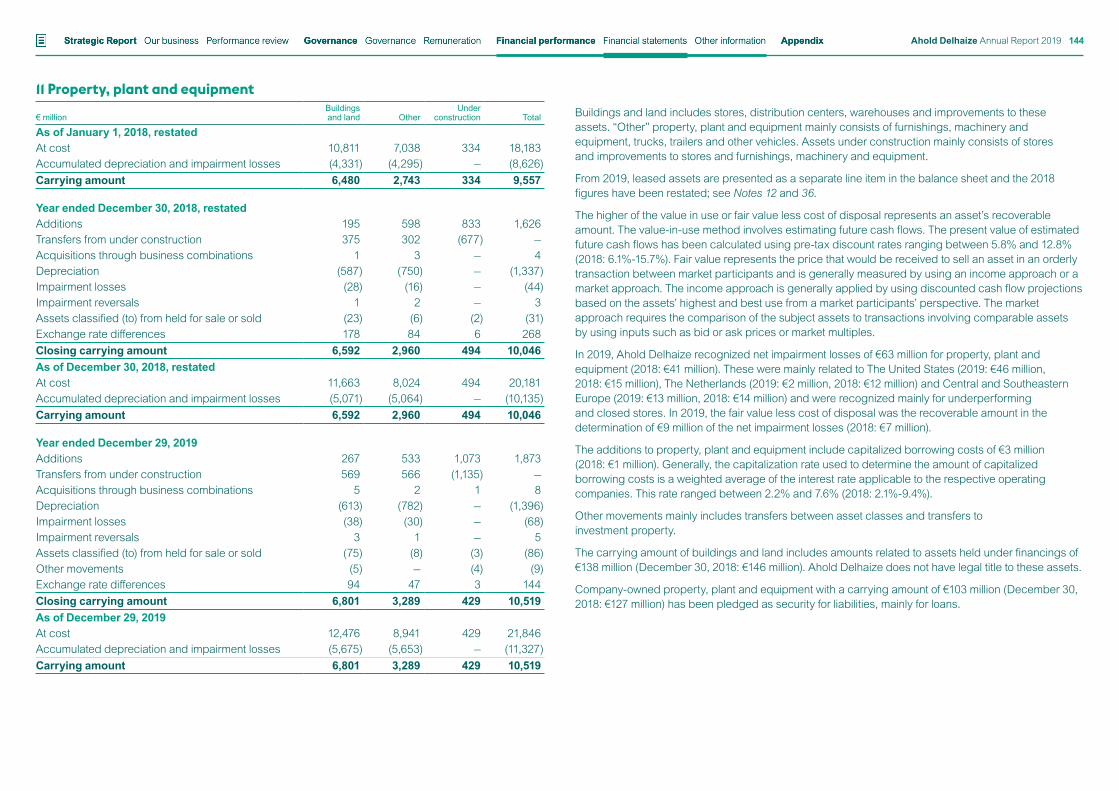
11 Property, plant and equipment
€ millionBuildings and land Other
Under construction Total
As of January 1, 2018, restatedAt cost 10,811 7,038 334 18,183Accumulated depreciation and impairment losses (4,331) (4,295) — (8,626)Carrying amount 6,480 2,743 334 9,557
Year ended December 30, 2018, restatedAdditions 195 598 833 1,626Transfers from under construction 375 302 (677) —Acquisitions through business combinations 1 3 — 4Depreciation (587) (750) — (1,337)Impairment losses (28) (16) — (44)Impairment reversals 1 2 — 3Assets classified (to) from held for sale or sold (23) (6) (2) (31)Exchange rate differences 178 84 6 268Closing carrying amount 6,592 2,960 494 10,046As of December 30, 2018, restatedAt cost 11,663 8,024 494 20,181Accumulated depreciation and impairment losses (5,071) (5,064) — (10,135)Carrying amount 6,592 2,960 494 10,046
Year ended December 29, 2019Additions 267 533 1,073 1,873Transfers from under construction 569 566 (1,135) —Acquisitions through business combinations 5 2 1 8Depreciation (613) (782) — (1,396)Impairment losses (38) (30) — (68)Impairment reversals 3 1 — 5Assets classified (to) from held for sale or sold (75) (8) (3) (86)Other movements (5) — (4) (9)Exchange rate differences 94 47 3 144Closing carrying amount 6,801 3,289 429 10,519As of December 29, 2019At cost 12,476 8,941 429 21,846Accumulated depreciation and impairment losses (5,675) (5,653) — (11,327)Carrying amount 6,801 3,289 429 10,519
Buildings and land includes stores, distribution centers, warehouses and improvements to these assets. “Other” property, plant and equipment mainly consists of furnishings, machinery and equipment, trucks, trailers and other vehicles. Assets under construction mainly consists of stores and improvements to stores and furnishings, machinery and equipment.
From 2019, leased assets are presented as a separate line item in the balance sheet and the 2018 figures have been restated; see Notes 12 and 36.
The higher of the value in use or fair value less cost of disposal represents an asset’s recoverable amount. The value-in-use method involves estimating future cash flows. The present value of estimated future cash flows has been calculated using pre-tax discount rates ranging between 5.8% and 12.8% (2018: 6.1%-15.7%). Fair value represents the price that would be received to sell an asset in an orderly transaction between market participants and is generally measured by using an income approach or a market approach. The income approach is generally applied by using discounted cash flow projections based on the assets’ highest and best use from a market participants’ perspective. The market approach requires the comparison of the subject assets to transactions involving comparable assets by using inputs such as bid or ask prices or market multiples.
In 2019, Ahold Delhaize recognized net impairment losses of €63 million for property, plant and equipment (2018: €41 million). These were mainly related to The United States (2019: €46 million, 2018: €15 million), The Netherlands (2019: €2 million, 2018: €12 million) and Central and Southeastern Europe (2019: €13 million, 2018: €14 million) and were recognized mainly for underperforming and closed stores. In 2019, the fair value less cost of disposal was the recoverable amount in the determination of €9 million of the net impairment losses (2018: €7 million).
The additions to property, plant and equipment include capitalized borrowing costs of €3 million (2018: €1 million). Generally, the capitalization rate used to determine the amount of capitalized borrowing costs is a weighted average of the interest rate applicable to the respective operating companies. This rate ranged between 2.2% and 7.6% (2018: 2.1%-9.4%).
Other movements mainly includes transfers between asset classes and transfers to investment property.
The carrying amount of buildings and land includes amounts related to assets held under financings of €138 million (December 30, 2018: €146 million). Ahold Delhaize does not have legal title to these assets.
Company-owned property, plant and equipment with a carrying amount of €103 million (December 30, 2018: €127 million) has been pledged as security for liabilities, mainly for loans.
Financial statements Other informationStrategic Report Governance Financial performance AppendixGovernance RemunerationOur business Performance review Ahold Delhaize Annual Report 2019 144
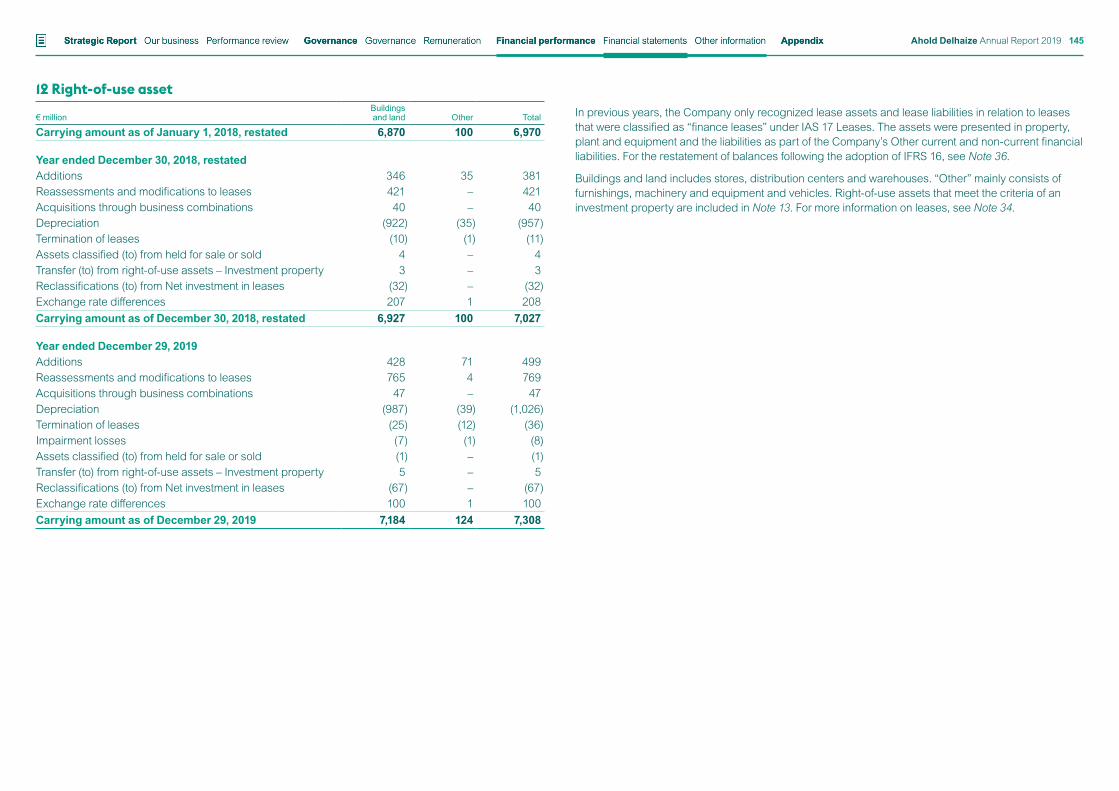
12 Right-of-use asset
€ millionBuildings and land Other Total
Carrying amount as of January 1, 2018, restated 6,870 100 6,970
Year ended December 30, 2018, restatedAdditions 346 35 381Reassessments and modifications to leases 421 – 421Acquisitions through business combinations 40 – 40Depreciation (922) (35) (957)Termination of leases (10) (1) (11)Assets classified (to) from held for sale or sold 4 – 4Transfer (to) from right-of-use assets – Investment property 3 – 3Reclassifications (to) from Net investment in leases (32) – (32)Exchange rate differences 207 1 208Carrying amount as of December 30, 2018, restated 6,927 100 7,027
Year ended December 29, 2019Additions 428 71 499Reassessments and modifications to leases 765 4 769Acquisitions through business combinations 47 – 47Depreciation (987) (39) (1,026)Termination of leases (25) (12) (36)Impairment losses (7) (1) (8)Assets classified (to) from held for sale or sold (1) – (1)Transfer (to) from right-of-use assets – Investment property 5 – 5Reclassifications (to) from Net investment in leases (67) – (67)Exchange rate differences 100 1 100Carrying amount as of December 29, 2019 7,184 124 7,308
In previous years, the Company only recognized lease assets and lease liabilities in relation to leases that were classified as “finance leases” under IAS 17 Leases. The assets were presented in property, plant and equipment and the liabilities as part of the Company’s Other current and non-current financial liabilities. For the restatement of balances following the adoption of IFRS 16, see Note 36.
Buildings and land includes stores, distribution centers and warehouses. “Other” mainly consists of furnishings, machinery and equipment and vehicles. Right-of-use assets that meet the criteria of an investment property are included in Note 13. For more information on leases, see Note 34.
Financial statements Other informationStrategic Report Governance Financial performance AppendixGovernance RemunerationOur business Performance review Ahold Delhaize Annual Report 2019 145
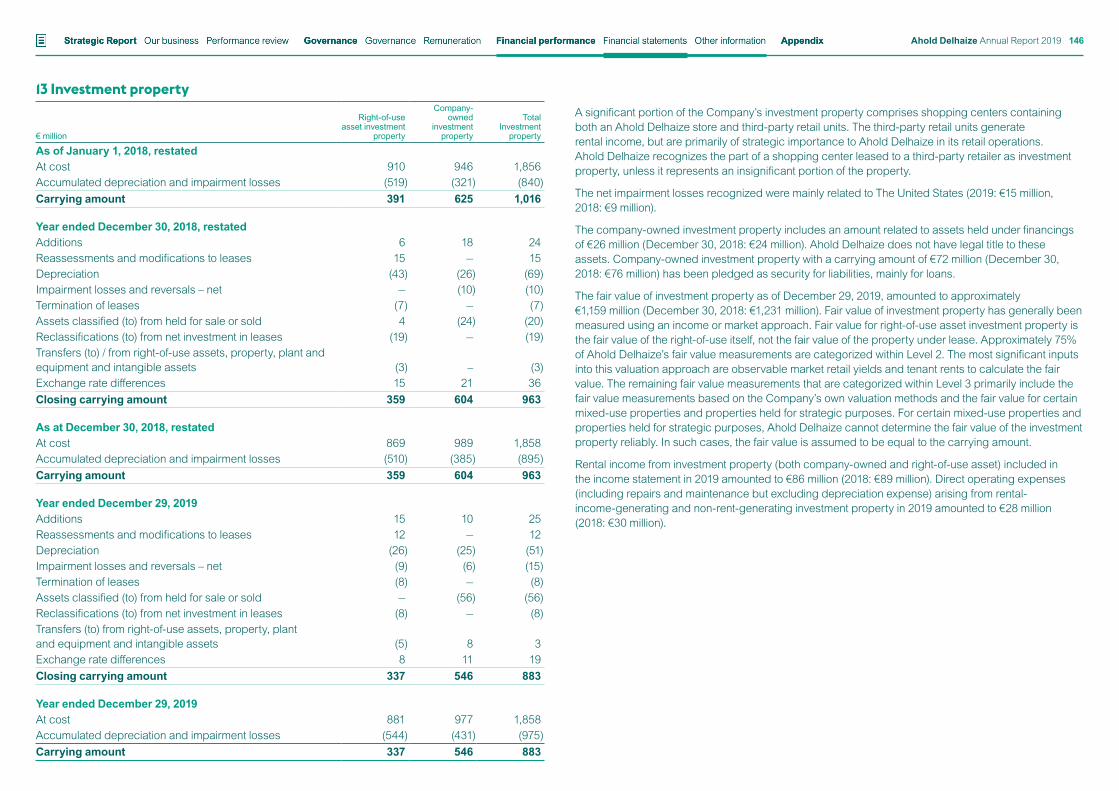
13 Investment property
€ million
Right-of-use asset investment
property
Company-owned
investment property
Total Investment
property
As of January 1, 2018, restatedAt cost 910 946 1,856Accumulated depreciation and impairment losses (519) (321) (840)Carrying amount 391 625 1,016
Year ended December 30, 2018, restatedAdditions 6 18 24Reassessments and modifications to leases 15 — 15Depreciation (43) (26) (69)Impairment losses and reversals – net — (10) (10)Termination of leases (7) — (7)Assets classified (to) from held for sale or sold 4 (24) (20)Reclassifications (to) from net investment in leases (19) — (19)Transfers (to) / from right-of-use assets, property, plant and equipment and intangible assets (3) – (3)Exchange rate differences 15 21 36Closing carrying amount 359 604 963
As at December 30, 2018, restatedAt cost 869 989 1,858Accumulated depreciation and impairment losses (510) (385) (895)Carrying amount 359 604 963
Year ended December 29, 2019Additions 15 10 25Reassessments and modifications to leases 12 — 12Depreciation (26) (25) (51)Impairment losses and reversals – net (9) (6) (15)Termination of leases (8) — (8)Assets classified (to) from held for sale or sold — (56) (56)Reclassifications (to) from net investment in leases (8) — (8)Transfers (to) from right-of-use assets, property, plant and equipment and intangible assets (5) 8 3Exchange rate differences 8 11 19Closing carrying amount 337 546 883
Year ended December 29, 2019At cost 881 977 1,858Accumulated depreciation and impairment losses (544) (431) (975)Carrying amount 337 546 883
A significant portion of the Company’s investment property comprises shopping centers containing both an Ahold Delhaize store and third-party retail units. The third-party retail units generate rental income, but are primarily of strategic importance to Ahold Delhaize in its retail operations. Ahold Delhaize recognizes the part of a shopping center leased to a third-party retailer as investment property, unless it represents an insignificant portion of the property.
The net impairment losses recognized were mainly related to The United States (2019: €15 million, 2018: €9 million).
The company-owned investment property includes an amount related to assets held under financings of €26 million (December 30, 2018: €24 million). Ahold Delhaize does not have legal title to these assets. Company-owned investment property with a carrying amount of €72 million (December 30, 2018: €76 million) has been pledged as security for liabilities, mainly for loans.
The fair value of investment property as of December 29, 2019, amounted to approximately €1,159 million (December 30, 2018: €1,231 million). Fair value of investment property has generally been measured using an income or market approach. Fair value for right-of-use asset investment property is the fair value of the right-of-use itself, not the fair value of the property under lease. Approximately 75% of Ahold Delhaize’s fair value measurements are categorized within Level 2. The most significant inputs into this valuation approach are observable market retail yields and tenant rents to calculate the fair value. The remaining fair value measurements that are categorized within Level 3 primarily include the fair value measurements based on the Company’s own valuation methods and the fair value for certain mixed-use properties and properties held for strategic purposes. For certain mixed-use properties and properties held for strategic purposes, Ahold Delhaize cannot determine the fair value of the investment property reliably. In such cases, the fair value is assumed to be equal to the carrying amount.
Rental income from investment property (both company-owned and right-of-use asset) included in the income statement in 2019 amounted to €86 million (2018: €89 million). Direct operating expenses (including repairs and maintenance but excluding depreciation expense) arising from rental-income-generating and non-rent-generating investment property in 2019 amounted to €28 million (2018: €30 million).
Financial statements Other informationStrategic Report Governance Financial performance AppendixGovernance RemunerationOur business Performance review Ahold Delhaize Annual Report 2019 146
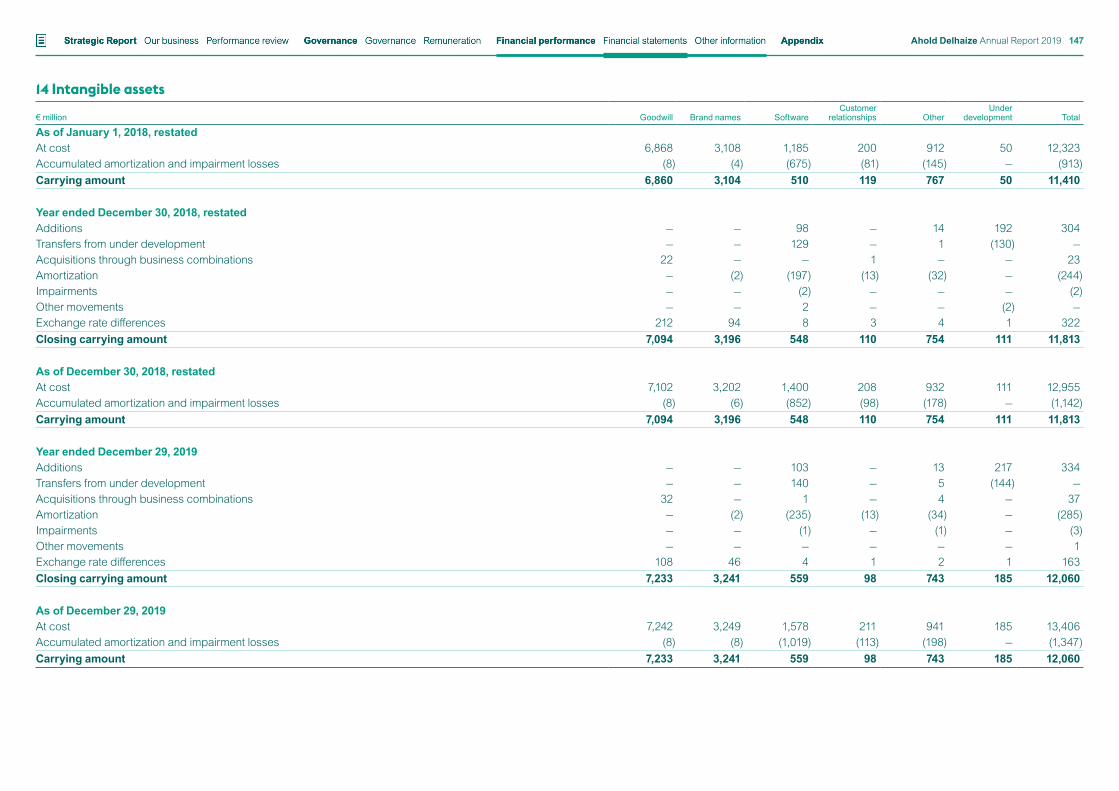
14 Intangible assets
€ million Goodwill Brand names SoftwareCustomer
relationships OtherUnder
development Total
As of January 1, 2018, restatedAt cost 6,868 3,108 1,185 200 912 50 12,323Accumulated amortization and impairment losses (8) (4) (675) (81) (145) — (913)Carrying amount 6,860 3,104 510 119 767 50 11,410
Year ended December 30, 2018, restatedAdditions — — 98 — 14 192 304Transfers from under development — — 129 — 1 (130) —Acquisitions through business combinations 22 — — 1 — — 23Amortization — (2) (197) (13) (32) — (244)Impairments — — (2) — — — (2)Other movements — — 2 — — (2) —Exchange rate differences 212 94 8 3 4 1 322Closing carrying amount 7,094 3,196 548 110 754 111 11,813
As of December 30, 2018, restatedAt cost 7,102 3,202 1,400 208 932 111 12,955Accumulated amortization and impairment losses (8) (6) (852) (98) (178) — (1,142)Carrying amount 7,094 3,196 548 110 754 111 11,813
Year ended December 29, 2019Additions — — 103 — 13 217 334Transfers from under development — — 140 — 5 (144) —Acquisitions through business combinations 32 — 1 — 4 — 37Amortization — (2) (235) (13) (34) — (285)Impairments — — (1) — (1) — (3)Other movements — — — — — — 1Exchange rate differences 108 46 4 1 2 1 163Closing carrying amount 7,233 3,241 559 98 743 185 12,060
As of December 29, 2019At cost 7,242 3,249 1,578 211 941 185 13,406Accumulated amortization and impairment losses (8) (8) (1,019) (113) (198) — (1,347)Carrying amount 7,233 3,241 559 98 743 185 12,060
Financial statements Other informationStrategic Report Governance Financial performance AppendixGovernance RemunerationOur business Performance review Ahold Delhaize Annual Report 2019 147
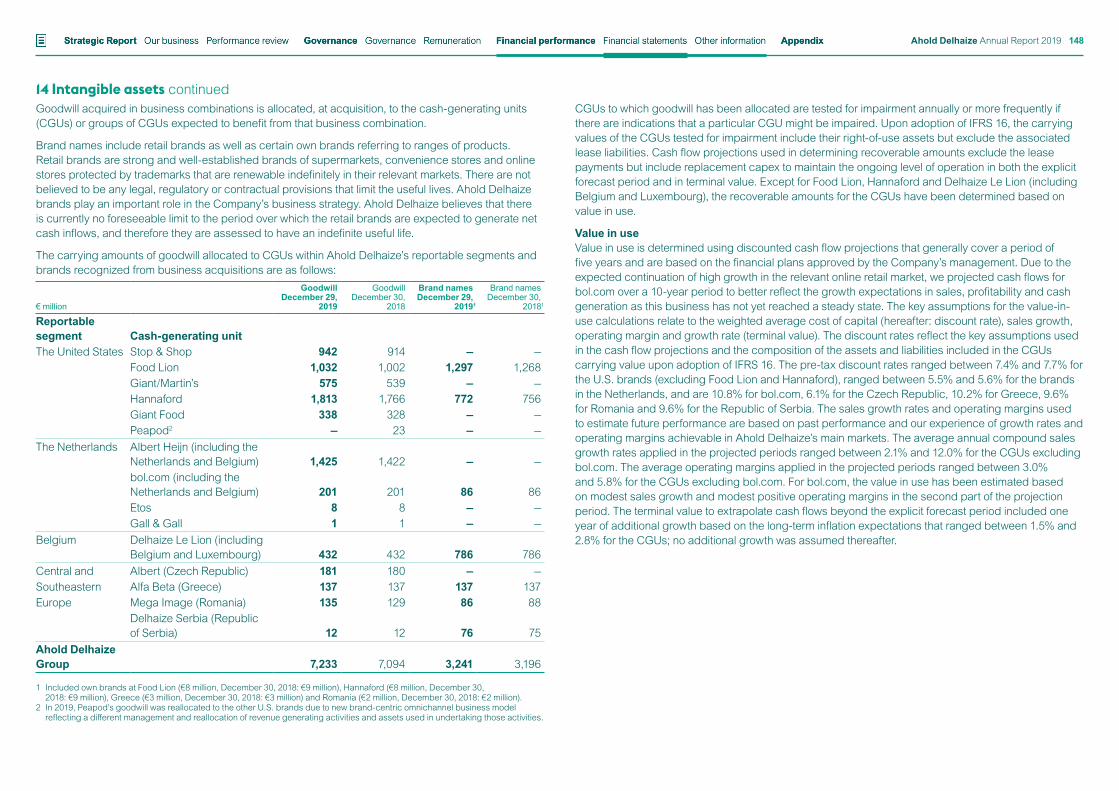
14 Intangible assets continuedGoodwill acquired in business combinations is allocated, at acquisition, to the cash-generating units (CGUs) or groups of CGUs expected to benefit from that business combination.
Brand names include retail brands as well as certain own brands referring to ranges of products. Retail brands are strong and well-established brands of supermarkets, convenience stores and online stores protected by trademarks that are renewable indefinitely in their relevant markets. There are not believed to be any legal, regulatory or contractual provisions that limit the useful lives. Ahold Delhaize brands play an important role in the Company’s business strategy. Ahold Delhaize believes that there is currently no foreseeable limit to the period over which the retail brands are expected to generate net cash inflows, and therefore they are assessed to have an indefinite useful life.
The carrying amounts of goodwill allocated to CGUs within Ahold Delhaize’s reportable segments and brands recognized from business acquisitions are as follows:
€ million
Goodwill December 29,
2019
Goodwill December 30,
2018
Brand names December 29,
2019¹
Brand namesDecember 30,
20181
Reportable segment Cash-generating unitThe United States Stop & Shop 942 914 — —
Food Lion 1,032 1,002 1,297 1,268Giant/Martin’s 575 539 — —Hannaford 1,813 1,766 772 756Giant Food 338 328 — —Peapod2 — 23 — —
The Netherlands Albert Heijn (including the Netherlands and Belgium) 1,425 1,422 — —bol.com (including the Netherlands and Belgium) 201 201 86 86Etos 8 8 — —Gall & Gall 1 1 — —
Belgium Delhaize Le Lion (including Belgium and Luxembourg) 432 432 786 786
Central and Albert (Czech Republic) 181 180 — —Southeastern Alfa Beta (Greece) 137 137 137 137Europe Mega Image (Romania) 135 129 86 88
Delhaize Serbia (Republic of Serbia) 12 12 76 75
Ahold Delhaize Group 7,233 7,094 3,241 3,196
1 Included own brands at Food Lion (€8 million, December 30, 2018: €9 million), Hannaford (€8 million, December 30, 2018: €9 million), Greece (€3 million, December 30, 2018: €3 million) and Romania (€2 million, December 30, 2018: €2 million).
2 In 2019, Peapod’s goodwill was reallocated to the other U.S. brands due to new brand-centric omnichannel business model reflecting a different management and reallocation of revenue generating activities and assets used in undertaking those activities.
CGUs to which goodwill has been allocated are tested for impairment annually or more frequently if there are indications that a particular CGU might be impaired. Upon adoption of IFRS 16, the carrying values of the CGUs tested for impairment include their right-of-use assets but exclude the associated lease liabilities. Cash flow projections used in determining recoverable amounts exclude the lease payments but include replacement capex to maintain the ongoing level of operation in both the explicit forecast period and in terminal value. Except for Food Lion, Hannaford and Delhaize Le Lion (including Belgium and Luxembourg), the recoverable amounts for the CGUs have been determined based on value in use.
Value in useValue in use is determined using discounted cash flow projections that generally cover a period of five years and are based on the financial plans approved by the Company’s management. Due to the expected continuation of high growth in the relevant online retail market, we projected cash flows for bol.com over a 10-year period to better reflect the growth expectations in sales, profitability and cash generation as this business has not yet reached a steady state. The key assumptions for the value-in-use calculations relate to the weighted average cost of capital (hereafter: discount rate), sales growth, operating margin and growth rate (terminal value). The discount rates reflect the key assumptions used in the cash flow projections and the composition of the assets and liabilities included in the CGUs carrying value upon adoption of IFRS 16. The pre-tax discount rates ranged between 7.4% and 7.7% for the U.S. brands (excluding Food Lion and Hannaford), ranged between 5.5% and 5.6% for the brands in the Netherlands, and are 10.8% for bol.com, 6.1% for the Czech Republic, 10.2% for Greece, 9.6% for Romania and 9.6% for the Republic of Serbia. The sales growth rates and operating margins used to estimate future performance are based on past performance and our experience of growth rates and operating margins achievable in Ahold Delhaize’s main markets. The average annual compound sales growth rates applied in the projected periods ranged between 2.1% and 12.0% for the CGUs excluding bol.com. The average operating margins applied in the projected periods ranged between 3.0% and 5.8% for the CGUs excluding bol.com. For bol.com, the value in use has been estimated based on modest sales growth and modest positive operating margins in the second part of the projection period. The terminal value to extrapolate cash flows beyond the explicit forecast period included one year of additional growth based on the long-term inflation expectations that ranged between 1.5% and 2.8% for the CGUs; no additional growth was assumed thereafter.
Financial statements Other informationStrategic Report Governance Financial performance AppendixGovernance RemunerationOur business Performance review Ahold Delhaize Annual Report 2019 148
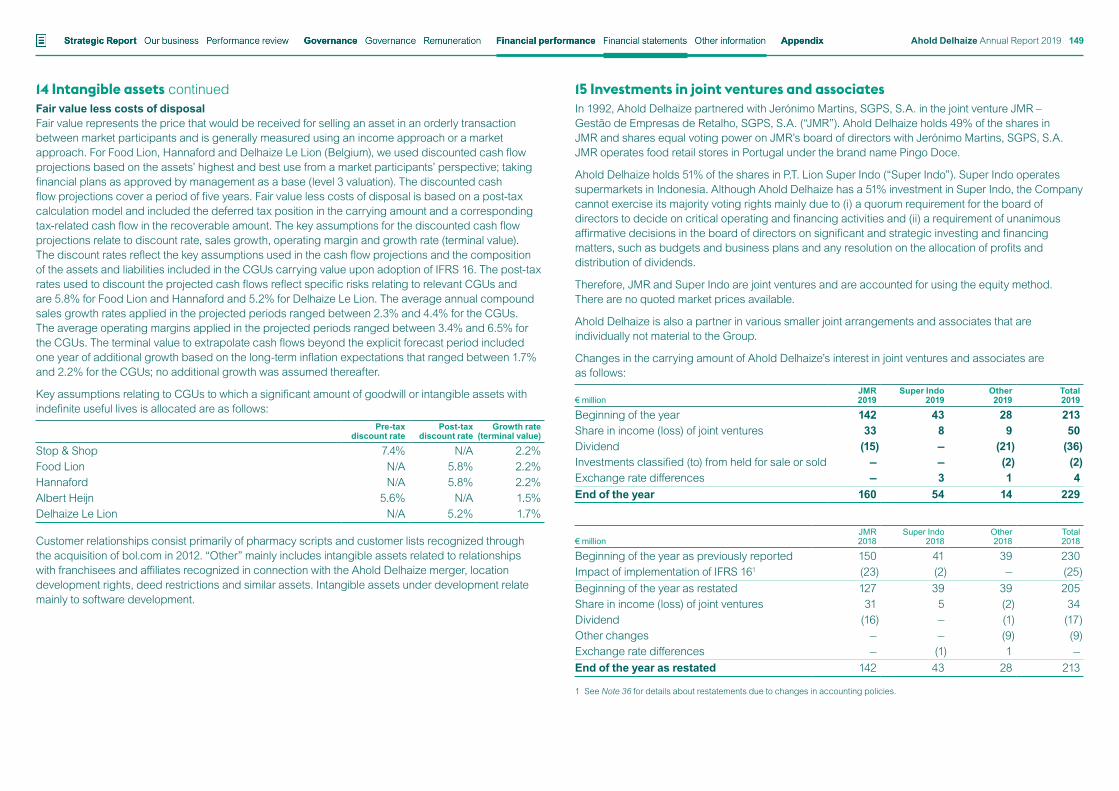
14 Intangible assets continuedFair value less costs of disposalFair value represents the price that would be received for selling an asset in an orderly transaction between market participants and is generally measured using an income approach or a market approach. For Food Lion, Hannaford and Delhaize Le Lion (Belgium), we used discounted cash flow projections based on the assets’ highest and best use from a market participants’ perspective; taking financial plans as approved by management as a base (level 3 valuation). The discounted cash flow projections cover a period of five years. Fair value less costs of disposal is based on a post-tax calculation model and included the deferred tax position in the carrying amount and a corresponding tax-related cash flow in the recoverable amount. The key assumptions for the discounted cash flow projections relate to discount rate, sales growth, operating margin and growth rate (terminal value). The discount rates reflect the key assumptions used in the cash flow projections and the composition of the assets and liabilities included in the CGUs carrying value upon adoption of IFRS 16. The post-tax rates used to discount the projected cash flows reflect specific risks relating to relevant CGUs and are 5.8% for Food Lion and Hannaford and 5.2% for Delhaize Le Lion. The average annual compound sales growth rates applied in the projected periods ranged between 2.3% and 4.4% for the CGUs. The average operating margins applied in the projected periods ranged between 3.4% and 6.5% for the CGUs. The terminal value to extrapolate cash flows beyond the explicit forecast period included one year of additional growth based on the long-term inflation expectations that ranged between 1.7% and 2.2% for the CGUs; no additional growth was assumed thereafter.
Key assumptions relating to CGUs to which a significant amount of goodwill or intangible assets with indefinite useful lives is allocated are as follows:
Pre-tax discount rate
Post-tax discount rate
Growth rate (terminal value)
Stop & Shop 7.4% N/A 2.2%Food Lion N/A 5.8% 2.2%Hannaford N/A 5.8% 2.2%Albert Heijn 5.6% N/A 1.5%Delhaize Le Lion N/A 5.2% 1.7%
Customer relationships consist primarily of pharmacy scripts and customer lists recognized through the acquisition of bol.com in 2012. “Other” mainly includes intangible assets related to relationships with franchisees and affiliates recognized in connection with the Ahold Delhaize merger, location development rights, deed restrictions and similar assets. Intangible assets under development relate mainly to software development.
15 Investments in joint ventures and associatesIn 1992, Ahold Delhaize partnered with Jerónimo Martins, SGPS, S.A. in the joint venture JMR – Gestão de Empresas de Retalho, SGPS, S.A. (“JMR”). Ahold Delhaize holds 49% of the shares in JMR and shares equal voting power on JMR’s board of directors with Jerónimo Martins, SGPS, S.A. JMR operates food retail stores in Portugal under the brand name Pingo Doce.
Ahold Delhaize holds 51% of the shares in P.T. Lion Super Indo (“Super Indo”). Super Indo operates supermarkets in Indonesia. Although Ahold Delhaize has a 51% investment in Super Indo, the Company cannot exercise its majority voting rights mainly due to (i) a quorum requirement for the board of directors to decide on critical operating and financing activities and (ii) a requirement of unanimous affirmative decisions in the board of directors on significant and strategic investing and financing matters, such as budgets and business plans and any resolution on the allocation of profits and distribution of dividends.
Therefore, JMR and Super Indo are joint ventures and are accounted for using the equity method. There are no quoted market prices available.
Ahold Delhaize is also a partner in various smaller joint arrangements and associates that are individually not material to the Group.
Changes in the carrying amount of Ahold Delhaize’s interest in joint ventures and associates are as follows:
€ millionJMR 2019
Super Indo2019
Other 2019
Total 2019
Beginning of the year 142 43 28 213Share in income (loss) of joint ventures 33 8 9 50Dividend (15) — (21) (36)Investments classified (to) from held for sale or sold — — (2) (2)Exchange rate differences — 3 1 4End of the year 160 54 14 229
€ millionJMR 2018
Super Indo 2018
Other 2018
Total 2018
Beginning of the year as previously reported 150 41 39 230Impact of implementation of IFRS 161 (23) (2) — (25)Beginning of the year as restated 127 39 39 205Share in income (loss) of joint ventures 31 5 (2) 34Dividend (16) — (1) (17)Other changes — — (9) (9)Exchange rate differences — (1) 1 —End of the year as restated 142 43 28 213
1 See Note 36 for details about restatements due to changes in accounting policies.
Financial statements Other informationStrategic Report Governance Financial performance AppendixGovernance RemunerationOur business Performance review Ahold Delhaize Annual Report 2019 149
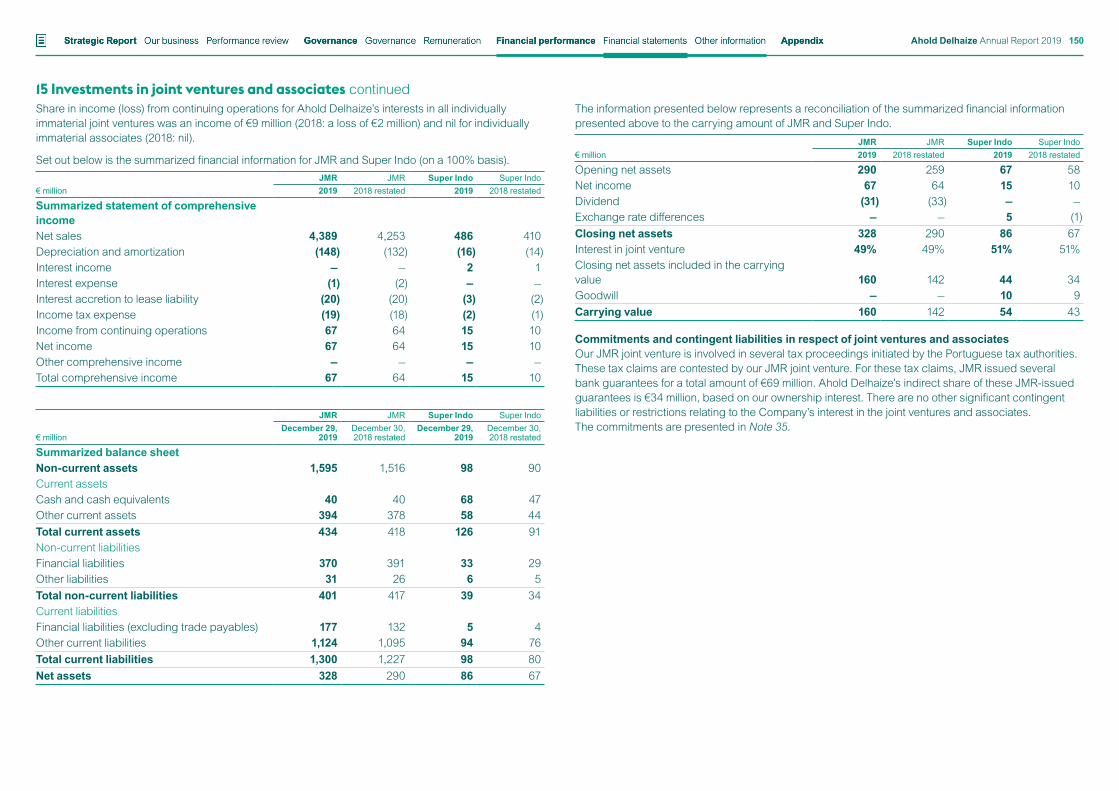
15 Investments in joint ventures and associates continuedShare in income (loss) from continuing operations for Ahold Delhaize’s interests in all individually immaterial joint ventures was an income of €9 million (2018: a loss of €2 million) and nil for individually immaterial associates (2018: nil).
Set out below is the summarized financial information for JMR and Super Indo (on a 100% basis).
€ millionJMR JMR Super Indo Super Indo2019 2018 restated 2019 2018 restated
Summarized statement of comprehensive incomeNet sales 4,389 4,253 486 410Depreciation and amortization (148) (132) (16) (14)Interest income — — 2 1Interest expense (1) (2) — —Interest accretion to lease liability (20) (20) (3) (2)Income tax expense (19) (18) (2) (1)Income from continuing operations 67 64 15 10Net income 67 64 15 10Other comprehensive income — — — —Total comprehensive income 67 64 15 10
€ million
JMR JMR Super Indo Super IndoDecember 29,
2019December 30, 2018 restated
December 29, 2019
December 30, 2018 restated
Summarized balance sheetNon-current assets 1,595 1,516 98 90Current assetsCash and cash equivalents 40 40 68 47Other current assets 394 378 58 44Total current assets 434 418 126 91Non-current liabilitiesFinancial liabilities 370 391 33 29Other liabilities 31 26 6 5Total non-current liabilities 401 417 39 34Current liabilitiesFinancial liabilities (excluding trade payables) 177 132 5 4Other current liabilities 1,124 1,095 94 76Total current liabilities 1,300 1,227 98 80Net assets 328 290 86 67
The information presented below represents a reconciliation of the summarized financial information presented above to the carrying amount of JMR and Super Indo.
€ millionJMR JMR Super Indo Super Indo2019 2018 restated 2019 2018 restated
Opening net assets 290 259 67 58Net income 67 64 15 10Dividend (31) (33) — —Exchange rate differences — — 5 (1)Closing net assets 328 290 86 67Interest in joint venture 49% 49% 51% 51%Closing net assets included in the carrying value 160 142 44 34Goodwill — — 10 9Carrying value 160 142 54 43
Commitments and contingent liabilities in respect of joint ventures and associatesOur JMR joint venture is involved in several tax proceedings initiated by the Portuguese tax authorities. These tax claims are contested by our JMR joint venture. For these tax claims, JMR issued several bank guarantees for a total amount of €69 million. Ahold Delhaize’s indirect share of these JMR-issued guarantees is €34 million, based on our ownership interest. There are no other significant contingent liabilities or restrictions relating to the Company’s interest in the joint ventures and associates. The commitments are presented in Note 35.
Financial statements Other informationStrategic Report Governance Financial performance AppendixGovernance RemunerationOur business Performance review Ahold Delhaize Annual Report 2019 150
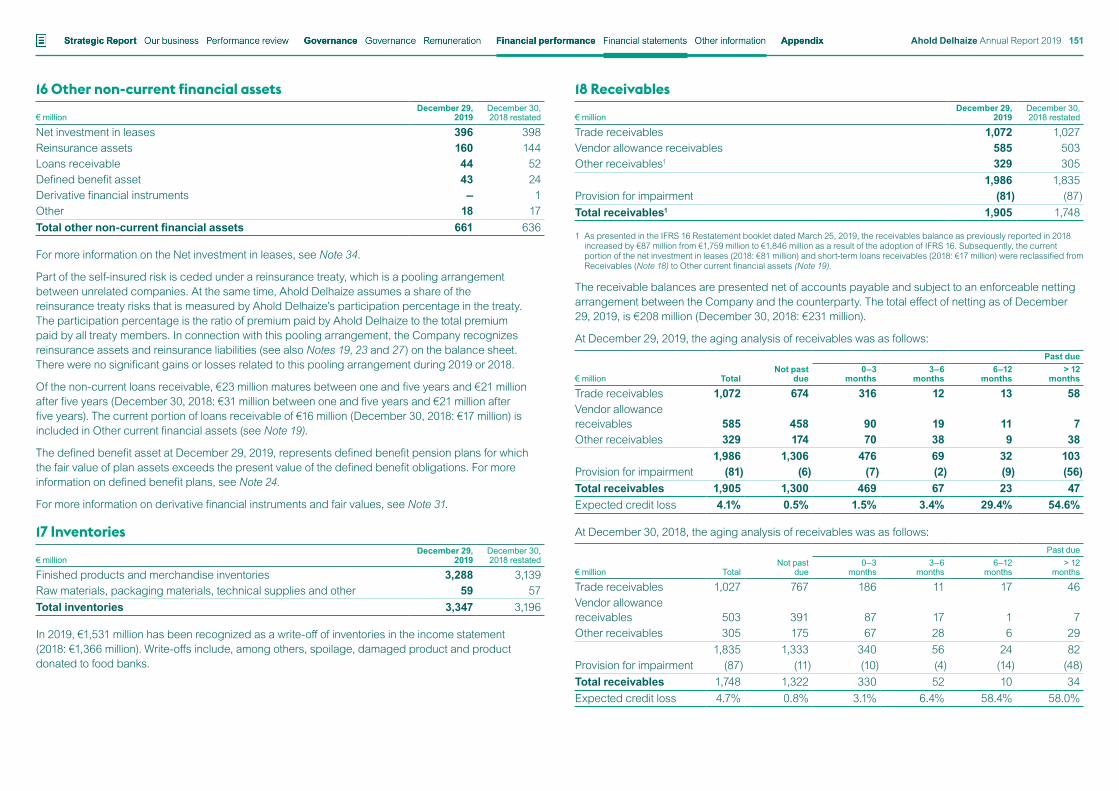
16 Other non-current financial assets
€ millionDecember 29,
2019December 30, 2018 restated
Net investment in leases 396 398Reinsurance assets 160 144Loans receivable 44 52Defined benefit asset 43 24Derivative financial instruments — 1Other 18 17Total other non-current financial assets 661 636
For more information on the Net investment in leases, see Note 34.
Part of the self-insured risk is ceded under a reinsurance treaty, which is a pooling arrangement between unrelated companies. At the same time, Ahold Delhaize assumes a share of the reinsurance treaty risks that is measured by Ahold Delhaize’s participation percentage in the treaty. The participation percentage is the ratio of premium paid by Ahold Delhaize to the total premium paid by all treaty members. In connection with this pooling arrangement, the Company recognizes reinsurance assets and reinsurance liabilities (see also Notes 19, 23 and 27) on the balance sheet. There were no significant gains or losses related to this pooling arrangement during 2019 or 2018.
Of the non-current loans receivable, €23 million matures between one and five years and €21 million after five years (December 30, 2018: €31 million between one and five years and €21 million after five years). The current portion of loans receivable of €16 million (December 30, 2018: €17 million) is included in Other current financial assets (see Note 19).
The defined benefit asset at December 29, 2019, represents defined benefit pension plans for which the fair value of plan assets exceeds the present value of the defined benefit obligations. For more information on defined benefit plans, see Note 24.
For more information on derivative financial instruments and fair values, see Note 31.
17 Inventories
€ millionDecember 29,
2019December 30, 2018 restated
Finished products and merchandise inventories 3,288 3,139Raw materials, packaging materials, technical supplies and other 59 57Total inventories 3,347 3,196
In 2019, €1,531 million has been recognized as a write-off of inventories in the income statement (2018: €1,366 million). Write-offs include, among others, spoilage, damaged product and product donated to food banks.
18 Receivables
€ millionDecember 29,
2019December 30, 2018 restated
Trade receivables 1,072 1,027Vendor allowance receivables 585 503Other receivables1 329 305
1,986 1,835Provision for impairment (81) (87)Total receivables1 1,905 1,748
1 As presented in the IFRS 16 Restatement booklet dated March 25, 2019, the receivables balance as previously reported in 2018 increased by €87 million from €1,759 million to €1,846 million as a result of the adoption of IFRS 16. Subsequently, the current portion of the net investment in leases (2018: €81 million) and short-term loans receivables (2018: €17 million) were reclassified from Receivables (Note 18) to Other current financial assets (Note 19).
The receivable balances are presented net of accounts payable and subject to an enforceable netting arrangement between the Company and the counterparty. The total effect of netting as of December 29, 2019, is €208 million (December 30, 2018: €231 million).
At December 29, 2019, the aging analysis of receivables was as follows:
€ million TotalNot past
due
Past due0–3
months3–6
months6–12
months> 12
months
Trade receivables 1,072 674 316 12 13 58Vendor allowance receivables 585 458 90 19 11 7Other receivables 329 174 70 38 9 38
1,986 1,306 476 69 32 103Provision for impairment (81) (6) (7) (2) (9) (56)Total receivables 1,905 1,300 469 67 23 47Expected credit loss 4.1% 0.5% 1.5% 3.4% 29.4% 54.6%
At December 30, 2018, the aging analysis of receivables was as follows:
€ million TotalNot past
due
Past due0–3
months3–6
months6–12
months> 12
months
Trade receivables 1,027 767 186 11 17 46Vendor allowance receivables 503 391 87 17 1 7Other receivables 305 175 67 28 6 29
1,835 1,333 340 56 24 82Provision for impairment (87) (11) (10) (4) (14) (48)Total receivables 1,748 1,322 330 52 10 34Expected credit loss 4.7% 0.8% 3.1% 6.4% 58.4% 58.0%
Financial statements Other informationStrategic Report Governance Financial performance AppendixGovernance RemunerationOur business Performance review Ahold Delhaize Annual Report 2019 151
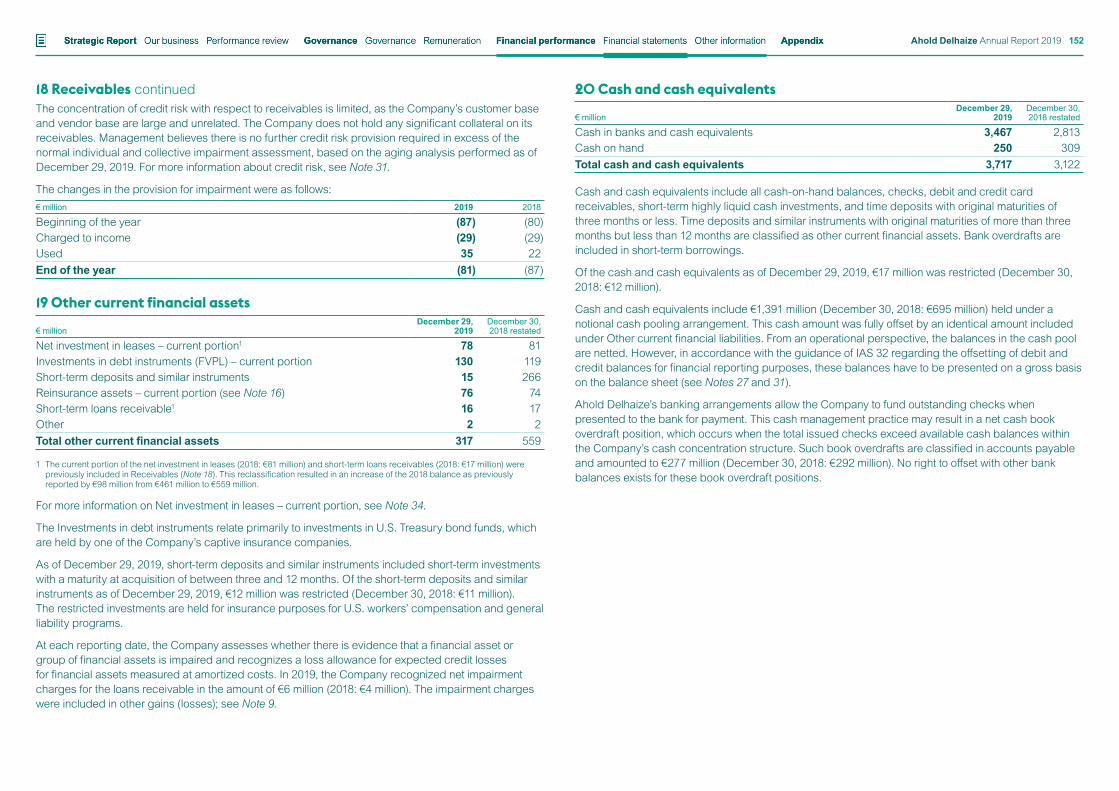
18 Receivables continuedThe concentration of credit risk with respect to receivables is limited, as the Company’s customer base and vendor base are large and unrelated. The Company does not hold any significant collateral on its receivables. Management believes there is no further credit risk provision required in excess of the normal individual and collective impairment assessment, based on the aging analysis performed as of December 29, 2019. For more information about credit risk, see Note 31.
The changes in the provision for impairment were as follows:€ million 2019 2018
Beginning of the year (87) (80)Charged to income (29) (29)Used 35 22End of the year (81) (87)
19 Other current financial assets
€ millionDecember 29,
2019December 30, 2018 restated
Net investment in leases – current portion1 78 81Investments in debt instruments (FVPL) – current portion 130 119Short-term deposits and similar instruments 15 266Reinsurance assets – current portion (see Note 16) 76 74Short-term loans receivable1 16 17Other 2 2Total other current financial assets 317 559
1 The current portion of the net investment in leases (2018: €81 million) and short-term loans receivables (2018: €17 million) were previously included in Receivables (Note 18). This reclassification resulted in an increase of the 2018 balance as previously reported by €98 million from €461 million to €559 million.
For more information on Net investment in leases – current portion, see Note 34.
The Investments in debt instruments relate primarily to investments in U.S. Treasury bond funds, which are held by one of the Company’s captive insurance companies.
As of December 29, 2019, short-term deposits and similar instruments included short-term investments with a maturity at acquisition of between three and 12 months. Of the short-term deposits and similar instruments as of December 29, 2019, €12 million was restricted (December 30, 2018: €11 million). The restricted investments are held for insurance purposes for U.S. workers’ compensation and general liability programs.
At each reporting date, the Company assesses whether there is evidence that a financial asset or group of financial assets is impaired and recognizes a loss allowance for expected credit losses for financial assets measured at amortized costs. In 2019, the Company recognized net impairment charges for the loans receivable in the amount of €6 million (2018: €4 million). The impairment charges were included in other gains (losses); see Note 9.
20 Cash and cash equivalents
€ millionDecember 29,
2019December 30, 2018 restated
Cash in banks and cash equivalents 3,467 2,813Cash on hand 250 309Total cash and cash equivalents 3,717 3,122
Cash and cash equivalents include all cash-on-hand balances, checks, debit and credit card receivables, short-term highly liquid cash investments, and time deposits with original maturities of three months or less. Time deposits and similar instruments with original maturities of more than three months but less than 12 months are classified as other current financial assets. Bank overdrafts are included in short-term borrowings.
Of the cash and cash equivalents as of December 29, 2019, €17 million was restricted (December 30, 2018: €12 million).
Cash and cash equivalents include €1,391 million (December 30, 2018: €695 million) held under a notional cash pooling arrangement. This cash amount was fully offset by an identical amount included under Other current financial liabilities. From an operational perspective, the balances in the cash pool are netted. However, in accordance with the guidance of IAS 32 regarding the offsetting of debit and credit balances for financial reporting purposes, these balances have to be presented on a gross basis on the balance sheet (see Notes 27 and 31).
Ahold Delhaize’s banking arrangements allow the Company to fund outstanding checks when presented to the bank for payment. This cash management practice may result in a net cash book overdraft position, which occurs when the total issued checks exceed available cash balances within the Company’s cash concentration structure. Such book overdrafts are classified in accounts payable and amounted to €277 million (December 30, 2018: €292 million). No right to offset with other bank balances exists for these book overdraft positions.
Financial statements Other informationStrategic Report Governance Financial performance AppendixGovernance RemunerationOur business Performance review Ahold Delhaize Annual Report 2019 152
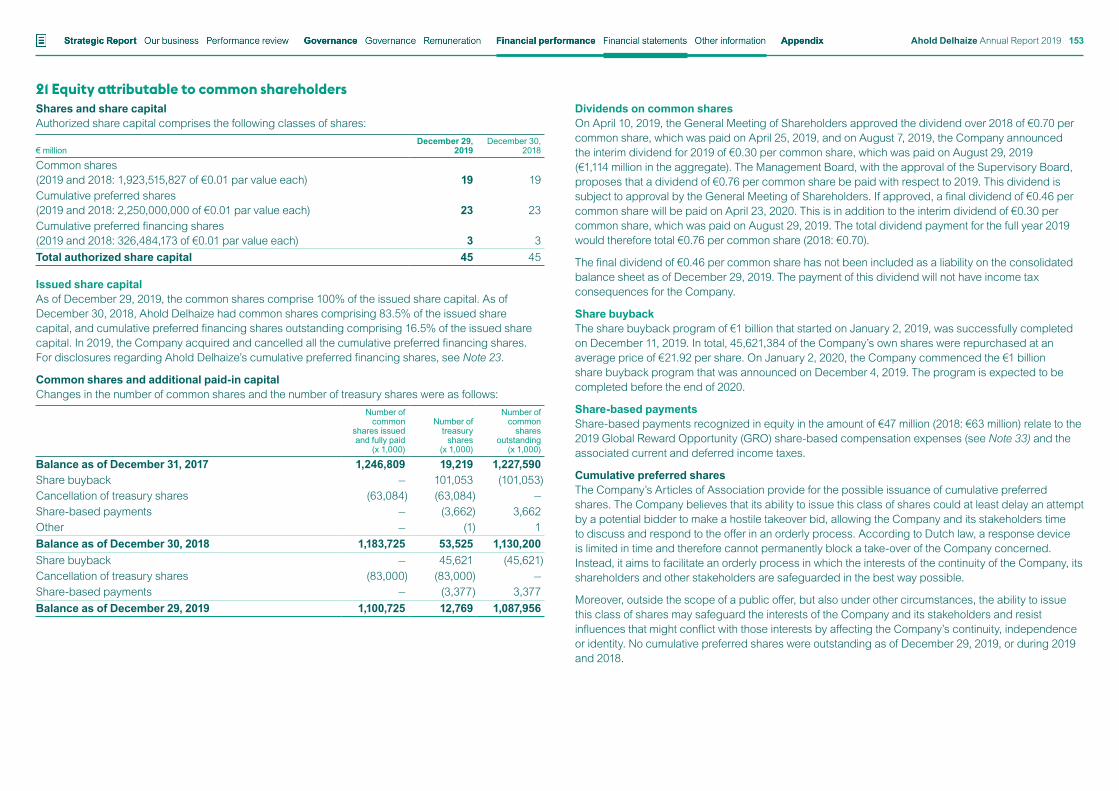
21 Equity attributable to common shareholdersShares and share capitalAuthorized share capital comprises the following classes of shares:
€ millionDecember 29,
2019December 30,
2018
Common shares (2019 and 2018: 1,923,515,827 of €0.01 par value each) 19 19Cumulative preferred shares (2019 and 2018: 2,250,000,000 of €0.01 par value each) 23 23Cumulative preferred financing shares (2019 and 2018: 326,484,173 of €0.01 par value each) 3 3Total authorized share capital 45 45
Issued share capitalAs of December 29, 2019, the common shares comprise 100% of the issued share capital. As of December 30, 2018, Ahold Delhaize had common shares comprising 83.5% of the issued share capital, and cumulative preferred financing shares outstanding comprising 16.5% of the issued share capital. In 2019, the Company acquired and cancelled all the cumulative preferred financing shares. For disclosures regarding Ahold Delhaize’s cumulative preferred financing shares, see Note 23.
Common shares and additional paid-in capitalChanges in the number of common shares and the number of treasury shares were as follows:
Number of common
shares issued and fully paid
(x 1,000)
Number of treasury
shares (x 1,000)
Number of common
shares outstanding
(x 1,000)
Balance as of December 31, 2017 1,246,809 19,219 1,227,590Share buyback — 101,053 (101,053)Cancellation of treasury shares (63,084) (63,084) —Share-based payments — (3,662) 3,662Other — (1) 1Balance as of December 30, 2018 1,183,725 53,525 1,130,200Share buyback — 45,621 (45,621)Cancellation of treasury shares (83,000) (83,000) —Share-based payments — (3,377) 3,377Balance as of December 29, 2019 1,100,725 12,769 1,087,956
Dividends on common sharesOn April 10, 2019, the General Meeting of Shareholders approved the dividend over 2018 of €0.70 per common share, which was paid on April 25, 2019, and on August 7, 2019, the Company announced the interim dividend for 2019 of €0.30 per common share, which was paid on August 29, 2019 (€1,114 million in the aggregate). The Management Board, with the approval of the Supervisory Board, proposes that a dividend of €0.76 per common share be paid with respect to 2019. This dividend is subject to approval by the General Meeting of Shareholders. If approved, a final dividend of €0.46 per common share will be paid on April 23, 2020. This is in addition to the interim dividend of €0.30 per common share, which was paid on August 29, 2019. The total dividend payment for the full year 2019 would therefore total €0.76 per common share (2018: €0.70).
The final dividend of €0.46 per common share has not been included as a liability on the consolidated balance sheet as of December 29, 2019. The payment of this dividend will not have income tax consequences for the Company.
Share buybackThe share buyback program of €1 billion that started on January 2, 2019, was successfully completed on December 11, 2019. In total, 45,621,384 of the Company’s own shares were repurchased at an average price of €21.92 per share. On January 2, 2020, the Company commenced the €1 billion share buyback program that was announced on December 4, 2019. The program is expected to be completed before the end of 2020.
Share-based paymentsShare-based payments recognized in equity in the amount of €47 million (2018: €63 million) relate to the 2019 Global Reward Opportunity (GRO) share-based compensation expenses (see Note 33) and the associated current and deferred income taxes.
Cumulative preferred shares The Company’s Articles of Association provide for the possible issuance of cumulative preferred shares. The Company believes that its ability to issue this class of shares could at least delay an attempt by a potential bidder to make a hostile takeover bid, allowing the Company and its stakeholders time to discuss and respond to the offer in an orderly process. According to Dutch law, a response device is limited in time and therefore cannot permanently block a take-over of the Company concerned. Instead, it aims to facilitate an orderly process in which the interests of the continuity of the Company, its shareholders and other stakeholders are safeguarded in the best way possible.
Moreover, outside the scope of a public offer, but also under other circumstances, the ability to issue this class of shares may safeguard the interests of the Company and its stakeholders and resist influences that might conflict with those interests by affecting the Company’s continuity, independence or identity. No cumulative preferred shares were outstanding as of December 29, 2019, or during 2019 and 2018.
Financial statements Other informationStrategic Report Governance Financial performance AppendixGovernance RemunerationOur business Performance review Ahold Delhaize Annual Report 2019 153
21 Equity attributable to common shareholders continuedIn March 1989, the Company entered into an agreement with the Dutch foundation Stichting Continuïteit Ahold Delhaize (SCAD, previously named Stichting Ahold Continuïteit), as amended and restated in April 1994, March 1997, December 2001, December 2003 and May 2018 (the “Option Agreement”). Pursuant to the Option Agreement, SCAD has been granted an option to acquire cumulative preferred shares from the Company from time to time for no consideration.
The Option Agreement entitles SCAD, under certain circumstances, to acquire cumulative preferred shares from the Company up to a total par value that is equal to the total par value of all issued and outstanding shares of Ahold Delhaize’s share capital, excluding cumulative preferred shares, at the time of exercising the option. If the authorized share capital of the Company is amended during the term of the option, the Option Agreement provides for a corresponding change of the total par value of cumulative preferred shares under option.
The holders of the cumulative preferred shares are entitled to one vote per share and a cumulative dividend expressed as a percentage of the amount called-up and paid-in to purchase the cumulative preferred shares. The percentage to be applied is the sum of (1) the average basic refinancing transaction interest rate as set by the European Central Bank – measured by the number of days during which that rate was in force in the fiscal year over which the dividend is paid – plus 2.1%, and (2) the average interest surcharge rate – measured by the number of days during which that rate was in force in the fiscal year over which the dividend is paid – that would be charged by the largest credit institution in the Netherlands (based on the balance sheet total as of the close of the fiscal year immediately preceding the fiscal year over which the dividend is paid). The minimum percentage to be applied is 5.75%. Subject to limited exceptions, any potential transfer of cumulative preferred shares requires the approval of the Management Board. Cumulative preferred shares can only be issued in a registered form. The Company may stipulate that only 25% of the par value will be paid upon subscription to cumulative preferred shares until payment in full is later required by the Company. SCAD would then only be entitled to a market-based interest return on its investment.
SCAD is a foundation organized under the laws of the Netherlands. Its purpose under its articles is to safeguard the interests of the Company and its stakeholders and to resist, to the best of its ability, influences that might conflict with those interests by affecting the Company’s continuity, independence or identity. SCAD seeks to realize its objectives by acquiring and holding cumulative preferred shares and by exercising the rights attached to these shares, including the voting rights. The SCAD board has four members, who are appointed by the board of SCAD itself.
If the board of SCAD considers acquiring cumulative preferred shares or exercising voting rights on cumulative preferred shares, it will make an independent assessment and, pursuant to Dutch law, it must ensure that its actions are proportional and reasonable. If SCAD acquires cumulative preferred shares, it will only hold them for a limited period of time. These principles are in line with Dutch law, which only allows response measures that are proportionate, reasonable and limited in time. In the case of liquidation, the SCAD board will decide on the use of any remaining residual assets.
Legal reservesIn accordance with the Dutch Civil Code and statutory requirements in other countries, legal reserves have to be established in certain circumstances. Legal reserves are not available for distribution to the Company’s shareholders. The currency translation reserve, cash flow hedging reserve and other reserves include non-distributable amounts. Of the total equity as per December 29, 2019, of €14,083 million, an amount of €590 million is non-distributable (December 30, 2018, restated: €397 million out of total equity of €14,205 million). See Note 10 to the parent company financial statements for more details on the legal reserves.
Financial statements Other informationStrategic Report Governance Financial performance AppendixGovernance RemunerationOur business Performance review Ahold Delhaize Annual Report 2019 154
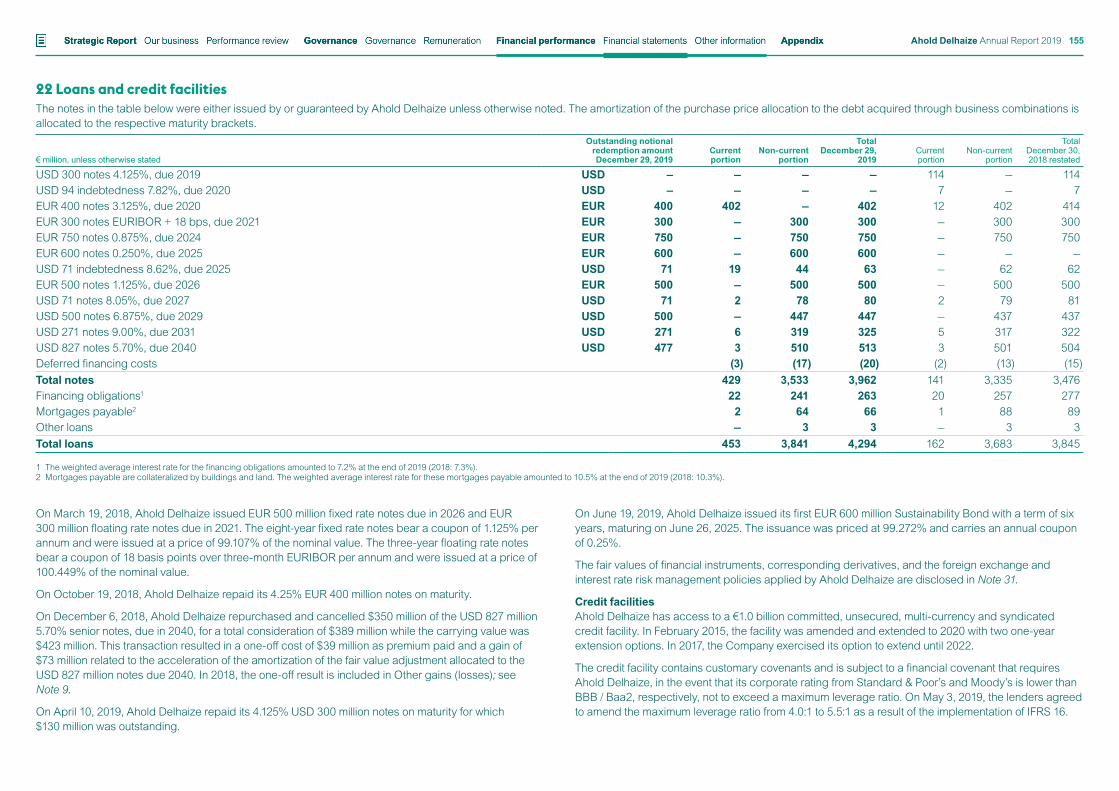
22 Loans and credit facilitiesThe notes in the table below were either issued by or guaranteed by Ahold Delhaize unless otherwise noted. The amortization of the purchase price allocation to the debt acquired through business combinations is allocated to the respective maturity brackets.
€ million, unless otherwise stated
Outstanding notional redemption amount December 29, 2019
Current portion
Non-current portion
Total December 29,
2019Current portion
Non-current portion
Total December 30, 2018 restated
USD 300 notes 4.125%, due 2019 USD – — — — 114 — 114USD 94 indebtedness 7.82%, due 2020 USD – — — — 7 — 7EUR 400 notes 3.125%, due 2020 EUR 400 402 — 402 12 402 414EUR 300 notes EURIBOR + 18 bps, due 2021 EUR 300 — 300 300 — 300 300EUR 750 notes 0.875%, due 2024 EUR 750 — 750 750 — 750 750EUR 600 notes 0.250%, due 2025 EUR 600 — 600 600 — — —USD 71 indebtedness 8.62%, due 2025 USD 71 19 44 63 — 62 62EUR 500 notes 1.125%, due 2026 EUR 500 — 500 500 — 500 500USD 71 notes 8.05%, due 2027 USD 71 2 78 80 2 79 81USD 500 notes 6.875%, due 2029 USD 500 — 447 447 — 437 437USD 271 notes 9.00%, due 2031 USD 271 6 319 325 5 317 322USD 827 notes 5.70%, due 2040 USD 477 3 510 513 3 501 504Deferred financing costs (3) (17) (20) (2) (13) (15)Total notes 429 3,533 3,962 141 3,335 3,476Financing obligations1 22 241 263 20 257 277Mortgages payable2 2 64 66 1 88 89Other loans — 3 3 — 3 3Total loans 453 3,841 4,294 162 3,683 3,845
1 The weighted average interest rate for the financing obligations amounted to 7.2% at the end of 2019 (2018: 7.3%).2 Mortgages payable are collateralized by buildings and land. The weighted average interest rate for these mortgages payable amounted to 10.5% at the end of 2019 (2018: 10.3%).
On March 19, 2018, Ahold Delhaize issued EUR 500 million fixed rate notes due in 2026 and EUR 300 million floating rate notes due in 2021. The eight-year fixed rate notes bear a coupon of 1.125% per annum and were issued at a price of 99.107% of the nominal value. The three-year floating rate notes bear a coupon of 18 basis points over three-month EURIBOR per annum and were issued at a price of 100.449% of the nominal value.
On October 19, 2018, Ahold Delhaize repaid its 4.25% EUR 400 million notes on maturity.
On December 6, 2018, Ahold Delhaize repurchased and cancelled $350 million of the USD 827 million 5.70% senior notes, due in 2040, for a total consideration of $389 million while the carrying value was $423 million. This transaction resulted in a one-off cost of $39 million as premium paid and a gain of $73 million related to the acceleration of the amortization of the fair value adjustment allocated to the USD 827 million notes due 2040. In 2018, the one-off result is included in Other gains (losses); see Note 9.
On April 10, 2019, Ahold Delhaize repaid its 4.125% USD 300 million notes on maturity for which $130 million was outstanding.
On June 19, 2019, Ahold Delhaize issued its first EUR 600 million Sustainability Bond with a term of six years, maturing on June 26, 2025. The issuance was priced at 99.272% and carries an annual coupon of 0.25%.
The fair values of financial instruments, corresponding derivatives, and the foreign exchange and interest rate risk management policies applied by Ahold Delhaize are disclosed in Note 31.
Credit facilitiesAhold Delhaize has access to a €1.0 billion committed, unsecured, multi-currency and syndicated credit facility. In February 2015, the facility was amended and extended to 2020 with two one-year extension options. In 2017, the Company exercised its option to extend until 2022.
The credit facility contains customary covenants and is subject to a financial covenant that requires Ahold Delhaize, in the event that its corporate rating from Standard & Poor’s and Moody’s is lower than BBB / Baa2, respectively, not to exceed a maximum leverage ratio. On May 3, 2019, the lenders agreed to amend the maximum leverage ratio from 4.0:1 to 5.5:1 as a result of the implementation of IFRS 16.
Financial statements Other informationStrategic Report Governance Financial performance AppendixGovernance RemunerationOur business Performance review Ahold Delhaize Annual Report 2019 155
22 Loans and credit facilities continuedDuring 2019 and 2018, the Company was in compliance with these covenants. However, it was not required to test the financial covenant as a result of its credit rating. As of December 29, 2019, there were no outstanding borrowings under the facility other than letters of credit to an aggregate amount of $165 million (€148 million).
Ahold Delhaize also has access to a total of €399 million uncommitted credit facilities to cover working capital requirements, issuance of guarantees and letters of credit, of which €60 million was utilized as of December 29, 2019.
23 Other non-current financial liabilities
€ millionDecember 29,
2019December 30, 2018 restated
Lease liabilities 8,484 8,270Cumulative preferred financing shares — 455Reinsurance liabilities 162 149Other 69 72Total other non-current financial liabilities 8,716 8,946
For more information on lease liabilities see Note 34.
On April 10, 2019, the General Meeting of Shareholders authorized the Management Board to acquire all cumulative preferred financing shares in the Company. On May 10, 2019, Ahold Delhaize acquired all 223,415,103 cumulative preferred financing shares at a redemption value of €477 million. Net financial expenses include transaction results from the cumulative preferred shares redemption, resulting in a one-off cost of €22 million (see Note 9). The cumulative preferred financing shares were cancelled on July 16, 2019.
The Company recognizes reinsurance liabilities on its balance sheet in connection with a pooling arrangement between unrelated companies (see Note 16).
As of December 29, 2019, “Other” mainly consists of a pre-tax liability for the discounted amount of the remaining settlement liability of $40 million (€36 million), relating to a 2013 agreement with the New England Teamsters and Trucking Industry Pension Fund (NETTI) to settle Stop & Shop’s pension liabilities in the fund, and a $13 million (€12 million) financial liability for rent payments for nine Tops stores that the Company agreed to make for a period of 72 months (see Note 35).
24 Pensions and other post-employment benefitsDefined benefit plansAhold Delhaize has a number of defined benefit pension plans covering a substantial number of employees, former employees and retirees in the Netherlands, the United States, Belgium, Greece and Serbia.
Net assets relating to one plan are not offset against liabilities of another plan, resulting in the following presentation of the pension and other post-employment benefits on the consolidated balance sheet:
€ millionDecember 29,
2019December 30, 2018 restated
Defined benefit liabilities 677 532Defined benefit assets (43) (24)Total net defined benefit plan funded status 633 508
The defined benefit assets are part of the other non-current financial assets; for more information, see Note 16.
In the Netherlands, the Company has a career average plan covering all employees, except for bol.com employees, over the age of 21. The plan provides benefits to participants or beneficiaries upon retirement, death or disability. The plan’s assets, which are made up of contributions from Ahold Delhaize and employees, are managed by Stichting Ahold Delhaize Pensioen (“Ahold Delhaize Pensioen”), an independent foundation. The contributions are established in a funding agreement between Ahold Delhaize, employee representatives and Ahold Delhaize Pensioen and are generally set every five years, or at the moment of a plan change. The contributions are determined as a percentage of an employee’s pension base.
In the United States, the Company maintains a funded plan covering a limited population of employees. This plan is closed to new participants. The plan provides a life annuity benefit based upon final pay to participants or beneficiaries upon retirement, death or disability. The assets of the plan, which are made up of contributions from Ahold Delhaize, are maintained with various trustees. Contributions to the plan are required under the current funding policy if the prior year-end funding ratio falls below 100% as measured using regulatory interest rates without funding relief in order to avoid variable Pension Benefit Guaranty Corporation (PBGC) premiums. In addition, the Company provides additional pension benefits for certain Company executives and life insurance and medical care benefits for certain retired employees meeting age and service requirements at its U.S. subsidiaries, all of which the Company funds as claims are incurred.
Financial statements Other informationStrategic Report Governance Financial performance AppendixGovernance RemunerationOur business Performance review Ahold Delhaize Annual Report 2019 156
24 Pensions and other post-employment benefits continuedIn Belgium, the Company sponsors plans for substantially all of its employees. The plans are funded by fixed monthly contributions from both the Company and employees, which are adjusted annually according to the Belgian consumer price index. Certain employees who were employed before 2005 could choose not to participate in the employee contribution part of the plans. The plans assure employees receive a lump-sum payment at retirement based on the contributions made, and provide employees with death-in-service benefits. Belgian law prescribes a variable minimum guaranteed rate of return with Belgian 10-year government bonds as the underlying benchmark, and a collar of 1.75% and 3.75%. The Company substantially insures these returns with external insurance companies that receive and manage the contributions to the plans. According to the relevant legislation, a short-fall only needs to be compensated by the employer at the point in time when the employee either retires or leaves the Company. As these plans have defined benefit features (when the return provided by the insurance company can be below the legally required minimum return, in which case the employer has to cover the gap with additional contributions), the Company treats these plans as defined benefit plans. In order to avoid the gap, or reduce it to a minimum, the Company has opened a new cash balance plan, under branch 23 rules in Belgium, as of July 1, 2017. All new employees who begin service after this date will be included in this new plan. The level of contributions remains unchanged, but the new plan is expected to experience higher returns in the long term than those generated under the branch 21 rules followed by the older plans.
Additionally in Belgium, the Company maintains a plan covering Company executives that provides lump-sum benefits to participants upon death or retirement based on a formula applied to the last annual salary of the participant before his or her retirement or death. The plan is subject to the legal requirement to guarantee a minimum return on contributions. The plan’s assets, which are made up of contributions, are managed through a fund that is administered by an independent insurance company, providing a minimum guaranteed return. The plan participant’s contributions are defined in the terms of the plan, while the annual contributions to be paid by the Company are determined based on the funding level of the plan and are calculated based on current salaries, taking into account the legal minimum funding requirement, which is based on the vested reserves to which employees are entitled upon retirement or death. The plan mainly invests in debt securities in order to achieve the required minimum return. The Company bears any risk above the minimum guarantee given by the insurance company. There are no asset ceiling restrictions. In order to avoid returns being less than the minimum guaranteed return, or reduce the risk to a minimum, the level of contributions at July 1, 2017, has been capped and applied under the classic branch 21 rules. Any increases in contributions after July 1, 2017, will be managed in accordance with branch 23 rules, which are expected to experience higher returns in the long term.
In Greece, the Company operates an unfunded defined benefit post-employment plan. This plan relates to retirement benefits prescribed by Greek law, consisting of lump-sum compensation payable in case of normal retirement or termination of employment. The amount of the indemnity is based on an employee’s monthly earnings and a multiple depending on the length of service and the status of the employee. There is no legal requirement to fund these plans with contributions or other plan assets. Employees participate in the plan once they have completed a minimum service period, which is generally one year.
In Serbia, the Company has an unfunded defined benefit plan that provides a lump-sum benefit upon the employee’s retirement, as prescribed by Serbian law. The benefit is based on a fixed multiple of the higher of the (i) average gross salary of the employee, (ii) average gross salary in the Company or (iii) average gross salary in the country, each determined at the time the employee retires. There is no legal requirement to fund these plans with contributions or other plan assets.
The pension plans expose the Company to actuarial risks such as: longevity risk, interest rate risk, currency risk, salary risk and investment risk. Longevity risk relates to the mortality assumptions used to value the defined benefit obligation, where an increase in participants’ life expectancies will increase a plan’s liability. Interest rate risk relates to the discount rate used to value the defined benefit obligation, where a decrease in the discount rate will increase a plan’s liability; however, this will be partially offset by an increase in the return on a plan’s investments in debt instruments. The pension plans may mitigate interest rate risk by entering into interest rate swap contracts. Currency risk relates to the fact that a plan holds investments that may not be denominated in the same currency as the plan’s obligations. The pension plans may mitigate currency risk by purchasing forward currency instruments. Salary risk relates to salary increase assumptions used to value the defined benefit obligation, where an increase will result in a higher plan liability. See section Plan assets for more details on the Company’s asset-liability matching strategy employed to manage its investment risk.
Net defined benefit cost is comprised of several components. The net interest (income) expense is presented within net financial expenses in the income statement and plan remeasurements are presented as other comprehensive income. All other components of net defined benefit cost are presented in the income statement as cost of sales, selling expenses, and general and administrative expenses, depending on the functional areas of the employees earning the benefits. € million 2019 2018 restated
Service costCurrent service cost 152 162Gain on settlement (3) —
Net interest expense 18 19Administrative cost 11 12Termination benefits 1 2Components of defined benefit cost recorded in the income statement 179 195
Remeasurements recognized:Return on plan assets, excluding amounts included in net interest (income) expense (1,162) 237(Gain) loss from changes in demographic assumptions 10 (79)(Gain) loss from changes in financial assumptions 1,251 (190)Experience (gains) losses (23) (34)
Components of defined benefit cost recognized in other comprehensive income 76 (66)Total net defined benefit cost 256 129
Financial statements Other informationStrategic Report Governance Financial performance AppendixGovernance RemunerationOur business Performance review Ahold Delhaize Annual Report 2019 157
24 Pensions and other post-employment benefits continuedThe changes in the defined benefit obligations and plan assets in 2019 and 2018 were as follows:
€ million
The Netherlands The United States Rest of world Total
2019 2018 restated 2019 2018 restated 2019 2018 restated 2019 2018 restated
Defined benefit obligationsBeginning of the year 4,777 4,822 1,333 1,359 281 278 6,391 6,459Current service cost 118 125 19 22 14 15 152 162Past service cost — — — — — — — —Gain on settlements — — (16) — — — (16) —Interest expense 94 98 60 51 5 5 158 154Termination benefits — — — — 1 2 1 2Contributions by plan participants 23 21 — — 1 1 24 22Benefits paid (95) (90) (72) (63) (8) (16) (176) (169)(Gain) loss from changes in demographic assumptions (9) (73) 18 (5) — (1) 10 (79)(Gain) loss from changes in financial assumptions 1,035 (80) 164 (104) 52 (6) 1,251 (190)Experience (gains) losses (32) (46) 4 9 5 3 (23) (34)Exchange rate differences — — 37 64 — — 37 64End of the year 5,911 4,777 1,547 1,333 351 281 7,809 6,391
Plan assetsFair value of assets, beginning of the year 4,588 4,619 1,101 1,071 194 202 5,883 5,892Acquisitions through business combinations — — — — — — — —Interest income 88 92 49 39 3 4 140 135Company contribution 101 101 22 82 18 18 140 201Contributions by plan participants 23 21 — — 1 1 24 22Benefits paid (95) (90) (72) (63) (8) (16) (176) (169)Settlement payments — — (13) — — — (13) —Administrative cost (8) (9) (3) (3) — — (11) (12)Return on plan assets, excluding amounts included in net interest (income) expense 946 (146) 175 (76) 42 (15) 1,162 (237)Exchange rate differences — — 27 51 — — 27 51Fair value of assets, end of the year 5,642 4,588 1,285 1,101 249 194 7,177 5,883
Funded status (269) (189) (262) (232) (102) (87) (633) (508)
The total defined benefit obligation of €7,809 million as of December 29, 2019, includes €214 million related to plans that are wholly unfunded. These plans include pension plans in Greece and Serbia and other benefits (such as life insurance and medical care) and supplemental executive retirement plans in the United States.
During 2017, Ahold Delhaize decided to transition a select population of employees participating in its defined benefit pension plan in the United States to a defined contribution plan, effective January 1, 2020. Accrued benefits under the defined benefit plan for these employees were frozen as of December 31, 2019. In 2020, the Company will make transition contributions of €3 million to compensate affected employees for the benefit freeze. These transition contributions were already accrued for in 2017.
Financial statements Other informationStrategic Report Governance Financial performance AppendixGovernance RemunerationOur business Performance review Ahold Delhaize Annual Report 2019 158
24 Pensions and other post-employment benefits continuedCash contributionsFrom 2019 to 2020, Company contributions are expected to increase from €101 million to €108 million in the Netherlands, increase from $24 million (€22 million) to $25 million (€23 million) for all defined benefit plans in the United States, and decrease from €18 million to €17 million for all plans in the rest of the world.
As of year-end 2019, the funding ratio, calculated in accordance with regulatory requirements, of the Dutch plan was 108%. Under the financing agreement with Ahold Delhaize Pensioen, contributions are made as a percentage of employees’ pension bases and shared between Ahold Delhaize and the employees. The agreement also allows for a reduction in premiums if certain funding conditions are met. In addition, Ahold Delhaize can be required to contribute a maximum amount of €150 million over a five-year period if the funding ratio is below 105%. At year-end 2016, the funding ratio was 104% and the Company and Ahold Delhaize Pensioen agreed to an additional funding of €28 million under the financing agreement, which was included in the 2017 cash contributions.
The Ahold USA pension plan’s funding ratio at year-end 2019 was 128%, measured using regulatory interest rates allowed by the U.S. government as part of funding relief, which are higher than otherwise would be allowed. Based upon this funding ratio, under the current funding policy, we do not expect to make a funding contribution to the Ahold USA pension plan in 2020.
Actuarial assumptionsThe calculations of the defined benefit obligation and net defined benefit cost are sensitive to the assumptions set out below. These assumptions require a large degree of judgment. Actual experience may differ from the assumptions made. The assumptions required to calculate the actuarial present value of benefit obligations and the net defined benefit costs are determined per plan and are as follows (expressed as weighted averages):
%The Netherlands The United States Rest of world
2019 2018 restated 2019 2018 restated 2019 2018 restated
Discount rate 1.2 1.9 3.5 4.5 1.0 1.7Future salary increases 2.5 3.3 4.3 4.5 3.8 3.2Future pension increases 0.7 0.7 0.0 0.0 0.0 0.0
Assumptions regarding longevity are based on published statistics and mortality tables. These assumptions translate into an average life expectancy in years for a pensioner retiring at age 65:
Years
The Netherlands The United States Rest of world
2019 2018 restated 2019 2018 restated 2019 2018 restated
Longevity at age 65 for current pensionersMale 21.4 21.3 20.4 19.5 N/A N/AFemale 23.6 23.5 22.4 22.2 N/A N/ALongevity at age 65 for current members aged 50Male 23.1 23.0 21.6 20.8 N/A N/AFemale 25.3 25.2 23.5 23.4 N/A N/A
The following table summarizes how the effect on the defined benefit obligations at the end of the reporting period would have increased (decreased) as a result of a 0.5% change in the respective assumptions and a one-year increase in life expectancy.€ million The Netherlands The United States Rest of world Total
Discount rate0.5% increase (696) (89) (25) (810)0.5% decrease 830 105 28 963Future salary increases0.5% increase 94 — 12 1060.5% decrease (89) — (11) (100)Future pension increases0.5% increase 759 — N/A 7590.5% decrease (649) — N/A (649)Life expectancy1 year increase at age 65 234 54 1 289
The above sensitivity analyses are based on a change in each respective assumption while holding all other assumptions constant. In reality, one might expect interrelationships between the assumptions, especially between discount rate and future salary increases as both depend to a certain extent on expected inflation rates. The methods and types of assumptions used in preparing the sensitivity analyses did not change compared to the previous period.
Financial statements Other informationStrategic Report Governance Financial performance AppendixGovernance RemunerationOur business Performance review Ahold Delhaize Annual Report 2019 159
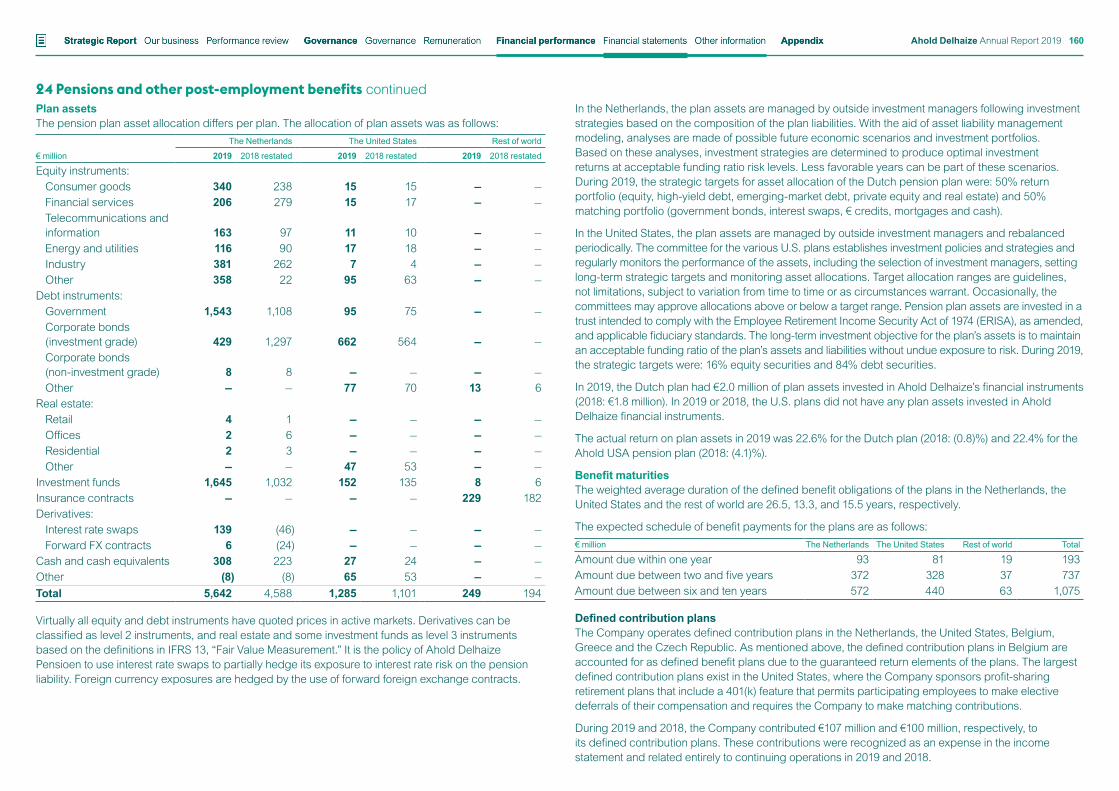
24 Pensions and other post-employment benefits continuedPlan assetsThe pension plan asset allocation differs per plan. The allocation of plan assets was as follows:
€ million
The Netherlands The United States Rest of world
2019 2018 restated 2019 2018 restated 2019 2018 restated
Equity instruments:Consumer goods 340 238 15 15 — —Financial services 206 279 15 17 — —Telecommunications and information 163 97 11 10 — —Energy and utilities 116 90 17 18 — —Industry 381 262 7 4 — —Other 358 22 95 63 — —
Debt instruments:Government 1,543 1,108 95 75 — —Corporate bonds (investment grade) 429 1,297 662 564 — —Corporate bonds (non-investment grade) 8 8 — — — —Other — — 77 70 13 6
Real estate:Retail 4 1 — — — —Offices 2 6 — — — —Residential 2 3 — — — —Other — — 47 53 — —
Investment funds 1,645 1,032 152 135 8 6Insurance contracts — — — — 229 182Derivatives:
Interest rate swaps 139 (46) — — — —Forward FX contracts 6 (24) — — — —
Cash and cash equivalents 308 223 27 24 — —Other (8) (8) 65 53 — —Total 5,642 4,588 1,285 1,101 249 194
Virtually all equity and debt instruments have quoted prices in active markets. Derivatives can be classified as level 2 instruments, and real estate and some investment funds as level 3 instruments based on the definitions in IFRS 13, “Fair Value Measurement.” It is the policy of Ahold Delhaize Pensioen to use interest rate swaps to partially hedge its exposure to interest rate risk on the pension liability. Foreign currency exposures are hedged by the use of forward foreign exchange contracts.
In the Netherlands, the plan assets are managed by outside investment managers following investment strategies based on the composition of the plan liabilities. With the aid of asset liability management modeling, analyses are made of possible future economic scenarios and investment portfolios. Based on these analyses, investment strategies are determined to produce optimal investment returns at acceptable funding ratio risk levels. Less favorable years can be part of these scenarios. During 2019, the strategic targets for asset allocation of the Dutch pension plan were: 50% return portfolio (equity, high-yield debt, emerging-market debt, private equity and real estate) and 50% matching portfolio (government bonds, interest swaps, € credits, mortgages and cash).
In the United States, the plan assets are managed by outside investment managers and rebalanced periodically. The committee for the various U.S. plans establishes investment policies and strategies and regularly monitors the performance of the assets, including the selection of investment managers, setting long-term strategic targets and monitoring asset allocations. Target allocation ranges are guidelines, not limitations, subject to variation from time to time or as circumstances warrant. Occasionally, the committees may approve allocations above or below a target range. Pension plan assets are invested in a trust intended to comply with the Employee Retirement Income Security Act of 1974 (ERISA), as amended, and applicable fiduciary standards. The long-term investment objective for the plan’s assets is to maintain an acceptable funding ratio of the plan’s assets and liabilities without undue exposure to risk. During 2019, the strategic targets were: 16% equity securities and 84% debt securities.
In 2019, the Dutch plan had €2.0 million of plan assets invested in Ahold Delhaize’s financial instruments (2018: €1.8 million). In 2019 or 2018, the U.S. plans did not have any plan assets invested in Ahold Delhaize financial instruments.
The actual return on plan assets in 2019 was 22.6% for the Dutch plan (2018: (0.8)%) and 22.4% for the Ahold USA pension plan (2018: (4.1)%).
Benefit maturitiesThe weighted average duration of the defined benefit obligations of the plans in the Netherlands, the United States and the rest of world are 26.5, 13.3, and 15.5 years, respectively.
The expected schedule of benefit payments for the plans are as follows:€ million The Netherlands The United States Rest of world Total
Amount due within one year 93 81 19 193Amount due between two and five years 372 328 37 737Amount due between six and ten years 572 440 63 1,075
Defined contribution plansThe Company operates defined contribution plans in the Netherlands, the United States, Belgium, Greece and the Czech Republic. As mentioned above, the defined contribution plans in Belgium are accounted for as defined benefit plans due to the guaranteed return elements of the plans. The largest defined contribution plans exist in the United States, where the Company sponsors profit-sharing retirement plans that include a 401(k) feature that permits participating employees to make elective deferrals of their compensation and requires the Company to make matching contributions.
During 2019 and 2018, the Company contributed €107 million and €100 million, respectively, to its defined contribution plans. These contributions were recognized as an expense in the income statement and related entirely to continuing operations in 2019 and 2018.
Financial statements Other informationStrategic Report Governance Financial performance AppendixGovernance RemunerationOur business Performance review Ahold Delhaize Annual Report 2019 160
24 Pensions and other post-employment benefits continuedMulti-employer plansA significant number of union employees in the United States are covered by multi-employer plans based on obligations arising from collective bargaining agreements. These plans provide retirement and other benefits to participants generally based on their service to contributing employers. The benefits are paid from assets held in trust for that purpose. Trustees are appointed in equal number by employers and unions and they are typically responsible for oversight of the investment of the assets and administration of the plan. Contribution rates and, in some instances, benefit levels are generally determined through the collective bargaining process between the participating employers and unions. With the exception of the Mid-Atlantic UFCW & Participating Employers Pension Fund as explained below, none of the Company’s collective bargaining agreements require an increase in the Company’s total pension contributions to meet minimum funding requirements.
Most of these plans are defined contribution plans. All plans that are defined benefit plans, on the basis of the terms of the benefits provided, are accounted for as defined contribution plans because, among other things, there is insufficient information available to account for these plans as defined benefit plans. These plans are generally flat dollar benefit plans. Ahold Delhaize is generally one of several employers participating in most of these plans and, in the event that Ahold Delhaize withdraws from a plan, its allocable share of the plan’s obligations (with certain exceptions) would be based upon unfunded vested benefits in the plan at the time of such withdrawal. Ahold Delhaize’s obligation to pay for its allocable share of a plan’s unfunded vested benefits is called a withdrawal liability. The withdrawal liability payable by Ahold Delhaize at such time as it experiences a withdrawal from a plan is based upon the applicable statutory formula, plan computation methods and actuarial assumptions, and the amount of the plan’s unfunded benefits. Ahold Delhaize does not have sufficient information to accurately determine its ratable share of plan obligations and assets following defined benefit accounting principles and the financial statements of the multi-employer plans are drawn up on the basis of other accounting policies than those applied by Ahold Delhaize. Consequently, these multi-employer plans are not included in the Company’s balance sheet.
The risks of participating in multi-employer plans are different from the risks of single employer plans. Ahold Delhaize’s contributions are pooled with the contributions of other contributing employers, and are therefore used to provide benefits to employees of these other participating employers. If other participating employers cease to participate in the plan without paying their allocable portion of the plan’s unfunded obligations, this could result in increases in the amount of the plan’s unfunded benefits and, thus, Ahold Delhaize’s future contributions. Similarly, if a number of employers cease to have employees participating in the plan, Ahold Delhaize could be responsible for an increased share of the plan’s deficit. If Ahold Delhaize seeks to withdraw from a multi-employer plan, it generally must obtain the agreement of the applicable unions and will likely be required to pay withdrawal liability in connection with this. If a multi-employer plan in which Ahold Delhaize participates becomes insolvent, Ahold Delhaize may be required to increase its contributions, in certain circumstances, to fund the payment of benefits by the multi-employer plan.
Defined benefit plansAhold Delhaize participates in 11 multi-employer pension plans that are defined benefit plans on the basis of the terms of the benefits provided. The Company’s participation in these multi-employer plans is outlined in the following tables.
Ahold Delhaize’s participation percentage is an indication based on the relevant amount of its contributions during the year in relation to the total amount of contributions made to the plan.
The estimate of the Company’s net proportionate share of the plans’ deficits is based on the latest available information received from these plans, such as the plans’ measurement of plan assets and the use of discount rates between 6.5% and 8.5%. The estimate does not represent Ahold Delhaize’s direct obligation. While it is our best estimate, based upon information available to us, it is imprecise and a reliable estimate of the amount of the obligation cannot be made.
The EIN / Pension Plan Number column provides the Employer Identification Number (EIN) and the three-digit pension plan number. As with all pension plans, multi-employer pension plans in the U.S. are regulated by the Employee Retirement Income Security Act of 1974 (ERISA), as amended; the Pension Protection Act of 2006 (PPA); and the Multi-employer Pension Reform Act of 2014 (MPRA), among other legislation.
Under the PPA, plans are categorized as “endangered” (Yellow Zone), “seriously endangered” (Orange Zone), “critical” (Red Zone), or neither endangered nor critical (Green Zone). This categorization is primarily based on three measures: the plan’s funded percentage, the number of years before the plan is projected to have a minimum funding deficiency under ERISA and the number of years before the plan is projected to become insolvent.
A plan is in the “Yellow Zone” if the funded percentage is less than 80% or a minimum funding deficiency is projected within seven years. If both of these triggers are reached, the plan is in the “Orange Zone.” Generally, a plan is in the “Red Zone” if a funding deficiency is projected at any time in the next four years (or five years if the funded percentage is less than 65%). Plans with a funding ratio above 80% are generally designated as being in the “Green Zone.” A plan in the “Red Zone” may be further categorized as “critical and declining” if the plan is projected to become insolvent within the current year or within either the next 14 years or the next 19 years, depending on the plan’s ratio of inactive participants to active participants and the plan’s specific funding percentage. Multi-employer plans in endangered or critical status are required by U.S. law to develop either a funding improvement plan (FIP) or a rehabilitation plan (RP) to enhance funding through reductions in benefits, increases in contributions, or both.
The FIP / RP Status Pending / Implemented column in the table below indicates plans for which an FIP or an RP is pending or has been implemented. Additional information regarding the multi-employer plans listed in the following tables can be found on the website of the U.S. Department of Labor (www.efast.dol.gov).
Financial statements Other informationStrategic Report Governance Financial performance AppendixGovernance RemunerationOur business Performance review Ahold Delhaize Annual Report 2019 161
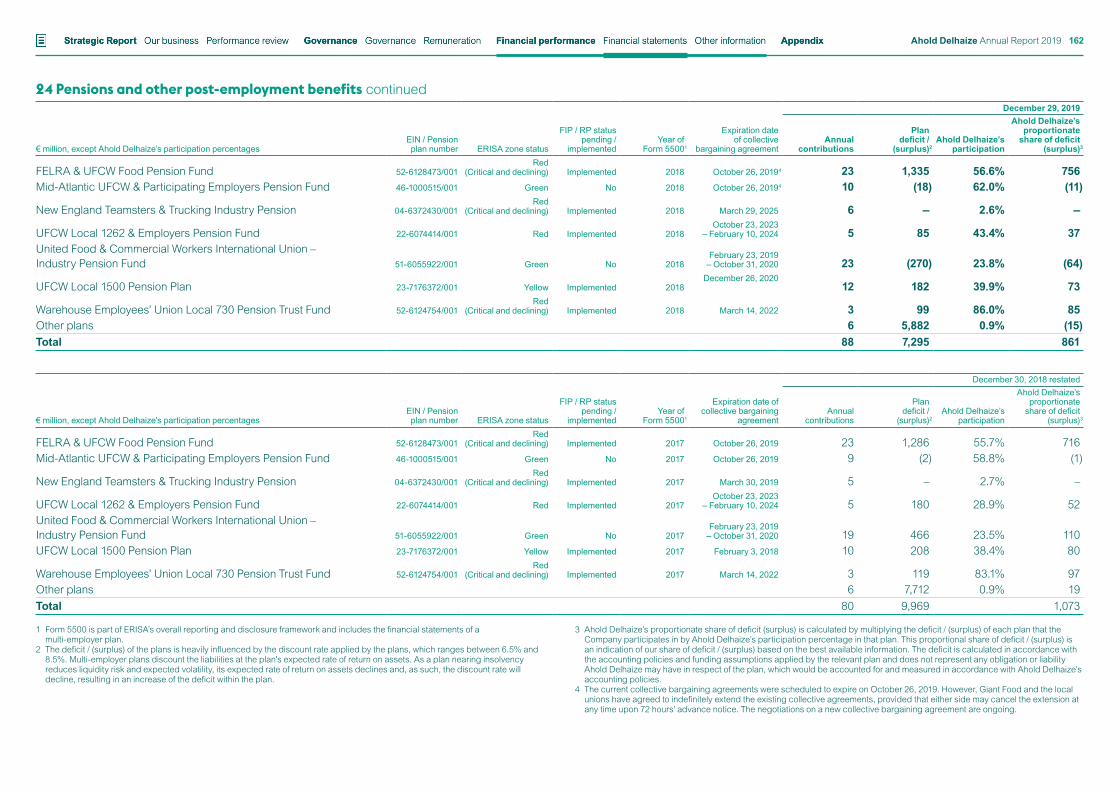
24 Pensions and other post-employment benefits continued
€ million, except Ahold Delhaize’s participation percentagesEIN / Pension plan number ERISA zone status
FIP / RP status pending /
implementedYear of
Form 55001
Expiration date of collective
bargaining agreement
December 29, 2019
Annual contributions
Plan deficit /
(surplus)2Ahold Delhaize’s
participation
Ahold Delhaize’s proportionate
share of deficit (surplus)3
FELRA & UFCW Food Pension Fund 52-6128473/001Red
(Critical and declining) Implemented 2018 October 26, 20194 23 1,335 56.6% 756Mid-Atlantic UFCW & Participating Employers Pension Fund 46-1000515/001 Green No 2018 October 26, 20194 10 (18) 62.0% (11)
New England Teamsters & Trucking Industry Pension 04-6372430/001Red
(Critical and declining) Implemented 2018 March 29, 2025 6 — 2.6% —
UFCW Local 1262 & Employers Pension Fund 22-6074414/001 Red Implemented 2018October 23, 2023
– February 10, 2024 5 85 43.4% 37United Food & Commercial Workers International Union – Industry Pension Fund 51-6055922/001 Green No 2018
February 23, 2019 – October 31, 2020 23 (270) 23.8% (64)
UFCW Local 1500 Pension Plan 23-7176372/001 Yellow Implemented 2018December 26, 2020
12 182 39.9% 73
Warehouse Employees’ Union Local 730 Pension Trust Fund 52-6124754/001Red
(Critical and declining) Implemented 2018 March 14, 2022 3 99 86.0% 85Other plans 6 5,882 0.9% (15)Total 88 7,295 861
€ million, except Ahold Delhaize’s participation percentagesEIN / Pension plan number ERISA zone status
FIP / RP status pending /
implementedYear of
Form 55001
Expiration date of collective bargaining
agreement
December 30, 2018 restated
Annual contributions
Plan deficit /
(surplus)2Ahold Delhaize’s
participation
Ahold Delhaize’s proportionate
share of deficit (surplus)3
FELRA & UFCW Food Pension Fund 52-6128473/001Red
(Critical and declining) Implemented 2017 October 26, 2019 23 1,286 55.7% 716Mid-Atlantic UFCW & Participating Employers Pension Fund 46-1000515/001 Green No 2017 October 26, 2019 9 (2) 58.8% (1)
New England Teamsters & Trucking Industry Pension 04-6372430/001Red
(Critical and declining) Implemented 2017 March 30, 2019 5 – 2.7% –
UFCW Local 1262 & Employers Pension Fund 22-6074414/001 Red Implemented 2017October 23, 2023
– February 10, 2024 5 180 28.9% 52United Food & Commercial Workers International Union – Industry Pension Fund 51-6055922/001 Green No 2017
February 23, 2019 – October 31, 2020 19 466 23.5% 110
UFCW Local 1500 Pension Plan 23-7176372/001 Yellow Implemented 2017 February 3, 2018 10 208 38.4% 80
Warehouse Employees’ Union Local 730 Pension Trust Fund 52-6124754/001Red
(Critical and declining) Implemented 2017 March 14, 2022 3 119 83.1% 97Other plans 6 7,712 0.9% 19Total 80 9,969 1,073
1 Form 5500 is part of ERISA’s overall reporting and disclosure framework and includes the financial statements of a multi-employer plan.
2 The deficit / (surplus) of the plans is heavily influenced by the discount rate applied by the plans, which ranges between 6.5% and 8.5%. Multi-employer plans discount the liabilities at the plan’s expected rate of return on assets. As a plan nearing insolvency reduces liquidity risk and expected volatility, its expected rate of return on assets declines and, as such, the discount rate will decline, resulting in an increase of the deficit within the plan.
3 Ahold Delhaize’s proportionate share of deficit (surplus) is calculated by multiplying the deficit / (surplus) of each plan that the Company participates in by Ahold Delhaize’s participation percentage in that plan. This proportional share of deficit / (surplus) is an indication of our share of deficit / (surplus) based on the best available information. The deficit is calculated in accordance with the accounting policies and funding assumptions applied by the relevant plan and does not represent any obligation or liability Ahold Delhaize may have in respect of the plan, which would be accounted for and measured in accordance with Ahold Delhaize’s accounting policies.
4 The current collective bargaining agreements were scheduled to expire on October 26, 2019. However, Giant Food and the local unions have agreed to indefinitely extend the existing collective agreements, provided that either side may cancel the extension at any time upon 72 hours’ advance notice. The negotiations on a new collective bargaining agreement are ongoing.
Financial statements Other informationStrategic Report Governance Financial performance AppendixGovernance RemunerationOur business Performance review Ahold Delhaize Annual Report 2019 162
24 Pensions and other post-employment benefits continuedIf the underfunded liabilities of the multi-employer pension plans are not reduced, either by improved market conditions, reductions in benefits and / or collective bargaining changes, increased future payments by the Company and the other participating employers may result. However, all future increases generally will be subject to the collective bargaining process. In 2020, the Company expects its contributions to increase to €94 million, which includes rehabilitation plan contribution increases where applicable. Ahold Delhaize has a risk of increased contributions and withdrawal liability (upon a withdrawal) if any of the participating employers in an underfunded multi-employer plan withdraw from the plan or become insolvent and are no longer able to meet their contribution requirements or if the multi-employer plan itself no longer has sufficient assets available to fund its short-term obligations to the participants in the plan. If and when a withdrawal liability is assessed, it may be substantially higher than the proportionate share disclosed above. Any adjustment for a withdrawal liability will be recorded when it is probable that a liability exists and the amount can be reliably estimated. Ahold Delhaize does not have a contractual agreement with any multi-employer plan that determines how a deficit will be funded. No withdrawal payments were incurred or included in the 2019 and 2018 contributions disclosed above.
In 2012, a restructuring took place regarding the FELRA & UFCW Pension Fund (“FELRA”). Under the restructuring, the Mid-Atlantic UFCW & Participating Employers Pension Fund (“MAP”) was created for future service accruals of Giant Food (a controlled subsidiary of Ahold Delhaize) employees and one other participating employer. Giant Food is currently the largest contributing employer in the FELRA plan, followed by one other large contributing employer and a small contributing employer affiliated with the other employer. MAP is funded by Giant Food and one other large participating employer. The MAP and the current collective bargaining agreements include a provision (“benefit backstop provision”) that will become effective, for all participating employers in MAP, if and when FELRA becomes insolvent and benefits are reduced in accordance with the rules established by the Pension Benefit Guaranty Corporation (PBGC). Under normal circumstances, when a multi-employer plan reaches insolvency it must reduce all accrued benefits to the maximum level guaranteed by the PBGC. The PBGC will continue to fund these minimum guaranteed benefits for the participants. FELRA and all other similar funds paid annual insurance premiums to the PBGC for such benefit insurance. Upon the insolvency of FELRA, the collective bargaining agreements to which Giant Food is a party may require Giant Food to pay certain supplemental contributions to FELRA and / or MAP that are attributable to certain of the benefits reduced by FELRA as a result of its insolvency. The specific amount of any such contributions remains subject to a number of variables, including the actions of third parties, and cannot be precisely estimated at this time. In addition, as noted below, this supplemental contribution obligation may be modified through the collective bargaining process.
FELRA reported in its 2018 Form 5500 that it projects it will become insolvent in approximately the first quarter of 2021 and reported in its Form 5500 a year-end funding ratio of 20.8%. Its Board of Trustees adopted an ERISA “all reasonable measures” rehabilitation plan intended to forestall insolvency. This specific ERISA rehabilitation plan allows FELRA to satisfy the applicable minimum funding standards. The current collective bargaining agreements were scheduled to expire on October 26, 2019. However, Giant Food and the union locals have agreed to indefinitely extend the existing collective agreements, provided that either side may cancel the extension at any time upon 72 hours’ advance notice. The negotiations on a new collective bargaining agreement are ongoing. Retirement benefits and funding are just one aspect of these negotiations, which concern all of the terms and conditions of employment for the relevant bargaining units. If FELRA becomes insolvent before new collective bargaining agreements are negotiated, Ahold Delhaize may be required to increase its contributions or, in certain circumstances to fund the payment of benefits that go unpaid by FELRA. A wide variety of potential scenarios could unfold, all of which are conditional and dependent on uncertain future events, and the outcome of which cannot be reasonably predicted but which could have a material impact on Ahold Delhaize’s financial position and results.
Defined contribution plansAhold Delhaize also participates in 39 multi-employer plans that are defined contribution plans on the basis of the terms of the benefits provided. The majority of these plans provide health and welfare benefits. The Company contributed €299 million and €280 million to multi-employer defined contribution plans during 2019 and 2018, respectively. These contributions are recognized as an expense in the consolidated income statement and related entirely to continuing operations in 2019 and 2018. These plans vary significantly in size, with contributions to the three largest plans representing 50% of total contributions.
Financial statements Other informationStrategic Report Governance Financial performance AppendixGovernance RemunerationOur business Performance review Ahold Delhaize Annual Report 2019 163
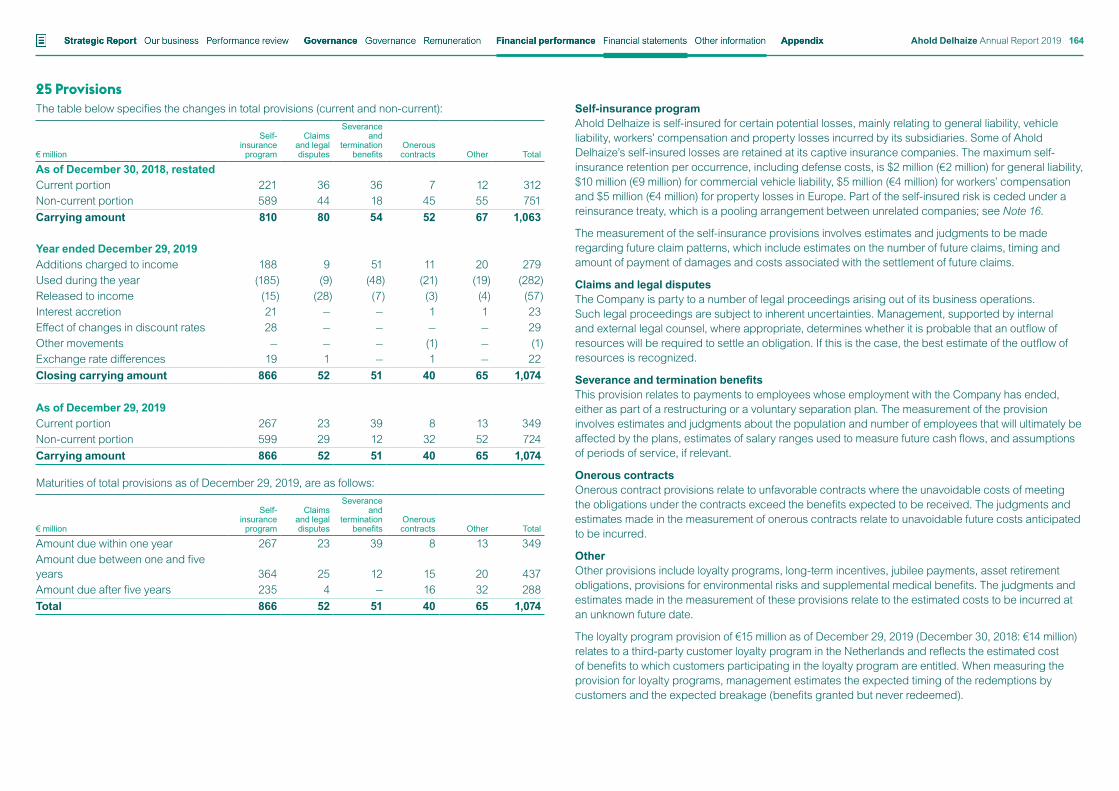
25 ProvisionsThe table below specifies the changes in total provisions (current and non-current):
€ million
Self- insurance
program
Claims and legal disputes
Severance and
termination benefits
Onerous contracts Other Total
As of December 30, 2018, restatedCurrent portion 221 36 36 7 12 312Non-current portion 589 44 18 45 55 751Carrying amount 810 80 54 52 67 1,063
Year ended December 29, 2019Additions charged to income 188 9 51 11 20 279Used during the year (185) (9) (48) (21) (19) (282)Released to income (15) (28) (7) (3) (4) (57)Interest accretion 21 — — 1 1 23Effect of changes in discount rates 28 — — — — 29Other movements — — — (1) — (1)Exchange rate differences 19 1 — 1 — 22Closing carrying amount 866 52 51 40 65 1,074
As of December 29, 2019Current portion 267 23 39 8 13 349Non-current portion 599 29 12 32 52 724Carrying amount 866 52 51 40 65 1,074
Maturities of total provisions as of December 29, 2019, are as follows:
€ million
Self- insurance
program
Claims and legal disputes
Severance and
termination benefits
Onerous contracts Other Total
Amount due within one year 267 23 39 8 13 349Amount due between one and five years 364 25 12 15 20 437Amount due after five years 235 4 — 16 32 288Total 866 52 51 40 65 1,074
Self-insurance programAhold Delhaize is self-insured for certain potential losses, mainly relating to general liability, vehicle liability, workers’ compensation and property losses incurred by its subsidiaries. Some of Ahold Delhaize’s self-insured losses are retained at its captive insurance companies. The maximum self-insurance retention per occurrence, including defense costs, is $2 million (€2 million) for general liability, $10 million (€9 million) for commercial vehicle liability, $5 million (€4 million) for workers’ compensation and $5 million (€4 million) for property losses in Europe. Part of the self-insured risk is ceded under a reinsurance treaty, which is a pooling arrangement between unrelated companies; see Note 16.
The measurement of the self-insurance provisions involves estimates and judgments to be made regarding future claim patterns, which include estimates on the number of future claims, timing and amount of payment of damages and costs associated with the settlement of future claims.
Claims and legal disputesThe Company is party to a number of legal proceedings arising out of its business operations. Such legal proceedings are subject to inherent uncertainties. Management, supported by internal and external legal counsel, where appropriate, determines whether it is probable that an outflow of resources will be required to settle an obligation. If this is the case, the best estimate of the outflow of resources is recognized.
Severance and termination benefitsThis provision relates to payments to employees whose employment with the Company has ended, either as part of a restructuring or a voluntary separation plan. The measurement of the provision involves estimates and judgments about the population and number of employees that will ultimately be affected by the plans, estimates of salary ranges used to measure future cash flows, and assumptions of periods of service, if relevant.
Onerous contractsOnerous contract provisions relate to unfavorable contracts where the unavoidable costs of meeting the obligations under the contracts exceed the benefits expected to be received. The judgments and estimates made in the measurement of onerous contracts relate to unavoidable future costs anticipated to be incurred.
OtherOther provisions include loyalty programs, long-term incentives, jubilee payments, asset retirement obligations, provisions for environmental risks and supplemental medical benefits. The judgments and estimates made in the measurement of these provisions relate to the estimated costs to be incurred at an unknown future date.
The loyalty program provision of €15 million as of December 29, 2019 (December 30, 2018: €14 million) relates to a third-party customer loyalty program in the Netherlands and reflects the estimated cost of benefits to which customers participating in the loyalty program are entitled. When measuring the provision for loyalty programs, management estimates the expected timing of the redemptions by customers and the expected breakage (benefits granted but never redeemed).
Financial statements Other informationStrategic Report Governance Financial performance AppendixGovernance RemunerationOur business Performance review Ahold Delhaize Annual Report 2019 164
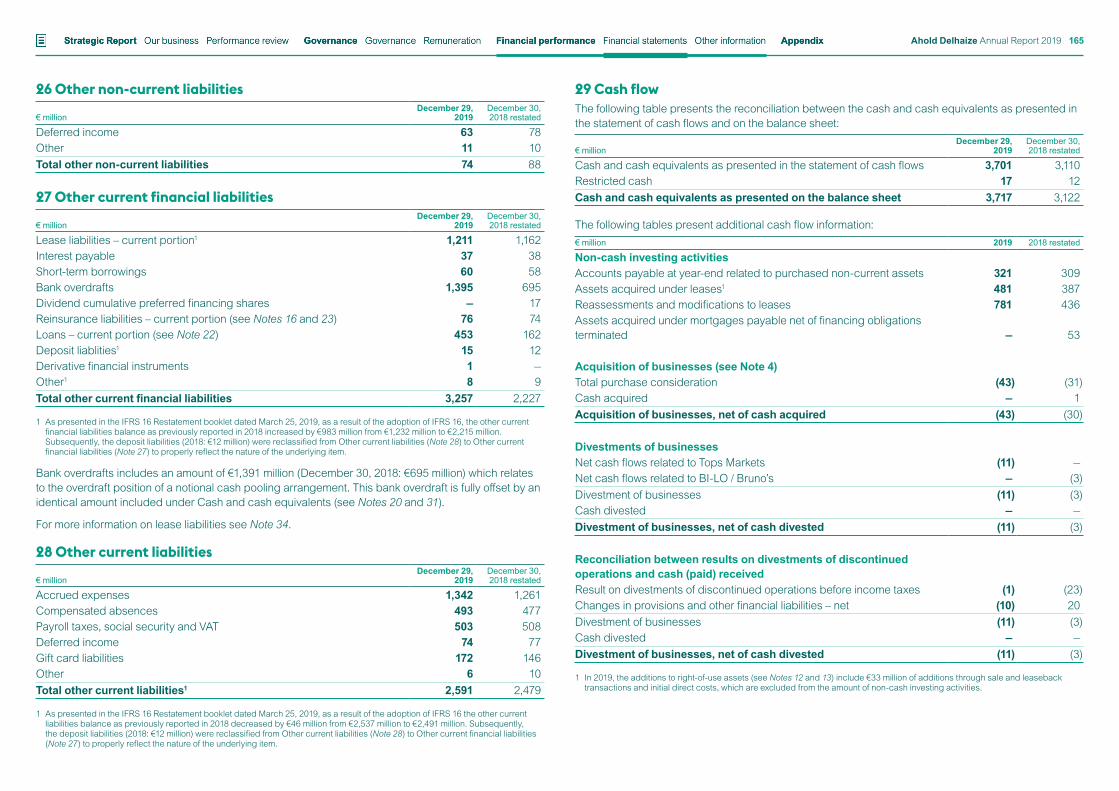
26 Other non-current liabilities
€ millionDecember 29,
2019December 30, 2018 restated
Deferred income 63 78Other 11 10Total other non-current liabilities 74 88
27 Other current financial liabilities
€ millionDecember 29,
2019December 30, 2018 restated
Lease liabilities – current portion1 1,211 1,162Interest payable 37 38Short-term borrowings 60 58Bank overdrafts 1,395 695Dividend cumulative preferred financing shares — 17Reinsurance liabilities – current portion (see Notes 16 and 23) 76 74Loans – current portion (see Note 22) 453 162Deposit liablities1 15 12Derivative financial instruments 1 —Other1 8 9Total other current financial liabilities 3,257 2,227
1 As presented in the IFRS 16 Restatement booklet dated March 25, 2019, as a result of the adoption of IFRS 16, the other current financial liabilities balance as previously reported in 2018 increased by €983 million from €1,232 million to €2,215 million. Subsequently, the deposit liabilities (2018: €12 million) were reclassified from Other current liabilities (Note 28) to Other current financial liabilities (Note 27) to properly reflect the nature of the underlying item.
Bank overdrafts includes an amount of €1,391 million (December 30, 2018: €695 million) which relates to the overdraft position of a notional cash pooling arrangement. This bank overdraft is fully offset by an identical amount included under Cash and cash equivalents (see Notes 20 and 31).
For more information on lease liabilities see Note 34.
28 Other current liabilities
€ millionDecember 29,
2019December 30, 2018 restated
Accrued expenses 1,342 1,261Compensated absences 493 477Payroll taxes, social security and VAT 503 508Deferred income 74 77Gift card liabilities 172 146Other 6 10Total other current liabilities1 2,591 2,479
1 As presented in the IFRS 16 Restatement booklet dated March 25, 2019, as a result of the adoption of IFRS 16 the other current liabilities balance as previously reported in 2018 decreased by €46 million from €2,537 million to €2,491 million. Subsequently, the deposit liabilities (2018: €12 million) were reclassified from Other current liabilities (Note 28) to Other current financial liabilities (Note 27) to properly reflect the nature of the underlying item.
29 Cash flowThe following table presents the reconciliation between the cash and cash equivalents as presented in the statement of cash flows and on the balance sheet:
€ millionDecember 29,
2019December 30, 2018 restated
Cash and cash equivalents as presented in the statement of cash flows 3,701 3,110Restricted cash 17 12Cash and cash equivalents as presented on the balance sheet 3,717 3,122
The following tables present additional cash flow information:€ million 2019 2018 restated
Non-cash investing activitiesAccounts payable at year-end related to purchased non-current assets 321 309Assets acquired under leases1 481 387Reassessments and modifications to leases 781 436Assets acquired under mortgages payable net of financing obligations terminated — 53
Acquisition of businesses (see Note 4)Total purchase consideration (43) (31)Cash acquired — 1Acquisition of businesses, net of cash acquired (43) (30)
Divestments of businessesNet cash flows related to Tops Markets (11) —Net cash flows related to BI-LO / Bruno’s — (3)Divestment of businesses (11) (3)Cash divested — —Divestment of businesses, net of cash divested (11) (3)
Reconciliation between results on divestments of discontinued operations and cash (paid) receivedResult on divestments of discontinued operations before income taxes (1) (23)Changes in provisions and other financial liabilities – net (10) 20Divestment of businesses (11) (3)Cash divested — —Divestment of businesses, net of cash divested (11) (3)
1 In 2019, the additions to right-of-use assets (see Notes 12 and 13) include €33 million of additions through sale and leaseback transactions and initial direct costs, which are excluded from the amount of non-cash investing activities.
Financial statements Other informationStrategic Report Governance Financial performance AppendixGovernance RemunerationOur business Performance review Ahold Delhaize Annual Report 2019 165
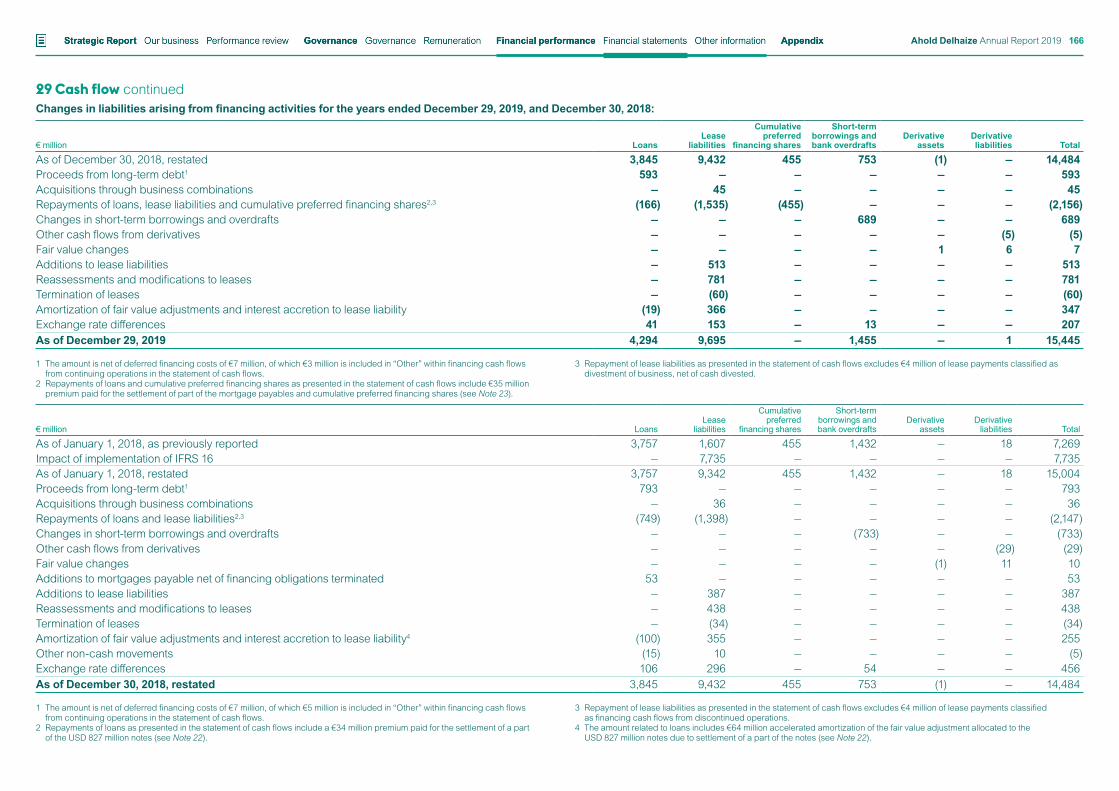
29 Cash flow continuedChanges in liabilities arising from financing activities for the years ended December 29, 2019, and December 30, 2018:
€ million LoansLease
liabilities
Cumulative preferred
financing shares
Short-term borrowings and bank overdrafts
Derivative assets
Derivative liabilities Total
As of December 30, 2018, restated 3,845 9,432 455 753 (1) — 14,484Proceeds from long-term debt1 593 — — — — — 593Acquisitions through business combinations — 45 — — — — 45Repayments of loans, lease liabilities and cumulative preferred financing shares2,3 (166) (1,535) (455) — — — (2,156)Changes in short-term borrowings and overdrafts — — — 689 — — 689Other cash flows from derivatives — — — — — (5) (5)Fair value changes — — — — 1 6 7Additions to lease liabilities — 513 — — — — 513Reassessments and modifications to leases — 781 — — — — 781Termination of leases — (60) — — — — (60)Amortization of fair value adjustments and interest accretion to lease liability (19) 366 — — — — 347Exchange rate differences 41 153 — 13 — — 207As of December 29, 2019 4,294 9,695 — 1,455 — 1 15,445
1 The amount is net of deferred financing costs of €7 million, of which €3 million is included in “Other” within financing cash flows from continuing operations in the statement of cash flows.
2 Repayments of loans and cumulative preferred financing shares as presented in the statement of cash flows include €35 million premium paid for the settlement of part of the mortgage payables and cumulative preferred financing shares (see Note 23).
3 Repayment of lease liabilities as presented in the statement of cash flows excludes €4 million of lease payments classified as divestment of business, net of cash divested.
€ million LoansLease
liabilities
Cumulative preferred
financing shares
Short-term borrowings and bank overdrafts
Derivative assets
Derivative liabilities Total
As of January 1, 2018, as previously reported 3,757 1,607 455 1,432 — 18 7,269Impact of implementation of IFRS 16 — 7,735 — — — — 7,735As of January 1, 2018, restated 3,757 9,342 455 1,432 — 18 15,004Proceeds from long-term debt1 793 — — — — — 793Acquisitions through business combinations — 36 — — — — 36Repayments of loans and lease liabilities2,3 (749) (1,398) — — — — (2,147)Changes in short-term borrowings and overdrafts — — — (733) — — (733)Other cash flows from derivatives — — — — — (29) (29)Fair value changes — — — — (1) 11 10Additions to mortgages payable net of financing obligations terminated 53 — — — — — 53Additions to lease liabilities — 387 — — — — 387Reassessments and modifications to leases — 438 — — — — 438Termination of leases — (34) — — — — (34)Amortization of fair value adjustments and interest accretion to lease liability4 (100) 355 — — — — 255Other non-cash movements (15) 10 — — — — (5)Exchange rate differences 106 296 — 54 — — 456As of December 30, 2018, restated 3,845 9,432 455 753 (1) — 14,484
1 The amount is net of deferred financing costs of €7 million, of which €5 million is included in “Other” within financing cash flows from continuing operations in the statement of cash flows.
2 Repayments of loans as presented in the statement of cash flows include a €34 million premium paid for the settlement of a part of the USD 827 million notes (see Note 22).
3 Repayment of lease liabilities as presented in the statement of cash flows excludes €4 million of lease payments classified as financing cash flows from discontinued operations.
4 The amount related to loans includes €64 million accelerated amortization of the fair value adjustment allocated to the USD 827 million notes due to settlement of a part of the notes (see Note 22).
Financial statements Other informationStrategic Report Governance Financial performance AppendixGovernance RemunerationOur business Performance review Ahold Delhaize Annual Report 2019 166
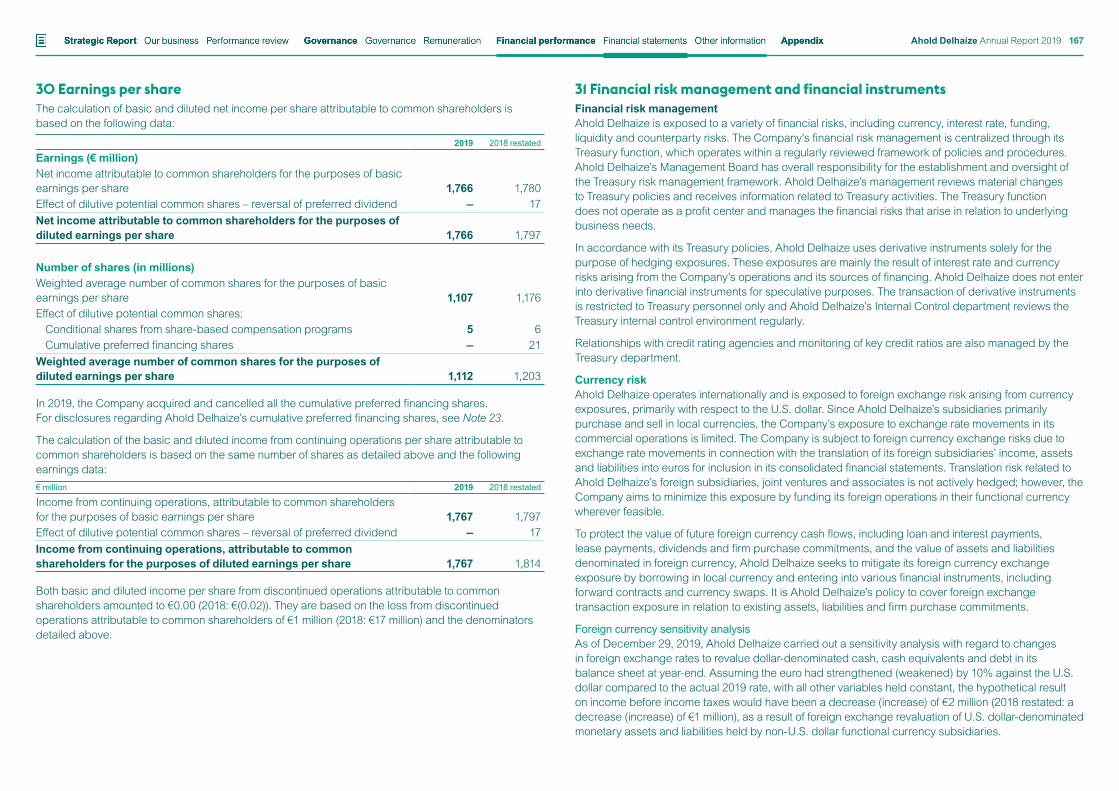
30 Earnings per shareThe calculation of basic and diluted net income per share attributable to common shareholders is based on the following data:
2019 2018 restated
Earnings (€ million)Net income attributable to common shareholders for the purposes of basic earnings per share 1,766 1,780Effect of dilutive potential common shares – reversal of preferred dividend — 17Net income attributable to common shareholders for the purposes of diluted earnings per share 1,766 1,797
Number of shares (in millions)Weighted average number of common shares for the purposes of basic earnings per share 1,107 1,176Effect of dilutive potential common shares:
Conditional shares from share-based compensation programs 5 6Cumulative preferred financing shares — 21
Weighted average number of common shares for the purposes of diluted earnings per share 1,112 1,203
In 2019, the Company acquired and cancelled all the cumulative preferred financing shares. For disclosures regarding Ahold Delhaize’s cumulative preferred financing shares, see Note 23.
The calculation of the basic and diluted income from continuing operations per share attributable to common shareholders is based on the same number of shares as detailed above and the following earnings data:€ million 2019 2018 restated
Income from continuing operations, attributable to common shareholders for the purposes of basic earnings per share 1,767 1,797Effect of dilutive potential common shares – reversal of preferred dividend — 17Income from continuing operations, attributable to common shareholders for the purposes of diluted earnings per share 1,767 1,814
Both basic and diluted income per share from discontinued operations attributable to common shareholders amounted to €0.00 (2018: €(0.02)). They are based on the loss from discontinued operations attributable to common shareholders of €1 million (2018: €17 million) and the denominators detailed above.
31 Financial risk management and financial instrumentsFinancial risk managementAhold Delhaize is exposed to a variety of financial risks, including currency, interest rate, funding, liquidity and counterparty risks. The Company’s financial risk management is centralized through its Treasury function, which operates within a regularly reviewed framework of policies and procedures. Ahold Delhaize’s Management Board has overall responsibility for the establishment and oversight of the Treasury risk management framework. Ahold Delhaize’s management reviews material changes to Treasury policies and receives information related to Treasury activities. The Treasury function does not operate as a profit center and manages the financial risks that arise in relation to underlying business needs.
In accordance with its Treasury policies, Ahold Delhaize uses derivative instruments solely for the purpose of hedging exposures. These exposures are mainly the result of interest rate and currency risks arising from the Company’s operations and its sources of financing. Ahold Delhaize does not enter into derivative financial instruments for speculative purposes. The transaction of derivative instruments is restricted to Treasury personnel only and Ahold Delhaize’s Internal Control department reviews the Treasury internal control environment regularly.
Relationships with credit rating agencies and monitoring of key credit ratios are also managed by the Treasury department.
Currency riskAhold Delhaize operates internationally and is exposed to foreign exchange risk arising from currency exposures, primarily with respect to the U.S. dollar. Since Ahold Delhaize’s subsidiaries primarily purchase and sell in local currencies, the Company’s exposure to exchange rate movements in its commercial operations is limited. The Company is subject to foreign currency exchange risks due to exchange rate movements in connection with the translation of its foreign subsidiaries’ income, assets and liabilities into euros for inclusion in its consolidated financial statements. Translation risk related to Ahold Delhaize’s foreign subsidiaries, joint ventures and associates is not actively hedged; however, the Company aims to minimize this exposure by funding its foreign operations in their functional currency wherever feasible.
To protect the value of future foreign currency cash flows, including loan and interest payments, lease payments, dividends and firm purchase commitments, and the value of assets and liabilities denominated in foreign currency, Ahold Delhaize seeks to mitigate its foreign currency exchange exposure by borrowing in local currency and entering into various financial instruments, including forward contracts and currency swaps. It is Ahold Delhaize’s policy to cover foreign exchange transaction exposure in relation to existing assets, liabilities and firm purchase commitments.
Foreign currency sensitivity analysisAs of December 29, 2019, Ahold Delhaize carried out a sensitivity analysis with regard to changes in foreign exchange rates to revalue dollar-denominated cash, cash equivalents and debt in its balance sheet at year-end. Assuming the euro had strengthened (weakened) by 10% against the U.S. dollar compared to the actual 2019 rate, with all other variables held constant, the hypothetical result on income before income taxes would have been a decrease (increase) of €2 million (2018 restated: a decrease (increase) of €1 million), as a result of foreign exchange revaluation of U.S. dollar-denominated monetary assets and liabilities held by non-U.S. dollar functional currency subsidiaries.
Financial statements Other informationStrategic Report Governance Financial performance AppendixGovernance RemunerationOur business Performance review Ahold Delhaize Annual Report 2019 167
31 Financial risk management and financial instruments continuedThe loss on foreign exchange recognized in the 2019 income statement related to the revaluation of unhedged leases reported in the balance sheet as a result of the implementation of IFRS16 amounted to €8 million. The strengthening (weakening) of the euro by 10% against the other currencies, with all other variables held constant, would result in a loss (gain) of €63 million.
Interest rate riskAhold Delhaize’s outstanding debt and investment position is exposed to changes in interest rates. To manage interest rate risk, Ahold Delhaize has an interest rate management policy aimed at reducing volatility in its interest expense and maintaining a target percentage of its debt in fixed-rate instruments. As of December 29, 2019, 92% of Ahold Delhaize’s long-term bonds was at fixed rates of interest (2018 restated: 91%).
Interest rate sensitivity analysisThe total interest expense recognized in the 2019 income statement related to the variable rates of short and long-term debt amounted to nil (2018: nil). An increase (decrease) in market interest rates by 25 basis points, with all other variables (including foreign exchange rates) held constant, would have resulted in a loss (gain) of €1 million (2018: nil).
The total interest income recognized in the 2019 income statement amounted to €65 million (2018: €85 million), mainly related to variable rate money market fund investments and deposits. The Company estimates that with a possible increase (decrease) of euro and U.S. dollar market interest rates of 25 basis points with all other variables (including foreign exchange rates) held constant, this would have resulted in a gain of €5 million or a loss of €5 million, respectively (2018: gain of €7 million or a loss of €7 million).
The above sensitivity analyses are for illustrative purposes only as, in practice, market rates rarely change in isolation from other factors that also affect Ahold Delhaize’s financial position and results.
Supply chain financingOur accounting policy for amounts due under supply chain finance arrangements with banks is to classify these arrangements as trade payables. In accordance with our accounting policy, trade payables are presented as operating activities within our cash flow statements. Suppliers choose to enter into these arrangements, which provide them with the option of access to earlier payment at favorable interest rates from our bank based on Ahold Delhaize’s investment grade credit rating. If suppliers do not choose early payment under these arrangements, their invoices are settled by our bank under the originally agreed payment terms. The arrangements do not expose Ahold Delhaize to additional credit risk nor provide Ahold Delhaize with a significant benefit of additional financing and accordingly it is Ahold Delhaize’s policy to classify the amounts due under supply chain finance arrangements with banks as trade payables. The amounts due under the supply chain finance arrangements classified as trade payables as of December 29, 2019, and December 30, 2018, were not significant compared to the total outstanding trade payables.
Credit riskAhold Delhaize has no significant concentrations of credit risk. The concentration of credit risk with respect to receivables is limited, as the Company’s customer base and vendor base are large and unrelated. The Company applies the IFRS 9 simplified approach to measuring expected credit losses, which uses a lifetime expected loss allowance for all trade receivables. To measure the expected credit losses, trade receivables have been grouped based on shared credit risk characteristics and the days past due. The expected loss rate is calculated based on delinquency status and actual historical credit loss experience. As a result, management believes there is no further credit risk provision required over the normal individual and collective impairment, based on an aging analysis performed as of December 29, 2019. For further discussion on Ahold Delhaize’s receivables, see Notes 16 and 18.
Financial transactions are predominantly entered into with investment grade financial institutions. The Company requires a minimum short-term rating of A1/P1 and a minimum long-term rating of A3/A- for its deposit and investment products. The Company may deviate from this requirement from time to time for operational reasons. Regarding credit risk, derivative contracts with counterparties are entered into primarily under the standard terms and conditions of the International Swaps and Derivatives Association (ISDA). With certain counterparties, Ahold Delhaize has credit support annexes in place that materially reduce the counterparty risk exposure because of a contractual exchange of cash collateral. Ahold Delhaize has policies that limit the amount of counterparty credit exposure to any single financial institution or investment vehicle and actively monitors these exposures.
Counterparty risk is measured by adding the nominal value of cash, short-term deposits and marketable securities, and the mark-to-market of derivative instruments, netted with the collateral posted, if any. As a result, the highest exposure to a single financial counterparty, excluding AAA-rated money market funds, on December 29, 2019, amounted to €240 million (December 30, 2018: €418 million).
Offsetting of financial instrumentsAhold Delhaize has several financial assets and financial liabilities that are subject to offsetting or enforceable master netting arrangements and similar agreements.
Cash poolThe Company has implemented a cash pool system, allowing a more efficient management of the daily working capital needs of the participating operating entities. The settlement mechanism of the cash pool is provided by an external financial counterparty. The cash pool system exposes the Company to a single net amount with that financial counterparty rather than the gross amount of several current accounts and bank overdraft balances with multiple financial counterparties. From an operational perspective, the balances in the cash pool are netted. However, under the guidance of IAS 32 regarding the offsetting of debit and credit balances for financial reporting purposes, these balances have to be presented on a gross basis on the balance sheet (see Notes 20 and 27).
Financial statements Other informationStrategic Report Governance Financial performance AppendixGovernance RemunerationOur business Performance review Ahold Delhaize Annual Report 2019 168
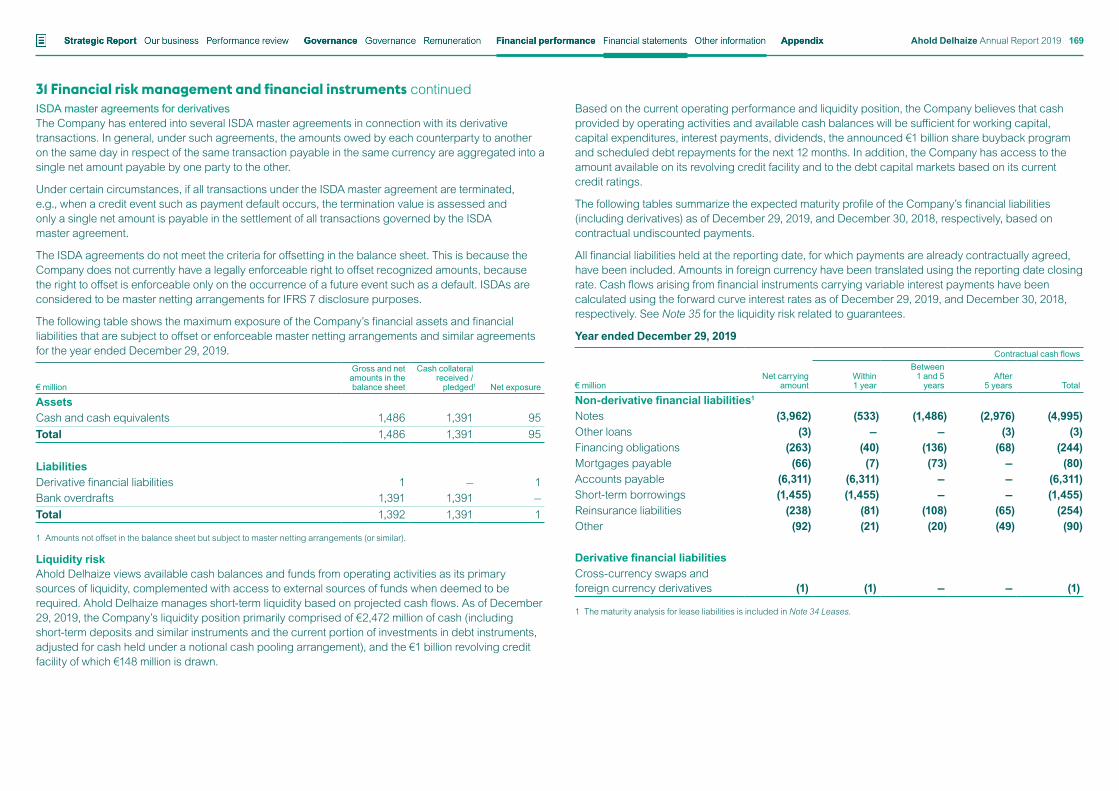
31 Financial risk management and financial instruments continuedISDA master agreements for derivativesThe Company has entered into several ISDA master agreements in connection with its derivative transactions. In general, under such agreements, the amounts owed by each counterparty to another on the same day in respect of the same transaction payable in the same currency are aggregated into a single net amount payable by one party to the other.
Under certain circumstances, if all transactions under the ISDA master agreement are terminated, e.g., when a credit event such as payment default occurs, the termination value is assessed and only a single net amount is payable in the settlement of all transactions governed by the ISDA master agreement.
The ISDA agreements do not meet the criteria for offsetting in the balance sheet. This is because the Company does not currently have a legally enforceable right to offset recognized amounts, because the right to offset is enforceable only on the occurrence of a future event such as a default. ISDAs are considered to be master netting arrangements for IFRS 7 disclosure purposes.
The following table shows the maximum exposure of the Company’s financial assets and financial liabilities that are subject to offset or enforceable master netting arrangements and similar agreements for the year ended December 29, 2019.
€ million
Gross and net amounts in the balance sheet
Cash collateral received /
pledged1 Net exposure
AssetsCash and cash equivalents 1,486 1,391 95Total 1,486 1,391 95
LiabilitiesDerivative financial liabilities 1 — 1Bank overdrafts 1,391 1,391 —Total 1,392 1,391 1
1 Amounts not offset in the balance sheet but subject to master netting arrangements (or similar).
Liquidity risk Ahold Delhaize views available cash balances and funds from operating activities as its primary sources of liquidity, complemented with access to external sources of funds when deemed to be required. Ahold Delhaize manages short-term liquidity based on projected cash flows. As of December 29, 2019, the Company’s liquidity position primarily comprised of €2,472 million of cash (including short-term deposits and similar instruments and the current portion of investments in debt instruments, adjusted for cash held under a notional cash pooling arrangement), and the €1 billion revolving credit facility of which €148 million is drawn.
Based on the current operating performance and liquidity position, the Company believes that cash provided by operating activities and available cash balances will be sufficient for working capital, capital expenditures, interest payments, dividends, the announced €1 billion share buyback program and scheduled debt repayments for the next 12 months. In addition, the Company has access to the amount available on its revolving credit facility and to the debt capital markets based on its current credit ratings.
The following tables summarize the expected maturity profile of the Company’s financial liabilities (including derivatives) as of December 29, 2019, and December 30, 2018, respectively, based on contractual undiscounted payments.
All financial liabilities held at the reporting date, for which payments are already contractually agreed, have been included. Amounts in foreign currency have been translated using the reporting date closing rate. Cash flows arising from financial instruments carrying variable interest payments have been calculated using the forward curve interest rates as of December 29, 2019, and December 30, 2018, respectively. See Note 35 for the liquidity risk related to guarantees.
Year ended December 29, 2019
€ millionNet carrying
amount
Contractual cash flows
Within 1 year
Between 1 and 5
yearsAfter
5 years Total
Non-derivative financial liabilities1
Notes (3,962) (533) (1,486) (2,976) (4,995)Other loans (3) — — (3) (3)Financing obligations (263) (40) (136) (68) (244)Mortgages payable (66) (7) (73) — (80)Accounts payable (6,311) (6,311) — — (6,311)Short-term borrowings (1,455) (1,455) — — (1,455)Reinsurance liabilities (238) (81) (108) (65) (254)Other (92) (21) (20) (49) (90)
Derivative financial liabilitiesCross-currency swaps and foreign currency derivatives (1) (1) — — (1)
1 The maturity analysis for lease liabilities is included in Note 34 Leases.
Financial statements Other informationStrategic Report Governance Financial performance AppendixGovernance RemunerationOur business Performance review Ahold Delhaize Annual Report 2019 169
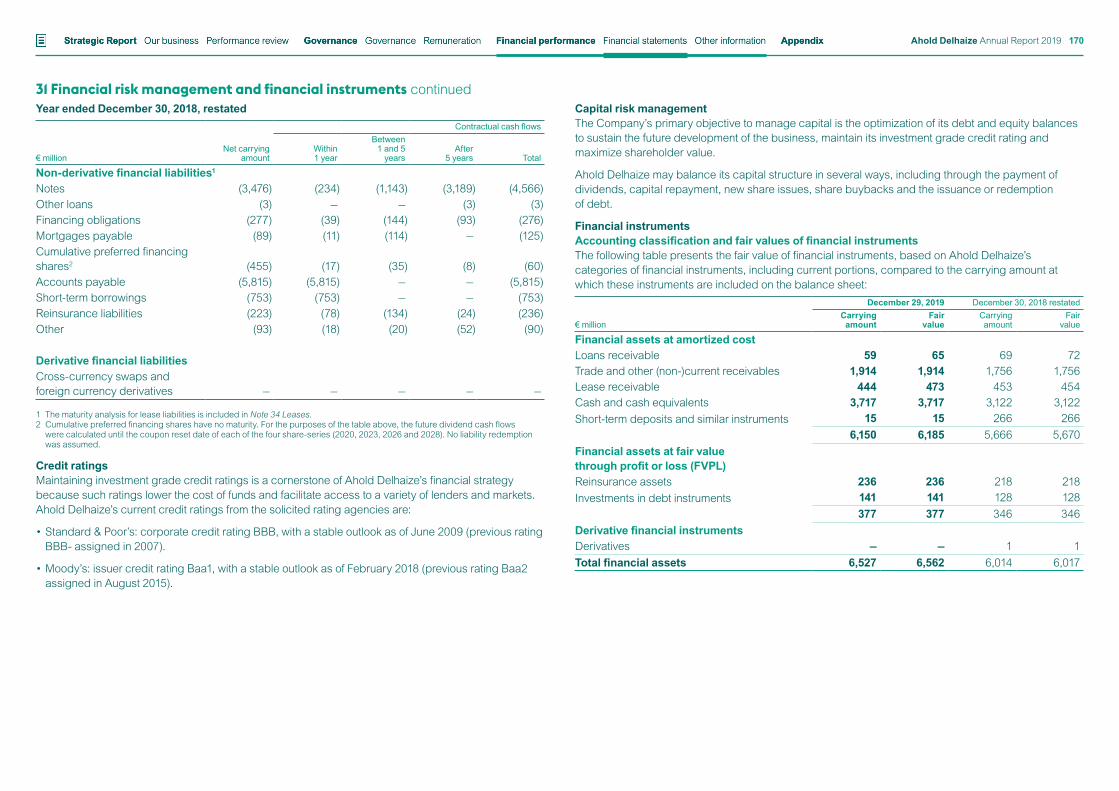
31 Financial risk management and financial instruments continuedYear ended December 30, 2018, restated
€ millionNet carrying
amount
Contractual cash flows
Within 1 year
Between 1 and 5
yearsAfter
5 years Total
Non-derivative financial liabilities1
Notes (3,476) (234) (1,143) (3,189) (4,566)Other loans (3) — — (3) (3)Financing obligations (277) (39) (144) (93) (276)Mortgages payable (89) (11) (114) — (125)Cumulative preferred financing shares2 (455) (17) (35) (8) (60)Accounts payable (5,815) (5,815) — — (5,815)Short-term borrowings (753) (753) — — (753)Reinsurance liabilities (223) (78) (134) (24) (236)Other (93) (18) (20) (52) (90)
Derivative financial liabilitiesCross-currency swaps and foreign currency derivatives — — — — —
1 The maturity analysis for lease liabilities is included in Note 34 Leases.2 Cumulative preferred financing shares have no maturity. For the purposes of the table above, the future dividend cash flows
were calculated until the coupon reset date of each of the four share-series (2020, 2023, 2026 and 2028). No liability redemption was assumed.
Credit ratingsMaintaining investment grade credit ratings is a cornerstone of Ahold Delhaize’s financial strategy because such ratings lower the cost of funds and facilitate access to a variety of lenders and markets. Ahold Delhaize’s current credit ratings from the solicited rating agencies are:
• Standard & Poor’s: corporate credit rating BBB, with a stable outlook as of June 2009 (previous rating BBB- assigned in 2007).
• Moody’s: issuer credit rating Baa1, with a stable outlook as of February 2018 (previous rating Baa2 assigned in August 2015).
Capital risk managementThe Company’s primary objective to manage capital is the optimization of its debt and equity balances to sustain the future development of the business, maintain its investment grade credit rating and maximize shareholder value.
Ahold Delhaize may balance its capital structure in several ways, including through the payment of dividends, capital repayment, new share issues, share buybacks and the issuance or redemption of debt.
Financial instrumentsAccounting classification and fair values of financial instrumentsThe following table presents the fair value of financial instruments, based on Ahold Delhaize’s categories of financial instruments, including current portions, compared to the carrying amount at which these instruments are included on the balance sheet:
€ million
December 29, 2019 December 30, 2018 restatedCarrying amount
Fair value
Carrying amount
Fair value
Financial assets at amortized costLoans receivable 59 65 69 72Trade and other (non-)current receivables 1,914 1,914 1,756 1,756Lease receivable 444 473 453 454Cash and cash equivalents 3,717 3,717 3,122 3,122Short-term deposits and similar instruments 15 15 266 266
6,150 6,185 5,666 5,670Financial assets at fair value through profit or loss (FVPL)Reinsurance assets 236 236 218 218Investments in debt instruments 141 141 128 128
377 377 346 346Derivative financial instrumentsDerivatives — — 1 1Total financial assets 6,527 6,562 6,014 6,017
Financial statements Other informationStrategic Report Governance Financial performance AppendixGovernance RemunerationOur business Performance review Ahold Delhaize Annual Report 2019 170
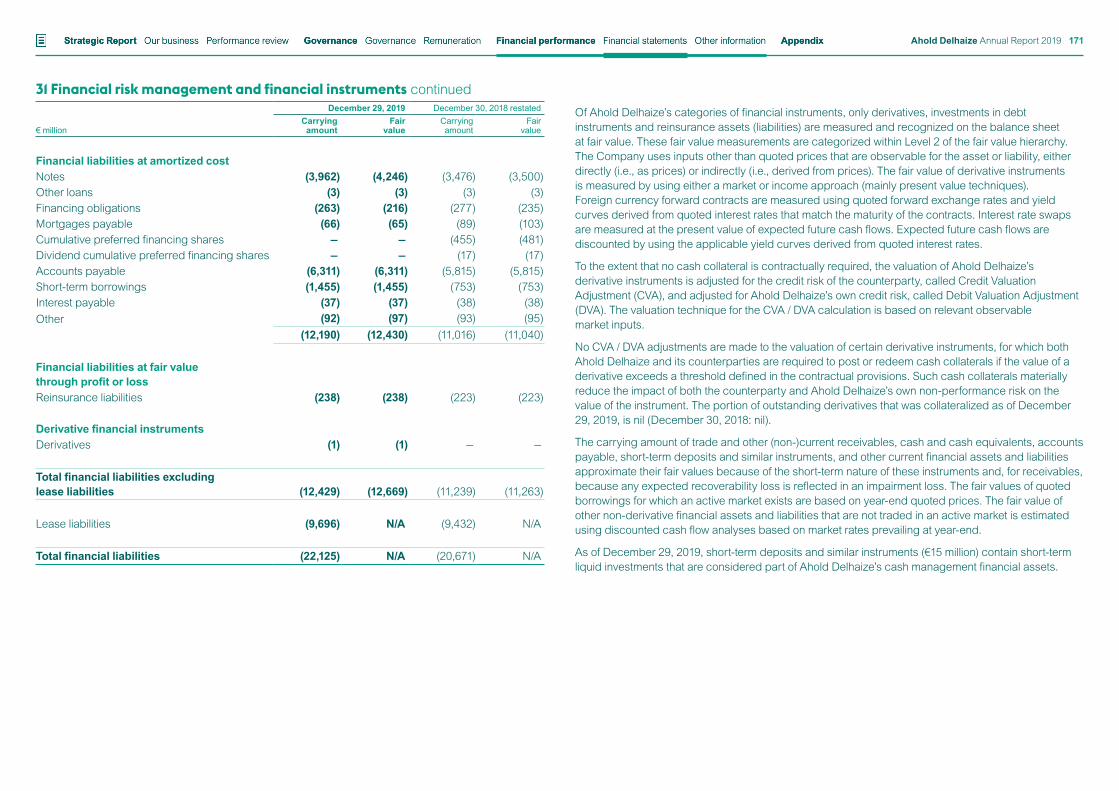
31 Financial risk management and financial instruments continued € million
December 29, 2019 December 30, 2018 restatedCarrying amount
Fair value
Carrying amount
Fair value
Financial liabilities at amortized costNotes (3,962) (4,246) (3,476) (3,500)Other loans (3) (3) (3) (3)Financing obligations (263) (216) (277) (235)Mortgages payable (66) (65) (89) (103)Cumulative preferred financing shares — — (455) (481)Dividend cumulative preferred financing shares — — (17) (17)Accounts payable (6,311) (6,311) (5,815) (5,815)Short-term borrowings (1,455) (1,455) (753) (753)Interest payable (37) (37) (38) (38)Other (92) (97) (93) (95)
(12,190) (12,430) (11,016) (11,040)
Financial liabilities at fair value through profit or lossReinsurance liabilities (238) (238) (223) (223)
Derivative financial instrumentsDerivatives (1) (1) — —
Total financial liabilities excluding lease liabilities (12,429) (12,669) (11,239) (11,263)
Lease liabilities (9,696) N/A (9,432) N/A
Total financial liabilities (22,125) N/A (20,671) N/A
Of Ahold Delhaize’s categories of financial instruments, only derivatives, investments in debt instruments and reinsurance assets (liabilities) are measured and recognized on the balance sheet at fair value. These fair value measurements are categorized within Level 2 of the fair value hierarchy. The Company uses inputs other than quoted prices that are observable for the asset or liability, either directly (i.e., as prices) or indirectly (i.e., derived from prices). The fair value of derivative instruments is measured by using either a market or income approach (mainly present value techniques). Foreign currency forward contracts are measured using quoted forward exchange rates and yield curves derived from quoted interest rates that match the maturity of the contracts. Interest rate swaps are measured at the present value of expected future cash flows. Expected future cash flows are discounted by using the applicable yield curves derived from quoted interest rates.
To the extent that no cash collateral is contractually required, the valuation of Ahold Delhaize’s derivative instruments is adjusted for the credit risk of the counterparty, called Credit Valuation Adjustment (CVA), and adjusted for Ahold Delhaize’s own credit risk, called Debit Valuation Adjustment (DVA). The valuation technique for the CVA / DVA calculation is based on relevant observable market inputs.
No CVA / DVA adjustments are made to the valuation of certain derivative instruments, for which both Ahold Delhaize and its counterparties are required to post or redeem cash collaterals if the value of a derivative exceeds a threshold defined in the contractual provisions. Such cash collaterals materially reduce the impact of both the counterparty and Ahold Delhaize’s own non-performance risk on the value of the instrument. The portion of outstanding derivatives that was collateralized as of December 29, 2019, is nil (December 30, 2018: nil).
The carrying amount of trade and other (non-)current receivables, cash and cash equivalents, accounts payable, short-term deposits and similar instruments, and other current financial assets and liabilities approximate their fair values because of the short-term nature of these instruments and, for receivables, because any expected recoverability loss is reflected in an impairment loss. The fair values of quoted borrowings for which an active market exists are based on year-end quoted prices. The fair value of other non-derivative financial assets and liabilities that are not traded in an active market is estimated using discounted cash flow analyses based on market rates prevailing at year-end.
As of December 29, 2019, short-term deposits and similar instruments (€15 million) contain short-term liquid investments that are considered part of Ahold Delhaize’s cash management financial assets.
Financial statements Other informationStrategic Report Governance Financial performance AppendixGovernance RemunerationOur business Performance review Ahold Delhaize Annual Report 2019 171
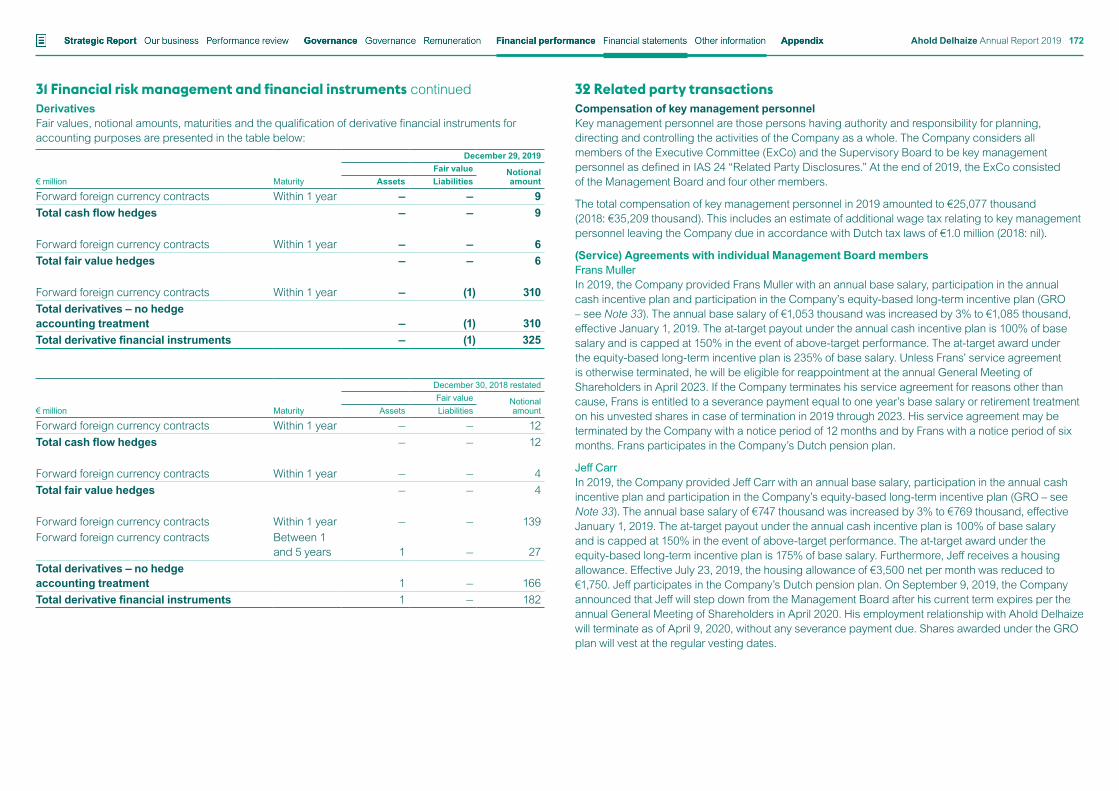
31 Financial risk management and financial instruments continuedDerivativesFair values, notional amounts, maturities and the qualification of derivative financial instruments for accounting purposes are presented in the table below:
€ million Maturity
December 29, 2019Fair value Notional
amountAssets Liabilities
Forward foreign currency contracts Within 1 year — — 9Total cash flow hedges — — 9
Forward foreign currency contracts Within 1 year — — 6Total fair value hedges — — 6
Forward foreign currency contracts Within 1 year — (1) 310Total derivatives – no hedge accounting treatment — (1) 310Total derivative financial instruments — (1) 325
€ million Maturity
December 30, 2018 restatedFair value Notional
amountAssets Liabilities
Forward foreign currency contracts Within 1 year — — 12Total cash flow hedges — — 12
Forward foreign currency contracts Within 1 year — — 4Total fair value hedges — — 4
Forward foreign currency contracts Within 1 year — — 139Forward foreign currency contracts Between 1
and 5 years 1 — 27Total derivatives – no hedge accounting treatment 1 — 166Total derivative financial instruments 1 — 182
32 Related party transactionsCompensation of key management personnelKey management personnel are those persons having authority and responsibility for planning, directing and controlling the activities of the Company as a whole. The Company considers all members of the Executive Committee (ExCo) and the Supervisory Board to be key management personnel as defined in IAS 24 “Related Party Disclosures.” At the end of 2019, the ExCo consisted of the Management Board and four other members.
The total compensation of key management personnel in 2019 amounted to €25,077 thousand (2018: €35,209 thousand). This includes an estimate of additional wage tax relating to key management personnel leaving the Company due in accordance with Dutch tax laws of €1.0 million (2018: nil).
(Service) Agreements with individual Management Board membersFrans MullerIn 2019, the Company provided Frans Muller with an annual base salary, participation in the annual cash incentive plan and participation in the Company’s equity-based long-term incentive plan (GRO – see Note 33). The annual base salary of €1,053 thousand was increased by 3% to €1,085 thousand, effective January 1, 2019. The at-target payout under the annual cash incentive plan is 100% of base salary and is capped at 150% in the event of above-target performance. The at-target award under the equity-based long-term incentive plan is 235% of base salary. Unless Frans’ service agreement is otherwise terminated, he will be eligible for reappointment at the annual General Meeting of Shareholders in April 2023. If the Company terminates his service agreement for reasons other than cause, Frans is entitled to a severance payment equal to one year’s base salary or retirement treatment on his unvested shares in case of termination in 2019 through 2023. His service agreement may be terminated by the Company with a notice period of 12 months and by Frans with a notice period of six months. Frans participates in the Company’s Dutch pension plan.
Jeff CarrIn 2019, the Company provided Jeff Carr with an annual base salary, participation in the annual cash incentive plan and participation in the Company’s equity-based long-term incentive plan (GRO – see Note 33). The annual base salary of €747 thousand was increased by 3% to €769 thousand, effective January 1, 2019. The at-target payout under the annual cash incentive plan is 100% of base salary and is capped at 150% in the event of above-target performance. The at-target award under the equity-based long-term incentive plan is 175% of base salary. Furthermore, Jeff receives a housing allowance. Effective July 23, 2019, the housing allowance of €3,500 net per month was reduced to €1,750. Jeff participates in the Company’s Dutch pension plan. On September 9, 2019, the Company announced that Jeff will step down from the Management Board after his current term expires per the annual General Meeting of Shareholders in April 2020. His employment relationship with Ahold Delhaize will terminate as of April 9, 2020, without any severance payment due. Shares awarded under the GRO plan will vest at the regular vesting dates.
Financial statements Other informationStrategic Report Governance Financial performance AppendixGovernance RemunerationOur business Performance review Ahold Delhaize Annual Report 2019 172
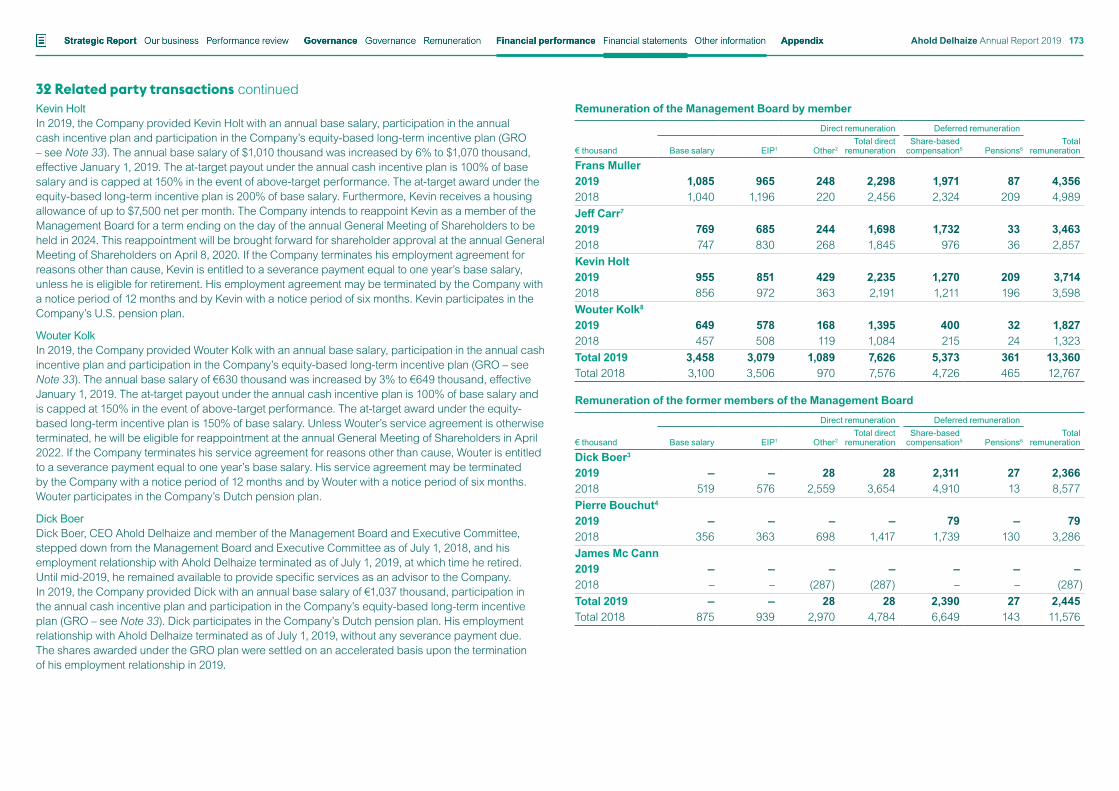
32 Related party transactions continuedKevin HoltIn 2019, the Company provided Kevin Holt with an annual base salary, participation in the annual cash incentive plan and participation in the Company’s equity-based long-term incentive plan (GRO – see Note 33). The annual base salary of $1,010 thousand was increased by 6% to $1,070 thousand, effective January 1, 2019. The at-target payout under the annual cash incentive plan is 100% of base salary and is capped at 150% in the event of above-target performance. The at-target award under the equity-based long-term incentive plan is 200% of base salary. Furthermore, Kevin receives a housing allowance of up to $7,500 net per month. The Company intends to reappoint Kevin as a member of the Management Board for a term ending on the day of the annual General Meeting of Shareholders to be held in 2024. This reappointment will be brought forward for shareholder approval at the annual General Meeting of Shareholders on April 8, 2020. If the Company terminates his employment agreement for reasons other than cause, Kevin is entitled to a severance payment equal to one year’s base salary, unless he is eligible for retirement. His employment agreement may be terminated by the Company with a notice period of 12 months and by Kevin with a notice period of six months. Kevin participates in the Company’s U.S. pension plan.
Wouter KolkIn 2019, the Company provided Wouter Kolk with an annual base salary, participation in the annual cash incentive plan and participation in the Company’s equity-based long-term incentive plan (GRO – see Note 33). The annual base salary of €630 thousand was increased by 3% to €649 thousand, effective January 1, 2019. The at-target payout under the annual cash incentive plan is 100% of base salary and is capped at 150% in the event of above-target performance. The at-target award under the equity-based long-term incentive plan is 150% of base salary. Unless Wouter’s service agreement is otherwise terminated, he will be eligible for reappointment at the annual General Meeting of Shareholders in April 2022. If the Company terminates his service agreement for reasons other than cause, Wouter is entitled to a severance payment equal to one year’s base salary. His service agreement may be terminated by the Company with a notice period of 12 months and by Wouter with a notice period of six months. Wouter participates in the Company’s Dutch pension plan.
Dick BoerDick Boer, CEO Ahold Delhaize and member of the Management Board and Executive Committee, stepped down from the Management Board and Executive Committee as of July 1, 2018, and his employment relationship with Ahold Delhaize terminated as of July 1, 2019, at which time he retired. Until mid-2019, he remained available to provide specific services as an advisor to the Company. In 2019, the Company provided Dick with an annual base salary of €1,037 thousand, participation in the annual cash incentive plan and participation in the Company’s equity-based long-term incentive plan (GRO – see Note 33). Dick participates in the Company’s Dutch pension plan. His employment relationship with Ahold Delhaize terminated as of July 1, 2019, without any severance payment due. The shares awarded under the GRO plan were settled on an accelerated basis upon the termination of his employment relationship in 2019.
Remuneration of the Management Board by member
€ thousand
Direct remuneration Deferred remuneration
Base salary EIP1 Other2Total direct
remunerationShare-based
compensation5 Pensions6Total
remuneration
Frans Muller2019 1,085 965 248 2,298 1,971 87 4,3562018 1,040 1,196 220 2,456 2,324 209 4,989Jeff Carr7
2019 769 685 244 1,698 1,732 33 3,4632018 747 830 268 1,845 976 36 2,857Kevin Holt2019 955 851 429 2,235 1,270 209 3,7142018 856 972 363 2,191 1,211 196 3,598Wouter Kolk8
2019 649 578 168 1,395 400 32 1,8272018 457 508 119 1,084 215 24 1,323Total 2019 3,458 3,079 1,089 7,626 5,373 361 13,360Total 2018 3,100 3,506 970 7,576 4,726 465 12,767
Remuneration of the former members of the Management Board
€ thousand
Direct remuneration Deferred remuneration
Base salary EIP1 Other2Total direct
remunerationShare-based
compensation5 Pensions6Total
remuneration
Dick Boer3
2019 — — 28 28 2,311 27 2,3662018 519 576 2,559 3,654 4,910 13 8,577Pierre Bouchut4
2019 — — – — 79 — 792018 356 363 698 1,417 1,739 130 3,286James Mc Cann2019 — — – — – — –2018 – – (287) (287) – – (287)Total 2019 — — 28 28 2,390 27 2,445Total 2018 875 939 2,970 4,784 6,649 143 11,576
Financial statements Other informationStrategic Report Governance Financial performance AppendixGovernance RemunerationOur business Performance review Ahold Delhaize Annual Report 2019 173
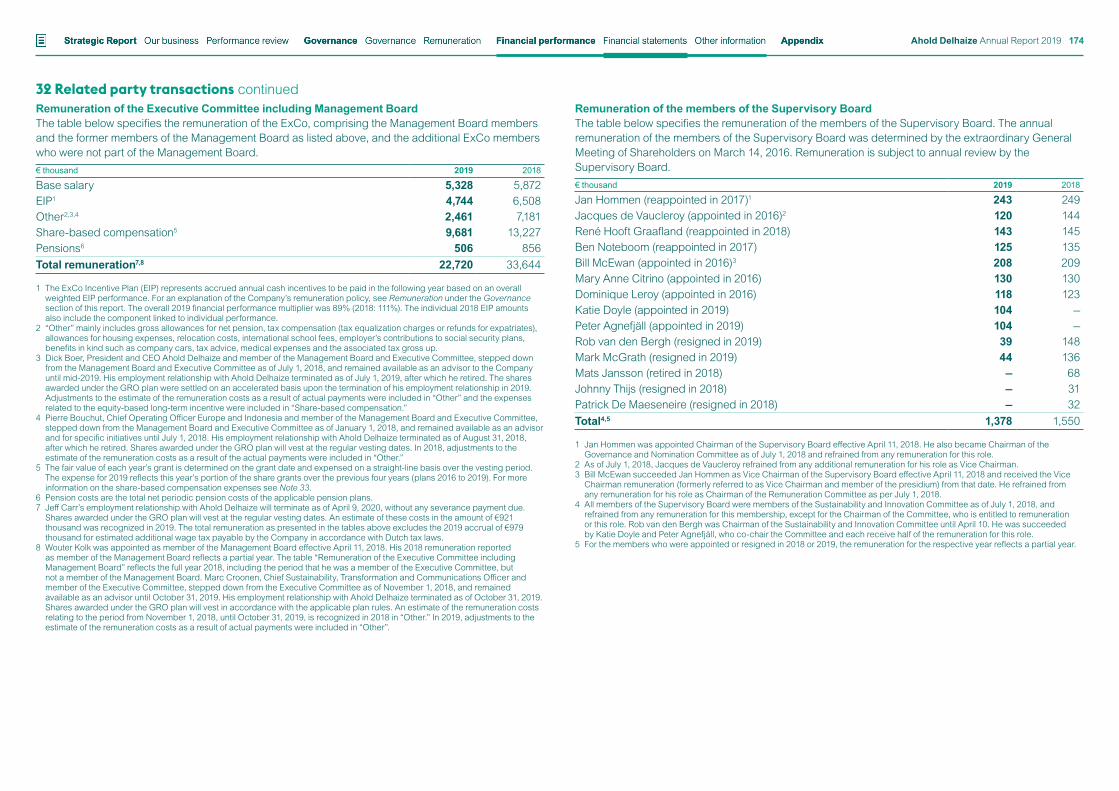
32 Related party transactions continuedRemuneration of the Executive Committee including Management BoardThe table below specifies the remuneration of the ExCo, comprising the Management Board members and the former members of the Management Board as listed above, and the additional ExCo members who were not part of the Management Board. € thousand 2019 2018
Base salary 5,328 5,872EIP1 4,744 6,508Other2,3,4 2,461 7,181Share-based compensation5 9,681 13,227Pensions6 506 856Total remuneration7,8 22,720 33,644
1 The ExCo Incentive Plan (EIP) represents accrued annual cash incentives to be paid in the following year based on an overall weighted EIP performance. For an explanation of the Company’s remuneration policy, see Remuneration under the Governance section of this report. The overall 2019 financial performance multiplier was 89% (2018: 111%). The individual 2018 EIP amounts also include the component linked to individual performance.
2 “Other” mainly includes gross allowances for net pension, tax compensation (tax equalization charges or refunds for expatriates), allowances for housing expenses, relocation costs, international school fees, employer’s contributions to social security plans, benefits in kind such as company cars, tax advice, medical expenses and the associated tax gross up.
3 Dick Boer, President and CEO Ahold Delhaize and member of the Management Board and Executive Committee, stepped down from the Management Board and Executive Committee as of July 1, 2018, and remained available as an advisor to the Company until mid-2019. His employment relationship with Ahold Delhaize terminated as of July 1, 2019, after which he retired. The shares awarded under the GRO plan were settled on an accelerated basis upon the termination of his employment relationship in 2019. Adjustments to the estimate of the remuneration costs as a result of actual payments were included in “Other” and the expenses related to the equity-based long-term incentive were included in “Share-based compensation.”
4 Pierre Bouchut, Chief Operating Officer Europe and Indonesia and member of the Management Board and Executive Committee, stepped down from the Management Board and Executive Committee as of January 1, 2018, and remained available as an advisor and for specific initiatives until July 1, 2018. His employment relationship with Ahold Delhaize terminated as of August 31, 2018, after which he retired. Shares awarded under the GRO plan will vest at the regular vesting dates. In 2018, adjustments to the estimate of the remuneration costs as a result of the actual payments were included in “Other.”
5 The fair value of each year’s grant is determined on the grant date and expensed on a straight-line basis over the vesting period. The expense for 2019 reflects this year’s portion of the share grants over the previous four years (plans 2016 to 2019). For more information on the share-based compensation expenses see Note 33.
6 Pension costs are the total net periodic pension costs of the applicable pension plans.7 Jeff Carr’s employment relationship with Ahold Delhaize will terminate as of April 9, 2020, without any severance payment due.
Shares awarded under the GRO plan will vest at the regular vesting dates. An estimate of these costs in the amount of €921 thousand was recognized in 2019. The total remuneration as presented in the tables above excludes the 2019 accrual of €979 thousand for estimated additional wage tax payable by the Company in accordance with Dutch tax laws.
8 Wouter Kolk was appointed as member of the Management Board effective April 11, 2018. His 2018 remuneration reported as member of the Management Board reflects a partial year. The table “Remuneration of the Executive Committee including Management Board” reflects the full year 2018, including the period that he was a member of the Executive Committee, but not a member of the Management Board. Marc Croonen, Chief Sustainability, Transformation and Communications Officer and member of the Executive Committee, stepped down from the Executive Committee as of November 1, 2018, and remained available as an advisor until October 31, 2019. His employment relationship with Ahold Delhaize terminated as of October 31, 2019. Shares awarded under the GRO plan will vest in accordance with the applicable plan rules. An estimate of the remuneration costs relating to the period from November 1, 2018, until October 31, 2019, is recognized in 2018 in “Other.” In 2019, adjustments to the estimate of the remuneration costs as a result of actual payments were included in “Other”.
Remuneration of the members of the Supervisory BoardThe table below specifies the remuneration of the members of the Supervisory Board. The annual remuneration of the members of the Supervisory Board was determined by the extraordinary General Meeting of Shareholders on March 14, 2016. Remuneration is subject to annual review by the Supervisory Board. € thousand 2019 2018
Jan Hommen (reappointed in 2017)1 243 249Jacques de Vaucleroy (appointed in 2016)2 120 144René Hooft Graafland (reappointed in 2018) 143 145Ben Noteboom (reappointed in 2017) 125 135Bill McEwan (appointed in 2016)3 208 209Mary Anne Citrino (appointed in 2016) 130 130Dominique Leroy (appointed in 2016) 118 123Katie Doyle (appointed in 2019) 104 —Peter Agnefjäll (appointed in 2019) 104 —Rob van den Bergh (resigned in 2019) 39 148Mark McGrath (resigned in 2019) 44 136Mats Jansson (retired in 2018) — 68Johnny Thijs (resigned in 2018) — 31Patrick De Maeseneire (resigned in 2018) — 32Total4,5 1,378 1,550
1 Jan Hommen was appointed Chairman of the Supervisory Board effective April 11, 2018. He also became Chairman of the Governance and Nomination Committee as of July 1, 2018 and refrained from any remuneration for this role.
2 As of July 1, 2018, Jacques de Vaucleroy refrained from any additional remuneration for his role as Vice Chairman.3 Bill McEwan succeeded Jan Hommen as Vice Chairman of the Supervisory Board effective April 11, 2018 and received the Vice
Chairman remuneration (formerly referred to as Vice Chairman and member of the presidium) from that date. He refrained from any remuneration for his role as Chairman of the Remuneration Committee as per July 1, 2018.
4 All members of the Supervisory Board were members of the Sustainability and Innovation Committee as of July 1, 2018, and refrained from any remuneration for this membership, except for the Chairman of the Committee, who is entitled to remuneration or this role. Rob van den Bergh was Chairman of the Sustainability and Innovation Committee until April 10. He was succeeded by Katie Doyle and Peter Agnefjäll, who co-chair the Committee and each receive half of the remuneration for this role.
5 For the members who were appointed or resigned in 2018 or 2019, the remuneration for the respective year reflects a partial year.
Financial statements Other informationStrategic Report Governance Financial performance AppendixGovernance RemunerationOur business Performance review Ahold Delhaize Annual Report 2019 174
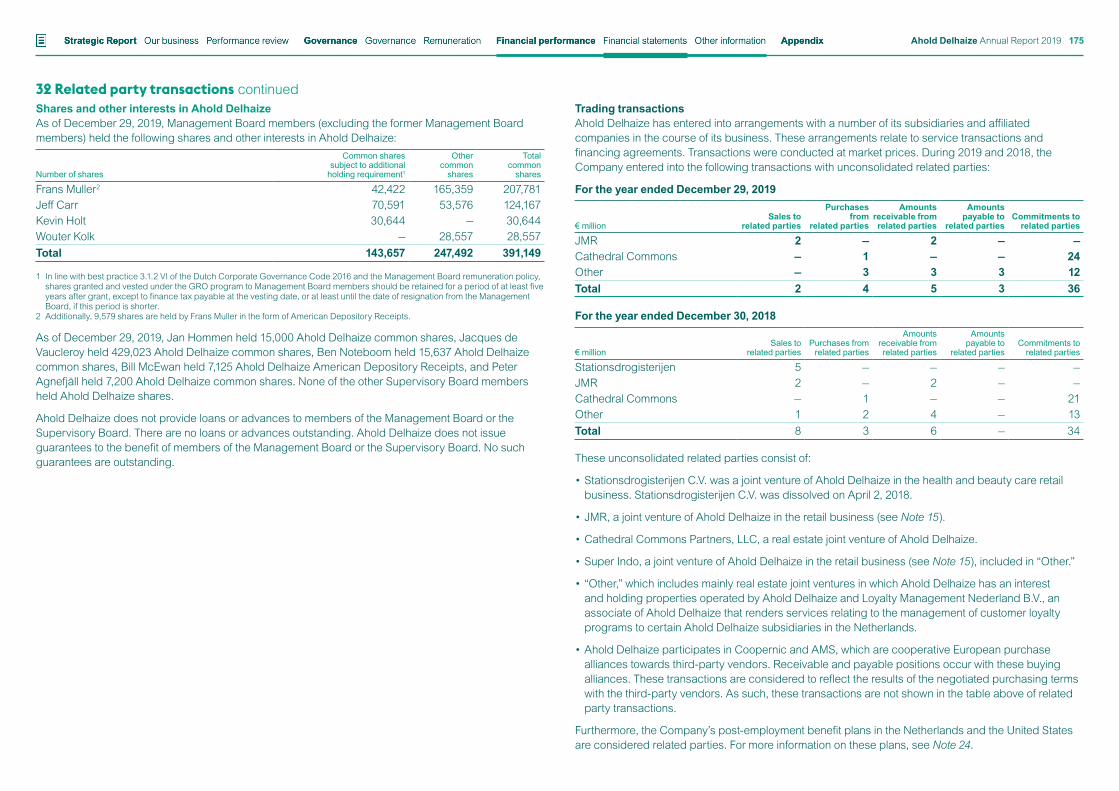
32 Related party transactions continuedShares and other interests in Ahold DelhaizeAs of December 29, 2019, Management Board members (excluding the former Management Board members) held the following shares and other interests in Ahold Delhaize:
Number of shares
Common shares subject to additional
holding requirement1
Other common
shares
Total common
shares
Frans Muller2 42,422 165,359 207,781Jeff Carr 70,591 53,576 124,167Kevin Holt 30,644 — 30,644Wouter Kolk — 28,557 28,557Total 143,657 247,492 391,149
1 In line with best practice 3.1.2 VI of the Dutch Corporate Governance Code 2016 and the Management Board remuneration policy, shares granted and vested under the GRO program to Management Board members should be retained for a period of at least five years after grant, except to finance tax payable at the vesting date, or at least until the date of resignation from the Management Board, if this period is shorter.
2 Additionally, 9,579 shares are held by Frans Muller in the form of American Depository Receipts.
As of December 29, 2019, Jan Hommen held 15,000 Ahold Delhaize common shares, Jacques de Vaucleroy held 429,023 Ahold Delhaize common shares, Ben Noteboom held 15,637 Ahold Delhaize common shares, Bill McEwan held 7,125 Ahold Delhaize American Depository Receipts, and Peter Agnefjäll held 7,200 Ahold Delhaize common shares. None of the other Supervisory Board members held Ahold Delhaize shares.
Ahold Delhaize does not provide loans or advances to members of the Management Board or the Supervisory Board. There are no loans or advances outstanding. Ahold Delhaize does not issue guarantees to the benefit of members of the Management Board or the Supervisory Board. No such guarantees are outstanding.
Trading transactionsAhold Delhaize has entered into arrangements with a number of its subsidiaries and affiliated companies in the course of its business. These arrangements relate to service transactions and financing agreements. Transactions were conducted at market prices. During 2019 and 2018, the Company entered into the following transactions with unconsolidated related parties:
For the year ended December 29, 2019
€ millionSales to
related parties
Purchases from
related parties
Amounts receivable from related parties
Amounts payable to
related partiesCommitments to
related parties
JMR 2 — 2 — —Cathedral Commons — 1 — — 24Other — 3 3 3 12Total 2 4 5 3 36
For the year ended December 30, 2018
€ millionSales to
related partiesPurchases from
related parties
Amounts receivable from related parties
Amounts payable to
related partiesCommitments to
related parties
Stationsdrogisterijen 5 — — — —JMR 2 — 2 — —Cathedral Commons — 1 — — 21Other 1 2 4 — 13Total 8 3 6 — 34
These unconsolidated related parties consist of:
• Stationsdrogisterijen C.V. was a joint venture of Ahold Delhaize in the health and beauty care retail business. Stationsdrogisterijen C.V. was dissolved on April 2, 2018.
• JMR, a joint venture of Ahold Delhaize in the retail business (see Note 15).
• Cathedral Commons Partners, LLC, a real estate joint venture of Ahold Delhaize.
• Super Indo, a joint venture of Ahold Delhaize in the retail business (see Note 15), included in “Other.”
• “Other,” which includes mainly real estate joint ventures in which Ahold Delhaize has an interest and holding properties operated by Ahold Delhaize and Loyalty Management Nederland B.V., an associate of Ahold Delhaize that renders services relating to the management of customer loyalty programs to certain Ahold Delhaize subsidiaries in the Netherlands.
• Ahold Delhaize participates in Coopernic and AMS, which are cooperative European purchase alliances towards third-party vendors. Receivable and payable positions occur with these buying alliances. These transactions are considered to reflect the results of the negotiated purchasing terms with the third-party vendors. As such, these transactions are not shown in the table above of related party transactions.
Furthermore, the Company’s post-employment benefit plans in the Netherlands and the United States are considered related parties. For more information on these plans, see Note 24.
Financial statements Other informationStrategic Report Governance Financial performance AppendixGovernance RemunerationOur business Performance review Ahold Delhaize Annual Report 2019 175
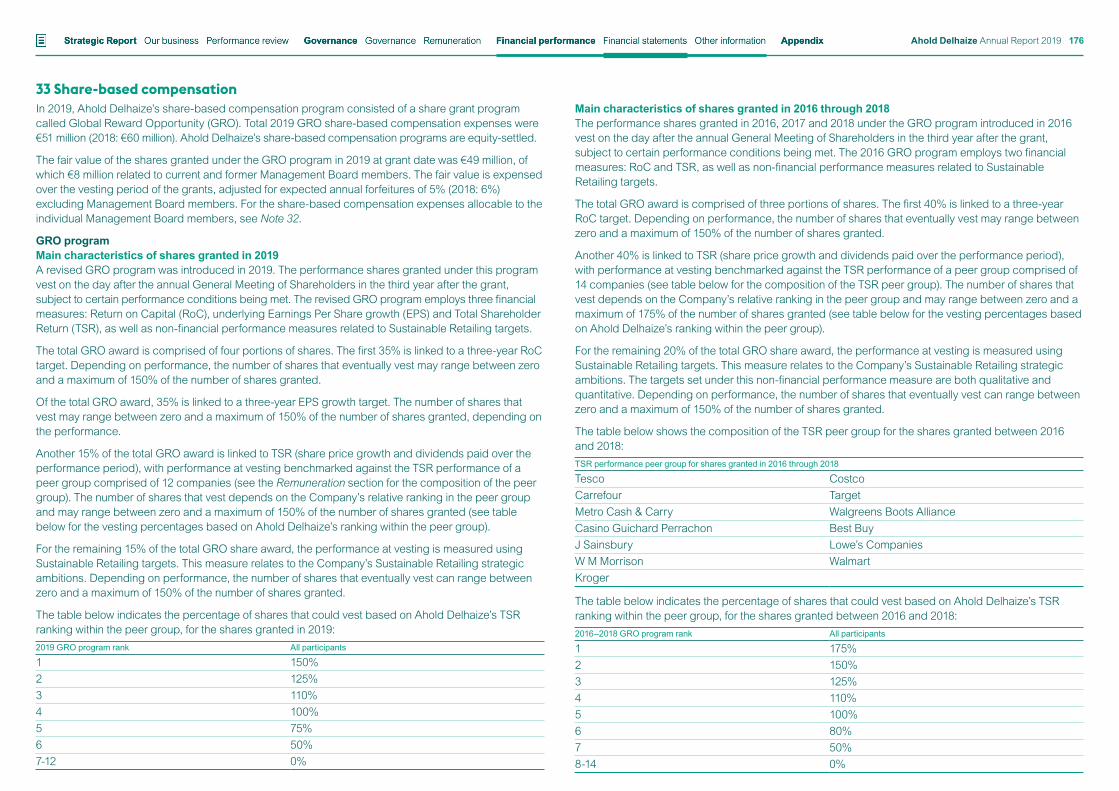
33 Share-based compensationIn 2019, Ahold Delhaize’s share-based compensation program consisted of a share grant program called Global Reward Opportunity (GRO). Total 2019 GRO share-based compensation expenses were €51 million (2018: €60 million). Ahold Delhaize’s share-based compensation programs are equity-settled.
The fair value of the shares granted under the GRO program in 2019 at grant date was €49 million, of which €8 million related to current and former Management Board members. The fair value is expensed over the vesting period of the grants, adjusted for expected annual forfeitures of 5% (2018: 6%) excluding Management Board members. For the share-based compensation expenses allocable to the individual Management Board members, see Note 32.
GRO programMain characteristics of shares granted in 2019A revised GRO program was introduced in 2019. The performance shares granted under this program vest on the day after the annual General Meeting of Shareholders in the third year after the grant, subject to certain performance conditions being met. The revised GRO program employs three financial measures: Return on Capital (RoC), underlying Earnings Per Share growth (EPS) and Total Shareholder Return (TSR), as well as non-financial performance measures related to Sustainable Retailing targets.
The total GRO award is comprised of four portions of shares. The first 35% is linked to a three-year RoC target. Depending on performance, the number of shares that eventually vest may range between zero and a maximum of 150% of the number of shares granted.
Of the total GRO award, 35% is linked to a three-year EPS growth target. The number of shares that vest may range between zero and a maximum of 150% of the number of shares granted, depending on the performance.
Another 15% of the total GRO award is linked to TSR (share price growth and dividends paid over the performance period), with performance at vesting benchmarked against the TSR performance of a peer group comprised of 12 companies (see the Remuneration section for the composition of the peer group). The number of shares that vest depends on the Company’s relative ranking in the peer group and may range between zero and a maximum of 150% of the number of shares granted (see table below for the vesting percentages based on Ahold Delhaize’s ranking within the peer group).
For the remaining 15% of the total GRO share award, the performance at vesting is measured using Sustainable Retailing targets. This measure relates to the Company’s Sustainable Retailing strategic ambitions. Depending on performance, the number of shares that eventually vest can range between zero and a maximum of 150% of the number of shares granted.
The table below indicates the percentage of shares that could vest based on Ahold Delhaize’s TSR ranking within the peer group, for the shares granted in 2019:2019 GRO program rank All participants
1 150%2 125%3 110%4 100%5 75%6 50%7-12 0%
Main characteristics of shares granted in 2016 through 2018The performance shares granted in 2016, 2017 and 2018 under the GRO program introduced in 2016 vest on the day after the annual General Meeting of Shareholders in the third year after the grant, subject to certain performance conditions being met. The 2016 GRO program employs two financial measures: RoC and TSR, as well as non-financial performance measures related to Sustainable Retailing targets.
The total GRO award is comprised of three portions of shares. The first 40% is linked to a three-year RoC target. Depending on performance, the number of shares that eventually vest may range between zero and a maximum of 150% of the number of shares granted.
Another 40% is linked to TSR (share price growth and dividends paid over the performance period), with performance at vesting benchmarked against the TSR performance of a peer group comprised of 14 companies (see table below for the composition of the TSR peer group). The number of shares that vest depends on the Company’s relative ranking in the peer group and may range between zero and a maximum of 175% of the number of shares granted (see table below for the vesting percentages based on Ahold Delhaize’s ranking within the peer group).
For the remaining 20% of the total GRO share award, the performance at vesting is measured using Sustainable Retailing targets. This measure relates to the Company’s Sustainable Retailing strategic ambitions. The targets set under this non-financial performance measure are both qualitative and quantitative. Depending on performance, the number of shares that eventually vest can range between zero and a maximum of 150% of the number of shares granted.
The table below shows the composition of the TSR peer group for the shares granted between 2016 and 2018:TSR performance peer group for shares granted in 2016 through 2018
Tesco CostcoCarrefour TargetMetro Cash & Carry Walgreens Boots AllianceCasino Guichard Perrachon Best BuyJ Sainsbury Lowe’s CompaniesW M Morrison WalmartKroger
The table below indicates the percentage of shares that could vest based on Ahold Delhaize’s TSR ranking within the peer group, for the shares granted between 2016 and 2018:2016–2018 GRO program rank All participants
1 175%2 150%3 125%4 110%5 100%6 80%7 50%8-14 0%
Financial statements Other informationStrategic Report Governance Financial performance AppendixGovernance RemunerationOur business Performance review Ahold Delhaize Annual Report 2019 176
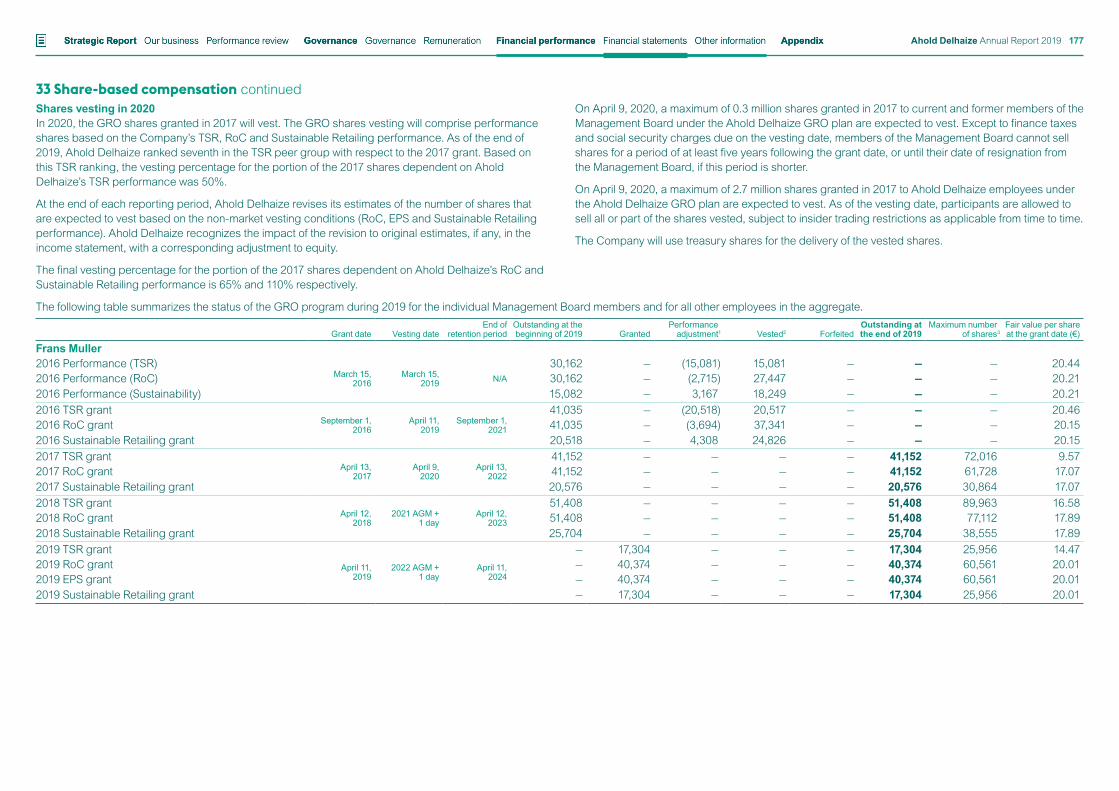
33 Share-based compensation continuedShares vesting in 2020In 2020, the GRO shares granted in 2017 will vest. The GRO shares vesting will comprise performance shares based on the Company’s TSR, RoC and Sustainable Retailing performance. As of the end of 2019, Ahold Delhaize ranked seventh in the TSR peer group with respect to the 2017 grant. Based on this TSR ranking, the vesting percentage for the portion of the 2017 shares dependent on Ahold Delhaize’s TSR performance was 50%.
At the end of each reporting period, Ahold Delhaize revises its estimates of the number of shares that are expected to vest based on the non-market vesting conditions (RoC, EPS and Sustainable Retailing performance). Ahold Delhaize recognizes the impact of the revision to original estimates, if any, in the income statement, with a corresponding adjustment to equity.
The final vesting percentage for the portion of the 2017 shares dependent on Ahold Delhaize’s RoC and Sustainable Retailing performance is 65% and 110% respectively.
On April 9, 2020, a maximum of 0.3 million shares granted in 2017 to current and former members of the Management Board under the Ahold Delhaize GRO plan are expected to vest. Except to finance taxes and social security charges due on the vesting date, members of the Management Board cannot sell shares for a period of at least five years following the grant date, or until their date of resignation from the Management Board, if this period is shorter.
On April 9, 2020, a maximum of 2.7 million shares granted in 2017 to Ahold Delhaize employees under the Ahold Delhaize GRO plan are expected to vest. As of the vesting date, participants are allowed to sell all or part of the shares vested, subject to insider trading restrictions as applicable from time to time.
The Company will use treasury shares for the delivery of the vested shares.
The following table summarizes the status of the GRO program during 2019 for the individual Management Board members and for all other employees in the aggregate.
Grant date Vesting dateEnd of
retention periodOutstanding at the beginning of 2019 Granted
Performance adjustment1 Vested2 Forfeited
Outstanding at the end of 2019
Maximum numberof shares3
Fair value per shareat the grant date (€)
Frans Muller2016 Performance (TSR)
March 15, 2016
March 15, 2019 N/A
30,162 — (15,081) 15,081 — — — 20.442016 Performance (RoC) 30,162 — (2,715) 27,447 — — — 20.212016 Performance (Sustainability) 15,082 — 3,167 18,249 — — — 20.212016 TSR grant
September 1, 2016
April 11, 2019
September 1, 2021
41,035 — (20,518) 20,517 — — — 20.462016 RoC grant 41,035 — (3,694) 37,341 — — — 20.152016 Sustainable Retailing grant 20,518 — 4,308 24,826 — — — 20.152017 TSR grant
April 13, 2017
April 9, 2020
April 13, 2022
41,152 — — — — 41,152 72,016 9.572017 RoC grant 41,152 — — — — 41,152 61,728 17.072017 Sustainable Retailing grant 20,576 — — — — 20,576 30,864 17.072018 TSR grant
April 12, 2018
2021 AGM + 1 day
April 12,2023
51,408 — — — — 51,408 89,963 16.582018 RoC grant 51,408 — — — — 51,408 77,112 17.892018 Sustainable Retailing grant 25,704 — — — — 25,704 38,555 17.892019 TSR grant
April 11, 2019
2022 AGM + 1 day
April 11, 2024
— 17,304 — — — 17,304 25,956 14.472019 RoC grant — 40,374 — — — 40,374 60,561 20.012019 EPS grant — 40,374 — — — 40,374 60,561 20.012019 Sustainable Retailing grant — 17,304 — — — 17,304 25,956 20.01
Financial statements Other informationStrategic Report Governance Financial performance AppendixGovernance RemunerationOur business Performance review Ahold Delhaize Annual Report 2019 177
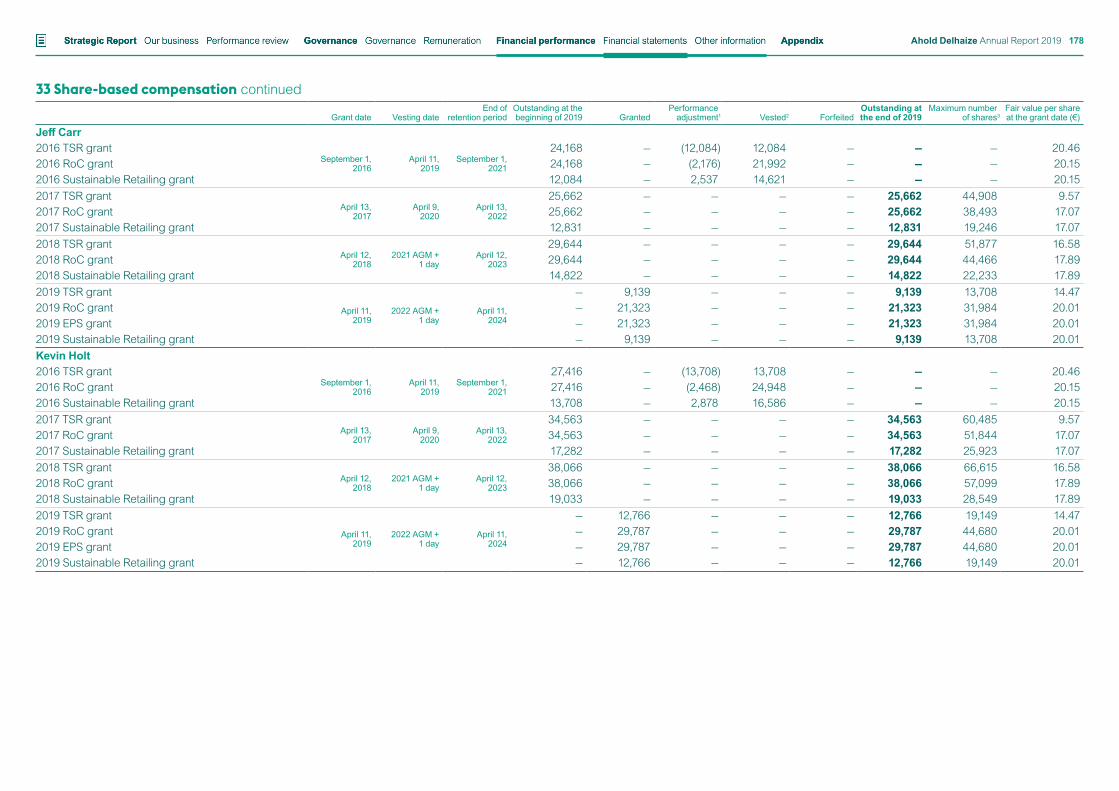
33 Share-based compensation continued
Grant date Vesting dateEnd of
retention periodOutstanding at the beginning of 2019 Granted
Performance adjustment1 Vested2 Forfeited
Outstanding at the end of 2019
Maximum numberof shares3
Fair value per shareat the grant date (€)
Jeff Carr2016 TSR grant
September 1, 2016
April 11, 2019
September 1, 2021
24,168 — (12,084) 12,084 — — — 20.462016 RoC grant 24,168 — (2,176) 21,992 — — — 20.152016 Sustainable Retailing grant 12,084 — 2,537 14,621 — — — 20.152017 TSR grant
April 13, 2017
April 9, 2020
April 13, 2022
25,662 — — — — 25,662 44,908 9.572017 RoC grant 25,662 — — — — 25,662 38,493 17.072017 Sustainable Retailing grant 12,831 — — — — 12,831 19,246 17.072018 TSR grant
April 12, 2018
2021 AGM + 1 day
April 12, 2023
29,644 — — — — 29,644 51,877 16.582018 RoC grant 29,644 — — — — 29,644 44,466 17.892018 Sustainable Retailing grant 14,822 — — — — 14,822 22,233 17.892019 TSR grant
April 11, 2019
2022 AGM + 1 day
April 11, 2024
— 9,139 — — — 9,139 13,708 14.472019 RoC grant — 21,323 — — — 21,323 31,984 20.012019 EPS grant — 21,323 — — — 21,323 31,984 20.012019 Sustainable Retailing grant — 9,139 — — — 9,139 13,708 20.01Kevin Holt2016 TSR grant
September 1, 2016
April 11, 2019
September 1, 2021
27,416 — (13,708) 13,708 — — — 20.462016 RoC grant 27,416 — (2,468) 24,948 — — — 20.152016 Sustainable Retailing grant 13,708 — 2,878 16,586 — — — 20.152017 TSR grant
April 13, 2017
April 9, 2020
April 13, 2022
34,563 — — — — 34,563 60,485 9.572017 RoC grant 34,563 — — — — 34,563 51,844 17.072017 Sustainable Retailing grant 17,282 — — — — 17,282 25,923 17.072018 TSR grant
April 12, 2018
2021 AGM + 1 day
April 12, 2023
38,066 — — — — 38,066 66,615 16.582018 RoC grant 38,066 — — — — 38,066 57,099 17.892018 Sustainable Retailing grant 19,033 — — — — 19,033 28,549 17.892019 TSR grant
April 11, 2019
2022 AGM + 1 day
April 11, 2024
— 12,766 — — — 12,766 19,149 14.472019 RoC grant — 29,787 — — — 29,787 44,680 20.012019 EPS grant — 29,787 — — — 29,787 44,680 20.012019 Sustainable Retailing grant — 12,766 — — — 12,766 19,149 20.01
Financial statements Other informationStrategic Report Governance Financial performance AppendixGovernance RemunerationOur business Performance review Ahold Delhaize Annual Report 2019 178
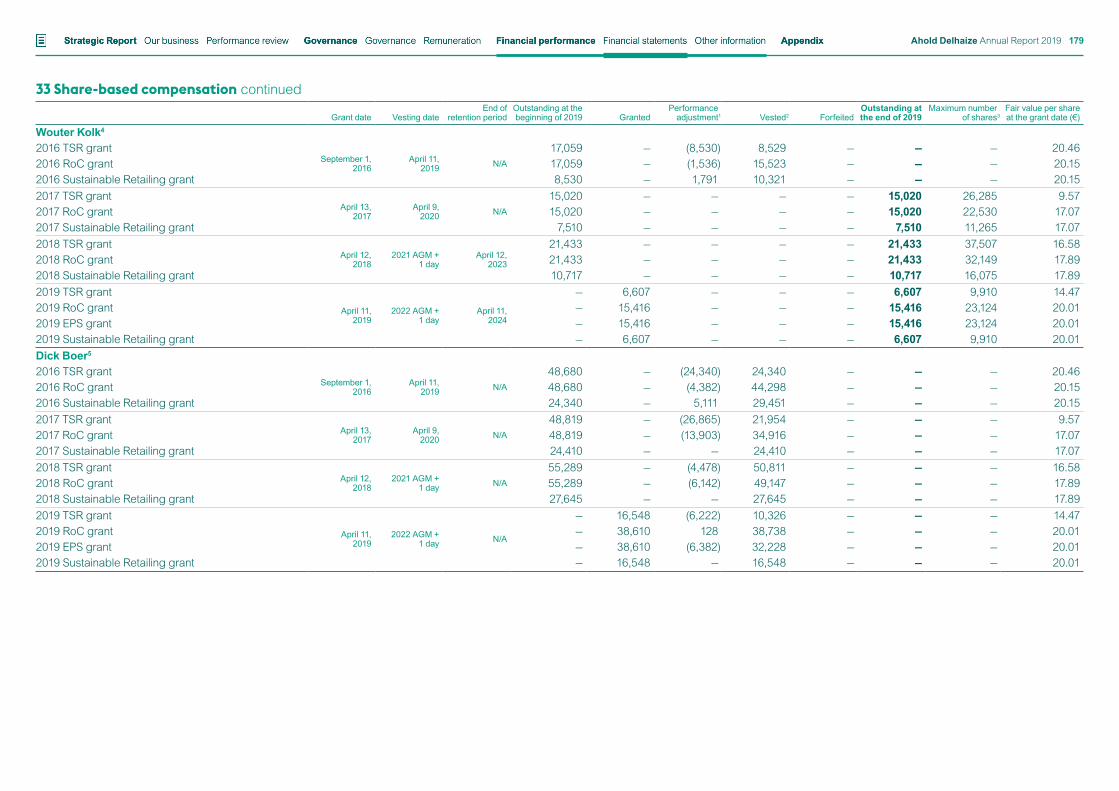
33 Share-based compensation continued
Grant date Vesting dateEnd of
retention periodOutstanding at the beginning of 2019 Granted
Performance adjustment1 Vested2 Forfeited
Outstanding at the end of 2019
Maximum numberof shares3
Fair value per shareat the grant date (€)
Wouter Kolk4
2016 TSR grantSeptember 1,
2016April 11,
2019 N/A
17,059 — (8,530) 8,529 — — — 20.462016 RoC grant 17,059 — (1,536) 15,523 — — — 20.152016 Sustainable Retailing grant 8,530 — 1,791 10,321 — — — 20.152017 TSR grant
April 13, 2017
April 9, 2020 N/A
15,020 — — — — 15,020 26,285 9.572017 RoC grant 15,020 — — — — 15,020 22,530 17.072017 Sustainable Retailing grant 7,510 — — — — 7,510 11,265 17.072018 TSR grant
April 12, 2018
2021 AGM + 1 day
April 12, 2023
21,433 — — — — 21,433 37,507 16.582018 RoC grant 21,433 — — — — 21,433 32,149 17.892018 Sustainable Retailing grant 10,717 — — — — 10,717 16,075 17.892019 TSR grant
April 11, 2019
2022 AGM + 1 day
April 11, 2024
— 6,607 — — — 6,607 9,910 14.472019 RoC grant — 15,416 — — — 15,416 23,124 20.012019 EPS grant — 15,416 — — — 15,416 23,124 20.012019 Sustainable Retailing grant — 6,607 — — — 6,607 9,910 20.01Dick Boer5
2016 TSR grantSeptember 1,
2016April 11,
2019 N/A
48,680 — (24,340) 24,340 — — — 20.462016 RoC grant 48,680 — (4,382) 44,298 — — — 20.152016 Sustainable Retailing grant 24,340 — 5,111 29,451 — — — 20.152017 TSR grant
April 13, 2017
April 9, 2020 N/A
48,819 — (26,865) 21,954 — — — 9.572017 RoC grant 48,819 — (13,903) 34,916 — — — 17.072017 Sustainable Retailing grant 24,410 — — 24,410 — — — 17.072018 TSR grant
April 12, 2018
2021 AGM + 1 day N/A
55,289 — (4,478) 50,811 — — — 16.582018 RoC grant 55,289 — (6,142) 49,147 — — — 17.892018 Sustainable Retailing grant 27,645 — — 27,645 — — — 17.892019 TSR grant
April 11, 2019
2022 AGM + 1 day N/A
— 16,548 (6,222) 10,326 — — — 14.472019 RoC grant — 38,610 128 38,738 — — — 20.012019 EPS grant — 38,610 (6,382) 32,228 — — — 20.012019 Sustainable Retailing grant — 16,548 — 16,548 — — — 20.01
Financial statements Other informationStrategic Report Governance Financial performance AppendixGovernance RemunerationOur business Performance review Ahold Delhaize Annual Report 2019 179
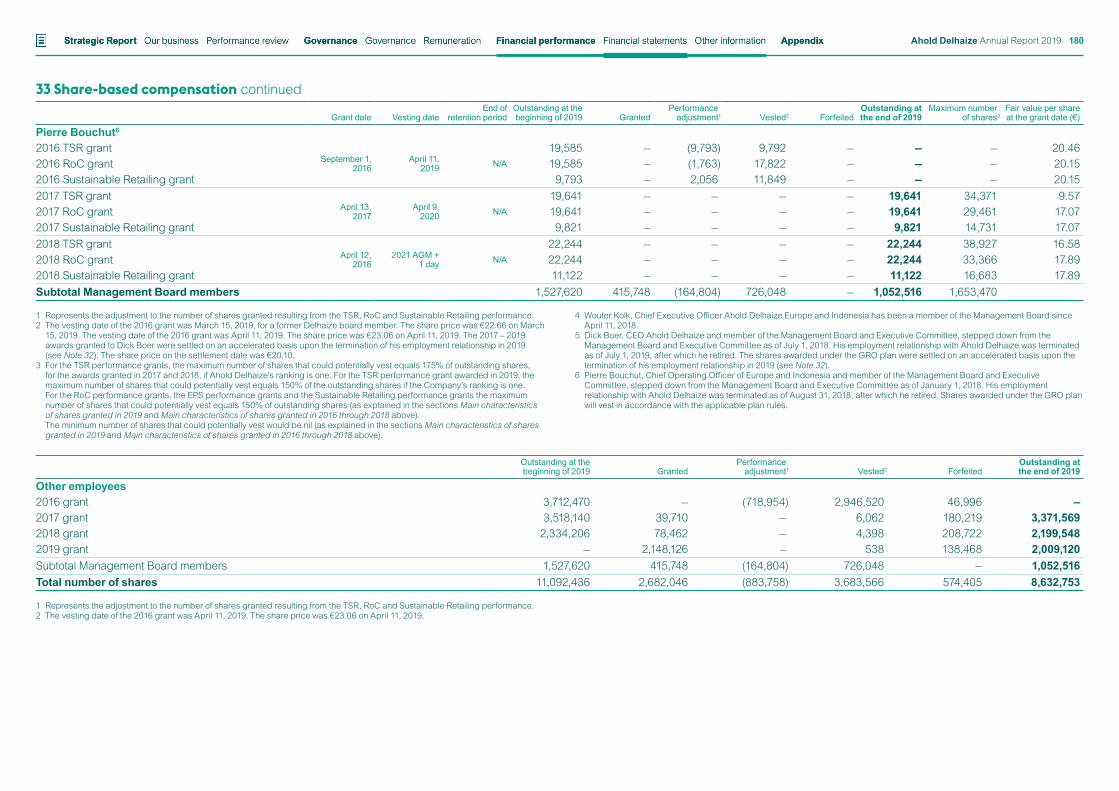
33 Share-based compensation continued
Grant date Vesting dateEnd of
retention periodOutstanding at the beginning of 2019 Granted
Performance adjustment1 Vested2 Forfeited
Outstanding at the end of 2019
Maximum numberof shares3
Fair value per shareat the grant date (€)
Pierre Bouchut6
2016 TSR grantSeptember 1,
2016April 11,
2019 N/A
19,585 — (9,793) 9,792 — — — 20.462016 RoC grant 19,585 — (1,763) 17,822 — — — 20.152016 Sustainable Retailing grant 9,793 — 2,056 11,849 — — — 20.152017 TSR grant
April 13, 2017
April 9, 2020 N/A
19,641 — — — — 19,641 34,371 9.572017 RoC grant 19,641 — — — — 19,641 29,461 17.072017 Sustainable Retailing grant 9,821 — — — — 9,821 14,731 17.072018 TSR grant
April 12, 2018
2021 AGM + 1 day N/A
22,244 — — — — 22,244 38,927 16.582018 RoC grant 22,244 — — — — 22,244 33,366 17.892018 Sustainable Retailing grant 11,122 — — — — 11,122 16,683 17.89Subtotal Management Board members 1,527,620 415,748 (164,804) 726,048 — 1,052,516 1,653,470
1 Represents the adjustment to the number of shares granted resulting from the TSR, RoC and Sustainable Retailing performance.2 The vesting date of the 2016 grant was March 15, 2019, for a former Delhaize board member. The share price was €22.66 on March
15, 2019. The vesting date of the 2016 grant was April 11, 2019. The share price was €23.06 on April 11, 2019. The 2017 – 2019 awards granted to Dick Boer were settled on an accelerated basis upon the termination of his employment relationship in 2019 (see Note 32). The share price on the settlement date was €20.10.
3 For the TSR performance grants, the maximum number of shares that could potentially vest equals 175% of outstanding shares, for the awards granted in 2017 and 2018, if Ahold Delhaize’s ranking is one. For the TSR performance grant awarded in 2019, the maximum number of shares that could potentially vest equals 150% of the outstanding shares if the Company’s ranking is one. For the RoC performance grants, the EPS performance grants and the Sustainable Retailing performance grants the maximum number of shares that could potentially vest equals 150% of outstanding shares (as explained in the sections Main characteristics of shares granted in 2019 and Main characteristics of shares granted in 2016 through 2018 above).
The minimum number of shares that could potentially vest would be nil (as explained in the sections Main characteristics of shares granted in 2019 and Main characteristics of shares granted in 2016 through 2018 above).
4 Wouter Kolk, Chief Executive Officer Ahold Delhaize Europe and Indonesia has been a member of the Management Board since April 11, 2018.
5 Dick Boer, CEO Ahold Delhaize and member of the Management Board and Executive Committee, stepped down from the Management Board and Executive Committee as of July 1, 2018. His employment relationship with Ahold Delhaize was terminated as of July 1, 2019, after which he retired. The shares awarded under the GRO plan were settled on an accelerated basis upon the termination of his employment relationship in 2019 (see Note 32).
6 Pierre Bouchut, Chief Operating Officer of Europe and Indonesia and member of the Management Board and Executive Committee, stepped down from the Management Board and Executive Committee as of January 1, 2018. His employment relationship with Ahold Delhaize was terminated as of August 31, 2018, after which he retired. Shares awarded under the GRO plan will vest in accordance with the applicable plan rules.
Outstanding at the beginning of 2019 Granted
Performance adjustment1 Vested2 Forfeited
Outstanding at the end of 2019
Other employees2016 grant 3,712,470 — (718,954) 2,946,520 46,996 —2017 grant 3,518,140 39,710 — 6,062 180,219 3,371,5692018 grant 2,334,206 78,462 — 4,398 208,722 2,199,5482019 grant — 2,148,126 – 538 138,468 2,009,120Subtotal Management Board members 1,527,620 415,748 (164,804) 726,048 — 1,052,516Total number of shares 11,092,436 2,682,046 (883,758) 3,683,566 574,405 8,632,753
1 Represents the adjustment to the number of shares granted resulting from the TSR, RoC and Sustainable Retailing performance.2 The vesting date of the 2016 grant was April 11, 2019. The share price was €23.06 on April 11, 2019.
Financial statements Other informationStrategic Report Governance Financial performance AppendixGovernance RemunerationOur business Performance review Ahold Delhaize Annual Report 2019 180
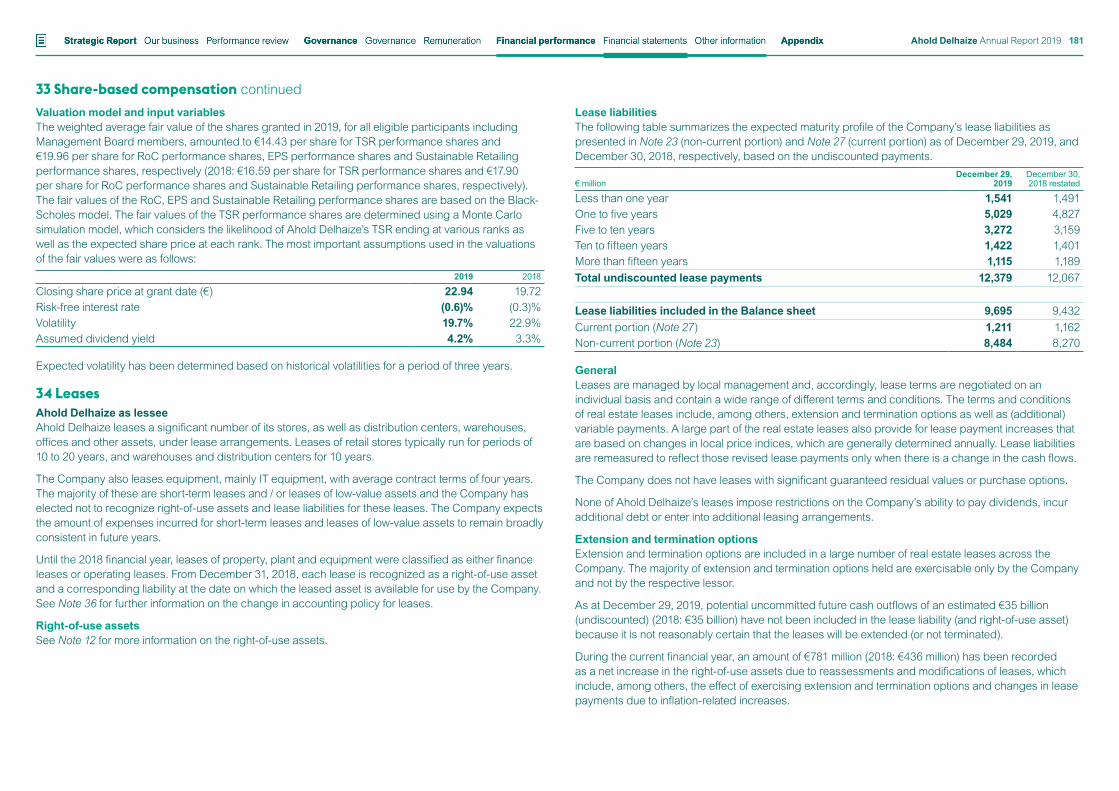
33 Share-based compensation continuedValuation model and input variablesThe weighted average fair value of the shares granted in 2019, for all eligible participants including Management Board members, amounted to €14.43 per share for TSR performance shares and €19.96 per share for RoC performance shares, EPS performance shares and Sustainable Retailing performance shares, respectively (2018: €16.59 per share for TSR performance shares and €17.90 per share for RoC performance shares and Sustainable Retailing performance shares, respectively). The fair values of the RoC, EPS and Sustainable Retailing performance shares are based on the Black-Scholes model. The fair values of the TSR performance shares are determined using a Monte Carlo simulation model, which considers the likelihood of Ahold Delhaize’s TSR ending at various ranks as well as the expected share price at each rank. The most important assumptions used in the valuations of the fair values were as follows:
2019 2018
Closing share price at grant date (€) 22.94 19.72Risk-free interest rate (0.6)% (0.3)%Volatility 19.7% 22.9%Assumed dividend yield 4.2% 3.3%
Expected volatility has been determined based on historical volatilities for a period of three years.
34 LeasesAhold Delhaize as lesseeAhold Delhaize leases a significant number of its stores, as well as distribution centers, warehouses, offices and other assets, under lease arrangements. Leases of retail stores typically run for periods of 10 to 20 years, and warehouses and distribution centers for 10 years.
The Company also leases equipment, mainly IT equipment, with average contract terms of four years. The majority of these are short-term leases and / or leases of low-value assets and the Company has elected not to recognize right-of-use assets and lease liabilities for these leases. The Company expects the amount of expenses incurred for short-term leases and leases of low-value assets to remain broadly consistent in future years.
Until the 2018 financial year, leases of property, plant and equipment were classified as either finance leases or operating leases. From December 31, 2018, each lease is recognized as a right-of-use asset and a corresponding liability at the date on which the leased asset is available for use by the Company. See Note 36 for further information on the change in accounting policy for leases.
Right-of-use assetsSee Note 12 for more information on the right-of-use assets.
Lease liabilitiesThe following table summarizes the expected maturity profile of the Company’s lease liabilities as presented in Note 23 (non-current portion) and Note 27 (current portion) as of December 29, 2019, and December 30, 2018, respectively, based on the undiscounted payments.
€ millionDecember 29,
2019December 30, 2018 restated
Less than one year 1,541 1,491One to five years 5,029 4,827Five to ten years 3,272 3,159Ten to fifteen years 1,422 1,401More than fifteen years 1,115 1,189Total undiscounted lease payments 12,379 12,067
Lease liabilities included in the Balance sheet 9,695 9,432Current portion (Note 27) 1,211 1,162Non-current portion (Note 23) 8,484 8,270
GeneralLeases are managed by local management and, accordingly, lease terms are negotiated on an individual basis and contain a wide range of different terms and conditions. The terms and conditions of real estate leases include, among others, extension and termination options as well as (additional) variable payments. A large part of the real estate leases also provide for lease payment increases that are based on changes in local price indices, which are generally determined annually. Lease liabilities are remeasured to reflect those revised lease payments only when there is a change in the cash flows.
The Company does not have leases with significant guaranteed residual values or purchase options.
None of Ahold Delhaize’s leases impose restrictions on the Company’s ability to pay dividends, incur additional debt or enter into additional leasing arrangements.
Extension and termination optionsExtension and termination options are included in a large number of real estate leases across the Company. The majority of extension and termination options held are exercisable only by the Company and not by the respective lessor.
As at December 29, 2019, potential uncommitted future cash outflows of an estimated €35 billion (undiscounted) (2018: €35 billion) have not been included in the lease liability (and right-of-use asset) because it is not reasonably certain that the leases will be extended (or not terminated).
During the current financial year, an amount of €781 million (2018: €436 million) has been recorded as a net increase in the right-of-use assets due to reassessments and modifications of leases, which include, among others, the effect of exercising extension and termination options and changes in lease payments due to inflation-related increases.
Financial statements Other informationStrategic Report Governance Financial performance AppendixGovernance RemunerationOur business Performance review Ahold Delhaize Annual Report 2019 181
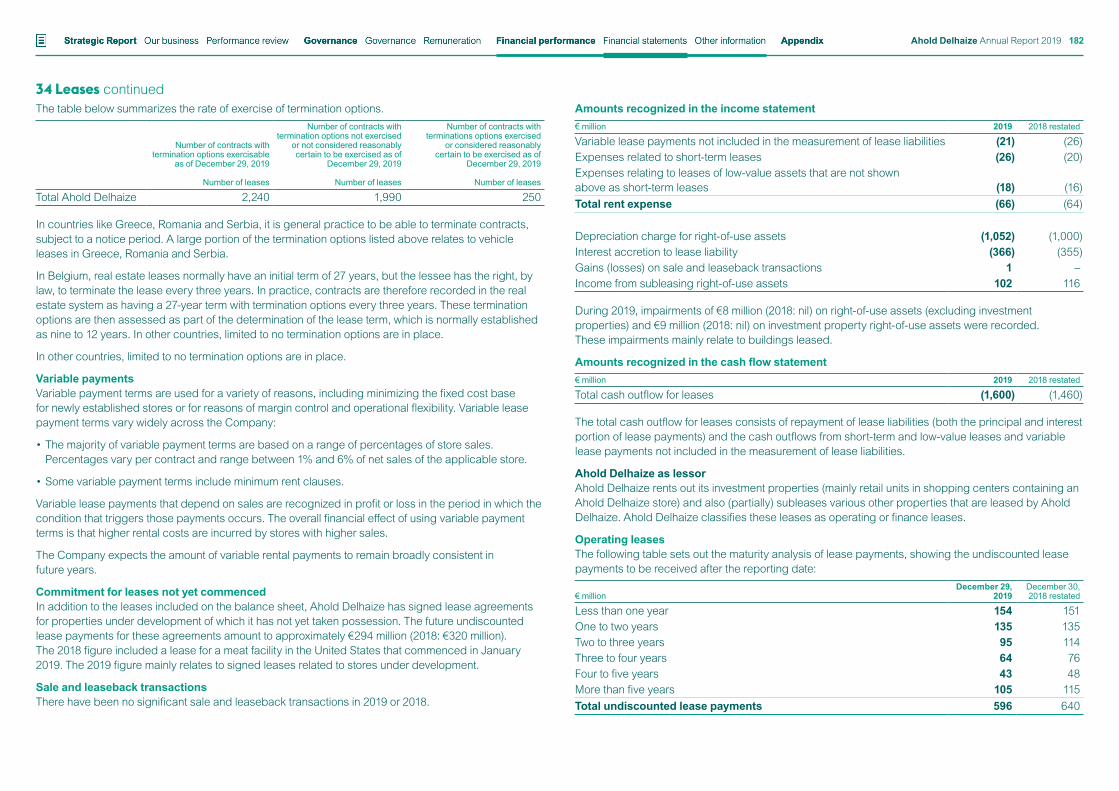
34 Leases continuedThe table below summarizes the rate of exercise of termination options.
Number of contracts with termination options exercisable
as of December 29, 2019
Number of leases
Number of contracts with termination options not exercised
or not considered reasonably certain to be exercised as of
December 29, 2019
Number of leases
Number of contracts with terminations options exercised
or considered reasonably certain to be exercised as of
December 29, 2019
Number of leases
Total Ahold Delhaize 2,240 1,990 250
In countries like Greece, Romania and Serbia, it is general practice to be able to terminate contracts, subject to a notice period. A large portion of the termination options listed above relates to vehicle leases in Greece, Romania and Serbia.
In Belgium, real estate leases normally have an initial term of 27 years, but the lessee has the right, by law, to terminate the lease every three years. In practice, contracts are therefore recorded in the real estate system as having a 27-year term with termination options every three years. These termination options are then assessed as part of the determination of the lease term, which is normally established as nine to 12 years. In other countries, limited to no termination options are in place.
In other countries, limited to no termination options are in place.
Variable paymentsVariable payment terms are used for a variety of reasons, including minimizing the fixed cost base for newly established stores or for reasons of margin control and operational flexibility. Variable lease payment terms vary widely across the Company:
• The majority of variable payment terms are based on a range of percentages of store sales. Percentages vary per contract and range between 1% and 6% of net sales of the applicable store.
• Some variable payment terms include minimum rent clauses.
Variable lease payments that depend on sales are recognized in profit or loss in the period in which the condition that triggers those payments occurs. The overall financial effect of using variable payment terms is that higher rental costs are incurred by stores with higher sales.
The Company expects the amount of variable rental payments to remain broadly consistent in future years.
Commitment for leases not yet commencedIn addition to the leases included on the balance sheet, Ahold Delhaize has signed lease agreements for properties under development of which it has not yet taken possession. The future undiscounted lease payments for these agreements amount to approximately €294 million (2018: €320 million). The 2018 figure included a lease for a meat facility in the United States that commenced in January 2019. The 2019 figure mainly relates to signed leases related to stores under development.
Sale and leaseback transactions There have been no significant sale and leaseback transactions in 2019 or 2018.
Amounts recognized in the income statement€ million 2019 2018 restated
Variable lease payments not included in the measurement of lease liabilities (21) (26)Expenses related to short-term leases (26) (20)Expenses relating to leases of low-value assets that are not shown above as short-term leases (18) (16)Total rent expense (66) (64)
Depreciation charge for right-of-use assets (1,052) (1,000)Interest accretion to lease liability (366) (355)Gains (losses) on sale and leaseback transactions 1 –Income from subleasing right-of-use assets 102 116
During 2019, impairments of €8 million (2018: nil) on right-of-use assets (excluding investment properties) and €9 million (2018: nil) on investment property right-of-use assets were recorded. These impairments mainly relate to buildings leased.
Amounts recognized in the cash flow statement€ million 2019 2018 restated
Total cash outflow for leases (1,600) (1,460)
The total cash outflow for leases consists of repayment of lease liabilities (both the principal and interest portion of lease payments) and the cash outflows from short-term and low-value leases and variable lease payments not included in the measurement of lease liabilities.
Ahold Delhaize as lessorAhold Delhaize rents out its investment properties (mainly retail units in shopping centers containing an Ahold Delhaize store) and also (partially) subleases various other properties that are leased by Ahold Delhaize. Ahold Delhaize classifies these leases as operating or finance leases.
Operating leasesThe following table sets out the maturity analysis of lease payments, showing the undiscounted lease payments to be received after the reporting date:
€ millionDecember 29,
2019December 30, 2018 restated
Less than one year 154 151One to two years 135 135Two to three years 95 114Three to four years 64 76Four to five years 43 48More than five years 105 115Total undiscounted lease payments 596 640
Financial statements Other informationStrategic Report Governance Financial performance AppendixGovernance RemunerationOur business Performance review Ahold Delhaize Annual Report 2019 182
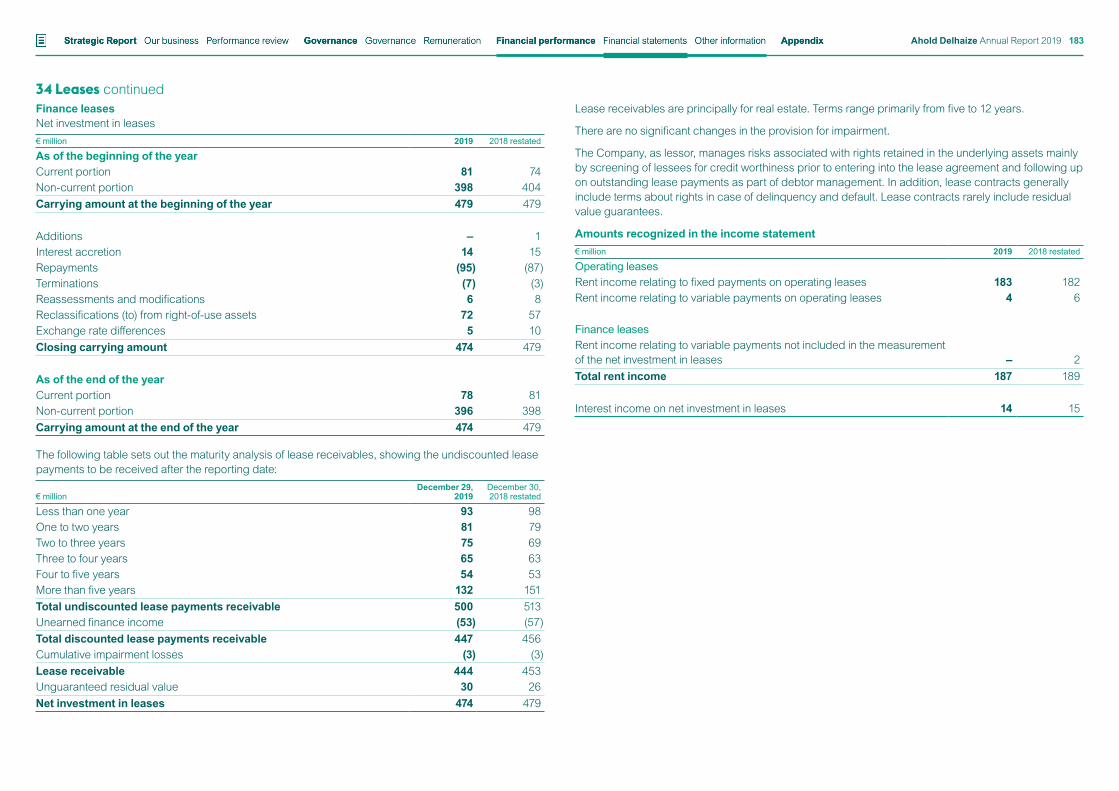
34 Leases continuedFinance leasesNet investment in leases€ million 2019 2018 restated
As of the beginning of the yearCurrent portion 81 74Non-current portion 398 404Carrying amount at the beginning of the year 479 479
Additions – 1Interest accretion 14 15Repayments (95) (87)Terminations (7) (3)Reassessments and modifications 6 8Reclassifications (to) from right-of-use assets 72 57Exchange rate differences 5 10Closing carrying amount 474 479
As of the end of the yearCurrent portion 78 81Non-current portion 396 398Carrying amount at the end of the year 474 479
The following table sets out the maturity analysis of lease receivables, showing the undiscounted lease payments to be received after the reporting date:
€ millionDecember 29,
2019December 30, 2018 restated
Less than one year 93 98One to two years 81 79Two to three years 75 69Three to four years 65 63Four to five years 54 53More than five years 132 151Total undiscounted lease payments receivable 500 513Unearned finance income (53) (57)Total discounted lease payments receivable 447 456Cumulative impairment losses (3) (3)Lease receivable 444 453Unguaranteed residual value 30 26Net investment in leases 474 479
Lease receivables are principally for real estate. Terms range primarily from five to 12 years.
There are no significant changes in the provision for impairment.
The Company, as lessor, manages risks associated with rights retained in the underlying assets mainly by screening of lessees for credit worthiness prior to entering into the lease agreement and following up on outstanding lease payments as part of debtor management. In addition, lease contracts generally include terms about rights in case of delinquency and default. Lease contracts rarely include residual value guarantees.
Amounts recognized in the income statement€ million 2019 2018 restated
Operating leasesRent income relating to fixed payments on operating leases 183 182Rent income relating to variable payments on operating leases 4 6
Finance leasesRent income relating to variable payments not included in the measurement of the net investment in leases – 2Total rent income 187 189
Interest income on net investment in leases 14 15
Financial statements Other informationStrategic Report Governance Financial performance AppendixGovernance RemunerationOur business Performance review Ahold Delhaize Annual Report 2019 183
35 Commitments and contingenciesCapital investment commitmentsAs of December 29, 2019, Ahold Delhaize had outstanding capital investment commitments for property, plant and equipment and investment property, and for intangible assets of approximately €593 million and €11 million, respectively (December 30, 2018: €447 million and €7 million, respectively). Ahold Delhaize’s share in the capital investment commitments of its unconsolidated joint ventures JMR and Super Indo amounted to €1 million as of December 29, 2019 (December 30, 2018: €1 million).
On December 10, 2019, Ahold Delhaize announced that it is investing $480 million to transform and expand its supply chain operations on the U.S. East Coast. This investment supports the new three-year strategy to move the U.S. supply chain to a fully integrated, self-distribution model. The $480 million capital outlay will cover a three-year transition period, which will support the acquisition of three distribution facilities by Ahold Delhaize USA from C&S Wholesale Grocers and leases on two additional facilities. It also includes investment in two new fully automated Ahold Delhaize USA frozen facilities to be constructed in the U.S. Northeast and Mid-Atlantic regions. This transaction will be accounted for as asset acquisition.
On February 12, 2020, Ahold Delhaize USA closed the acquisition of the three C&S Wholesale Grocers distribution centers in York, Pennsylvania, and Chester, New York.
Purchase commitmentsAhold Delhaize enters into purchase commitments with vendors in the ordinary course of business. The Company has purchase contracts with some vendors for varying terms that require Ahold Delhaize to buy services and predetermined volumes of goods and goods not-for-resale at fixed prices. As of December 29, 2019, the Company’s purchase commitments were approximately €1,194 million (December 30, 2018: €1,000 million). Not included in the purchase commitments are those purchase contracts for which Ahold Delhaize has received advance vendor allowances, such as upfront signing payments in consideration of its purchase commitments. These contracts generally may be terminated without satisfying the purchase commitments upon the repayment of the unearned portions of the advance vendor allowances. The unearned portion of these advance vendor allowances is recorded as a liability on the balance sheet.
Contingent liabilities GuaranteesGuarantees to third parties issued by Ahold Delhaize can be summarized as follows:
€ millionDecember 29,
2019December 30,
2018
Lease guarantees 833 911Lease guarantees backed by letters of credit 33 40Corporate and buyback guarantees 24 32Total 891 983
The amounts included in the table above are the maximum undiscounted amounts the Group could be forced to settle under the arrangement for the full guaranteed amount, if that amount is claimed by the counterparty to the guarantee. For lease guarantees, this is based on the committed lease terms as communicated to Ahold Delhaize. Specifics to the guarantees are discussed below.
Lease guarantees Ahold Delhaize may be contingently liable for leases that have been assigned and / or transferred to third parties in connection with facility closings and disposals. Ahold Delhaize could be required to assume the financial obligations under these leases if any of the third parties are unable to fulfill their lease obligations. The lease guarantees are based on the nominal value of future minimum lease payments of the relevant leases, which extend through 2041 and are based on the committed lease terms as communicated to Ahold Delhaize. The amounts of the lease guarantees exclude the cost of common area maintenance and real estate taxes; such amounts may vary in time, per region and per property. Certain amounts related to these leases are recognized as a provision or a financial liability; for more information see Notes 23 and 25.
Lease guarantees related to divestmentsAs of December 29, 2019, the €833 million in the undiscounted lease guarantees as presented in the table above completely relates to divestments. Of this amount, €342 million relates to the various Tops divestments, €127 million to the BI-LO / Bruno’s divestment, €109 million to the Sweetbay, Harveys, and Reid’s divestment, €105 million to the Bottom Dollar Food divestment and €150 million to other, including the divestment of remedy stores in the U.S. and the divestment of Bradlees.
On a discounted basis, these lease guarantees amount to €674 million and €742 million as of December 29, 2019, and December 30, 2018, respectively. If Ahold Delhaize is called upon to satisfy its obligations under the outstanding lease guarantees, it has several options to reduce the Company’s gross exposure. Further details on the guarantees related to divestments are discussed below.
Lease guarantees related to the Tops Markets divestmentsIn connection with the divestment of Tops Markets in 2007, Ahold Delhaize retained a contingent liability for 45 leases that carry Ahold Delhaize guarantees. Additionally, Ahold Delhaize retained liabilities related to stores previously divested, including guarantees on five Tops stores in eastern New York state, as well as liabilities related to the Tops convenience stores and the stores in northeast Ohio as outlined under Lease guarantees related to the divestment of Tops convenience stores: Wilson Farms and Sugarcreek.
On February 21, 2018, Tops Markets filed for bankruptcy protection under Chapter 11 of the U.S. Bankruptcy Code. These actions resulted in Ahold Delhaize recognizing €24 million partly as a financial liability and partly as an onerous contract provision (see Notes 23 and 25), which was presented as an after-tax loss from discontinued operations of €17 million in 2018.
Lease guarantees related to the divestment of Tops convenience stores: Wilson Farms and Sugarcreek Tops may be contingently liable to landlords under 186 leases assigned in connection with the divestment of the Tops’ Wilson Farms and Sugarcreek convenience stores in 2005, in the event of a future default by the tenant under such leases. In addition, Ahold Delhaize may be contingently liable to landlords under the guarantees of 77 of these leases in the same event.
Lease guarantees related to divestment of the Tops northeast Ohio stores Prior to Ahold Delhaize’s divestment of Tops in 2007, Tops closed all of its locations in northeast Ohio before year-end 2006. As of December 29, 2019, 32 of the total 55 closed locations in northeast Ohio have been divested or are now subleased or partially subleased. An additional 19 leases have been terminated. Four stores continue to be marketed. Ahold Delhaize may be contingently liable to landlords under guarantees of 13 of these leases in the event of a future default by the tenant under the leases.
Financial statements Other informationStrategic Report Governance Financial performance AppendixGovernance RemunerationOur business Performance review Ahold Delhaize Annual Report 2019 184
35 Commitments and contingencies continuedLease guarantees related to BI-LO / Bruno’s divestment In 2005, Ahold Delhaize divested its U.S. retail subsidiaries BI-LO and Bruno’s. On February 5, 2009, and March 23, 2009, Bruno’s Supermarkets, LLC and BI-LO, LLC, respectively, filed for protection under Chapter 11 of the U.S. Bankruptcy Code (the “2009 BI-LO Bankruptcy Filing”). As a result of the 2009 BI-LO Bankruptcy Filing, Ahold Delhaize made an assessment of its potential obligations under existing lease guarantees. Consequently, in 2009, Ahold Delhaize recognized provisions of €109 million (see Note 25) and related tax benefit offsets of €47 million within results on divestments.
During the 2009 BI-LO bankruptcy, BI-LO rejected a total of 16 leases that were guaranteed by Ahold Delhaize and Ahold Delhaize took assignment of 12 other BI-LO leases with Ahold Delhaize guarantees. On May 12, 2010, the then reorganized BI-LO (“BI-LO II”) exited bankruptcy protection and BI-LO II assumed 149 operating locations that were guaranteed by Ahold Delhaize. Based on the foregoing developments, Ahold Delhaize recognized a reduction of €23 million in its provision, after tax, within results on divestments in the first half of 2010. Since the end of the second quarter of 2010, Ahold Delhaize has entered into settlements with a number of landlords relating to leases of former BI-LO or Bruno’s stores that were guaranteed by Ahold Delhaize.
On March 27, 2018, BI-LO II and its parent, Southeastern Grocers, Inc., filed for bankruptcy protection under Chapter 11 of the U.S. Bankruptcy Code (the “2018 BI-LO Bankruptcy Filing”). As a result of the 2018 BI-LO Bankruptcy Filing, Ahold Delhaize has reassessed its potential obligations under the lease guarantees based upon: (i) the remaining initial term of each lease, (ii) an assessment of the possibility that Ahold Delhaize would have to pay under a guarantee and (iii) any potential remedies that Ahold Delhaize may have to limit future lease payments.
At the end of 2019, the undiscounted lease guarantees relating to BI-LO and Bruno’s totaled €127 million. As of December 29, 2019, the remaining provision was €2 million (December 30, 2018 restated: €2 million) with a related tax benefit offset of €1 million (2018 restated: €1 million); see Note 25. This amount represents Ahold Delhaize’s best estimate of the discounted aggregate amount of the remaining lease obligations and associated charges, net of known mitigation offsets, which could result in cash outflows for Ahold Delhaize under the various lease guarantees. Ahold Delhaize continues to monitor any developments and pursues its mitigation efforts with respect to these potential lease guarantee liabilities.
Lease guarantees related to Sweetbay, Harveys and Reid’s and Bottom Dollar Food divestmentsAhold Delhaize divested its U.S. retail subsidiaries Sweetbay, Harveys and Reid’s to BI-LO II in 2014 and its U.S. retail subsidiary Bottom Dollar Food to Aldi in 2015. Ahold Delhaize had provided guarantees for a number of existing lease contracts, which extend through 2037. Ahold Delhaize has made an assessment of its potential obligations under lease guarantees, considering: (i) the remaining term of each lease, (ii) the re-let potential of the property if the acquirer were to default on the lease and (iii) the credit position of the counterparty. At the end of 2019, the undiscounted lease guarantees were €109 million for Sweetbay, Harveys and Reid’s and €105 million for Bottom Dollar Food. As of December 29, 2019, the on-balance sheet financial liability representing the fair value of the lease guarantees was €10 million (2018: €12 million); see Note 23.
In connection with the 2018 BI-LO Bankruptcy filing described above, BI-LO II has rejected a number of leases for which Ahold Delhaize recognized a provision for lease guarantees in the amount of €22 million in 2018. As of December 29, 2019, the remaining provision for these lease guarantees was €11 million (2018: €15 million); see Note 25.
Lease guarantees related to the divestment of U.S. remedy storesIn July 2016, as a condition of receiving regulatory clearance for their merger from the United States Federal Trade Commission (“FTC”), Ahold and Delhaize entered into a consent agreement (“Consent Agreement”) with the FTC that required Ahold and Delhaize to divest certain stores in seven states in order to prevent the merger from being anti-competitive. Ahold Delhaize subsidiaries may be contingently liable for 73 divested locations.
Lease guarantees related to the divestment of BradleesIn 1992, Stop & Shop spun-off Bradlees Stores, Inc. (“Bradlees”) as a public company (the “Bradlees Spin-off”). In connection with the Bradlees Spin-off, Stop & Shop assigned to Bradlees certain commercial real property leases. Pursuant to a 1995 reorganization of Bradlees and a subsequent wind-down and liquidation of Bradlees following a bankruptcy protection filing in 2000 (collectively, the “Bradlees Bankruptcies”), a number of such real property leases were assumed and assigned to third parties. Pursuant to applicable law, Stop & Shop may be contingently liable, subject to applicable defenses, to landlords under certain of the leases assigned in connection with the Bradlees Spin-off and subsequently assumed and assigned to third parties in connection with the Bradlees Bankruptcies.
Lease guarantees backed up by letters of creditAs part of the divestment of U.S. Foodservice in 2007, Ahold Delhaize received an irrevocable standby letter of credit for $216 million (€163 million), which was reduced to $37 million (€33 million) as of December 29, 2019 (2018: $46 million (€40 million)).
Corporate and buyback guaranteesAhold Delhaize has provided corporate guarantees to certain suppliers of its franchisees or non-consolidated entities. Ahold Delhaize would be required to perform under the guarantee if the franchisee or non-consolidated entity failed to meet its financial obligations, as described in the guarantee. Buyback guarantees relate to Ahold Delhaize’s commitment to repurchase stores or inventory from certain franchisees at predetermined prices. The buyback guarantees reflect the maximum committed repurchase value under the guarantees. The last of the corporate and buyback guarantees expire in 2022.
Financial statements Other informationStrategic Report Governance Financial performance AppendixGovernance RemunerationOur business Performance review Ahold Delhaize Annual Report 2019 185
35 Commitments and contingencies continuedIndemnifications as part of divestments of Ahold Delhaize’s operationsIn the relevant sales agreements, Ahold Delhaize has provided customary indemnifications, including for potential breach of representations and warranties, that often include, but are not limited to, completeness of books and records, title to assets, schedule of material contracts and arrangements, litigation, permits, labor matters, and employee benefits and taxes. These representations and warranties will generally terminate, depending on their specific features, a number of years after the date of the relevant transaction completion date.
The most significant divestments of operations are, to the extent not already covered in the guarantee section above, described below. In addition, specific, limited indemnifications exist for a number of Ahold Delhaize’s smaller divestments. The aggregate impact of claims, if any, under such indemnification provisions is not expected to be material.
Disco divestmentAs part of the divestment of Disco S.A. (“Disco”) in 2004, Ahold Delhaize is required to indemnify Disco and its buyers for the outcome of the Uruguayan litigation described in the Legal proceedings section of this Note. Ahold Delhaize’s indemnification obligation relating to this litigation is not capped at a certain amount nor restricted to a certain time period.
Tom & Co divestmentIn 2016, Ahold Delhaize divested the pet specialist shop chain Tom & Co. As part of the transaction, Ahold Delhaize granted indemnities to the purchaser of all divested stores, which Ahold Delhaize believes are customary for transactions of this nature.
Income tax Because Ahold Delhaize operates in a number of countries, its income is subject to taxation in differing jurisdictions and at differing tax rates. Significant judgment is required in determining the consolidated income tax position. We seek to organize our affairs in a sustainable manner, taking into account the applicable regulations of the jurisdictions in which we operate. As a result of Ahold Delhaize’s multi-jurisdictional operations, it is exposed to a number of different tax risks including, but not limited to, changes in tax laws or interpretations of such tax laws. The authorities in the jurisdictions where Ahold Delhaize operates may review the Company’s tax returns and may disagree with the positions taken in those returns. While the ultimate outcome of such reviews is not certain, Ahold Delhaize has considered the merits of its filing positions in its overall evaluation of potential tax liabilities and believes it has adequate liabilities recorded in its consolidated financial statements for exposures on these matters. Based on its evaluation of the potential tax liabilities and the merits of Ahold Delhaize’s filing positions, it is unlikely that potential tax exposures over and above the amounts currently recorded as liabilities in its consolidated financial statements will be material to its financial condition or future results of operations.
Legal proceedingsAhold Delhaize and certain of its former or current subsidiaries are involved in a number of legal proceedings, which include litigation as a result of divestments, tax and employment, as well as other litigation and inquiries. The legal proceedings discussed below, whether pending, threatened or unasserted, if decided adversely or settled, may result in liability material to Ahold Delhaize’s financial condition, results of operations or cash flows. Ahold Delhaize may enter into discussions regarding the settlement of these and other proceedings, and may enter into settlement agreements, if it believes settlement is in the best interest of Ahold Delhaize’s shareholders. In accordance with IAS 37 “Provisions, Contingent Liabilities, and Contingent Assets,” Ahold Delhaize has recognized provisions with respect to these proceedings, where appropriate, which are reflected on its balance sheet.
Albert Heijn FranchisingIn 2014, the Vereniging Albert Heijn Franchisenemers (an association of Albert Heijn franchisees or “VAHFR”) has asserted claims against Albert Heijn Franchising BV (an Ahold Delhaize subsidiary or “AHF”), for the years 2008 through 2012, the alleged value of which exceeds €200 million in aggregate. AHF and the VAHFR have had ongoing discussions for a number of years about the resolution of certain cost items under individual franchise agreements. On December 24, 2014, AHF and other legal entities within the Ahold Delhaize group of companies received a writ in which VAHFR and 242 individual claimants would initiate proceedings as of April 15, 2015, before the District Court of Haarlem with respect to these discussions. On November 16, 2016, the court issued a judgment rejecting all claims of the VAHFR and the claimants. On February 13, 2017, VAHFR and 240 individual claimants filed a formal appeal against the judgment.
In September 2017, the claimants filed their grounds for appeal in which they asserted unquantified claims for the years 2008 until 2016.
On July 23, 2019, the Court of Appeal issued a judgment rejecting, except for one, all the claims of VAHFR and the claimants. On October 23, 2019, the VAHFR and the claimants filed an appeal in cassation to the Supreme Court. Albert Heijn Franchising BV and its affiliates will continue to vigorously defend their interest in the legal proceedings.
Uruguayan litigationAhold Delhaize, together with Disco and Disco Ahold International Holdings N.V. (“DAIH”), is party to one lawsuit in Uruguay related to Ahold Delhaize’s 2002 acquisition of Velox Retail Holdings’ shares in the capital of DAIH. The two other related lawsuits in Uruguay were decided in favor of Ahold Delhaize without any further right to appeal of the plaintiffs in 2013. The damages alleged by the plaintiffs, alleged creditors of certain Uruguayan and other banks, amount to approximately $62 million (€55 million) plus interest and costs. As part of the divestment of Disco to Cencosud in 2004, Ahold Delhaize indemnified Cencosud and Disco against the outcome of these legal proceedings. The one remaining lawsuit is ongoing. Ahold Delhaize continues to believe that the plaintiffs’ claims are without merit and will continue to vigorously oppose such claims.
Financial statements Other informationStrategic Report Governance Financial performance AppendixGovernance RemunerationOur business Performance review Ahold Delhaize Annual Report 2019 186
35 Commitments and contingencies continuedGreek litigation In a shareholders’ matter related to Alfa Beta Vassilopoulos S.A. (“Alfa Beta”), Ahold Delhaize’s wholly-owned subsidiary in Greece, Ahold Delhaize was notified in 2011 that five former shareholders of Alfa Beta, who together held 7% of Alfa Beta’s shares, filed a claim with the Court of First Instance of Athens challenging the price paid by Ahold Delhaize during the squeeze-out process that was approved by the Hellenic Capital Markets Commission. Claimants had filed a separate claim for compound interest as well, which they withdrew in 2018. On January 11, 2019, the Court of First Instance delivered a decision on the merits pursuant to which Ahold Delhaize was held to pay an additional consideration of approximately €11.9 million plus interest and costs. On April 3, 2019, claimants re-filed their separate claim for compound interest. A provision was taken for this matter by Ahold Delhaize. At the end of 2019 and beginning of 2020, Ahold Delhaize fully and finally settled this Greek litigation with four of the five plaintiffs, representing 66.5% of the total plaintiff base, within the amount of the provision, while all five plaintiffs have withdrawn from their claim for compound interest. For the remainder, Ahold Delhaize expects to reach a full and final settlement as well, within the amount of the provision, and otherwise has the right to launch an appeal against the Court of First Instance decision, on the basis that the squeeze-out transaction had been executed and completed in compliance with all legal and regulatory requirements and against a fair price.
National prescription opiate litigationSeveral U.S. brands and subsidiaries of Ahold Delhaize have been sued in a number of lawsuits included in In re: National Prescription Opiate Litigation (MDL No. 2804), a multi-district litigation (MDL) matter pending in the United States District Court in the Northern District of Ohio. The MDL contains cases filed against hundreds of defendants by counties, cities, hospitals and others concerning the impact of opioid abuse. The suits name Ahold Delhaize as a defendant, as well as various subsidiaries, including American Sales Company, LLC, which ceased operations prior to being named as a defendant in any MDL-related case. All of the matters in which Ahold Delhaize or its subsidiaries have been named have been stayed by the court and, therefore, are not being actively litigated at this time. Ahold Delhaize and its affected subsidiaries believe that the plaintiffs’ claims are without merit and we will defend ourselves against the claims in all these matters, if and when the stay is lifted. Ahold Delhaize is not currently able to predict the outcome of these claims.
Pharmacy regulatory investigationThe Ahold Delhaize USA brands are responding to a civil investigative demand (CID) from the U.S. Department of Justice (DOJ), working together with several state Attorneys General, concerning pharmacy customer-retention programs. The brands are cooperating with this investigation and communicating with the DOJ regarding the CID. Ahold Delhaize is not currently able to predict the timing or outcome of the investigation.
Other legal proceedingsIn addition to the legal proceedings described previously in this Note, Ahold Delhaize and its former or current subsidiaries are parties to a number of other legal proceedings arising out of their business operations. Ahold Delhaize believes that the ultimate resolution of these other proceedings will not, in the aggregate, have a material adverse effect on Ahold Delhaize’s financial position, results of operations or cash flows. Such other legal proceedings, however, are subject to inherent uncertainties and the outcome of individual matters is unpredictable. It is possible that Ahold Delhaize could be required to make expenditures, in excess of established provisions, in amounts that cannot reasonably be estimated.
36 Changes in accounting policies – effect of IFRS 16 adoptionA new accounting standard, IFRS 16 “Leases” (“IFRS 16”) has been published by the International Accounting Standards Board. IFRS 16 replaces existing lease guidance, including IAS 17, “Leases”; IFRIC 4, “Determining whether an Arrangement Contains a Lease”; SIC-15, “Operating Leases – Incentives”; and SIC-27, “Evaluating the Substance of Transactions Involving the Legal Form of a Lease” (“the former lease accounting standard”).
The IFRS 16 standard is effective for annual periods beginning on or after January 1, 2019. The Company adopted IFRS 16 on December 31, 2018, and applied the full retrospective transition approach, and, therefore, the comparative figures for the 2018 financial year have been restated, as presented below.
IFRS 16 introduced a single, on-balance-sheet lease accounting model for lessees. As a result, the Company, as a lessee, has recognized right-of-use assets, representing its rights to use the underlying assets, and lease liabilities, representing its obligation to make lease payments.
On the income statement, there are changes to the nature of expenses related to leases in which the Company leases an asset (lessee), because IFRS 16 replaces the operating lease expense with a depreciation charge for right-of-use assets and interest expense on lease liabilities.
At the time of the transition to IFRS 16, the Company determined whether an arrangement contains a lease. When performing this assessment, the Company could choose whether to apply the IFRS 16 definition of a lease to all its contracts or apply the practical expedient allowed under IFRS 16 and not reassess whether a contract is, or contains, a lease. The Company chose to apply the practical expedient to grandfather the definition of a lease upon transition. This means that it applied IFRS 16 to all contracts entered into before December 31, 2018, and identified as leases in accordance with IAS 17 and IFRIC 4.
The accounting policies applicable to the Company as a lessor in the comparative period were not different from IFRS 16. However, subleases under IFRS 16 are classified with reference to the right-of-use asset, not with reference to the underlying asset, as per IAS 17. As a result, more leases have been classified as finance leases.
See Note 3 for the accounting policy selected for lease accounting.
Financial statements Other informationStrategic Report Governance Financial performance AppendixGovernance RemunerationOur business Performance review Ahold Delhaize Annual Report 2019 187
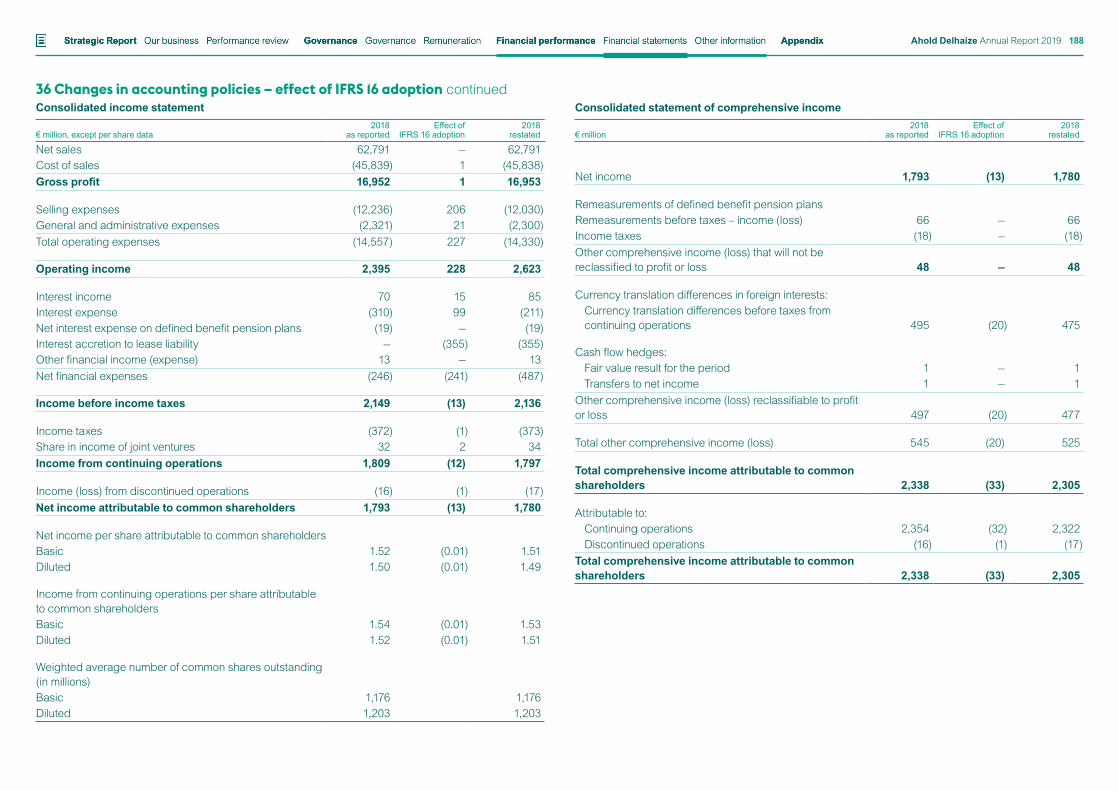
36 Changes in accounting policies – effect of IFRS 16 adoption continued Consolidated income statement € million, except per share data
2018 as reported
Effect of IFRS 16 adoption
2018 restated
Net sales 62,791 — 62,791Cost of sales (45,839) 1 (45,838)Gross profit 16,952 1 16,953
Selling expenses (12,236) 206 (12,030)General and administrative expenses (2,321) 21 (2,300)Total operating expenses (14,557) 227 (14,330)
Operating income 2,395 228 2,623
Interest income 70 15 85Interest expense (310) 99 (211)Net interest expense on defined benefit pension plans (19) — (19)Interest accretion to lease liability — (355) (355)Other financial income (expense) 13 — 13Net financial expenses (246) (241) (487)
Income before income taxes 2,149 (13) 2,136
Income taxes (372) (1) (373)Share in income of joint ventures 32 2 34Income from continuing operations 1,809 (12) 1,797
Income (loss) from discontinued operations (16) (1) (17)Net income attributable to common shareholders 1,793 (13) 1,780
Net income per share attributable to common shareholdersBasic 1.52 (0.01) 1.51Diluted 1.50 (0.01) 1.49
Income from continuing operations per share attributable to common shareholdersBasic 1.54 (0.01) 1.53Diluted 1.52 (0.01) 1.51
Weighted average number of common shares outstanding (in millions)Basic 1,176 1,176Diluted 1,203 1,203
€ million
2018 as reported
Effect of IFRS 16 adoption
2018 restated
Net income 1,793 (13) 1,780
Remeasurements of defined benefit pension plansRemeasurements before taxes – income (loss) 66 — 66Income taxes (18) — (18)Other comprehensive income (loss) that will not be reclassified to profit or loss 48 — 48
Currency translation differences in foreign interests:Currency translation differences before taxes from continuing operations 495 (20) 475
Cash flow hedges:Fair value result for the period 1 — 1Transfers to net income 1 — 1
Other comprehensive income (loss) reclassifiable to profit or loss 497 (20) 477
Total other comprehensive income (loss) 545 (20) 525
Total comprehensive income attributable to common shareholders 2,338 (33) 2,305
Attributable to:Continuing operations 2,354 (32) 2,322Discontinued operations (16) (1) (17)
Total comprehensive income attributable to common shareholders 2,338 (33) 2,305
Consolidated statement of comprehensive income
Financial statements Other informationStrategic Report Governance Financial performance AppendixGovernance RemunerationOur business Performance review Ahold Delhaize Annual Report 2019 188
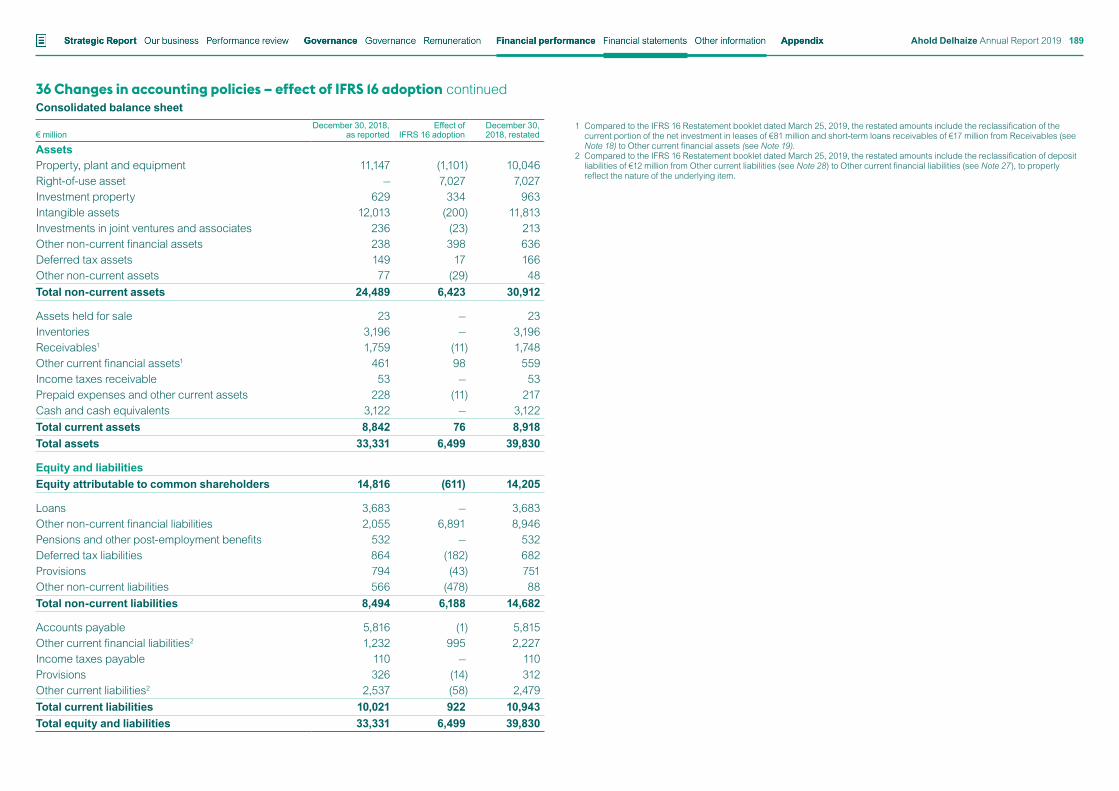
36 Changes in accounting policies – effect of IFRS 16 adoption continued Consolidated balance sheet € million
December 30, 2018, as reported
Effect of IFRS 16 adoption
December 30, 2018, restated
AssetsProperty, plant and equipment 11,147 (1,101) 10,046Right-of-use asset — 7,027 7,027Investment property 629 334 963Intangible assets 12,013 (200) 11,813Investments in joint ventures and associates 236 (23) 213Other non-current financial assets 238 398 636Deferred tax assets 149 17 166Other non-current assets 77 (29) 48Total non-current assets 24,489 6,423 30,912
Assets held for sale 23 — 23Inventories 3,196 — 3,196Receivables1 1,759 (11) 1,748Other current financial assets1 461 98 559Income taxes receivable 53 — 53Prepaid expenses and other current assets 228 (11) 217Cash and cash equivalents 3,122 — 3,122Total current assets 8,842 76 8,918Total assets 33,331 6,499 39,830
Equity and liabilitiesEquity attributable to common shareholders 14,816 (611) 14,205
Loans 3,683 — 3,683Other non-current financial liabilities 2,055 6,891 8,946Pensions and other post-employment benefits 532 — 532Deferred tax liabilities 864 (182) 682Provisions 794 (43) 751Other non-current liabilities 566 (478) 88Total non-current liabilities 8,494 6,188 14,682
Accounts payable 5,816 (1) 5,815Other current financial liabilities2 1,232 995 2,227Income taxes payable 110 — 110Provisions 326 (14) 312Other current liabilities2 2,537 (58) 2,479Total current liabilities 10,021 922 10,943Total equity and liabilities 33,331 6,499 39,830
1 Compared to the IFRS 16 Restatement booklet dated March 25, 2019, the restated amounts include the reclassification of the current portion of the net investment in leases of €81 million and short-term loans receivables of €17 million from Receivables (see Note 18) to Other current financial assets (see Note 19).
2 Compared to the IFRS 16 Restatement booklet dated March 25, 2019, the restated amounts include the reclassification of deposit liabilities of €12 million from Other current liabilities (see Note 28) to Other current financial liabilities (see Note 27), to properly reflect the nature of the underlying item.
Financial statements Other informationStrategic Report Governance Financial performance AppendixGovernance RemunerationOur business Performance review Ahold Delhaize Annual Report 2019 189
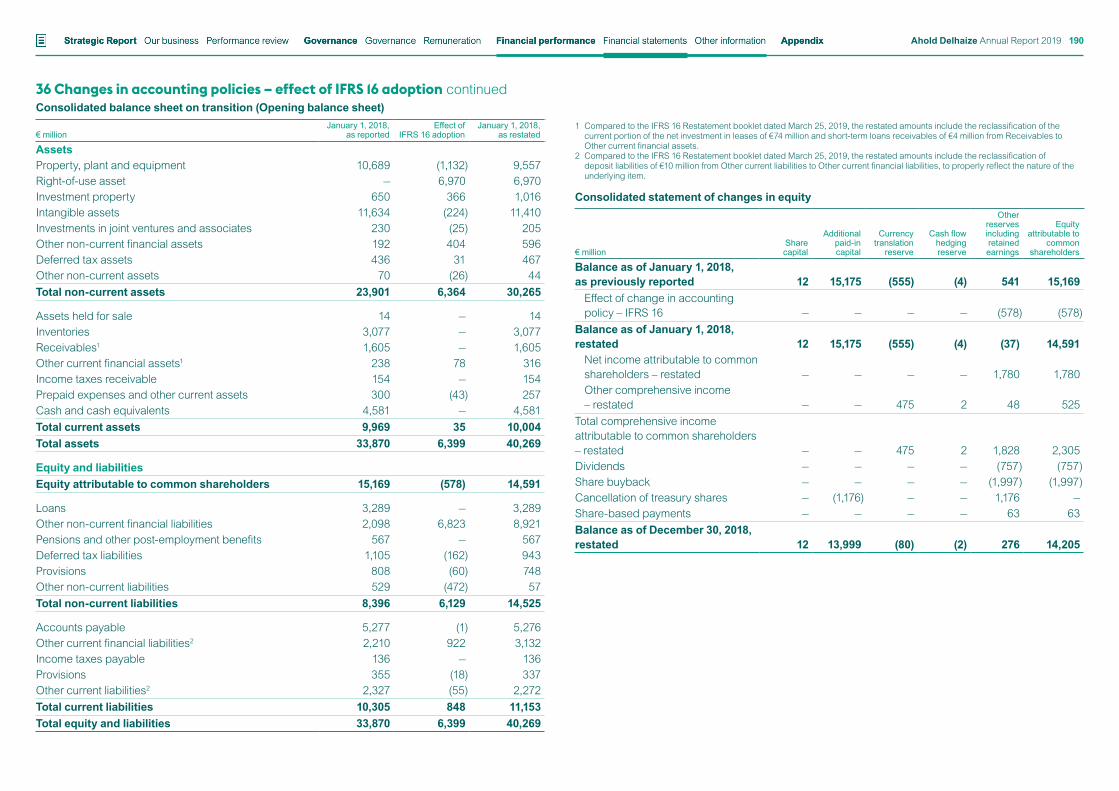
36 Changes in accounting policies – effect of IFRS 16 adoption continued Consolidated balance sheet on transition (Opening balance sheet) € million
January 1, 2018, as reported
Effect of IFRS 16 adoption
January 1, 2018, as restated
AssetsProperty, plant and equipment 10,689 (1,132) 9,557Right-of-use asset — 6,970 6,970Investment property 650 366 1,016Intangible assets 11,634 (224) 11,410Investments in joint ventures and associates 230 (25) 205Other non-current financial assets 192 404 596Deferred tax assets 436 31 467Other non-current assets 70 (26) 44Total non-current assets 23,901 6,364 30,265
Assets held for sale 14 — 14Inventories 3,077 — 3,077Receivables1 1,605 — 1,605Other current financial assets1 238 78 316Income taxes receivable 154 — 154Prepaid expenses and other current assets 300 (43) 257Cash and cash equivalents 4,581 — 4,581Total current assets 9,969 35 10,004Total assets 33,870 6,399 40,269
Equity and liabilitiesEquity attributable to common shareholders 15,169 (578) 14,591
Loans 3,289 — 3,289Other non-current financial liabilities 2,098 6,823 8,921Pensions and other post-employment benefits 567 — 567Deferred tax liabilities 1,105 (162) 943Provisions 808 (60) 748Other non-current liabilities 529 (472) 57Total non-current liabilities 8,396 6,129 14,525
Accounts payable 5,277 (1) 5,276Other current financial liabilities2 2,210 922 3,132Income taxes payable 136 — 136Provisions 355 (18) 337Other current liabilities2 2,327 (55) 2,272Total current liabilities 10,305 848 11,153Total equity and liabilities 33,870 6,399 40,269
1 Compared to the IFRS 16 Restatement booklet dated March 25, 2019, the restated amounts include the reclassification of the current portion of the net investment in leases of €74 million and short-term loans receivables of €4 million from Receivables to Other current financial assets.
2 Compared to the IFRS 16 Restatement booklet dated March 25, 2019, the restated amounts include the reclassification of deposit liabilities of €10 million from Other current liabilities to Other current financial liabilities, to properly reflect the nature of the underlying item.
Consolidated statement of changes in equity
€ millionShare capital
Additional paid-in capital
Currency translation
reserve
Cash flow hedging reserve
Other reserves including retained earnings
Equity attributable to
common shareholders
Balance as of January 1, 2018, as previously reported 12 15,175 (555) (4) 541 15,169
Effect of change in accounting policy – IFRS 16 — — — — (578) (578)
Balance as of January 1, 2018, restated 12 15,175 (555) (4) (37) 14,591
Net income attributable to common shareholders – restated — — — — 1,780 1,780Other comprehensive income – restated — — 475 2 48 525
Total comprehensive income attributable to common shareholders – restated — — 475 2 1,828 2,305Dividends — — — — (757) (757)Share buyback — — — — (1,997) (1,997)Cancellation of treasury shares — (1,176) — — 1,176 —Share-based payments — — — — 63 63Balance as of December 30, 2018, restated 12 13,999 (80) (2) 276 14,205
Financial statements Other informationStrategic Report Governance Financial performance AppendixGovernance RemunerationOur business Performance review Ahold Delhaize Annual Report 2019 190
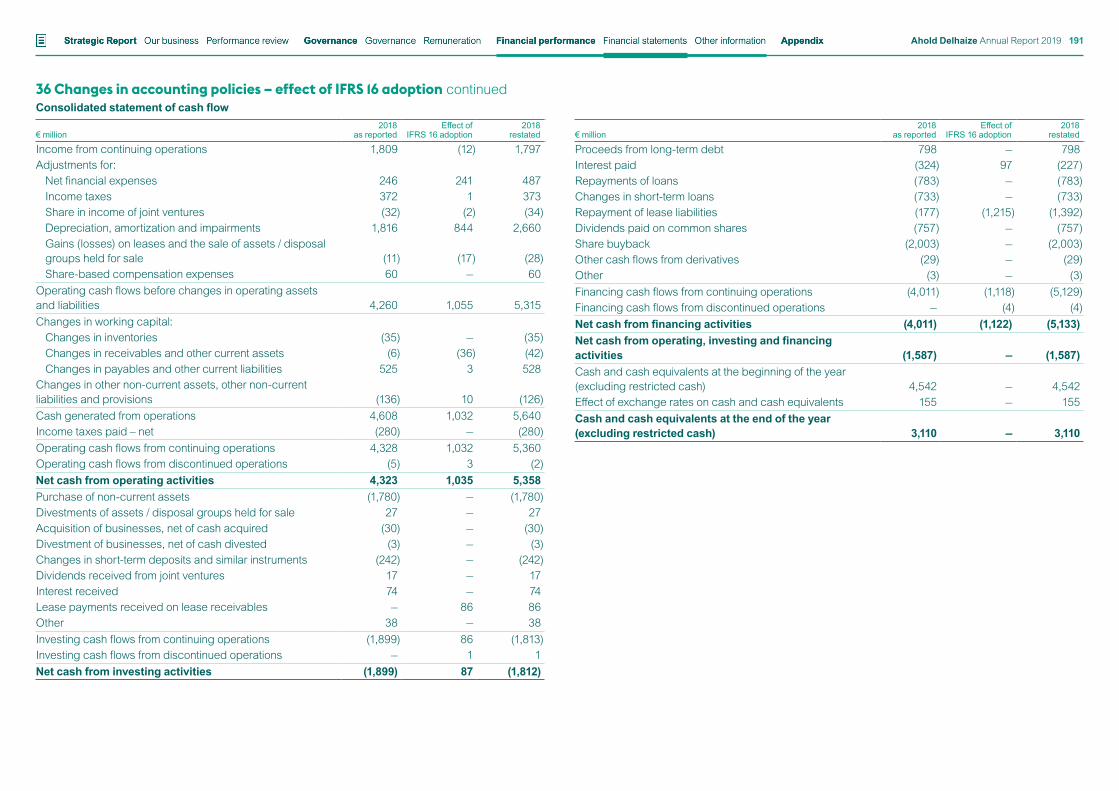
36 Changes in accounting policies – effect of IFRS 16 adoption continued Consolidated statement of cash flow € million
2018 as reported
Effect of IFRS 16 adoption
2018 restated
Income from continuing operations 1,809 (12) 1,797Adjustments for:
Net financial expenses 246 241 487Income taxes 372 1 373Share in income of joint ventures (32) (2) (34)Depreciation, amortization and impairments 1,816 844 2,660Gains (losses) on leases and the sale of assets / disposal groups held for sale (11) (17) (28)Share-based compensation expenses 60 — 60
Operating cash flows before changes in operating assets and liabilities 4,260 1,055 5,315Changes in working capital:
Changes in inventories (35) — (35)Changes in receivables and other current assets (6) (36) (42)Changes in payables and other current liabilities 525 3 528
Changes in other non-current assets, other non-current liabilities and provisions (136) 10 (126)Cash generated from operations 4,608 1,032 5,640Income taxes paid – net (280) — (280)Operating cash flows from continuing operations 4,328 1,032 5,360Operating cash flows from discontinued operations (5) 3 (2)Net cash from operating activities 4,323 1,035 5,358Purchase of non-current assets (1,780) — (1,780)Divestments of assets / disposal groups held for sale 27 — 27Acquisition of businesses, net of cash acquired (30) — (30)Divestment of businesses, net of cash divested (3) — (3)Changes in short-term deposits and similar instruments (242) — (242)Dividends received from joint ventures 17 — 17Interest received 74 — 74Lease payments received on lease receivables — 86 86Other 38 — 38Investing cash flows from continuing operations (1,899) 86 (1,813)Investing cash flows from discontinued operations — 1 1Net cash from investing activities (1,899) 87 (1,812)
€ million
2018 as reported
Effect of IFRS 16 adoption
2018 restated
Proceeds from long-term debt 798 — 798Interest paid (324) 97 (227)Repayments of loans (783) — (783)Changes in short-term loans (733) — (733)Repayment of lease liabilities (177) (1,215) (1,392)Dividends paid on common shares (757) — (757)Share buyback (2,003) — (2,003)Other cash flows from derivatives (29) — (29)Other (3) — (3)Financing cash flows from continuing operations (4,011) (1,118) (5,129)Financing cash flows from discontinued operations — (4) (4)Net cash from financing activities (4,011) (1,122) (5,133)Net cash from operating, investing and financing activities (1,587) — (1,587)Cash and cash equivalents at the beginning of the year (excluding restricted cash) 4,542 — 4,542Effect of exchange rates on cash and cash equivalents 155 — 155Cash and cash equivalents at the end of the year (excluding restricted cash) 3,110 — 3,110
Financial statements Other informationStrategic Report Governance Financial performance AppendixGovernance RemunerationOur business Performance review Ahold Delhaize Annual Report 2019 191
37 List of subsidiaries, joint ventures and associates The following are Ahold Delhaize’s significant subsidiaries, joint ventures and associates as of December 29, 2019:
Consolidated significant subsidiariesThe following subsidiaries are, directly or indirectly, wholly owned by Ahold Delhaize. Subsidiaries not important to providing an insight into the Ahold Delhaize Group as required under Dutch law are omitted from this list.
Retail trade EuropeAlbert Heijn B.V., Zaandam, the Netherlands* Albert Heijn Franchising B.V., Zaandam, the Netherlands* Gall & Gall B.V., Zaandam, the Netherlands* Etos B.V., Zaandam, the Netherlands* bol.com B.V., Utrecht, the Netherlands* Alfa-Beta Vassilopoulos S.A., Athens, Greece Delhaize Le Lion / De Leeuw Comm. VA, Brussels, Belgium Delhaize Serbia d.o.o. Beograd, Belgrade, Serbia Mega Image S.R.L., Bucharest, Romania Albert Česká republika, s.r.o., Prague, Czech Republic Albert Heijn België NV / SA, Antwerp, Belgium Delhaize Luxembourg S.A., Pommerloch, Grand-Duchy of Luxembourg
Retail trade United StatesThe Stop & Shop Supermarket Company LLC, Quincy, Massachusetts, United States Food Lion LLC, Salisbury, North Carolina, United States Giant Food Stores LLC, Carlisle, Pennsylvania, United States Giant of Maryland LLC, Landover, Maryland, United States Hannaford Bros. Co., LLC, Scarborough, Maine, United States Peapod LLC, Skokie, Illinois, United States
OtherAhold Delhaize Coffee Company B.V., Zaandam, the Netherlands* Ahold Europe Real Estate & Construction B.V., Zaandam, the Netherlands* Ahold Delhaize Finance Company N.V., Zug, Switzerland Ahold Finance U.S.A., LLC, Zaandam, the Netherlands* Ahold Insurance N.V., Willemstad, Curaçao Ahold Delhaize International Sàrl, Zug, Switzerland Ahold Information Services Inc., Greenville, South Carolina, United States Ahold Lease U.S.A. Inc., Quincy, Massachusetts, United States Ahold Delhaize Licensing Sàrl, Geneva, Switzerland Ahold Nederland B.V., Zaandam, the Netherlands* Ahold U.S.A. Inc., Quincy, Massachusetts, United States American Sales Company LLC, Lancaster, New York, United States CUW B.V., Willemstad, Curaçao Delhaize America LLC, Salisbury, North Carolina, United States Delhaize “The Lion” Nederland B.V., Zaandam, the Netherlands
Delhaize US Holding Inc., Salisbury, North Carolina, United States DZA Brands LLC, Salisbury, North Carolina, United States Lion Lux Finance Sàrl, Pommerloch, Grand-Duchy of Luxembourg Lion Retail Holding Sàrl, Pommerloch, Grand-Duchy of Luxembourg MAC Risk Management Inc., Quincy, Massachusetts, United States The MollyAnna Company, Montpelier, Vermont, United States Retail Business Services LLC, Delaware, United States
With respect to the separate financial statements of the Dutch legal entities included in the consolidation, a number of subsidiaries availed themselves of the exemption laid down in section 403, subsection 1 of Book 2 of the Dutch Civil Code. Pursuant to section 403, Ahold Delhaize has assumed joint and several liability for the debts arising out of the legal acts of these subsidiaries. The determination of which Dutch subsidiaries of Ahold Delhaize, whether significant in the context of this Note or not, make use of the 403 exemption follows from the Dutch trade register. Each of these subsidiaries has filed Ahold Delhaize’s 403 declaration with the Dutch trade register. The above significant subsidiaries that make use of the 403 exemption are marked by *.
Significant joint ventures and associates (unconsolidated)JMR – Gestão de Empresas de Retalho, SGPS, S.A., Lisbon, Portugal (49% owned by Ahold Delhaize’s subsidiary Ahold Delhaize International Sàrl)
P.T. Lion Super Indo, Jakarta, Indonesia (51% owned by Ahold Delhaize’s subsidiary Delhaize “The Lion” Nederland B.V.)
38 Subsequent events Closure of Midwest online grocery sales operationsOn February 11, 2020, Ahold Delhaize USA announced plans to close the Midwest division of its Peapod online grocery sales business. The Company expects no significant impact to reported operating profits from the closure.
Tentative collective bargaining agreement Giant FoodGiant Food announced on February 19, 2020 that it reached a tentative agreement with UFCW Locals 27 and 400 (the “Union Locals”) on new four-year collective bargaining agreements. The current collective bargaining agreements were originally scheduled to expire on October 26, 2019. However, Giant Food and the Union Locals agreed to indefinitely extend the existing collective agreements, provided that either side may cancel the extension at any time upon 72 hours’ advance notice. The applicable bargaining unit members are scheduled to vote on whether to ratify the new collective bargaining agreements on March 5, 2020.
Giant Food’s negotiations with the Union Locals covered all terms and conditions of employment for the applicable bargaining unit members. Retirement benefits were one aspect of the negotiations. Giant Food and the Union Locals also reached a general agreement on Giant’s funding obligations with respect to the FELRA and UFCW Pension Plan and the Mid-Atlantic UFCW and Participating Employers Pension Plan (the “Plans”). The implementation of the tentative agreement with respect to the Plans remains also subject to further discussions with various stakeholders, including the U.S. Pension Benefit Guaranty Corporation and the other significant contributing employer to the Plans. See Note 24 to the consolidated financial statements for more information on the Plans.
Financial statements Other informationStrategic Report Governance Financial performance AppendixGovernance RemunerationOur business Performance review Ahold Delhaize Annual Report 2019 192
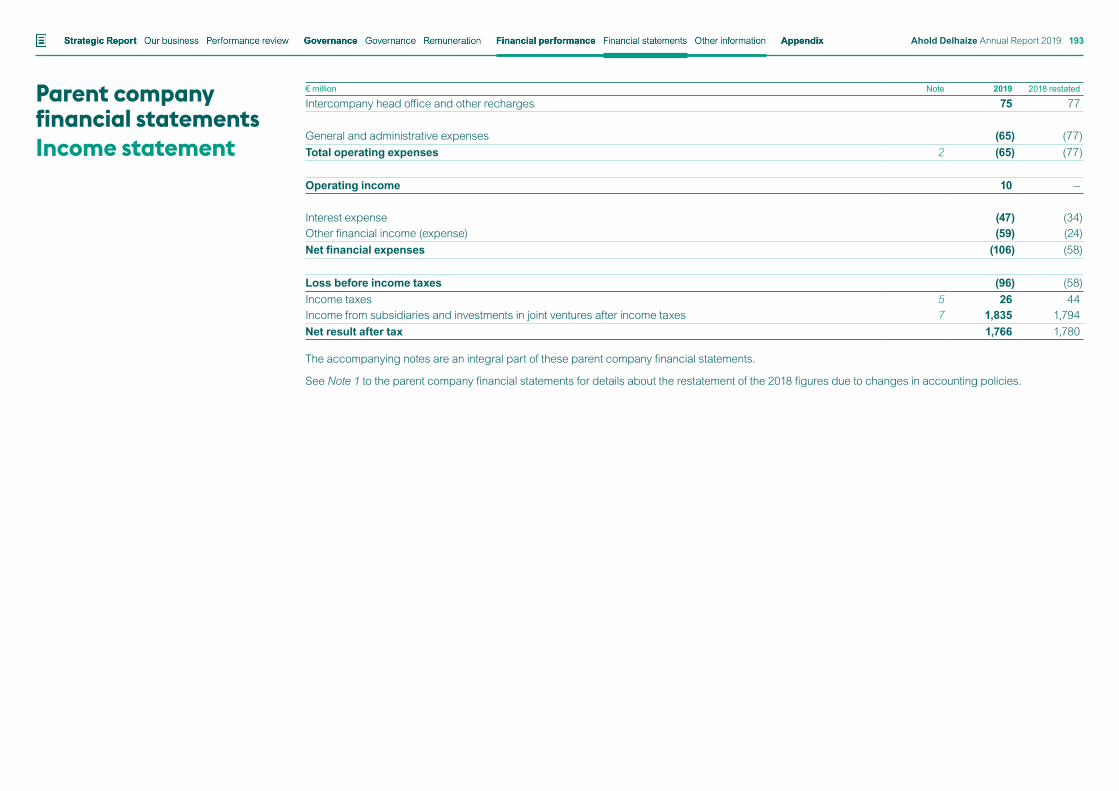
€ million Note 2019 2018 restated
Intercompany head office and other recharges 75 77
General and administrative expenses (65) (77)Total operating expenses 2 (65) (77)
Operating income 10 —
Interest expense (47) (34)Other financial income (expense) (59) (24)Net financial expenses (106) (58)
Loss before income taxes (96) (58)Income taxes 5 26 44Income from subsidiaries and investments in joint ventures after income taxes 7 1,835 1,794Net result after tax 1,766 1,780
The accompanying notes are an integral part of these parent company financial statements.
See Note 1 to the parent company financial statements for details about the restatement of the 2018 figures due to changes in accounting policies.
Parent company financial statementsIncome statement
Financial statements Other informationStrategic Report Governance Financial performance AppendixGovernance RemunerationOur business Performance review Ahold Delhaize Annual Report 2019 193
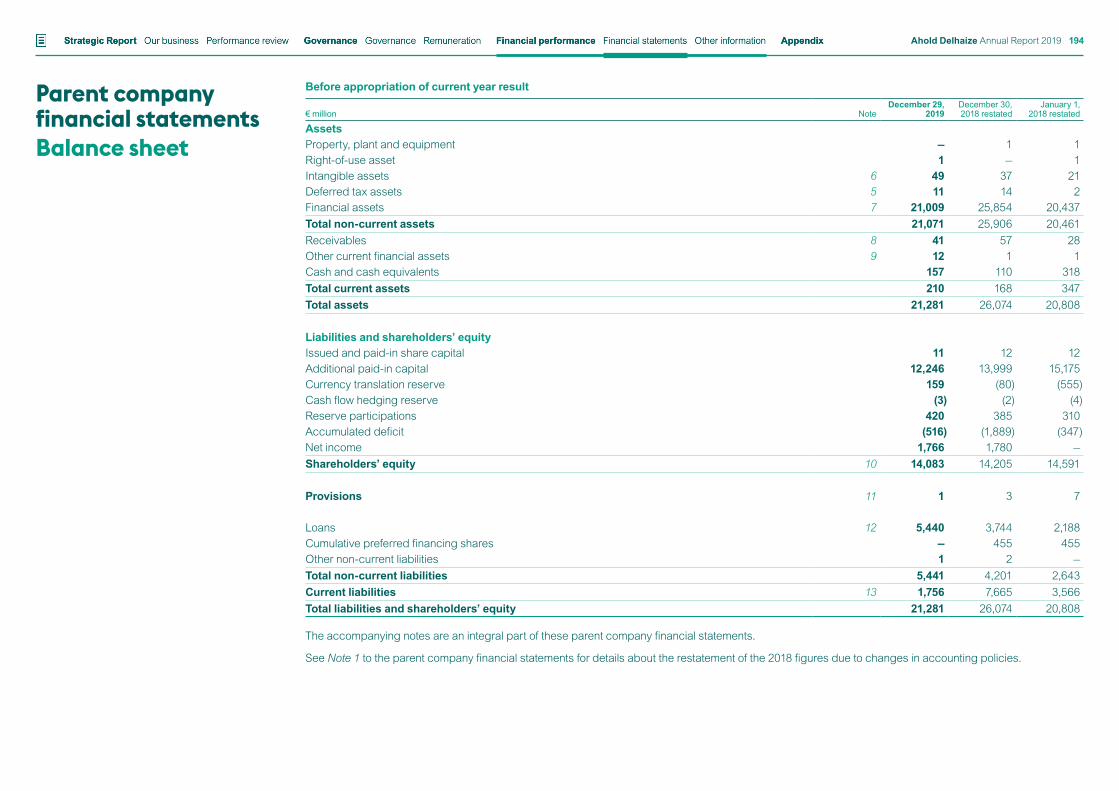
Parent company financial statementsBalance sheet
Before appropriation of current year result
€ million NoteDecember 29,
2019December 30, 2018 restated
January 1, 2018 restated
AssetsProperty, plant and equipment — 1 1Right-of-use asset 1 — 1Intangible assets 6 49 37 21Deferred tax assets 5 11 14 2Financial assets 7 21,009 25,854 20,437Total non-current assets 21,071 25,906 20,461Receivables 8 41 57 28Other current financial assets 9 12 1 1Cash and cash equivalents 157 110 318Total current assets 210 168 347Total assets 21,281 26,074 20,808
Liabilities and shareholders’ equityIssued and paid-in share capital 11 12 12Additional paid-in capital 12,246 13,999 15,175Currency translation reserve 159 (80) (555)Cash flow hedging reserve (3) (2) (4)Reserve participations 420 385 310Accumulated deficit (516) (1,889) (347)Net income 1,766 1,780 —Shareholders’ equity 10 14,083 14,205 14,591
Provisions 11 1 3 7
Loans 12 5,440 3,744 2,188Cumulative preferred financing shares — 455 455Other non-current liabilities 1 2 —Total non-current liabilities 5,441 4,201 2,643Current liabilities 13 1,756 7,665 3,566Total liabilities and shareholders’ equity 21,281 26,074 20,808
The accompanying notes are an integral part of these parent company financial statements.
See Note 1 to the parent company financial statements for details about the restatement of the 2018 figures due to changes in accounting policies.
Financial statements Other informationStrategic Report Governance Financial performance AppendixGovernance RemunerationOur business Performance review Ahold Delhaize Annual Report 2019 194
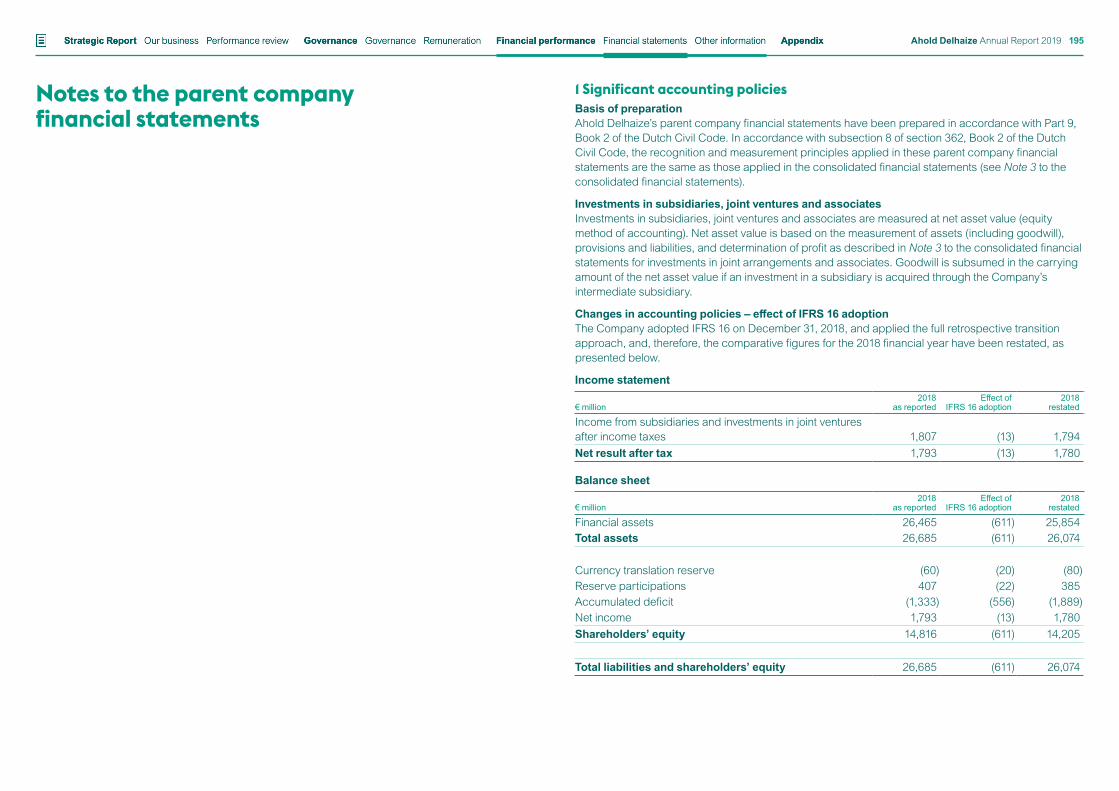
Notes to the parent company financial statements
1 Significant accounting policiesBasis of preparationAhold Delhaize’s parent company financial statements have been prepared in accordance with Part 9, Book 2 of the Dutch Civil Code. In accordance with subsection 8 of section 362, Book 2 of the Dutch Civil Code, the recognition and measurement principles applied in these parent company financial statements are the same as those applied in the consolidated financial statements (see Note 3 to the consolidated financial statements).
Investments in subsidiaries, joint ventures and associatesInvestments in subsidiaries, joint ventures and associates are measured at net asset value (equity method of accounting). Net asset value is based on the measurement of assets (including goodwill), provisions and liabilities, and determination of profit as described in Note 3 to the consolidated financial statements for investments in joint arrangements and associates. Goodwill is subsumed in the carrying amount of the net asset value if an investment in a subsidiary is acquired through the Company’s intermediate subsidiary.
Changes in accounting policies – effect of IFRS 16 adoptionThe Company adopted IFRS 16 on December 31, 2018, and applied the full retrospective transition approach, and, therefore, the comparative figures for the 2018 financial year have been restated, as presented below.
Income statement € million
2018 as reported
Effect of IFRS 16 adoption
2018 restated
Income from subsidiaries and investments in joint ventures after income taxes 1,807 (13) 1,794Net result after tax 1,793 (13) 1,780
Balance sheet € million
2018 as reported
Effect of IFRS 16 adoption
2018 restated
Financial assets 26,465 (611) 25,854Total assets 26,685 (611) 26,074
Currency translation reserve (60) (20) (80)Reserve participations 407 (22) 385Accumulated deficit (1,333) (556) (1,889)Net income 1,793 (13) 1,780Shareholders’ equity 14,816 (611) 14,205
Total liabilities and shareholders’ equity 26,685 (611) 26,074
Financial statements Other informationStrategic Report Governance Financial performance AppendixGovernance RemunerationOur business Performance review Ahold Delhaize Annual Report 2019 195
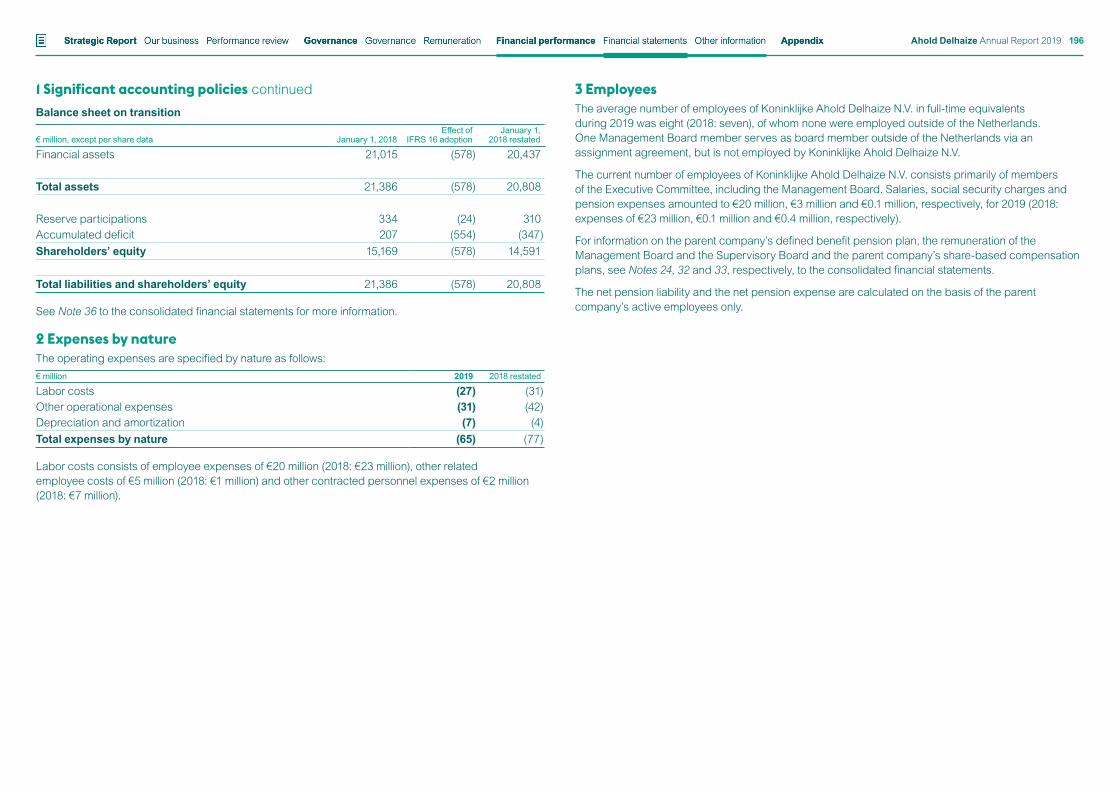
1 Significant accounting policies continuedBalance sheet on transition € million, except per share data January 1, 2018
Effect of IFRS 16 adoption
January 1, 2018 restated
Financial assets 21,015 (578) 20,437
Total assets 21,386 (578) 20,808
Reserve participations 334 (24) 310Accumulated deficit 207 (554) (347)Shareholders’ equity 15,169 (578) 14,591
Total liabilities and shareholders’ equity 21,386 (578) 20,808
See Note 36 to the consolidated financial statements for more information.
2 Expenses by nature The operating expenses are specified by nature as follows:€ million 2019 2018 restated
Labor costs (27) (31)Other operational expenses (31) (42)Depreciation and amortization (7) (4)Total expenses by nature (65) (77)
Labor costs consists of employee expenses of €20 million (2018: €23 million), other related employee costs of €5 million (2018: €1 million) and other contracted personnel expenses of €2 million (2018: €7 million).
3 Employees The average number of employees of Koninklijke Ahold Delhaize N.V. in full-time equivalents during 2019 was eight (2018: seven), of whom none were employed outside of the Netherlands. One Management Board member serves as board member outside of the Netherlands via an assignment agreement, but is not employed by Koninklijke Ahold Delhaize N.V.
The current number of employees of Koninklijke Ahold Delhaize N.V. consists primarily of members of the Executive Committee, including the Management Board. Salaries, social security charges and pension expenses amounted to €20 million, €3 million and €0.1 million, respectively, for 2019 (2018: expenses of €23 million, €0.1 million and €0.4 million, respectively).
For information on the parent company’s defined benefit pension plan, the remuneration of the Management Board and the Supervisory Board and the parent company’s share-based compensation plans, see Notes 24, 32 and 33, respectively, to the consolidated financial statements.
The net pension liability and the net pension expense are calculated on the basis of the parent company’s active employees only.
Financial statements Other informationStrategic Report Governance Financial performance AppendixGovernance RemunerationOur business Performance review Ahold Delhaize Annual Report 2019 196
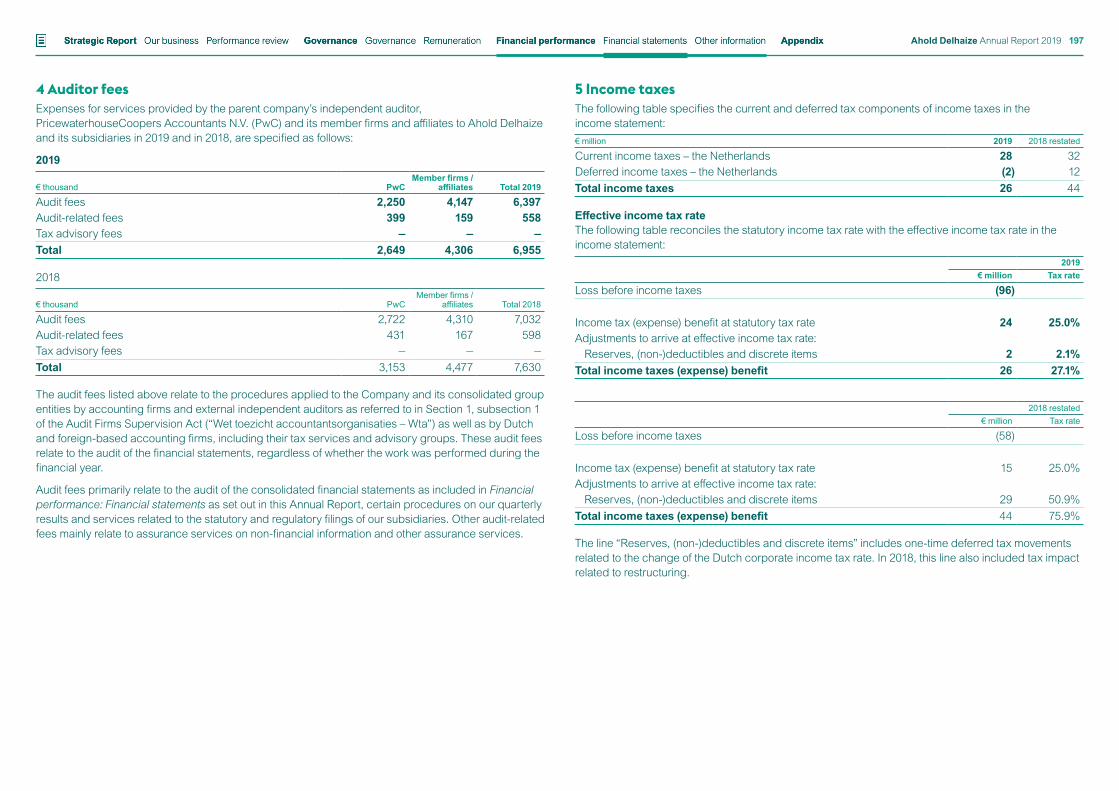
4 Auditor fees Expenses for services provided by the parent company’s independent auditor, PricewaterhouseCoopers Accountants N.V. (PwC) and its member firms and affiliates to Ahold Delhaize and its subsidiaries in 2019 and in 2018, are specified as follows:
2019
€ thousand PwCMember firms /
affiliates Total 2019
Audit fees 2,250 4,147 6,397Audit-related fees 399 159 558Tax advisory fees — — —Total 2,649 4,306 6,955
2018
€ thousand PwCMember firms /
affiliates Total 2018
Audit fees 2,722 4,310 7,032Audit-related fees 431 167 598Tax advisory fees — — —Total 3,153 4,477 7,630
The audit fees listed above relate to the procedures applied to the Company and its consolidated group entities by accounting firms and external independent auditors as referred to in Section 1, subsection 1 of the Audit Firms Supervision Act (“Wet toezicht accountantsorganisaties – Wta”) as well as by Dutch and foreign-based accounting firms, including their tax services and advisory groups. These audit fees relate to the audit of the financial statements, regardless of whether the work was performed during the financial year.
Audit fees primarily relate to the audit of the consolidated financial statements as included in Financial performance: Financial statements as set out in this Annual Report, certain procedures on our quarterly results and services related to the statutory and regulatory filings of our subsidiaries. Other audit-related fees mainly relate to assurance services on non-financial information and other assurance services.
5 Income taxesThe following table specifies the current and deferred tax components of income taxes in the income statement:€ million 2019 2018 restated
Current income taxes – the Netherlands 28 32Deferred income taxes – the Netherlands (2) 12Total income taxes 26 44
Effective income tax rate The following table reconciles the statutory income tax rate with the effective income tax rate in the income statement:
2019 € million Tax rate
Loss before income taxes (96)
Income tax (expense) benefit at statutory tax rate 24 25.0%Adjustments to arrive at effective income tax rate:
Reserves, (non-)deductibles and discrete items 2 2.1%Total income taxes (expense) benefit 26 27.1%
2018 restated € million Tax rate
Loss before income taxes (58)
Income tax (expense) benefit at statutory tax rate 15 25.0%Adjustments to arrive at effective income tax rate:
Reserves, (non-)deductibles and discrete items 29 50.9%Total income taxes (expense) benefit 44 75.9%
The line “Reserves, (non-)deductibles and discrete items” includes one-time deferred tax movements related to the change of the Dutch corporate income tax rate. In 2018, this line also included tax impact related to restructuring.
Financial statements Other informationStrategic Report Governance Financial performance AppendixGovernance RemunerationOur business Performance review Ahold Delhaize Annual Report 2019 197
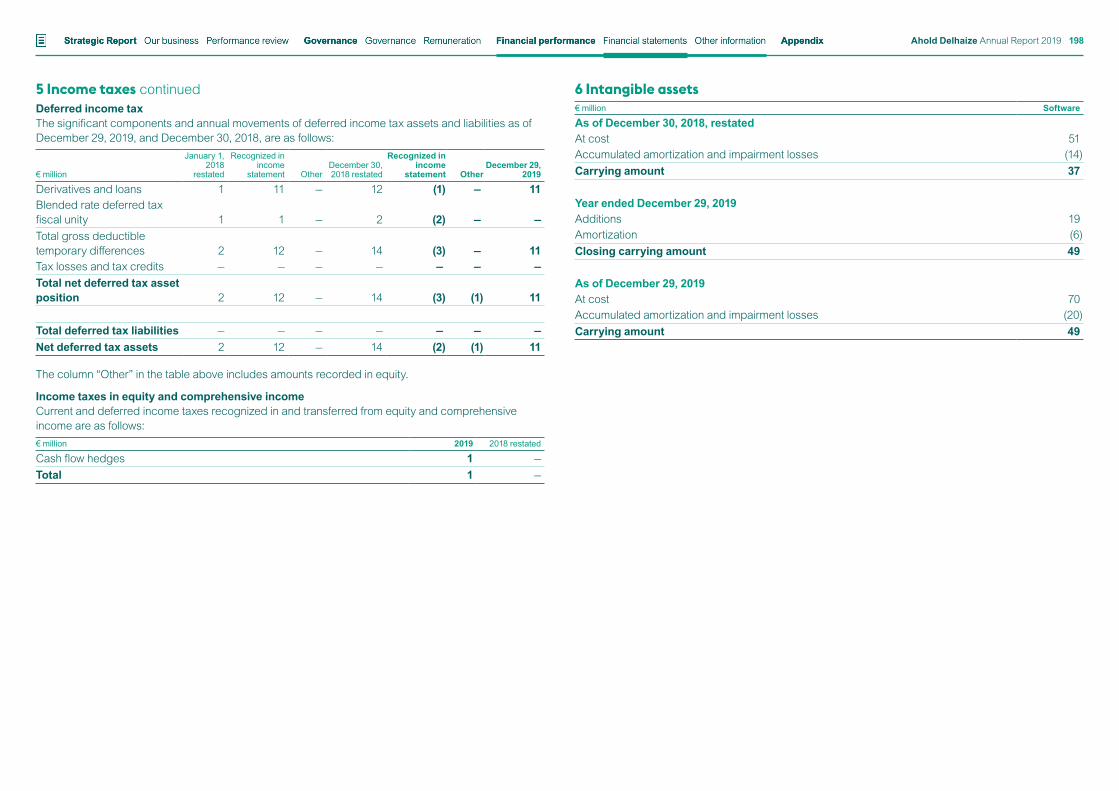
5 Income taxes continuedDeferred income taxThe significant components and annual movements of deferred income tax assets and liabilities as of December 29, 2019, and December 30, 2018, are as follows:
€ million
January 1, 2018
restated
Recognized in income
statement OtherDecember 30, 2018 restated
Recognized in income
statement OtherDecember 29,
2019
Derivatives and loans 1 11 — 12 (1) — 11Blended rate deferred tax fiscal unity 1 1 — 2 (2) — —Total gross deductible temporary differences 2 12 — 14 (3) — 11Tax losses and tax credits — — — — — — —Total net deferred tax asset position 2 12 — 14 (3) (1) 11
Total deferred tax liabilities — — — — — — —Net deferred tax assets 2 12 — 14 (2) (1) 11
The column “Other” in the table above includes amounts recorded in equity.
Income taxes in equity and comprehensive income Current and deferred income taxes recognized in and transferred from equity and comprehensive income are as follows:€ million 2019 2018 restated
Cash flow hedges 1 —Total 1 —
6 Intangible assets € million Software
As of December 30, 2018, restatedAt cost 51Accumulated amortization and impairment losses (14)Carrying amount 37
Year ended December 29, 2019Additions 19Amortization (6)Closing carrying amount 49
As of December 29, 2019At cost 70Accumulated amortization and impairment losses (20)Carrying amount 49
Financial statements Other informationStrategic Report Governance Financial performance AppendixGovernance RemunerationOur business Performance review Ahold Delhaize Annual Report 2019 198
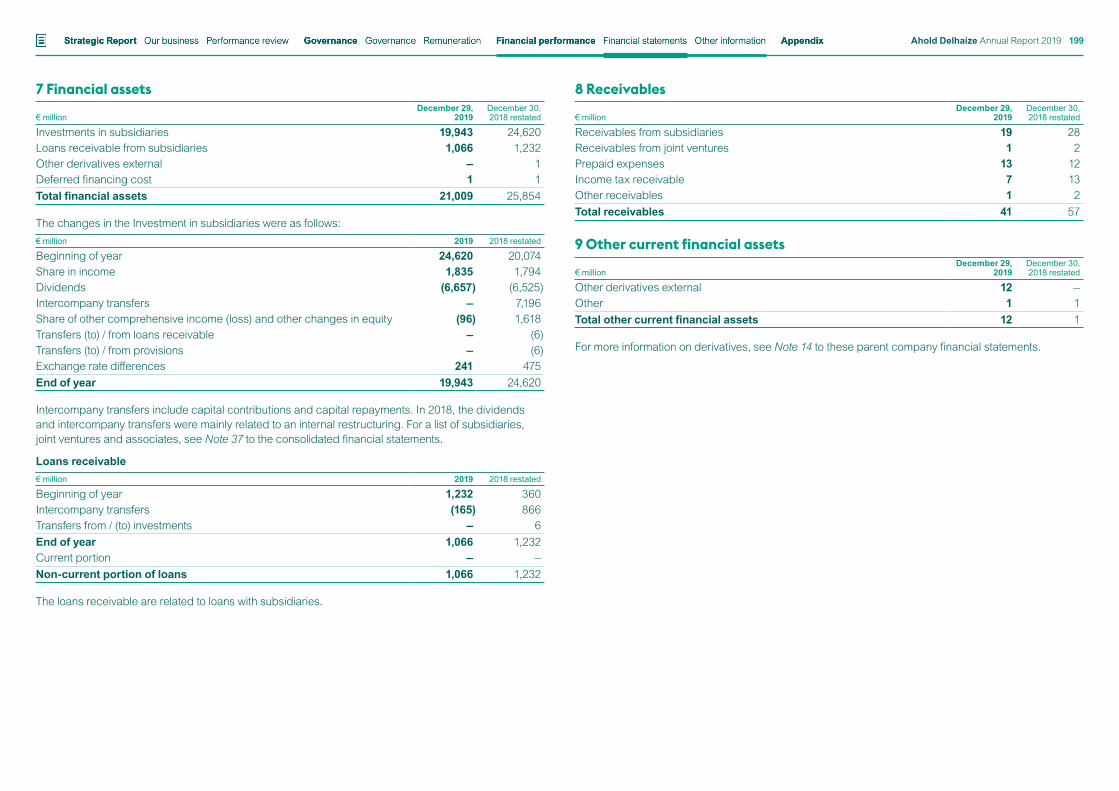
7 Financial assets
€ millionDecember 29,
2019December 30, 2018 restated
Investments in subsidiaries 19,943 24,620Loans receivable from subsidiaries 1,066 1,232Other derivatives external — 1Deferred financing cost 1 1Total financial assets 21,009 25,854
The changes in the Investment in subsidiaries were as follows: € million 2019 2018 restated
Beginning of year 24,620 20,074Share in income 1,835 1,794Dividends (6,657) (6,525)Intercompany transfers — 7,196Share of other comprehensive income (loss) and other changes in equity (96) 1,618Transfers (to) / from loans receivable — (6)Transfers (to) / from provisions — (6)Exchange rate differences 241 475End of year 19,943 24,620
Intercompany transfers include capital contributions and capital repayments. In 2018, the dividends and intercompany transfers were mainly related to an internal restructuring. For a list of subsidiaries, joint ventures and associates, see Note 37 to the consolidated financial statements.
Loans receivable € million 2019 2018 restated
Beginning of year 1,232 360Intercompany transfers (165) 866Transfers from / (to) investments — 6End of year 1,066 1,232Current portion — —Non-current portion of loans 1,066 1,232
The loans receivable are related to loans with subsidiaries.
8 Receivables
€ millionDecember 29,
2019December 30, 2018 restated
Receivables from subsidiaries 19 28Receivables from joint ventures 1 2Prepaid expenses 13 12Income tax receivable 7 13Other receivables 1 2Total receivables 41 57
9 Other current financial assets
€ millionDecember 29,
2019December 30, 2018 restated
Other derivatives external 12 —Other 1 1Total other current financial assets 12 1
For more information on derivatives, see Note 14 to these parent company financial statements.
Financial statements Other informationStrategic Report Governance Financial performance AppendixGovernance RemunerationOur business Performance review Ahold Delhaize Annual Report 2019 199
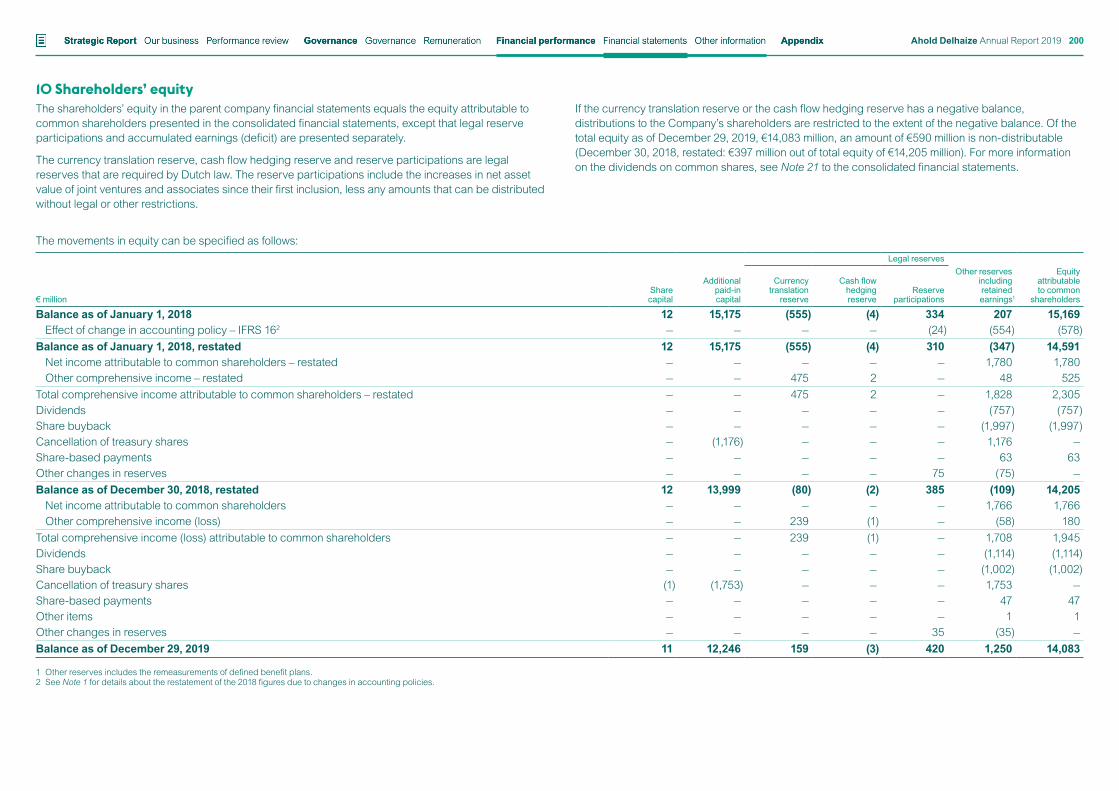
10 Shareholders’ equityThe shareholders’ equity in the parent company financial statements equals the equity attributable to common shareholders presented in the consolidated financial statements, except that legal reserve participations and accumulated earnings (deficit) are presented separately.
The currency translation reserve, cash flow hedging reserve and reserve participations are legal reserves that are required by Dutch law. The reserve participations include the increases in net asset value of joint ventures and associates since their first inclusion, less any amounts that can be distributed without legal or other restrictions.
If the currency translation reserve or the cash flow hedging reserve has a negative balance, distributions to the Company’s shareholders are restricted to the extent of the negative balance. Of the total equity as of December 29, 2019, €14,083 million, an amount of €590 million is non-distributable (December 30, 2018, restated: €397 million out of total equity of €14,205 million). For more information on the dividends on common shares, see Note 21 to the consolidated financial statements.
The movements in equity can be specified as follows:
€ million
Legal reserves
Share capital
Additional paid-in capital
Currency translation
reserve
Cash flow hedging reserve
Reserve participations
Other reserves including retained earnings1
Equity attributable to common
shareholders
Balance as of January 1, 2018 12 15,175 (555) (4) 334 207 15,169Effect of change in accounting policy – IFRS 162 — — — — (24) (554) (578)
Balance as of January 1, 2018, restated 12 15,175 (555) (4) 310 (347) 14,591Net income attributable to common shareholders – restated — — — — — 1,780 1,780Other comprehensive income – restated — — 475 2 — 48 525
Total comprehensive income attributable to common shareholders – restated — — 475 2 — 1,828 2,305Dividends — — — — — (757) (757)Share buyback — — — — — (1,997) (1,997)Cancellation of treasury shares — (1,176) — — — 1,176 —Share-based payments — — — — — 63 63Other changes in reserves — — — — 75 (75) —Balance as of December 30, 2018, restated 12 13,999 (80) (2) 385 (109) 14,205
Net income attributable to common shareholders — — — — — 1,766 1,766Other comprehensive income (loss) — — 239 (1) — (58) 180
Total comprehensive income (loss) attributable to common shareholders — — 239 (1) — 1,708 1,945Dividends — — — — — (1,114) (1,114)Share buyback — — — — — (1,002) (1,002)Cancellation of treasury shares (1) (1,753) — — — 1,753 —Share-based payments — — — — — 47 47Other items — — — — — 1 1Other changes in reserves — — — — 35 (35) —Balance as of December 29, 2019 11 12,246 159 (3) 420 1,250 14,083
1 Other reserves includes the remeasurements of defined benefit plans. 2 See Note 1 for details about the restatement of the 2018 figures due to changes in accounting policies.
Financial statements Other informationStrategic Report Governance Financial performance AppendixGovernance RemunerationOur business Performance review Ahold Delhaize Annual Report 2019 200
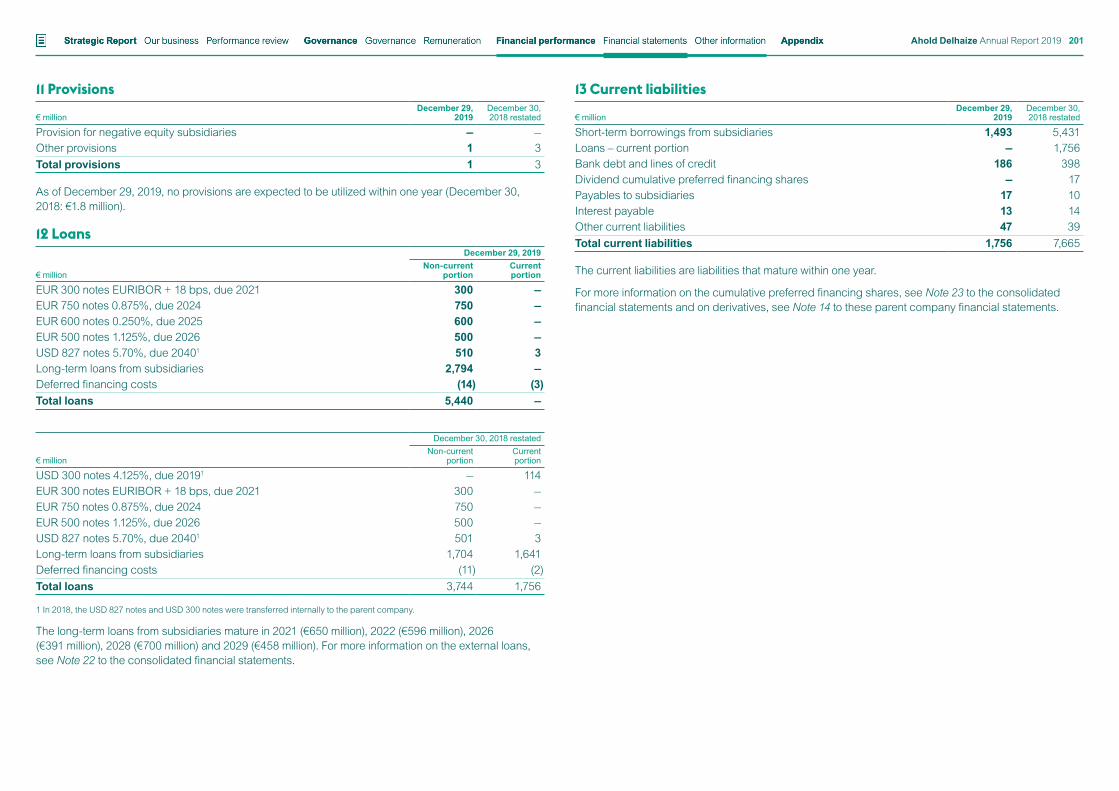
11 Provisions
€ millionDecember 29,
2019December 30, 2018 restated
Provision for negative equity subsidiaries — —Other provisions 1 3Total provisions 1 3
As of December 29, 2019, no provisions are expected to be utilized within one year (December 30, 2018: €1.8 million).
12 Loans
€ million
December 29, 2019Non-current
portionCurrent portion
EUR 300 notes EURIBOR + 18 bps, due 2021 300 —EUR 750 notes 0.875%, due 2024 750 —EUR 600 notes 0.250%, due 2025 600 —EUR 500 notes 1.125%, due 2026 500 —USD 827 notes 5.70%, due 20401 510 3Long-term loans from subsidiaries 2,794 —Deferred financing costs (14) (3)Total loans 5,440 —
€ million
December 30, 2018 restatedNon-current
portionCurrent portion
USD 300 notes 4.125%, due 20191 — 114EUR 300 notes EURIBOR + 18 bps, due 2021 300 —EUR 750 notes 0.875%, due 2024 750 —EUR 500 notes 1.125%, due 2026 500 —USD 827 notes 5.70%, due 20401 501 3Long-term loans from subsidiaries 1,704 1,641Deferred financing costs (11) (2)Total loans 3,744 1,756
1 In 2018, the USD 827 notes and USD 300 notes were transferred internally to the parent company.
The long-term loans from subsidiaries mature in 2021 (€650 million), 2022 (€596 million), 2026 (€391 million), 2028 (€700 million) and 2029 (€458 million). For more information on the external loans, see Note 22 to the consolidated financial statements.
13 Current liabilities
€ millionDecember 29,
2019December 30, 2018 restated
Short-term borrowings from subsidiaries 1,493 5,431Loans – current portion — 1,756Bank debt and lines of credit 186 398Dividend cumulative preferred financing shares — 17Payables to subsidiaries 17 10Interest payable 13 14Other current liabilities 47 39Total current liabilities 1,756 7,665
The current liabilities are liabilities that mature within one year.
For more information on the cumulative preferred financing shares, see Note 23 to the consolidated financial statements and on derivatives, see Note 14 to these parent company financial statements.
Financial statements Other informationStrategic Report Governance Financial performance AppendixGovernance RemunerationOur business Performance review Ahold Delhaize Annual Report 2019 201
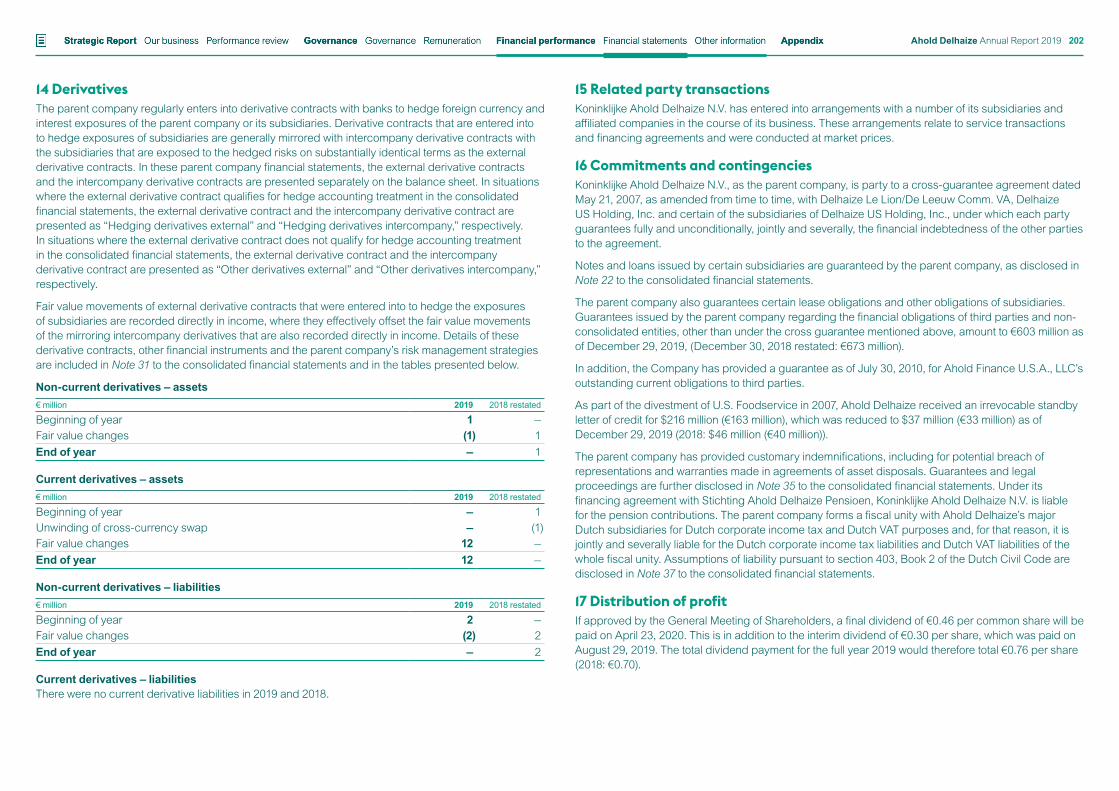
14 DerivativesThe parent company regularly enters into derivative contracts with banks to hedge foreign currency and interest exposures of the parent company or its subsidiaries. Derivative contracts that are entered into to hedge exposures of subsidiaries are generally mirrored with intercompany derivative contracts with the subsidiaries that are exposed to the hedged risks on substantially identical terms as the external derivative contracts. In these parent company financial statements, the external derivative contracts and the intercompany derivative contracts are presented separately on the balance sheet. In situations where the external derivative contract qualifies for hedge accounting treatment in the consolidated financial statements, the external derivative contract and the intercompany derivative contract are presented as “Hedging derivatives external” and “Hedging derivatives intercompany,” respectively. In situations where the external derivative contract does not qualify for hedge accounting treatment in the consolidated financial statements, the external derivative contract and the intercompany derivative contract are presented as “Other derivatives external” and “Other derivatives intercompany,” respectively.
Fair value movements of external derivative contracts that were entered into to hedge the exposures of subsidiaries are recorded directly in income, where they effectively offset the fair value movements of the mirroring intercompany derivatives that are also recorded directly in income. Details of these derivative contracts, other financial instruments and the parent company’s risk management strategies are included in Note 31 to the consolidated financial statements and in the tables presented below.
Non-current derivatives – assets€ million 2019 2018 restated
Beginning of year 1 —Fair value changes (1) 1End of year — 1
Current derivatives – assets€ million 2019 2018 restated
Beginning of year — 1Unwinding of cross-currency swap — (1)Fair value changes 12 —End of year 12 —
Non-current derivatives – liabilities€ million 2019 2018 restated
Beginning of year 2 —Fair value changes (2) 2End of year — 2
Current derivatives – liabilitiesThere were no current derivative liabilities in 2019 and 2018.
15 Related party transactionsKoninklijke Ahold Delhaize N.V. has entered into arrangements with a number of its subsidiaries and affiliated companies in the course of its business. These arrangements relate to service transactions and financing agreements and were conducted at market prices.
16 Commitments and contingenciesKoninklijke Ahold Delhaize N.V., as the parent company, is party to a cross-guarantee agreement dated May 21, 2007, as amended from time to time, with Delhaize Le Lion/De Leeuw Comm. VA, Delhaize US Holding, Inc. and certain of the subsidiaries of Delhaize US Holding, Inc., under which each party guarantees fully and unconditionally, jointly and severally, the financial indebtedness of the other parties to the agreement.
Notes and loans issued by certain subsidiaries are guaranteed by the parent company, as disclosed in Note 22 to the consolidated financial statements.
The parent company also guarantees certain lease obligations and other obligations of subsidiaries. Guarantees issued by the parent company regarding the financial obligations of third parties and non-consolidated entities, other than under the cross guarantee mentioned above, amount to €603 million as of December 29, 2019, (December 30, 2018 restated: €673 million).
In addition, the Company has provided a guarantee as of July 30, 2010, for Ahold Finance U.S.A., LLC’s outstanding current obligations to third parties.
As part of the divestment of U.S. Foodservice in 2007, Ahold Delhaize received an irrevocable standby letter of credit for $216 million (€163 million), which was reduced to $37 million (€33 million) as of December 29, 2019 (2018: $46 million (€40 million)).
The parent company has provided customary indemnifications, including for potential breach of representations and warranties made in agreements of asset disposals. Guarantees and legal proceedings are further disclosed in Note 35 to the consolidated financial statements. Under its financing agreement with Stichting Ahold Delhaize Pensioen, Koninklijke Ahold Delhaize N.V. is liable for the pension contributions. The parent company forms a fiscal unity with Ahold Delhaize’s major Dutch subsidiaries for Dutch corporate income tax and Dutch VAT purposes and, for that reason, it is jointly and severally liable for the Dutch corporate income tax liabilities and Dutch VAT liabilities of the whole fiscal unity. Assumptions of liability pursuant to section 403, Book 2 of the Dutch Civil Code are disclosed in Note 37 to the consolidated financial statements.
17 Distribution of profitIf approved by the General Meeting of Shareholders, a final dividend of €0.46 per common share will be paid on April 23, 2020. This is in addition to the interim dividend of €0.30 per share, which was paid on August 29, 2019. The total dividend payment for the full year 2019 would therefore total €0.76 per share (2018: €0.70).
Financial statements Other informationStrategic Report Governance Financial performance AppendixGovernance RemunerationOur business Performance review Ahold Delhaize Annual Report 2019 202
18 Subsequent eventsFor information regarding subsequent events, see Note 38 to the consolidated financial statements.
Zaandam, the Netherlands February 25, 2020
Management Board Frans Muller Jeff Carr Kevin Holt Wouter Kolk
Supervisory Board Jan Hommen (Chairman) Bill McEwan (Vice Chairman) Jacques de Vaucleroy (Vice Chairman) René Hooft Graafland Ben Noteboom Mary Anne Citrino Dominique Leroy Katie Doyle Peter Agnefjäll
Financial statements Other informationStrategic Report Governance Financial performance AppendixGovernance RemunerationOur business Performance review Ahold Delhaize Annual Report 2019 203
Assurance report on the financial statementsIndependent auditor’s report
To: the General Meeting and the Supervisory Board of Koninklijke Ahold Delhaize N.V.
Report on the financial statements for the period December 31, 2018 to December 29, 2019Our opinionIn our opinion:
• Koninklijke Ahold Delhaize N.V.’s consolidated financial statements give a true and fair view of the financial position of the Group as at December 29, 2019 and of its result and cash flows for the period from December 31, 2018 to December 29, 2019 in accordance with International Financial Reporting Standards as adopted by the European Union (EU-IFRS) and with Part 9 of Book 2 of the Dutch Civil Code;
• Koninklijke Ahold Delhaize N.V.’s parent company financial statements give a true and fair view of the financial position of the Company as at December 29, 2019 and of its result for the period from December 31, 2018 to December 29, 2019 in accordance with Part 9 of Book 2 of the Dutch Civil Code.
What we have auditedWe have audited the accompanying financial statements for the period December 31, 2018 to December 29, 2019 of Koninklijke Ahold Delhaize N.V., Zaandam, The Netherlands. The financial statements include the consolidated financial statements of Koninklijke Ahold Delhaize N.V. together with its subsidiaries (“the Group”) and the parent company financial statements.
The consolidated financial statements comprise:
• the consolidated balance sheet as at December 29, 2019;
• the following statements for the period from December 31, 2018 to December 29, 2019: the consolidated income statement, the consolidated statements of comprehensive income, changes in equity and cash flows; and
• the notes, comprising a summary of significant accounting policies and other explanatory information.
The parent company financial statements comprise:
• the parent company balance sheet as at December 29, 2019;
• the parent company income statement for the period from December 31, 2018 to December 29, 2019;
• the notes, comprising a summary of accounting policies applied and other explanatory information.
The financial reporting framework applied in the preparation of the financial statements is EU-IFRS and the relevant provisions of Part 9 of Book 2 of the Dutch Civil Code for the consolidated financial statements and Part 9 of Book 2 of the Dutch Civil Code for the parent company financial statements.
The basis for our opinionWe conducted our audit in accordance with Dutch law, including the Dutch Standards on Auditing. We have further described our responsibilities under those standards in the section “Our responsibilities for the audit of the financial statements” of our report.
We believe that the audit evidence we have obtained is sufficient and appropriate to provide a basis for our opinion.
IndependenceWe are independent of Koninklijke Ahold Delhaize N.V. in accordance with the European Union Regulation on specific requirements regarding statutory audit of public-interest entities, the “Wet toezicht accountantsorganisaties” (Wta, Audit firms supervision act), the “Verordening inzake de onafhankelijkheid van accountants bij assuranceopdrachten” (ViO, Code of Ethics for Professional Accountants, a regulation with respect to independence) and other relevant independence requirements in the Netherlands. Furthermore, we have complied with the “Verordening gedrags- en beroepsregels accountants” (VGBA, Dutch Code of Ethics).
Our audit approachOverview and contextKoninklijke Ahold Delhaize N.V. is an international food retail group operating supermarkets and e-commerce platforms in Belgium, the Czech Republic, Greece, Luxembourg, the Netherlands, Romania, Serbia and the United States and through participating in joint ventures in Indonesia and Portugal. The Group is comprised of several components and therefore we considered our group audit scope and approach as set out in the section “The scope of our group audit”. We paid specific attention to the areas of focus driven by the operations of the Group, as set out below.
As part of designing our audit, we determined materiality and assessed the risks of material misstatement in the financial statements. In particular, we considered where the Management Board made important judgments, for example, in respect of significant accounting estimates that involved making assumptions and considering future events that are inherently uncertain. In Note 2 of the financial statements, the company describes the areas of judgment in applying accounting policies and the key sources of estimation uncertainty.
As in 2018, we considered the impairment testing of goodwill and brand names, and the recognition of vendor allowance income as key audit matters, in view of the significant estimation uncertainty and the related higher inherent risks of material misstatement. Furthermore, we continue to consider the employee benefit plan measurement and disclosures as a key audit matter because of the complexity and judgment required in auditing the defined benefit obligation estimates as well as the extensive disclosures required, specifically in the area of the group’s participation in US multi-employer plans. In addition, we continue to consider the recognition of leases as a key audit matter, however as for this year this matter relates to the recognition of the right-of-use asset and the lease liability as part of first-year adoption of the leasing standard (IFRS 16). We considered this a key audit matter in view of the magnitude of the amounts involved, the implementation process required to identify and process all
Financial statements Other informationStrategic Report Governance Financial performance AppendixGovernance RemunerationOur business Performance review Ahold Delhaize Annual Report 2019 204
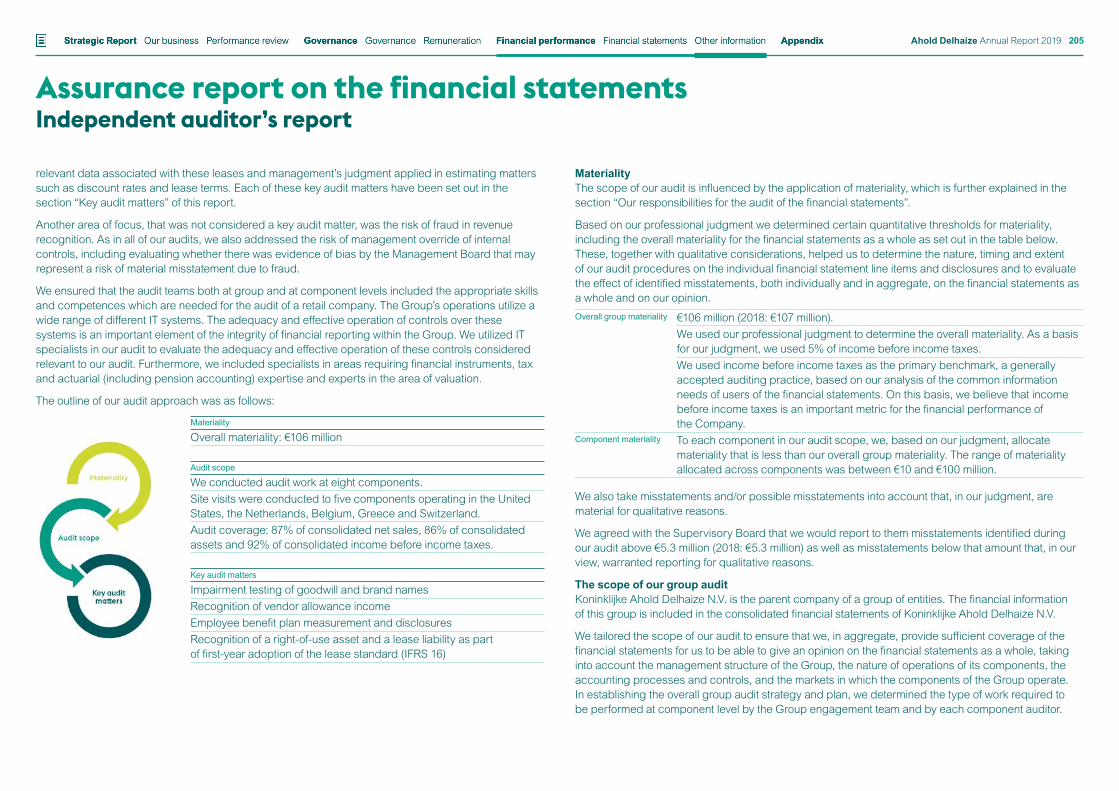
Assurance report on the financial statementsIndependent auditor’s report
relevant data associated with these leases and management’s judgment applied in estimating matters such as discount rates and lease terms. Each of these key audit matters have been set out in the section “Key audit matters” of this report.
Another area of focus, that was not considered a key audit matter, was the risk of fraud in revenue recognition. As in all of our audits, we also addressed the risk of management override of internal controls, including evaluating whether there was evidence of bias by the Management Board that may represent a risk of material misstatement due to fraud.
We ensured that the audit teams both at group and at component levels included the appropriate skills and competences which are needed for the audit of a retail company. The Group’s operations utilize a wide range of different IT systems. The adequacy and effective operation of controls over these systems is an important element of the integrity of financial reporting within the Group. We utilized IT specialists in our audit to evaluate the adequacy and effective operation of these controls considered relevant to our audit. Furthermore, we included specialists in areas requiring financial instruments, tax and actuarial (including pension accounting) expertise and experts in the area of valuation.
The outline of our audit approach was as follows:
Materiality
Overall materiality: €106 million
Audit scope
We conducted audit work at eight components. Site visits were conducted to five components operating in the United States, the Netherlands, Belgium, Greece and Switzerland.Audit coverage: 87% of consolidated net sales, 86% of consolidated assets and 92% of consolidated income before income taxes.
Key audit matters
Impairment testing of goodwill and brand namesRecognition of vendor allowance incomeEmployee benefit plan measurement and disclosuresRecognition of a right-of-use asset and a lease liability as part of first-year adoption of the lease standard (IFRS 16)
MaterialityThe scope of our audit is influenced by the application of materiality, which is further explained in the section “Our responsibilities for the audit of the financial statements”.
Based on our professional judgment we determined certain quantitative thresholds for materiality, including the overall materiality for the financial statements as a whole as set out in the table below. These, together with qualitative considerations, helped us to determine the nature, timing and extent of our audit procedures on the individual financial statement line items and disclosures and to evaluate the effect of identified misstatements, both individually and in aggregate, on the financial statements as a whole and on our opinion.Overall group materiality €106 million (2018: €107 million).
We used our professional judgment to determine the overall materiality. As a basis for our judgment, we used 5% of income before income taxes.We used income before income taxes as the primary benchmark, a generally accepted auditing practice, based on our analysis of the common information needs of users of the financial statements. On this basis, we believe that income before income taxes is an important metric for the financial performance of the Company.
Component materiality To each component in our audit scope, we, based on our judgment, allocate materiality that is less than our overall group materiality. The range of materiality allocated across components was between €10 and €100 million.
We also take misstatements and/or possible misstatements into account that, in our judgment, are material for qualitative reasons.
We agreed with the Supervisory Board that we would report to them misstatements identified during our audit above €5.3 million (2018: €5.3 million) as well as misstatements below that amount that, in our view, warranted reporting for qualitative reasons.
The scope of our group auditKoninklijke Ahold Delhaize N.V. is the parent company of a group of entities. The financial information of this group is included in the consolidated financial statements of Koninklijke Ahold Delhaize N.V.
We tailored the scope of our audit to ensure that we, in aggregate, provide sufficient coverage of the financial statements for us to be able to give an opinion on the financial statements as a whole, taking into account the management structure of the Group, the nature of operations of its components, the accounting processes and controls, and the markets in which the components of the Group operate. In establishing the overall group audit strategy and plan, we determined the type of work required to be performed at component level by the Group engagement team and by each component auditor.
Financial statements Other informationStrategic Report Governance Financial performance AppendixGovernance RemunerationOur business Performance review Ahold Delhaize Annual Report 2019 205
Assurance report on the financial statementsIndependent auditor’s report
The group audit primarily focused on the significant components; these components include the retail operations in the Unites States and the Netherlands as well as the Global Support Office activities in the Netherlands (which includes financing activities in Switzerland).
We subjected five components to audits of their complete financial information, of which three components are individually financially significant to the Group, as described in the paragraph above. The other two components, the Belgian and Greek retail operations, are selected to achieve appropriate audit coverage over the consolidated financial statements. Additionally, we selected three components for audit procedures to achieve appropriate coverage on financial line items in the consolidated financial statements or to build an element of unpredictability in our audit.
In total, in performing these procedures, we achieved the following coverage on the financial line items:
Consolidated net sales 87%Consolidated total assets 86%Consolidated income before income taxes 92%
None of the remaining components represented more than 4% of consolidated net sales, consolidated income before income taxes nor consolidated total assets. For those remaining components, we attended internal quarterly closing meetings with local and Group management and performed, among other things, analytical procedures to corroborate our assessment that there were no significant risks of material misstatements within those components.
The group engagement team performed the audit work on the Global Support Office activities in the Netherlands, which includes financing activities in Switzerland, the Group consolidation, the financial statement disclosures and a number of complex items. This included procedures performed over financial instruments such as loans and derivatives, goodwill impairment testing, Board remuneration including share-based payments and compliance of accounting positions taken by the Group in accordance with EU IFRS.
For all other components we used component auditors who are familiar with the local laws and regulations to perform the audit work.
Where component auditors performed the work, we determined the level of involvement we needed to have in their audit work to be able to conclude whether we had obtained sufficient and appropriate audit evidence as a basis for our opinion on the consolidated financial statements as a whole.
We issued instructions to the component audit teams in our audit scope. These instructions included amongst others our risk analysis, materiality and scope of the work. We explained to the component audit teams the structure of the Group, the main developments that are relevant for the component auditors, the risks identified, the materiality levels to be applied and our global audit approach. We had individual calls with each of the in-scope component audit teams during the year and upon conclusion of their work. During these calls, we discussed the significant accounting and audit issues identified by the component auditors, their reports, the findings of their procedures and other matters, which could be of relevance for the consolidated financial statements.
In the current year, the group audit team visited the United States, the Netherlands, Belgium, Greece and Switzerland component audit teams and local management. For each of these components we reviewed relevant parts of the component auditor’s audit files.
By performing the procedures above at components, combined with additional procedures at group level, we have been able to obtain, in aggregate, sufficient and appropriate audit evidence on the Group’s financial information, as a whole, to provide a basis for our opinion on the financial statements.
Key audit mattersKey audit matters are those matters that, in our professional judgment, were of most significance in the audit of the financial statements. We have communicated the key audit matters to the Supervisory Board. The key audit matters are not a comprehensive reflection of all matters identified by our audit and that we discussed. In this section, we described the key audit matters and included a summary of the audit procedures we performed on those matters.
We addressed the key audit matters in the context of our audit of the financial statements as a whole, and in forming our opinion thereon. We do not provide separate opinions on these matters or on specific elements of the financial statements. Any comment or observation we made on the results of our procedures should be read in this context.
Financial statements Other informationStrategic Report Governance Financial performance AppendixGovernance RemunerationOur business Performance review Ahold Delhaize Annual Report 2019 206
Assurance report on the financial statementsIndependent auditor’s report
Key audit matter Our audit work and observations
Impairment testing of goodwill and brand names Note 14As at December 29, 2019, the Group’s goodwill and brand names are valued at €10.5 billion. The majority of this balance (€6.7 billion) relates to the former Delhaize business acquired in 2016.
As disclosed in Note 2 and 3 to the consolidated financial statements, the Group tests its CGUs containing goodwill and brand names for impairment annually and if there is a triggering event at an earlier or later reporting date. This is done by comparing the recoverable amounts of the individual CGUs, being the higher of value-in-use and fair value less costs of disposal, to the carrying amounts. The Management Board performed its annual goodwill and brand names impairment test in accordance with IAS36 – Impairment of Assets and concluded that no impairment of goodwill or brand names was necessary.
We considered this to be a key audit matter because the assessment process is complex, especially with the effects on the impairment model of the inclusion of the right-of-use assets in the carrying amounts as a result of the implementation of IFRS16, involves significant management judgments and is based on key assumptions on expected future market and economic conditions, revenue growth, margin developments, the discount rates and (terminal) growth rates.
We evaluated management’s process and design effectiveness of controls over the impairment assessment including the appropriateness of management’s identification of the Group’s CGUs, indicators of impairment, discount rates and forecasts.
We have challenged management, primarily on their assumptions applied to which the outcome of the impairment test is the most sensitive, in particular, the projected revenue growth, operating margin developments, discount rates and (terminal) growth rates.
We benchmarked key market related assumptions (as disclosed in Note 14) against external data and challenged management by comparing the assumptions to historic performance of the company and local economic developments, taking into account the sensitivity test of the goodwill balances for any changes in the respective assumptions.
We involved our valuation experts to assist us in evaluating the appropriateness of the impairment model (including the changes as a result of the implementation of IFRS16), the discount rates applied and to assess the overall reasonableness of the assumptions. We compared the sum of the future cash flow forecasts of all CGUs to the market capitalization.
We also verified the mathematical accuracy of management’s valuation models and agreed relevant data, including assumptions on timing of future capital and operating expenditures to the five-year plan as approved by the Management Board.
Based on our procedures we did not identify material exceptions and we found management’s assumptions to be supported by available evidence.
Financial statements Other informationStrategic Report Governance Financial performance AppendixGovernance RemunerationOur business Performance review Ahold Delhaize Annual Report 2019 207
Assurance report on the financial statementsIndependent auditor’s report
Key audit matter Our audit work and observations
Recognition of vendor allowance incomeNote 2 and 3 The Group receives various types of vendor allowances from its suppliers, as further disclosed in Note 2 and 3 to the consolidated financial statements. These allowances are a significant component of cost of sales. The vendor allowance receivable at December 29, 2019, amounts to €585 million (Note 18).
The vendor allowance agreements with suppliers contain volume-related allowances, promotional and marketing allowances and various other fees and discounts received in connection with the purchase of goods for resale from those suppliers.
The Group recognizes vendor allowances as a reduction in cost of sales when the performance obligations associated with the allowances have been met, for example when the product has been sold, placed or when the marketing campaign has been held.
We considered this to be a key audit matter because of the magnitude of amounts involved and the judgment required from management to determine the nature and level of fulfilment of the Company’s obligations under the vendor agreements and to recognize the amounts in the correct period. This requires a detailed understanding of the contractual arrangements in addition to complete and accurate data to estimate purchase and sales volumes and fulfilment of promotional programs.
Our procedures included evaluating the design and testing the operating effectiveness of management’s controls around the completeness and accuracy of the contractual agreements recognized in the accounting system.
Furthermore, we challenged management’s assumptions used in determining the recognized vendor allowances through discussions with management and performing specific substantive audit procedures. For example, on a sample basis we agreed the recorded amounts to the vendor contracts and confirmed the related positions and terms with the vendors.
To determine the quality of the estimates made by management we performed a retrospective review of management judgments by testing subsequent collections on prior period vendor allowance receivables. These procedures showed us that the vendor allowances collected versus management’s estimates were reasonable. We also tested material write-offs and evaluated the nature to identify possible management bias.
Finally we tested whether the allowances were recorded in the correct period through assessing the obligation fulfilment of vendor allowances recorded during a period before and after year-end.
Based on our procedures we did not identify material exceptions and we found management’s recognition of vendor allowances to be supported by available evidence.
Financial statements Other informationStrategic Report Governance Financial performance AppendixGovernance RemunerationOur business Performance review Ahold Delhaize Annual Report 2019 208
Assurance report on the financial statementsIndependent auditor’s report
Key audit matter Our audit work and observations
Employee benefit plan measurement and disclosures Note 24 The Group has defined benefit plans, primarily in the Netherlands and in the United States, giving rise to defined benefit obligations of €5.9 billion and €1.5 billion, respectively.
The Group also has a significant number of union employees in the United States whose pension benefits are covered by multi-employer plans (we also refer to the risk factor on pension plan funding on page 100 of the Annual Report). A number of these plans are accounted for as defined contribution plans as there is insufficient information to account for these plans as defined benefit plans. In Note 24 management has disclosed certain facts and a calculation, which is based on assumptions, and leads to an estimate of the Group’s participation in these plans, including, for certain plans, the possible proportionate share of the total net deficit. As disclosed, this estimate does not necessarily reflect the Company’s liability, in case of withdrawal or insolvency of such plans.
We considered this to be a key audit matter because of the magnitude of the amounts involved, management’s significant judgment applied in estimating the actuarial and demographic assumptions (the most relevant being around salary increases, inflation, discount rates and mortality rates) and the technical expertise required to measure the resulting defined benefit pension obligation for the Group.
In addition, the US multi-employer plan rules are complex and certain plans are in endangered or critical status for which relevant material facts require adequate disclosure in the financial statements.
Our procedures included understanding and evaluating the design and testing the operating effectiveness of controls related to key inputs (such as payroll data) and key outputs of the Group’s pension process.
We tested the actuarial and demographic assumptions and valuation methodologies used by management to determine the Group’s various defined benefit pension obligations. We evaluated whether the key actuarial assumptions are reasonable (for example by comparing to the published actuarial tables) and consistently applied. We tested payroll data, through a combination of controls testing and test of details and reconciled the membership census data used in the actuarial models to the payroll data.
With the support from our valuation experts, we also tested the valuation of the pension assets. Depending on the type of asset, we either reconciled the value to publicly available information or challenged the assumptions used in determining the value by benchmarking assumptions to own expectations.
Finally, we assessed the adequacy of disclosures related to the employee defined benefit plans. We evaluated management’s disclosures and calculations in relation to the US multi-employer plans. For this purpose, we reconciled the disclosed facts and the related inputs used by management for the calculation to supporting documentation such as the latest available plan information and actuarial calculations.
Our procedures did not identify material exceptions, we considered management’s key assumptions to be within a reasonable range of our own expectations and we did not identify material exceptions in management’s disclosures or accounting conclusions.
Financial statements Other informationStrategic Report Governance Financial performance AppendixGovernance RemunerationOur business Performance review Ahold Delhaize Annual Report 2019 209
Assurance report on the financial statementsIndependent auditor’s report
Key audit matter Our audit work and observations
Recognition of a right-of-use asset and a lease liability as part of first-year adoption of the lease standard (IFRS 16) Note 12, 34 and 36 IFRS 16, Leases, became effective for annual reporting periods beginning on or after January 1, 2019. The company applied the full retrospective approach. The application of this new standard as disclosed in Note 36 gave rise to an increase in total consolidated assets of €6.5 billion, an increase in total consolidated liabilities of €7.1 billion and a corresponding offset in total consolidated equity of approximately €0.6 billion.
We considered this to be a key audit matter because of the magnitude of the amounts involved, management’s judgment required in estimating matters such as discount rates (incremental borrowing rates) and lease terms as well as the separation of lease and non-lease components.
Our procedures included evaluating the design and testing the operating effectiveness of management’s controls around the completeness and accuracy of the contractual lease agreements recognized in the lease accounting system.
We have reviewed accounting position papers prepared by the Group to determine whether this has been set up in accordance with the requirements of IFRS 16. We challenged management on their judgments and obtained evidence supporting their judgments.
We involved our valuation experts to assist us in evaluating the discount rates applied. On a sample basis, we have agreed key inputs to supporting documentation such as lease agreements. Additionally, we have tested on a sample basis the movements during the year. We have also recalculated the right-of-use asset and lease liability calculated by the system for each material type lease contract. We challenged management assumptions, specifically on the assessment of renewal options and adequate disclosure of the assumptions made.
Based on our procedures performed, we did not identify material exceptions in the accounting for leases, management’s estimates and disclosure on Leases in Note 12 and 34 and the implementation in Note 36 to the financial statements.
Financial statements Other informationStrategic Report Governance Financial performance AppendixGovernance RemunerationOur business Performance review Ahold Delhaize Annual Report 2019 210
Assurance report on the financial statementsIndependent auditor’s report
Report on the other information included in the annual reportIn addition to the financial statements and our auditor’s report thereon, the annual report contains other information that consists of:
• The Management Report as defined on page 105 of the Annual Report;
• The other information included in Strategic report and Governance sections and;
• The other information pursuant to Part 9 of Book 2 of the Dutch Civil Code.
Based on the procedures performed as set out below, we conclude that the other information:
• Is consistent with the financial statements and does not contain material misstatements;
• Contains the information that is required by Part 9 of Book 2 of the Dutch Civil Code.
We have read the other information. Based on our knowledge and understanding obtained in our audit of the financial statements or otherwise, we have considered whether the other information contains material misstatements.
By performing our procedures, we comply with the requirements of Part 9 of Book 2 of the Dutch Civil Code and the Dutch Standard 720. The scope of such procedures was substantially less than the scope of those performed in our audit of the financial statements.
The Management Board is responsible for the preparation of the other information, including the Management Report and the other information in accordance with Part 9 of Book 2 of the Dutch Civil Code.
Report on other legal and regulatory requirementsOur appointmentWe were appointed as auditors of Koninklijke Ahold Delhaize N.V. on April 16, 2013 by the Supervisory Board following the passing of a resolution by the shareholders at the annual meeting held on April 16, 2013. Our appointment has been renewed annually by shareholders representing a total period of uninterrupted engagement appointment of seven years.
No prohibited non-audit servicesTo the best of our knowledge and belief, we have not provided prohibited non-audit services as referred to in Article 5(1) of the European Regulation on specific requirements regarding statutory audit of public-interest entities.
Services renderedThe services, in addition to the audit, that we have provided to the company and its controlled entities, for the period to which our statutory audit relates, are disclosed in Note 4 of the notes to the parent company financial statements.
Responsibilities for the financial statements and the auditResponsibilities of the Management Board and the Supervisory Board for the financial statementsThe Management Board is responsible for:
• the preparation and fair presentation of the financial statements in accordance with EU-IFRS and with Part 9 of Book 2 of the Dutch Civil Code; and for
• Such internal control as the Management Board determines is necessary to enable the preparation of the financial statements that are free from material misstatement, whether due to fraud or error.
As part of the preparation of the financial statements, the Management Board is responsible for assessing the Company’s ability to continue as a going concern. Based on the financial reporting frameworks mentioned, the Management Board should prepare the financial statements using the going-concern basis of accounting unless the Management Board either intends to liquidate the company or to cease operations, or has no realistic alternative but to do so. The Management Board should disclose events and circumstances that may cast significant doubt on the Company’s ability to continue as a going concern in the financial statements.
The Supervisory Board is responsible for overseeing the Company’s financial reporting process.
Our responsibilities for the audit of the financial statementsOur responsibility is to plan and perform an audit engagement in a manner that allows us to obtain sufficient and appropriate audit evidence to provide a basis for our opinion. Our objectives are to obtain reasonable assurance about whether the financial statements as a whole are free from material misstatement, whether due to fraud or error and to issue an auditor’s report that includes our opinion. Reasonable assurance is a high but not absolute level of assurance, which makes it possible that we may not detect all material misstatements. Misstatements may arise due to fraud or error. They are considered to be material if, individually or in the aggregate, they could reasonably be expected to influence the economic decisions of users taken on the basis of the financial statements.
Materiality affects the nature, timing and extent of our audit procedures and the evaluation of the effect of identified misstatements on our opinion.
A more detailed description of our responsibilities is set out in the appendix to our report.
Amsterdam, February 25, 2020
PricewaterhouseCoopers Accountants N.V.S. Laurie de Hernandez RA
Financial statements Other informationStrategic Report Governance Financial performance AppendixGovernance RemunerationOur business Performance review Ahold Delhaize Annual Report 2019 211
Assurance report on the financial statementsIndependent auditor’s report
Appendix to our auditor’s report on the financial statements for the period December 31, 2018 to December 29, 2019 of Koninklijke Ahold Delhaize N.V.In addition to what is included in our auditor’s report, we have further set out in this appendix our responsibilities for the audit of the financial statements and explained what an audit involves.
The auditor’s responsibilities for the audit of the financial statementsWe have exercised professional judgment and have maintained professional scepticism throughout the audit in accordance with Dutch Standards on Auditing, ethical requirements and independence requirements. Our audit consisted, among other things of the following:
• Identifying and assessing the risks of material misstatement of the financial statements, whether due to fraud or error, designing and performing audit procedures responsive to those risks, and obtaining audit evidence that is sufficient and appropriate to provide a basis for our opinion. The risk of not detecting a material misstatement resulting from fraud is higher than for one resulting from error, as fraud may involve collusion, forgery, intentional omissions, misrepresentations, or the intentional override of internal control.
• Obtaining an understanding of internal control relevant to the audit in order to design audit procedures that are appropriate in the circumstances, but not for the purpose of expressing an opinion on the effectiveness of the Company’s internal control.
• Evaluating the appropriateness of accounting policies used and the reasonableness of accounting estimates and related disclosures made by the Management Board.
• Concluding on the appropriateness of the Management Board’s use of the going-concern basis of accounting, and based on the audit evidence obtained, concluding whether a material uncertainty exists related to events and/or conditions that may cast significant doubt on the Company’s ability to continue as a going concern. If we conclude that a material uncertainty exists, we are required to draw attention in our auditor’s report to the related disclosures in the financial statements or, if such disclosures are inadequate, to modify our opinion. Our conclusions are based on the audit evidence obtained up to the date of our auditor’s report and are made in the context of our opinion on the financial statements as a whole. However, future events or conditions may cause the company to cease to continue as a going concern.
• Evaluating the overall presentation, structure and content of the financial statements, including the disclosures, and evaluating whether the financial statements represent the underlying transactions and events in a manner that achieves fair presentation.
Considering our ultimate responsibility for the opinion on the consolidated financial statements, we are responsible for the direction, supervision and performance of the group audit. In this context, we have determined the nature and extent of the audit procedures for components of the Group to ensure that we performed enough work to be able to give an opinion on the financial statements as a whole. Determining factors are the geographic structure of the Group, the significance and/or risk profile of group entities or activities, the accounting processes and controls, and the industry in which the Group operates. On this basis, we selected group entities for which an audit or review of financial information or specific balances was considered necessary.
We communicate with the Supervisory Board regarding, among other matters, the planned scope and timing of the audit and significant audit findings, including any significant deficiencies in internal control that we identify during our audit. In this respect, we also issue an additional report to the Audit, Finance and Risk Committee in accordance with Article 11 of the EU Regulation on specific requirements regarding statutory audit of public-interest entities. The information included in this additional report is consistent with our audit opinion in this auditor’s report.
We provide the Supervisory Board with a statement that we have complied with relevant ethical requirements regarding independence, and to communicate with them all relationships and other matters that may reasonably be thought to bear on our independence, and where applicable, related safeguards.
From the matters communicated with the Supervisory Board, we determine those matters that were of most significance in the audit of the financial statements of the current period and are therefore the key audit matters. We describe these matters in our auditor’s report unless law or regulation precludes public disclosure about the matter or when, in extremely rare circumstances, not communicating the matter is in the public interest.
Financial statements Other informationStrategic Report Governance Financial performance AppendixGovernance RemunerationOur business Performance review Ahold Delhaize Annual Report 2019 212
Assurance report on non-financial informationAssurance report of the independent auditor
To: the Management Board and the Supervisory Board of Koninklijke Ahold Delhaize N.V.
Assurance report on the non-financial information 2019
Our conclusionBased on our procedures performed nothing has come to our attention that causes us to believe that the non-financial information included in the Annual Report 2019 of Koninklijke Ahold Delhaize N.V. does not present, in all material respects, a reliable and adequate view of:
• the policy and business operations with regard to sustainability; and
• the thereto related events and achievements for the period from December 31, 2018 to December 29, 2019
in accordance with the Sustainability Reporting Standards of the Global Reporting Initiative (GRI) and the internally applied reporting criteria as included in the section “reporting criteria”.
What we have reviewedWe have reviewed the non-financial information as included in the Annual Report for the period from December 31, 2018 to December 29, 2019, as included in the following sections in the Annual Report (hereafter: “the non-financial information”):
• Our business;
• Group non-financial review;
• Paragraph “Materiality Assessment” of section How we manage risk.
This review is aimed at obtaining a limited level of assurance.
The non-financial information comprises a representation of the policy and business operations of Koninklijke Ahold Delhaize N.V., Zaandam, the Netherlands (hereafter: “Ahold Delhaize”) with regard to sustainability and the thereto related business operations, events and achievements for the period from December 31, 2018 to December 29, 2019.
The basis for our conclusionWe have performed our review in accordance with Dutch law, which includes the Dutch Standard 3810N “Assurance-opdrachten inzake maatschappelijke verslagen” (“Assurance engagements on corporate social responsibility reports”), which is a specified Dutch Standard that is based on the International Standard on Assurance Engagements (ISAE) 3000 “Assurance Engagements other than Audits or Reviews of Historical Financial Information”. Our responsibilities under this standard are further described in the section “Our responsibilities for the review of the non-financial information” of this assurance report.
We believe that the assurance evidence we have obtained is sufficient and appropriate to provide a basis for our conclusion.
Independence and quality controlWe are independent of Ahold Delhaize in accordance with the “Verordening inzake de onafhankelijkheid van accountants bij assuranceopdrachten” (ViO – Code of Ethics for Professional Accountants, a regulation with respect to independence) and other for the engagement relevant independence requirements in the Netherlands. Furthermore, we have complied with the “Verordening gedrags- en beroepsregels accountants” (VGBA – “Dutch Code of Ethics”).
We apply the “Nadere voorschriften kwaliteitssystemen” (NVKS – “Regulations for quality systems”) and accordingly maintain a comprehensive system of quality control including documented policies and procedures regarding compliance with ethical requirements, professional standards and other applicable legal and regulatory requirements.
Reporting criteriaThe non-financial information needs to be read and understood in conjunction with the reporting criteria. The Management Board of Ahold Delhaize is solely responsible for selecting and applying these reporting criteria, taking into account applicable law and regulations related to reporting.
The reporting criteria used for the preparation of the non-financial information are the Sustainability Reporting Standards of the Global Reporting Initiative (GRI) and the internally applied reporting criteria, as disclosed in paragraphs “How we manage sustainable retailing” and “Global Reporting Initiative” of section “Group non-financial review” and section “Definitions: Performance measures” of the Annual Report. The absence of an established practice on which to draw, to evaluate and measure non-financial information allows for different, but acceptable, measurement techniques and can affect comparability between entities and over time.
Limitations to the scope of our reviewThe non-financial information includes prospective information such as expectations on ambitions, strategy, plans, estimates and risk assessments. Inherently, the actual results are likely to differ from these expectations and these differences may be material. We do not provide any assurance on the assumptions and the achievability of prospective information in the non-financial information.
The links to external sources or websites in the non-financial information are not part of the non-financial information reviewed by us. We do not provide assurance over information outside of the Annual Report.
Financial statements Other informationStrategic Report Governance Financial performance AppendixGovernance RemunerationOur business Performance review Ahold Delhaize Annual Report 2019 213
Assurance report on non-financial informationAssurance report of the independent auditor
Responsibilities for the non-financial information and the reviewResponsibilities of the Management Board and the Supervisory BoardThe Management Board of Ahold Delhaize is responsible for the preparation of reliable and adequate non-financial information in accordance with the reporting criteria as included in section “reporting criteria”, including the identification of stakeholders and the definition of material matters. The choices made by the Management Board regarding the scope of the non-financial information and the reporting policy are summarized in paragraphs “How we manage sustainable retailing” and “Global Reporting Initiative” of section “Group non-financial review” and section “Definitions: Performance measures” of the Annual Report. The Management Board is responsible for determining that the applicable reporting criteria are acceptable in the circumstances.
The Management Board is also responsible for such internal control as the Management Board determines is necessary to enable the preparation of the non-financial information that is free from material misstatement, whether due to fraud or errors.
The Supervisory Board is responsible for overseeing the company’s reporting process on the non-financial information.
Our responsibilities for the review of the non-financial informationOur responsibility is to plan and perform the review engagement in a manner that allows us to obtain sufficient and appropriate assurance evidence to provide a basis for our conclusion.
Procedures performed to obtain a limited level of assurance are aimed to determine the plausibility of information and vary in nature and timing from, and are less in extent, than for a reasonable assurance engagement. The level of assurance obtained in review engagements is therefore substantially less than the assurance obtained in audit engagements.
Procedures performedWe have exercised professional judgment and have maintained professional scepticism throughout the review, in accordance with the Dutch Standard 3810N, ethical requirements and independence requirements.
Our procedures included amongst others:
• Performing an analysis of the external environment and obtaining insight into relevant social themes and issues and the characteristics of the Company.
• Evaluating the appropriateness of the reporting criteria used, their consistent application and related disclosures in the non-financial information. This includes the evaluation of the results of the stakeholders’ dialogue and the reasonableness of estimates made by the Management Board.
• Obtaining an understanding of the reporting processes for the non-financial information, including obtaining a general understanding of the internal control environment relevant to our review.
• Identifying areas of the non-financial information with a higher risk of misleading or unbalanced information or material misstatement, whether due to fraud or errors. Designing and performing further assurance procedures aimed at determining the plausibility of the non-financial information responsive to this risk analysis. These procedures consisted amongst others of:
· Interviewing management (and/or relevant staff) at corporate and local level responsible for the sustainability strategy, policy and results;
· Interviewing relevant staff responsible for providing the information for, carrying out internal control procedures on, and consolidating the data in the non-financial information.
· Determining the nature and extent of the review procedures for the group components and locations. For this, the nature, extent and/or risk profile of these components are decisive. Based thereon we selected the components and locations to visit. The visits to entities in Belgium, the United States of America and Greece are aimed at, on a local level, validating source data and evaluating the design and implementation of internal controls and validation procedures;
· Obtaining assurance evidence that the non-financial information reconciles with underlying records of the company;
· Reviewing, on a limited test basis, relevant internal and external documentation;
· Performing an analytical review of the data and trends in the information submitted for consolidation at corporate level.
• Reconciling the financial information, as included in the sections we reviewed, with the financial statements.
• Evaluating the consistency of the non-financial information with the information in the Annual Report, which is not included in the scope of our review.
• Evaluating the presentation, structure and content of the non-financial information.
• To consider whether the non-financial information as a whole, including the disclosures, reflects the purpose of the reporting criteria used.
We communicate with the Supervisory Board on the planned scope and timing of the engagement and on the significant findings that result from our procedures.
Amsterdam, February 25, 2020
PricewaterhouseCoopers Accountants N.V. S. Laurie de Hernandez RA
Financial statements Other informationStrategic Report Governance Financial performance AppendixGovernance RemunerationOur business Performance review Ahold Delhaize Annual Report 2019 214
Other
Distribution of profitArticles of Association provisions governing the distribution of profitThe holders of common shares are entitled to one vote per share and to participate in the distribution of dividends and liquidation proceeds. Pursuant to section 39 of the Articles of Association, a dividend will first be declared out of net income on cumulative preferred shares and cumulative preferred financing shares. Any net income remaining after reservations deemed necessary by the Supervisory Board, in consultation with the Management Board, will then be at the disposal of the General Meeting of Shareholders, who may resolve to distribute it among the common shareholders. The Management Board, with the approval of the Supervisory Board, may propose that the General Meeting of Shareholders make distributions wholly or partly in the form of common shares. Amounts of net income not paid in the form of dividends will be added to the accumulated deficit. In the financial statements, the dividend on cumulative preferred financing shares is included in the income statement. Consequently, net income according to the parent company income statement is fully attributable to common shareholders.
See Note 21 to the consolidated financial statements and Note 17 to the parent company financial statements for more information on the dividend on common shares.
Details of special shareholder rightsAhold Delhaize shareholders have no special rights, see Governance section for more information about voting rights.
Details of shares without profit rights and non-voting sharesAhold Delhaize has no common shares without profit rights and no non-voting shares.
Financial statements Other informationStrategic Report Governance Financial performance AppendixGovernance RemunerationOur business Performance review Ahold Delhaize Annual Report 2019 215
Shareholder engagementAhold Delhaize proactively maintains an open, constructive and ongoing dialogue with its shareholders. We are committed to keeping shareholders updated by informing them transparently and accurately about Ahold Delhaize’s strategy, performance and other Company matters and developments that could be relevant to investors’ decisions. We disclose information through both financial and non-financial performance briefings, such as during our quarterly results releases, the annual General Meeting of Shareholders and Capital Markets days. We also participate in investor conferences and organize roadshows. All disclosed information is accessible via our website.
Corporate websiteOn the Company’s website you can find recent and archived press releases, financial reports, annual reports, presentations, the financial calendar and other relevant shareholder information. To receive press releases and other Ahold Delhaize news, please subscribe to our email service through our website at www.aholddelhaize.com
Contact information
How to get in touchInvestor [email protected] +31 88 659 52 13
Alvin ConcepcionVP and Head of Investor Relations
Cornell BurnetteDirector Investor Relations
Media [email protected] +31 88 659 51 34
Maarten van TartwijkManager External Communications
General informationAhold Delhaize Group Communications Provincialeweg 11 1506 MA Zaandam The Netherlands Telephone: +31 88 659 5100 Email: [email protected] www.aholddelhaize.com
Shareholder informationAhold Delhaize Investor Relations Provincialeweg 11 1506 MA Zaandam The Netherlands Telephone: +31 88 659 5213 Email: [email protected]
Visiting addressAhold Delhaize Global Support Office Provincialeweg 11 1506 MA Zaandam The Netherlands
ADR informationJ.P. Morgan Chase Bank, N.A. P.O. Box 64504 St. Paul, MN 55164-0504
Overnight mail: J.P. Morgan Chase Bank, N.A. 1110 Centre Pointe Curve, Suite 101 Mendota Heights, MN 55120-4100 Tel: +1 800 990 1135 (U.S. only) Tel: +1 651 453 2128 (International) Email: [email protected] Website: www.adr.com/shareholder
Financial statements Other informationStrategic Report Governance Financial performance AppendixGovernance RemunerationOur business Performance review Ahold Delhaize Annual Report 2019 216
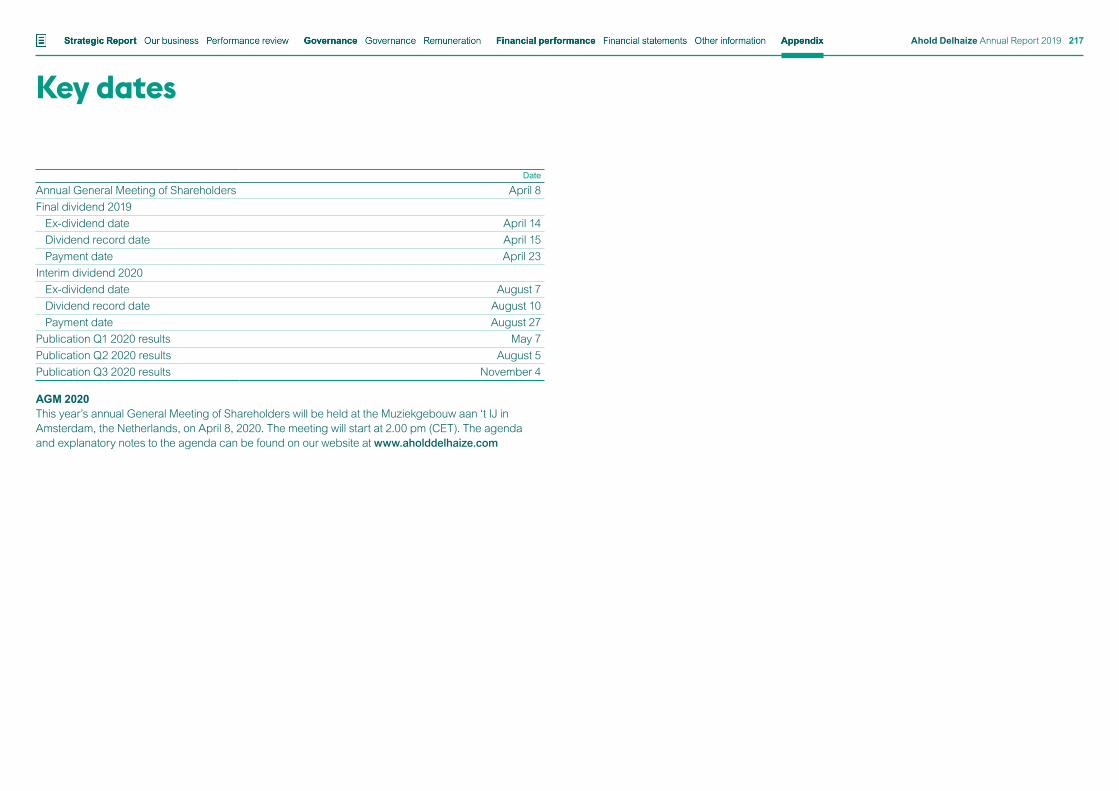
Date
Annual General Meeting of Shareholders April 8Final dividend 2019
Ex-dividend date April 14Dividend record date April 15Payment date April 23
Interim dividend 2020Ex-dividend date August 7Dividend record date August 10Payment date August 27
Publication Q1 2020 results May 7Publication Q2 2020 results August 5Publication Q3 2020 results November 4
AGM 2020This year’s annual General Meeting of Shareholders will be held at the Muziekgebouw aan ‘t IJ in Amsterdam, the Netherlands, on April 8, 2020. The meeting will start at 2.00 pm (CET). The agenda and explanatory notes to the agenda can be found on our website at www.aholddelhaize.com
Key datesFinancial statements Other informationStrategic Report Governance Financial performance AppendixGovernance RemunerationOur business Performance review Ahold Delhaize Annual Report 2019 217
Cautionary notice
This Annual Report includes forward-looking statements. All statements other than statements of historical facts may be forward-looking statements. Words such as focus, future, drive, ambition, strategy, will, believe, can, outlook, 2020, 2021, 2023, 2025, 2030, years to come, target, expect, to be, are, is, trends, ongoing, potential, likely, opportunities, could, purpose, plans, promise, strive, aim, every day, always, on track, support, goal, policy, ensure, objective, may, might, estimate, foreseeable, intend, prospects, forward-looking, forecast, possible, anticipate, probable, contingent, going, make it happen, count on, enable, innovative, growth, committed, commitment, longterm, continue, continuous, staying, remain, create, expectations, invest, seek, keep or other similar words or expressions are typically used to identify forward-looking statements.
Forward-looking statements are subject to risks, uncertainties and other factors that are difficult to predict and that may cause actual results of Koninklijke Ahold Delhaize N.V. (the “Company”) to differ materially from future results expressed or implied by such forward-looking statements. Such factors include, but are not limited to, risks relating to the Company’s inability to successfully implement its strategy, manage the growth of its business or realize the anticipated benefits of acquisitions; risks relating to competition and pressure on profit margins in the food retail industry; the impact of economic conditions on consumer spending; turbulence in the global capital markets; natural disasters and geopolitical events; climate change, raw material scarcity and human rights developments in the supply chain; disruption of operations and other factors negatively affecting the Company’s suppliers; the unsuccessful operation of the Company’s franchised and affiliated stores; changes in supplier terms and inability to pass on costs to prices; risks related to corporate responsibility and sustainable retailing; food safety issues resulting in product liability claims and adverse publicity; environmental liabilities associated with the properties that the Company owns or leases; competitive labor markets, changes in labor conditions and labor disruptions; increases in costs associated with the Company’s defined benefit pension plans; the failure or breach of security of IT systems; the Company’s inability to successfully complete divestitures and the effect of contingent liabilities arising from completed divestitures; antitrust and similar legislation; unexpected outcomes in the Company’s legal proceedings; additional expenses or capital expenditures associated with compliance with federal, regional, state and local laws and regulations; unexpected outcomes with respect to tax audits; the impact of the Company’s outstanding financial debt; the Company’s ability to generate positive cash flows; fluctuation in interest rates; the change in reference interest rate; the impact of downgrades of the Company’s credit ratings and the associated increase in the Company’s cost of borrowing; exchange rate fluctuations; inherent limitations in the Company’s control systems; changes in accounting standards; adverse results arising from the Company’s claims against its self-insurance program; the Company’s inability to locate appropriate real estate or enter into real estate leases on commercially acceptable terms and other factors discussed in the Company’s public filings and other disclosures.
Forward-looking statements reflect the current views of the Company’s management and assumptions based on information currently available to the Company’s management. Forward-looking statements speak only as of the date they are made, and the Company does not assume any obligation to update such statements, except as required by law.
Outside the Netherlands, Ahold Delhaize presents itself under the name “Royal Ahold Delhaize” or “Ahold Delhaize.” For the reader’s convenience, “Ahold Delhaize,” the “Company,” the “company,” “Ahold Delhaize Group,” “Ahold Delhaize group” or the “Group” are also used throughout this Annual Report. The Company’s registered name is “Koninklijke Ahold Delhaize N.V.”
Nielsen’s information as included in this Annual Report does not constitute a reliable independent basis for investment advice or Nielsen’s opinion as to the value of any security or the advisability of investing in, purchasing or selling any security.
Financial statements Other informationStrategic Report Governance Financial performance AppendixGovernance RemunerationOur business Performance review Ahold Delhaize Annual Report 2019 218
Related Documents