Addressing optimal underwater electrical explosion of a wire A. Virozub, V. Tz. Gurovich, D. Yanuka, O. Antonov, and Ya. E. Krasik Physics Department, Technion, Haifa 32000, Israel (Received 24 May 2016; accepted 6 September 2016; published online 22 September 2016) The underwater electrical explosion of a wire in the timescale 10 7 –10 6 s is characterized by different phase transitions at extreme values of deposited energy density, allowing one to obtain warm dense matter using rather moderate pulse power generators. In order to achieve maximal energy density deposition, the parameters of the wire and the pulse generator should be optimized to realize an overdamped explosion where most of the initially stored energy is delivered to the exploding wire during a time comparable with the quarter of the discharge period. In this paper, the results of 1D magneto-hydrodynamic modeling, coupled with the copper and water equations of state, of the underwater electrical explosion of Cu wires having an identical length and average current density but different discharge current rise time are analyzed and compared with those of a simplified model of a conductivity wave, the propagation velocity of which determines the mode of the wire’s explosion. In addition, it is shown that in the case of extreme high current densities, a scaling from a single wire to a wire array having the same total cross-sectional area of wires cannot be used to obtain an optimal wire explosion. Published by AIP Publishing. [http://dx.doi.org/10.1063/1.4963002] I. INTRODUCTION The underwater electrical explosion of a wire allows one to achieve an extremely high energy density deposition (>200 eV/atom) during 10 6 s. 1 Such high energy density deposition becomes available because of the low compress- ibility of water, resulting in a rather slow wire radial expan- sion velocity 10 5 cm/s, and because of the high value of the breakdown electric field in water (300 kV/cm), preventing the formation of a shunting plasma channel along the wire’s surface, typical for wire explosions in vacuum or gas. In order to achieve high energy density deposition, a wire explosion characterized by an overdamped discharge, i.e., when the damping parameter 1 ¼ 0:5R ffiffiffiffiffiffiffiffi C=L p 1, should be realized. Here, R(t) is the time-dependent resistance of the exploding wire and C and L(t) are the capacitance and induc- tance of the discharge circuit, respectively. In this case, a sig- nificant (>60%) part of the energy primarily stored in the capacitor bank is transferred to the exploding wire during a time shorter than the discharge’s half of a period. To obtain an overdamped discharge, one can apply a simplified model of the wire’s explosion and use similarity parameters 2 to define the parameters of the electrical circuit, namely, capacitance, inductance, and charging voltage, as well as the parameters of the wire, i.e., radius, length, and material. This model considers uniform wire evaporation and conductivity of the wire propor- tional to the deposited energy density. However, wire electrical explosion is a rather complicated phenomenon, characterized by phase transitions (solid state–liquid–vapor–plasma) and radial expansion of the wire due to pressure gradients. These processes lead to fast changes in the wire’s electrical and ther- mal conductivities, density, pressure, and temperature, which cannot be considered to be independent of each other. In recent years, a self-consistent magneto-hydrodynamic (MHD) model- ing, coupled with Ohm’s law, electrical circuit equations, equations of state (EOS), and electrical conductivity models of an underwater wire explosion was conducted in a broad range of wire and current pulse parameters. 3 This modeling allows one to obtain the resistive voltage and discharge current wave- forms in the RLC circuit (here R is the total resistance of the discharge circuit) and, consequently, the energy density deposi- tion into the wire for a known charging voltage of the capacitor bank. In experiments with Cu wire underwater electrical explo- sions, the wire’s resistance was changed from its resistance of 10 2 X to several Ohms during 10 7 –10 6 s, depending on the pulse generator’s parameters. In the case of an optimal wire explosion characterized by an overdamped mode of the electrical discharge, the discharge current reaches its maximal amplitude of 0.8I sc , where I sc is the amplitude of the current in the case of a pure inductive load. 1 During this rise time of the current, the wire experien- ces fast Joule heating accompanied by solid state-liquid and partial liquid-vapor phase transitions characterized by a signif- icant increase in the wire’s total resistance. Typically, in the case of an optimal wire explosion, 30% of the initially stored energy W 0 in the capacitor banks is deposited into the wire during this discharge phase. Later in the discharge, a much faster increase in the wire’s resistance is realized, lead- ing to a fast decrease in the discharge current and generation of voltage along the exploding wire e ¼ IðtÞR w ðtÞþ L w ðtÞ dIðtÞ=dt þ I ðtÞdL w ðtÞ=dt, where L w (t) is the time-dependent inductance of the wire due to its radial expansion and I(t) is the discharge current. During this phase of the discharge, a low-ionized, non-ideal plasma is formed as a result of partial ionization of the wire vapors. The wire’s maximal resistance is realized close to the peak of the generated voltage, and later in the discharge one obtains a decrease in the wire’s resis- tance. However, this decrease in the resistance should not be sufficient to transfer the discharge into an under-damped mode. 1070-664X/2016/23(9)/092708/7/$30.00 Published by AIP Publishing. 23, 092708-1 PHYSICS OF PLASMAS 23, 092708 (2016)

Welcome message from author
This document is posted to help you gain knowledge. Please leave a comment to let me know what you think about it! Share it to your friends and learn new things together.
Transcript
Addressing optimal underwater electrical explosion of a wire
A. Virozub, V. Tz. Gurovich, D. Yanuka, O. Antonov, and Ya. E. KrasikPhysics Department, Technion, Haifa 32000, Israel
(Received 24 May 2016; accepted 6 September 2016; published online 22 September 2016)
The underwater electrical explosion of a wire in the timescale 10�7–10�6 s is characterized by
different phase transitions at extreme values of deposited energy density, allowing one to obtain
warm dense matter using rather moderate pulse power generators. In order to achieve maximal
energy density deposition, the parameters of the wire and the pulse generator should be optimized
to realize an overdamped explosion where most of the initially stored energy is delivered to the
exploding wire during a time comparable with the quarter of the discharge period. In this paper, the
results of 1D magneto-hydrodynamic modeling, coupled with the copper and water equations of
state, of the underwater electrical explosion of Cu wires having an identical length and average
current density but different discharge current rise time are analyzed and compared with those of a
simplified model of a conductivity wave, the propagation velocity of which determines the mode of
the wire’s explosion. In addition, it is shown that in the case of extreme high current densities, a
scaling from a single wire to a wire array having the same total cross-sectional area of wires cannot
be used to obtain an optimal wire explosion. Published by AIP Publishing.[http://dx.doi.org/10.1063/1.4963002]
I. INTRODUCTION
The underwater electrical explosion of a wire allows
one to achieve an extremely high energy density deposition
(>200 eV/atom) during �10�6 s.1 Such high energy density
deposition becomes available because of the low compress-
ibility of water, resulting in a rather slow wire radial expan-
sion velocity �105 cm/s, and because of the high value of the
breakdown electric field in water (�300 kV/cm), preventing
the formation of a shunting plasma channel along the wire’s
surface, typical for wire explosions in vacuum or gas.
In order to achieve high energy density deposition, a wire
explosion characterized by an overdamped discharge, i.e.,
when the damping parameter 1 ¼ 0:5RffiffiffiffiffiffiffiffiffiC=L
p� 1, should be
realized. Here, R(t) is the time-dependent resistance of the
exploding wire and C and L(t) are the capacitance and induc-
tance of the discharge circuit, respectively. In this case, a sig-
nificant (>60%) part of the energy primarily stored in the
capacitor bank is transferred to the exploding wire during a
time shorter than the discharge’s half of a period. To obtain an
overdamped discharge, one can apply a simplified model of
the wire’s explosion and use similarity parameters2 to define
the parameters of the electrical circuit, namely, capacitance,
inductance, and charging voltage, as well as the parameters of
the wire, i.e., radius, length, and material. This model considers
uniform wire evaporation and conductivity of the wire propor-
tional to the deposited energy density. However, wire electrical
explosion is a rather complicated phenomenon, characterized
by phase transitions (solid state–liquid–vapor–plasma) and
radial expansion of the wire due to pressure gradients. These
processes lead to fast changes in the wire’s electrical and ther-
mal conductivities, density, pressure, and temperature, which
cannot be considered to be independent of each other. In recent
years, a self-consistent magneto-hydrodynamic (MHD) model-
ing, coupled with Ohm’s law, electrical circuit equations,
equations of state (EOS), and electrical conductivity models of
an underwater wire explosion was conducted in a broad range
of wire and current pulse parameters.3 This modeling allows
one to obtain the resistive voltage and discharge current wave-
forms in the RLC circuit (here R is the total resistance of the
discharge circuit) and, consequently, the energy density deposi-
tion into the wire for a known charging voltage of the capacitor
bank. In experiments with Cu wire underwater electrical explo-
sions, the wire’s resistance was changed from its resistance of
�10�2 X to several Ohms during 10�7–10�6 s, depending on
the pulse generator’s parameters.
In the case of an optimal wire explosion characterized by
an overdamped mode of the electrical discharge, the discharge
current reaches its maximal amplitude of �0.8Isc, where Isc is
the amplitude of the current in the case of a pure inductive
load.1 During this rise time of the current, the wire experien-
ces fast Joule heating accompanied by solid state-liquid and
partial liquid-vapor phase transitions characterized by a signif-
icant increase in the wire’s total resistance. Typically, in the
case of an optimal wire explosion, �30% of the initially
stored energy W0 in the capacitor banks is deposited into the
wire during this discharge phase. Later in the discharge, a
much faster increase in the wire’s resistance is realized, lead-
ing to a fast decrease in the discharge current and generation
of voltage along the exploding wire e ¼ IðtÞRwðtÞ þ LwðtÞdIðtÞ=dtþ IðtÞdLwðtÞ=dt, where Lw(t) is the time-dependent
inductance of the wire due to its radial expansion and I(t) is
the discharge current. During this phase of the discharge, a
low-ionized, non-ideal plasma is formed as a result of partial
ionization of the wire vapors. The wire’s maximal resistance
is realized close to the peak of the generated voltage, and later
in the discharge one obtains a decrease in the wire’s resis-
tance. However, this decrease in the resistance should not be
sufficient to transfer the discharge into an under-damped
mode.
1070-664X/2016/23(9)/092708/7/$30.00 Published by AIP Publishing.23, 092708-1
PHYSICS OF PLASMAS 23, 092708 (2016)
The wire’s cross section S, necessary to obtain an elec-
trical explosion at �0.8Isc, can be estimated using the action
integral g as S2 ¼ g�1Ð texp
0I2ðtÞdt having tabulated data for
different metals.4 Considering this value of S and �0.3W0
energy deposited into the wire to achieve its evaporation
within the time interval of texp, one can estimate the wire’s
length. These calculations do not account for a fast change in
the wire’s resistance during the heating and evaporation of
the wire and can be considered only as rough estimates of
the wire and electrical circuit parameters necessary to obtain
an optimal wire explosion.
II. MHD MODELING OF DIFFERENT WIRESUNDERWATER ELECTRICAL EXPLOSION
MHD modeling shows that, for the same average current
density, electrical explosions of a single wire with a cross-
sectional area S0 and an array of wires having the same
length and total cross section as the single wire result in dif-
ferent time-dependent resistances and, consequently, energy
density depositions. Let us consider the underwater electrical
explosions of a 10 mm in diameter array of 40 Cu wires each
of which is 40 mm in length and 100 lm in diameter with a
return current path having a diameter of 80 mm, and of a sin-
gle Cu wire having the same length but a 632 lm diameter,
so that it has the same cross-sectional area as the array wires.
The pulse generator has a capacitor C¼ 10 lF charged up to
28 kV, total inductance of �75 nH, and load inductance of
�39 nH. Here, for simplicity the inductances of the single
wire and the array of wires are considered to be equal. The
1D MHD modeling was the same as that explained in detail
in Ref. 5; the SESAME EOS6 was used for copper and water
and the BKL7,8 model was applied for electrical conductivity
calculations. The waveforms of the discharge current and
resistive voltage and temporal evolution of the deposited
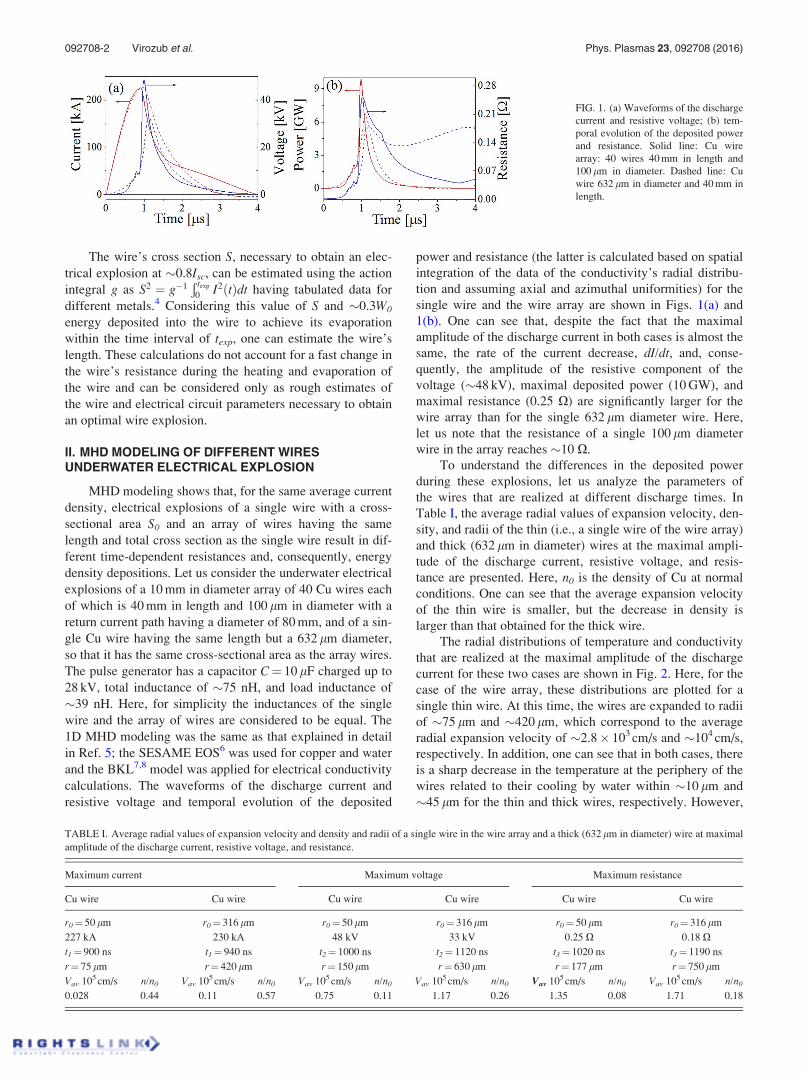
power and resistance (the latter is calculated based on spatial
integration of the data of the conductivity’s radial distribu-
tion and assuming axial and azimuthal uniformities) for the
single wire and the wire array are shown in Figs. 1(a) and
1(b). One can see that, despite the fact that the maximal
amplitude of the discharge current in both cases is almost the
same, the rate of the current decrease, dI/dt, and, conse-
quently, the amplitude of the resistive component of the
voltage (�48 kV), maximal deposited power (10 GW), and
maximal resistance (0.25 X) are significantly larger for the
wire array than for the single 632 lm diameter wire. Here,
let us note that the resistance of a single 100 lm diameter
wire in the array reaches �10 X.
To understand the differences in the deposited power
during these explosions, let us analyze the parameters of
the wires that are realized at different discharge times. In
Table I, the average radial values of expansion velocity, den-
sity, and radii of the thin (i.e., a single wire of the wire array)
and thick (632 lm in diameter) wires at the maximal ampli-
tude of the discharge current, resistive voltage, and resis-
tance are presented. Here, n0 is the density of Cu at normal
conditions. One can see that the average expansion velocity
of the thin wire is smaller, but the decrease in density is
larger than that obtained for the thick wire.
The radial distributions of temperature and conductivity
that are realized at the maximal amplitude of the discharge
current for these two cases are shown in Fig. 2. Here, for the
case of the wire array, these distributions are plotted for a
single thin wire. At this time, the wires are expanded to radii
of �75 lm and �420 lm, which correspond to the average
radial expansion velocity of �2.8� 103 cm/s and �104 cm/s,
respectively. In addition, one can see that in both cases, there
is a sharp decrease in the temperature at the periphery of the
wires related to their cooling by water within �10 lm and
�45 lm for the thin and thick wires, respectively. However,
FIG. 1. (a) Waveforms of the discharge
current and resistive voltage; (b) tem-
poral evolution of the deposited power
and resistance. Solid line: Cu wire
array: 40 wires 40 mm in length and
100 lm in diameter. Dashed line: Cu
wire 632 lm in diameter and 40 mm in
length.
TABLE I. Average radial values of expansion velocity and density and radii of a single wire in the wire array and a thick (632 lm in diameter) wire at maximal
amplitude of the discharge current, resistive voltage, and resistance.
Maximum current Maximum voltage Maximum resistance
Cu wire Cu wire Cu wire Cu wire Cu wire Cu wire
r0¼ 50 lm r0¼ 316 lm r0¼ 50 lm r0¼ 316 lm r0¼ 50 lm r0¼ 316 lm
227 kA 230 kA 48 kV 33 kV 0.25 X 0.18 Xt1¼ 900 ns t1¼ 940 ns t2¼ 1000 ns t2¼ 1120 ns t3¼ 1020 ns t3¼ 1190 ns
r¼ 75 lm r¼ 420 lm r¼ 150 lm r¼ 630 lm r¼ 177 lm r¼ 750 lm
Vav 105 cm/s n/n0 Vav 105 cm/s n/n0 Vav 105 cm/s n/n0 Vav 105 cm/s n/n0 Vav 105 cm/s n/n0 Vav 105 cm/s n/n0
0.028 0.44 0.11 0.57 0.75 0.11 1.17 0.26 1.35 0.08 1.71 0.18
092708-2 Virozub et al. Phys. Plasmas 23, 092708 (2016)
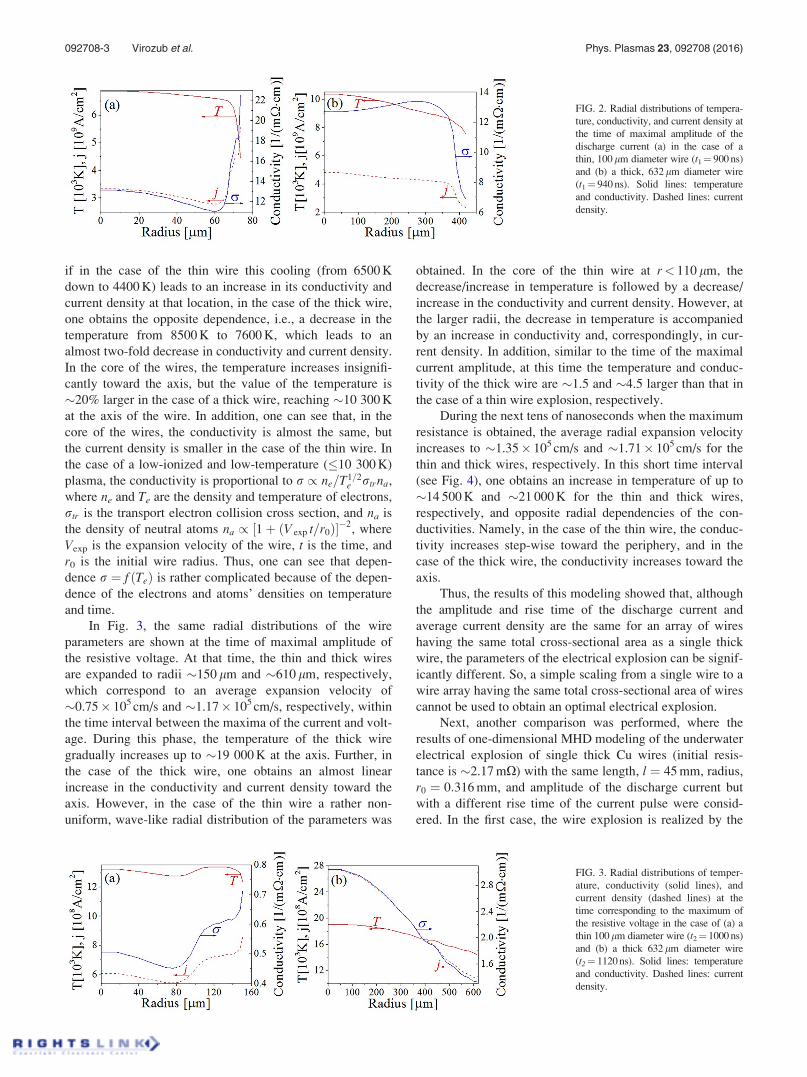
if in the case of the thin wire this cooling (from 6500 K
down to 4400 K) leads to an increase in its conductivity and
current density at that location, in the case of the thick wire,
one obtains the opposite dependence, i.e., a decrease in the
temperature from 8500 K to 7600 K, which leads to an
almost two-fold decrease in conductivity and current density.
In the core of the wires, the temperature increases insignifi-
cantly toward the axis, but the value of the temperature is
�20% larger in the case of a thick wire, reaching �10 300 K
at the axis of the wire. In addition, one can see that, in the
core of the wires, the conductivity is almost the same, but
the current density is smaller in the case of the thin wire. In
the case of a low-ionized and low-temperature (�10 300 K)
plasma, the conductivity is proportional to r / ne=T1=2e rtrna,
where ne and Te are the density and temperature of electrons,
rtr is the transport electron collision cross section, and na is
the density of neutral atoms na / ½1þ ðV exp t=r0Þ��2, where
Vexp is the expansion velocity of the wire, t is the time, and
r0 is the initial wire radius. Thus, one can see that depen-
dence r ¼ f ðTeÞ is rather complicated because of the depen-
dence of the electrons and atoms’ densities on temperature
and time.
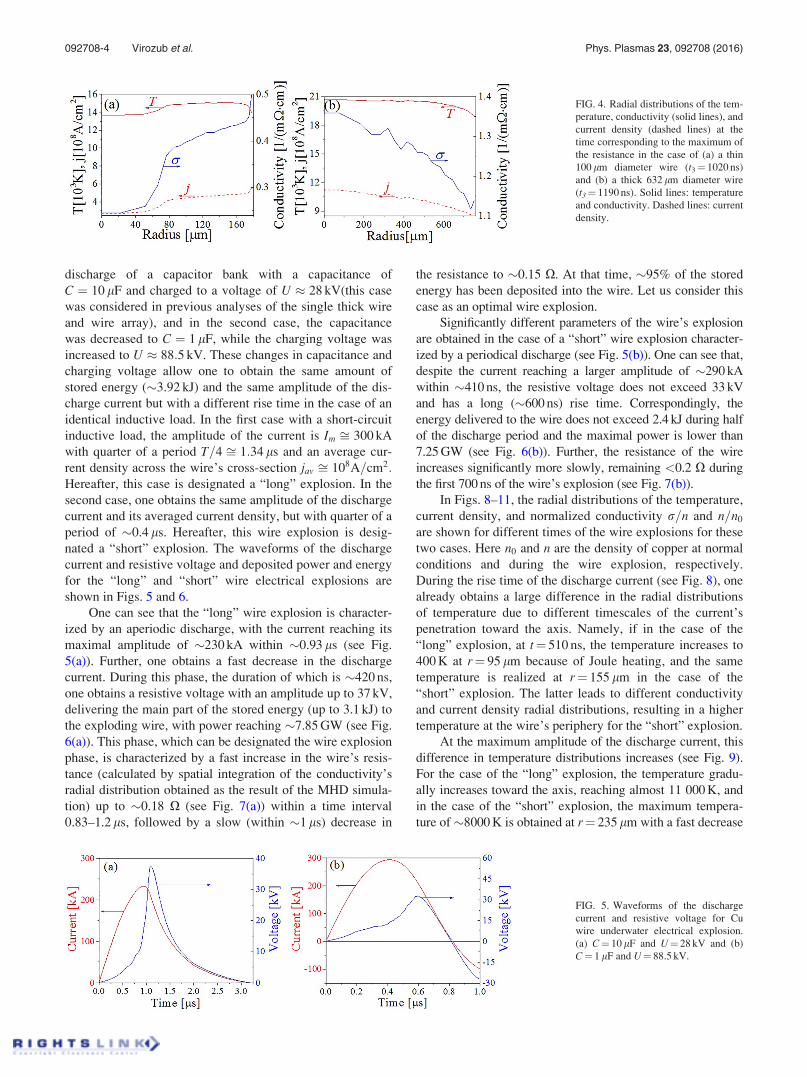
In Fig. 3, the same radial distributions of the wire
parameters are shown at the time of maximal amplitude of
the resistive voltage. At that time, the thin and thick wires
are expanded to radii �150 lm and �610 lm, respectively,
which correspond to an average expansion velocity of
�0.75� 105 cm/s and �1.17� 105 cm/s, respectively, within
the time interval between the maxima of the current and volt-
age. During this phase, the temperature of the thick wire
gradually increases up to �19 000 K at the axis. Further, in
the case of the thick wire, one obtains an almost linear
increase in the conductivity and current density toward the
axis. However, in the case of the thin wire a rather non-
uniform, wave-like radial distribution of the parameters was
obtained. In the core of the thin wire at r< 110 lm, the
decrease/increase in temperature is followed by a decrease/
increase in the conductivity and current density. However, at
the larger radii, the decrease in temperature is accompanied
by an increase in conductivity and, correspondingly, in cur-
rent density. In addition, similar to the time of the maximal
current amplitude, at this time the temperature and conduc-
tivity of the thick wire are �1.5 and �4.5 larger than that in
the case of a thin wire explosion, respectively.
During the next tens of nanoseconds when the maximum
resistance is obtained, the average radial expansion velocity
increases to �1.35� 105 cm/s and �1.71� 105 cm/s for the
thin and thick wires, respectively. In this short time interval
(see Fig. 4), one obtains an increase in temperature of up to
�14 500 K and �21 000 K for the thin and thick wires,
respectively, and opposite radial dependencies of the con-
ductivities. Namely, in the case of the thin wire, the conduc-
tivity increases step-wise toward the periphery, and in the
case of the thick wire, the conductivity increases toward the
axis.
Thus, the results of this modeling showed that, although
the amplitude and rise time of the discharge current and
average current density are the same for an array of wires
having the same total cross-sectional area as a single thick
wire, the parameters of the electrical explosion can be signif-
icantly different. So, a simple scaling from a single wire to a
wire array having the same total cross-sectional area of wires
cannot be used to obtain an optimal electrical explosion.
Next, another comparison was performed, where the
results of one-dimensional MHD modeling of the underwater
electrical explosion of single thick Cu wires (initial resis-
tance is �2.17 mX) with the same length, l ¼ 45 mm, radius,
r0 ¼ 0:316 mm, and amplitude of the discharge current but
with a different rise time of the current pulse were consid-
ered. In the first case, the wire explosion is realized by the
FIG. 2. Radial distributions of tempera-
ture, conductivity, and current density at
the time of maximal amplitude of the
discharge current (a) in the case of a
thin, 100 lm diameter wire (t1¼ 900 ns)
and (b) a thick, 632 lm diameter wire
(t1¼ 940 ns). Solid lines: temperature
and conductivity. Dashed lines: current
density.
FIG. 3. Radial distributions of temper-
ature, conductivity (solid lines), and
current density (dashed lines) at the
time corresponding to the maximum of
the resistive voltage in the case of (a) a
thin 100lm diameter wire (t2¼ 1000 ns)
and (b) a thick 632 lm diameter wire
(t2¼ 1120 ns). Solid lines: temperature
and conductivity. Dashed lines: current
density.
092708-3 Virozub et al. Phys. Plasmas 23, 092708 (2016)
discharge of a capacitor bank with a capacitance of
C ¼ 10 lF and charged to a voltage of U � 28 kV(this case
was considered in previous analyses of the single thick wire
and wire array), and in the second case, the capacitance
was decreased to C ¼ 1 lF, while the charging voltage was
increased to U � 88:5 kV. These changes in capacitance and
charging voltage allow one to obtain the same amount of
stored energy (�3.92 kJ) and the same amplitude of the dis-
charge current but with a different rise time in the case of an
identical inductive load. In the first case with a short-circuit
inductive load, the amplitude of the current is Im ffi 300 kA
with quarter of a period T=4 ffi 1:34 ls and an average cur-
rent density across the wire’s cross-section jav ffi 108A=cm2:Hereafter, this case is designated a “long” explosion. In the
second case, one obtains the same amplitude of the discharge
current and its averaged current density, but with quarter of a
period of �0.4 ls. Hereafter, this wire explosion is desig-
nated a “short” explosion. The waveforms of the discharge
current and resistive voltage and deposited power and energy
for the “long” and “short” wire electrical explosions are
shown in Figs. 5 and 6.
One can see that the “long” wire explosion is character-
ized by an aperiodic discharge, with the current reaching its
maximal amplitude of �230 kA within �0.93 ls (see Fig.
5(a)). Further, one obtains a fast decrease in the discharge
current. During this phase, the duration of which is �420 ns,
one obtains a resistive voltage with an amplitude up to 37 kV,
delivering the main part of the stored energy (up to 3.1 kJ) to
the exploding wire, with power reaching �7.85 GW (see Fig.
6(a)). This phase, which can be designated the wire explosion
phase, is characterized by a fast increase in the wire’s resis-
tance (calculated by spatial integration of the conductivity’s
radial distribution obtained as the result of the MHD simula-
tion) up to �0.18 X (see Fig. 7(a)) within a time interval
0.83–1.2 ls, followed by a slow (within �1 ls) decrease in
the resistance to �0.15 X. At that time, �95% of the stored
energy has been deposited into the wire. Let us consider this
case as an optimal wire explosion.
Significantly different parameters of the wire’s explosion
are obtained in the case of a “short” wire explosion character-
ized by a periodical discharge (see Fig. 5(b)). One can see that,
despite the current reaching a larger amplitude of �290 kA
within �410 ns, the resistive voltage does not exceed 33 kV
and has a long (�600 ns) rise time. Correspondingly, the
energy delivered to the wire does not exceed 2.4 kJ during half
of the discharge period and the maximal power is lower than
7.25 GW (see Fig. 6(b)). Further, the resistance of the wire
increases significantly more slowly, remaining <0.2 X during
the first 700 ns of the wire’s explosion (see Fig. 7(b)).
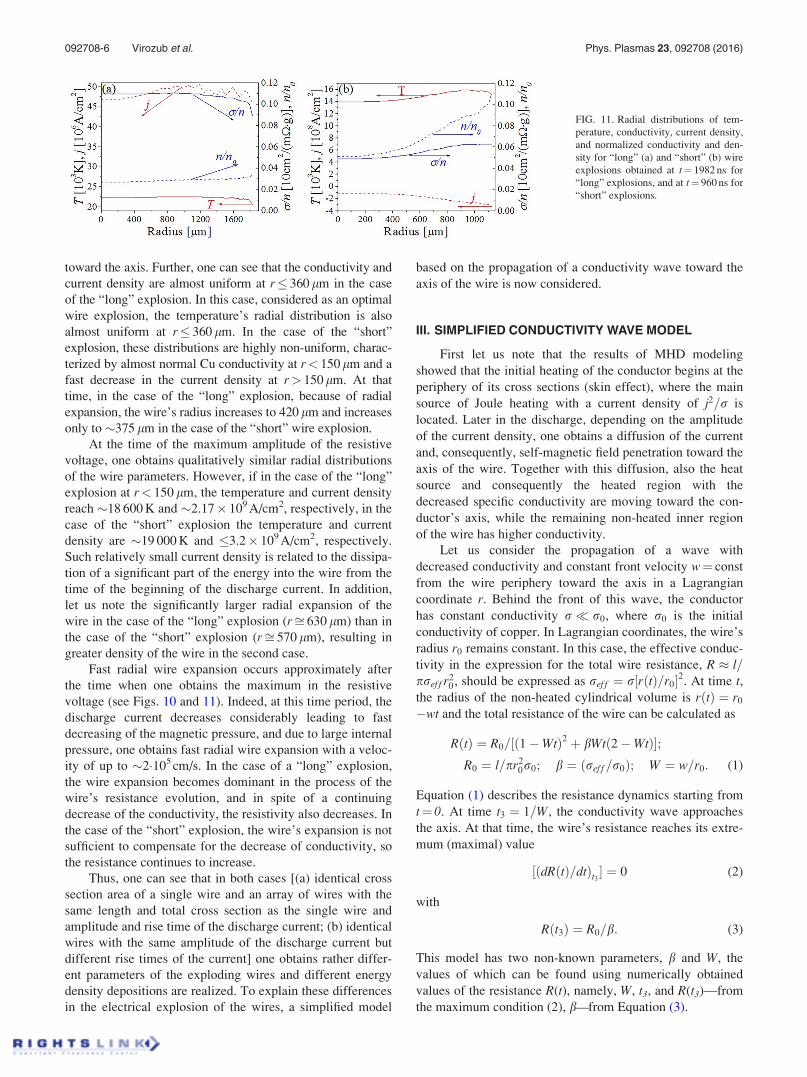
In Figs. 8–11, the radial distributions of the temperature,
current density, and normalized conductivity r=n and n=n0
are shown for different times of the wire explosions for these
two cases. Here n0 and n are the density of copper at normal
conditions and during the wire explosion, respectively.
During the rise time of the discharge current (see Fig. 8), one
already obtains a large difference in the radial distributions
of temperature due to different timescales of the current’s
penetration toward the axis. Namely, if in the case of the
“long” explosion, at t¼ 510 ns, the temperature increases to
400 K at r¼ 95 lm because of Joule heating, and the same
temperature is realized at r¼ 155 lm in the case of the
“short” explosion. The latter leads to different conductivity
and current density radial distributions, resulting in a higher
temperature at the wire’s periphery for the “short” explosion.
At the maximum amplitude of the discharge current, this
difference in temperature distributions increases (see Fig. 9).
For the case of the “long” explosion, the temperature gradu-
ally increases toward the axis, reaching almost 11 000 K, and
in the case of the “short” explosion, the maximum tempera-
ture of�8000 K is obtained at r¼ 235 lm with a fast decrease
FIG. 4. Radial distributions of the tem-
perature, conductivity (solid lines), and
current density (dashed lines) at the
time corresponding to the maximum of
the resistance in the case of (a) a thin
100 lm diameter wire (t3¼ 1020 ns)
and (b) a thick 632 lm diameter wire
(t3¼ 1190 ns). Solid lines: temperature
and conductivity. Dashed lines: current
density.
FIG. 5. Waveforms of the discharge
current and resistive voltage for Cu
wire underwater electrical explosion.
(a) C¼ 10 lF and U¼ 28 kV and (b)
C¼ 1 lF and U¼ 88.5 kV.
092708-4 Virozub et al. Phys. Plasmas 23, 092708 (2016)
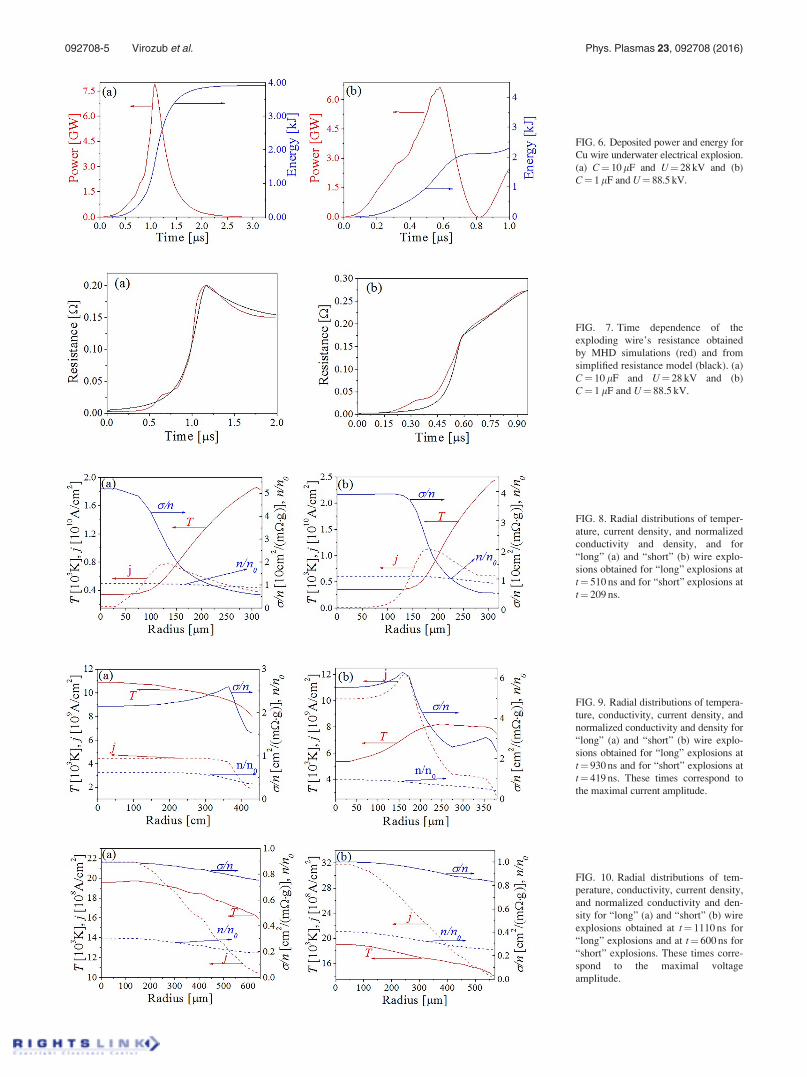
FIG. 6. Deposited power and energy for
Cu wire underwater electrical explosion.
(a) C¼ 10 lF and U¼ 28 kV and (b)
C¼ 1 lF and U¼ 88.5 kV.
FIG. 7. Time dependence of the
exploding wire’s resistance obtained
by MHD simulations (red) and from
simplified resistance model (black). (a)
C¼ 10 lF and U¼ 28 kV and (b)
C¼ 1 lF and U¼ 88.5 kV.
FIG. 8. Radial distributions of temper-
ature, current density, and normalized
conductivity and density, and for
“long” (a) and “short” (b) wire explo-
sions obtained for “long” explosions at
t¼ 510 ns and for “short” explosions at
t¼ 209 ns.
FIG. 9. Radial distributions of tempera-
ture, conductivity, current density, and
normalized conductivity and density for
“long” (a) and “short” (b) wire explo-
sions obtained for “long” explosions at
t¼ 930 ns and for “short” explosions at
t¼ 419 ns. These times correspond to
the maximal current amplitude.
FIG. 10. Radial distributions of tem-
perature, conductivity, current density,
and normalized conductivity and den-
sity for “long” (a) and “short” (b) wire
explosions obtained at t¼ 1110 ns for
“long” explosions and at t¼ 600 ns for
“short” explosions. These times corre-
spond to the maximal voltage
amplitude.
092708-5 Virozub et al. Phys. Plasmas 23, 092708 (2016)
toward the axis. Further, one can see that the conductivity and
current density are almost uniform at r� 360 lm in the case
of the “long” explosion. In this case, considered as an optimal
wire explosion, the temperature’s radial distribution is also
almost uniform at r� 360 lm. In the case of the “short”
explosion, these distributions are highly non-uniform, charac-
terized by almost normal Cu conductivity at r< 150 lm and a
fast decrease in the current density at r> 150 lm. At that
time, in the case of the “long” explosion, because of radial
expansion, the wire’s radius increases to 420 lm and increases
only to �375 lm in the case of the “short” wire explosion.
At the time of the maximum amplitude of the resistive
voltage, one obtains qualitatively similar radial distributions
of the wire parameters. However, if in the case of the “long”
explosion at r< 150 lm, the temperature and current density
reach �18 600 K and �2.17� 109 A/cm2, respectively, in the
case of the “short” explosion the temperature and current
density are �19 000 K and �3.2� 109 A/cm2, respectively.
Such relatively small current density is related to the dissipa-
tion of a significant part of the energy into the wire from the
time of the beginning of the discharge current. In addition,
let us note the significantly larger radial expansion of the
wire in the case of the “long” explosion (rffi 630 lm) than in
the case of the “short” explosion (rffi 570 lm), resulting in
greater density of the wire in the second case.
Fast radial wire expansion occurs approximately after
the time when one obtains the maximum in the resistive
voltage (see Figs. 10 and 11). Indeed, at this time period, the
discharge current decreases considerably leading to fast
decreasing of the magnetic pressure, and due to large internal
pressure, one obtains fast radial wire expansion with a veloc-
ity of up to �2105 cm/s. In the case of a “long” explosion,
the wire expansion becomes dominant in the process of the
wire’s resistance evolution, and in spite of a continuing
decrease of the conductivity, the resistivity also decreases. In
the case of the “short” explosion, the wire’s expansion is not
sufficient to compensate for the decrease of conductivity, so
the resistance continues to increase.
Thus, one can see that in both cases [(a) identical cross
section area of a single wire and an array of wires with the
same length and total cross section as the single wire and
amplitude and rise time of the discharge current; (b) identical
wires with the same amplitude of the discharge current but
different rise times of the current] one obtains rather differ-
ent parameters of the exploding wires and different energy
density depositions are realized. To explain these differences
in the electrical explosion of the wires, a simplified model
based on the propagation of a conductivity wave toward the
axis of the wire is now considered.
III. SIMPLIFIED CONDUCTIVITY WAVE MODEL
First let us note that the results of MHD modeling
showed that the initial heating of the conductor begins at the
periphery of its cross sections (skin effect), where the main
source of Joule heating with a current density of j2=r is
located. Later in the discharge, depending on the amplitude
of the current density, one obtains a diffusion of the current
and, consequently, self-magnetic field penetration toward the
axis of the wire. Together with this diffusion, also the heat
source and consequently the heated region with the
decreased specific conductivity are moving toward the con-
ductor’s axis, while the remaining non-heated inner region
of the wire has higher conductivity.
Let us consider the propagation of a wave with
decreased conductivity and constant front velocity w¼ const
from the wire periphery toward the axis in a Lagrangian
coordinate r. Behind the front of this wave, the conductor
has constant conductivity r� r0, where r0 is the initial
conductivity of copper. In Lagrangian coordinates, the wire’s
radius r0 remains constant. In this case, the effective conduc-
tivity in the expression for the total wire resistance, R � l=pref f r
20, should be expressed as ref f ¼ r½rðtÞ=r0�2. At time t,
the radius of the non-heated cylindrical volume is rðtÞ ¼ r0
�wt and the total resistance of the wire can be calculated as
RðtÞ ¼ R0=½ð1�WtÞ2 þ bWtð2�WtÞ�;R0 ¼ l=pr2
0r0; b ¼ ðref f=r0Þ; W ¼ w=r0: (1)
Equation (1) describes the resistance dynamics starting from
t¼ 0. At time t3 ¼ 1=W, the conductivity wave approaches
the axis. At that time, the wire’s resistance reaches its extre-
mum (maximal) value
½ðdRðtÞ=dtÞt3 � ¼ 0 (2)
with
Rðt3Þ ¼ R0=b: (3)
This model has two non-known parameters, b and W, the
values of which can be found using numerically obtained
values of the resistance R(t), namely, W, t3, and R(t3)—from
the maximum condition (2), b—from Equation (3).
FIG. 11. Radial distributions of tem-
perature, conductivity, current density,
and normalized conductivity and den-
sity for “long” (a) and “short” (b) wire
explosions obtained at t¼ 1982 ns for
“long” explosions, and at t¼ 960 ns for
“short” explosions.
092708-6 Virozub et al. Phys. Plasmas 23, 092708 (2016)
Let us note that at t � t3 one obtains a fast radial expan-
sion of the wire (see Table I). The resistance dynamics start-
ing from t> t3 is described by a second conductivity wave.
In this description, the same Equation (1) can be used with treplaced by t � t3, and R0–by R(t3)
R tð Þ ¼ Rmaxt¼3
1� t� t3
t4 � t3
� �2
þ Rmaxt3
Rminxt4
� �t� t3
t4 � t3
� �2� t� t3
t4 � t3
� � ;
t3 � t � t4: ð4Þ
This modified equation is used for describing the second
conductivity wave. The new values of W and b are deter-
mined from the next extremal value of R at t¼ t4
W ¼ 1=ðt4 � t3Þ; (5)
R t4ð Þ ¼R t3ð Þ
b: (6)
Plots of the resistance dynamics corresponding to the simpli-
fied model depicted in Fig. 7 describe the first (t< t3) and the
second (t4> t> t3) conductivity waves. For the “long” explo-
sion b> 1, and R decreases at t> t3, while for the “short”
explosion b< 1 and R continues to increase. That is the rea-
son one obtains a breakpoint at t¼ t3 in the model resistance
plot Fig. 7(b).
At t> t3, the wire’s conductivity does not change signifi-
cantly, but its radial expansion leads to a decrease in the
wire’s total resistance in the “long” explosion case. This can
be modeled as a new conductivity wave propagating from the
wire periphery. A comparison of the resistance of the wire
obtained by this simplified model with the resistance obtained
by MHD modeling (see Fig. 7(a)) shows good agreement.
In the case of the “short” wire explosion (see Figs.
8(b)–10(b)), at the beginning of the discharge, when the cur-
rent does not reach its maximal value, the largest current
density is realized at the periphery of the wire. Similar to the
case of the “long” wire explosion, the thermal wave propaga-
tion toward the axis of the wire is accompanied by a decrease
in the conductivity behind its front. When the discharge cur-
rent reaches its maximum value at t1¼ 420 ns, maximum
current density is realized at rffi 150 lm and the temperature
of the central part of the wire remains rather small. In spite
of the fact that in this location the conductivity is �10 times
lower than the normal conductivity, the total resistance of
the wire is significantly lower than in the case of the “long”
wire explosion. At the time of the maximal amplitude of the
resistive voltage (t2 � 600 ns, in this case it approximately
coincides with t3), the temperature in the central part of the
wire increases and becomes larger than its value at the
periphery of the wire. At that time, the value of the total
resistance of the wire becomes comparable with the maximal
value of the resistance in the case of the “long” wire explo-
sion. Let us note here that at that time (t2, t3� 600 ns) one
obtains a change in the slope of the wire’s resistance (see
Fig. 7(b)). In addition, at that time the absolute value of the
discharge current decreases �1.4 times as compared with its
maximal value. This leads to a �1.5-fold smaller energy
deposition during time Dt ¼ t2 � t1 than in the case of the
“long” wire explosion during the corresponding time period.
Continuing energy deposition, accompanied by the radial
wire expansion, results in a further decrease in its conductiv-
ity. Indeed, MHD simulations showed that at t � 960 ns
(¼t4) when the wire’s resistance reaches its maximal value,
the radius of the wire increases �2 times and the conductiv-
ity decreases �6 times as compared with their value at t2 �600 ns. This leads to a 1.5 times increase in the wire’s total
resistance. In order to fit this increase in the resistance
(600 ns< t< 960 ns), similar to the case of the “long” wire
explosion, a new wave of conductivity propagating from the
periphery (at t2¼ 600 ns) toward the axis was modeled. The
comparison between the results of this simplified model and
those of the MHD simulations for the “short” wire explosion
(see Fig. 7(b)) showed satisfactory agreement.
IV. SUMMARY
To conclude, the results of MHD modeling showed that
in order to achieve an optimal electrical explosion of the
wire, the temperature and conductivity radial distributions
should be uniform across the cross section of the wire at the
time when the discharge current reaches its maximal ampli-
tude. The temporal dependence of the total resistance, which
dictates the energy deposition rate into the exploding wire,
can be obtained using a simplified model of a conductivity
wave. Namely, the time when the first conductivity wave
approaches the wire’s axis and when one obtains the maxi-
mal wire’s resistance should be close to the time of the maxi-
mal current amplitude and resistive voltage. Finally, we
want to point out that in the case of extreme high current
densities, a simple scaling from a single wire to a wire array
having the same total cross-sectional area of wires can lead
to a non-optimal wire explosion.
ACKNOWLEDGMENTS
This research was supported by the Israeli Science
Foundation Grant No. 99/12.
1Ya. E. Krasik, S. Efimov, D. Sheftman, A. Fedotov-Gefen, O. Antonov, D.
Shafer, D. Yanuka, M. Nitishinskiy, M. Kozlov, L. Gilburd, G. Toker, S.
Gleizer, E. Zvulun, V. Tz. Gurovich, D. Varentsov, and M. Rodionova,
IEEE Trans. Plasma Sci. 44, 412 (2016).2V. Ts. Gurovich, A. Grinenko, Ya. E. Krasik, and J. Felsteiner, Phys. Rev.
E 69, 036402 (2004).3I. V. Oreshkin, R. B. Baksht, A. Yu. Labezkii, A. G. Rousskikh, A. V.
Shishlov, P. R. Levashov, K. V. Khishchenko, and I. V. Glazyrin, Tech.
Phys. 49, 843 (2004).4L. I. Chemezova, G. A. Mesyats, V. S. Sedoi, B. N. Semin, and V. V.
Valevich, in 18th International Symposium on Discharges and ElectricalInsulation in Vacuum, Eindhove (IEEE, 1998), pp. 48–51.
5A. Grinenko, V. Tz. Gurovich, A. Saypin, S. Efimov, and Ya. E. Krasik,
Phys. Rev. E 72, 066401 (2005).6See National Technical Information Service Document No. DE85014241
(S. P. Lyon and J. D. Johnson, Sesame: The Los Alamos National
Laboratory Equation-of-State Database, LANL Rep. LA UR-92-3407,
1992). Copies may be ordered from the National Technical Information
Service, Springfield, VA, 22161.7Yu. D. Bakulin, V. F. Kuropatenko, and A. V. Luchinskii, Sov. Phys.-Tech.
Phys. 21, 1144–1150 (1976).8A. Grinenko, Ya. E. Krasik, S. Efimov, A. Fedotov, V. Tz. Gurovich, and
V. I. Oreshkin, Phys. Plasmas 13, 042701 (2006).
092708-7 Virozub et al. Phys. Plasmas 23, 092708 (2016)
Related Documents