Active Region Active Region Helioseismology Helioseismology Irene González Hernández Irene González Hernández National Solar Observatory, Tucson, AZ National Solar Observatory, Tucson, AZ

Active Region Helioseismology Irene González Hernández National Solar Observatory, Tucson, AZ
Jan 18, 2016
Active Region Helioseismology Irene González Hernández National Solar Observatory, Tucson, AZ. Overview Main local helioseismology techniques Time Distance (Duvall et al., 1993) Helioseimic Holography (Lindsey & Braun, 1990) Ring Diagrams (Hill, 1988) - PowerPoint PPT Presentation
Welcome message from author
This document is posted to help you gain knowledge. Please leave a comment to let me know what you think about it! Share it to your friends and learn new things together.
Transcript
Active Region Helioseismology Active Region Helioseismology
Irene González HernándezIrene González Hernández
National Solar Observatory, Tucson, AZNational Solar Observatory, Tucson, AZ
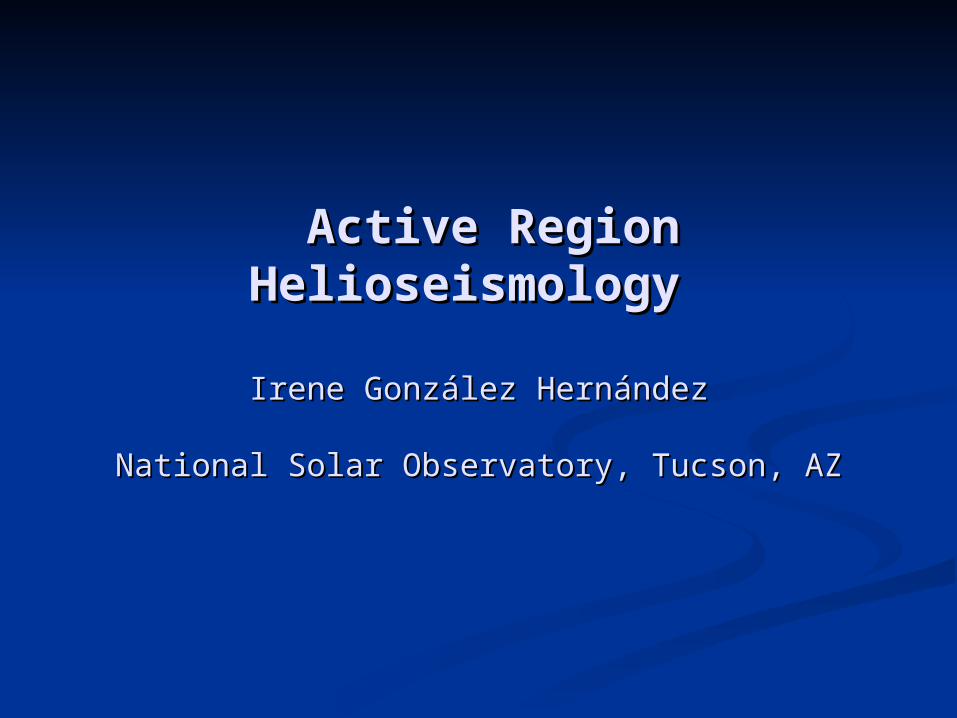
ContentsContents Overview
Main local helioseismology techniques Time Distance (Duvall et al., 1993)
Helioseimic Holography (Lindsey & Braun, 1990)
Ring Diagrams (Hill, 1988)
Comparison between results from different techniques
Excluding active regions from helioseismic inferences
Summary and Ongoing work
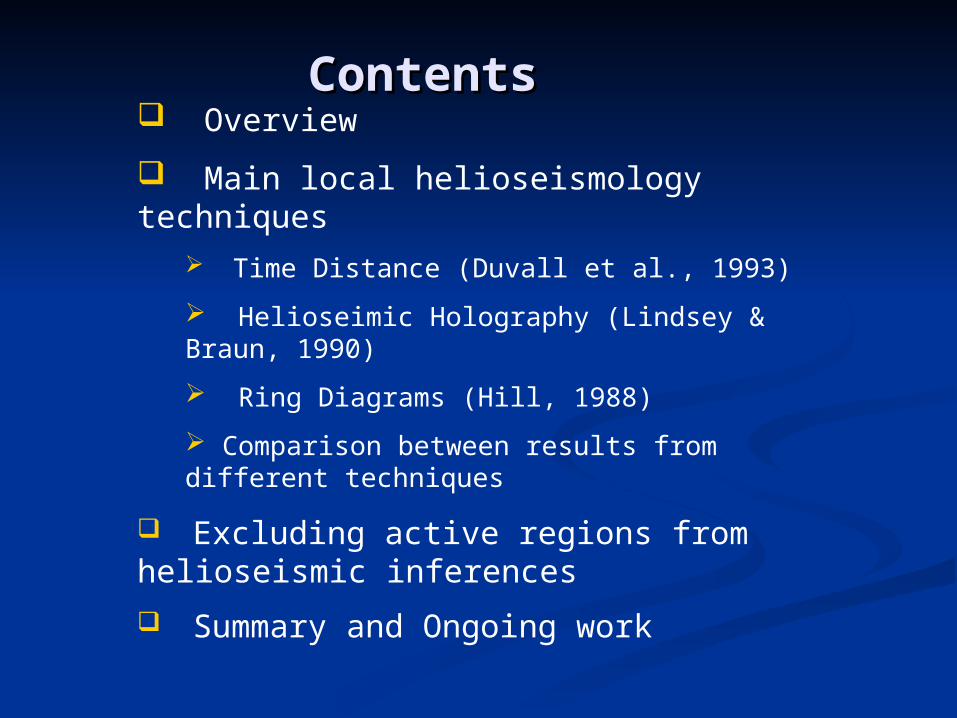
OverviewOverview
“The Spatial Distribution of p-Mode Absortion in Active Regions”
Braun, D. C., LaBonte B. J. and Duval, T.L. Jr. 1990, ApJ, 354, 372
“Scattering of p-Modes by a Sunspot” Braun, D. C., Duvall, T.L. Jr., LaBonte, B.J., Jefferies, S.M., Harvey, J.W. and Pomerantz, M.A. 1992, ApJ, 391L, 113
Towards Seismology of Active Regions:
Seismic Imaging of Sunspots in the Far Side of
the SunLindsey, C. and Braun D., 1990, Solar
Physics, 126, 101
Time-distance helioseismology
Duvall et al., 1993, Nature, 362,430
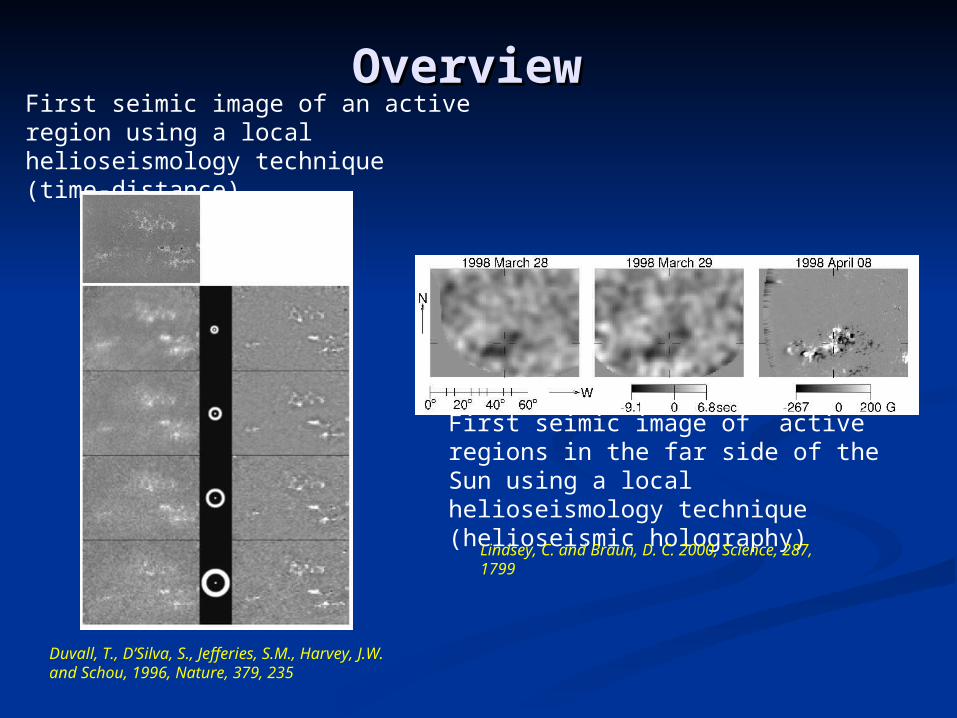
OverviewOverviewFirst seimic image of an active region using a local helioseismology technique (time-distance)
Duvall, T., D’Silva, S., Jefferies, S.M., Harvey, J.W. and Schou, 1996, Nature, 379, 235
First seimic image of active regions in the far side of the Sun using a local helioseismology technique (helioseismic holography)
Lindsey, C. and Braun, D. C. 2000, Science, 287, 1799
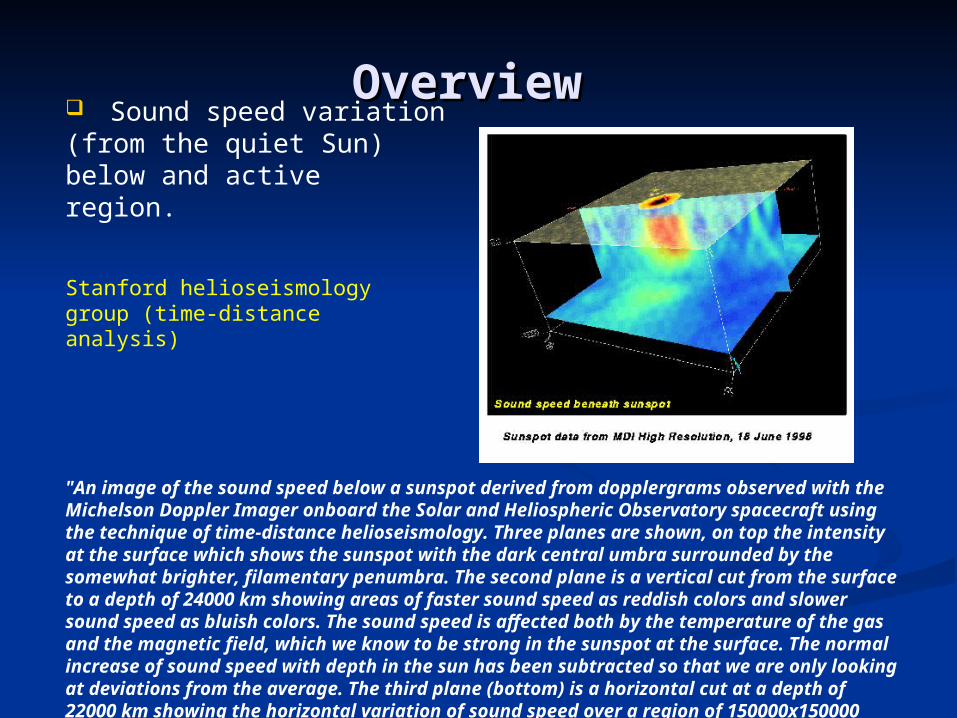
OverviewOverview Sound speed variation (from the quiet Sun) below and active region.
Stanford helioseismology group (time-distance analysis)
"An image of the sound speed below a sunspot derived from dopplergrams observed with the Michelson Doppler Imager onboard the Solar and Heliospheric Observatory spacecraft using the technique of time-distance helioseismology. Three planes are shown, on top the intensity at the surface which shows the sunspot with the dark central umbra surrounded by the somewhat brighter, filamentary penumbra. The second plane is a vertical cut from the surface to a depth of 24000 km showing areas of faster sound speed as reddish colors and slower sound speed as bluish colors. The sound speed is affected both by the temperature of the gas and the magnetic field, which we know to be strong in the sunspot at the surface. The normal increase of sound speed with depth in the sun has been subtracted so that we are only looking at deviations from the average. The third plane (bottom) is a horizontal cut at a depth of 22000 km showing the horizontal variation of sound speed over a region of 150000x150000 km."
Time Distance Time Distance
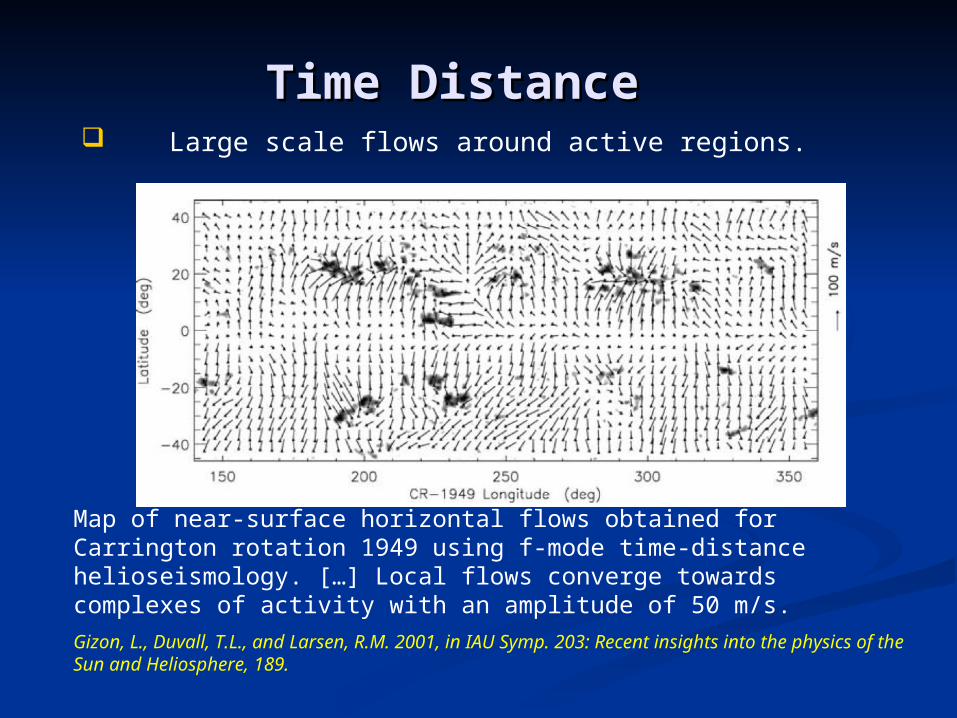
Map of near-surface horizontal flows obtained for Carrington rotation 1949 using f-mode time-distance helioseismology. […] Local flows converge towards complexes of activity with an amplitude of 50 m/s.
Gizon, L., Duvall, T.L., and Larsen, R.M. 2001, in IAU Symp. 203: Recent insights into the physics of the Sun and Heliosphere, 189.
Large scale flows around active regions.
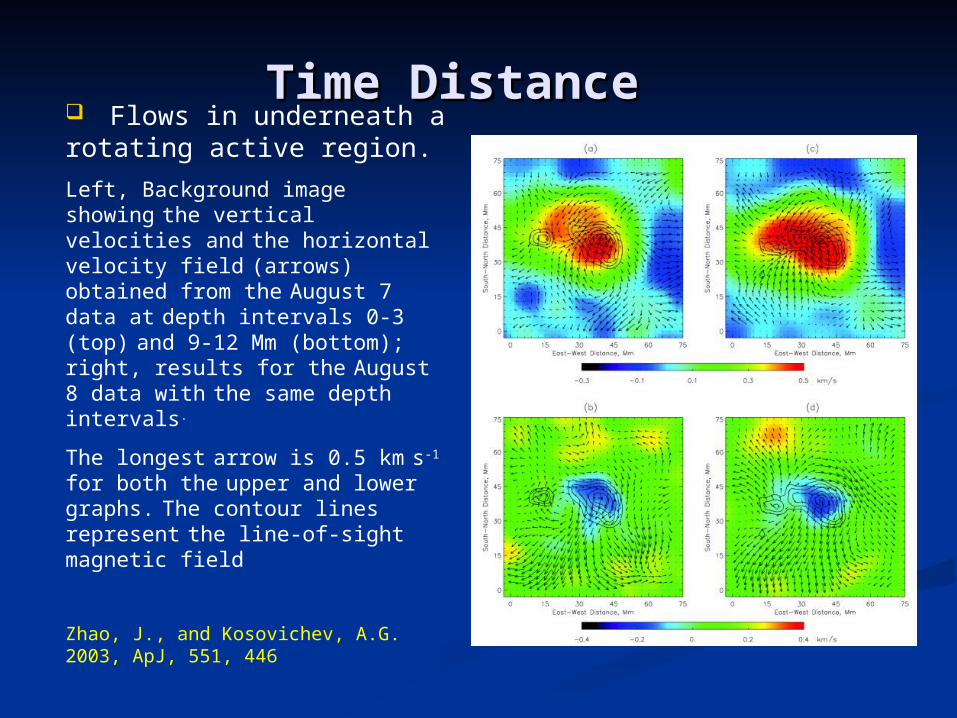
Time Distance Time Distance Flows in underneath a rotating active region.
Left, Background image showing
the vertical velocities and the horizontal velocity field (arrows) obtained from the August 7 data at
depth intervals 0-3 (top) and 9-12 Mm (bottom); right, results for the
August 8 data with the same depth intervals.
The longest arrow is 0.5 km s-1 for both the upper and lower graphs.
The contour lines represent the line-of-sight magnetic field
Zhao, J., and Kosovichev, A.G. 2003, ApJ, 551, 446
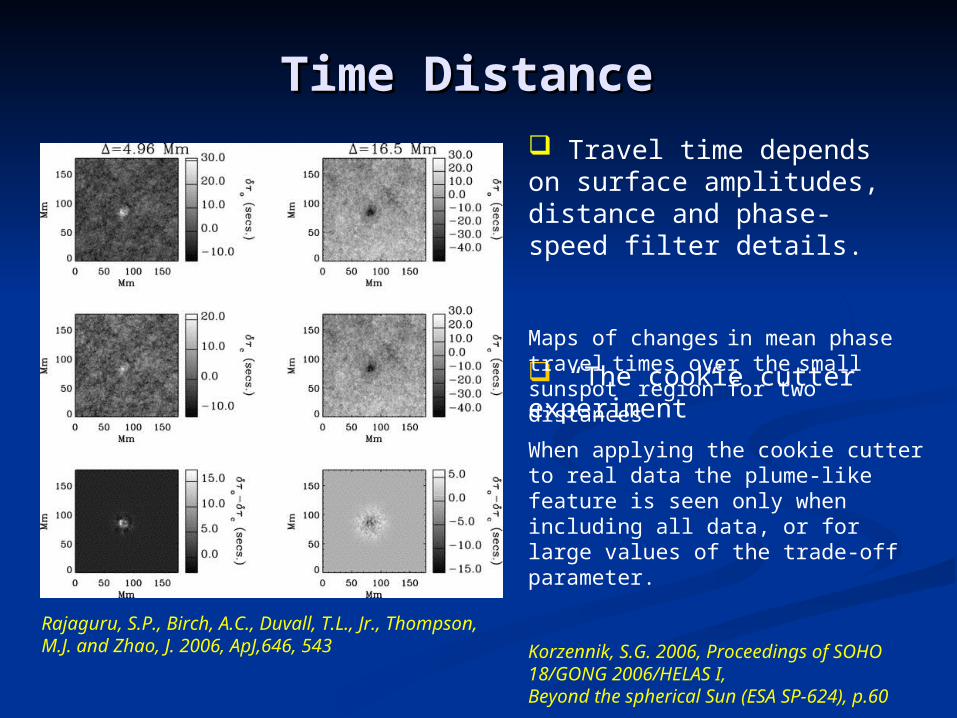
Time DistanceTime Distance
“The cookie cutter experiment”
When applying the cookie cutter to real data the plume-like feature is seen only when including all data, or for large values of the trade-off parameter.
Korzennik, S.G. 2006, Proceedings of SOHO 18/GONG 2006/HELAS I,Beyond the spherical Sun (ESA SP-624), p.60
Rajaguru, S.P., Birch, A.C., Duvall, T.L., Jr., Thompson, M.J. and Zhao, J. 2006, ApJ,646, 543
Travel time depends on surface amplitudes, distance and phase-speed filter details.
Maps of changes in mean phase travel times over the small sunspot
region for two distances
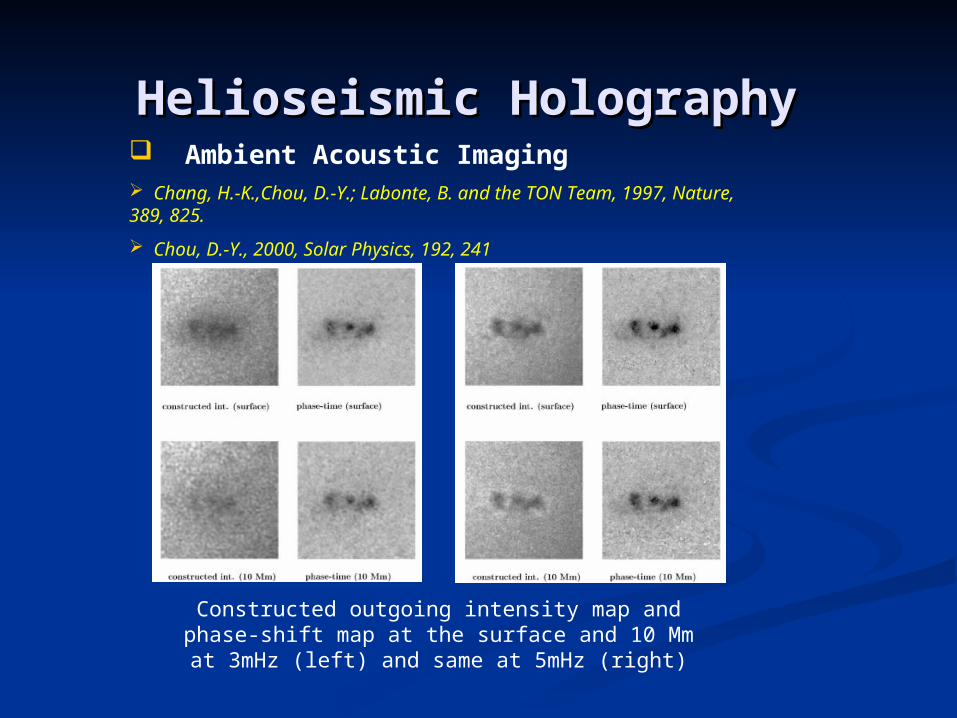
Helioseismic HolographyHelioseismic Holography Ambient Acoustic Imaging Chang, H.-K.,Chou, D.-Y.; Labonte, B. and the TON Team, 1997, Nature, 389, 825.
Chou, D.-Y., 2000, Solar Physics, 192, 241
Constructed outgoing intensity map and phase-shift map at the surface and 10 Mm at 3mHz
(left) and same at 5mHz (right)
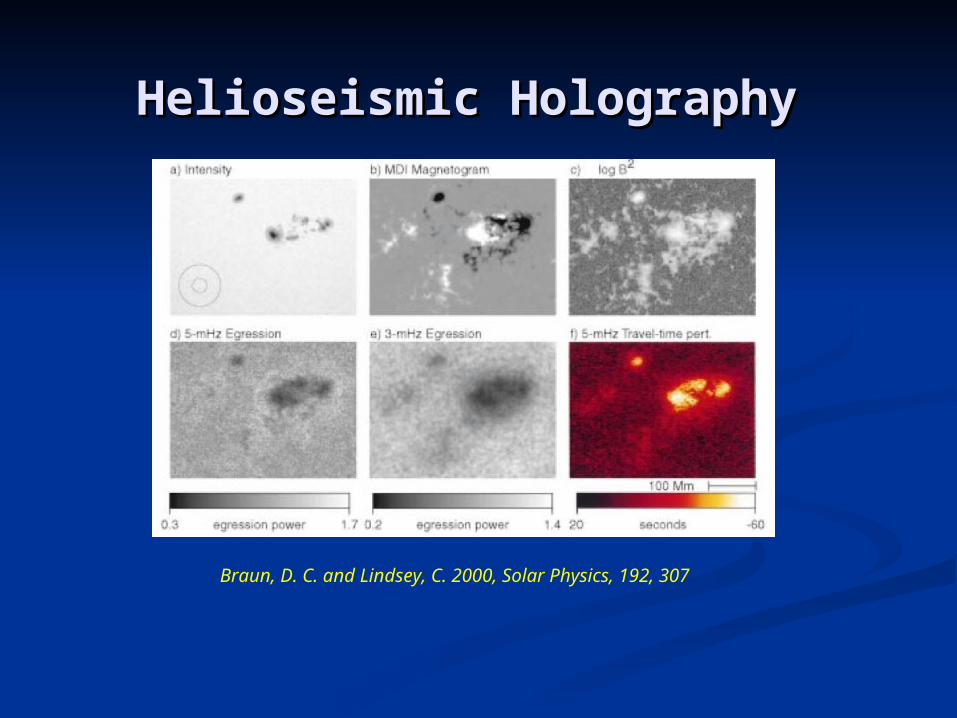
Helioseismic HolographyHelioseismic Holography
Braun, D. C. and Lindsey, C. 2000, Solar Physics, 192, 307
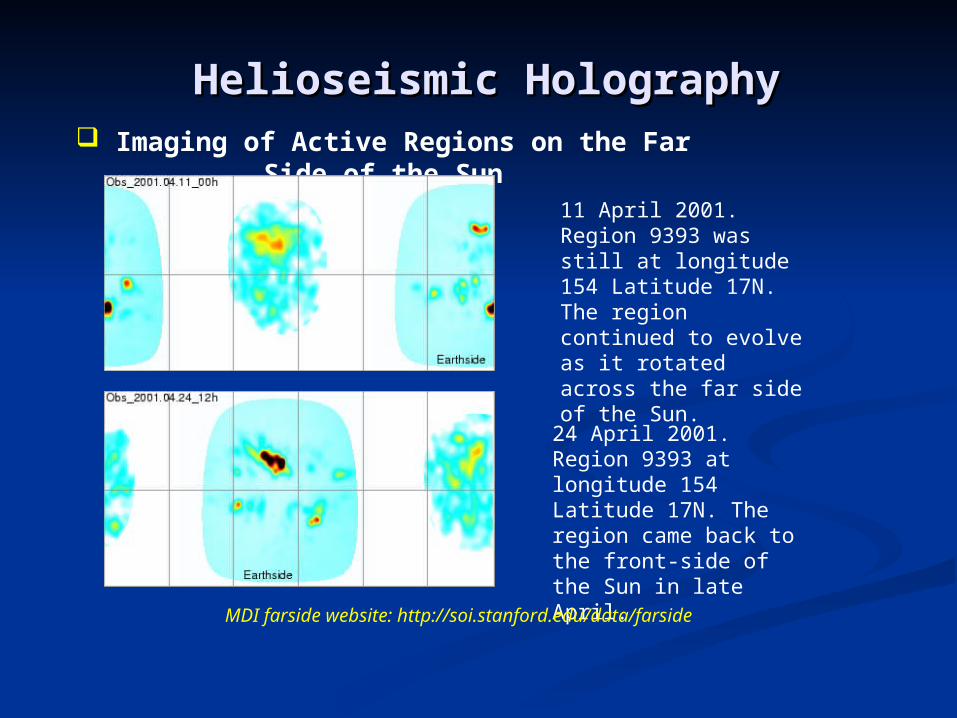
Helioseismic HolographyHelioseismic Holography Imaging of Active Regions on the Far Side
of the Sun11 April 2001. Region 9393 was still at longitude 154 Latitude 17N. The region continued to evolve as it rotated across the far side of the Sun.
24 April 2001. Region 9393 at longitude 154 Latitude 17N. The region came back to the front-side of the Sun in late April.
MDI farside website: http://soi.stanford.edu/data/farside
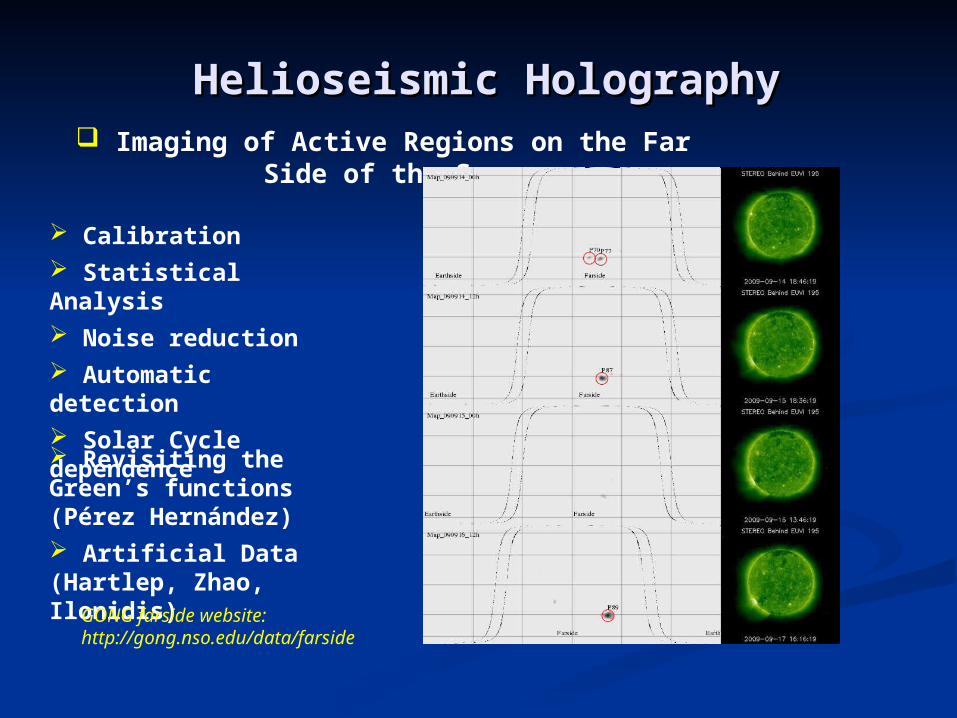
Helioseismic HolographyHelioseismic Holography Imaging of Active Regions on the Far Side
of the Sun
Calibration Statistical Analysis Noise reduction Automatic detection Solar Cycle dependence Revisiting the Green’s functions (Pérez Hernández) Artificial Data (Hartlep, Zhao, Ilonidis)GONG farside website:
http://gong.nso.edu/data/farside
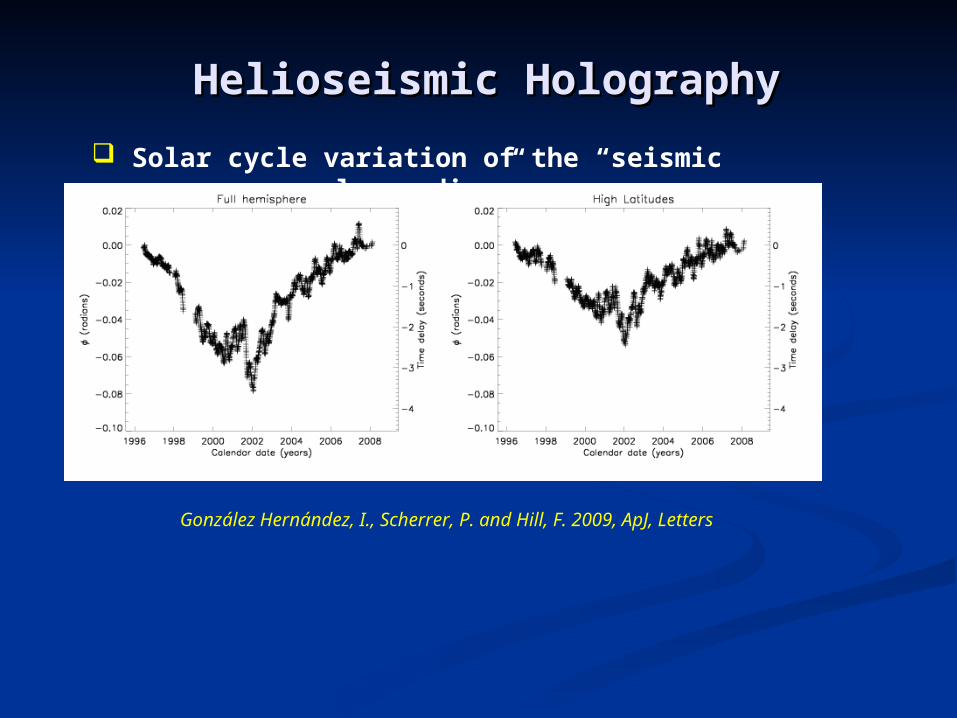
Helioseismic HolographyHelioseismic Holography
Solar cycle variation of the “seismic solar radius”
González Hernández, I., Scherrer, P. and Hill, F. 2009, ApJ, Letters
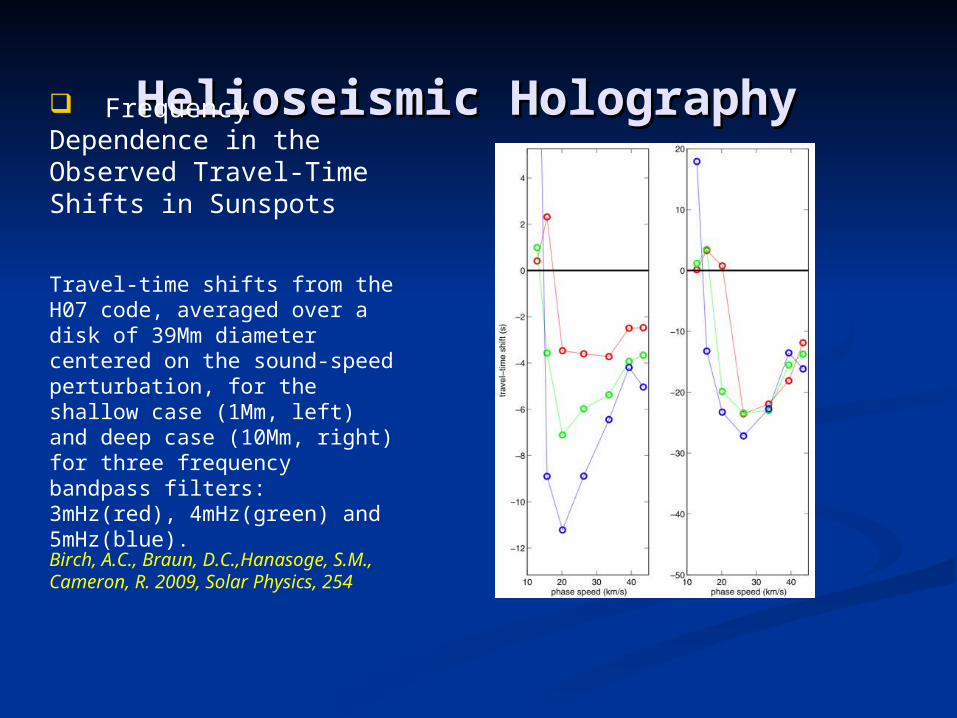
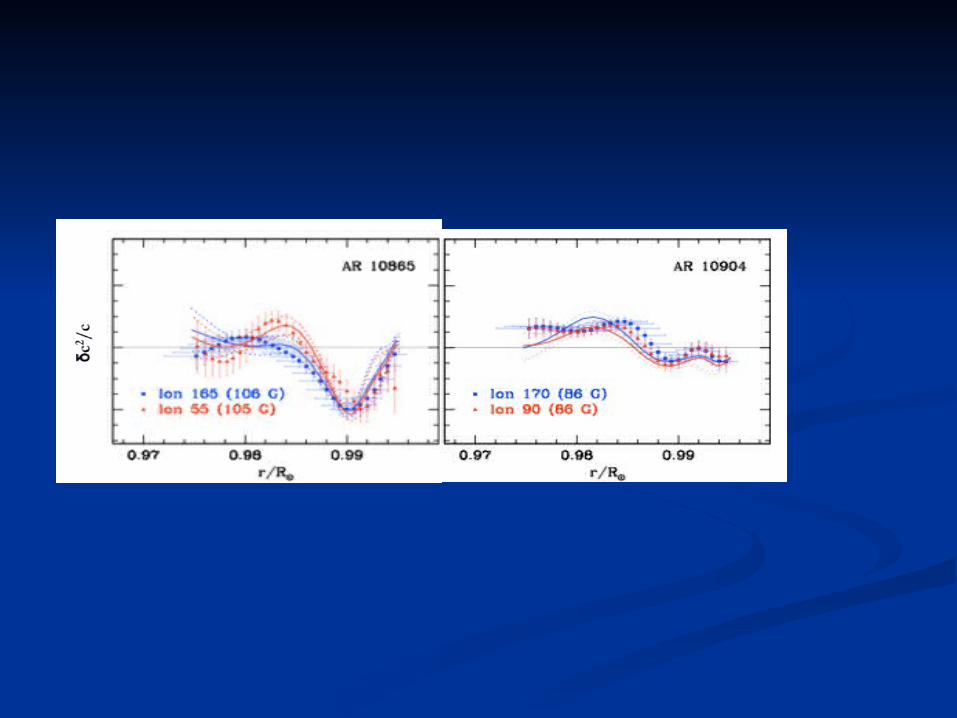
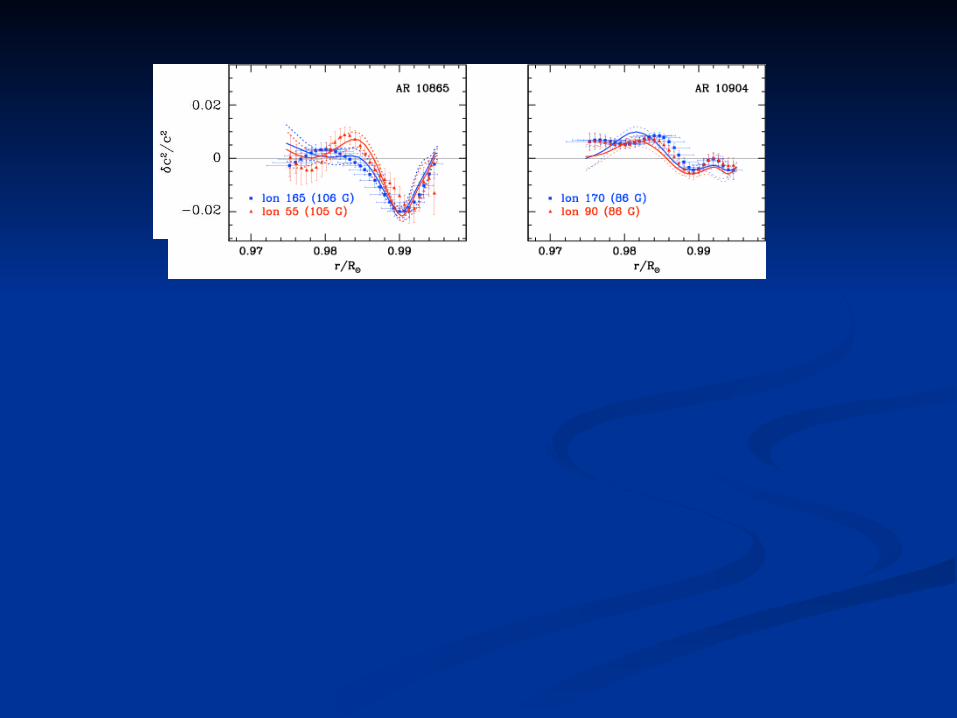
Helioseismic HolographyHelioseismic Holography Frequency Dependence in the Observed Travel-Time Shifts in Sunspots
Travel-time shifts from the H07 code, averaged over a disk of 39Mm diameter centered on the sound-speed perturbation, for the shallow case (1Mm, left) and deep case (10Mm, right) for three frequency bandpass filters: 3mHz(red), 4mHz(green) and 5mHz(blue).
Birch, A.C., Braun, D.C.,Hanasoge, S.M., Cameron, R. 2009, Solar Physics, 254
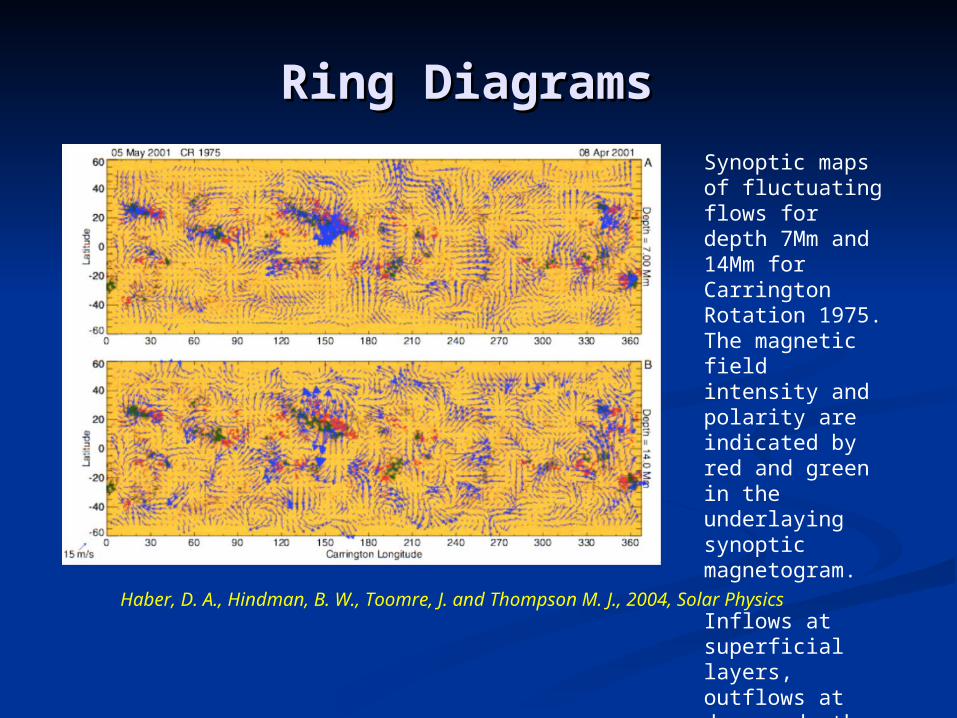
Ring DiagramsRing Diagrams
Synoptic maps of fluctuating flows for depth 7Mm and 14Mm for Carrington Rotation 1975. The magnetic field intensity and polarity are indicated by red and green in the underlaying synoptic magnetogram.
Inflows at superficial layers, outflows at deeper depth
Haber, D. A., Hindman, B. W., Toomre, J. and Thompson M. J., 2004, Solar Physics
Ring Diagrams Ring Diagrams
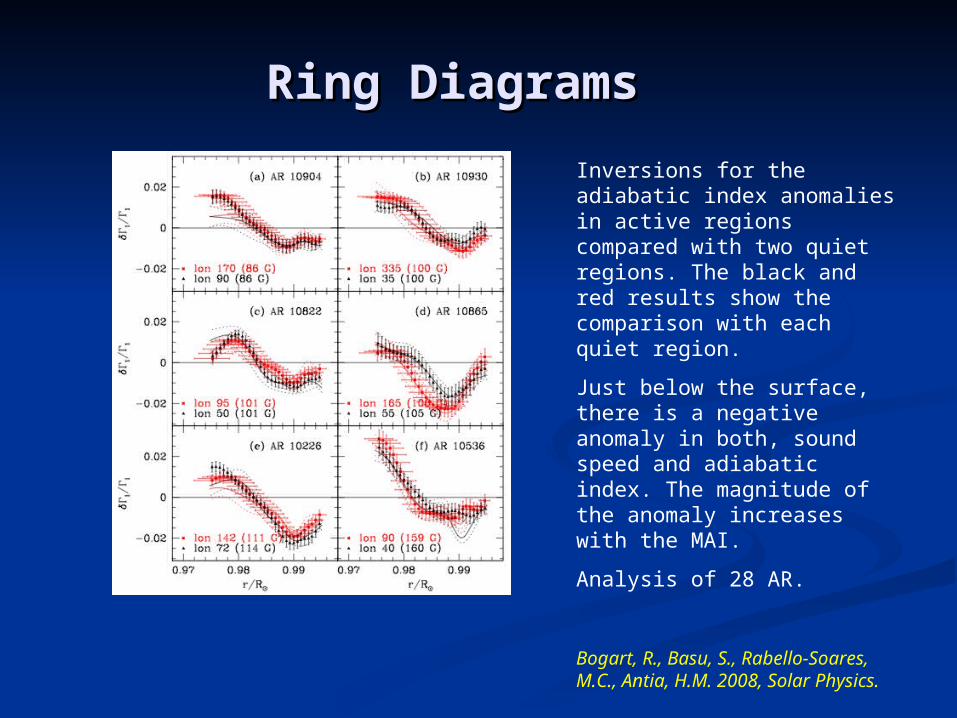
Inversions for the adiabatic index anomalies in active regions compared with two quiet regions. The black and red results show the comparison with each quiet region.
Just below the surface, there is a negative anomaly in both, sound speed and adiabatic index. The magnitude of the anomaly increases with the MAI.
Analysis of 28 AR.
Bogart, R., Basu, S., Rabello-Soares, M.C., Antia, H.M. 2008, Solar Physics.
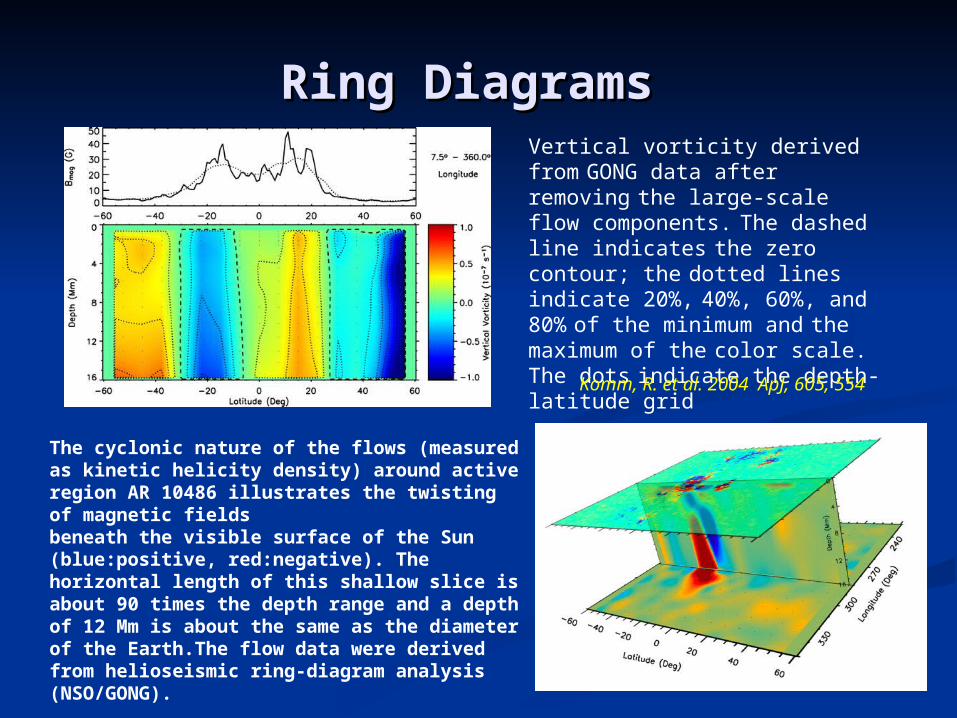
Ring DiagramsRing DiagramsVertical vorticity derived from
GONG data after removing the large-scale flow components. The dashed line indicates the zero contour; the dotted lines indicate 20%, 40%, 60%, and 80% of the minimum and the maximum of the color scale. The dots indicate the depth-latitude grid
Komm, R. et al. 2004 ApJ, 605, 554
The cyclonic nature of the flows (measured as kinetic helicity density) around active region AR 10486 illustrates the twisting of magnetic fields beneath the visible surface of the Sun (blue:positive, red:negative). The horizontal length of this shallow slice is about 90 times the depth range and a depth of 12 Mm is about the same as the diameter of the Earth.The flow data were derived from helioseismic ring-diagram analysis (NSO/GONG).
GONG mug picture (courtesy of Rudi Komm)
Ring-diagram AnalysisRing-diagram Analysis
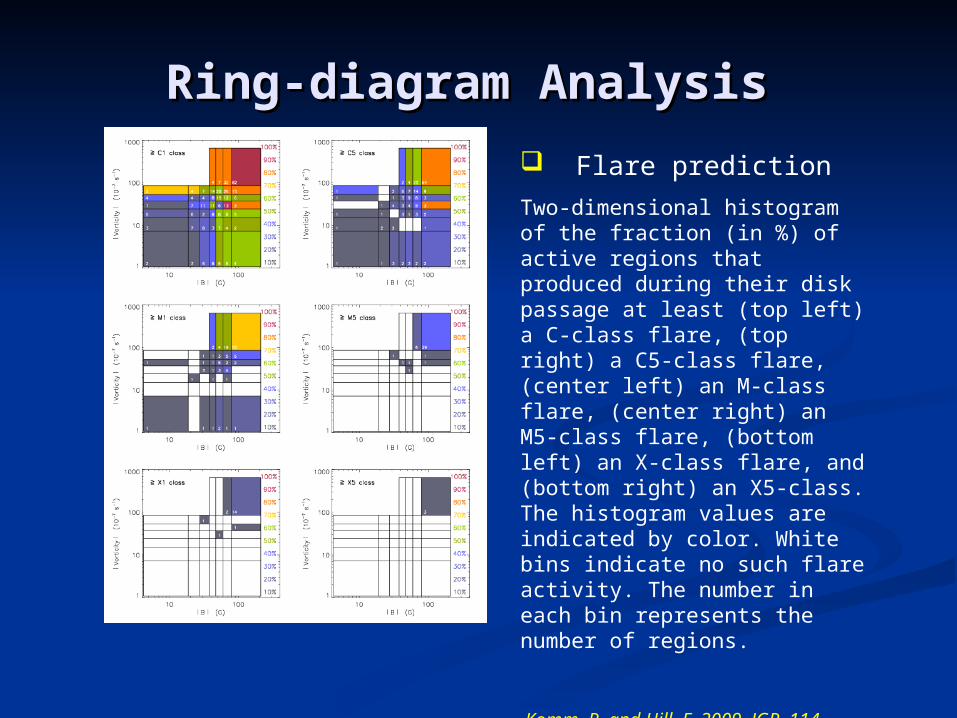
Flare prediction
Two-dimensional histogram of the fraction (in %) of active regions that produced during their disk passage at least (top left) a C-class flare, (top right) a C5-class flare, (center left) an M-class flare, (center right) an M5-class flare, (bottom left) an X-class flare, and (bottom right) an X5-class. The histogram values are indicated by color. White bins indicate no such flare activity. The number in each bin represents the number of regions.
Komm, R. and Hill, F. 2009, JGR, 114
Flows in filamentsFlows in filaments
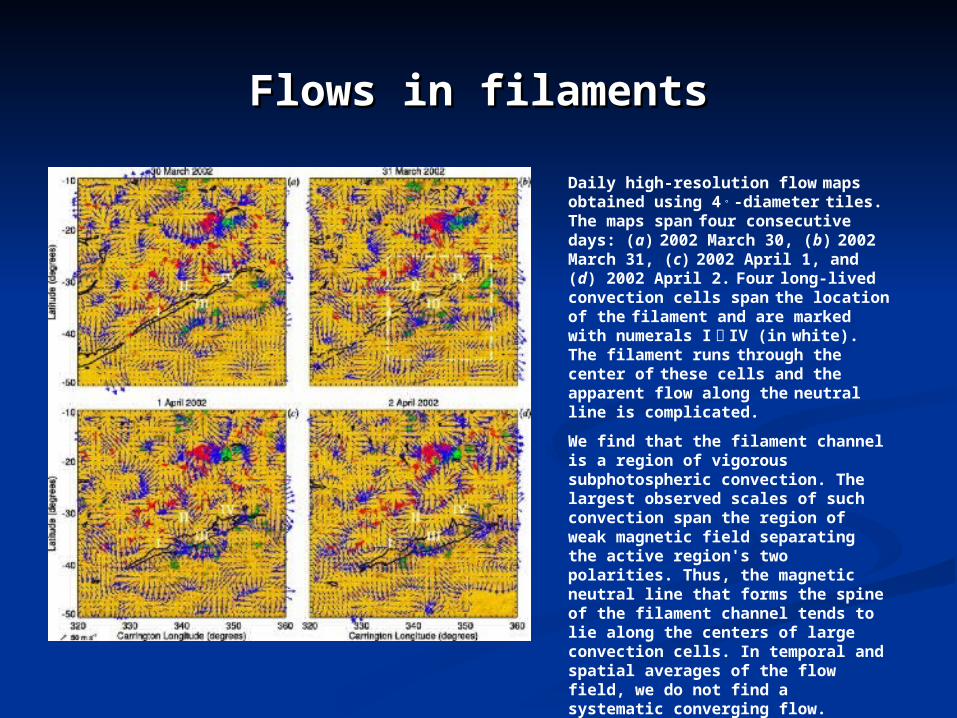
Daily high-resolution flow maps obtained using 4 。 -diameter tiles. The maps span four consecutive days: (a) 2002 March 30, (b) 2002 March 31, (c) 2002 April 1, and (d) 2002 April 2. Four long-lived convection cells span the location of the filament and are marked with numerals I ミ IV (in white). The filament runs through the center of
these cells and the apparent flow along the neutral line is complicated.
We find that the filament channel is a region of vigorous subphotospheric convection. The largest observed scales of such convection span the region of weak magnetic field separating the active region's two polarities. Thus, the magnetic neutral line that forms the spine of the filament channel tends to lie along the centers of large convection cells. In temporal and spatial averages of the flow field, we do not find a systematic converging flow. However, we do detect a significant shearing flow parallel to the neutral line.
Hindman, B., Haber, D. and Toomre, J. ApJ, 2006, 653, 725
Comparison between results Comparison between results from different techniquesfrom different techniques
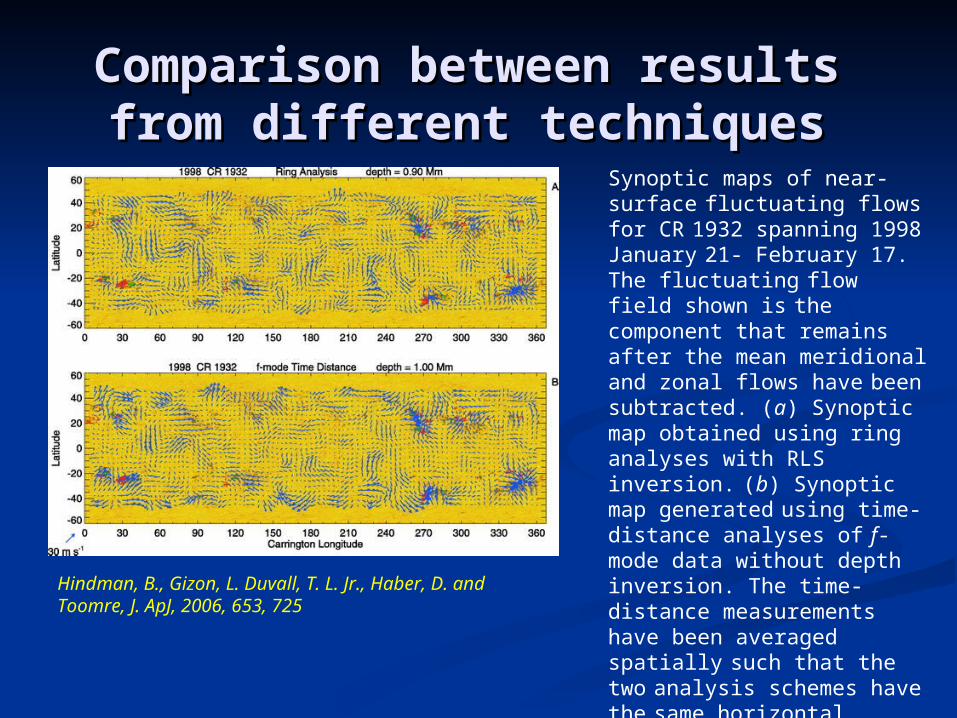
Synoptic maps of near-surface fluctuating flows for CR 1932 spanning 1998 January 21- February 17. The fluctuating flow field shown is
the component that remains
after the mean meridional
and zonal flows have been subtracted. (a) Synoptic map obtained using ring analyses with RLS inversion. (b) Synoptic map generated
using time-distance analyses of f-mode data without depth
inversion. The time-distance measurements have been averaged spatially such that the two analysis schemes have the same horizontal resolution of 15°. The maps generated with the two techniques are decidedly similar, possessing common inflow and outflow sites.
Hindman, B., Gizon, L. Duvall, T. L. Jr., Haber, D. and Toomre, J. ApJ, 2006, 653, 725
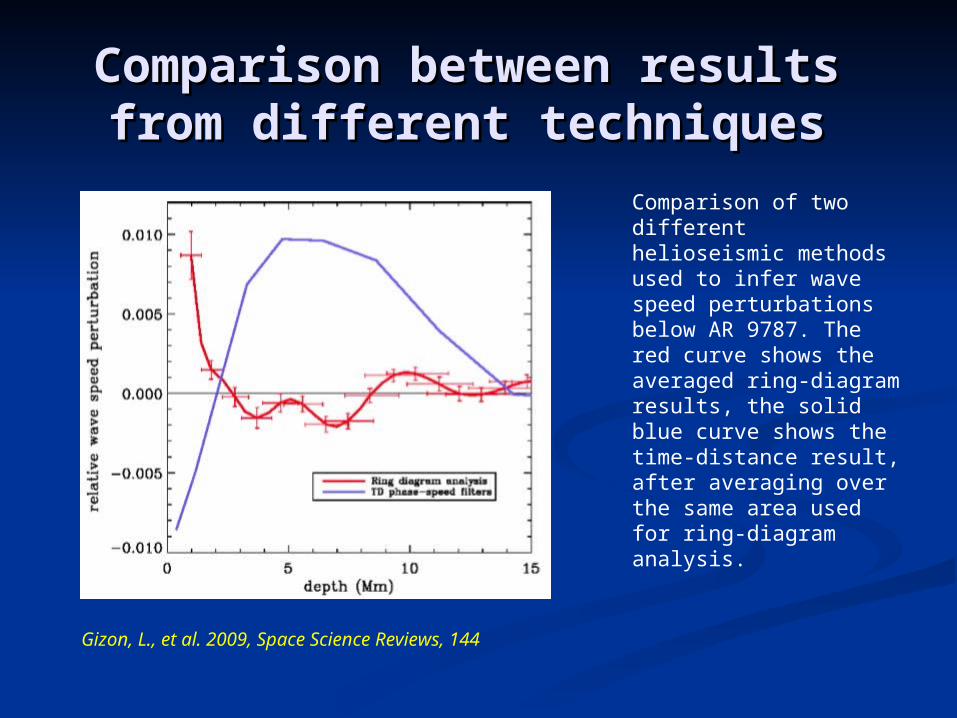
Comparison between results Comparison between results from different techniquesfrom different techniques
Comparison of two different helioseismic methods used to infer wave speed perturbations below AR 9787. The red curve shows the averaged ring-diagram results, the solid blue curve shows the time-distance result, after averaging over the same area used for ring-diagram analysis.
Gizon, L., et al. 2009, Space Science Reviews, 144
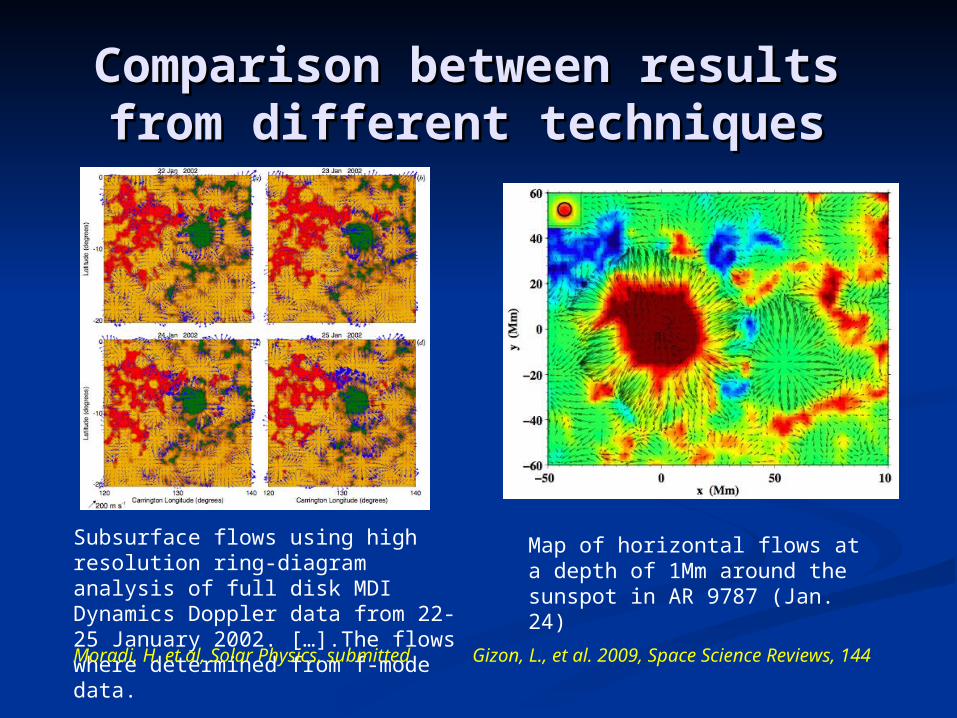
Comparison between results Comparison between results from different techniquesfrom different techniques
Subsurface flows using high resolution ring-diagram analysis of full disk MDI Dynamics Doppler data from 22-25 January 2002. […].The flows where determined from f-mode data. Gizon, L., et al. 2009, Space Science Reviews,
144Moradi, H. et al, Solar Physics, submitted
Map of horizontal flows at a depth of 1Mm around the sunspot in AR 9787 (Jan. 24)
Excluding Active RegionsExcluding Active Regions
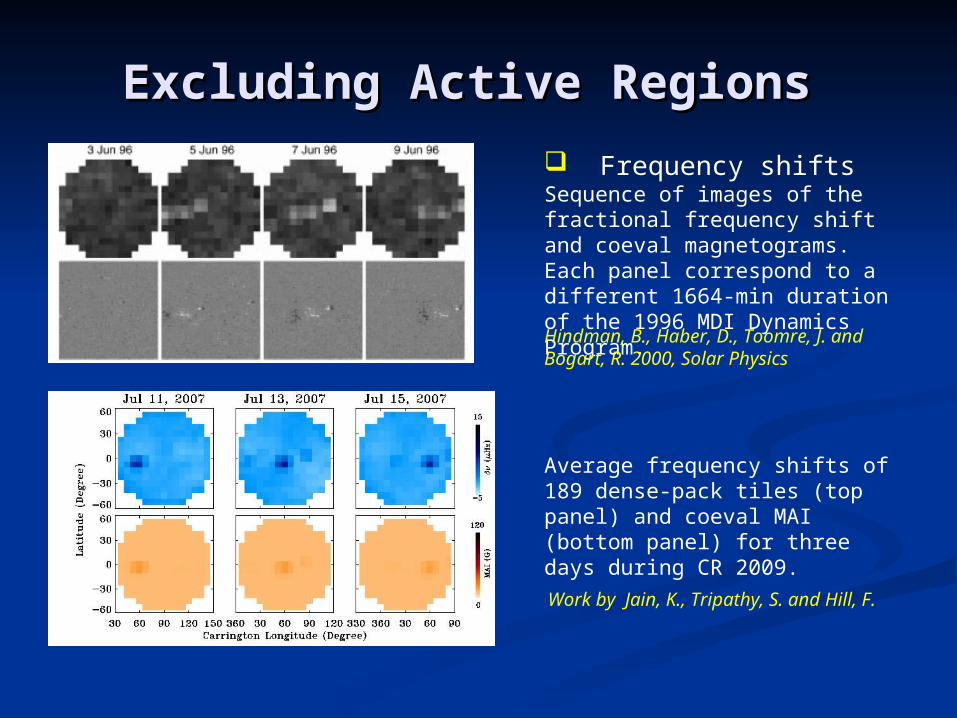
Frequency shiftsSequence of images of the fractional frequency shift and coeval magnetograms. Each panel correspond to a different 1664-min duration of the 1996 MDI Dynamics Program.Hindman, B., Haber, D., Toomre, J. and Bogart, R. 2000, Solar Physics
Average frequency shifts of 189 dense-pack tiles (top panel) and coeval MAI (bottom panel) for three days during CR 2009.
Work by Jain, K., Tripathy, S. and Hill, F.
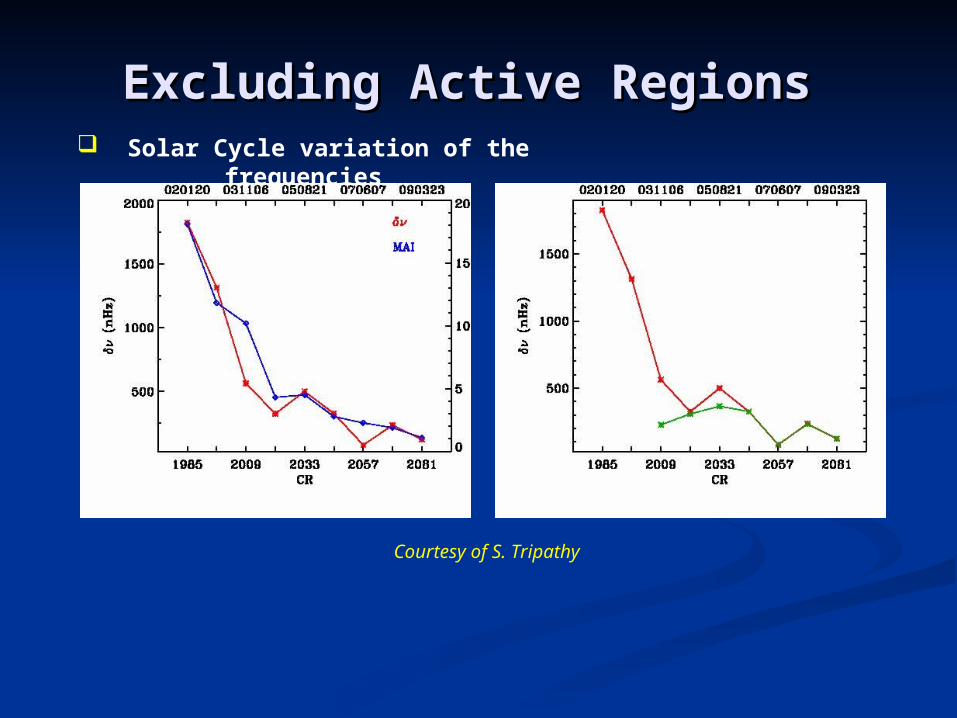
Excluding Active RegionsExcluding Active Regions Solar Cycle variation of the
frequencies
Courtesy of S. Tripathy
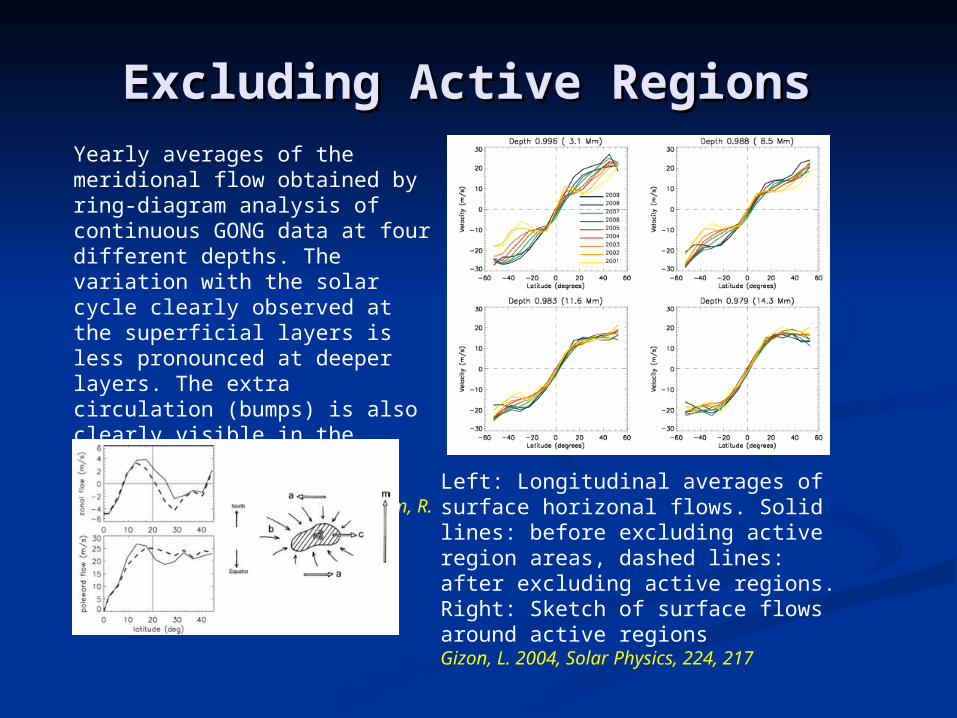
Excluding Active RegionsExcluding Active RegionsYearly averages of the meridional flow obtained by ring-diagram analysis of continuous GONG data at four different depths. The variation with the solar cycle clearly observed at the superficial layers is less pronounced at deeper layers. The extra circulation (bumps) is also clearly visible in the shallow layers.
González Hernández, I., Howe, R., Komm, R. and Hill F. 2010, ApJ Letters, submitted
Left: Longitudinal averages of surface horizonal flows. Solid lines: before excluding active region areas, dashed lines: after excluding active regions.Right: Sketch of surface flows around active regionsGizon, L. 2004, Solar Physics, 224, 217
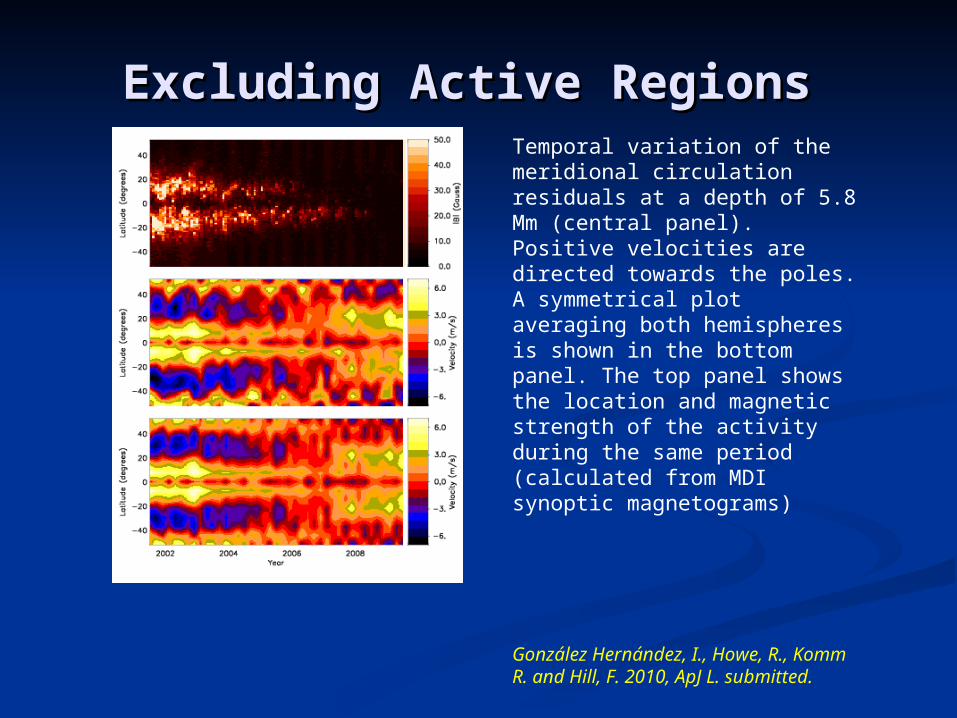
Excluding Active RegionsExcluding Active RegionsTemporal variation of the meridional circulation residuals at a depth of 5.8 Mm (central panel). Positive velocities are directed towards the poles. A symmetrical plot averaging both hemispheres is shown in the bottom panel. The top panel shows the location and magnetic strength of the activity during the same period (calculated from MDI synoptic magnetograms)
González Hernández, I., Howe, R., Komm R. and Hill, F. 2010, ApJ L. submitted.
Summary and Ongoing work Summary and Ongoing work What have we learned from Active Region Seismology
Large scale flow pattern below active regions
Overall sound speed variation
Location of active regions in the far side of the Sun
Solar cycle variation in frequencies highly affected by local strong magnetic field.
Possibility of using dynamic parameters as predictors for solar flare eruptions and active region emergence.
Interpreting the results is very tricky (surface contamination!).
Modeling and artificial data analysis
Continuous, high quality data : MDI, GONG and now HMI
Sunspot seismology with Hinode (Zhao, J. et al, 2010, 708,304)
Related Documents