SCHOOL OF ARCHITECTURE, BUILDING AND DESIGN THE DESIGN SCHOOL FOUNDATION IN NATURAL BUILD ENVIRONMENT BASIC ACCOUNTING [ACC 30205] FINANCIAL RATIO ANALYSIS TAN CHONG MOTOR HOLDINGS BERHAD LECTURER: CHANG JAU HO SUBMISSION DATE: JUNE 4 th 2015 GROUP MEMBERS: Name ID DANIEL SONG CHENG HOCK 0320155 ABDUL QAYYUM SHAHMIE 0320220 SATESH RAJ 0321419

Welcome message from author
This document is posted to help you gain knowledge. Please leave a comment to let me know what you think about it! Share it to your friends and learn new things together.
Transcript
SCHOOL OF ARCHITECTURE, BUILDING AND DESIGNTHE DESIGN SCHOOL
FOUNDATION IN NATURAL BUILD ENVIRONMENT
BASIC ACCOUNTING [ACC 30205]
FINANCIAL RATIO ANALYSIS
TAN CHONG MOTOR HOLDINGS BERHAD
LECTURER: CHANG JAU HO
SUBMISSION DATE: JUNE 4th 2015
GROUP MEMBERS:
Name ID
DANIEL SONG CHENG HOCK 0320155
ABDUL QAYYUM SHAHMIE 0320220
SATESH RAJ 0321419
2
TABLE OF CONTENT
COMPANY BACKGROUND & RECENT HISTORY
4
PROFITABILITY RATIOS 5 & 6
INTERPRETATION OF PROFITABILITY RATIOS
6
FINANCIAL STABILITY RATIOS 7
INTERPRETATION OF STABILITY RATIOS
8
PRICE EARNING RATIO 9
INVESTMENT RECOMMENDATION 10
APPENDIX 11-21
REFERENCE 22
3
COMPANY BACKGROUND & RECENT DEVELOPMENTS
Company Status: Public CompanyIndustry: Automotive
Tan Chong Motor Holdings Berhad(TCMH) was set up on 14 October 1972. From the earliest point of being a small motor vehicles distributor by the founder back in 1950s, it has developed into one of the biggest national conglomerates. TCMH is fundamentally an investment company that is specifically occupied with the assembly and distribution of motor vehicles, produces and sells automotive spare parts and accessories.
In 1950s, the company was founded by the Tan brothers and was soon appointed in 1957 as the sole distributor for Nissan/Datsun throughout Malaysia. During this historical year, first Japanese car that was sold in Malaysia and was later known as Tan Chong Ltd in 1959. The company thrived even further after Nissan/Datsun was recognized as the best-selling model in 1970 and during the year of 1974, it was listed by Kuala Lumpur Stock Market as a public company.
The company assembly plant and operations which is located in Segambut was first established in 1976. During 1977, the production and selling of Nissan diesel trucks and buses were soon introduced and it received a certificate in 1993 for ISO 9002 (Quality System). The company started the exportation venture by beginning to export Nissan C22 Vanette to East Asia countries in 1994. Soon, an agreement was made with Renault to manufacture and distribute Renault cars in the region.
TCM Holdings soon started expanding and building new manufacturing plants to fulfil the new volume of orders, starting with a modern plant in Serendah in 2007. After mastering the regional market, TCM Holdings decided to grow further, to countries like Vietnam, Cambodia, and Taiwan.
The company soon became the sole and exclusive distributor for Nissan vehicles in the Kingdom of Cambodia and Lao People’s Democratic Republic. The ground breaking for the group’s first overseas vehicles assembly plant was in Danang (Vietnam) as it acquired 74% charter capital of Nissan Vietnam Co Ltd. The signing of the agreement took place in 2010 in Hanoi.
PROFITABILITY RATIOS
4
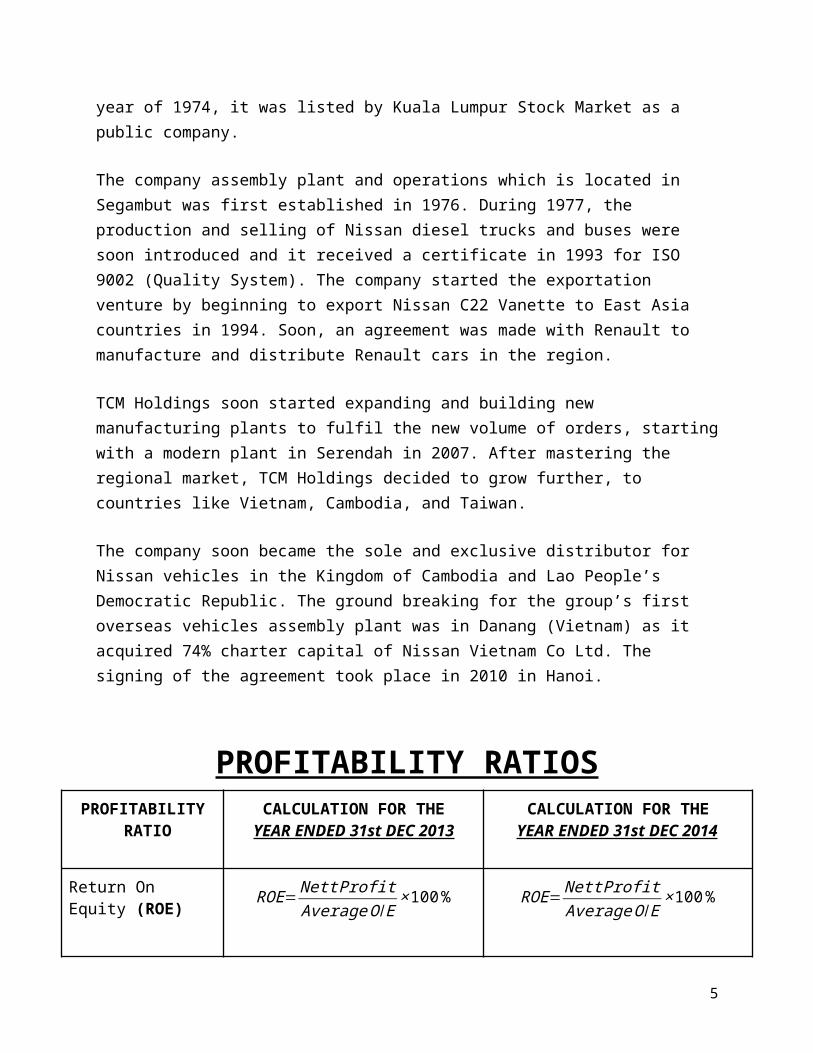
PROFITABILITY RATIO
CALCULATION FOR THE YEAR ENDED 31st DEC 2013
CALCULATION FOR THEYEAR ENDED 31st DEC 2014
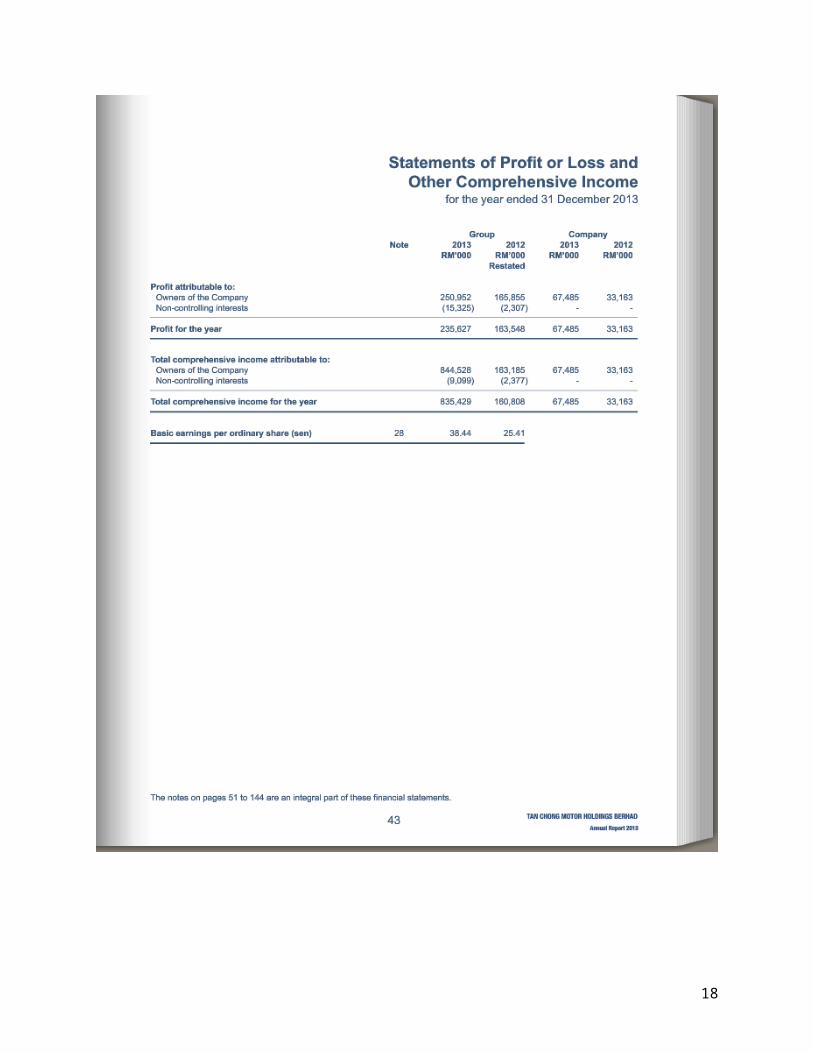
Return On Equity (ROE)
ROE= Nett ProfitAverageO /E
×100%
ROE= 235 ,627 ,0002,336,014,500
×100%
ROE=10.1%
ROE= Nett ProfitAverageO /E
×100%
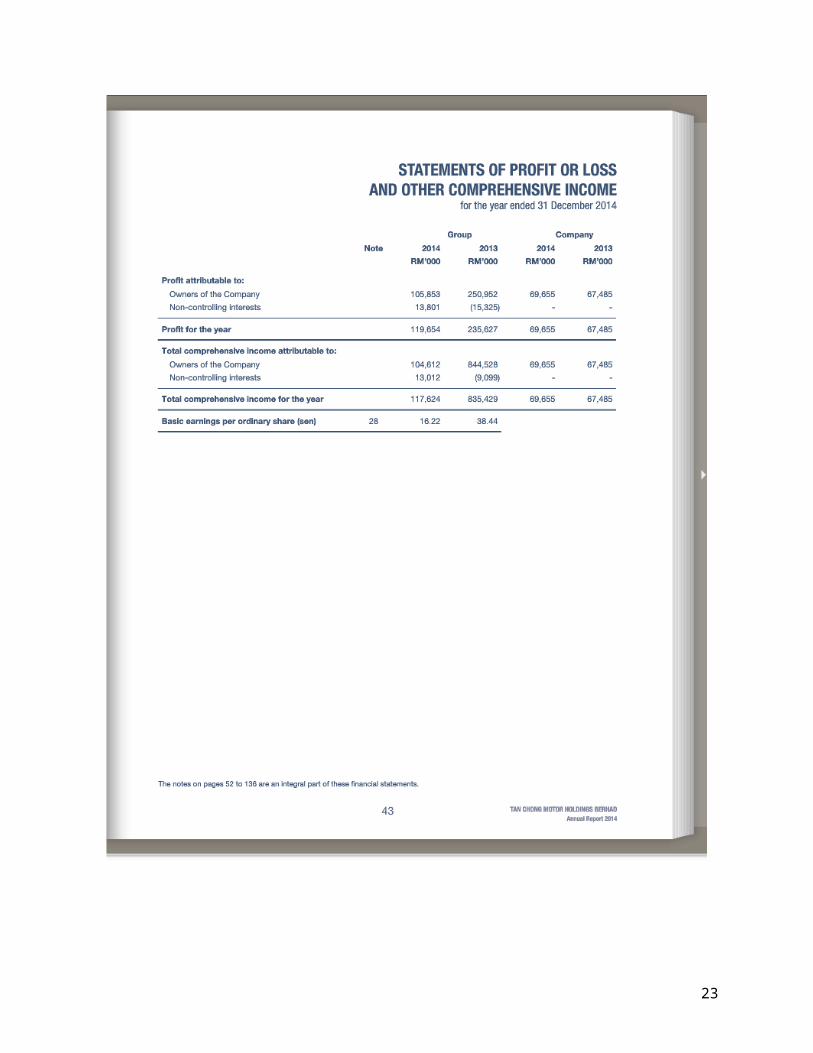
ROE= 119,654,0002,731,358,000
×100%
ROE=4.38% ↓
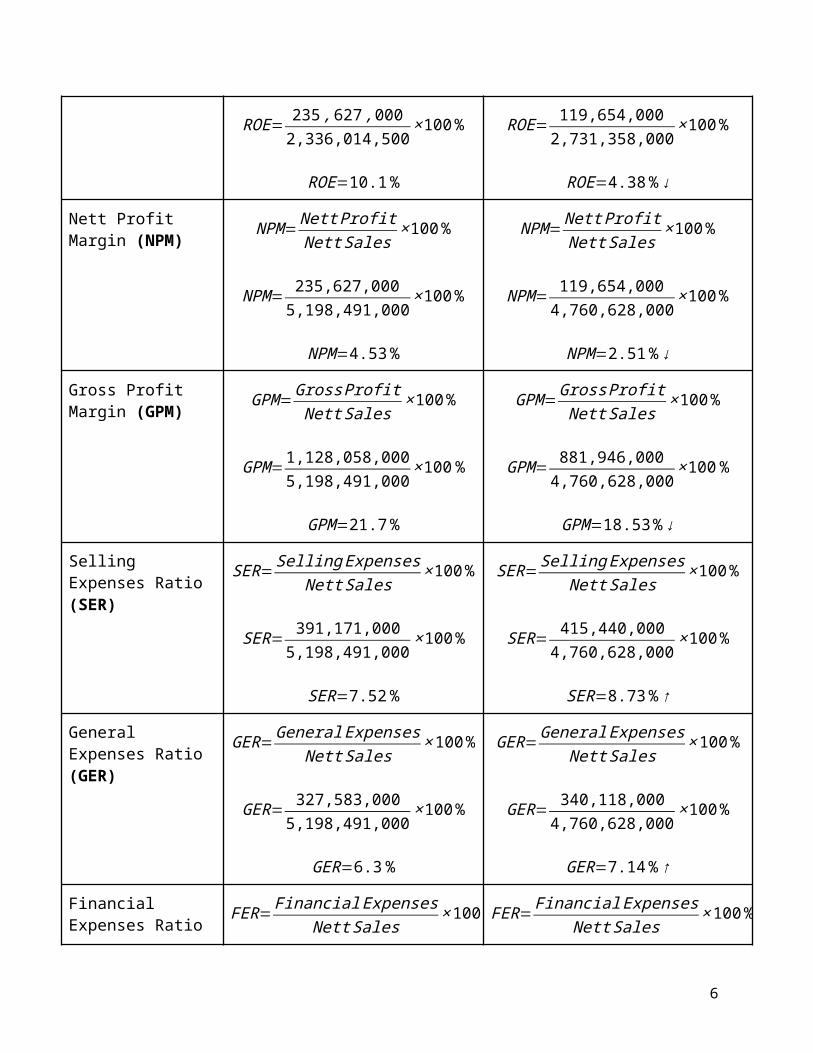
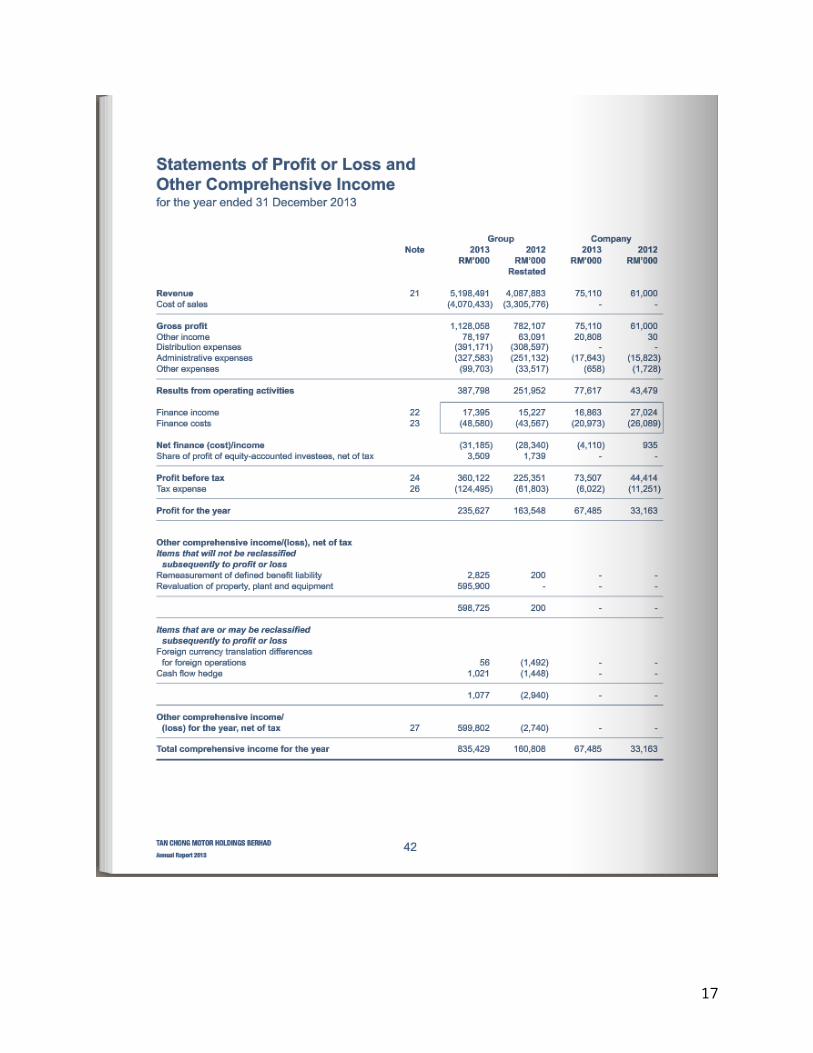
Nett Profit Margin (NPM)
NPM=Nett ProfitNett Sales
×100%
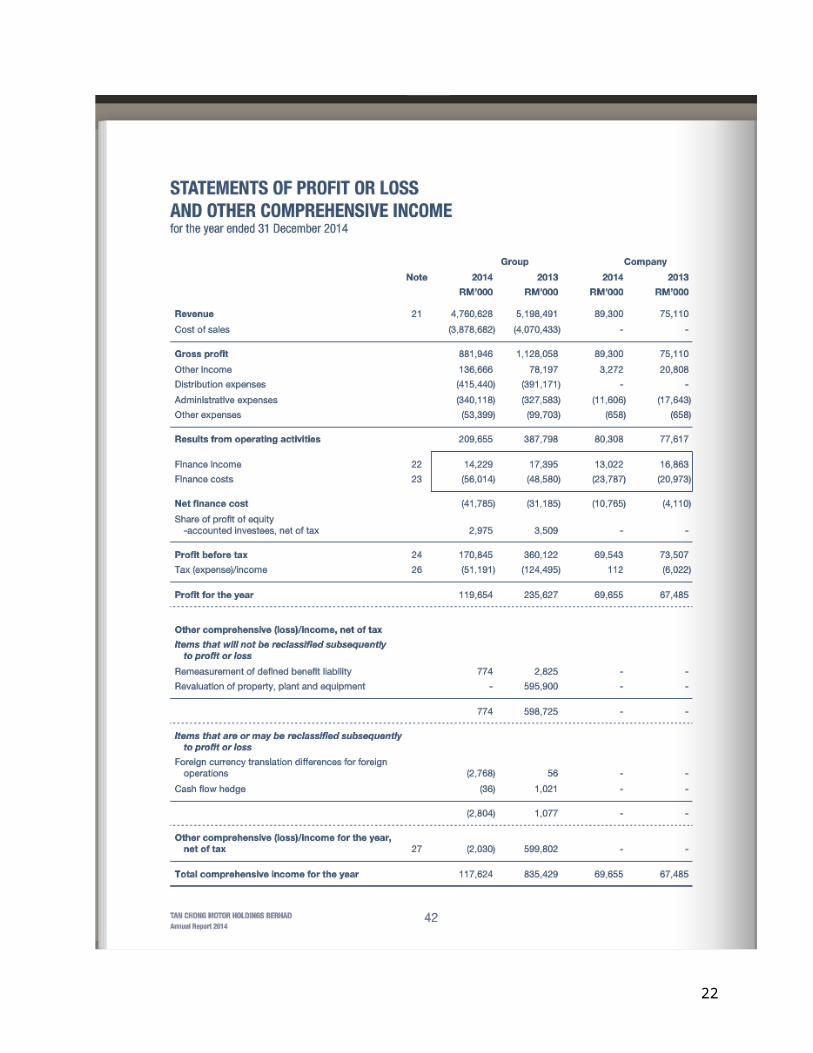
NPM= 235,627,0005,198,491,000
×100%
NPM=4.53%
NPM=Nett ProfitNett Sales
×100%
NPM= 119,654,0004,760,628,000
×100%
NPM=2.51%↓
Gross Profit Margin (GPM)
GPM=Gross ProfitNett Sales
×100%
GPM=1,128,058,0005,198,491,000
×100%
GPM=21.7%
GPM=Gross ProfitNett Sales
×100%
GPM= 881,946,0004,760,628,000
×100%
GPM=18.53%↓
Selling Expenses Ratio (SER)
SER=Selling ExpensesNett Sales
×100%
SER= 391,171,0005,198,491,000
×100%
SER=7.52%
SER=Selling ExpensesNett Sales
×100%
SER= 415,440,0004,760,628,000
×100%
SER=8.73%↑
General Expenses Ratio (GER)
GER=General ExpensesNett Sales
×100%
GER= 327,583,0005,198,491,000
×100%
GER=6.3%
GER=General ExpensesNett Sales
×100%
GER= 340,118,0004,760,628,000
×100%
GER=7.14% ↑
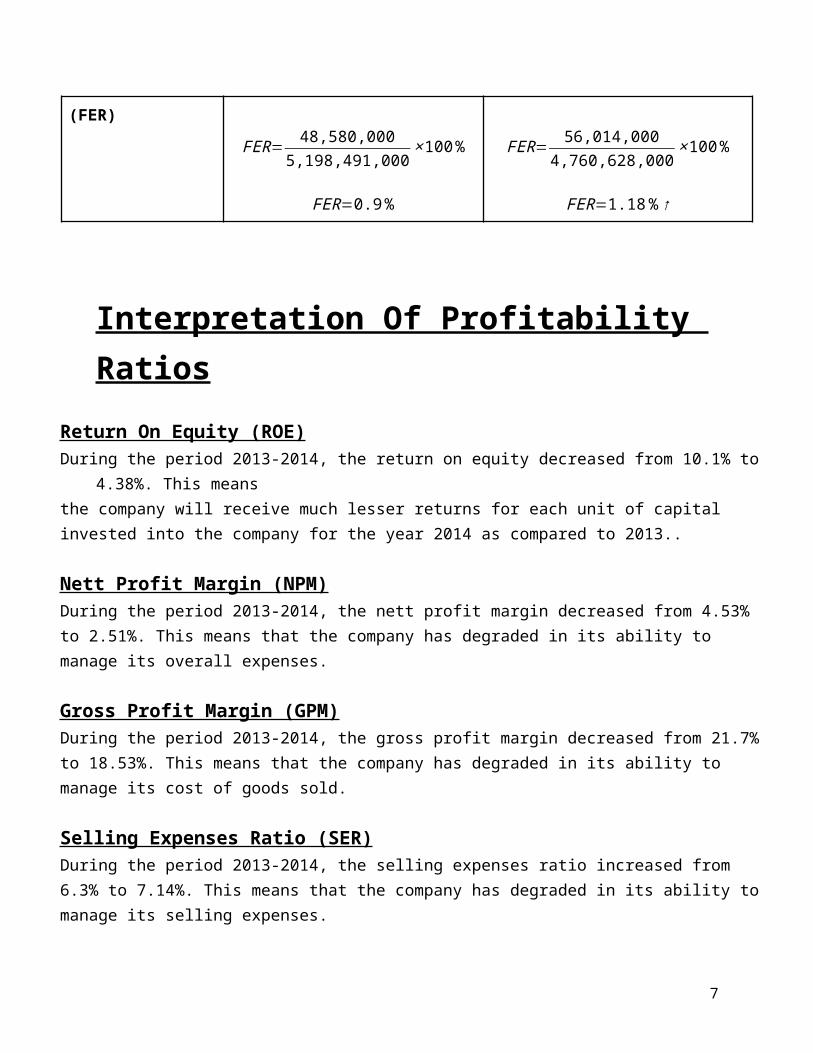
Financial Expenses Ratio (FER)
FER= Financial ExpensesNett Sales
×100% FER= Financial ExpensesNett Sales
×100%
5
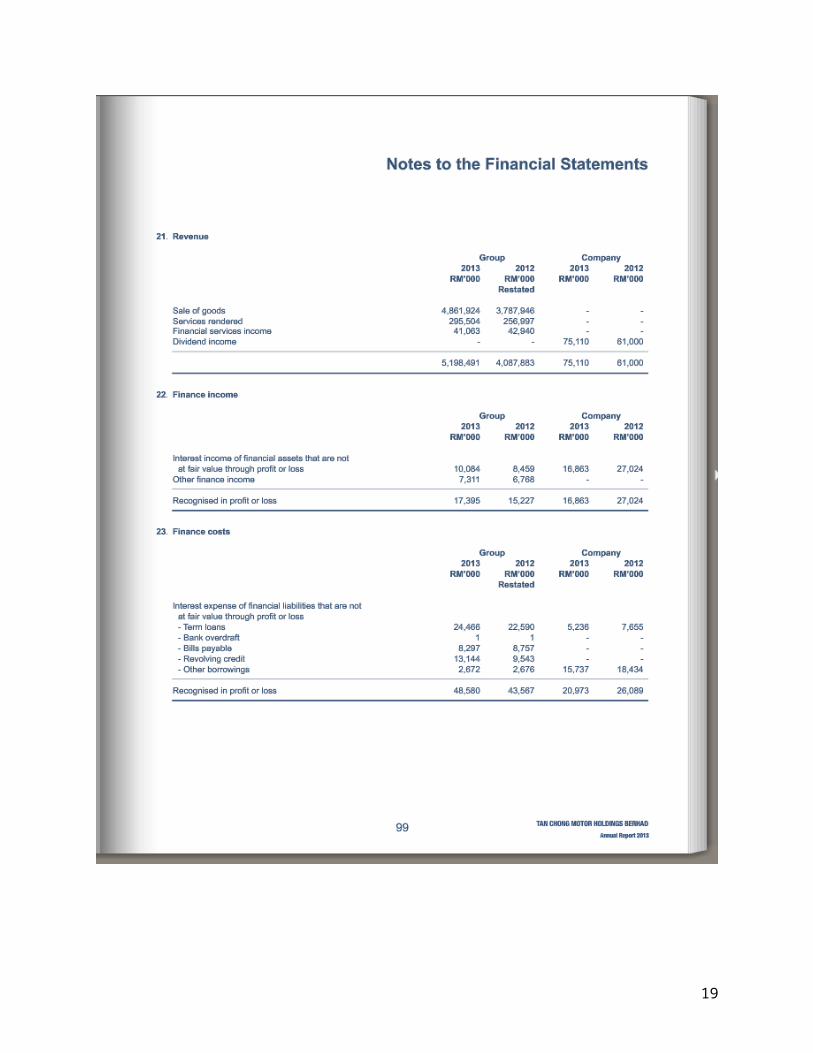
FER= 48,580,0005,198,491,000
×100%
FER=0.9%
FER= 56,014,0004,760,628,000
×100%
FER=1.18%↑
Interpretation Of Profitability Ratios
Return On Equity (ROE)During the period 2013-2014, the return on equity decreased from 10.1% to 4.38%. This meansthe company will receive much lesser returns for each unit of capital invested into the company for the year 2014 as compared to 2013..
Nett Profit Margin (NPM)During the period 2013-2014, the nett profit margin decreased from 4.53% to 2.51%. This means that the company has degraded in its ability to manage its overall expenses.
Gross Profit Margin (GPM)During the period 2013-2014, the gross profit margin decreased from 21.7% to 18.53%. This means that the company has degraded in its ability to manage its cost of goods sold.
Selling Expenses Ratio (SER)During the period 2013-2014, the selling expenses ratio increased from 6.3% to 7.14%. This means that the company has degraded in its ability to manage its selling expenses.
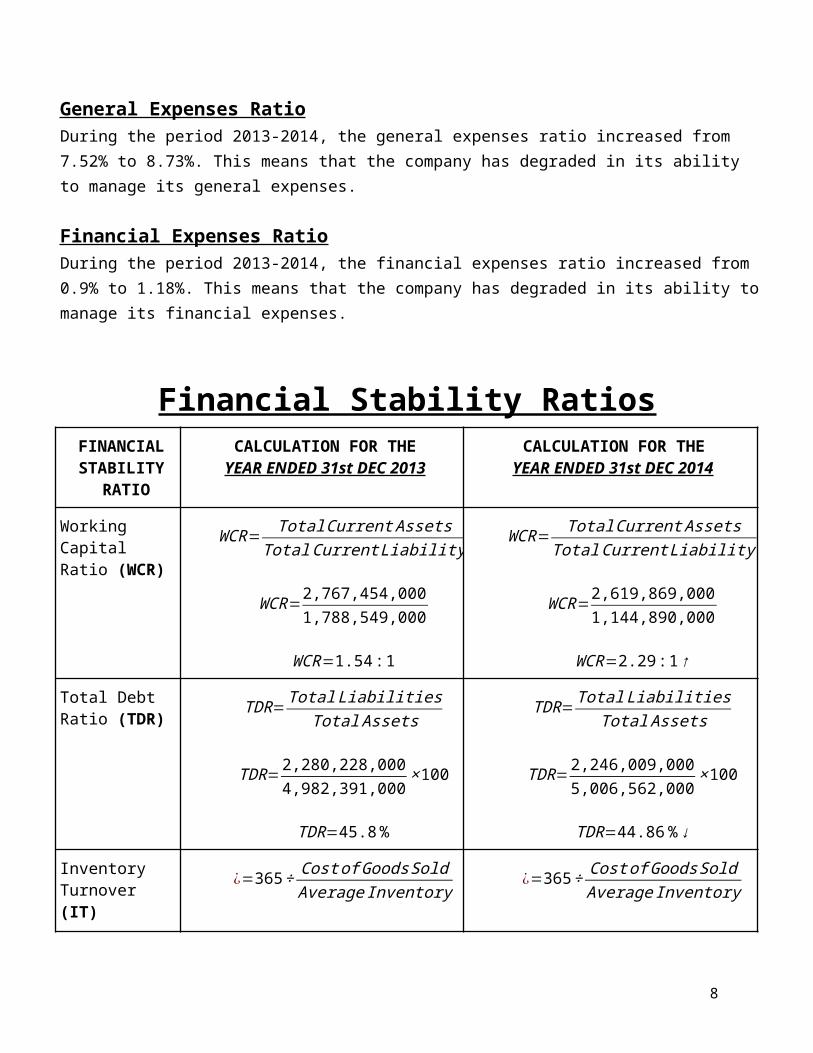
General Expenses RatioDuring the period 2013-2014, the general expenses ratio increased from 7.52% to 8.73%. This means that the company has degraded in its ability to manage its general expenses.
Financial Expenses RatioDuring the period 2013-2014, the financial expenses ratio increased from 0.9% to 1.18%. This means that the company has degraded in its ability to manage its financial expenses.
Financial Stability Ratios
6
FINANCIAL STABILITY
RATIO
CALCULATION FOR THEYEAR ENDED 31st DEC 2013
CALCULATION FOR THEYEAR ENDED 31st DEC 2014
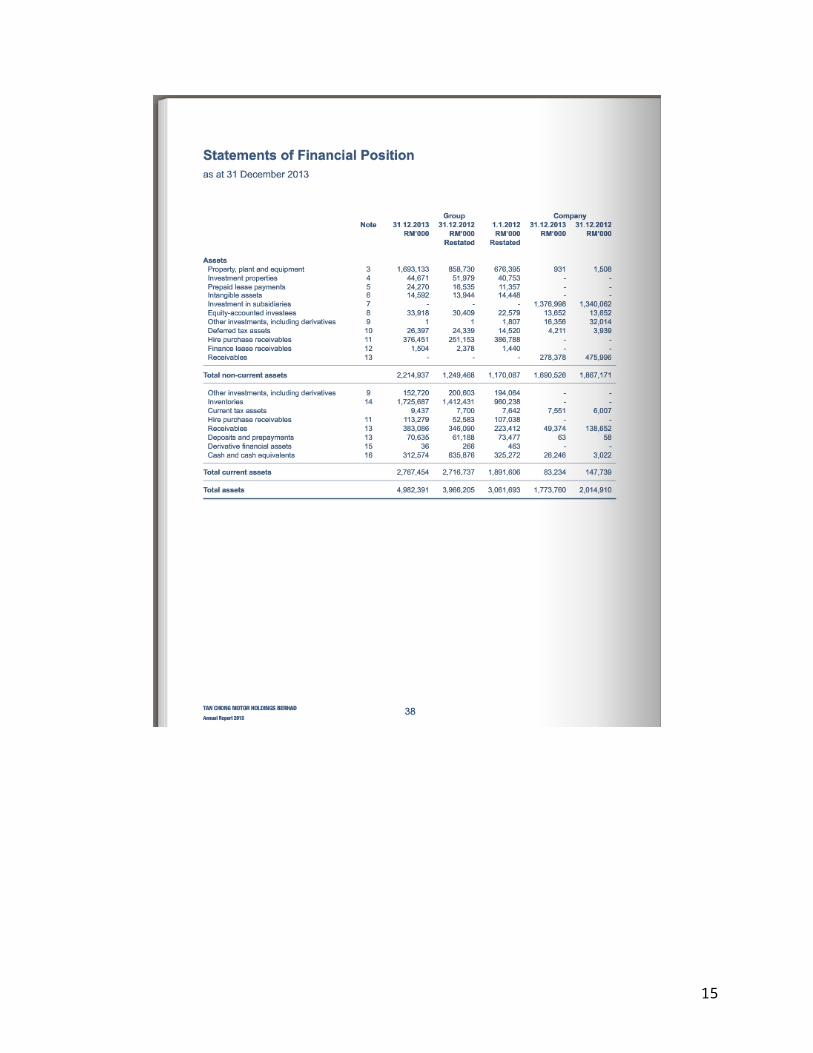
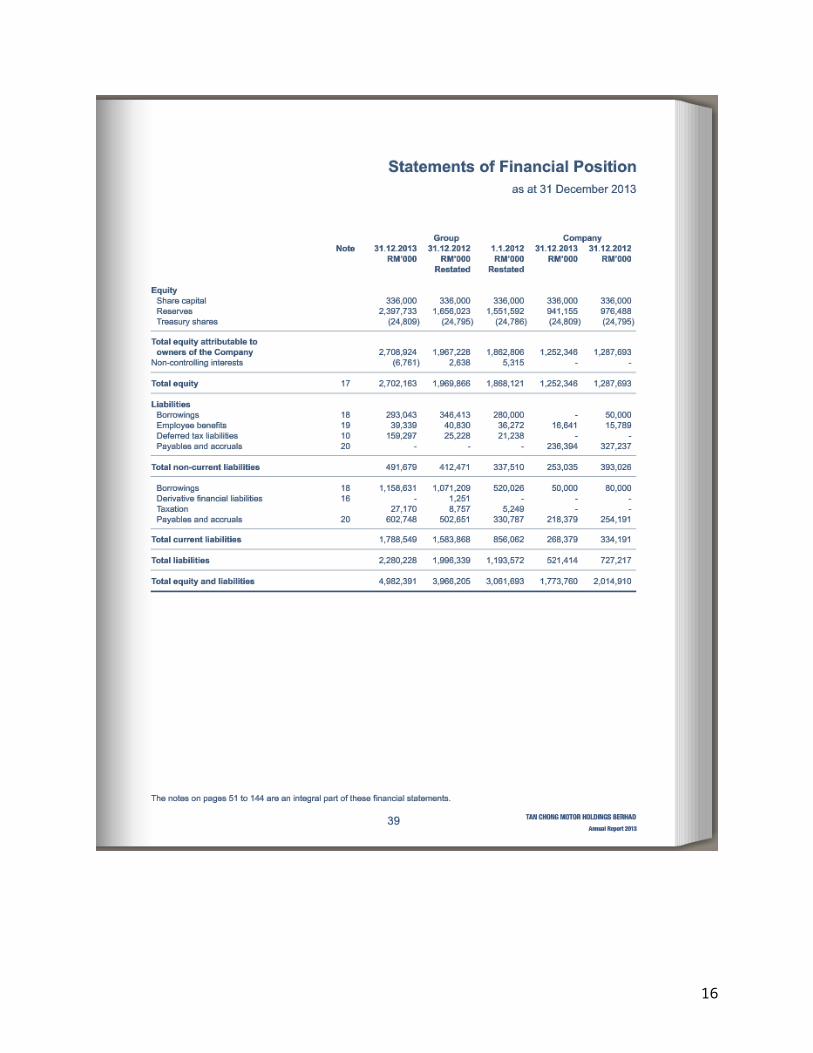
Working Capital Ratio (WCR)
WCR= Total Current AssetsTotal Current Liability
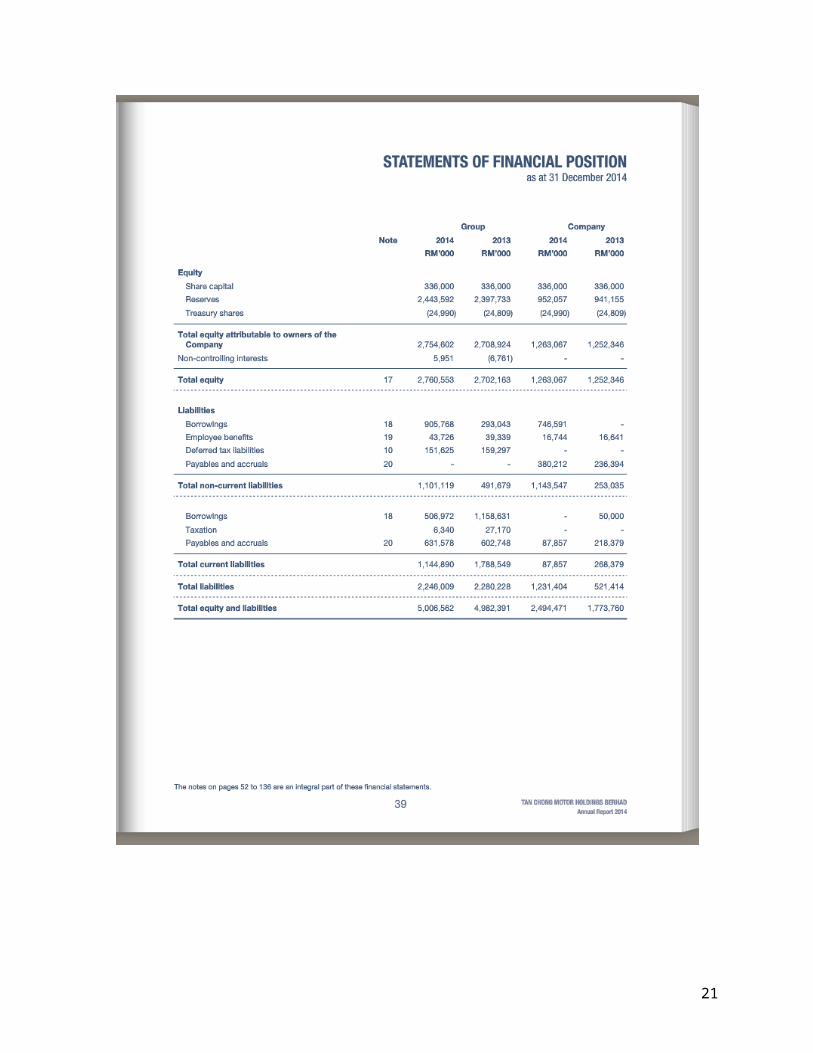
WCR=2,767,454,0001,788,549,000
WCR=1.54 :1
WCR= Total Current AssetsTotal Current Liability
WCR=2,619,869,0001,144,890,000
WCR=2.29: 1↑
Total Debt Ratio (TDR)
TDR=Total LiabilitiesTotal Assets
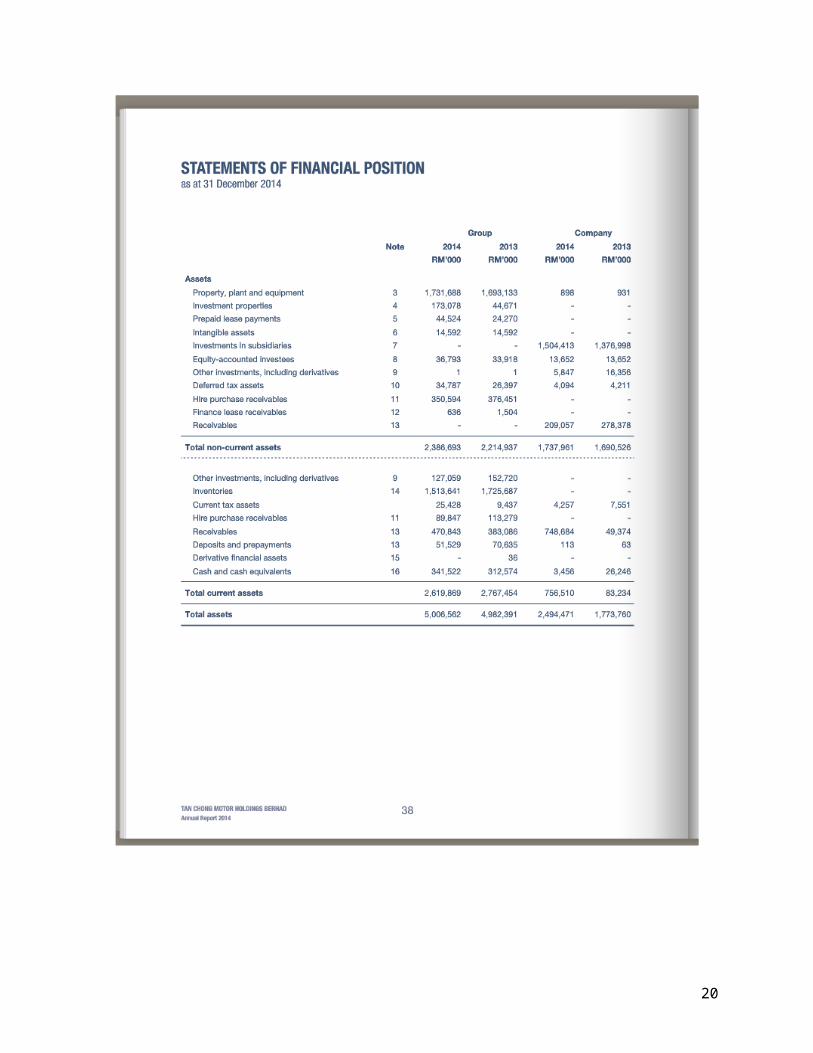
TDR=2,280,228,0004,982,391,000
×100
TDR=45.8%
TDR=Total LiabilitiesTotal Assets
TDR=2,246,009,0005,006,562,000
×100
TDR=44.86%↓
Inventory Turnover (IT)
¿=365÷ Cost of Goods SoldAverage Inventory
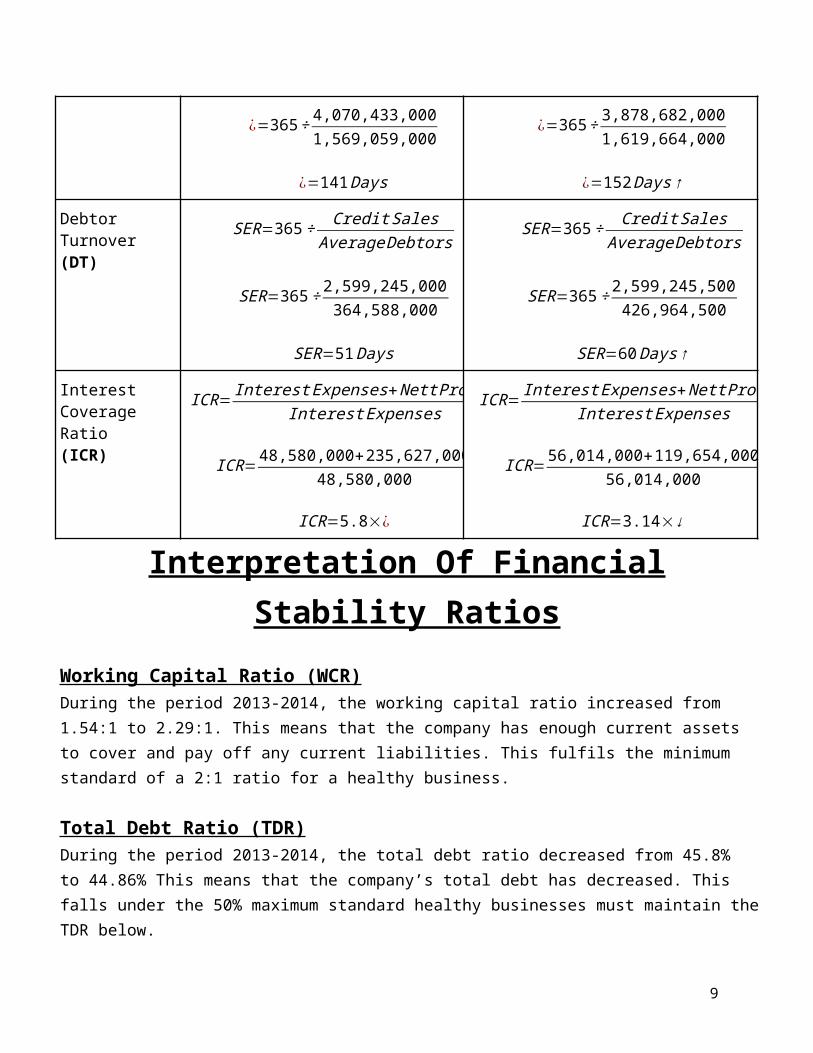
¿=365÷ 4,070,433,0001,569,059,000
¿=141Days
¿=365÷ Cost of Goods SoldAverage Inventory
¿=365÷ 3,878,682,0001,619,664,000
¿=152Days↑
Debtor Turnover (DT)
SER=365÷ Credit SalesAverageDebtors
SER=365÷ 2,599,245,000364,588,000
SER=51Days
SER=365÷ Credit SalesAverageDebtors
SER=365÷ 2,599,245,500426,964,500
SER=60Days↑
Interest CoverageRatio(ICR)
ICR= Interest Expenses+Nett ProfitInterest Expenses
ICR=48,580,000+235,627,00048,580,000
ICR=5.8׿
ICR= Interest Expenses+Nett ProfitInterest Expenses
ICR=56,014,000+119,654,00056,014,000
ICR=3.14×↓
7
Interpretation Of Financial Stability Ratios
Working Capital Ratio (WCR)During the period 2013-2014, the working capital ratio increased from 1.54:1 to 2.29:1. This means that the company has enough current assets to cover and pay off any current liabilities. This fulfils the minimum standard of a 2:1 ratio for a healthy business.
Total Debt Ratio (TDR)During the period 2013-2014, the total debt ratio decreased from 45.8% to 44.86% This means that the company’s total debt has decreased. This falls under the 50% maximum standard healthy businesses must maintain the TDR below.
Inventory Turnover (IT)During the period 2013-2014, the inventory turnover has increased from 141 days to 152 days. This means that the company’s ability to sell of its stock on average, is degrading, as it has increased from 141 days, to 152 days to sell of its inventory in 2014.
Debtor Turnover (DT)During the period 2013-2014, the debtor turnover has increased from 51 days to 60 days. This means that the company has degraded in its ability to collect its debts as it has increased from 51 days, to 60 days to collect debts, in 2014.
Interest Coverage Ratio (ICR)During the period 2013-2014, the interest coverage ratio increased from 5.8 times to 3.14 times. This means that the company has degraded in its ability to pay off its interest expenses. This falls below the 5 times minimum standard healthy businesses must maintain the ICR below.
8
Price/Earnings Ratio
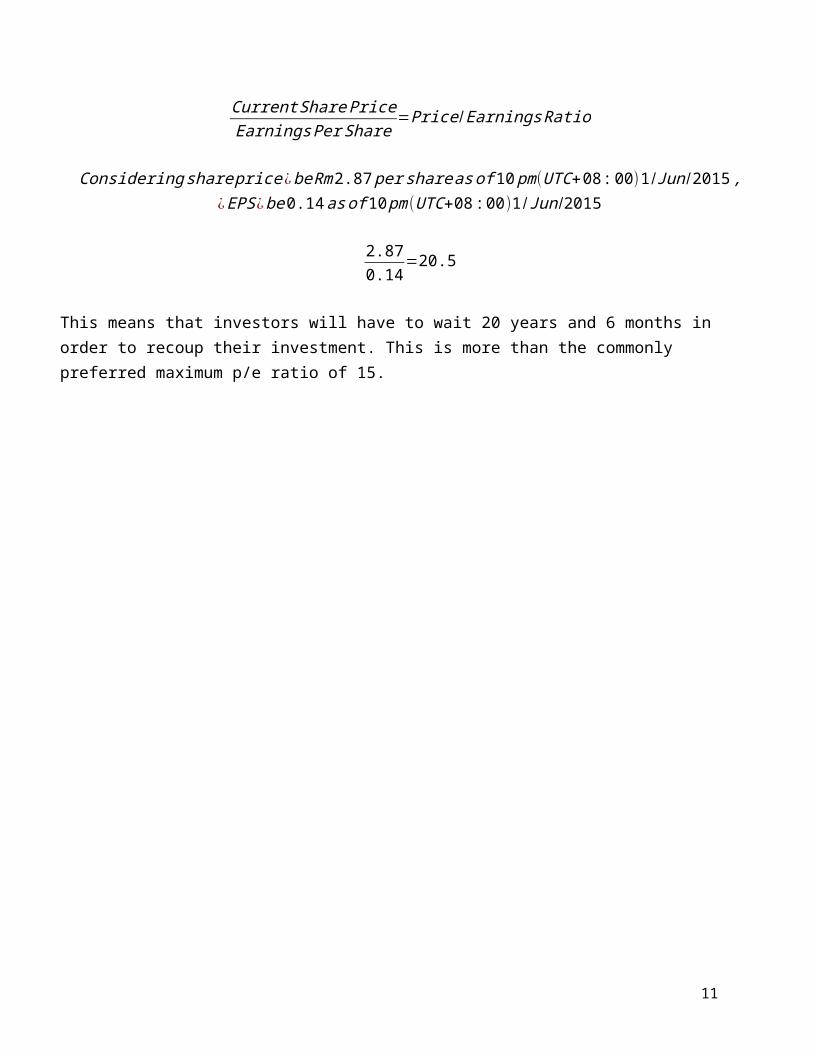
Current Share PriceEarningsPer Share
=Price /EarningsRatio
Considering share price¿be Rm2.87 per shareas of 10 pm(UTC+08 :00)1 /Jun/2015 ,¿EPS ¿be0.14 asof 10 pm(UTC+08 : 00)1/Jun /2015
2.870.14
=20.5
This means that investors will have to wait 20 years and 6 months in order to recoup their investment. This is more than the commonly preferred maximum p/e ratio of 15.
Investment R ecommendation
After the analyses and interpretation of all the profitability and financial stability ratios attributed to Tan Chong Motor Holdings Berhad, it has been determined that Tan Chong Motor Holdings, has
9
been suffering in terms of profitability for the 2013-2014 period, but has managed to retain financial stability throughout this rather negative term.
The group’s profitability ratios have shown to be rather disappointing showing a significant drop in return on equity, nett profit margins, as well as gross profit margins. All the expense ratios, such as selling expense ratios, general expense ratios, and financial expense ratios show some measure of increase.
It should be noted however, that this is mostly attributed to lack of Nissan’s introduction of new products into the market, where their competitors, such as Toyota, have aggressively introduced new models into the market in order to compensate for the bearish effect the economy’s outlook has borne. In fair conditions, TCM Holdings has shown to perform very well. (Personal communication, 31st May 2015)
Besides profitability, the group’s financial stability ratios actually show to be rather stable showing increases in working capital, and total debt ratios. This goes to show that the company has the financial stability, to weather through trying times, and can sustain operations, and expand its business even in such conditions. However, the increase in the debt turnover and inventory turnover show to be a negative to small consequence. Also, the decrease in the interest coverage ratio show to be negative as the company seems to less capable to cover its interest expenses.
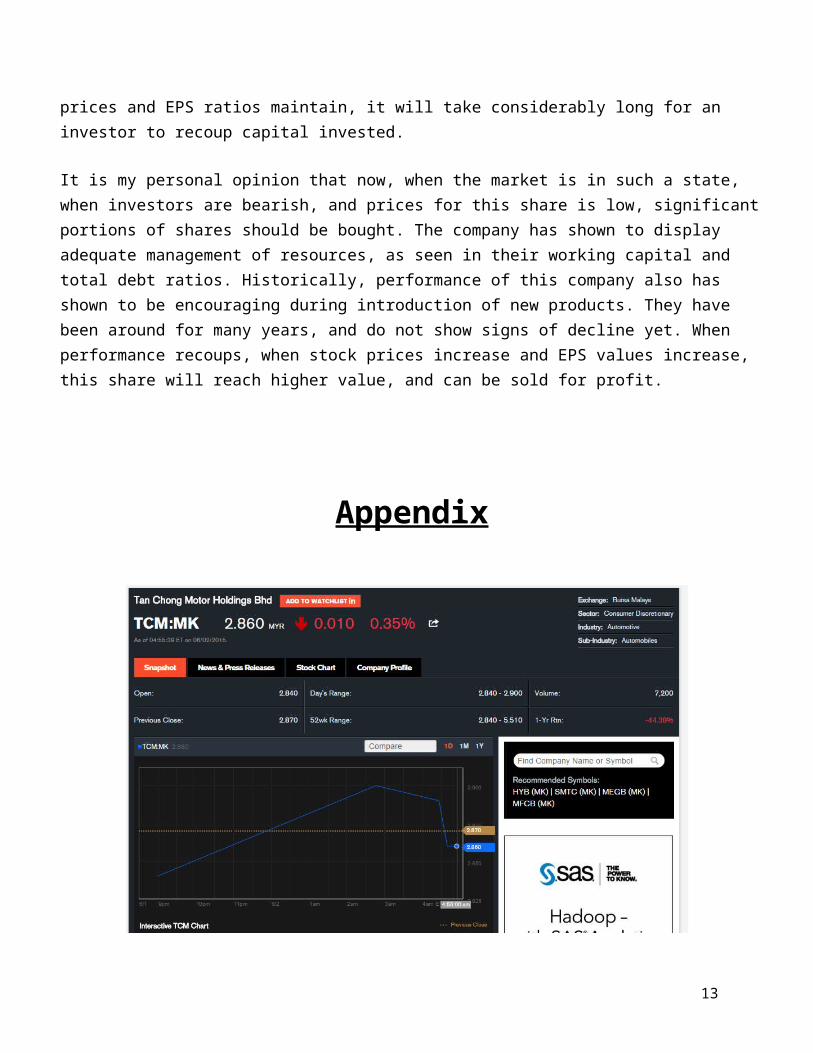
Finally, we consider the price/earnings ratio. It shows to be rather disappointing, showing to be 20.5. This means that, if current share prices and EPS ratios maintain, it will take considerably long for an investor to recoup capital invested.
It is my personal opinion that now, when the market is in such a state, when investors are bearish, and prices for this share is low, significant portions of shares should be bought. The company has shown to display adequate management of resources, as seen in their working capital and total debt ratios. Historically, performance of this company also has shown to be encouraging during introduction of new products. They have been around for many years, and do not show signs of decline yet. When performance recoups, when stock prices increase and EPS values increase, this share will reach higher value, and can be sold for profit.
Appendix
10
Retrieved 10pm (UTC +8:00) 2/6/2015 (not reflecting data retrieved at time of calculation of p/e ratio)
11
12
13
14
15
16
17
18
19
20
21
References
1) Tan Chong Motor Holdings Berhad Annual Report 2014. (2015). Kuala Lumpur: Tan Chong Motor Holdings Berhad.
2) Tan Chong Motor Holdings Berhad-Annual Report 2013. (2014, April 26). Retrieved May 27, 2015, from http://tanchonggroup.listedcompany.com/misc/FlippingBook_PDF_Publisher/Publications/HTML/ar2013/#/44/zoomed
3) Another challenging year ahead for Tan Chong Motor. (2015, February 26). The Star.
4) Tan Chong Motor Holdings Berhad Company Profile. Retrieved June 1st, 2015, from http://www.bloomberg.com/quote/TCM:MK
5) Tan Chong Motor Holdings Berhad Company Milestones. Retrieved June 2, 2015, from http://www.tanchonggroup.com/companybackground.html
6) Bluman, A. (2006). Business math demystified. New York: McGraw-Hill.
7) Yap, C. (Ed.). (n.d.). Motor Trader. Retrieved June 3, 2015. http://www.motortrader.com.my/news/the-tan-chong-story/
8) Steven K.C Poh. CNN news. Retrieved June 3, 2015. http://edition.cnn.com/ASIANOW/asiaweek/96/0412/biz2.html
9) Danny Tan. Paultan local news. Retrieved June 3, 2015.http://paultan.org/2014/02/14/tan-chong-confirms-five-new-nissan-models-2014/
22
23
Related Documents