Accepted refereed manuscript of: Salini MJ, Poppi D, Turchini GM & Glencross B (2016) Defining the allometric relationship between size and individual fatty acid turnover in barramundi Lates calcarifer, Comparative Biochemistry and Physiology Part A: Molecular and Integrative Physiology, 201, pp. 79-86. DOI: 10.1016/j.cbpa.2016.06.028 © 2016, Elsevier. Licensed under the Creative Commons Attribution-NonCommercial-NoDerivatives 4.0 International http://creativecommons.org/licenses/by-nc-nd/4.0/

Welcome message from author
This document is posted to help you gain knowledge. Please leave a comment to let me know what you think about it! Share it to your friends and learn new things together.
Transcript
Accepted refereed manuscript of:
Salini MJ, Poppi D, Turchini GM & Glencross B (2016) Defining
the allometric relationship between size and individual fatty acid
turnover in barramundi Lates calcarifer, Comparative
Biochemistry and Physiology Part A: Molecular and Integrative
Physiology, 201, pp. 79-86.
DOI: 10.1016/j.cbpa.2016.06.028
© 2016, Elsevier. Licensed under the Creative Commons
Attribution-NonCommercial-NoDerivatives 4.0 International
http://creativecommons.org/licenses/by-nc-nd/4.0/
Defining the allometric relationship between size and individual fatty acid turnover in 1
barramundi Lates calcarifer. 2
3
Michael J. Salinia,b,c*, David Poppib,c, Giovanni M. Turchinia, Brett D. Glencrossd 4
5
a Deakin University, Geelong, Australia. School of Life and Environmental Sciences, 6
Warrnambool Campus, Princess Hwy, Warrnambool, VIC., Australia. 7
b CSIRO Agriculture, 144 North Street, Woorim, QLD, Australia. 8
c CSIRO Agriculture, QLD Biosciences Precinct, Services Rd, St Lucia, QLD, Australia. 9
d Institute of Aquaculture, Stirling University, FK9 4LA Stirling, United Kingdom 10
11
*Corresponding author at: Present address: Ridley Aqua Feed, Unit 4, 31 Robart Court, 12
Narangba, QLD, Australia. Tel.: +61 7 3817 9829 Email: [email protected] 13
Abstract 14
An experiment was conducted with barramundi (Asian seabass; Lates calcarifer) to examine 15
the allometric scaling effect of individual fatty acids. Six treatment size classes of fish were 16
deprived of food for 21 days (Treatment A, 10.5 ± 0.13g; Treatment B, 19.2 ± 0.11g; 17
Treatment C, 28.3 ± 0.05g; Treatment D, 122.4 ± 0.10g; Treatment E, 217.6 ± 0.36g; 18
Treatment F, 443.7 ± 1.48g; mean ± SD) with each treatment comprising of fifteen fish, in 19
triplicate. The assessment of somatic losses of whole-body energy and lipid were consistent 20
with previous studies, validating the methodology to be extended to individual fatty acids. 21
Live-weight (LW) exponent values were determined to be 0.817 ± 0.010 for energy and 22
0.895 ± 0.007 for lipid. There were significant differences among the fatty acids ranging from 23
0.687 ± 0.005 for 20:5n-3 (eicosapentaenoic acid) and 0.954 ± 0.008 for 18:1n-9 (oleic acid). 24
The LW exponent values were applied to existing fatty acid intake and deposition data of 25
barramundi fed with either 100% fish oil or 100% poultry oil. From this the maintenance 26
requirement for each fatty acid was determined. The metabolic demands for maintenance and 27
growth were then iteratively determined for fish over a range of size classes. Application of 28
these exponent values to varying levels of fatty acid intake demonstrated that the biggest 29
driver in the utilisation of fatty acids in this species is deposition demand and despite their 30
reputed importance, the long-chain polyunsaturated fatty acids had nominal to no 31
maintenance requirement. 32
Keywords: Allometric scaling; maintenance; fatty acid; bioenergetics; LC-PUFA; 33
barramundi, Asian seabass. 34
1. Introduction 35
A range of different approaches have been used to predict or determine growth as well as 36
feed requirements based on the dynamic flow of nutrients in aquatic systems (Bar et al., 37
2007; Cho and Bureau, 1998; Glencross, 2008; Lupatsch and Kissil, 1998; Machiels and 38
Henken, 1986). Predictive models started out as relatively simple approaches such as the 39
ubiquitous specific growth rate and thermal growth coefficient calculations; however, 40
progressive extensions of these models now exist that consider the many biological properties 41
of fish (Birkett and Lange, 2007; Dumas et al., 2010). In addition, mass-balance models have 42
also been developed and used in understanding specific nutrient and metabolite flows in a 43
range of model species (Cunnane and Anderson, 1997; Turchini et al., 2006; Turchini et al., 44
2007) as well as a whole ecosystem approach (Sawyer et al., 2016). 45
There is a growing body of evidence regarding the essential fatty acid requirements of many 46
species generally determined by various forms in vivo feeding assessments (NRC, 2011). The 47
efficient utilisation of these fatty acids within an organism depends on a number of factors 48
and there are many complex interactions potentially affecting their utilisation efficiency 49
(Glencross, 2009; Tocher, 2015). Despite the numerous studies to date, relatively little is 50
known about the maintenance requirements and utilisation efficiencies associated with 51
specific fatty acids and how these may be used in nutrient modelling. An obvious step in the 52
refinement of factorial models is the incorporation of empirically derived utilisation 53
efficiency values. Recently, the marginal efficiency of long-chain polyunsaturated fatty acids 54
(LC-PUFA) was determined for barramundi (Asian seabass; Lates calcarifer) and differences 55
were clear among the fatty acids (Salini et al., 2015a). Maintenance requirements of protein, 56
lipid and energy typically described by linear equations of intake to gain ratios can give an 57
insight into the partitioning of production and maintenance costs (Bureau et al., 2006; NRC, 58
2011; Pirozzi et al., 2010). Similarly, it should be possible to determine estimates of 59
productivity for specific fatty acids using derived body weight scaling exponent values to 60
provide a size independent response (Bar et al., 2007; Glencross and Bermudes, 2011; White, 61
2011). 62
Bioenergetic modelling of the nutrient flows in barramundi has been extensively researched 63
and ‘user friendly’ simulation programs are used routinely (Glencross, 2008; Glencross and 64
Bermudes, 2010, 2011, 2012). One of the key assumptions and constraints in the application 65
of these models is that the live-weight (LW) exponent values are constant. Studies have 66
shown with barramundi, over a range of normal temperatures, that this is generally the case 67
for the energy, protein and lipid exponents (Glencross and Bermudes, 2011). However, it is 68
assumed that when broken down into constituent fatty acids the body weight exponents are 69
also equivalent to that of the lipid as a complete nutrient. 70
A further refinement of those factorial bioenergetic models could include consideration of the 71
individual fatty acids and potentially amino acids in order to better understand their 72
utilisation in terms of productivity on a size independent basis. Therefore, the aim of the 73
present study was to determine the allometric scaling effect of specific fatty acids in 74
barramundi for use in future bioenergetic studies. In addition, a re-evaluation of previously 75
published data is used to refine the fatty acid demands for maintenance and growth of 76
barramundi using in silico predictive modelling. 77
78
2. Materials and Methods 79
2.1 Fish husbandry and management 80
Juvenile barramundi (Lates calcarifer) were sourced from the Betta barra fish hatchery 81
(Atherton, QLD, Australia), originally from two shipments and on-grown to various sizes 82
using commercial feeds (Ridley Marine Float; Ridley Aquafeeds). The fish were graded 83
multiple times during on-growing phase in order to generate an appropriate range of size 84
classes. Before commencement of the experiment the fish were individually weighed on an 85
electronic balance and sorted into a series of experimental tanks (600 L). Each tank was 86
alimented with heated flow-through seawater (3L/min) and maintained at a temperature of 87
30.0 ± 0.2 °C and dissolved oxygen of 6.6 ± 0.3 mg/L, under fluorescent lighting 12L:12D. 88
At the beginning of the experiment each of the tanks held fifteen fish. The six treatment size 89
classes were randomly distributed among the tanks with each treatment having three replicate 90
tanks (Treatment A, 10.5 ± 0.13g; Treatment B, 19.2 ± 0.11g; Treatment C, 28.3 ± 0.05g; 91
Treatment D, 122.4 ± 0.10g; Treatment E, 217.6 ± 0.36g; Treatment F, 443.7 ± 1.48g). The 92
fish were then fasted for 21 days. Whole fish samples were collected prior to and after fasting 93
from each of the treatment size classes and frozen at -20 °C before laboratory analysis. 94
Ethical clearance was approved for the experimental procedures by the CSIRO animal ethics 95
committee (Approval A3/2015). 96
2.2 Laboratory analysis 97
The initial and final fish were processed using the following methods. The frozen whole fish 98
were passed through a commercial meat mincer (MGT – 012, Taiwan) twice to obtain a 99
homogeneous mixture. A sample was taken for dry matter analysis and another sample was 100
freeze-dried until no further loss of moisture was observed (Alpha 1-4, Martin Christ, 101
Germany). Dry matter was calculated by gravimetric analysis following oven drying at 105ºC 102
for 24 h. Crude protein was calculated after the determination of total nitrogen by organic 103
elemental analysis (CHNS-O Flash 2000, Thermo Scientific, USA), based on N x 6.25. Total 104
lipid content was determined gravimetrically following extraction of the lipids using 105
chloroform:methanol (2:1) following Folch et al. (1957). Gross ash content was determined 106
gravimetrically following loss of mass after combustion of a sample in a muffle furnace at 107
550 ˚C for 24 h. Gross energy was determined by adiabatic bomb calorimetry (Parr 6200 108
Calorimeter, USA). All methods were consistent with (AOAC, 2005). 109
Fatty acid composition was determined following the methods of Christie (2003). Lipids 110
were esterified by an acid-catalysed methylation and 0.3 mg of an internal standard was 111
added to each sample (21:0 Supelco, PA, USA). The fatty acids were identified relative to the 112
internal standard following separation by gas chromatography (GC). An Agilent 113
Technologies 6890N GC system (Agilent Technologies, California, USA) fitted with a DB-114
23 (60m x 0.25mm x 0.15 μm, cat 122-2361 Agilent Technologies, California) capillary 115
column and flame ionisation detection was used. The temperature program was 50–175 ºC at 116
25 ºC /min then 175–230 ºC at 2.5 ºC /min. The injector and detector temperatures were set at 117
250 ºC and 320 ºC, respectively. The column head pressure was set to constant pressure mode 118
at 170 kPa using hydrogen as the carrier gas. The peaks were identified by comparing 119
retention times to the internal standard and further referenced against known standards (37 120
Comp. FAME mix, Supelco, PA, USA). The resulting peaks were then corrected by the 121
theoretical relative FID response factors (Ackman, 2002) and quantified relative to the 122
internal standard. 123
2.3 Assessment of energy, lipid and fatty acid loss 124
The assessment of somatic losses was based on the formula previously reported by Glencross 125
and Bermudes (2011): 126
𝐸𝑛𝑒𝑟𝑔𝑦 𝑙𝑜𝑠𝑠 (𝑘𝐽/𝑑𝑎𝑦) = 𝑊𝑖 ∗ 𝐸𝑖 − 𝑊𝑓 ∗ 𝐸𝑓
𝑡 127
Where the Wi and Wf are the initial and final weights of the fish respectively. Ei and Ef are 128
the initial and final energy content of the whole fish on a live-weight basis respectively. The 129
duration of the assessment is denoted as t. The determination of lipid and fatty acid loss was 130
calculated in the same way by substituting the appropriate Ei and Ef values with the 131
corresponding values for either lipid or fatty acids. 132
2.4 Iteratively determined demands for fatty acids 133
Maintenance demands for each fatty acid were calculated based on the multiplication of the 134
maintenance requirement by the regression of the transformed intake and deposition and then 135
the proportion of each fatty acid present in the whole body lipids following methodology 136
presented in Glencross (2008). Calculation and determination of fatty acid maintenance 137
requirements were previously reported in barramundi (Salini et al., 2015a). The fatty acid 138
gained was calculated as the mass of each fatty acid present in the lipid multiplied by the 139
predicted daily growth following the growth equation developed for barramundi (Glencross, 140
2008): 141
𝐺𝑎𝑖𝑛 (𝑔/𝑓𝑖𝑠ℎ/𝑑) = (𝐾 + 𝑥𝑇 + 𝑦𝑇2 + 𝑧𝑇3) ∗ (𝑤𝑒𝑖𝑔ℎ𝑡)𝑎𝑥+𝑏 142
where K and b are constants and x, y, z and a are determined coefficients of the functional 143
growth response model. T is the temperature within an operating range of 16 to 39°C and 144
weight is the geometric mean weight of the fish in grams (GMW=(Winitial x Wfinal)0.5). The 145
fatty acid requirement for growth was calculated as the fatty acid gained as a function of its 146
utilisation efficiency (Salini et al., 2015a). The total fatty acid demand is the sum of the 147
requirement for maintenance and growth. 148
2.5 Statistical analysis 149
All values are presented as mean ± standard error of the mean (SEM) unless otherwise stated. 150
Energy, lipid and fatty acid losses were examined relative to the geometric mean weight in 151
grams of the initial and final fish from each treatment size class. All relationships were 152
examined using a power function (y=aXb) or a logarithmic function (y=b ln(x)+a). Microsoft 153
Excel (Microsoft Office 2007) was used to generate the equations and figures. A 154
bootstrapping approach was used to generate replications of exponent values of energy, lipid 155
and fatty acid loss in order to analyse the data statistically. Fatty acid exponents were then 156
analysed by one-way ANOVA using the RStudio package v.0.98.501. Levels of significance 157
were compared using Tukey’s HSD test with significance defined as P<0.05. 158
159
3. Results 160
3.1 Fish compositional changes 161
The initial and final weights of the fish are presented in Table 1. In all size groups of fish 162
weight loss was between 12.9 % for the smallest fish to 5.3 % for the largest fish. The 163
condition factor was also lower in the fish after fasting. No fish died during the experiment. 164
The initial and final chemical composition of the fish were analysed and reported in Table 1. 165
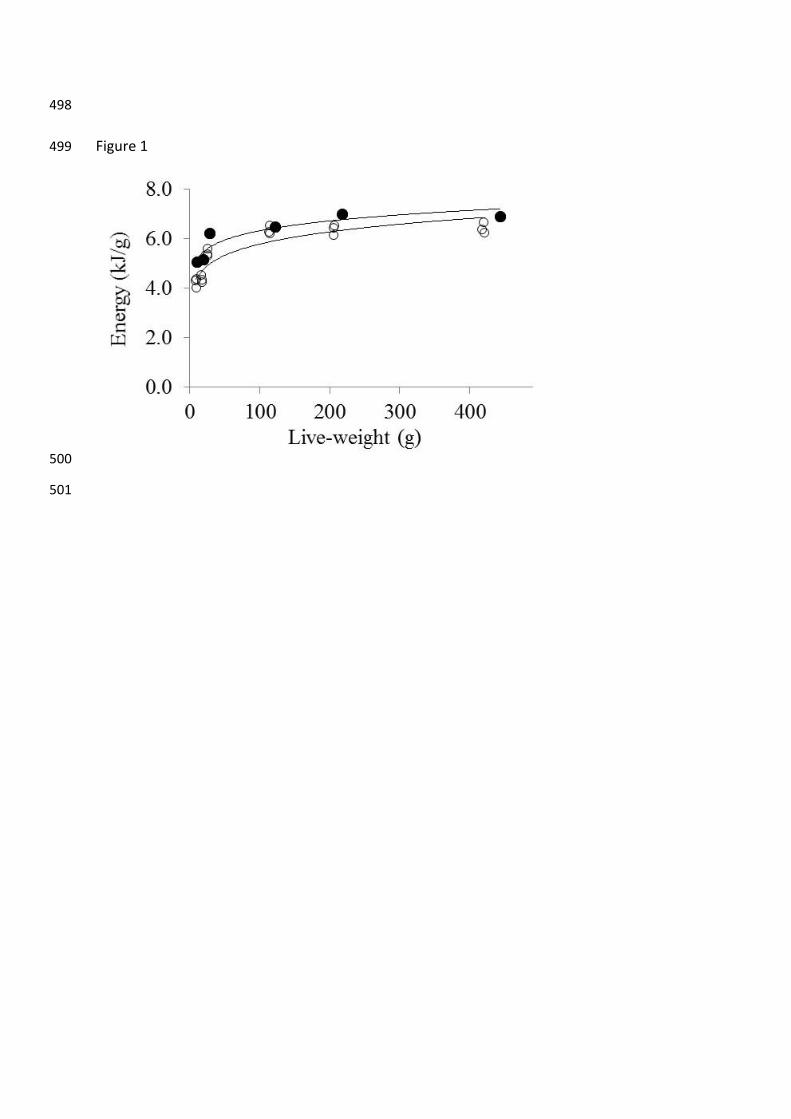
The energy density of the barramundi of varying size before and after fasting was best fitted 166
to a power function with high R2 values of 0.845 and 0.844 respectively (Fig. 1). There was a 167
decrease in the energy density of the fasted fish (Fig. 1). The lipid density of the barramundi 168
was best fitted to a logarithmic function with initial and final R2 values of 0.711 and 0.744 169
respectively (Fig. 2). The logarithmic response after fasting appears to be driven by 170
Treatment F. 171
The individual fatty acid density of barramundi for each of the treatment size classes is 172
presented in Table 2 and the LC-PUFA density is plotted in Fig. 3. There was a general 173
increase in the fatty acid density with increasing size, concomitant with the lipid composition 174
of the fish (Table 1). The response after fasting was best fitted to a logarithmic function that 175
appears to be driven by the lipid content of Treatment F. 176
3.2 Determination of metabolic live-weight exponents 177
Somatic losses of energy, lipid and individual fatty acids were well described by the function 178
a*Xb (Table 3). A bootstrapping approach was used to generate replications of coefficient 179
(slope) and exponent values of energy, lipid and fatty acid loss. An energy live-weight (LW) 180
exponent of 0.817 was derived based on energy losses after fasting and the equation is 181
presented in Eqn. 1. Similarly, a lipid loss LW exponent of 0.895 was derived based on lipid 182
loss after fasting and the equation is presented in Eqn. 2. The relationships between fatty acid 183
losses and the geometric mean weight over the range of sizes in the present study are 184
presented in Fig. 4 (A and B). 185
Energy loss (kJ/fish/day) = 0.104(±0.003)*(Live-weight) 0.817(±0.010), R2 = 0.949 (1) 186
Lipid loss (g/fish/day) = 0.002(±0.000)*(Live-weight) 0.895(±0.007), R2 = 0.985 (2) 187
188
There was a significant difference in the derived LW exponent values for specific fatty acids 189
confirming that they are for most, different from that of the total lipid (LW0.895). However, 190
there was no difference in the exponent values of 16:0 and 18:3n-3 (LNA) and 18:0 and 191
20:4n-6 (ARA) (Table 3). The LW exponent values for 22:6n-3 (DHA), 22:5n-3 (DPA) and 192
20:5n-3 (EPA), 0.792, 0.748 and 0.687 respectively, were all significantly lower than that of 193
lipid while 18:1n-9 was higher at 0.954 (Table 3). The weighted exponent values were 194
calculated and the sum of all fatty acids presented was equal to 0.854 ± 0.033 (Table 3; sum 195
not presented). 196
3.3 Metabolic demands for fatty acids 197
A re-evaluation of the marginal utilisation efficiencies of individual fatty acids using the fatty 198
acid LW exponents derived from the present experiment is presented in Table 4. This re-199
evaluation was performed on data from three prior experiments (Glencross and Rutherford, 200
2011; Salini et al., 2015a; Salini et al., 2016). The linear equations of the marginal intake to 201
marginal gain ratio were extrapolated to zero (0 = b(x) + a) in order to obtain estimated 202
maintenance requirement values. In the first experiment, the LC-PUFA all produced negative 203
requirement values whereas all other shorter-chain length and more saturated fatty acids have 204
a determined requirement. In the subsequent studies, the marginal utilisation efficiencies for 205
ARA, EPA and DHA were higher, contrasting those of the first study. There was no 206
requirement value established for EPA and DHA, however there was a maintenance 207
requirement of 0.012 g/kg0.880/d determined for ARA. 208
Iteratively determined fatty acid maintenance, fatty acid gain, fatty acid for growth and total 209
requirements are presented in Table 5. For each of the size classes the values are presented 210
for barramundi fed either 100% fish oil or 100% poultry oil diets adapted from Salini et al. 211
(2015a). 212
213
4. Discussion 214
One of the key assumptions of nutritional modelling is that the allometric scaling exponent 215
values for biological variables ascribed to transform live-weight (LW) are constant 216
(Glencross and Bermudes, 2011; Lupatsch et al., 2003). In reality, exponent values for the 217
metabolic LW for energy in aquatic species usually fit around an average value of 0.80, 218
which has been adopted and used routinely (Bureau et al., 2002; Cho and Kaushik, 1990; Cui 219
and Liu, 1990; Lupatsch et al., 2003; NRC, 2011). Similarly for protein, a range of LW 220
exponents have been used to describe the allometric relationship and the value of 0.70 is 221
routinely used under normal physiological conditions (Lupatsch et al., 1998; Pirozzi et al., 222
2010). Arguably the average of the weighted LW exponents for lipid and protein energy 223
should be equal to that of gross energy, therefore 0.90 can be ascribed to LW exponent of 224
lipid (Glencross and Bermudes, 2011). The development of predictive models of energy 225
transactions that also consider the individual compounds of nutrients rather than aggregates 226
of energy would help in understanding the discrete biochemical relationships that exist and 227
some attempts at compartmentalising these have been made in monogastric animals (Birkett 228
and Lange, 2007). However, these are not common in the literature or in practice for aquatic 229
species. The present study therefore investigated the allometric scaling effect of specific fatty 230
acids in barramundi held at a constant temperature. 231
In the present study, the assessment of somatic energy before and after fasting was highly 232
consistent with the study of Glencross and Bermudes (2011). This suggests that over the 233
variable size range of fish used in the present study and held at an optimal temperature, 234
fasting losses are quite predictable, further validating the methodology to be extended to 235
specific fatty acids. One caveat of the present study was that the size class selection of the 236
fish was limited to two initial shipments of fish that were held in stock aquaria and 237
subsequently graded. Therefore we cannot conclude on what may happen outside this range 238
or within the range if additional treatments were available. The increasing live-weight as a 239
function of energy and lipid density of the fish was best fitted to power and natural 240
logarithmic equations respectively. The lower than expected analytical values obtained for 241
lipid in Treatment F are likely related to the nutritional status of the fish prior to the 242
commencement of the study however there is no consistent explanation for this. Consistent 243
with other studies, the loss of lipid was concomitant to the loss of energy, confirming that 244
lipid is preferentially metabolised under fasting conditions in order to retain protein 245
(Glencross and Bermudes, 2011; Lupatsch et al., 1998). 246
The somatic losses determined in the present study were best described by power functions, 247
following the equation y=a*Xb, where a represents a temperature dependent coefficient, X is 248
the live-weight (LW) and b the scaling exponent. An important finding of the present study 249
was that the energy LW exponent value (0.817 ± 0.010) is consistent with the commonly 250
reported value of 0.80. This is an important finding as previous studies have found that even 251
slight variations in the reported exponent values can lead to substantially different outcomes 252
when applied to the determination of maintenance energy demands (Pirozzi, 2009). The lipid 253
exponent value of 0.895 ± 0.007 was also highly consistent with the values previously 254
described for barramundi (Glencross and Bermudes, 2011). One caveat of the present study 255
was that only a single temperature range was examined; however, it is reported that provided 256
barramundi are held within their normal temperature range then the values should be mostly 257
consistent (Glencross and Bermudes, 2011). 258
The fatty acid allometric scaling exponent values derived in the present study were 259
significantly different and ranged from 0.687 ± 0.005 for EPA to 0.954 ± 0.008 for 18:1n-9. 260
With the exception of ARA, all the LC-PUFA exponent values were significantly lower than 261
the more dominant shorter-chain length and more saturated fatty acids. The individual fatty 262
acids presented as weighted exponent values are also consistent with that of lipid as a 263
complete nutrient (0.854 ± 0.033 vs. 0.895 ± 0.007 respectively). The lower exponent values 264
recorded for the LC-PUFA suggest that there is likely to be a greater turnover of these fatty 265
acids in the juvenile fish indicating more specific biological demands. While the higher 266
exponents (eg. 18:1n-9) suggest there is less effect of size and lower biological demands for 267
those fatty acids. Additionally, the LC-PUFA with lower exponent values also have marginal 268
utilisation efficiencies that are considerably lower than other more dominant fatty acids 269
(Salini et al., 2015a). This lends further support to the theory that they are more biologically 270
important and that they are selectively retained in the tissues, corroborating evidence from 271
past studies in barramundi (Glencross and Rutherford, 2011; Salini et al., 2015c). Moreover, 272
the significance of LC-PUFA is also be supported by their anti-inflammatory role in the 273
production of eicosanoids and specialised proresolving mediators (Bannenberg and Serhan, 274
2010; Rowley et al., 1995; Serhan, 2010). 275
The energy from metabolizable food in juvenile animals can only really be partitioned into 276
maintenance and growth as reproductive effort is essentially zero (Lucas, 1996; NRC, 2011). 277
Moreover, the concept of maintenance and growth demands are additive in terms of 278
productivity (Bureau et al., 2002; Clarke and Fraser, 2004). A range of data pools were used 279
in the analysis of the present study in order to iteratively determine the metabolic demands 280
for specific fatty acids in growing barramundi. The partial (marginal) efficiency values from 281
Salini et al. (2015a) were re-calculated with the newer exponent values derived in the present 282
study. The LW exponent of lipid (0.90) was applied to specific fatty acids and acknowledged 283
as an assumption in that earlier study. This re-calculation allowed a more accurate 284
determination of maintenance fatty acid demands given the acknowledged impact that this 285
transformation can have on the determination of that parameter (Pirozzi, 2009). We also 286
assessed the suitability of marginal efficiency values for ARA, EPA and DHA determined 287
from subsequent studies (Glencross and Rutherford, 2011; Salini et al., 2016). However these 288
values were inconsistent with those of Salini et al. (2015a) and not included in the final 289
analysis (Table 5). Reasons for these inconsistencies are likely to be due to the large 290
differences in the initial size of the fish and the feeding regime utilised. 291
The results of the present study demonstrate that the different fatty acids are utilised with 292
different efficiencies. However, contrary to what might be expected, the levels of LC-PUFA 293
required in barramundi fed a fish oil based diet are numerically higher than those fed a 294
poultry oil based diet. This apparent difference is driven largely by the deposition demands of 295
individual fatty acids rather than catabolism or other processes. Based on the demands 296
(requirements) for maintenance presented in Table 5, we could conclude that the LC-PUFA 297
requirements are negligible (Birkett and Lange, 2007). This conclusion may be more 298
generally applied to larger growing barramundi however, evidence suggests that essential 299
fatty acid requirements are more pronounced during the rapid growth phase of juveniles, and 300
virtually negligible at larger fish sizes (Salini et al., 2015c). 301
The relative contribution of the more dominant shorter-chain length and more saturated fatty 302
acids for the provision of energy is clear. This corroborates with data recently obtained in 303
barramundi where the monounsaturated and to a lesser extent saturated fatty acids ‘spared’ 304
LC-PUFA for deposition and were preferentially utilised as energy sources (Salini et al., 305
2015b). This supports that the available lipids are partitioned into either those fatty acids 306
directed towards oxidative fates for generating energy or those directed towards other 307
downstream biological purpose such as eicosanoid production. 308
There are many potential assumptions in the application of energetic models (Glencross, 309
2008). The current allometric assessment only considers a single phenotypic parameter (live-310
weight). Not surprisingly, past reports have concluded that temperature plays a key role in the 311
metabolism of ectotherms, including fish (Clarke and Fraser, 2004; Clarke and Johnston, 312
1999; Glencross and Bermudes, 2011; Pirozzi et al., 2010). With barramundi, Glencross and 313
Bermudes (2011) demonstrated that the allometric scaling over a range of temperatures did 314
change; however, the response was not dramatic under normal thermal conditions for the 315
species. Therefore, we assume that the effect of temperature would be minimised by using a 316
constant ‘optimal’ temperature of 30°C. 317
Additionally, there are many studies investigating the metabolic rate in animals and these 318
relationships with size can usually be described similarly using non-linear power equations or 319
variants of these (Clarke and Johnston, 1999; White, 2011). The assumption in the present 320
study is that the standard metabolic rate does not change under fasting conditions as this 321
could further impact the somatic losses incurred. There is evidence to suggest that in fish and 322
crustaceans, the standard metabolic rate is reduced by up to 50% during fasting and this is 323
due partly to decreased protein synthesis (O'Connor et al., 2000; Simon et al., 2015). Without 324
an estimation of oxygen consumption or another measure of standard metabolic rate, we 325
cannot conclude on what might happen on a temporal basis under fasting conditions. 326
The present study demonstrated that allometric scaling exponents of specific fatty acids 327
varied after food deprivation for 21 days in barramundi. The underlying assumption so far 328
has been that the scaling exponent of lipid (0.90) could be applied at a nutrient level to any 329
situation involving fatty acids, including the calculation of maintenance demands. The results 330
of the present study indicate that there are differences allometric scaling values of the 331
individual fatty acids and in the utilisation efficiencies of individual fatty acids, corroborating 332
evidence from past studies. After re-evaluating data from three separate experiments we have 333
concluded that the biggest driver in our understanding of LC-PUFA metabolism in 334
barramundi is that of deposition demand. Empirically based models should now attempt to 335
consider the energetic costs associated with the lipid metabolic pathway, as this would be the 336
logical progression of the current work. 337
338
Acknowledgements. 339
The authors would like to acknowledge the assistance from CSIRO Agriculture staff 340
including Mr David Blyth, Ms Natalie Habilay, Mr Simon Irvin and Mr Isaak Kadel from the 341
Bribie Island Aquaculture Centre (BIRC), Queensland, Australia. The authors received no 342
specific grant however would also like to acknowledge CSIRO Agriculture for financial 343
assistance. 344
References 345
Ackman, R.G., 2002. The gas chromatograph in practical analysis of common and 346
uncommon fatty acids for the 21st century. Anal. Chim. Acta 465, 175-192. 347
AOAC, 2005. Official methods of analysis of the association of official analytical chemists, 348
Association of Official Analytical Chemists (AOAC). 15th edn ed. Association of Official 349
Analytical Chemists, Washington, DC, USA. 350
Bannenberg, G., Serhan, C.N., 2010. Specialized pro-resolving lipid mediators in the 351
inflammatory response: An update. BBA-Mol. Cell Biol. L. 1801, 1260-1273. 352
Bar, N.S., Sigholt, T., Shearer, K.D., Krogdahl, Å., 2007. A dynamic model of nutrient 353
pathways, growth, and body composition in fish. Can. J. Fish. Aquat. Sci. 64, 1669-1682. 354
Birkett, S., Lange, K.d., 2007. A computational framework for a nutrient flow representation 355
of energy utilization by growing monogastric animals. Br. J. Nutr. 86, 661. 356
Bureau, D.P., Hua, K., Cho, C.Y., 2006. Effect of feeding level on growth and nutrient 357
deposition in rainbow trout (Oncorhynchus mykiss Walbaum) growing from 150 to 600g. 358
Aquac. Res. 37, 1090-1098. 359
Bureau, D.P., Kaushik, S.J., Cho, C.Y., 2002. Bioenergetics, in: J.E. Halver, R.W. Hardy 360
(Eds.), Fish Nutrition. Academic Press, San Diego, California, 2-59. 361
Cho, C., Kaushik, S., 1990. Nutritional energetics in fish: energy and protein utilization in 362
rainbow trout (Salmo gairdneri). World Rev. Nutr. Diet. 61, 132-172. 363
Cho, C.Y., Bureau, D.P., 1998. Development of bioenergetic models and the Fish-PrFEQ 364
software to estimate production, feeding ration and waste output in aquaculture. Aquat. 365
Living Resour. 11, 199-210. 366
Christie, W.W., 2003. Lipid analysis, isolation, separation, identification and structural 367
analysis of lipids., 3rd edn ed. PJ Barnes and Associates, Bridgewater, UK. 368
Clarke, A., Fraser, K.P.P., 2004. Why does metabolism scale with temperature? Funct. Ecol. 369
18, 243-251. 370
Clarke, A., Johnston, N.M., 1999. Scaling of metabolic rate with body mass and temperature 371
in teleost fish. J. Anim. Ecol. 68, 893-905. 372
Cui, Y., Liu, J., 1990. Comparison of energy budget among six teleosts—II. Metabolic rates. 373
Comp. Biochem. Physiol. A Comp. Physiol. 97, 169-174. 374
Cunnane, S.C., Anderson, M.J., 1997. The majority of dietary linoleate in growing rats is β-375
oxidized or stored in visceral fat. J. Nutr. 127, 146-152. 376
Dumas, A., France, J., Bureau, D., 2010. Modelling growth and body composition in fish 377
nutrition: where have we been and where are we going? Aquac. Res. 41, 161-181. 378
Folch, J., Lees, M., Sloane-Stanley, G., 1957. A simple method for the isolation and 379
purification of total lipids from animal tissues. J. biol. Chem 226, 497-509. 380
Glencross, B.D., 2008. A factorial growth and feed utilization model for barramundi, Lates 381
calcarifer based on Australian production conditions. Aquac. Nutr. 14, 360-373. 382
Glencross, B.D., 2009. Exploring the nutritional demand for essential fatty acids by 383
aquaculture species. Rev. Aquacult. 1, 71-124. 384
Glencross, B.D., Bermudes, M., 2010. Effect of high water temperatures on the utilisation 385
efficiencies of energy and protein by juvenile barramundi, Lates calcarifer. Fish. Aquac. J 14, 386
1-11. 387
Glencross, B.D., Bermudes, M., 2011. The effect of high water temperatures on the 388
allometric scaling effects of energy and protein starvation losses in juvenile barramundi, 389
Lates calcarifer. Comp. Biochem. Physiol. Part A Mol. Integr. Physiol. 159, 167-174. 390
Glencross, B.D., Bermudes, M., 2012. Adapting bioenergetic factorial modelling to 391
understand the implications of heat stress on barramundi (Lates calcarifer) growth, feed 392
utilisation and optimal protein and energy requirements – potential strategies for dealing with 393
climate change? Aquac. Nutr. 18, 411-422. 394
Glencross, B.D., Rutherford, N., 2011. A determination of the quantitative requirements for 395
docosahexaenoic acid for juvenile barramundi (Lates calcarifer). Aquac. Nutr. 17, e536-396
e548. 397
Lucas, A., 1996. Bioenergetics of aquatic animals. Taylor & Francia Ltd., London, UK. 398
Lupatsch, I., Kissil, G.W., 1998. Predicting aquaculture waste from gilthead seabream 399
(Sparus aurata) culture using a nutritional approach. Aquat. Living Resour. 11, 265-268. 400
Lupatsch, I., Kissil, G.W., Sklan, D., 2003. Comparison of energy and protein efficiency 401
among three fish species gilthead sea bream (Sparus aurata), European sea bass 402
(Dicentrarchus labrax) and white grouper (Epinephelus aeneus): energy expenditure for 403
protein and lipid deposition. Aquaculture 225, 175-189. 404
Lupatsch, I., Kissil, G.W., Sklan, D., Pfeffer, E., 1998. Energy and protein requirements for 405
maintenance and growth in gilthead seabream (Sparus aurata L.). Aquac. Nutr. 4, 165-173. 406
Machiels, M.A.M., Henken, A.M., 1986. A dynamic simulation model for growth of the 407
African catfish, Clarias gariepinus (Burchell 1822): I. Effect of feeding level on growth and 408
energy metabolism. Aquaculture 56, 29-52. 409
NRC, 2011. Nutrient requirements of fish and shrimp. National Academy Press, Washington, 410
DC, USA. 411
O'Connor, K.I., Taylor, A.C., Metcalfe, N.B., 2000. The stability of standard metabolic rate 412
during a period of food deprivation in juvenile Atlantic salmon. J. Fish Biol. 57, 41-51. 413
Pirozzi, I., 2009. A factorial approach to defining the dietary protein and energy requirements 414
of mulloway, Argyrosomus japonicus: optimising feed formulations and feeding strategies. 415
James Cook University. 416
Pirozzi, I., Booth, M.A., Allan, G.L., 2010. Protein and energy utilization and the 417
requirements for maintenance in juvenile mulloway (Argyrosomus japonicus). Fish Physiol. 418
Biochem. 36, 109-121. 419
Rowley, A.F., Knight, J., Lloyd-Evans, P., Holland, J.W., Vickers, P.J., 1995. Eicosanoids 420
and their role in immune modulation in fish—a brief overview. Fish Shellfish Immunol. 5, 421
549-567. 422
Salini, M.J., Irvin, S.J., Bourne, N., Blyth, D., Cheers, S., Habilay, N., Glencross, B.D., 423
2015a. Marginal efficiencies of long chain-polyunsaturated fatty acid use by barramundi 424
(Lates calcarifer) when fed diets with varying blends of fish oil and poultry fat. Aquaculture 425
449, 48-57. 426
Salini, M.J., Turchini, G.M., Glencross, B.G., 2015b. Effect of dietary saturated and 427
monounsaturated fatty acids in juvenile barramundi Lates calcarifer. Aquac. Nutr. DOI 428
10.1111/anu.12389. 429
Salini, M.J., Turchini, G.M., Wade, N., Glencross, B.D., 2015c. Rapid effects of essential 430
fatty acid deficiency on growth and development parameters and transcription of key fatty 431
acid metabolism genes in juvenile barramundi Lates calcarifer. Br. J. Nutr. 114, 1784-1796. 432
Salini, M.J., Wade, N.M., Araújo, B.C., Turchini, G.M., Glencross, B.D., 2016. 433
Eicosapentaenoic acid, arachidonic acid and eicosanoid metabolism in juvenile barramundi 434
Lates calcarifer. Lipids DOI 10.1007/s11745-016-4167-4. 435
Sawyer, J.M., Arts, M.T., Arhonditsis, G., Diamond, M.L., 2016. A general model of 436
polyunsaturated fatty acid (PUFA) uptake, loss and transformation in freshwater fish. Ecol. 437
Model. 323, 96-105. 438
Serhan, C.N., 2010. Novel lipid mediators and resolution mechanisms in acute inflammation: 439
to resolve or not? Am. J. Pathol. 177, 1576-1591. 440
Simon, C.J., Fitzgibbon, Q.P., Battison, A., Carter, C.G., Battaglene, S.C., 2015. 441
Bioenergetics of nutrient reserves and metabolism in spiny lobster juveniles Sagmariasus 442
verreauxi: Predicting nutritional condition from hemolymph biochemistry. Physiol. Biochem. 443
Zool. 88, 266-283. 444
Tocher, D.R., 2015. Omega-3 long-chain polyunsaturated fatty acids and aquaculture in 445
perspective. Aquaculture 449, 94-107. 446
Turchini, G.M., Francis, D.S., De Silva, S.S., 2006. Fatty acid metabolism in the freshwater 447
fish Murray cod (Maccullochella peelii peelii) deduced by the whole-body fatty acid balance 448
method. Comp. Biochem. Physiol. B Comp. Biochem. 144, 110-118. 449
Turchini, G.M., Francis, D.S., De Silva, S.S., 2007. A whole body, in vivo, fatty acid balance 450
method to quantify PUFA metabolism (desaturation, elongation and beta-oxidation). Lipids 451
42, 1065-1071. 452
White, C.R., 2011. Allometric estimation of metabolic rates in animals. Comp. Biochem. 453
Physiol. A Comp. Physiol. 158, 346-357. 454
455
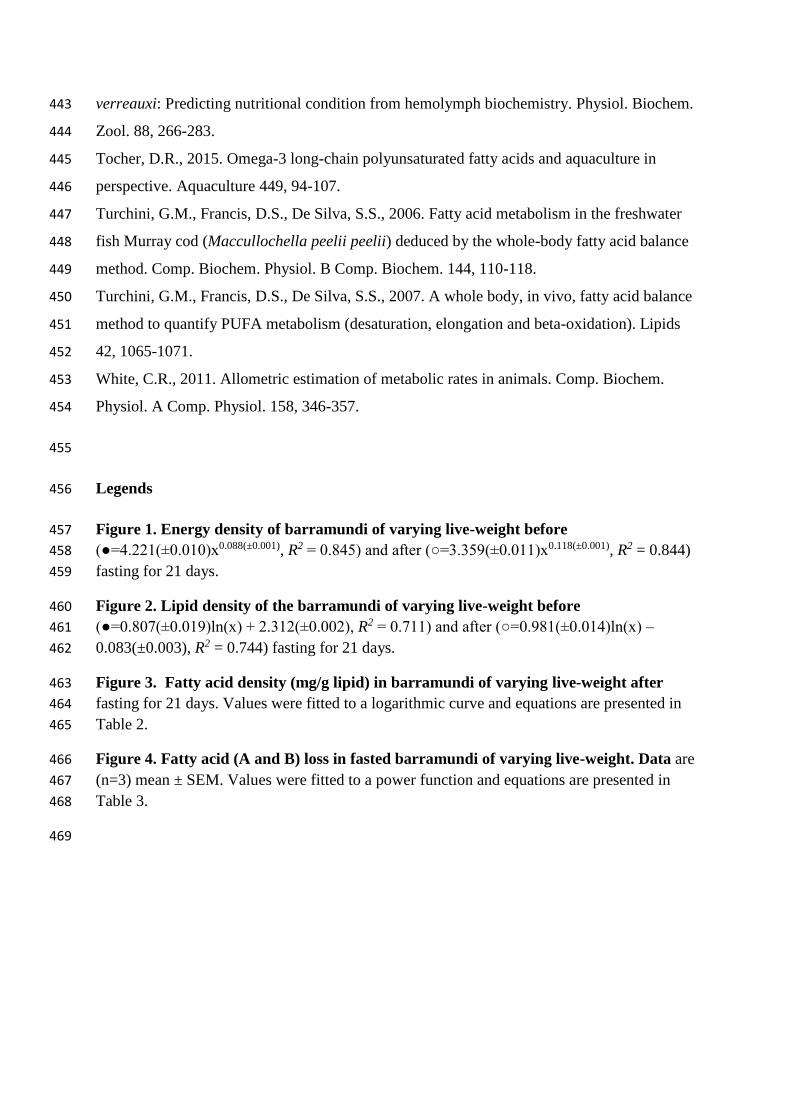
Legends 456
Figure 1. Energy density of barramundi of varying live-weight before 457
(●=4.221(±0.010)x0.088(±0.001), R2 = 0.845) and after (○=3.359(±0.011)x0.118(±0.001), R2 = 0.844) 458
fasting for 21 days. 459
Figure 2. Lipid density of the barramundi of varying live-weight before 460
(●=0.807(±0.019)ln(x) + 2.312(±0.002), R2 = 0.711) and after (○=0.981(±0.014)ln(x) – 461
0.083(±0.003), R2 = 0.744) fasting for 21 days. 462
Figure 3. Fatty acid density (mg/g lipid) in barramundi of varying live-weight after 463
fasting for 21 days. Values were fitted to a logarithmic curve and equations are presented in 464
Table 2. 465
Figure 4. Fatty acid (A and B) loss in fasted barramundi of varying live-weight. Data are 466
(n=3) mean ± SEM. Values were fitted to a power function and equations are presented in 467
Table 3. 468
469
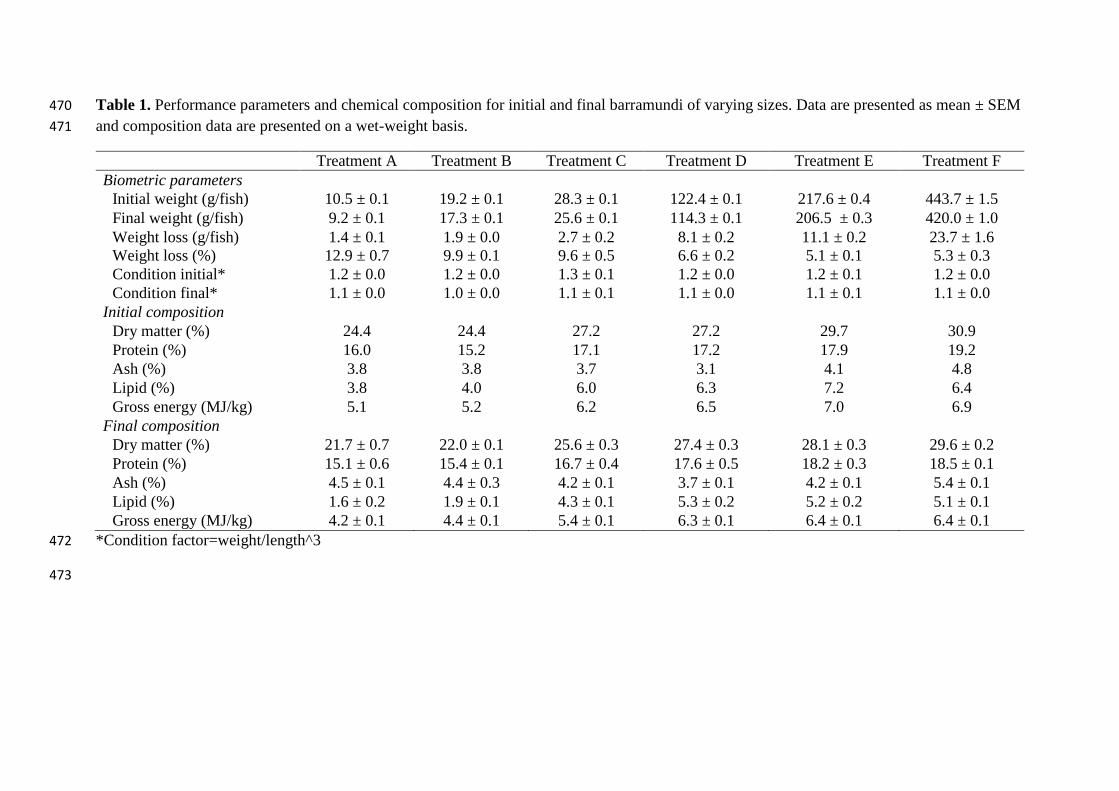
Table 1. Performance parameters and chemical composition for initial and final barramundi of varying sizes. Data are presented as mean ± SEM 470
and composition data are presented on a wet-weight basis. 471
Treatment A Treatment B Treatment C Treatment D Treatment E Treatment F
Biometric parameters
Initial weight (g/fish) 10.5 ± 0.1 19.2 ± 0.1 28.3 ± 0.1 122.4 ± 0.1 217.6 ± 0.4 443.7 ± 1.5
Final weight (g/fish) 9.2 ± 0.1 17.3 ± 0.1 25.6 ± 0.1 114.3 ± 0.1 206.5 ± 0.3 420.0 ± 1.0
Weight loss (g/fish) 1.4 ± 0.1 1.9 ± 0.0 2.7 ± 0.2 8.1 ± 0.2 11.1 ± 0.2 23.7 ± 1.6
Weight loss (%) 12.9 ± 0.7 9.9 ± 0.1 9.6 ± 0.5 6.6 ± 0.2 5.1 ± 0.1 5.3 ± 0.3
Condition initial* 1.2 ± 0.0 1.2 ± 0.0 1.3 ± 0.1 1.2 ± 0.0 1.2 ± 0.1 1.2 ± 0.0
Condition final* 1.1 ± 0.0 1.0 ± 0.0 1.1 ± 0.1 1.1 ± 0.0 1.1 ± 0.1 1.1 ± 0.0
Initial composition
Dry matter (%) 24.4 24.4 27.2 27.2 29.7 30.9
Protein (%) 16.0 15.2 17.1 17.2 17.9 19.2
Ash (%) 3.8 3.8 3.7 3.1 4.1 4.8
Lipid (%) 3.8 4.0 6.0 6.3 7.2 6.4
Gross energy (MJ/kg) 5.1 5.2 6.2 6.5 7.0 6.9
Final composition
Dry matter (%) 21.7 ± 0.7 22.0 ± 0.1 25.6 ± 0.3 27.4 ± 0.3 28.1 ± 0.3 29.6 ± 0.2
Protein (%) 15.1 ± 0.6 15.4 ± 0.1 16.7 ± 0.4 17.6 ± 0.5 18.2 ± 0.3 18.5 ± 0.1
Ash (%) 4.5 ± 0.1 4.4 ± 0.3 4.2 ± 0.1 3.7 ± 0.1 4.2 ± 0.1 5.4 ± 0.1
Lipid (%) 1.6 ± 0.2 1.9 ± 0.1 4.3 ± 0.1 5.3 ± 0.2 5.2 ± 0.2 5.1 ± 0.1
Gross energy (MJ/kg) 4.2 ± 0.1 4.4 ± 0.1 5.4 ± 0.1 6.3 ± 0.1 6.4 ± 0.1 6.4 ± 0.1
*Condition factor=weight/length^3 472
473
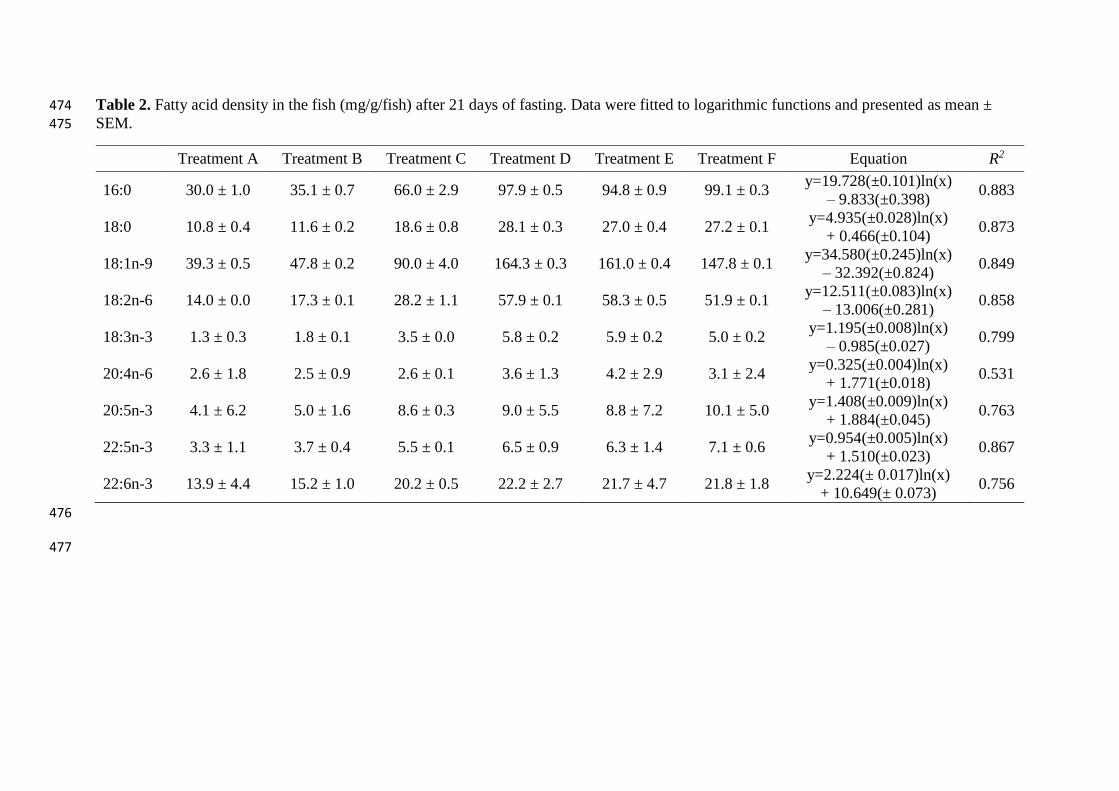
Table 2. Fatty acid density in the fish (mg/g/fish) after 21 days of fasting. Data were fitted to logarithmic functions and presented as mean ± 474
SEM. 475
Treatment A Treatment B Treatment C Treatment D Treatment E Treatment F Equation R2
16:0 30.0 ± 1.0 35.1 ± 0.7 66.0 ± 2.9 97.9 ± 0.5 94.8 ± 0.9 99.1 ± 0.3 y=19.728(±0.101)ln(x)
– 9.833(±0.398) 0.883
18:0 10.8 ± 0.4 11.6 ± 0.2 18.6 ± 0.8 28.1 ± 0.3 27.0 ± 0.4 27.2 ± 0.1 y=4.935(±0.028)ln(x)
+ 0.466(±0.104) 0.873
18:1n-9 39.3 ± 0.5 47.8 ± 0.2 90.0 ± 4.0 164.3 ± 0.3 161.0 ± 0.4 147.8 ± 0.1 y=34.580(±0.245)ln(x)
– 32.392(±0.824) 0.849
18:2n-6 14.0 ± 0.0 17.3 ± 0.1 28.2 ± 1.1 57.9 ± 0.1 58.3 ± 0.5 51.9 ± 0.1 y=12.511(±0.083)ln(x)
– 13.006(±0.281) 0.858
18:3n-3 1.3 ± 0.3 1.8 ± 0.1 3.5 ± 0.0 5.8 ± 0.2 5.9 ± 0.2 5.0 ± 0.2 y=1.195(±0.008)ln(x)
– 0.985(±0.027) 0.799
20:4n-6 2.6 ± 1.8 2.5 ± 0.9 2.6 ± 0.1 3.6 ± 1.3 4.2 ± 2.9 3.1 ± 2.4 y=0.325(±0.004)ln(x)
+ 1.771(±0.018) 0.531
20:5n-3 4.1 ± 6.2 5.0 ± 1.6 8.6 ± 0.3 9.0 ± 5.5 8.8 ± 7.2 10.1 ± 5.0 y=1.408(±0.009)ln(x)
+ 1.884(±0.045) 0.763
22:5n-3 3.3 ± 1.1 3.7 ± 0.4 5.5 ± 0.1 6.5 ± 0.9 6.3 ± 1.4 7.1 ± 0.6 y=0.954(±0.005)ln(x)
+ 1.510(±0.023) 0.867
22:6n-3 13.9 ± 4.4 15.2 ± 1.0 20.2 ± 0.5 22.2 ± 2.7 21.7 ± 4.7 21.8 ± 1.8 y=2.224(± 0.017)ln(x)
+ 10.649(± 0.073) 0.756
476
477
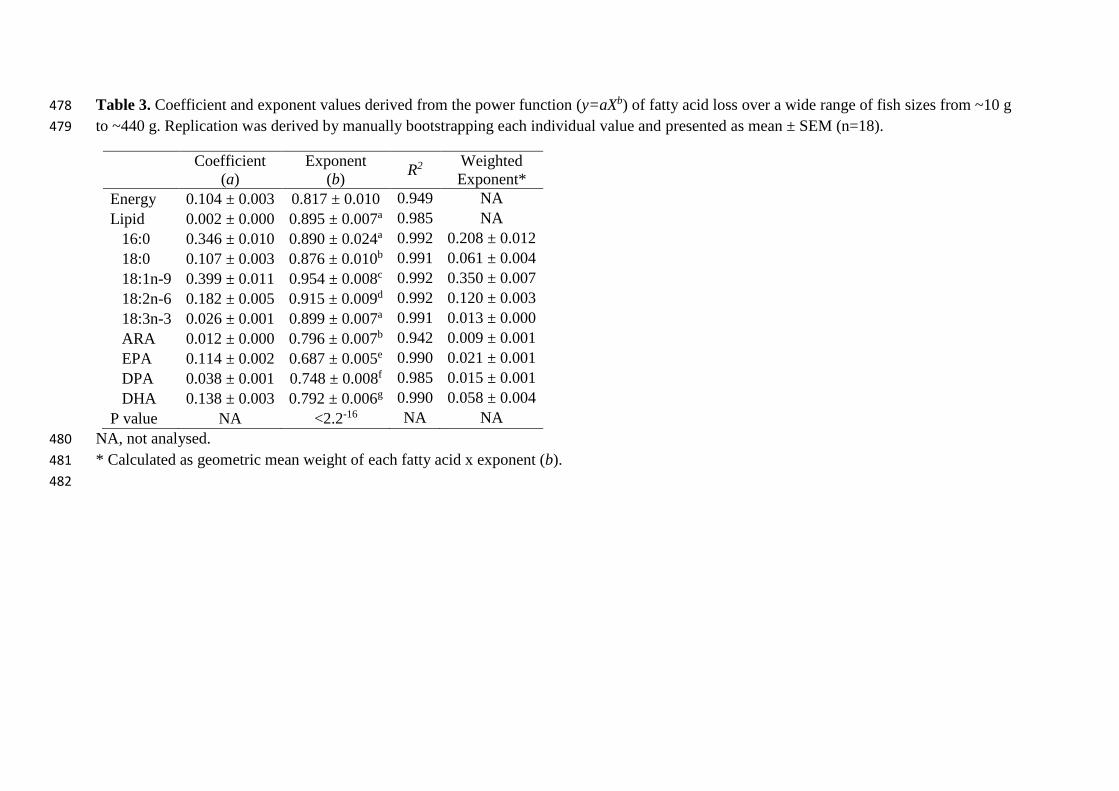
Table 3. Coefficient and exponent values derived from the power function (y=aXb) of fatty acid loss over a wide range of fish sizes from ~10 g 478
to ~440 g. Replication was derived by manually bootstrapping each individual value and presented as mean ± SEM (n=18). 479
Coefficient
(a)
Exponent
(b) R2
Weighted
Exponent*
Energy 0.104 ± 0.003 0.817 ± 0.010 0.949 NA
Lipid 0.002 ± 0.000 0.895 ± 0.007a 0.985 NA
16:0 0.346 ± 0.010 0.890 ± 0.024a 0.992 0.208 ± 0.012
18:0 0.107 ± 0.003 0.876 ± 0.010b 0.991 0.061 ± 0.004
18:1n-9 0.399 ± 0.011 0.954 ± 0.008c 0.992 0.350 ± 0.007
18:2n-6 0.182 ± 0.005 0.915 ± 0.009d 0.992 0.120 ± 0.003
18:3n-3 0.026 ± 0.001 0.899 ± 0.007a 0.991 0.013 ± 0.000
ARA 0.012 ± 0.000 0.796 ± 0.007b 0.942 0.009 ± 0.001
EPA 0.114 ± 0.002 0.687 ± 0.005e 0.990 0.021 ± 0.001
DPA 0.038 ± 0.001 0.748 ± 0.008f 0.985 0.015 ± 0.001
DHA 0.138 ± 0.003 0.792 ± 0.006g 0.990 0.058 ± 0.004
P value NA <2.2-16 NA NA
NA, not analysed. 480
* Calculated as geometric mean weight of each fatty acid x exponent (b). 481
482
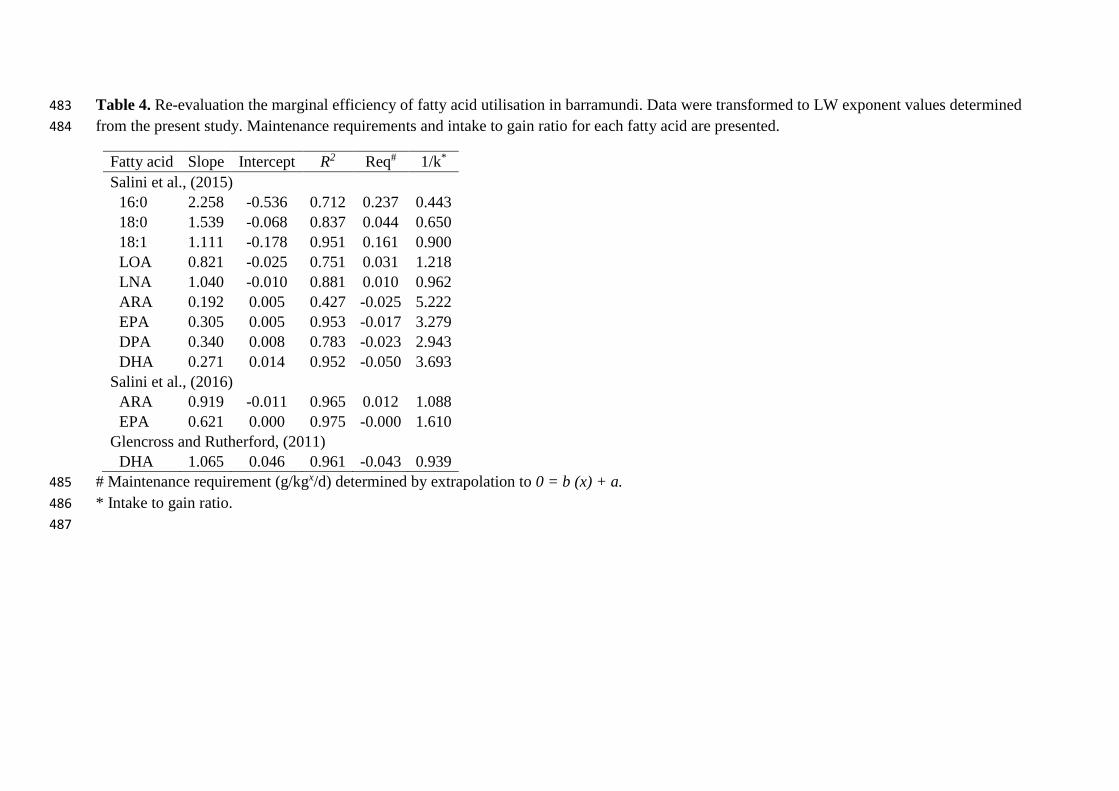
Table 4. Re-evaluation the marginal efficiency of fatty acid utilisation in barramundi. Data were transformed to LW exponent values determined 483
from the present study. Maintenance requirements and intake to gain ratio for each fatty acid are presented. 484
Fatty acid Slope Intercept R2 Req# 1/k*
Salini et al., (2015)
16:0 2.258 -0.536 0.712 0.237 0.443
18:0 1.539 -0.068 0.837 0.044 0.650
18:1 1.111 -0.178 0.951 0.161 0.900
LOA 0.821 -0.025 0.751 0.031 1.218
LNA 1.040 -0.010 0.881 0.010 0.962
ARA 0.192 0.005 0.427 -0.025 5.222
EPA 0.305 0.005 0.953 -0.017 3.279
DPA 0.340 0.008 0.783 -0.023 2.943
DHA 0.271 0.014 0.952 -0.050 3.693
Salini et al., (2016)
ARA 0.919 -0.011 0.965 0.012 1.088
EPA 0.621 0.000 0.975 -0.000 1.610
Glencross and Rutherford, (2011)
DHA 1.065 0.046 0.961 -0.043 0.939
# Maintenance requirement (g/kgx/d) determined by extrapolation to 0 = b (x) + a. 485
* Intake to gain ratio. 486
487
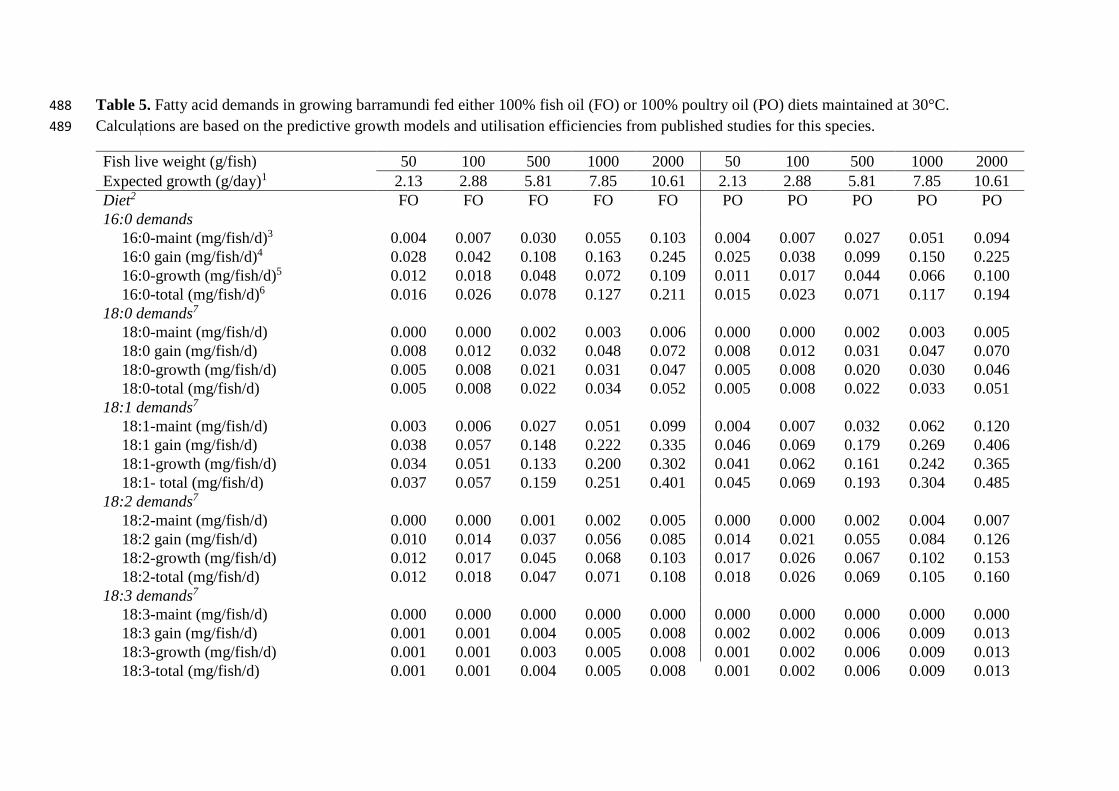
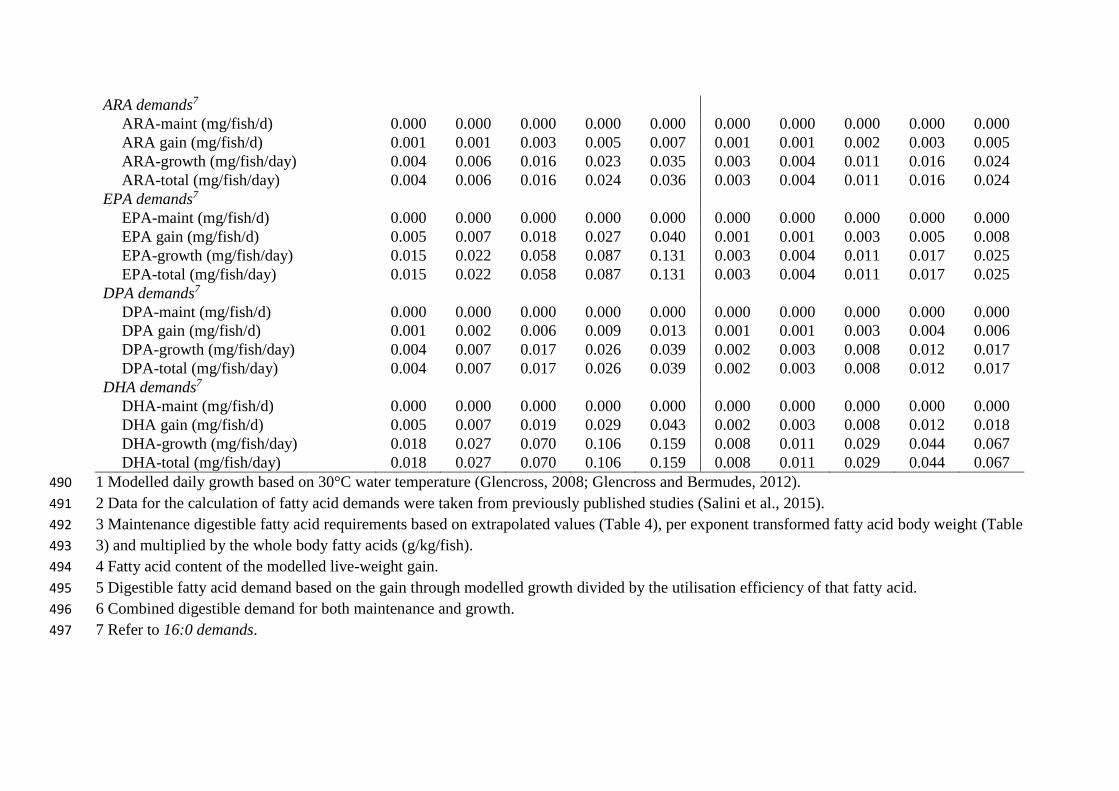
Table 5. Fatty acid demands in growing barramundi fed either 100% fish oil (FO) or 100% poultry oil (PO) diets maintained at 30°C. 488
Calculations are based on the predictive growth models and utilisation efficiencies from published studies for this species. 489
Fish live weight (g/fish) 50 100 500 1000 2000 50 100 500 1000 2000
Expected growth (g/day)1 2.13 2.88 5.81 7.85 10.61 2.13 2.88 5.81 7.85 10.61
Diet2 FO FO FO FO FO PO PO PO PO PO
16:0 demands
16:0-maint (mg/fish/d)3 0.004 0.007 0.030 0.055 0.103 0.004 0.007 0.027 0.051 0.094
16:0 gain (mg/fish/d)4 0.028 0.042 0.108 0.163 0.245 0.025 0.038 0.099 0.150 0.225
16:0-growth (mg/fish/d)5 0.012 0.018 0.048 0.072 0.109 0.011 0.017 0.044 0.066 0.100
16:0-total (mg/fish/d)6 0.016 0.026 0.078 0.127 0.211 0.015 0.023 0.071 0.117 0.194
18:0 demands7
18:0-maint (mg/fish/d) 0.000 0.000 0.002 0.003 0.006 0.000 0.000 0.002 0.003 0.005
18:0 gain (mg/fish/d) 0.008 0.012 0.032 0.048 0.072 0.008 0.012 0.031 0.047 0.070
18:0-growth (mg/fish/d) 0.005 0.008 0.021 0.031 0.047 0.005 0.008 0.020 0.030 0.046
18:0-total (mg/fish/d) 0.005 0.008 0.022 0.034 0.052 0.005 0.008 0.022 0.033 0.051
18:1 demands7
18:1-maint (mg/fish/d) 0.003 0.006 0.027 0.051 0.099 0.004 0.007 0.032 0.062 0.120
18:1 gain (mg/fish/d) 0.038 0.057 0.148 0.222 0.335 0.046 0.069 0.179 0.269 0.406
18:1-growth (mg/fish/d) 0.034 0.051 0.133 0.200 0.302 0.041 0.062 0.161 0.242 0.365
18:1- total (mg/fish/d) 0.037 0.057 0.159 0.251 0.401 0.045 0.069 0.193 0.304 0.485
18:2 demands7
18:2-maint (mg/fish/d) 0.000 0.000 0.001 0.002 0.005 0.000 0.000 0.002 0.004 0.007
18:2 gain (mg/fish/d) 0.010 0.014 0.037 0.056 0.085 0.014 0.021 0.055 0.084 0.126
18:2-growth (mg/fish/d) 0.012 0.017 0.045 0.068 0.103 0.017 0.026 0.067 0.102 0.153
18:2-total (mg/fish/d) 0.012 0.018 0.047 0.071 0.108 0.018 0.026 0.069 0.105 0.160
18:3 demands7
18:3-maint (mg/fish/d) 0.000 0.000 0.000 0.000 0.000 0.000 0.000 0.000 0.000 0.000
18:3 gain (mg/fish/d) 0.001 0.001 0.004 0.005 0.008 0.002 0.002 0.006 0.009 0.013
18:3-growth (mg/fish/d) 0.001 0.001 0.003 0.005 0.008 0.001 0.002 0.006 0.009 0.013
18:3-total (mg/fish/d) 0.001 0.001 0.004 0.005 0.008 0.001 0.002 0.006 0.009 0.013
ARA demands7
ARA-maint (mg/fish/d) 0.000 0.000 0.000 0.000 0.000 0.000 0.000 0.000 0.000 0.000
ARA gain (mg/fish/d) 0.001 0.001 0.003 0.005 0.007 0.001 0.001 0.002 0.003 0.005
ARA-growth (mg/fish/day) 0.004 0.006 0.016 0.023 0.035 0.003 0.004 0.011 0.016 0.024
ARA-total (mg/fish/day) 0.004 0.006 0.016 0.024 0.036 0.003 0.004 0.011 0.016 0.024
EPA demands7
EPA-maint (mg/fish/d) 0.000 0.000 0.000 0.000 0.000 0.000 0.000 0.000 0.000 0.000
EPA gain (mg/fish/d) 0.005 0.007 0.018 0.027 0.040 0.001 0.001 0.003 0.005 0.008
EPA-growth (mg/fish/day) 0.015 0.022 0.058 0.087 0.131 0.003 0.004 0.011 0.017 0.025
EPA-total (mg/fish/day) 0.015 0.022 0.058 0.087 0.131 0.003 0.004 0.011 0.017 0.025
DPA demands7
DPA-maint (mg/fish/d) 0.000 0.000 0.000 0.000 0.000 0.000 0.000 0.000 0.000 0.000
DPA gain (mg/fish/d) 0.001 0.002 0.006 0.009 0.013 0.001 0.001 0.003 0.004 0.006
DPA-growth (mg/fish/day) 0.004 0.007 0.017 0.026 0.039 0.002 0.003 0.008 0.012 0.017
DPA-total (mg/fish/day) 0.004 0.007 0.017 0.026 0.039 0.002 0.003 0.008 0.012 0.017
DHA demands7
DHA-maint (mg/fish/d) 0.000 0.000 0.000 0.000 0.000 0.000 0.000 0.000 0.000 0.000
DHA gain (mg/fish/d) 0.005 0.007 0.019 0.029 0.043 0.002 0.003 0.008 0.012 0.018
DHA-growth (mg/fish/day) 0.018 0.027 0.070 0.106 0.159 0.008 0.011 0.029 0.044 0.067
DHA-total (mg/fish/day) 0.018 0.027 0.070 0.106 0.159 0.008 0.011 0.029 0.044 0.067
1 Modelled daily growth based on 30°C water temperature (Glencross, 2008; Glencross and Bermudes, 2012). 490
2 Data for the calculation of fatty acid demands were taken from previously published studies (Salini et al., 2015). 491
3 Maintenance digestible fatty acid requirements based on extrapolated values (Table 4), per exponent transformed fatty acid body weight (Table 492
3) and multiplied by the whole body fatty acids (g/kg/fish). 493
4 Fatty acid content of the modelled live-weight gain. 494
5 Digestible fatty acid demand based on the gain through modelled growth divided by the utilisation efficiency of that fatty acid. 495
6 Combined digestible demand for both maintenance and growth. 496
7 Refer to 16:0 demands. 497
498
Figure 1 499
500
501
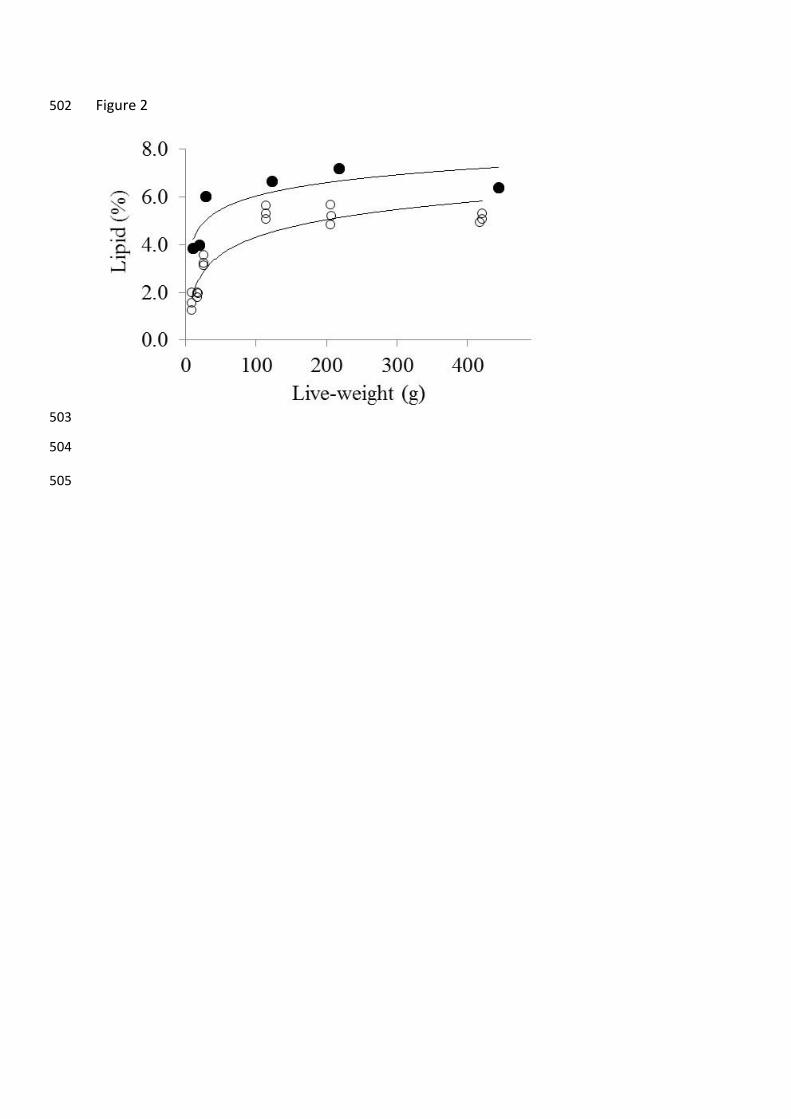
Figure 2 502
503
504
505
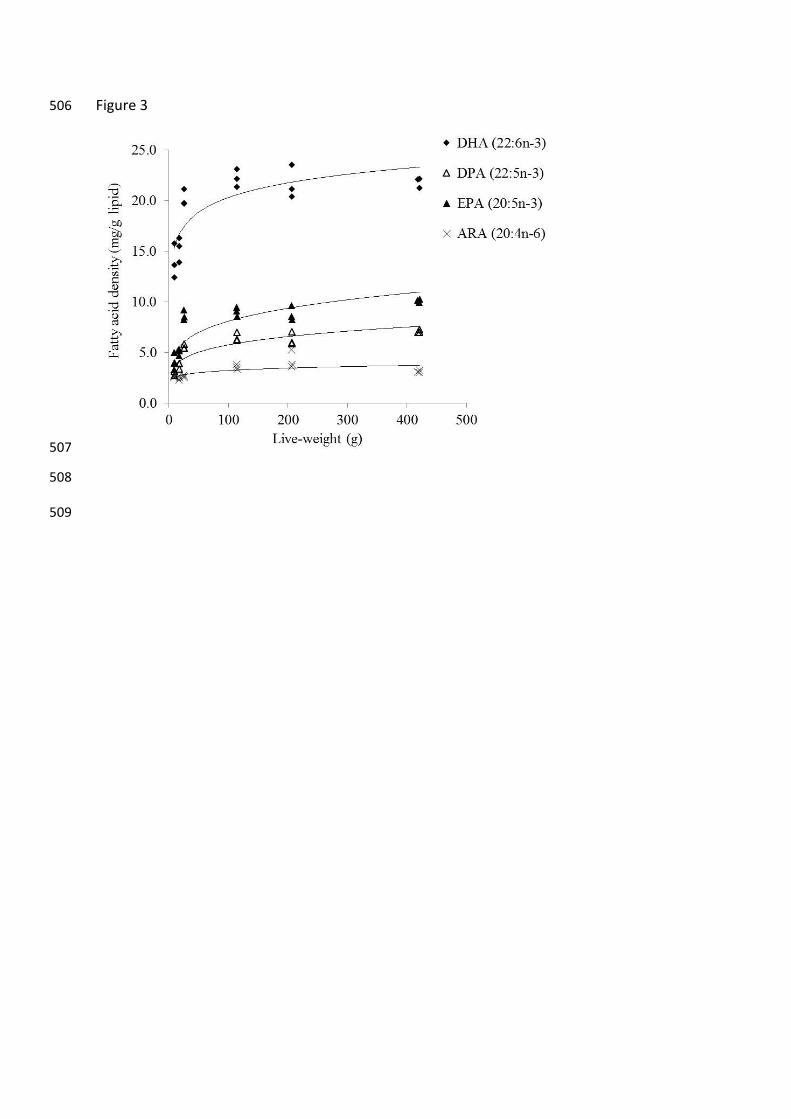
Figure 3 506
507
508
509
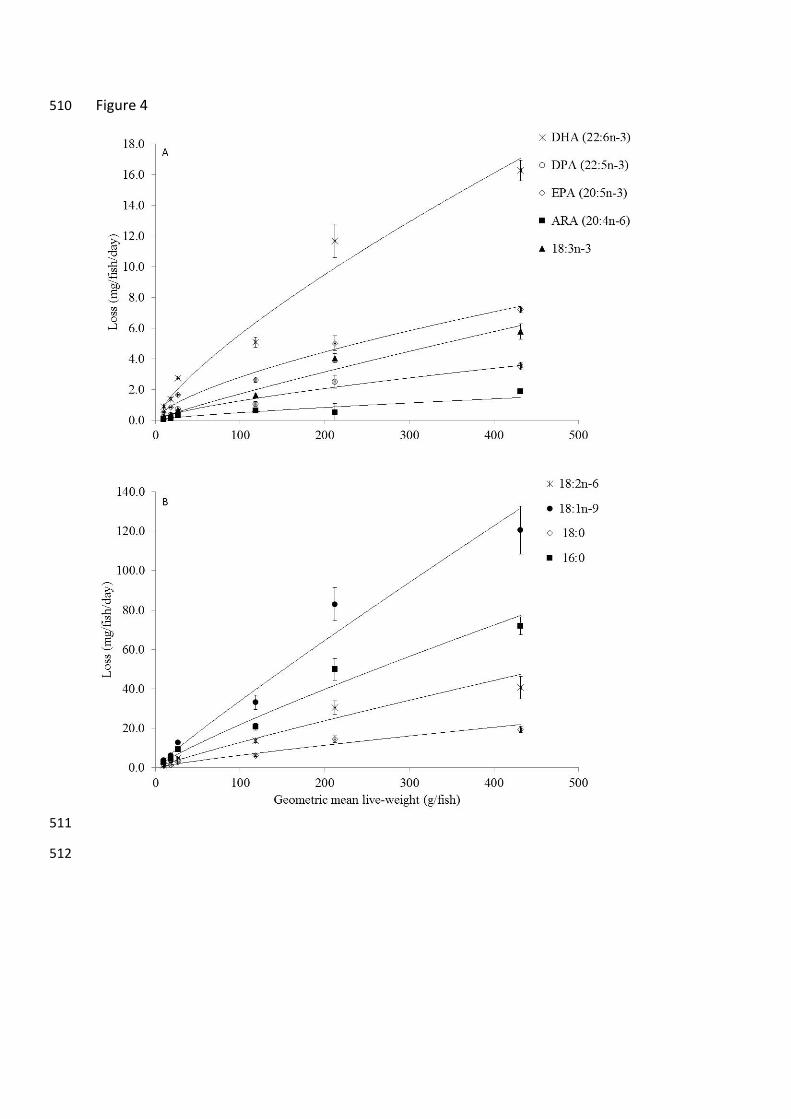
Figure 4 510
511
512
Related Documents