The Rockefeller University Press $30.00 J. Cell Biol. Vol. 191 No. 3 471–478 www.jcb.org/cgi/doi/10.1083/jcb.201003135 JCB 471 JCB: Report Correspondence to Ronald D. Vale: [email protected] Abbreviations used in this paper: ACC, acetyl CoA carboxylase; dsRNA, double-stranded RNA; FFT, fast Fourier transform; SREBP, sterol regulatory element–binding protein. Introduction Cells can adopt a wide range of morphologies, from round lymphocytes to highly branched Purkinjee neurons. Major chal- lenges of modern cell biology are to identify the proteins that are involved in cell shape determination and understand how these proteins are regulated by external and internal signals. Many of the best-studied proteins involved in cell shape deter- mination are components or direct regulators of the actin cyto- skeleton (Faix and Rottner, 2006), although many other proteins appear to play roles as well (Randazzo et al., 2007). Not surpris- ingly, different sets of proteins contribute to the determination of morphology in different cell types (Liu et al., 2009). RNAi screens provide powerful approaches for identify- ing proteins involved in cell biological activities. However, only a limited number of screens have been performed on cell shape. Initial screens by Kiger et al. (2003) and Rogers et al. (2003) examined the effect of knocking down a limited set of genes (994 and 96 genes, respectively) on cell shape in Drosophila melanogaster tissue culture cells. At that time, the acquisition of image data was performed manually on the microscope, and the image data were analyzed by laborious visual inspection. Since that time, technological advances in robotic microscopy have allowed fully automated image acquisition, making it pos- sible to obtain images from a whole genome RNAi screen in only a few weeks. As a result, the image analysis has become the rate-limiting step, and in most cases, the amount of image data for a whole genome screen exceeds what can be reasonably and reliably analyzed through visual inspection. Complex visual data, such as cell shape, are also best compared quantitatively rather than by qualitative assessment. Thus, developing new approaches for automated quantitative image analysis has now become a greater challenge than collecting the primary image data. An important step in automated, computational analysis was taken by Bakal et al. (2007), who used computational meth- ods and neural networks to classify phenotypes in a screen with 249 genes predicted to play a role in cell morphology. More recently, Sepp et al. (2008) performed an automated whole ge- nome screen of Drosophila primary neuron cells for genes that regulate neurite outgrowth using algorithms designed to analyze R ecent technological advances in microscopy have enabled cell-based whole genome screens, but the analysis of the vast amount of image data generated by such screens usually proves to be rate limiting. In this study, we performed a whole genome RNA interference (RNAi) screen to uncover genes that affect spreading of Drosophila melanogaster S2 cells using several com- putational methods for analyzing the image data in an automated manner. Expected genes in the Scar-Arp2/3 actin nucleation pathway were identified as well as casein kinase I, which had a similar morphological RNAi signature. A distinct nonspreading morphological pheno- type was identified for genes involved in membrane secre- tion or synthesis. In this group, we identified a new secretory peptide and investigated the functions of two poorly char- acterized endoplasmic reticulum proteins that have roles in secretion. Thus, this genome-wide screen succeeded in identifying known and unexpected proteins that are important for cell spreading, and the computational tools developed in this study should prove useful for other types of automated whole genome screens. A whole genome RNAi screen of Drosophila S2 cell spreading performed using automated computational image analysis Michael V. D’Ambrosio 1,2 and Ronald D. Vale 1,2 1 The Howard Hughes Medical Institute and 2 Department of Cellular and Molecular Pharmacology, University of California, San Francisco, San Francisco, CA 94158 © 2010 D’Ambrosio and Vale This article is distributed under the terms of an Attribution– Noncommercial–Share Alike–No Mirror Sites license for the first six months after the pub- lication date (see http://www.rupress.org/terms). After six months it is available under a Creative Commons License (Attribution–Noncommercial–Share Alike 3.0 Unported license, as described at http://creativecommons.org/licenses/by-nc-sa/3.0/). THE JOURNAL OF CELL BIOLOGY on April 14, 2018 jcb.rupress.org Downloaded from http://doi.org/10.1083/jcb.201003135 Published Online: 1 November, 2010 | Supp Info:

Welcome message from author
This document is posted to help you gain knowledge. Please leave a comment to let me know what you think about it! Share it to your friends and learn new things together.
Transcript
The Rockefeller University Press $30.00J. Cell Biol. Vol. 191 No. 3 471–478www.jcb.org/cgi/doi/10.1083/jcb.201003135 JCB 471
JCB: Report
Correspondence to Ronald D. Vale: [email protected] used in this paper: ACC, acetyl CoA carboxylase; dsRNA, double-stranded RNA; FFT, fast Fourier transform; SREBP, sterol regulatory element–binding protein.
IntroductionCells can adopt a wide range of morphologies, from round lymphocytes to highly branched Purkinjee neurons. Major chal-lenges of modern cell biology are to identify the proteins that are involved in cell shape determination and understand how these proteins are regulated by external and internal signals. Many of the best-studied proteins involved in cell shape deter-mination are components or direct regulators of the actin cyto-skeleton (Faix and Rottner, 2006), although many other proteins appear to play roles as well (Randazzo et al., 2007). Not surpris-ingly, different sets of proteins contribute to the determination of morphology in different cell types (Liu et al., 2009).
RNAi screens provide powerful approaches for identify-ing proteins involved in cell biological activities. However, only a limited number of screens have been performed on cell shape. Initial screens by Kiger et al. (2003) and Rogers et al. (2003) examined the effect of knocking down a limited set of genes (994 and 96 genes, respectively) on cell shape in Drosophila melanogaster tissue culture cells. At that time, the acquisition of image data was performed manually on the microscope, and
the image data were analyzed by laborious visual inspection. Since that time, technological advances in robotic microscopy have allowed fully automated image acquisition, making it pos-sible to obtain images from a whole genome RNAi screen in only a few weeks. As a result, the image analysis has become the rate-limiting step, and in most cases, the amount of image data for a whole genome screen exceeds what can be reasonably and reliably analyzed through visual inspection. Complex visual data, such as cell shape, are also best compared quantitatively rather than by qualitative assessment. Thus, developing new approaches for automated quantitative image analysis has now become a greater challenge than collecting the primary image data. An important step in automated, computational analysis was taken by Bakal et al. (2007), who used computational meth-ods and neural networks to classify phenotypes in a screen with 249 genes predicted to play a role in cell morphology. More recently, Sepp et al. (2008) performed an automated whole ge-nome screen of Drosophila primary neuron cells for genes that regulate neurite outgrowth using algorithms designed to analyze
Recent technological advances in microscopy have enabled cell-based whole genome screens, but the analysis of the vast amount of image data generated
by such screens usually proves to be rate limiting. In this study, we performed a whole genome RNA interference (RNAi) screen to uncover genes that affect spreading of Drosophila melanogaster S2 cells using several com-putational methods for analyzing the image data in an automated manner. Expected genes in the Scar-Arp2/3 actin nucleation pathway were identified as well as casein kinase I, which had a similar morphological RNAi
signature. A distinct nonspreading morphological pheno-type was identified for genes involved in membrane secre-tion or synthesis. In this group, we identified a new secretory peptide and investigated the functions of two poorly char-acterized endoplasmic reticulum proteins that have roles in secretion. Thus, this genome-wide screen succeeded in identifying known and unexpected proteins that are important for cell spreading, and the computational tools developed in this study should prove useful for other types of automated whole genome screens.
A whole genome RNAi screen of Drosophila S2 cell spreading performed using automated computational image analysis
Michael V. D’Ambrosio1,2 and Ronald D. Vale1,2
1The Howard Hughes Medical Institute and 2Department of Cellular and Molecular Pharmacology, University of California, San Francisco, San Francisco, CA 94158
© 2010 D’Ambrosio and Vale This article is distributed under the terms of an Attribution–Noncommercial–Share Alike–No Mirror Sites license for the first six months after the pub-lication date (see http://www.rupress.org/terms). After six months it is available under a Creative Commons License (Attribution–Noncommercial–Share Alike 3.0 Unported license, as described at http://creativecommons.org/licenses/by-nc-sa/3.0/).
TH
EJ
OU
RN
AL
OF
CE
LL
BIO
LO
GY
on April 14, 2018jcb.rupress.org Downloaded from http://doi.org/10.1083/jcb.201003135Published Online: 1 November, 2010 | Supp Info:
JCB • VOLUME 191 • NUMBER 3 • 2010 472
separate the normal and phenotype of interest cells in the train-ing set and is applied across the genome.
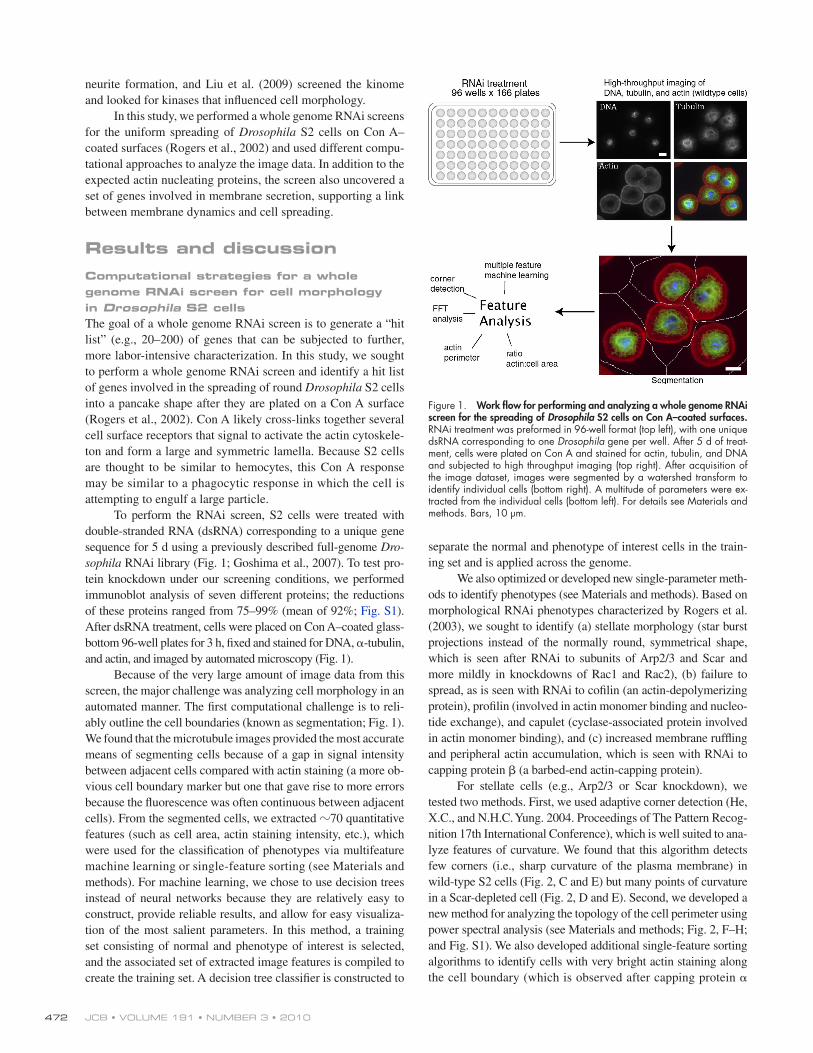
We also optimized or developed new single-parameter meth-ods to identify phenotypes (see Materials and methods). Based on morphological RNAi phenotypes characterized by Rogers et al. (2003), we sought to identify (a) stellate morphology (star burst projections instead of the normally round, symmetrical shape, which is seen after RNAi to subunits of Arp2/3 and Scar and more mildly in knockdowns of Rac1 and Rac2), (b) failure to spread, as is seen with RNAi to cofilin (an actin-depolymerizing protein), profilin (involved in actin monomer binding and nucleo-tide exchange), and capulet (cyclase-associated protein involved in actin monomer binding), and (c) increased membrane ruffling and peripheral actin accumulation, which is seen with RNAi to capping protein (a barbed-end actin-capping protein).
For stellate cells (e.g., Arp2/3 or Scar knockdown), we tested two methods. First, we used adaptive corner detection (He, X.C., and N.H.C. Yung. 2004. Proceedings of The Pattern Recog-nition 17th International Conference), which is well suited to ana-lyze features of curvature. We found that this algorithm detects few corners (i.e., sharp curvature of the plasma membrane) in wild-type S2 cells (Fig. 2, C and E) but many points of curvature in a Scar-depleted cell (Fig. 2, D and E). Second, we developed a new method for analyzing the topology of the cell perimeter using power spectral analysis (see Materials and methods; Fig. 2, F–H; and Fig. S1). We also developed additional single-feature sorting algorithms to identify cells with very bright actin staining along the cell boundary (which is observed after capping protein
neurite formation, and Liu et al. (2009) screened the kinome and looked for kinases that influenced cell morphology.
In this study, we performed a whole genome RNAi screens for the uniform spreading of Drosophila S2 cells on Con A–coated surfaces (Rogers et al., 2002) and used different compu-tational approaches to analyze the image data. In addition to the expected actin nucleating proteins, the screen also uncovered a set of genes involved in membrane secretion, supporting a link between membrane dynamics and cell spreading.
Results and discussionComputational strategies for a whole genome RNAi screen for cell morphology in Drosophila S2 cellsThe goal of a whole genome RNAi screen is to generate a “hit list” (e.g., 20–200) of genes that can be subjected to further, more labor-intensive characterization. In this study, we sought to perform a whole genome RNAi screen and identify a hit list of genes involved in the spreading of round Drosophila S2 cells into a pancake shape after they are plated on a Con A surface (Rogers et al., 2002). Con A likely cross-links together several cell surface receptors that signal to activate the actin cytoskele-ton and form a large and symmetric lamella. Because S2 cells are thought to be similar to hemocytes, this Con A response may be similar to a phagocytic response in which the cell is attempting to engulf a large particle.
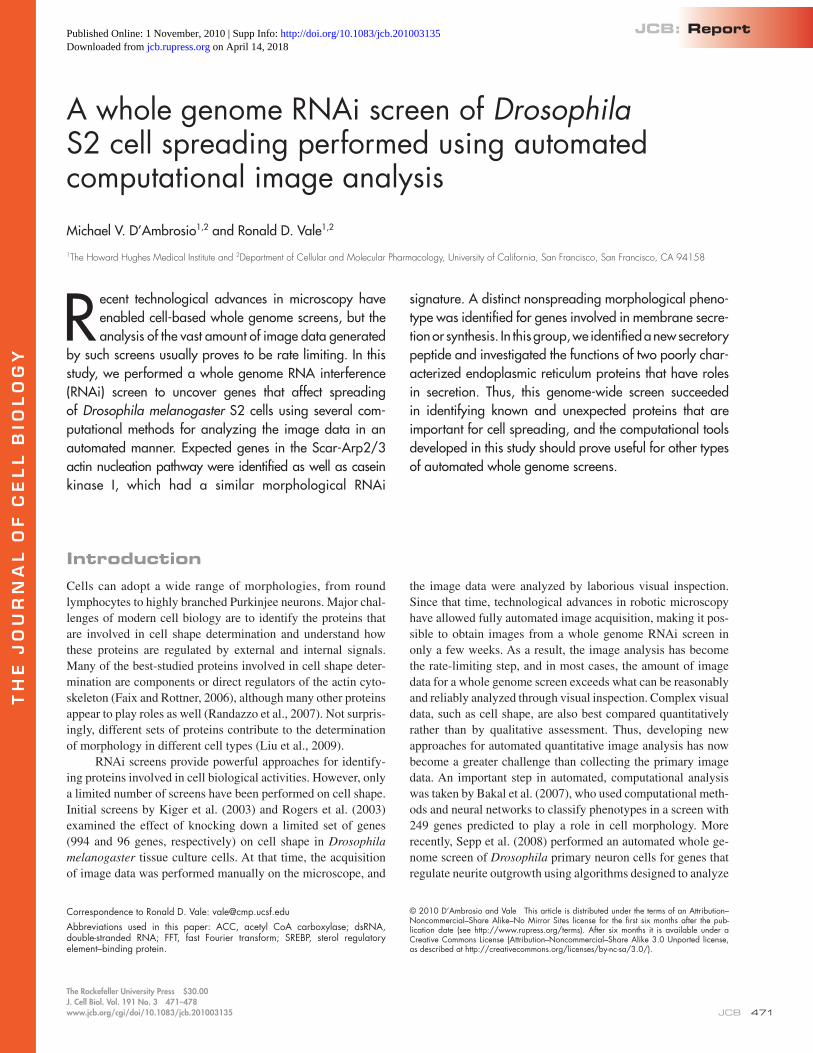
To perform the RNAi screen, S2 cells were treated with double-stranded RNA (dsRNA) corresponding to a unique gene sequence for 5 d using a previously described full-genome Dro-sophila RNAi library (Fig. 1; Goshima et al., 2007). To test pro-tein knockdown under our screening conditions, we performed immunoblot analysis of seven different proteins; the reductions of these proteins ranged from 75–99% (mean of 92%; Fig. S1). After dsRNA treatment, cells were placed on Con A–coated glass- bottom 96-well plates for 3 h, fixed and stained for DNA, -tubulin, and actin, and imaged by automated microscopy (Fig. 1).
Because of the very large amount of image data from this screen, the major challenge was analyzing cell morphology in an automated manner. The first computational challenge is to reli-ably outline the cell boundaries (known as segmentation; Fig. 1). We found that the microtubule images provided the most accurate means of segmenting cells because of a gap in signal intensity between adjacent cells compared with actin staining (a more ob-vious cell boundary marker but one that gave rise to more errors because the fluorescence was often continuous between adjacent cells). From the segmented cells, we extracted 70 quantitative features (such as cell area, actin staining intensity, etc.), which were used for the classification of phenotypes via multifeature machine learning or single-feature sorting (see Materials and methods). For machine learning, we chose to use decision trees instead of neural networks because they are relatively easy to construct, provide reliable results, and allow for easy visualiza-tion of the most salient parameters. In this method, a training set consisting of normal and phenotype of interest is selected, and the associated set of extracted image features is compiled to create the training set. A decision tree classifier is constructed to
Figure 1. Work flow for performing and analyzing a whole genome RNAi screen for the spreading of Drosophila S2 cells on Con A–coated surfaces. RNAi treatment was preformed in 96-well format (top left), with one unique dsRNA corresponding to one Drosophila gene per well. After 5 d of treat-ment, cells were plated on Con A and stained for actin, tubulin, and DNA and subjected to high throughput imaging (top right). After acquisition of the image dataset, images were segmented by a watershed transform to identify individual cells (bottom right). A multitude of parameters were ex-tracted from the individual cells (bottom left). For details see Materials and methods. Bars, 10 µm.
473A genomic RNAi screen of cell shape • D’Ambrosio and Vale
of the fact that Con A activates many redundant signaling path-ways that feed into Rac GTPase. However, the screen did identify casein kinase 1 as producing a phenotype similar to Scar and Arp2/3, as is subsequently described in more detail.
Casein kinase 1
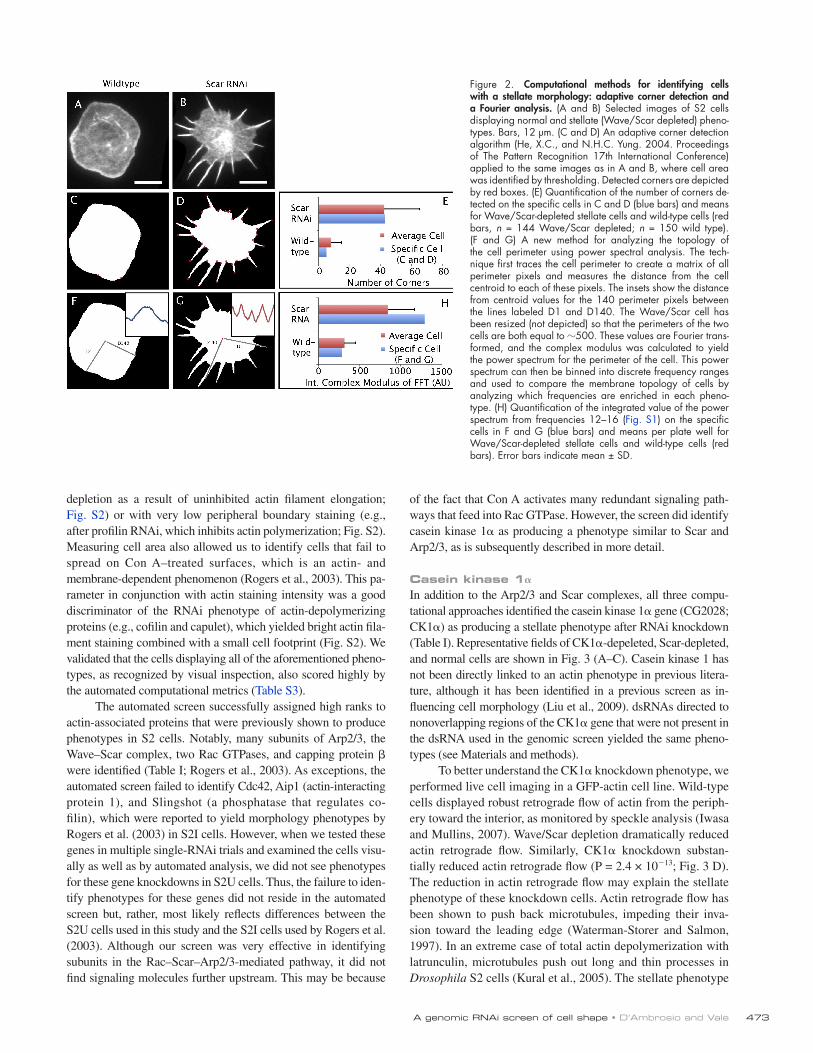
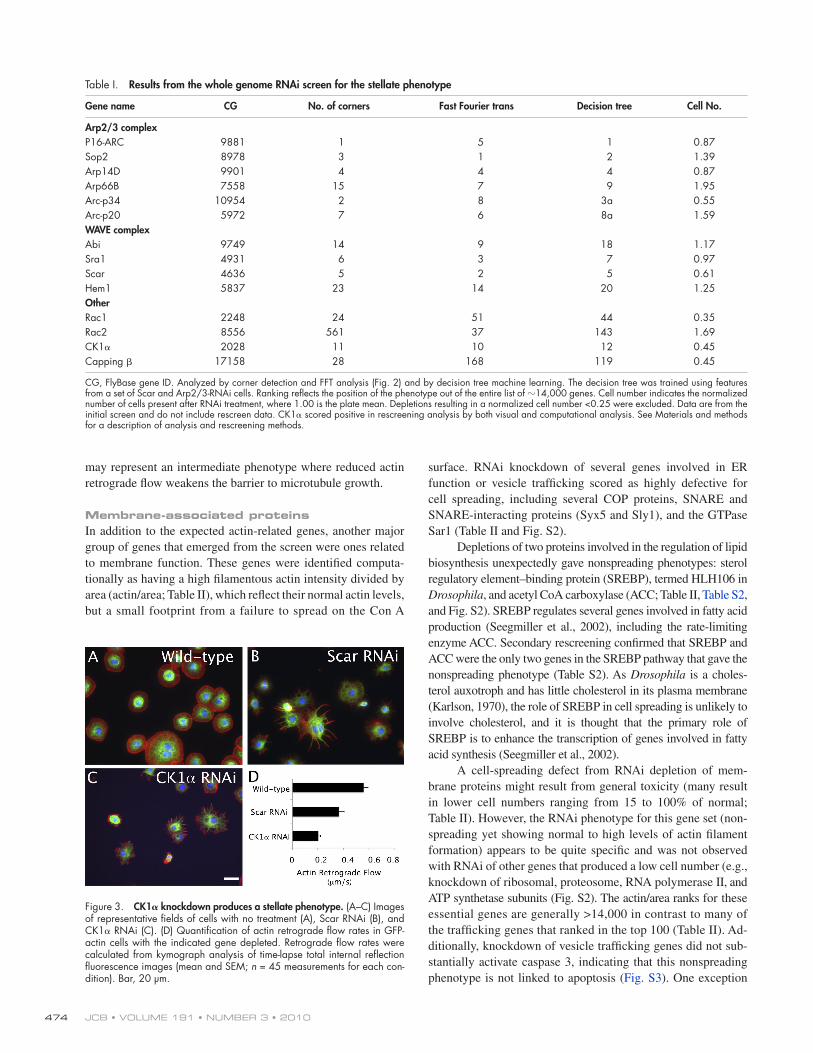
In addition to the Arp2/3 and Scar complexes, all three compu-tational approaches identified the casein kinase 1 gene (CG2028; CK1) as producing a stellate phenotype after RNAi knockdown (Table I). Representative fields of CK1-depeleted, Scar-depleted, and normal cells are shown in Fig. 3 (A–C). Casein kinase 1 has not been directly linked to an actin phenotype in previous litera-ture, although it has been identified in a previous screen as in-fluencing cell morphology (Liu et al., 2009). dsRNAs directed to nonoverlapping regions of the CK1 gene that were not present in the dsRNA used in the genomic screen yielded the same pheno-types (see Materials and methods).
To better understand the CK1 knockdown phenotype, we performed live cell imaging in a GFP-actin cell line. Wild-type cells displayed robust retrograde flow of actin from the periph-ery toward the interior, as monitored by speckle analysis (Iwasa and Mullins, 2007). Wave/Scar depletion dramatically reduced actin retrograde flow. Similarly, CK1 knockdown substan-tially reduced actin retrograde flow (P = 2.4 × 10¹³; Fig. 3 D). The reduction in actin retrograde flow may explain the stellate phenotype of these knockdown cells. Actin retrograde flow has been shown to push back microtubules, impeding their inva-sion toward the leading edge (Waterman-Storer and Salmon, 1997). In an extreme case of total actin depolymerization with latrunculin, microtubules push out long and thin processes in Drosophila S2 cells (Kural et al., 2005). The stellate phenotype
depletion as a result of uninhibited actin filament elongation; Fig. S2) or with very low peripheral boundary staining (e.g., after profilin RNAi, which inhibits actin polymerization; Fig. S2). Measuring cell area also allowed us to identify cells that fail to spread on Con A–treated surfaces, which is an actin- and membrane-dependent phenomenon (Rogers et al., 2003). This pa-rameter in conjunction with actin staining intensity was a good discriminator of the RNAi phenotype of actin-depolymerizing proteins (e.g., cofilin and capulet), which yielded bright actin fila-ment staining combined with a small cell footprint (Fig. S2). We validated that the cells displaying all of the aforementioned pheno-types, as recognized by visual inspection, also scored highly by the automated computational metrics (Table S3).
The automated screen successfully assigned high ranks to actin-associated proteins that were previously shown to produce phenotypes in S2 cells. Notably, many subunits of Arp2/3, the Wave–Scar complex, two Rac GTPases, and capping protein were identified (Table I; Rogers et al., 2003). As exceptions, the automated screen failed to identify Cdc42, Aip1 (actin-interacting protein 1), and Slingshot (a phosphatase that regulates co-filin), which were reported to yield morphology phenotypes by Rogers et al. (2003) in S2I cells. However, when we tested these genes in multiple single-RNAi trials and examined the cells visu-ally as well as by automated analysis, we did not see phenotypes for these gene knockdowns in S2U cells. Thus, the failure to iden-tify phenotypes for these genes did not reside in the automated screen but, rather, most likely reflects differences between the S2U cells used in this study and the S2I cells used by Rogers et al. (2003). Although our screen was very effective in identifying subunits in the Rac–Scar–Arp2/3-mediated pathway, it did not find signaling molecules further upstream. This may be because
Figure 2. Computational methods for identifying cells with a stellate morphology: adaptive corner detection and a Fourier analysis. (A and B) Selected images of S2 cells displaying normal and stellate (Wave/Scar depleted) pheno-types. Bars, 12 µm. (C and D) An adaptive corner detection algorithm (He, X.C., and N.H.C. Yung. 2004. Proceedings of The Pattern Recognition 17th International Conference) applied to the same images as in A and B, where cell area was identified by thresholding. Detected corners are depicted by red boxes. (E) Quantification of the number of corners de-tected on the specific cells in C and D (blue bars) and means for Wave/Scar-depleted stellate cells and wild-type cells (red bars, n = 144 Wave/Scar depleted; n = 150 wild type). (F and G) A new method for analyzing the topology of the cell perimeter using power spectral analysis. The tech-nique first traces the cell perimeter to create a matrix of all perimeter pixels and measures the distance from the cell centroid to each of these pixels. The insets show the distance from centroid values for the 140 perimeter pixels between the lines labeled D1 and D140. The Wave/Scar cell has been resized (not depicted) so that the perimeters of the two cells are both equal to 500. These values are Fourier trans-formed, and the complex modulus was calculated to yield the power spectrum for the perimeter of the cell. This power spectrum can then be binned into discrete frequency ranges and used to compare the membrane topology of cells by analyzing which frequencies are enriched in each pheno-type. (H) Quantification of the integrated value of the power spectrum from frequencies 12–16 (Fig. S1) on the specific cells in F and G (blue bars) and means per plate well for Wave/Scar-depleted stellate cells and wild-type cells (red bars). Error bars indicate mean ± SD.
JCB • VOLUME 191 • NUMBER 3 • 2010 474
surface. RNAi knockdown of several genes involved in ER function or vesicle trafficking scored as highly defective for cell spreading, including several COP proteins, SNARE and SNARE-interacting proteins (Syx5 and Sly1), and the GTPase Sar1 (Table II and Fig. S2).
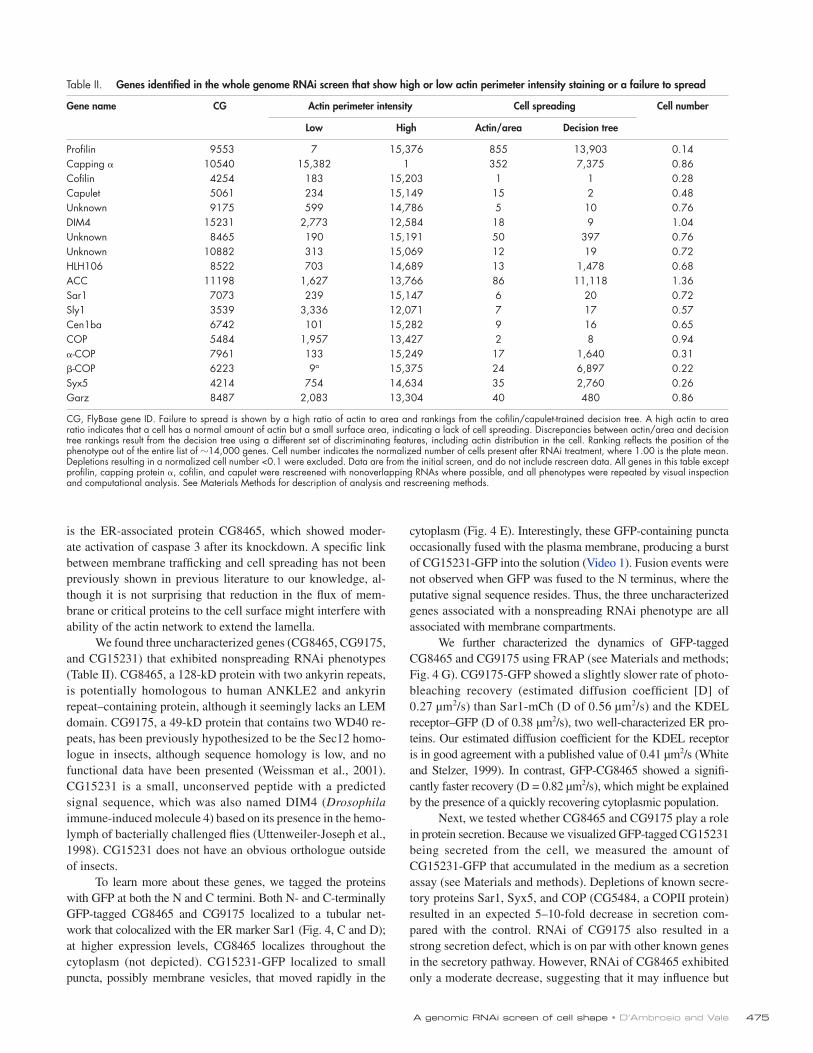
Depletions of two proteins involved in the regulation of lipid biosynthesis unexpectedly gave nonspreading phenotypes: sterol regulatory element–binding protein (SREBP), termed HLH106 in Drosophila, and acetyl CoA carboxylase (ACC; Table II, Table S2, and Fig. S2). SREBP regulates several genes involved in fatty acid production (Seegmiller et al., 2002), including the rate-limiting enzyme ACC. Secondary rescreening confirmed that SREBP and ACC were the only two genes in the SREBP pathway that gave the nonspreading phenotype (Table S2). As Drosophila is a choles-terol auxotroph and has little cholesterol in its plasma membrane (Karlson, 1970), the role of SREBP in cell spreading is unlikely to involve cholesterol, and it is thought that the primary role of SREBP is to enhance the transcription of genes involved in fatty acid synthesis (Seegmiller et al., 2002).
A cell-spreading defect from RNAi depletion of mem-brane proteins might result from general toxicity (many result in lower cell numbers ranging from 15 to 100% of normal; Table II). However, the RNAi phenotype for this gene set (non-spreading yet showing normal to high levels of actin filament formation) appears to be quite specific and was not observed with RNAi of other genes that produced a low cell number (e.g., knockdown of ribosomal, proteosome, RNA polymerase II, and ATP synthetase subunits (Fig. S2). The actin/area ranks for these essential genes are generally >14,000 in contrast to many of the trafficking genes that ranked in the top 100 (Table II). Ad-ditionally, knockdown of vesicle trafficking genes did not sub-stantially activate caspase 3, indicating that this nonspreading phenotype is not linked to apoptosis (Fig. S3). One exception
may represent an intermediate phenotype where reduced actin retrograde flow weakens the barrier to microtubule growth.
Membrane-associated proteinsIn addition to the expected actin-related genes, another major group of genes that emerged from the screen were ones related to membrane function. These genes were identified computa-tionally as having a high filamentous actin intensity divided by area (actin/area; Table II), which reflect their normal actin levels, but a small footprint from a failure to spread on the Con A
Table I. Results from the whole genome RNAi screen for the stellate phenotype
Gene name CG No. of corners Fast Fourier trans Decision tree Cell No.
Arp2/3 complexP16-ARC 9881 1 5 1 0.87Sop2 8978 3 1 2 1.39Arp14D 9901 4 4 4 0.87Arp66B 7558 15 7 9 1.95Arc-p34 10954 2 8 3a 0.55Arc-p20 5972 7 6 8a 1.59WAVE complexAbi 9749 14 9 18 1.17Sra1 4931 6 3 7 0.97Scar 4636 5 2 5 0.61Hem1 5837 23 14 20 1.25OtherRac1 2248 24 51 44 0.35Rac2 8556 561 37 143 1.69CK1 2028 11 10 12 0.45Capping 17158 28 168 119 0.45
CG, FlyBase gene ID. Analyzed by corner detection and FFT analysis (Fig. 2) and by decision tree machine learning. The decision tree was trained using features from a set of Scar and Arp2/3-RNAi cells. Ranking reflects the position of the phenotype out of the entire list of 14,000 genes. Cell number indicates the normalized number of cells present after RNAi treatment, where 1.00 is the plate mean. Depletions resulting in a normalized cell number <0.25 were excluded. Data are from the initial screen and do not include rescreen data. CK1 scored positive in rescreening analysis by both visual and computational analysis. See Materials and methods for a description of analysis and rescreening methods.
Figure 3. CK1 knockdown produces a stellate phenotype. (A–C) Images of representative fields of cells with no treatment (A), Scar RNAi (B), and CK1 RNAi (C). (D) Quantification of actin retrograde flow rates in GFP-actin cells with the indicated gene depleted. Retrograde flow rates were calculated from kymograph analysis of time-lapse total internal reflection fluorescence images (mean and SEM; n = 45 measurements for each con-dition). Bar, 20 µm.
475A genomic RNAi screen of cell shape • D’Ambrosio and Vale
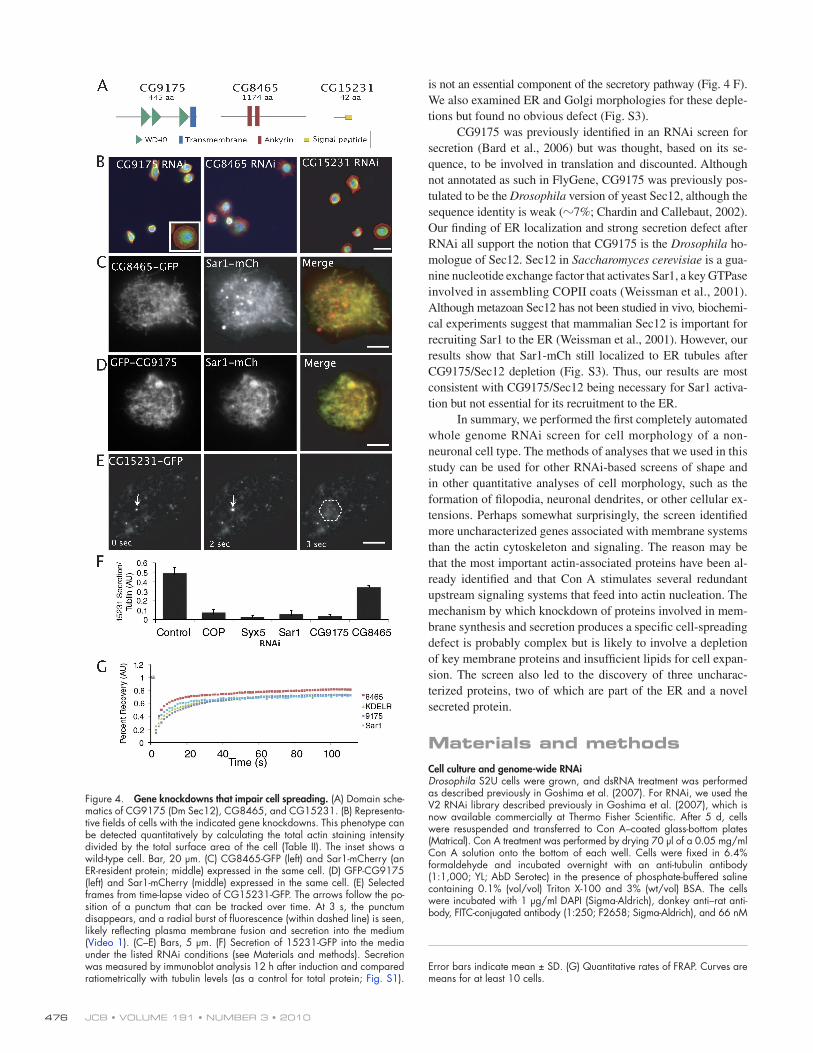
cytoplasm (Fig. 4 E). Interestingly, these GFP-containing puncta occasionally fused with the plasma membrane, producing a burst of CG15231-GFP into the solution (Video 1). Fusion events were not observed when GFP was fused to the N terminus, where the putative signal sequence resides. Thus, the three uncharacterized genes associated with a nonspreading RNAi phenotype are all associated with membrane compartments.
We further characterized the dynamics of GFP-tagged CG8465 and CG9175 using FRAP (see Materials and methods; Fig. 4 G). CG9175-GFP showed a slightly slower rate of photo-bleaching recovery (estimated diffusion coefficient [D] of 0.27 µm2/s) than Sar1-mCh (D of 0.56 µm2/s) and the KDEL receptor–GFP (D of 0.38 µm2/s), two well-characterized ER pro-teins. Our estimated diffusion coefficient for the KDEL receptor is in good agreement with a published value of 0.41 µm2/s (White and Stelzer, 1999). In contrast, GFP-CG8465 showed a signifi-cantly faster recovery (D = 0.82 µm2/s), which might be explained by the presence of a quickly recovering cytoplasmic population.
Next, we tested whether CG8465 and CG9175 play a role in protein secretion. Because we visualized GFP-tagged CG15231 being secreted from the cell, we measured the amount of CG15231-GFP that accumulated in the medium as a secretion assay (see Materials and methods). Depletions of known secre-tory proteins Sar1, Syx5, and COP (CG5484, a COPII protein) resulted in an expected 5–10-fold decrease in secretion com-pared with the control. RNAi of CG9175 also resulted in a strong secretion defect, which is on par with other known genes in the secretory pathway. However, RNAi of CG8465 exhibited only a moderate decrease, suggesting that it may influence but
is the ER-associated protein CG8465, which showed moder-ate activation of caspase 3 after its knockdown. A specific link between membrane trafficking and cell spreading has not been previously shown in previous literature to our knowledge, al-though it is not surprising that reduction in the flux of mem-brane or critical proteins to the cell surface might interfere with ability of the actin network to extend the lamella.
We found three uncharacterized genes (CG8465, CG9175, and CG15231) that exhibited nonspreading RNAi phenotypes (Table II). CG8465, a 128-kD protein with two ankyrin repeats, is potentially homologous to human ANKLE2 and ankyrin repeat–containing protein, although it seemingly lacks an LEM domain. CG9175, a 49-kD protein that contains two WD40 re-peats, has been previously hypothesized to be the Sec12 homo-logue in insects, although sequence homology is low, and no functional data have been presented (Weissman et al., 2001). CG15231 is a small, unconserved peptide with a predicted signal sequence, which was also named DIM4 (Drosophila immune-induced molecule 4) based on its presence in the hemo-lymph of bacterially challenged flies (Uttenweiler-Joseph et al., 1998). CG15231 does not have an obvious orthologue outside of insects.
To learn more about these genes, we tagged the proteins with GFP at both the N and C termini. Both N- and C-terminally GFP-tagged CG8465 and CG9175 localized to a tubular net-work that colocalized with the ER marker Sar1 (Fig. 4, C and D); at higher expression levels, CG8465 localizes throughout the cytoplasm (not depicted). CG15231-GFP localized to small puncta, possibly membrane vesicles, that moved rapidly in the
Table II. Genes identified in the whole genome RNAi screen that show high or low actin perimeter intensity staining or a failure to spread
Gene name CG Actin perimeter intensity Cell spreading Cell number
Low High Actin/area Decision tree
Profilin 9553 7 15,376 855 13,903 0.14Capping 10540 15,382 1 352 7,375 0.86Cofilin 4254 183 15,203 1 1 0.28Capulet 5061 234 15,149 15 2 0.48Unknown 9175 599 14,786 5 10 0.76DIM4 15231 2,773 12,584 18 9 1.04Unknown 8465 190 15,191 50 397 0.76Unknown 10882 313 15,069 12 19 0.72HLH106 8522 703 14,689 13 1,478 0.68ACC 11198 1,627 13,766 86 11,118 1.36Sar1 7073 239 15,147 6 20 0.72Sly1 3539 3,336 12,071 7 17 0.57Cen1ba 6742 101 15,282 9 16 0.65COP 5484 1,957 13,427 2 8 0.94-COP 7961 133 15,249 17 1,640 0.31-COP 6223 9a 15,375 24 6,897 0.22Syx5 4214 754 14,634 35 2,760 0.26Garz 8487 2,083 13,304 40 480 0.86
CG, FlyBase gene ID. Failure to spread is shown by a high ratio of actin to area and rankings from the cofilin/capulet-trained decision tree. A high actin to area ratio indicates that a cell has a normal amount of actin but a small surface area, indicating a lack of cell spreading. Discrepancies between actin/area and decision tree rankings result from the decision tree using a different set of discriminating features, including actin distribution in the cell. Ranking reflects the position of the phenotype out of the entire list of 14,000 genes. Cell number indicates the normalized number of cells present after RNAi treatment, where 1.00 is the plate mean. Depletions resulting in a normalized cell number <0.1 were excluded. Data are from the initial screen, and do not include rescreen data. All genes in this table except profilin, capping protein , cofilin, and capulet were rescreened with nonoverlapping RNAs where possible, and all phenotypes were repeated by visual inspection and computational analysis. See Materials Methods for description of analysis and rescreening methods.
JCB • VOLUME 191 • NUMBER 3 • 2010 476
is not an essential component of the secretory pathway (Fig. 4 F). We also examined ER and Golgi morphologies for these deple-tions but found no obvious defect (Fig. S3).
CG9175 was previously identified in an RNAi screen for secretion (Bard et al., 2006) but was thought, based on its se-quence, to be involved in translation and discounted. Although not annotated as such in FlyGene, CG9175 was previously pos-tulated to be the Drosophila version of yeast Sec12, although the sequence identity is weak (7%; Chardin and Callebaut, 2002). Our finding of ER localization and strong secretion defect after RNAi all support the notion that CG9175 is the Drosophila ho-mologue of Sec12. Sec12 in Saccharomyces cerevisiae is a gua-nine nucleotide exchange factor that activates Sar1, a key GTPase involved in assembling COPII coats (Weissman et al., 2001). Although metazoan Sec12 has not been studied in vivo, biochemi-cal experiments suggest that mammalian Sec12 is important for recruiting Sar1 to the ER (Weissman et al., 2001). However, our results show that Sar1-mCh still localized to ER tubules after CG9175/Sec12 depletion (Fig. S3). Thus, our results are most consistent with CG9175/Sec12 being necessary for Sar1 activa-tion but not essential for its recruitment to the ER.
In summary, we performed the first completely automated whole genome RNAi screen for cell morphology of a non-neuronal cell type. The methods of analyses that we used in this study can be used for other RNAi-based screens of shape and in other quantitative analyses of cell morphology, such as the formation of filopodia, neuronal dendrites, or other cellular ex-tensions. Perhaps somewhat surprisingly, the screen identified more uncharacterized genes associated with membrane systems than the actin cytoskeleton and signaling. The reason may be that the most important actin-associated proteins have been al-ready identified and that Con A stimulates several redundant upstream signaling systems that feed into actin nucleation. The mechanism by which knockdown of proteins involved in mem-brane synthesis and secretion produces a specific cell-spreading defect is probably complex but is likely to involve a depletion of key membrane proteins and insufficient lipids for cell expan-sion. The screen also led to the discovery of three uncharac-terized proteins, two of which are part of the ER and a novel secreted protein.
Materials and methodsCell culture and genome-wide RNAiDrosophila S2U cells were grown, and dsRNA treatment was performed as described previously in Goshima et al. (2007). For RNAi, we used the V2 RNAi library described previously in Goshima et al. (2007), which is now available commercially at Thermo Fisher Scientific. After 5 d, cells were resuspended and transferred to Con A–coated glass-bottom plates (Matrical). Con A treatment was performed by drying 70 µl of a 0.05 mg/ml Con A solution onto the bottom of each well. Cells were fixed in 6.4% formaldehyde and incubated overnight with an anti-tubulin antibody (1:1,000; YL; AbD Serotec) in the presence of phosphate-buffered saline containing 0.1% (vol/vol) Triton X-100 and 3% (wt/vol) BSA. The cells were incubated with 1 µg/ml DAPI (Sigma-Aldrich), donkey anti–rat anti-body, FITC-conjugated antibody (1:250; F2658; Sigma-Aldrich), and 66 nM
Figure 4. Gene knockdowns that impair cell spreading. (A) Domain sche-matics of CG9175 (Dm Sec12), CG8465, and CG15231. (B) Representa-tive fields of cells with the indicated gene knockdowns. This phenotype can be detected quantitatively by calculating the total actin staining intensity divided by the total surface area of the cell (Table II). The inset shows a wild-type cell. Bar, 20 µm. (C) CG8465-GFP (left) and Sar1-mCherry (an ER-resident protein; middle) expressed in the same cell. (D) GFP-CG9175 (left) and Sar1-mCherry (middle) expressed in the same cell. (E) Selected frames from time-lapse video of CG15231-GFP. The arrows follow the po-sition of a punctum that can be tracked over time. At 3 s, the punctum disappears, and a radial burst of fluorescence (within dashed line) is seen, likely reflecting plasma membrane fusion and secretion into the medium (Video 1). (C–E) Bars, 5 µm. (F) Secretion of 15231-GFP into the media under the listed RNAi conditions (see Materials and methods). Secretion was measured by immunoblot analysis 12 h after induction and compared ratiometrically with tubulin levels (as a control for total protein; Fig. S1).
Error bars indicate mean ± SD. (G) Quantitative rates of FRAP. Curves are means for at least 10 cells.
477A genomic RNAi screen of cell shape • D’Ambrosio and Vale
et al. (2003) screen. The first step in such analysis is to distinguish individual cells and outline the boundary between cells, referred to as segmentation (Fig. 1). A common approach for performing this is through the watershed method, which we performed using the images of DNA and tubulin stain-ing. Actin staining proved to be difficult to use for segmentation because the actin structures of adjacent cells often touch, making groups of more than two cells very difficult to segment accurately. However, with the tubu-lin signal, there was a gap in signal intensity between adjacent cells, and watershed lines closely followed the true cell edges when segmenting through groups of cells (Fig. 1). We found that the most robust means of detecting cell edges was by using a simple threshold after the watershed operation, which accurately divided the image into regions containing sin-gle cells. From these individual cells, we extracted upwards of 70 features, such as cell area, actin staining intensity, etc., which were used for the classification of phenotypes via multiple-feature machine learning or single-feature sorting.
All image analysis was performed in MATLAB (MathWorks) using the image processing toolbox. After loading images into MATLAB, appro-priate contrast-stretching operations were performed on all images. Groups of pixels <300 and 200 pixels were excluded from the tubulin image and DAPI image, respectively. A composite image of the tubulin and DAPI chan-nels was created by adding the DAPI image to the tubulin image and divid-ing by 1.5. This image was inverted and slightly blurred using a convolution filtering technique with a 2-pixel-diameter disc filter. The extended minima was calculated (using the imextendedmin function), and these minima were imposed onto the image (using the imimposemin function). The purpose of the blurring and minima imposition was to prevent the common problem of oversegmentation via the watershed transform. A watershed segmentation was then performed on this image. The goal of this operation was not to identify cell borders but to isolate one cell in each watershed segment. Any cell edges touching the border of this segment were blurred with a convolu-tion operation with a disc-shaped filter with a diameter of 10. This blurring ensures that measurements were not skewed by an artificially created jag-ged edge of the watershed line. The actin, tubulin, and DAPI images con-tained within this segment were thresholded. If this new image only contained one group of DAPI pixels, and the DAPI, tubulin, and actin sig-nals overlapped after all objects <400 pixels were excluded, it was fed through the rest of the analysis.
Feature extraction and machine learningCorner detection is described in Fig. 2. The code for corner detection was previously described by MathWorks (http://www.mathworks.com/matlabcentral/fileexchange/7652-a-corner-detector-based-on-global-and-local-curvature-properties). FFT analysis is described in Figs. 2 (F–H) and S1. A total of 70 extracted features were used for machine learning. The following is a description of each of these parameters. (1–6) Actin, distri-bution analysis: the cell is divided into six concentric rings by repeated erosion with a circular structural element. The amount of actin in each ring is summed and reported independently (six measurements). (7) Actin, total intensity: the summed intensity of the actin staining in the cell. (8) Actin, perimeter analysis: the intensity of the actin signal up to 6-pixels deep into the lamella is calculated and divided by the intensity in the rest of the cell. (9) Area: the area of the thresholded cell. (10) Area, convex hull: the area of the convex hull of the thresholded cell. (11) Cells per image: the mean number of analyzable cells per image. (12) Corner detection: see Fig. 2. (13) DAPI fragments: the number of DAPI fragments in the cell. (14) DAPI fragment distance: the mean distance separating DAPI fragments. (15) Dif-ference of Gaussian filter: the area of resulting image after the difference between the original image filtered with Gaussians of two different kernels (Yi and Coppolino, 2006). (16) Elongation: the length of the major axis of the cell divided by the minor axis. (17–45) FFT perimeter analysis: see Figs. 2 (F–H) and S1. (46) Perimeter: the number of pixels that compose the perimeter of the thresholded cell. (47) Perimeter, smoothed: the number of pixels that compose the perimeter of the thresholded cell after a blur-ring operation. (48–58) Polynomial perimeter analysis: the distance from the centroid to each perimeter pixel was calculated as in FFT analysis. The resulting plot is then fit to an 11th-order polynomial, and the co-efficients are recorded (11 measurements). (59) Texture, contrast: MATLAB built-in function for assessing contrast of images. (60) Texture, correlation: MATLAB built-in function for assessing correlation of images. (61) Texture, energy: MATLAB built-in function for assessing energy of images. (62) Tex-ture, homogeneity: MATLAB built-in function for assessing homogeneity of images. (63) Texture, range: MATLAB built-in function that calculates the maximum difference in every 3 × 3 neighborhood. (64–69) Tubulin exten-sion analysis: the cell was divided into six concentric rings by repeated erosion with a circular structural element. The amount of tubulin in each
TRITC-phalloidin (Sigma-Aldrich) for 1 h. High throughput images were acquired using an ImageXpress Micro (MDS Analytical Technologies) with a 40× 0.95 NA lens (Nikon). 15–36 images per well were obtained so that 100–200 cells were imaged per well. Linear contrast adjustments were performed on all images.
Images were taken on an ImageXpress Micro–automated micro-scope with a 40× 0.9 NA objective using MetaMorph software (MDS Ana-lytical Technologies). Plates were images in mounting media (Dako) at 20°C. Linear contrast adjustments were performed on all images.
Phenotypes for CG2028, CG8465, CG9175, and the nonspreading genes were verified by visually confirming the depletion phenotype using nonoverlapping RNA directed toward a different part of the gene as de-scribed previously in Goshima et al. (2007). To be considered confirmed, a gene had to have a score that would place in the top 2% of its identifying category in the original screen in at least half of all rescreens. Rescreen number varied from 1 to 12 per gene. CG2028 repeated 2/4 times visu-ally, 2/4 times by fast Fourier transform (FFT) analysis, but only 1/4 times by corner detection. CG15231 is too small to design a nonoverlapping dsRNA. There are two computationally predicted off-target genes, CG13159 and CG9771, which show one 16-bp segment of overlap with the dsRNA for CG15231. However, RNAi of these two genes did not produce a pheno-type. This makes it unlikely that the observed phenotype for CG15231 is because of an off-target effect, although the possibility cannot be excluded. All other genes indicated in Table S1 were subjected to visual confirmation.
GFP tagging, live cell imaging, and analysiscDNAs for cloning were obtained by PCR from Drosophila S2 cell cDNA. CG8465 was cloned from a cDNA obtained from Thermo Fisher Scientific. CG9175 cloned from our S2U cells had several mutations (all but one noncoding) compared with the FlyBase sequence. Vectors were cloned into pMT-GFP (Invitrogen) or pMT-Cherry vectors as described previously (Goshima et al., 2007) using the Gateway system (Invitrogen). GFP was imaged after induction of gene expression with 50 µM CuSO4 overnight. Time-lapse imaging was performed using a microscope (TE2000; Nikon) with a 100× 1.49 NA objective and µManager microscopy software (Stuurman et al., 2007). Cells were imaged in growth media at 20°C with a camera (iXonEM+; Andor). Linear contrast adjustments were performed on all images. For measuring actin retrograde flow in actin-GFP–expressing cells, kymo-graphs were constructed by selecting lines of pixels perpendicular to the edge of the lamella in an image stack. Kymographs were analyzed for at least 10 cells with at least four measurements taken per cell using at least two different areas of the lamella. For CK1- and Scar-depleted cells, actin velocities in the protrusions were measured, as flow does not occur in the regions between protrusions.
Secretion assaysSecretion assays were performed using our CG15231-GFP cell line ex-pressed from a metallothionein promoter. On the beginning of day 4 of RNAi treatment, the cells were induced with 500 µM copper sulfate. After 12 h, the media from the cells were removed, resuspended in 2× sample buffer, and immunoblotted for GFP, and the cells were lysed in 4× sample buffer and immunoblotted for tubulin. Immunoblots were developed using ECL and scanned. The ratio of intensity of GFP band to the tubulin band (to normalize for cellular protein) for each condition was quantitated by measuring total pixel intensity in the band of interest corrected for background intensity.
Caspase assaysCaspase assays were performed as previously described (Wei et al., 2002). In brief, cells were lysed, and total protein concentrations were normalized to 0.74 mg/ml. DEVD.pna (California Peptide Research) cleav-age was measured initially and at 6 h as OD 410 on a plate reader. Ex-periments were performed in quadruplicate.
Quantitative FRAPExperiments were performed on a confocal microscope (510; Carl Zeiss, Inc.) with a 300 mW 488 laser. A 2.6-µm slice was bleached through the entire cell width and much of the cell depth (100% laser power and 100% transmission), and recovery of fluorescence was observed every 1.5 s after photobleaching (100% laser power and 0.75% transmission). No signifi-cant photobleaching was observed in control experiments. To obtain diffu-sion coefficients, the first 65% of the recovery toward the asymptote was fit as previously described (Ellenberg et al., 1997).
Computational analysisSegmentation. We sought to develop image analysis routines that are capa-ble of analyzing the phenotypes described previously in the Rogers
JCB • VOLUME 191 • NUMBER 3 • 2010 478
Rogers, S.L., G.C. Rogers, D.J. Sharp, and R.D. Vale. 2002. Drosophila EB1 is important for proper assembly, dynamics, and positioning of the mitotic spindle. J. Cell Biol. 158:873–884. doi:10.1083/jcb.200202032
Rogers, S.L., U. Wiedemann, N. Stuurman, and R.D. Vale. 2003. Molecular re-quirements for actin-based lamella formation in Drosophila S2 cells. J. Cell Biol. 162:1079–1088. doi:10.1083/jcb.200303023
Seegmiller, A.C., I. Dobrosotskaya, J.L. Goldstein, Y.K. Ho, M.S. Brown, and R.B. Rawson. 2002. The SREBP pathway in Drosophila: regulation by palmitate, not sterols. Dev. Cell. 2:229–238. doi:10.1016/S1534-5807(01)00119-8
Sepp, K.J., P. Hong, S.B. Lizarraga, J.S. Liu, L.A. Mejia, C.A. Walsh, and N. Perrimon. 2008. Identification of neural outgrowth genes using genome-wide RNAi. PLoS Genet. 4:e1000111. doi:10.1371/journal .pgen.1000111
Stuurman, N., N. Amodaj, and R.D. Vale. 2007. Micro-manager: open source software for light microscope images. Microscopy Today. 15:42–43.
Uttenweiler-Joseph, S., M. Moniatte, M. Lagueux, A. Van Dorsselaer, J.A. Hoffmann, and P. Bulet. 1998. Differential display of peptides induced during the immune response of Drosophila: a matrix-assisted laser de-sorption ionization time-of-flight mass spectrometry study. Proc. Natl. Acad. Sci. USA. 95:11342–11347. doi:10.1073/pnas.95.19.11342
Waterman-Storer, C.M., and E.D. Salmon. 1997. Actomyosin-based retrograde flow of microtubules in the lamella of migrating epithelial cells influ-ences microtubule dynamic instability and turnover and is associated with microtubule breakage and treadmilling. J. Cell Biol. 139:417–434. doi:10.1083/jcb.139.2.417
Wei, C.W., C.C. Hu, C.H. Tang, M.C. Lee, and J.J. Wang. 2002. Induction of differentiation rescues HL-60 cells from Rana catesbeiana ribonuclease-induced cell death. FEBS Lett. 531:421–426. doi:10 .1016/S0014-5793(02)03577-9
Weissman, J.T., H. Plutner, and W.E. Balch. 2001. The mammalian guanine nu-cleotide exchange factor mSec12 is essential for activation of the Sar1 GTPase directing endoplasmic reticulum export. Traffic. 2:465–475. doi:10.1034/j.1600-0854.2001.20704.x
White, J., and E. Stelzer. 1999. Photobleaching GFP reveals protein dynam-ics inside live cells. Trends Cell Biol. 9:61–65. doi:10.1016/S0962- 8924(98)01433-0
Witten, I.H., and E. Frank. 2005. Data Mining: Practical Machine Learning Tools and Techniques. Second edition. Morgan Kaufmann, Amsterdam/Boston, MA. 525 pp.
Yi, Q., and M.G. Coppolino. 2006. Automated classification and quantification of F-actin-containing ruffles in confocal micrographs. Biotechniques. 40:745–746: 748: 750 passim. doi:10.2144/000112162
ring was summed and reported independently (six measurements). (70) Tubulin, total intensity: the summed intensity of the tubulin staining in cells.
For machine learning, training sets of at least 100 cells were select-ing based on the images of the cells. Alternating decision trees were con-structed using Weka (Witten and Frank, 2005) on all of the features extracted for each selected cell. Because of the small training set size, two-fold cross validation was performed to roughly assess the performance of the tree, but no cross validation was performed when training to evaluate the entire dataset. To calculate a rankable score, the number of cells classi-fied as having the phenotype of interest was divided by the number of cells classified as normal for each knockdown. The analysis code and primary image data are available at http://www.cellmigration.org/resource/ discovery/vale/dambrosio2010_rnai.cgi.
Online supplemental materialFig. S1 shows FFT power spectral analysis, the protein depletion after RNAi treatment to the relevant gene, and sample Western blot data used to generate Fig. 4 F. Fig. S2 shows RNAi phenotypes. Fig. S3 shows Golgi and ER morphology in the indicated knockdowns and DEVD cleavage activity. Table S1 shows the top and bottom 40 ranked genes for each indi-cated sorting method. Table S2 shows an analysis of toxicity and the non-spreading phenotype in the depletion of SREBP pathway genes. Table S3 shows validation of quantitative parameters. Video 1 shows time-lapse total internal reflection fluorescence microscopy of CG15231-GFP expressed in S2U cells. Online supplemental material is available at http://www.jcb .org/cgi/content/full/jcb.201003135/DC1.
This project was supported by the Cell Migration Consortium (grant U54GM064346) from the National Institute of General Medical Sciences. The content is solely the responsibility of the authors and does not necessarily represent the official views of the National Institute of General Medical Sci-ences or the National Institutes of Health.
Submitted: 29 March 2010Accepted: 5 October 2010
ReferencesBakal, C., J. Aach, G. Church, and N. Perrimon. 2007. Quantitative morphologi-
cal signatures define local signaling networks regulating cell morphology. Science. 316:1753–1756. doi:10.1126/science.1140324
Bard, F., L. Casano, A. Mallabiabarrena, E. Wallace, K. Saito, H. Kitayama, G. Guizzunti, Y. Hu, F. Wendler, R. Dasgupta, et al. 2006. Functional ge-nomics reveals genes involved in protein secretion and Golgi organiza-tion. Nature. 439:604–607. doi:10.1038/nature04377
Chardin, P., and I. Callebaut. 2002. The yeast Sar exchange factor Sec12, and its higher organism orthologs, fold as beta-propellers. FEBS Lett. 525:171–173. doi:10.1016/S0014-5793(02)03068-5
Ellenberg, J., E.D. Siggia, J.E. Moreira, C.L. Smith, J.F. Presley, H.J. Worman, and J. Lippincott-Schwartz. 1997. Nuclear membrane dynamics and reassembly in living cells: targeting of an inner nuclear membrane protein in interphase and mitosis. J. Cell Biol. 138:1193–1206. doi:10 .1083/jcb.138.6.1193
Faix, J., and K. Rottner. 2006. The making of filopodia. Curr. Opin. Cell Biol. 18:18–25. doi:10.1016/j.ceb.2005.11.002
Goshima, G., R. Wollman, S.S. Goodwin, N. Zhang, J.M. Scholey, R.D. Vale, and N. Stuurman. 2007. Genes required for mitotic spindle as-sembly in Drosophila S2 cells. Science. 316:417–421. doi:10.1126/ science.1141314
Iwasa, J.H., and R.D. Mullins. 2007. Spatial and temporal relationships between actin-filament nucleation, capping, and disassembly. Curr. Biol. 17:395–406. doi:10.1016/j.cub.2007.02.012
Karlson, P. 1970. Terpenoids in insects. Biochem. Soc. Symp. 29:145–156.
Kiger, A.A., B. Baum, S. Jones, M.R. Jones, A. Coulson, C. Echeverri, and N. Perrimon. 2003. A functional genomic analysis of cell morphology using RNA interference. J. Biol. 2:27. doi:10.1186/1475-4924-2-27
Kural, C., H. Kim, S. Syed, G. Goshima, V.I. Gelfand, and P.R. Selvin. 2005. Kinesin and dynein move a peroxisome in vivo: a tug-of-war or coordinated movement? Science. 308:1469–1472. doi:10.1126/science.1108408
Liu, T., D. Sims, and B. Baum. 2009. Parallel RNAi screens across different cell lines identify generic and cell type-specific regulators of actin or-ganization and cell morphology. Genome Biol. 10:R26. doi:10.1186/ gb-2009-10-3-r26
Randazzo, P.A., H. Inoue, and S. Bharti. 2007. Arf GAPs as regulators of the actin cytoskeleton. Biol. Cell. 99:583–600. doi:10.1042/BC20070034
Related Documents