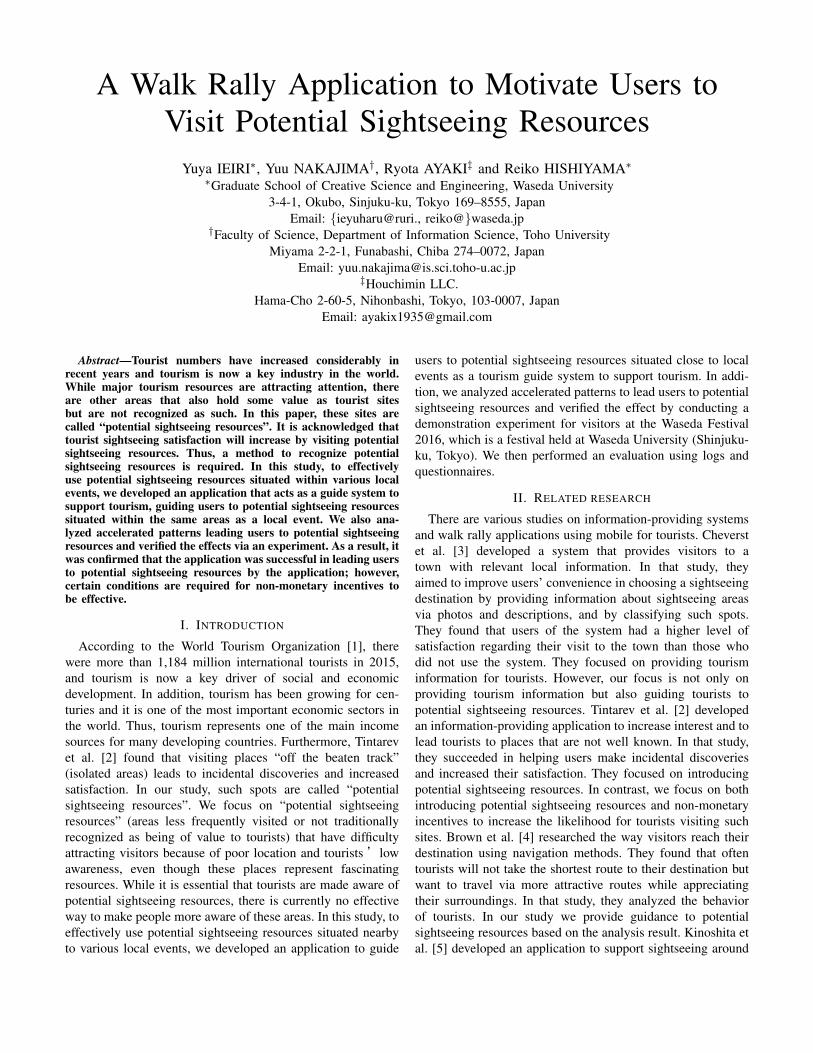
A Walk Rally Application to Motivate Users to Visit Potential Sightseeing Resources Yuya IEIRI * , Yuu NAKAJIMA † , Ryota AYAKI ‡ and Reiko HISHIYAMA * * Graduate School of Creative Science and Engineering, Waseda University 3-4-1, Okubo, Sinjuku-ku, Tokyo 169–8555, Japan Email: {ieyuharu@ruri., reiko@}waseda.jp † Faculty of Science, Department of Information Science, Toho University Miyama 2-2-1, Funabashi, Chiba 274–0072, Japan Email: [email protected] ‡ Houchimin LLC. Hama-Cho 2-60-5, Nihonbashi, Tokyo, 103-0007, Japan Email: [email protected] Abstract—Tourist numbers have increased considerably in recent years and tourism is now a key industry in the world. While major tourism resources are attracting attention, there are other areas that also hold some value as tourist sites but are not recognized as such. In this paper, these sites are called “potential sightseeing resources”. It is acknowledged that tourist sightseeing satisfaction will increase by visiting potential sightseeing resources. Thus, a method to recognize potential sightseeing resources is required. In this study, to effectively use potential sightseeing resources situated within various local events, we developed an application that acts as a guide system to support tourism, guiding users to potential sightseeing resources situated within the same areas as a local event. We also ana- lyzed accelerated patterns leading users to potential sightseeing resources and verified the effects via an experiment. As a result, it was confirmed that the application was successful in leading users to potential sightseeing resources by the application; however, certain conditions are required for non-monetary incentives to be effective. I. I NTRODUCTION According to the World Tourism Organization [1], there were more than 1,184 million international tourists in 2015, and tourism is now a key driver of social and economic development. In addition, tourism has been growing for cen- turies and it is one of the most important economic sectors in the world. Thus, tourism represents one of the main income sources for many developing countries. Furthermore, Tintarev et al. [2] found that visiting places “off the beaten track” (isolated areas) leads to incidental discoveries and increased satisfaction. In our study, such spots are called “potential sightseeing resources”. We focus on “potential sightseeing resources” (areas less frequently visited or not traditionally recognized as being of value to tourists) that have difficulty attracting visitors because of poor location and tourists ’low awareness, even though these places represent fascinating resources. While it is essential that tourists are made aware of potential sightseeing resources, there is currently no effective way to make people more aware of these areas. In this study, to effectively use potential sightseeing resources situated nearby to various local events, we developed an application to guide users to potential sightseeing resources situated close to local events as a tourism guide system to support tourism. In addi- tion, we analyzed accelerated patterns to lead users to potential sightseeing resources and verified the effect by conducting a demonstration experiment for visitors at the Waseda Festival 2016, which is a festival held at Waseda University (Shinjuku- ku, Tokyo). We then performed an evaluation using logs and questionnaires. II. RELATED RESEARCH There are various studies on information-providing systems and walk rally applications using mobile for tourists. Cheverst et al. [3] developed a system that provides visitors to a town with relevant local information. In that study, they aimed to improve users’ convenience in choosing a sightseeing destination by providing information about sightseeing areas via photos and descriptions, and by classifying such spots. They found that users of the system had a higher level of satisfaction regarding their visit to the town than those who did not use the system. They focused on providing tourism information for tourists. However, our focus is not only on providing tourism information but also guiding tourists to potential sightseeing resources. Tintarev et al. [2] developed an information-providing application to increase interest and to lead tourists to places that are not well known. In that study, they succeeded in helping users make incidental discoveries and increased their satisfaction. They focused on introducing potential sightseeing resources. In contrast, we focus on both introducing potential sightseeing resources and non-monetary incentives to increase the likelihood for tourists visiting such sites. Brown et al. [4] researched the way visitors reach their destination using navigation methods. They found that often tourists will not take the shortest route to their destination but want to travel via more attractive routes while appreciating their surroundings. In that study, they analyzed the behavior of tourists. In our study we provide guidance to potential sightseeing resources based on the analysis result. Kinoshita et al. [5] developed an application to support sightseeing around

Welcome message from author
This document is posted to help you gain knowledge. Please leave a comment to let me know what you think about it! Share it to your friends and learn new things together.
Transcript
A Walk Rally Application to Motivate Users toVisit Potential Sightseeing Resources
Yuya IEIRI∗, Yuu NAKAJIMA†, Ryota AYAKI‡ and Reiko HISHIYAMA∗∗Graduate School of Creative Science and Engineering, Waseda University
3-4-1, Okubo, Sinjuku-ku, Tokyo 169–8555, JapanEmail: {ieyuharu@ruri., reiko@}waseda.jp
†Faculty of Science, Department of Information Science, Toho UniversityMiyama 2-2-1, Funabashi, Chiba 274–0072, Japan
Email: [email protected]‡Houchimin LLC.
Hama-Cho 2-60-5, Nihonbashi, Tokyo, 103-0007, JapanEmail: [email protected]
Abstract—Tourist numbers have increased considerably inrecent years and tourism is now a key industry in the world.While major tourism resources are attracting attention, thereare other areas that also hold some value as tourist sitesbut are not recognized as such. In this paper, these sites arecalled “potential sightseeing resources”. It is acknowledged thattourist sightseeing satisfaction will increase by visiting potentialsightseeing resources. Thus, a method to recognize potentialsightseeing resources is required. In this study, to effectivelyuse potential sightseeing resources situated within various localevents, we developed an application that acts as a guide system tosupport tourism, guiding users to potential sightseeing resourcessituated within the same areas as a local event. We also ana-lyzed accelerated patterns leading users to potential sightseeingresources and verified the effects via an experiment. As a result, itwas confirmed that the application was successful in leading usersto potential sightseeing resources by the application; however,certain conditions are required for non-monetary incentives tobe effective.
I. INTRODUCTION
According to the World Tourism Organization [1], therewere more than 1,184 million international tourists in 2015,and tourism is now a key driver of social and economicdevelopment. In addition, tourism has been growing for cen-turies and it is one of the most important economic sectors inthe world. Thus, tourism represents one of the main incomesources for many developing countries. Furthermore, Tintarevet al. [2] found that visiting places “off the beaten track”(isolated areas) leads to incidental discoveries and increasedsatisfaction. In our study, such spots are called “potentialsightseeing resources”. We focus on “potential sightseeingresources” (areas less frequently visited or not traditionallyrecognized as being of value to tourists) that have difficultyattracting visitors because of poor location and tourists’lowawareness, even though these places represent fascinatingresources. While it is essential that tourists are made aware ofpotential sightseeing resources, there is currently no effectiveway to make people more aware of these areas. In this study, toeffectively use potential sightseeing resources situated nearbyto various local events, we developed an application to guide
users to potential sightseeing resources situated close to localevents as a tourism guide system to support tourism. In addi-tion, we analyzed accelerated patterns to lead users to potentialsightseeing resources and verified the effect by conducting ademonstration experiment for visitors at the Waseda Festival2016, which is a festival held at Waseda University (Shinjuku-ku, Tokyo). We then performed an evaluation using logs andquestionnaires.
II. RELATED RESEARCH
There are various studies on information-providing systemsand walk rally applications using mobile for tourists. Cheverstet al. [3] developed a system that provides visitors to atown with relevant local information. In that study, theyaimed to improve users’ convenience in choosing a sightseeingdestination by providing information about sightseeing areasvia photos and descriptions, and by classifying such spots.They found that users of the system had a higher level ofsatisfaction regarding their visit to the town than those whodid not use the system. They focused on providing tourisminformation for tourists. However, our focus is not only onproviding tourism information but also guiding tourists topotential sightseeing resources. Tintarev et al. [2] developedan information-providing application to increase interest and tolead tourists to places that are not well known. In that study,they succeeded in helping users make incidental discoveriesand increased their satisfaction. They focused on introducingpotential sightseeing resources. In contrast, we focus on bothintroducing potential sightseeing resources and non-monetaryincentives to increase the likelihood for tourists visiting suchsites. Brown et al. [4] researched the way visitors reach theirdestination using navigation methods. They found that oftentourists will not take the shortest route to their destination butwant to travel via more attractive routes while appreciatingtheir surroundings. In that study, they analyzed the behaviorof tourists. In our study we provide guidance to potentialsightseeing resources based on the analysis result. Kinoshita etal. [5] developed an application to support sightseeing around
towns. They used a navigation system that simply used acompass. That system makes it possible for users to lookaround at their surroundings and enjoy the atmosphere aroundthem. In addition, it was revealed that users engaged in moreconversations about their surroundings and they took morephotographs. The users focused on enjoying their surroundingsvia compass navigation. However, we focus on guiding touriststo specific places with this navigation method.
In this study, we developed an application to lead usersto potential sightseeing resources situated within or closeto a local event via walking rally applications for touristsusing mobile devices. Thus, we aimed to effectively utilizepotential sightseeing resources among various regional events.Our application provides information by way of photographsand descriptions about tourism resources, and lead tourists tovarious destinations using a navigation system that comprises acompass and the distance to the destination. It also introducesa non-monetary incentive to motivate user behavior.
III. ASSUMPTION
In this study, we assumed that “the Waseda Festival 2016 isa regional event. The various forms of entertainment offeredat the Waseda Festival are tourism resources. The Wasedacultural facilities are potential sightseeing resources”. We thendeveloped the web application “WaseNavi”, which guidesvisitors at the Waseda Festival 2016 (5th and 6th November2016) and leads them to various Waseda cultural facilities. Inthis application, users repeat the next four steps to participatein a walk rally.
1) Select a checkpoint (destination)2) Move to the destination using Navi3) Enter keywords (check-in) → Acquire points4) Try a quiz → Acquire points if users answer correctlyThen, we hypothesized that people who already have a
specific destination in mind will stop at potential sightseeingresources on their way to their destination if they are awarethat these exist. Furthermore, it is not clear what kind ofevaluation these sites will receive when visitors reach thepotential sightseeing resources. Thus, through this experiment,we test the hypothesis by verifying whether people who visitWaseda University to attend the Waseda Festival will then visitpotential sightseeing resources within the university.
IV. OVERVIEW OF THE APPLICATION
A. Building block method
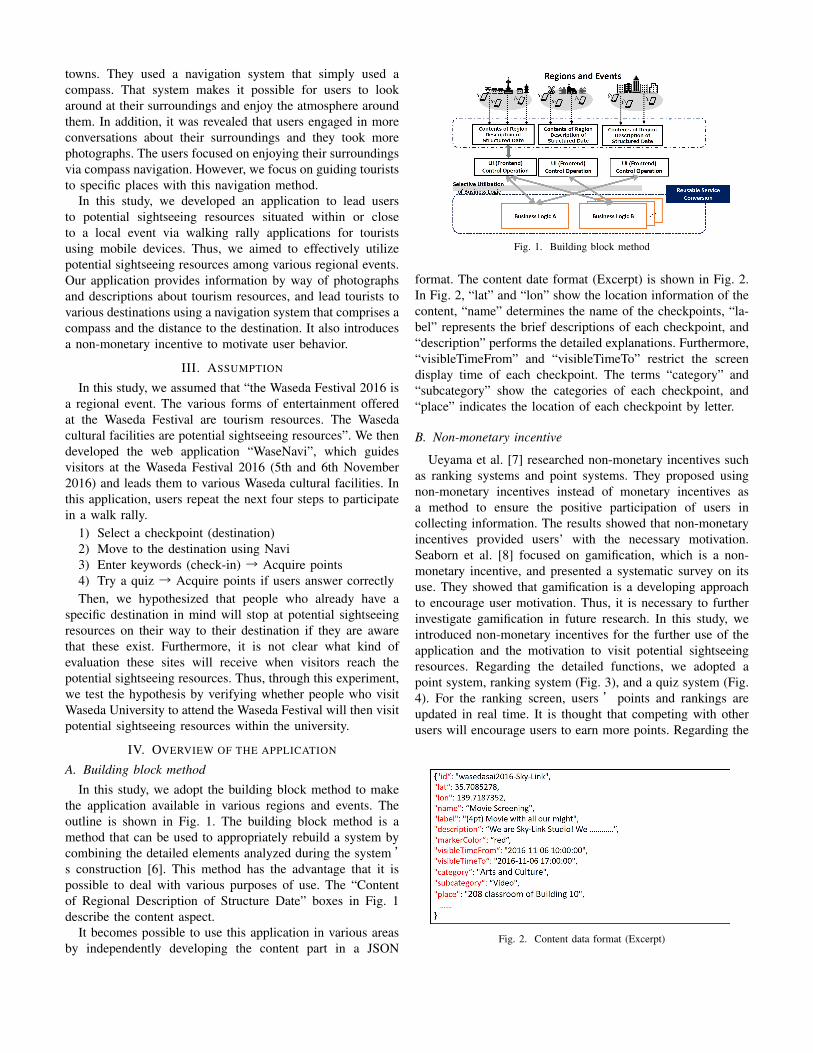
In this study, we adopt the building block method to makethe application available in various regions and events. Theoutline is shown in Fig. 1. The building block method is amethod that can be used to appropriately rebuild a system bycombining the detailed elements analyzed during the system’s construction [6]. This method has the advantage that it ispossible to deal with various purposes of use. The “Contentof Regional Description of Structure Date” boxes in Fig. 1describe the content aspect.
It becomes possible to use this application in various areasby independently developing the content part in a JSON
Fig. 1. Building block method
format. The content date format (Excerpt) is shown in Fig. 2.In Fig. 2, “lat” and “lon” show the location information of thecontent, “name” determines the name of the checkpoints, “la-bel” represents the brief descriptions of each checkpoint, and“description” performs the detailed explanations. Furthermore,“visibleTimeFrom” and “visibleTimeTo” restrict the screendisplay time of each checkpoint. The terms “category” and“subcategory” show the categories of each checkpoint, and“place” indicates the location of each checkpoint by letter.
B. Non-monetary incentive
Ueyama et al. [7] researched non-monetary incentives suchas ranking systems and point systems. They proposed usingnon-monetary incentives instead of monetary incentives asa method to ensure the positive participation of users incollecting information. The results showed that non-monetaryincentives provided users’ with the necessary motivation.Seaborn et al. [8] focused on gamification, which is a non-monetary incentive, and presented a systematic survey on itsuse. They showed that gamification is a developing approachto encourage user motivation. Thus, it is necessary to furtherinvestigate gamification in future research. In this study, weintroduced non-monetary incentives for the further use of theapplication and the motivation to visit potential sightseeingresources. Regarding the detailed functions, we adopted apoint system, ranking system (Fig. 3), and a quiz system (Fig.4). For the ranking screen, users ’ points and rankings areupdated in real time. It is thought that competing with otherusers will encourage users to earn more points. Regarding the
Fig. 2. Content data format (Excerpt)
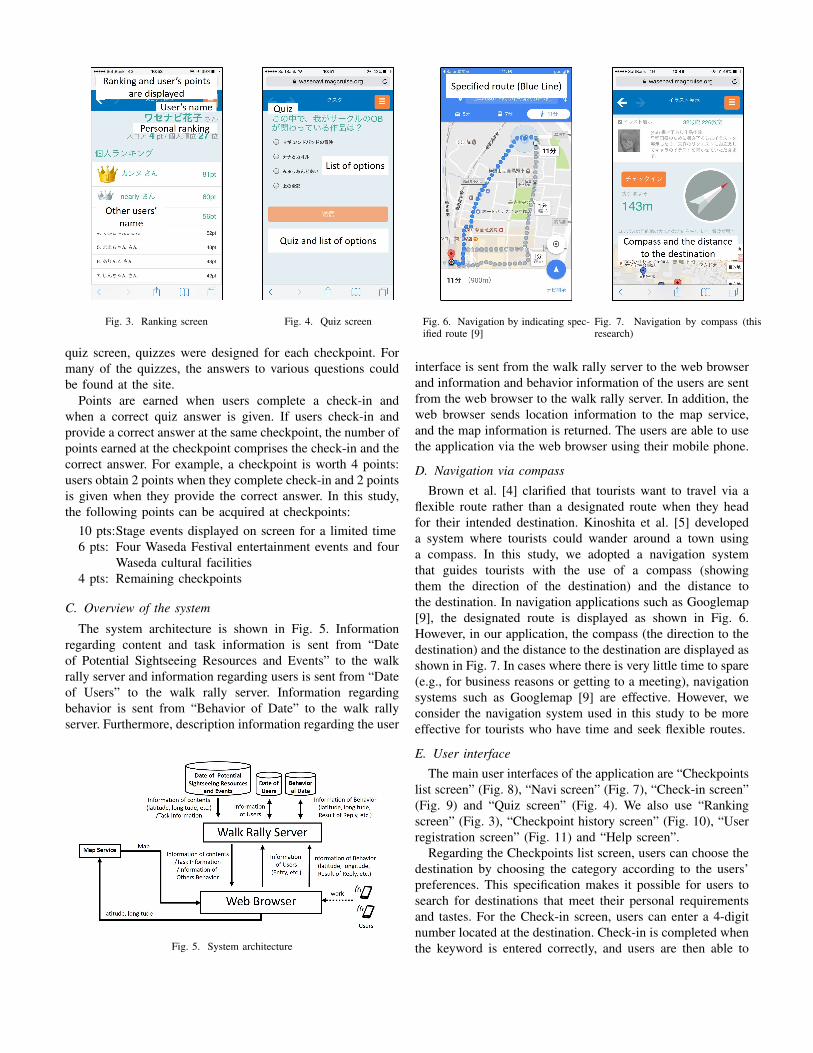
Fig. 3. Ranking screen Fig. 4. Quiz screen
quiz screen, quizzes were designed for each checkpoint. Formany of the quizzes, the answers to various questions couldbe found at the site.
Points are earned when users complete a check-in andwhen a correct quiz answer is given. If users check-in andprovide a correct answer at the same checkpoint, the number ofpoints earned at the checkpoint comprises the check-in and thecorrect answer. For example, a checkpoint is worth 4 points:users obtain 2 points when they complete check-in and 2 pointsis given when they provide the correct answer. In this study,the following points can be acquired at checkpoints:
10 pts:Stage events displayed on screen for a limited time6 pts: Four Waseda Festival entertainment events and four
Waseda cultural facilities4 pts: Remaining checkpoints
C. Overview of the system
The system architecture is shown in Fig. 5. Informationregarding content and task information is sent from “Dateof Potential Sightseeing Resources and Events” to the walkrally server and information regarding users is sent from “Dateof Users” to the walk rally server. Information regardingbehavior is sent from “Behavior of Date” to the walk rallyserver. Furthermore, description information regarding the user
Fig. 5. System architecture
Fig. 6. Navigation by indicating spec-ified route [9]
Fig. 7. Navigation by compass (thisresearch)
interface is sent from the walk rally server to the web browserand information and behavior information of the users are sentfrom the web browser to the walk rally server. In addition, theweb browser sends location information to the map service,and the map information is returned. The users are able to usethe application via the web browser using their mobile phone.
D. Navigation via compass
Brown et al. [4] clarified that tourists want to travel via aflexible route rather than a designated route when they headfor their intended destination. Kinoshita et al. [5] developeda system where tourists could wander around a town usinga compass. In this study, we adopted a navigation systemthat guides tourists with the use of a compass (showingthem the direction of the destination) and the distance tothe destination. In navigation applications such as Googlemap[9], the designated route is displayed as shown in Fig. 6.However, in our application, the compass (the direction to thedestination) and the distance to the destination are displayed asshown in Fig. 7. In cases where there is very little time to spare(e.g., for business reasons or getting to a meeting), navigationsystems such as Googlemap [9] are effective. However, weconsider the navigation system used in this study to be moreeffective for tourists who have time and seek flexible routes.
E. User interface
The main user interfaces of the application are “Checkpointslist screen” (Fig. 8), “Navi screen” (Fig. 7), “Check-in screen”(Fig. 9) and “Quiz screen” (Fig. 4). We also use “Rankingscreen” (Fig. 3), “Checkpoint history screen” (Fig. 10), “Userregistration screen” (Fig. 11) and “Help screen”.
Regarding the Checkpoints list screen, users can choose thedestination by choosing the category according to the users’preferences. This specification makes it possible for users tosearch for destinations that meet their personal requirementsand tastes. For the Check-in screen, users can enter a 4-digitnumber located at the destination. Check-in is completed whenthe keyword is entered correctly, and users are then able to
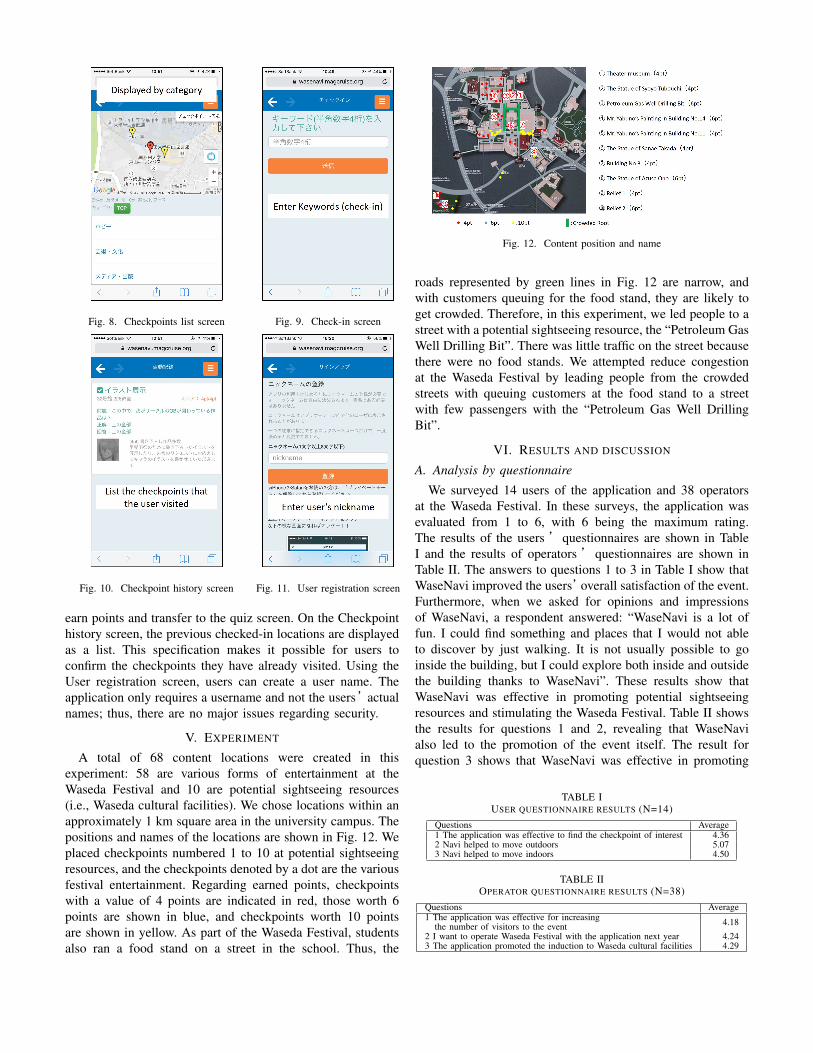
Fig. 8. Checkpoints list screen Fig. 9. Check-in screen
Fig. 10. Checkpoint history screen Fig. 11. User registration screen
earn points and transfer to the quiz screen. On the Checkpointhistory screen, the previous checked-in locations are displayedas a list. This specification makes it possible for users toconfirm the checkpoints they have already visited. Using theUser registration screen, users can create a user name. Theapplication only requires a username and not the users’actualnames; thus, there are no major issues regarding security.
V. EXPERIMENT
A total of 68 content locations were created in thisexperiment: 58 are various forms of entertainment at theWaseda Festival and 10 are potential sightseeing resources(i.e., Waseda cultural facilities). We chose locations within anapproximately 1 km square area in the university campus. Thepositions and names of the locations are shown in Fig. 12. Weplaced checkpoints numbered 1 to 10 at potential sightseeingresources, and the checkpoints denoted by a dot are the variousfestival entertainment. Regarding earned points, checkpointswith a value of 4 points are indicated in red, those worth 6points are shown in blue, and checkpoints worth 10 pointsare shown in yellow. As part of the Waseda Festival, studentsalso ran a food stand on a street in the school. Thus, the
Fig. 12. Content position and name
roads represented by green lines in Fig. 12 are narrow, andwith customers queuing for the food stand, they are likely toget crowded. Therefore, in this experiment, we led people to astreet with a potential sightseeing resource, the “Petroleum GasWell Drilling Bit”. There was little traffic on the street becausethere were no food stands. We attempted reduce congestionat the Waseda Festival by leading people from the crowdedstreets with queuing customers at the food stand to a streetwith few passengers with the “Petroleum Gas Well DrillingBit”.
VI. RESULTS AND DISCUSSION
A. Analysis by questionnaire
We surveyed 14 users of the application and 38 operatorsat the Waseda Festival. In these surveys, the application wasevaluated from 1 to 6, with 6 being the maximum rating.The results of the users ’questionnaires are shown in TableI and the results of operators ’questionnaires are shown inTable II. The answers to questions 1 to 3 in Table I show thatWaseNavi improved the users’overall satisfaction of the event.Furthermore, when we asked for opinions and impressionsof WaseNavi, a respondent answered: “WaseNavi is a lot offun. I could find something and places that I would not ableto discover by just walking. It is not usually possible to goinside the building, but I could explore both inside and outsidethe building thanks to WaseNavi”. These results show thatWaseNavi was effective in promoting potential sightseeingresources and stimulating the Waseda Festival. Table II showsthe results for questions 1 and 2, revealing that WaseNavialso led to the promotion of the event itself. The result forquestion 3 shows that WaseNavi was effective in promoting
TABLE IUSER QUESTIONNAIRE RESULTS (N=14)
Questions Average1 The application was effective to find the checkpoint of interest 4.362 Navi helped to move outdoors 5.073 Navi helped to move indoors 4.50
TABLE IIOPERATOR QUESTIONNAIRE RESULTS (N=38)
Questions Average1 The application was effective for increasing 4.18the number of visitors to the event2 I want to operate Waseda Festival with the application next year 4.243 The application promoted the induction to Waseda cultural facilities 4.29
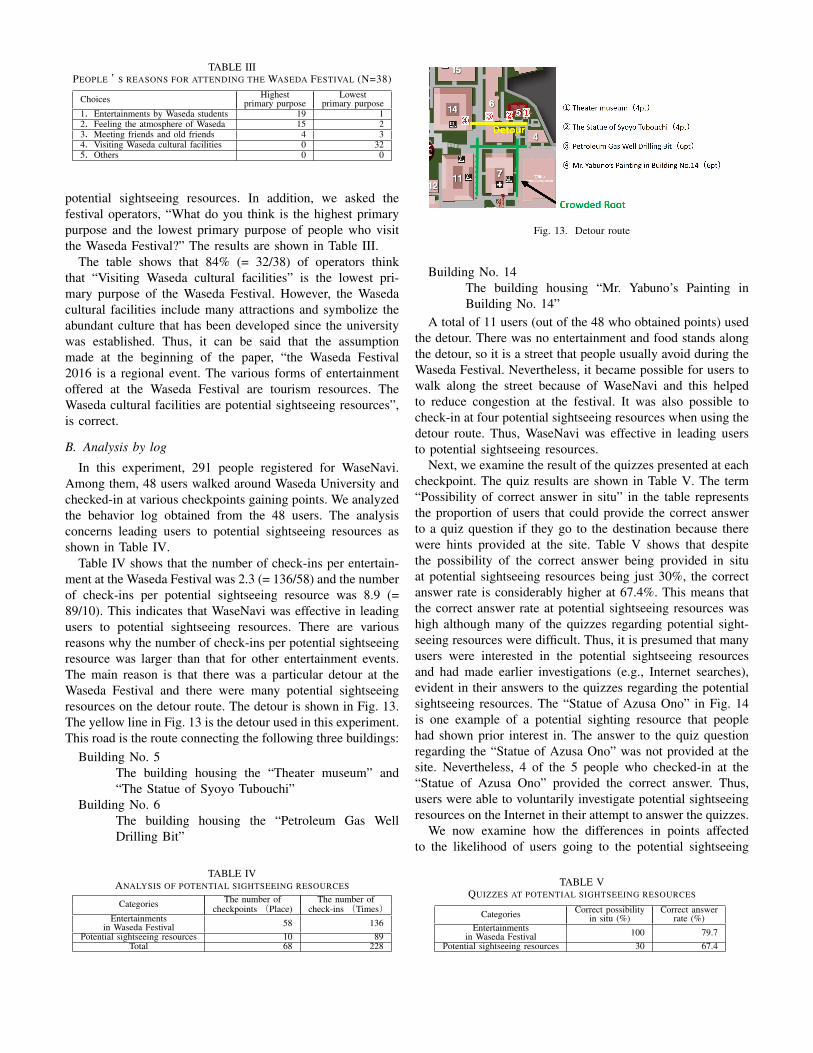
TABLE IIIPEOPLE ’S REASONS FOR ATTENDING THE WASEDA FESTIVAL (N=38)
Choices Highest Lowestprimary purpose primary purpose
1.Entertainments by Waseda students 19 12.Feeling the atmosphere of Waseda 15 23.Meeting friends and old friends 4 34.Visiting Waseda cultural facilities 0 325.Others 0 0
potential sightseeing resources. In addition, we asked thefestival operators, “What do you think is the highest primarypurpose and the lowest primary purpose of people who visitthe Waseda Festival?” The results are shown in Table III.
The table shows that 84% (= 32/38) of operators thinkthat “Visiting Waseda cultural facilities” is the lowest pri-mary purpose of the Waseda Festival. However, the Wasedacultural facilities include many attractions and symbolize theabundant culture that has been developed since the universitywas established. Thus, it can be said that the assumptionmade at the beginning of the paper, “the Waseda Festival2016 is a regional event. The various forms of entertainmentoffered at the Waseda Festival are tourism resources. TheWaseda cultural facilities are potential sightseeing resources”,is correct.
B. Analysis by log
In this experiment, 291 people registered for WaseNavi.Among them, 48 users walked around Waseda University andchecked-in at various checkpoints gaining points. We analyzedthe behavior log obtained from the 48 users. The analysisconcerns leading users to potential sightseeing resources asshown in Table IV.
Table IV shows that the number of check-ins per entertain-ment at the Waseda Festival was 2.3 (= 136/58) and the numberof check-ins per potential sightseeing resource was 8.9 (=89/10). This indicates that WaseNavi was effective in leadingusers to potential sightseeing resources. There are variousreasons why the number of check-ins per potential sightseeingresource was larger than that for other entertainment events.The main reason is that there was a particular detour at theWaseda Festival and there were many potential sightseeingresources on the detour route. The detour is shown in Fig. 13.The yellow line in Fig. 13 is the detour used in this experiment.This road is the route connecting the following three buildings:
Building No. 5The building housing the “Theater museum” and“The Statue of Syoyo Tubouchi”
Building No. 6The building housing the “Petroleum Gas WellDrilling Bit”
TABLE IVANALYSIS OF POTENTIAL SIGHTSEEING RESOURCES
Categories The number of The number ofcheckpoints (Place) check-ins (Times)
Entertainments 58 136in Waseda FestivalPotential sightseeing resources 10 89
Total 68 228
Fig. 13. Detour route
Building No. 14The building housing “Mr. Yabuno’s Painting inBuilding No. 14”
A total of 11 users (out of the 48 who obtained points) usedthe detour. There was no entertainment and food stands alongthe detour, so it is a street that people usually avoid during theWaseda Festival. Nevertheless, it became possible for users towalk along the street because of WaseNavi and this helpedto reduce congestion at the festival. It was also possible tocheck-in at four potential sightseeing resources when using thedetour route. Thus, WaseNavi was effective in leading usersto potential sightseeing resources.
Next, we examine the result of the quizzes presented at eachcheckpoint. The quiz results are shown in Table V. The term“Possibility of correct answer in situ” in the table representsthe proportion of users that could provide the correct answerto a quiz question if they go to the destination because therewere hints provided at the site. Table V shows that despitethe possibility of the correct answer being provided in situat potential sightseeing resources being just 30%, the correctanswer rate is considerably higher at 67.4%. This means thatthe correct answer rate at potential sightseeing resources washigh although many of the quizzes regarding potential sight-seeing resources were difficult. Thus, it is presumed that manyusers were interested in the potential sightseeing resourcesand had made earlier investigations (e.g., Internet searches),evident in their answers to the quizzes regarding the potentialsightseeing resources. The “Statue of Azusa Ono” in Fig. 14is one example of a potential sighting resource that peoplehad shown prior interest in. The answer to the quiz questionregarding the “Statue of Azusa Ono” was not provided at thesite. Nevertheless, 4 of the 5 people who checked-in at the“Statue of Azusa Ono” provided the correct answer. Thus,users were able to voluntarily investigate potential sightseeingresources on the Internet in their attempt to answer the quizzes.
We now examine how the differences in points affectedto the likelihood of users going to the potential sightseeing
TABLE VQUIZZES AT POTENTIAL SIGHTSEEING RESOURCES
Categories Correct possibility Correct answerin situ (%) rate (%)
Entertainments 100 79.7in Waseda FestivalPotential sightseeing resources 30 67.4

Fig. 14. Statue of Azusa Ono
resources. There were 10 potential sightseeing resources, 4of which were worth 6 points and 6 worth 4 points. TableVI shows the analysis results for the number of visits percheckpoints divided by points earned for potential sightseeingresources. From Table VI, we can see that the number ofcheck-ins per checkpoint worth 4 points was 9.67 (= 58/6)and the number of check-ins per checkpoint worth 6 pointswas 7.75 (=31/4). Many studies have pointed out the effectsof non-monetary incentives [7] and gamification [8]. However,in this experiment, it was confirmed that a difference in pointswas not an effective motivation for users. A key reason forthis was that there was other incentive that was more effectivethan points. Thus, it is presumed that certain situations arenecessary for non-monetary incentives and gamification to beeffective.
We now analyze the users’ movements between check-points. The movements between checkpoints are shown inTable VII. Table VII shows that the users tended to go aroundcheckpoints in the same building. Thus, the users had atendency to visit the checkpoints closest to the next destinationwhen they used WaseNavi. Therefore, we need to pay attentionto the positional relationship of checkpoints to promote theevent and lead users to potential sightseeing resources whenusing WaseNavi. In addition, it can be predicted that resourceslocated some distance from other checkpoints will get fewervisitors.
Finally, the earlier assumption that “People who alreadyhave a specific visiting destination stop at potential sightseeingresources if they recognize there are potential sightseeingresources on their way to their destination” is correct. It wasalso found that visits to potential sightseeing resources wereeffectively promoted by our application. Furthermore, therewere heuristic visits to potential tourism resources locatedbetween those sites that were the original purpose of the visit.It was also revealed that visitors who visited the potentialsightseeing resources were actively seeking them. From theviewpoint of the festival operators, guidance to a detour viapotential sightseeing resources produced a noticeable side
TABLE VIANALYSIS OF DIFFERENCE OF POINTS
Earned points (pt) The number of The number ofcheckpoints (Place) check-ins (Times)
4 6 586 4 31
TABLE VIIMOVEMENT BETWEEN CHECKPOINTS
The number of movements between checkpoints (Times) 178The number of movements of the same building number (Times) 71The rate of movement of the same building number (%) 39.9
effect, a reduction in congestion. The application also ledfestival goers to potential sightseeing resources within theuniversity. From the viewpoint of operators, the applicationwas able to provide new value above the traditional attractionsof the school festival.
VII. SUMMARY AND FUTURE CHALLENGES
In this study, we developed WaseNavi, an application thatleads users to potential sightseeing resources within an existingevent. Via our experiment, we showed that WaseNavi iseffective in leading users to potential sightseeing resources.We also showed that the application succeeded in creating adetour and it is effective in easing congestion at busy events.Furthermore, we analyzed the motivation pattern of users’behaviors. As a result, it became clear that the users did notparticipate in the walk rally to gain more points but insteadtheir emphasis was on the distance from their current location.As a future challenge, rather than displaying checkpoints bycategory, we could do so by distance from the user’s currentlocation. It is predicted that users will find the applicationeasier to use after such improvements. Furthermore, becausethis experiment was conducted under the special condition ofa school festival, we need to perform the experiment in a town,representing a more practical stage.
ACKNOWLEDGMENT
This research was supported by the foundation for theFusion Of Science and Technology (FOST) in Japan. Alsowe would like to Waseda Festival staffs for carrying out theexperiment.
REFERENCES
[1] World Tourism Organization UNWTO. Retrieved March 25, 2016 fromhttp://www2.unwto.org/
[2] N. Tintarev, A. Flores and X. Amatriain,“Off the Beaten Track - a MobileField Study Exploring the Long Tail of Tourist Recommendations,” inProc. of the 12th Conf. on Human-Computer Interaction with MobileDevices and Services, Mobile HCI 2010, pp. 209-218.
[3] K. Cheverst, N. Davies, K. Mitchell, A. Friday and C. Efstratiou,“ Developing a context-aware electronic tourist Guide: Some issues andexperiences,” in Proc. of the SIGCHI Conf. on Human Factors inComputing Systems, CHI 2000, pp. 17-24.
[4] B. Brown, M. McGregor and E. Laurier,“ iPhone in vivo: Video analysisof mobile device use,” in Proc. of the SIGCHI Conf. on Human Factorsin Computing Systems , CHI 2013, pp. 1031-1040.
[5] Y. Kinoshita, S. Tsukanaka and K. Go,“Strolling with street atmospherevisualization: Development of a tourist support system,” in CHI 2013Extended Abstracts on Human Factors in Computing Systems, pp. 553-558.
[6] D. Batory and S. O’Malley,“The design and implementation of hierarchi-cal software systems with reusable components,” in ACM Transactionson Software Engineering and Methodology (TOSEM), ACM 1992, pp.355-398.
[7] Y. Ueyama, M. Tamai, Y. Arakawa and K. Yasumoto,“ Gamification-Based incentive mechanism for participatory sensing,” in Perva-sive Computing and Communications Workshops (PERCOM Workshops),2014 IEEE International Conference, pp.98-103.
[8] K. Seaborn and D. I. Fels,“Gamification in theory and action: A survey,”Int. J. of Human-Computer Stud., vol. 74, pp.14-31, 2015.
[9] Google Map. Retrieved March 19, 2016 fromhttps://www.google.co.jp/maps
Related Documents