A VERIFIED CARBON STANDARD (VCS) VERSION 3, PROJECT DESCRIPTION (PD) AVOIDING UNPLANNED DEFORESTATION AND ENHANCING CARBON STOCK IN MERU BETIRI NATIONAL PARK, EAST JAVA, INDONESIA By Carbon and Environmental (CER) Indonesia, and Center for Climate Change and Policy Research and Development Published By Center for Climate Change and Policy Research and Development Forestry Research and Development Agency Ministry of Forestry, Indonesia In Cooperation with International Tropical Timber Organization (ITTO) Bogor, 2015

Welcome message from author
This document is posted to help you gain knowledge. Please leave a comment to let me know what you think about it! Share it to your friends and learn new things together.
Transcript
A VERIFIED CARBON STANDARD (VCS) VERSION 3,
PROJECT DESCRIPTION (PD)
AVOIDING UNPLANNED DEFORESTATION AND
ENHANCING CARBON STOCK IN
MERU BETIRI NATIONAL PARK,
EAST JAVA, INDONESIA
By
Carbon and Environmental (CER) Indonesia, and
Center for Climate Change and Policy Research and Development
Published By
Center for Climate Change and Policy Research and Development
Forestry Research and Development Agency
Ministry of Forestry, Indonesia
In Cooperation with
International Tropical Timber Organization (ITTO)
Bogor, 2015

PROJECT DESCRIPTION: VCS Version 3
ii
A VERIFIED CARBON STANDARD (VCS)_VERSION 3, PROJECT
DESCRIPTION (PD): AVOIDING UNPLANNED DEFORESTATION
AND ENHANCING CARBON STOCK IN MERU BETIRI NATIONAL
PARK, EAST JAVA, INDONESIA
ISBN: 978-602-7672-31-3
Technical Report No 28, January 2015
By. Carbon and Environmental (CER) Indonesia, and Center for Climate Change and Policy
Research and Development
This Report of Activity Is a Part of Program ITTO PD 519/08 Rev.1 (F): Tropical Forest
Conservation for Reducing Emissions From Deforestation and Forest Degradation and
Enhancing Carbon Stocks in Meru Betiri National Park, Indonesia.
Collaboration Between:
Center for Climate Change and Policy Research and Development (Pusat Penelitian dan
Pengembangan Perubahan Iklim dan Kebijakan)
Jl. Gunung Batu No. 5 Bogor West Java Indonesia
Phone: +62-251-8633944
Fax: +62-251-8634924
Email: [email protected]
Website: www.puspijak.org
LATIN – the Indonesian Tropical Institute
Jl. Sutera No. 1 Situgede Bogor West Java Indonesia
Phone: +62-251-8425522/8425523
Fax: +62-251-8626593
Email: [email protected]
Website: www.latin.or.id
Meru Betiri National Park, Ministry of Forestry
Jalan Siriwijaya 53, Jember, East Java, Indonesia
Phone: +62-331-335535
Fax: +62-331-335535
Email: [email protected]
Website: www.merubetiri.com
This work is copyright © 2015
Published by:
Center for Climate Change and Policy Research and Development- ITTO PD 519/08 Rev.1 (F).
Jl. Gunung Batu No. 5 Bogor 16610
Phone/Fax: +62-251-8633944
Email: [email protected]
Web site: www.puspijak.org

PROJECT DESCRIPTION: VCS Version 3
iii
Table of Contents
1 Project Details ............................................................................................................... 1
1.1 Summary Description of the Project ..................................................................... 1
1.2 Sectoral Scope and Project Type ........................................................................... 2
1.3 Project Proponent .................................................................................................. 2
1.4 Other Entities Involved in the Project ................................................................... 3
1.5 Project Start Date .................................................................................................. 3
1.6 Project Crediting Period ........................................................................................ 3
1.7 Project Scale and Estimated GHG Emission Reductions or Removals ................. 3
1.8 Description of the Project Activity ........................................................................ 4
1.9 Project Location .................................................................................................... 5
1.10 Conditions Prior to Project Initiation ................................................................ 6
1.11 Compliance with Laws, Statutes and Other Regulatory Frameworks ............... 7
1.12 Ownership and Other Programs ........................................................................ 8
1.12.1 Proof of Title ............................................................................................ 8
1.12.2 Emissions Trading Programs and Other Binding Limits ......................... 9
1.12.3 Participation under Other GHG Programs ............................................... 9
1.12.4 Other Forms of Environmental Credit ..................................................... 9
1.12.5 Projects Rejected by Other GHG Programs ............................................. 9
1.13 Additional Information Relevant to the Project ................................................ 9
2 Application of Methodology ........................................................................................14
2.1 Title and Reference of Methodology ...................................................................14
2.2 Applicability of Methodology ..............................................................................14
2.3 Project Boundary ..................................................................................................15
2.4 Baseline Scenario .................................................................................................17
2.5 Additionality ........................................................................................................22
2.6 Methodology Deviations ......................................................................................25
3 Quantification of GHG Emission Reductions and Removals ......................................26
3.1 Baseline Emissions...............................................................................................26
3.2 Project Emissions .................................................................................................31
3.3 Leakage ................................................................................................................34
3.4 Summary of GHG Emission Reductions and Removals ......................................34
4 Monitoring ...................................................................................................................36
4.1 Data and Parameters Available at Validation .......................................................36
4.2 Data and Parameters Monitored ...........................................................................37
4.3 Description of the Monitoring Plan ......................................................................38
5 Environmental Impact ..................................................................................................41
6 Stakeholder Comments ................................................................................................41
Appendix 1. Detailed proposed project activities ..................................................................46
Appendix 2. Flora in Meru Betiri National Park ..................................................................51
Appendix 3. Minister of Forestry‘s decree No. 277/Kpts-VI/1997 on Designation of Meru
Betiri as National Park ...........................................................................................................53
Appendix 4. Sample of MoU between MBNP Authority and farmer groups regarding
REDD+ and utilization of rehabilitation zone .......................................................................56
Appendix 5. Report of Gerakan Rehabilitasi Lahan dan Hutan (GERHAN) or Forest and
Land Rehabilitation Movement in East Java .........................................................................59

PROJECT DESCRIPTION: VCS Version 3
1
1 PROJECT DETAILS
1.1 Summary Description of the Project
Meru Betiri National Park area is located in Jember and Banyuwangi districts. Originally, it
was assigned as a wildlife reserve to protect the endangered species of Panthera tigris
sondaica (Javan Tiger/Harimau Jawa). The National Park covers an area of ± 52,681 ha1
consist of various land types such as mountainous, hilly areas, lowland areas, coastal, and
mangrove. The National Park has tropical rainforest ecosystem and is rich in biodiversity
(more than 500 identified plant species). It is divided into five designated zones, namely
core zone, intact forest zone, utilization zone, rehabilitation zone, and buffer zone.
The project activity aims to avoid unplanned deforestation and enhance carbon stock within
the Meru Betiri National Park area. In order to achieve it, planting activities inside the
rehabilitation zone will be conducted. Meanwhile, activities aimed to improve economic
condition of local community will be implemented outside the rehabilitation zone as a way
to support the sustainability of the planting activity.
Implementation of the project will involve various stakeholders, e.g. local community,
NGOs, local government, the Ministry of Forestry, as well as ITTO for support in
development of project design.
A study conducted by NGO KAIL in March-July 2012 classified tree density in the
rehabilitation zone into six categories (Table 1). The planting activity has been targeted to
reach the type 5 tree densitysince it is the one considered as providing highest economic
benefits to local community.
Table 1. Categorization of tree density in MNBP’s rehabilitation zone
Type Number of Trees/ha Description
Type 1 0 No trees, only food crops
Type 2 < 50 A few trees + food crops
Type 3 51 – 100 Rather dense + food crops
Type 4 101 – 150 Dense + food crops
Type 5 151 – 200 Dense + herbal/medicinal crops
Type 6 > 200 Dense, no crops
Trees to be planted in the project area are Petai (Parkia spaciosa), Durian (Durio
zibethinus), Avocado (Persea americana), Melinjo (Gnetum gnemon), Jackfruit (Artocarpus
1There are several versions of MBNP’s total area. The Ministry of Forestry Decree No. 277/Kpts-VI/1997
stated total area 58,000 ha (including waters and the current enclave area). The numberused in this document is a result of recalculation process on MBNP 2010 satellite image—excluding waters and enclave area—, which was done in collaboration between CERIndonesia and the Forest Research and Development Agency. Objective of the recalculation was to get an updated data.

PROJECT DESCRIPTION: VCS Version 3
2
heterophilus), and Pakem (Pangium edule). Selection of trees is based on discussions with
stakeholders especially the local community.
1.2 Sectoral Scope and Project Type
Scope of the project is to avoid unplanned deforestation (AUD) and enhance carbon stocks
of forests that would otherwise be deforested. The project is a single project (not a grouped
project).Illustration of the project scope is presented in Figure 1 below.
Figure 1. Illustration of project scope
1.3 Project Proponent
Proponents of the proposed project are listed below
Name of Entity(s) Roles and Responsibilities
1. The authority of Balai Taman
Nasional Meru Betiri, hereafter
called MBNP
Main project proponent.
Responsible for: (i) coordinating all project participants in
the implementation of project activities, (ii) managing
project activities, (iii) implementing carbon measurement
and reporting, (iv) managing project verification process,
and (v) distributing benefit from project activities
2. Non-Government Organization:
LATIN and its local
representative organization
(KAIL)
Responsible for (i) assisting MBNP in designing project
activities and addressing permanence and displacement of
emission, (ii) facilitating community in implementing
project activities and managementof leakage
3. Farmer Groups working in the
rehabilitation area; many are
inactive) hereafter referred to as
Kelompok Tani Rehabilitasi
(KTR2)
Responsible for implementing project activities
2Note: In each of five villages there has been KTR (Kelompok Tani Rehabilitasi – Rehabilitation Farmers
Group) and SPKP (Sentra Penyuluhan Kehutanan Pedesaan – Rural Forestry Extensions Center). KTR was initiated by community and KAIL, while SPKP was established by MBNP Authority. Both groups aim to rehabilitate the degraded forest and increase the income of local communities.

PROJECT DESCRIPTION: VCS Version 3
3
4. ITTO and Seven and i Holdings
Company
Project Investors
5. FORDA (Forestry Research and
Development Agency) –
Ministry of Forestry
Responsible for coordinating the research needed in
development of PDD
1.4 Other Entities Involved in the Project
The district governments of Jember and Banyuwangi will be involved in wider scope of the
project, such as in the following aspects:
- Assistance for farmers to gain market access for their agroforestry products (both raw
material and processed one)
- Field assistance or extensions to empower local community (e.g. cultivation,
establishment of cooperative, etc.)
- Improvement of public facilities, namely quality of roads and public transport for
villages located in remote areas
- Assistance for farmers to gain access for initial investment if they want to expand their
agroforestry business
1.5 Project Start Date
The project was started on January 1st, 2010.
1.6 Project Crediting Period
The crediting period is 20 years starting from January 1st 2010 to December 31
st2030.
1.7 Project Scale and Estimated GHG Emission Reductions or Removals
The project is estimated to generate annual GHG emission reductions or removals of less
than 1,000,000 t CO2e during the project crediting period, therefore the project scale is
―Project‖. See Table 1 for a more detailed information.
Project X
Mega-project
Estimated GHG emission reductions or removals were calculated from (i) reduced emission
as a result of the reduction of deforestation rate, and (ii) GHG removals from carbon stock
enhancement activities. The two aspects were calculated separately then cumulated in final
calculation.
PROJECT DESCRIPTION: VCS Version 3
4
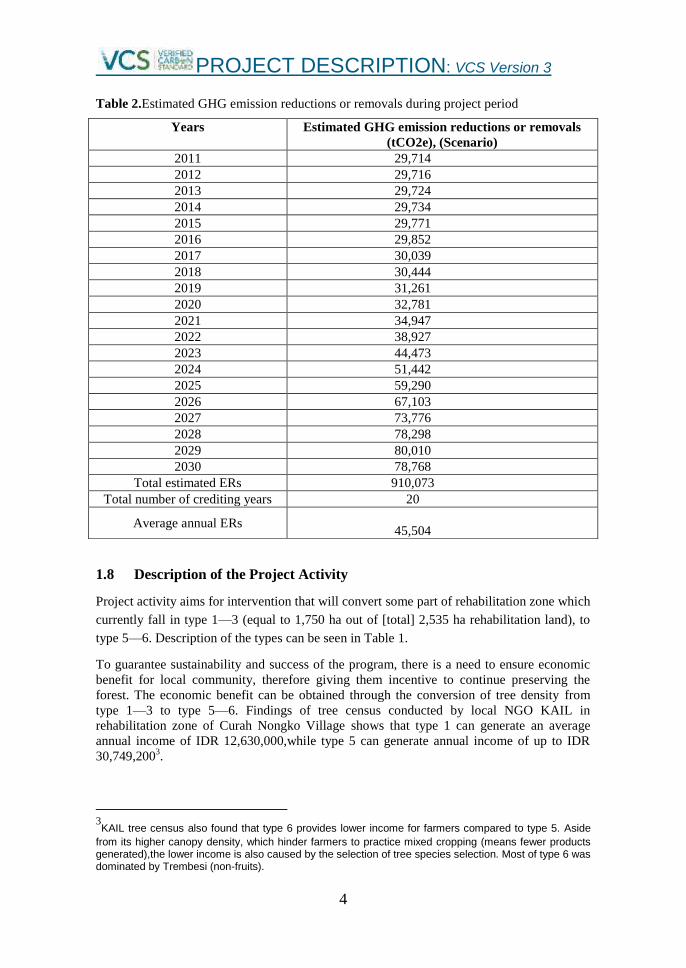
Table 2.Estimated GHG emission reductions or removals during project period
1.8 Description of the Project Activity
Project activity aims for intervention that will convert some part of rehabilitation zone which
currently fall in type 1—3 (equal to 1,750 ha out of [total] 2,535 ha rehabilitation land), to
type 5—6. Description of the types can be seen in Table 1.
To guarantee sustainability and success of the program, there is a need to ensure economic
benefit for local community, therefore giving them incentive to continue preserving the
forest. The economic benefit can be obtained through the conversion of tree density from
type 1—3 to type 5—6. Findings of tree census conducted by local NGO KAIL in
rehabilitation zone of Curah Nongko Village shows that type 1 can generate an average
annual income of IDR 12,630,000,while type 5 can generate annual income of up to IDR
30,749,2003.
3KAIL tree census also found that type 6 provides lower income for farmers compared to type 5. Aside
from its higher canopy density, which hinder farmers to practice mixed cropping (means fewer products generated),the lower income is also caused by the selection of tree species selection. Most of type 6 was dominated by Trembesi (non-fruits).
Years Estimated GHG emission reductions or removals
(tCO2e), (Scenario)
2011 29,714
2012 29,716
2013 29,724
2014 29,734
2015 29,771
2016 29,852
2017 30,039
2018 30,444
2019 31,261
2020 32,781
2021 34,947
2022 38,927
2023 44,473
2024 51,442
2025 59,290
2026 67,103
2027 73,776
2028 78,298
2029 80,010
2030 78,768
Total estimated ERs 910,073
Total number of crediting years 20
Average annual ERs
45,504

PROJECT DESCRIPTION: VCS Version 3
5
To achieve its objective, the project will utilize strategies as presented in Figure 2 below
Figure 2.Proposed project’s strategy.
There are three important actors within this strategy: local community, local NGO, and
MBNP authority. Local community plays role in on-site rehabilitation, local NGO plays
assistance role, and MBNP Authority plays monitoring and supporting role. To ensure
sustainability of the rehabilitation activity, economic based activities related to non-timber
forest products will be embedded in it to secure economic benefit for local community in the
long term.
1.9 Project Location
Project activities are located in Meru Betiri National Park, geographically located at 113o 38'
38" – 113o 58' 30" East and 8
o 20' 48" – 8
o 33' 48" South. The area lies in Jember and
Banyuwangi districts, East Java Province .
PROJECT DESCRIPTION: VCS Version 3
6
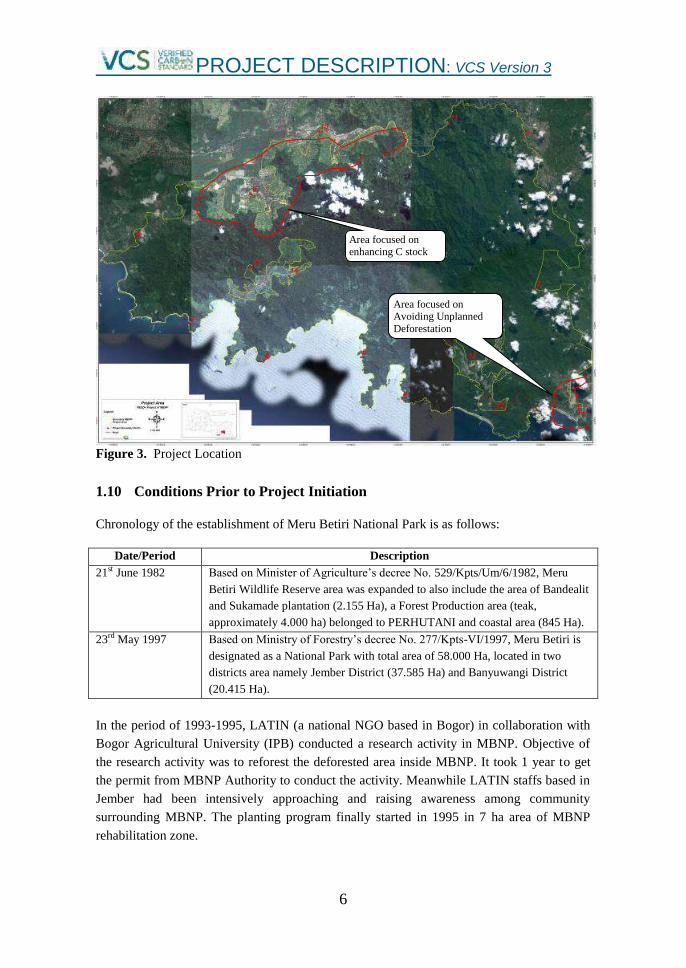
Figure 3. Project Location
1.10 Conditions Prior to Project Initiation
Chronology of the establishment of Meru Betiri National Park is as follows:
Date/Period Description
21st June 1982 Based on Minister of Agriculture‘s decree No. 529/Kpts/Um/6/1982, Meru
Betiri Wildlife Reserve area was expanded to also include the area of Bandealit
and Sukamade plantation (2.155 Ha), a Forest Production area (teak,
approximately 4.000 ha) belonged to PERHUTANI and coastal area (845 Ha).
23rd May 1997 Based on Ministry of Forestry‘s decree No. 277/Kpts-VI/1997, Meru Betiri is
designated as a National Park with total area of 58.000 Ha, located in two
districts area namely Jember District (37.585 Ha) and Banyuwangi District
(20.415 Ha).
In the period of 1993-1995, LATIN (a national NGO based in Bogor) in collaboration with
Bogor Agricultural University (IPB) conducted a research activity in MBNP. Objective of
the research activity was to reforest the deforested area inside MBNP. It took 1 year to get
the permit from MBNP Authority to conduct the activity. Meanwhile LATIN staffs based in
Jember had been intensively approaching and raising awareness among community
surrounding MBNP. The planting program finally started in 1995 in 7 ha area of MBNP
rehabilitation zone.
Area focused on enhancing C stock
Area focused on Avoiding Unplanned
Deforestation

PROJECT DESCRIPTION: VCS Version 3
7
The National Park experienced loss during political transition period in 1998. At the time,
teak looting occurred, conducted not only by local inhabitants but also outsiders. The loss
caused changes when later on the formerly teak forest was converted into agroforestry.
According to the methodology applied for the project, the changes can be considered as
―temporary un-stock‖.
Another major threat faced by MBNP is deforestation caused by farmers who live in five
villages along the national park‘s border (Wonoasri, Curah Nongko, Andongrejo, Sanenrejo
dan Curah Takir), where rehabilitation zone exists. A significant number of farmers (4,664
persons) turned piece of land (in average 0.25 ha/farmer) inside the rehabilitation zone into
agroforestry. They also harvest forest products to generate additional income. Other threat
comes from local villagers who illegally harvest from MBNP for housing or firewood. This
activity creates area within MBNP (mostly in the rehabilitation zone), which can be
categorized as ―temporary un-stock‖.
1.11 Compliance with Laws, Statutes and Other Regulatory Frameworks
The following table provide list of regulatory framework for implementation of the proposed
REDD project.
Policy/ Regulation Description
Act Number 5/1990 Conservation of Natural Resources and the Ecosystems
Act Number 6/1994 Ratification of the United Nations Framework Convention on
Climate Change
Act Number 41/1999 Forestry
Act Number 17/2004 Ratification of the Kyoto Protocol to the United Nations
Framework Convention on Climate Change
Government Regulation No 6/2007 Forest and Forest Management Planning, and Forest Utilization
Government Regulation No 3/2008 Amendment of Government Regulation No 6 of 2007 on Forest,
Forest Management Planning, and Forest Utilization
Government Regulation No
28/2011
Management of Conservation area. Particularly on utilization on
non timber forest products
Minister of Forestry
RegulationP.20/Menhut-II/2012
Implementation of the Forest Carbon Trading Project
Directorate General Forest
Protection and Nature
Conservation (PHKA) Regulation
No. P.7/IV-Set/2012
Application and assessment procedures for registration and
organization of DA REDD+ in conservation area
During the early stage of the project, there was hesitancy from MNBP to include community
in it, especially in implementing the planting activity within conservation area. As formerly
no planting activity was allowed to take place in conservation area. However, the rule has
been revised and replaced by Government Regulation No. 28 of 2011 on Management of
Conservation Area.
PROJECT DESCRIPTION: VCS Version 3
8
Important points on Government Regulation No. 28 of 2011that support the implementation
of the proposed REDD project are:
Chapter 1, article 1, paragraph 9;
National Park is Conservation area which has the native ecosystem, managed by zoning
system designated for the purpose of research, science, education, support cultivation,
tourism, and recreation.
Chapter 2, article 4, paragraph 2;
Conservation area consists of: (a) National Park, (b) Forest Park (c) Nature Parks
Chapter 3, article 12;
The Conservation area such as national park is managed by central Government by
establishing Management Unit under Ministry of Forestry.
Chapter 3
Article 13;
Activities on the Conservation area include: (a) Planning, (b) Protection, (c)
Preservation, (d) utilization, (e) Evaluation of functionalities.
Article 25
Preservation activities include: (a) management of plant and animal and their habitat,
(b) establishment of wildlife corridors, (c) ecosystem restoration, (d) area closing.
Article 29
Point (2): Ecosystem Restoration activities include: (a) Nature mechanism, (b)
Rehabilitation, (c) Restoration.
Point (4): Rehabilitation activity is implemented by planting and enrichment of native
species.
Point (5): Restoration activity is implemented by maintaining, protecting, planting, and
enriching native species, as well as animal.
Article 35:
Point (c) National Park is feasible for Carbon storage and sequestration activities
Based on the abovementioned points, it is clear that implementation of the proposed project
is applicable for conservation area such as MBNP.
1.12 Ownership and Other Programs
1.12.1 Proof of Title
The land status of the project area is National Park which is controlled and managed by
Ministry of Forestry (MoFor). The MoFor assigned ―National Park Office‖ (Balai Taman
Nasional) to manage the national park. Meru Betiri National Park has been officially
established since 1997 by regulation ―SK Menteri Kehutanan No. 277/Kpts-VI/1997‖, and
automatically at the same time Meru Betiri National Park Office has been established.
Please see separated file titled: TN Meru Betiri.pdf for copy of the regulation.
Meru Betiri National Park Office will be the main Proponent holding the permit for the
REDD implementation project in Meru Betiri National Park. Local community surrounding
the project area who represented by ―Kelompok Tani Rehabiltasi‖ (farmer groups) will be
involved as an active project participants who take care of all the trees, and monitor the
planting and maintenance implementations. The Memorandum of Understanding between
Meru Betiri National Park Office and Kelompok Tani Rehabilitasi about the implementation

PROJECT DESCRIPTION: VCS Version 3
9
of REDD+ project which involves local farmer groups was signed in 2012. Please see
Appendix 4.
1.12.2 Emissions Trading Programs and Other Binding Limits
Based on the Ministry of Forestry Regulation No. 20/Menhut-II/2012 article 8 point 5, 51%
of GHG emission reductions or removals generated by the project will be used to for
national target needs, the remaining 49% can be traded to foreign country. The project
proponent has options to sell the carbon credit to domestic buyer or international buyer.
1.12.3 Participation under Other GHG Programs
The project will only be registered under VCS standard.
1.12.4 Other Forms of Environmental Credit
The project will only follow and registered to VCS standard.
1.12.5 Projects Rejected by Other GHG Programs
The project has not been registered to other forest carbon standard. The project will only be
registered under VCS standard.
1.13 Additional Information Relevant to the Project Leakage Management
N.A

PROJECT DESCRIPTION: VCS Version 3
10
Figure 4.Historical deforestation rate in MBNP
Based on the data presented in Figure 4 which consistently shows a decreased trend, it is
predicted that there will be no leakage occurs during REDD implementation. Moreover, the
fact that rehabilitation zone belongs to MBNP Authority and the local community is granted
special permission to utilize it, will prevent local community to do deforestation. In addition
to strict law regarding deforestation, the community will lost their permit in rehabilitation
zone.
Other reasons that support the projection are:
a. Based on a report from the MBNP Authority and input from local NGO KAIL, it was
discovered that after involving local community in reforesting and maintaining
rehabilitation zone, deforestation rate in MBNP is decreasing. Since implementation of
the REDDproject will provide economic benefit to local community from harvesting
and selling of non timber forest products or mainly fruits, it will provide incentive for
them to keep the sustainability of forest.
1997 2001 2008
1995 formation of farmer group for rehabilitating 7 ha of TNMB lands for giving land access to community and protect forest (LATIN)
2011
Deforestation rate (ha/yr)
24
129
107
31
In the period of 1997-2002, rapid deforestation was happened in reformation era. In 1999 TNMB asked LATIN to establish farmer groups (KHTR) for forest rehabilitation in all villages (except Wonoasri)
Establishment of Farmer Groups Networks in all villages: Jaketresi (Jaringan Kelompok Tani Rehabilitasi Lahan) in Curah Nongko, Permataresi (Persatuan Masyarakat Tani Rehabilitasi) in Andongrejo, Papanresi (Panguyuban Petani Pengolah Lahan Rehabilitasi), SPKP (Sentra
Penyuluh Kehutanan Pedesaan) in Sanenrejo, and Organisasi Petani Rehabilitasi Wonomulyo (OPR Wonomulyo) in Wonoasri
Reference period

PROJECT DESCRIPTION: VCS Version 3
11
b. Based on the interview at community level (with Head of Wonoasri Village and
Secretary of Sanenrejo Village) and assessment of land topography, it was found that it
is difficult to shift the agriculture activities to other forestland area since the remaining
forestland is located at extreme topography (> 400).
c. Other possibility is shifting the agriculture activities to forest area behind the hill, which
is quite far and should be done in-group, otherwise the wild animal will destroy the new
opened farm. In such case the cost to cultivate this land is very high and the agricultural
activity will not be profitable anymore. It will discourage people to shift their
agriculture activities to other forest area.
d. The commodities cultivated by the farmers are regular food crop and not having a huge
amount of market demand. Therefore the possibilities of having this agriculture
activities shifted somewhere else is quite small since there is no market driven.
Thus, based on the abovementioned considerations, leakage management is not needed for
the proposed REDD Project.
Commercially Sensitive Information
During discussions with local villagers, the use of ―carbon trading‖ or ―REDD-type
ofproject‖ terms was consciously avoided. It is intended to avoid creating ―project
mentality‖ among villagers which will cause the tree planting will mainly be driven by the
urge to get money.
Moreover, there is no guarantee that the carbon credit generated from this project will
generate money due to uncertainty in demand for carbon credits generated from such
projects.
However, MBNP Authority and local NGO KAIL have socialized the basic concept of
carbon trading mechanism and REDD (reducing emission from deforestation, reducing
emission from forest degradation, improving forest carbon stock, and conserving forest
carbon stock) during their communication and assistance with local community prior to
project‘s initiative.
We consider this approach as not violating Free Prior Informed Consent Principle.
Moreover, the fact that local communities are granted with opportunity to manage
agroforestry inside MBNP rehabilitation zone to get additional income is an incentive on its
own.
Further Information
Even though there is no leakage projected in the future, there are some activities that
potentially lead to forest degradation that possibly occur despite project implementation. It is
because local communities need the resources and livelihood for everyday living. Therefore,
it is important to think and be prepared with some supported program—as mitigation effort.
PROJECT DESCRIPTION: VCS Version 3
12
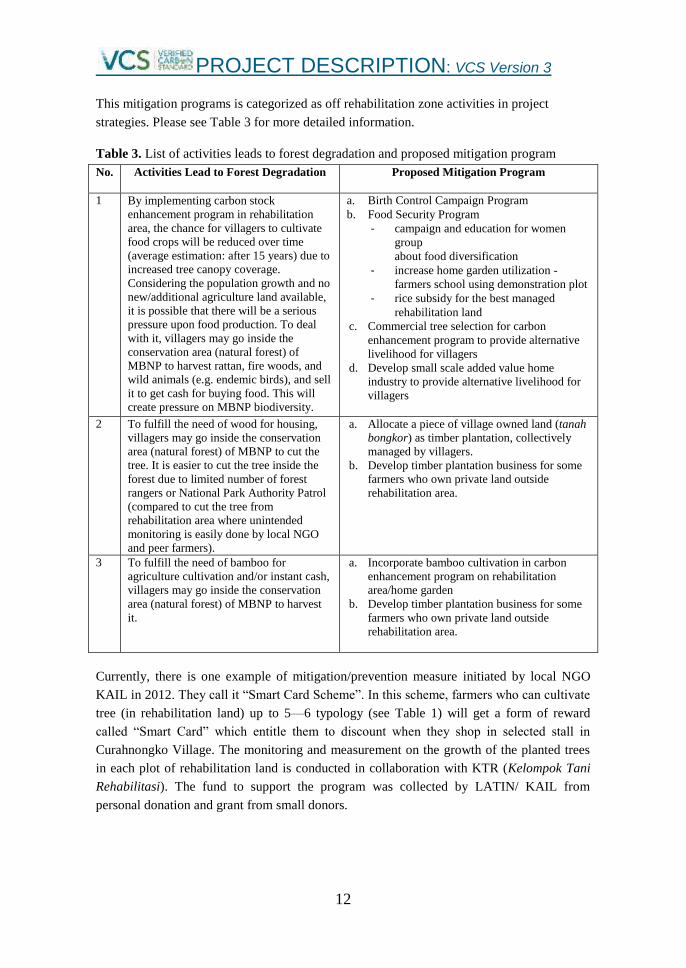
This mitigation programs is categorized as off rehabilitation zone activities in project
strategies. Please see Table 3 for more detailed information.
Table 3. List of activities leads to forest degradation and proposed mitigation program
No.
Activities Lead to Forest Degradation Proposed Mitigation Program
1 By implementing carbon stock
enhancement program in rehabilitation
area, the chance for villagers to cultivate
food crops will be reduced over time
(average estimation: after 15 years) due to
increased tree canopy coverage.
Considering the population growth and no
new/additional agriculture land available,
it is possible that there will be a serious
pressure upon food production. To deal
with it, villagers may go inside the
conservation area (natural forest) of
MBNP to harvest rattan, fire woods, and
wild animals (e.g. endemic birds), and sell
it to get cash for buying food. This will
create pressure on MBNP biodiversity.
a. Birth Control Campaign Program
b. Food Security Program
- campaign and education for women
group
about food diversification
- increase home garden utilization -
farmers school using demonstration plot
- rice subsidy for the best managed
rehabilitation land
c. Commercial tree selection for carbon
enhancement program to provide alternative
livelihood for villagers
d. Develop small scale added value home
industry to provide alternative livelihood for
villagers
2 To fulfill the need of wood for housing,
villagers may go inside the conservation
area (natural forest) of MBNP to cut the
tree. It is easier to cut the tree inside the
forest due to limited number of forest
rangers or National Park Authority Patrol
(compared to cut the tree from
rehabilitation area where unintended
monitoring is easily done by local NGO
and peer farmers).
a. Allocate a piece of village owned land (tanah
bongkor) as timber plantation, collectively
managed by villagers.
b. Develop timber plantation business for some
farmers who own private land outside
rehabilitation area.
3 To fulfill the need of bamboo for
agriculture cultivation and/or instant cash,
villagers may go inside the conservation
area (natural forest) of MBNP to harvest
it.
a. Incorporate bamboo cultivation in carbon
enhancement program on rehabilitation
area/home garden
b. Develop timber plantation business for some
farmers who own private land outside
rehabilitation area.
Currently, there is one example of mitigation/prevention measure initiated by local NGO
KAIL in 2012. They call it ―Smart Card Scheme‖. In this scheme, farmers who can cultivate
tree (in rehabilitation land) up to 5—6 typology (see Table 1) will get a form of reward
called ―Smart Card‖ which entitle them to discount when they shop in selected stall in
Curahnongko Village. The monitoring and measurement on the growth of the planted trees
in each plot of rehabilitation land is conducted in collaboration with KTR (Kelompok Tani
Rehabilitasi). The fund to support the program was collected by LATIN/ KAIL from
personal donation and grant from small donors.
PROJECT DESCRIPTION: VCS Version 3
13
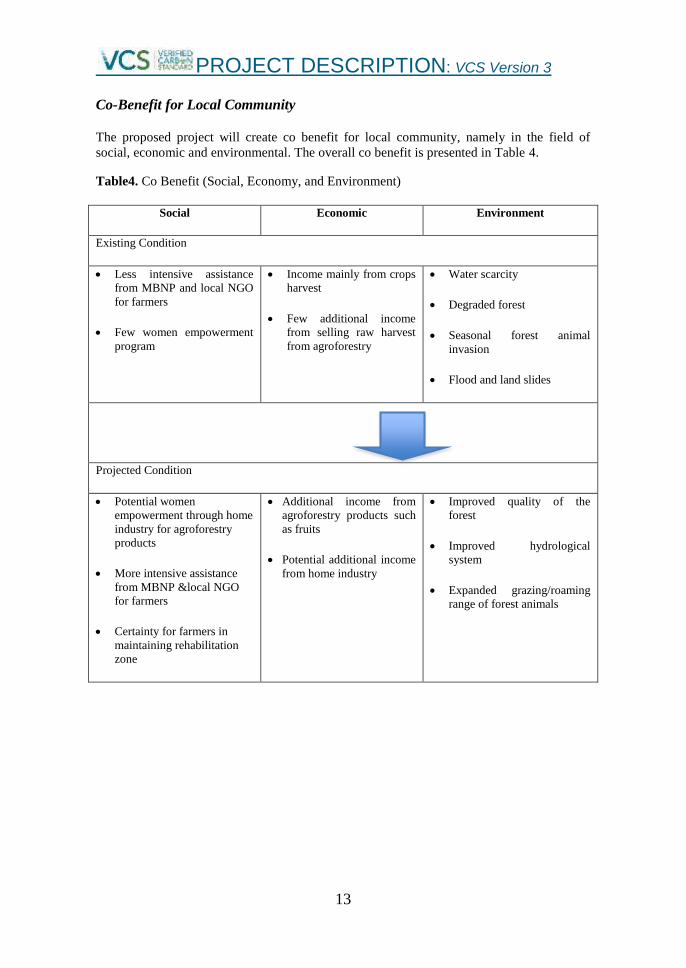
Co-Benefit for Local Community
The proposed project will create co benefit for local community, namely in the field of
social, economic and environmental. The overall co benefit is presented in Table 4.
Table4. Co Benefit (Social, Economy, and Environment)
Social Economic Environment
Existing Condition
Less intensive assistance
from MBNP and local NGO
for farmers
Few women empowerment
program
Income mainly from crops
harvest
Few additional income
from selling raw harvest
from agroforestry
Water scarcity
Degraded forest
Seasonal forest animal
invasion
Flood and land slides
Projected Condition
Potential women
empowerment through home
industry for agroforestry
products
More intensive assistance
from MBNP &local NGO
for farmers
Certainty for farmers in
maintaining rehabilitation
zone
Additional income from
agroforestry products such
as fruits
Potential additional income
from home industry
Improved quality of the
forest
Improved hydrological
system
Expanded grazing/roaming
range of forest animals

PROJECT DESCRIPTION: VCS Version 3
14
2 APPLICATION OF METHODOLOGY
2.1 Title and Reference of Methodology
Approved VCS Methodology VM0015 Version 1.0, Sectoral Scope 14: Methodology for
Avoided Unplanned Deforestation.
2.2 Applicability of Methodology
This project applies VCS Methodology VM0015 Version 1.0 since it gives option to
consider the effort in avoiding unplanned deforestation and carbon stock enhancements in
MBNParea that otherwise would be deforested. However, credits for reducing GHG
emissions from avoided degradation are excluded from the calculation. Only credits for
forest carbon stock enhancement will be calculated.
The methodology has no geographic restrictions and is applicable globally under the several
conditions. These conditions and the applicability of the methodology to the MBNP project
are elaborated in Table 5.
Table 5. Applicability of Methodology
Condition Applicability
Baseline activities may include planned or
unplanned logging for timber, fuel wood
collection, charcoal production, agricultural,
and grazing activities as long as the category is
unplanned deforestation according to the most
recent VCS AFOLU requirements.
The project area is within Meru Betiri National
Park which is very restricted for other land use
outside conservation. All activities that lead to
deforestation are illegal and unplanned. Forest
degradation is mostly driven by land clearing
activities for agricultural practices and/or
unplanned timber and other forest products
harvesting.
Project activities may include one or a
combination of eligible categories defined in
the description of the scope of methodology
(Refers to table 1 and figure 2 in Approved
VCS Methodology VM 0015 Version 1.0
Sectoral Scope 14 document).
The project activity is categorized as avoiding
deforestation of degrading forest and increasing
forest carbon stock within the project area.
The project area can include different types of
forest, such as, but not limited to, old-growth
forest, degraded forest, secondary forests,
planted forests and agro-forestry systems
meeting the definition of ―forest‖.
The project area consists of primary forest and
agroforestry which are categorized as forest land.
Indonesia has announced national forest definition
and has submitted it to UNFCCC. According to it,
forest is land with area of>= 0.25 ha, has crown
cover of>= 30% and the average tree height is >= 5
meters.
At project commencement, the project area
shall include only land qualifying as ―forest‖
for a minimum of 10 years prior to the project
start date.
The project area only covers forested land (primary
forest and agroforestry land). The condition of the
project area is qualified as ―forest‖ for 10 years
prior to the project‘s starting date. It was proven by
analysis on 2001 and 2010 satellite images.

PROJECT DESCRIPTION: VCS Version 3
15
Condition Applicability
The project area can include forested wetlands
(such as bottomland forests, floodplain forests,
mangrove forests) as long as they do not grow
on peat. Peat shall be defined as organic soils
with at least 65% organic matter and a
minimum thickness of 50 cm. If the project
area includes a forested wetlands growing on
peat (e.g. peat swamp forests), this
methodology is not applicable.
There is no peat within the project area.
2.3 Project Boundary
Reference region for spatial boundary of the project is following the official boundary of the
Meru Betiri National Park as stated in a publication by The Directorate General for Forest
Planology. Meanwhile, project area refers to the National Park‘s rehabilitation zone within
its conservation area (Figure 5).
Figure 5. Project area
PROJECT DESCRIPTION: VCS Version 3
16
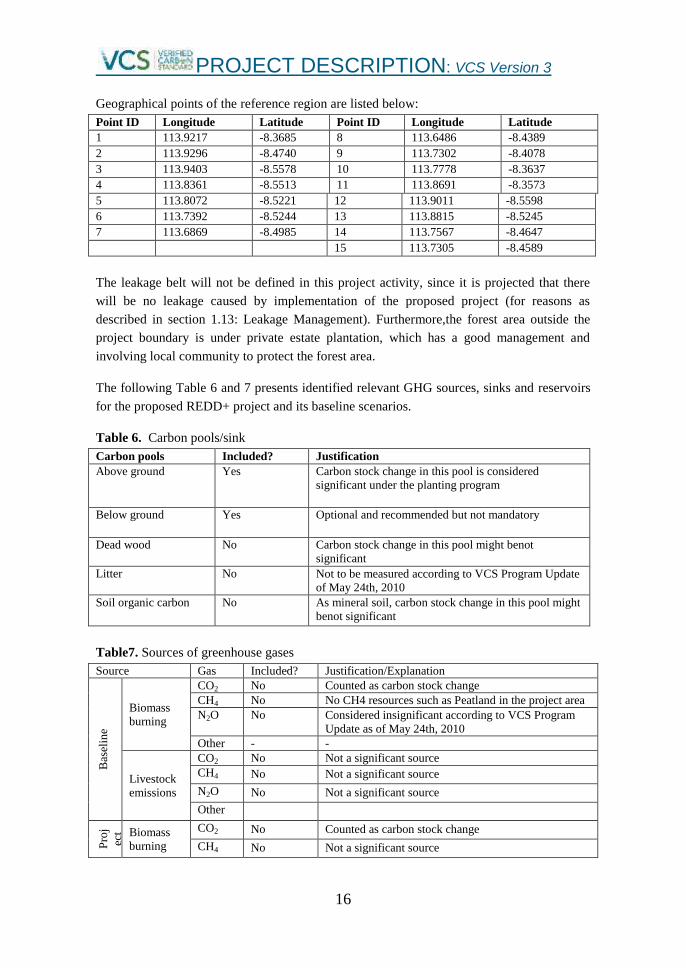
Geographical points of the reference region are listed below:
Point ID Longitude Latitude Point ID Longitude Latitude
1 113.9217 -8.3685 8 113.6486 -8.4389
2 113.9296 -8.4740 9 113.7302 -8.4078
3 113.9403 -8.5578 10 113.7778 -8.3637
4 113.8361 -8.5513 11 113.8691 -8.3573
5 113.8072 -8.5221 12 113.9011 -8.5598
6 113.7392 -8.5244 13 113.8815 -8.5245
7 113.6869 -8.4985 14 113.7567 -8.4647
15 113.7305 -8.4589
The leakage belt will not be defined in this project activity, since it is projected that there
will be no leakage caused by implementation of the proposed project (for reasons as
described in section 1.13: Leakage Management). Furthermore,the forest area outside the
project boundary is under private estate plantation, which has a good management and
involving local community to protect the forest area.
The following Table 6 and 7 presents identified relevant GHG sources, sinks and reservoirs
for the proposed REDD+ project and its baseline scenarios.
Table 6. Carbon pools/sink
Carbon pools Included? Justification
Above ground Yes Carbon stock change in this pool is considered
significant under the planting program
Below ground Yes Optional and recommended but not mandatory
Dead wood No Carbon stock change in this pool might benot
significant
Litter No Not to be measured according to VCS Program Update
of May 24th, 2010
Soil organic carbon No As mineral soil, carbon stock change in this pool might
benot significant
Table7. Sources of greenhouse gases
Source Gas Included? Justification/Explanation
Bas
elin
e
Biomass
burning
CO2 No Counted as carbon stock change
CH4 No No CH4 resources such as Peatland in the project area
N2O No Considered insignificant according to VCS Program
Update as of May 24th, 2010
Other - -
Livestock
emissions
CO2 No Not a significant source
CH4 No Not a significant source
N2O No Not a significant source
Other
Pro
j
ect Biomass
burning
CO2 No Counted as carbon stock change
CH4 No Not a significant source

PROJECT DESCRIPTION: VCS Version 3
17
Source Gas Included? Justification/Explanation
N2O No
Considered insignificant according to VCS Program
Update as of May 24th, 2010
Other
Livestock
emissions
CO2 No Not a significant source
CH4 No Not a significant source
N2O No Not a significant source
Other
2.4 Baseline Scenario
On 1982 MBNP area has been extended to the northern part, covering teak plantation area of
―PERHUTANI‖ (a state-owned timber state company). Based on satellite image data, it is
known that the teak plantation still remains in the beginning of 1997 with total area of
approximately 1,600 ha. Later on, during 1997 to 2001, there were rapid changes: the whole
area of teak plantation was converted to agroforestry. Although there were changes on
vegetation types, the land status still considered as a forest because there are tree-replanting
activities after the teak trees has been logged.
Baseline activities and project activities may include harvesting of timber, fuel-wood
collection and charcoal production. Since many activities related to agriculture expansion
occur in MBNP and give significant effect to deforestation, agriculture activities are
included in the baseline.
Analysis on historical land use and land cover change
Land cover changes has been analyzed on lands with no changes in its category and lands
converted to a new land cover category, as presented in Figure 6 below.
Figure 6. Steps of land cover changes analysis.
Forest Land remaining Forest Land
Land converted to Forest Land
Crop Land remaining Crop Land Land converted to Crop Land
Grassland remaining Grassland Land converted to Grassland
Other Land remaining Other Land
Land converted to Other Land
PROJECT DESCRIPTION: VCS Version 3
18
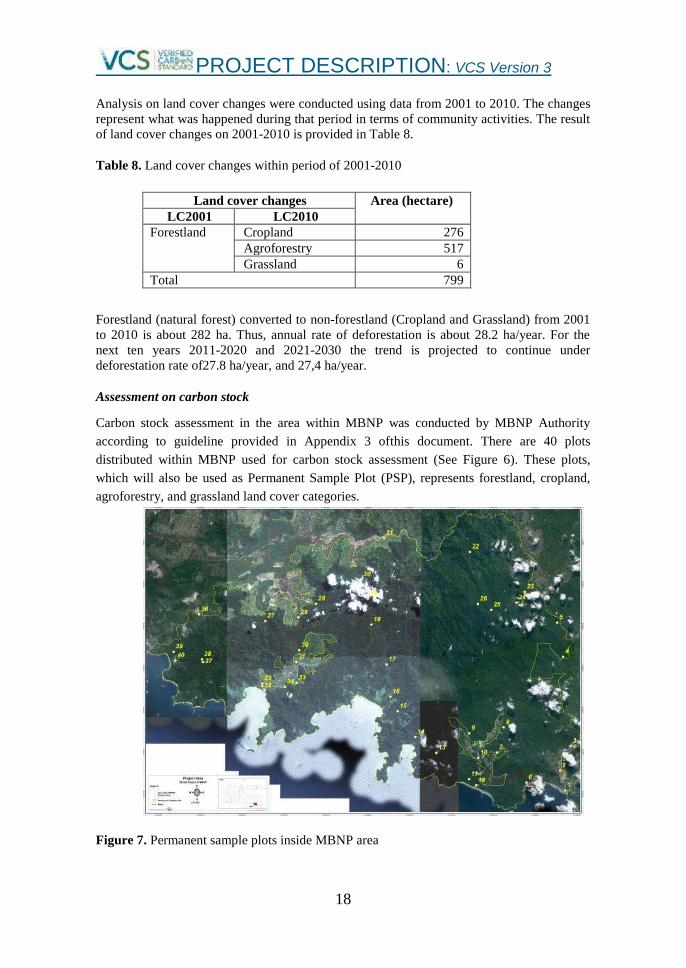
Analysis on land cover changes were conducted using data from 2001 to 2010. The changes
represent what was happened during that period in terms of community activities. The result
of land cover changes on 2001-2010 is provided in Table 8.
Table 8. Land cover changes within period of 2001-2010
Land cover changes Area (hectare)
LC2001 LC2010
Forestland
Cropland 276
Agroforestry 517
Grassland 6
Total 799
Forestland (natural forest) converted to non-forestland (Cropland and Grassland) from 2001
to 2010 is about 282 ha. Thus, annual rate of deforestation is about 28.2 ha/year. For the
next ten years 2011-2020 and 2021-2030 the trend is projected to continue under
deforestation rate of27.8 ha/year, and 27,4 ha/year.
Assessment on carbon stock
Carbon stock assessment in the area within MBNP was conducted by MBNP Authority
according to guideline provided in Appendix 3 ofthis document. There are 40 plots
distributed within MBNP used for carbon stock assessment (See Figure 6). These plots,
which will also be used as Permanent Sample Plot (PSP), represents forestland, cropland,
agroforestry, and grassland land cover categories.
Figure 7. Permanent sample plots inside MBNP area

PROJECT DESCRIPTION: VCS Version 3
19
By following the selected guideline of carbon stock assessment, each land cover category
within MBNP will have carbon stock value as presented in Table 8. These values represent
carbon stock at maximum capacity (it is projected that there will be no significant
increment). The only exception is for agroforestry category, as carbon stock for this category
still have the potential to increase.
Table 9. Carbon stock for each land cover category
The values presented inTable 9 were used in the emission calculation.
Analysis on agents, drivers, and underlying cause of deforestation and its future
development
Series of discussions and interviews with local communities were conducted since the
project‘s initiation, in order to identify the drivers of deforestationand/or increase of forest
cover. On the discussions, it was found out that main actors in decreasing or increasing
forest cover is local communities from five villages around MBNP, namely Wonoasri,
Curah Nongko, Andongrejo, Sanenrejo and Curah Takir. Their daily activities such as
collection of fire woods, hunting of forest animals, and harvesting of forest products to earn
additional income, as well as occasionalland clearing for agriculture and (most likely illegal)
tree logs for sale or housing renovation cause deforestation in the National Park. On the
other hand, the also conduct agroforestry activities that lead to increase of forest cover.
For agroforestry activities in average farmers ownlarger agriculture land on areas outside
MBNP compared to the area inside rehabilitation zone that they occupied. The proportion is
more or less 30%-70%. Itindicates that their income from agroforestry in rehabilitation zone
is smaller than those from agriculture land outside MBNP. According to the farmers, they
can generate net income of IDR. 4,000,000/year, only from crops products such as peanut
and corn they cultivate in rehabilitation zone. Regardless of its small value, farmers still
need the additional income and thus they keep practicing the agroforestry activity inside the
National Park.
Since the rehabilitation zone is located next to primary forest, local communities existence
can lead to two possibilities in the future. First, they will become a huge threat thatdestroy
the forest if there is no intervention and second they can be an important actor to increase
the forest cover. Summary of analysis is presented in Table 10.
Land Cover Carbon Stock (tC/ha)
Forest land 148.7
Grass land 7.2
Crop land 2.9
Agroforestry (existing condition, not the optimum
condition)
28.7
PROJECT DESCRIPTION: VCS Version 3
20
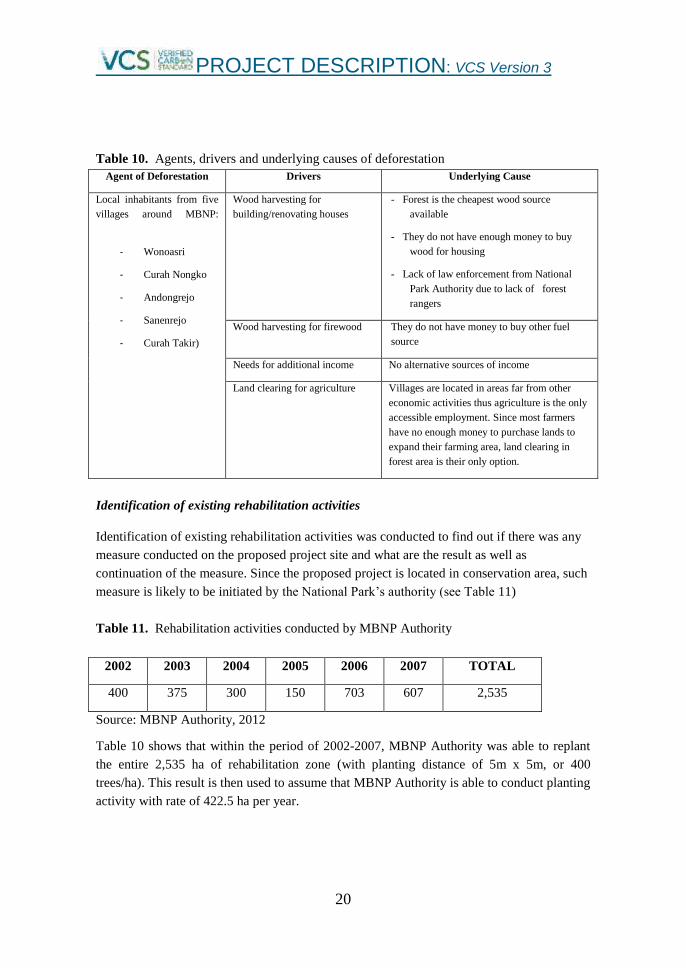
Table 10. Agents, drivers and underlying causes of deforestation
Agent of Deforestation Drivers Underlying Cause
Local inhabitants from five
villages around MBNP:
- Wonoasri
- Curah Nongko
- Andongrejo
- Sanenrejo
- Curah Takir)
Wood harvesting for
building/renovating houses
- Forest is the cheapest wood source
available
- They do not have enough money to buy
wood for housing
- Lack of law enforcement from National
Park Authority due to lack of forest
rangers
Wood harvesting for firewood They do not have money to buy other fuel
source
Needs for additional income No alternative sources of income
Land clearing for agriculture Villages are located in areas far from other
economic activities thus agriculture is the only
accessible employment. Since most farmers
have no enough money to purchase lands to
expand their farming area, land clearing in
forest area is their only option.
Identification of existing rehabilitation activities
Identification of existing rehabilitation activities was conducted to find out if there was any
measure conducted on the proposed project site and what are the result as well as
continuation of the measure. Since the proposed project is located in conservation area, such
measure is likely to be initiated by the National Park‘s authority (see Table 11)
Table 11. Rehabilitation activities conducted by MBNP Authority
2002 2003 2004 2005 2006 2007 TOTAL
400 375 300 150 703 607 2,535
Source: MBNP Authority, 2012
Table 10 shows that within the period of 2002-2007, MBNP Authority was able to replant
the entire 2,535 ha of rehabilitation zone (with planting distance of 5m x 5m, or 400
trees/ha). This result is then used to assume that MBNP Authority is able to conduct planting
activity with rate of 422.5 ha per year.
PROJECT DESCRIPTION: VCS Version 3
21
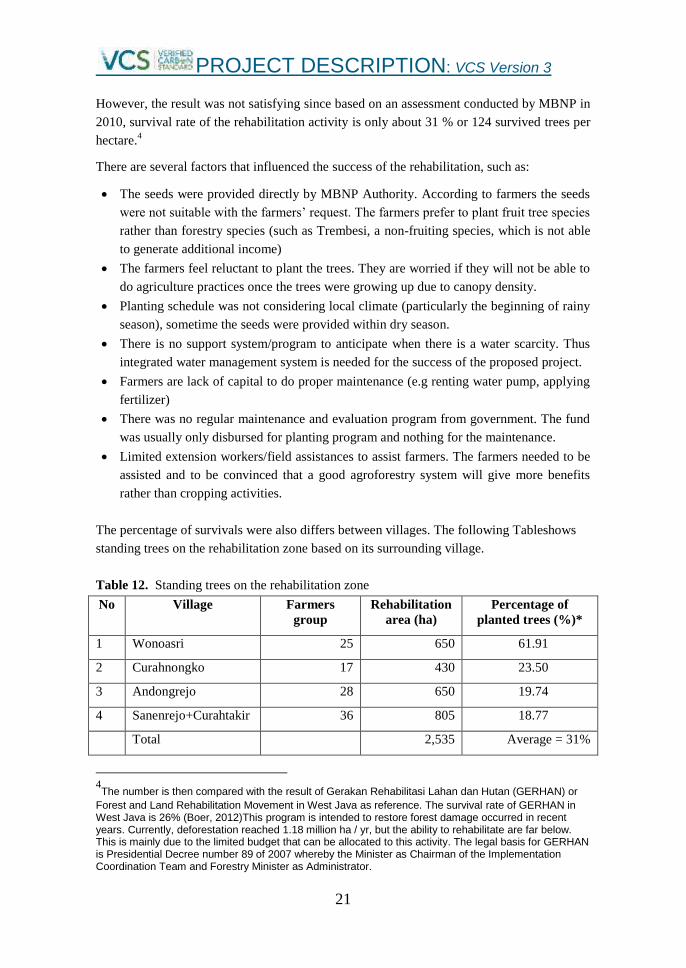
However, the result was not satisfying since based on an assessment conducted by MBNP in
2010, survival rate of the rehabilitation activity is only about 31 % or 124 survived trees per
hectare.4
There are several factors that influenced the success of the rehabilitation, such as:
The seeds were provided directly by MBNP Authority. According to farmers the seeds
were not suitable with the farmers‘ request. The farmers prefer to plant fruit tree species
rather than forestry species (such as Trembesi, a non-fruiting species, which is not able
to generate additional income)
The farmers feel reluctant to plant the trees. They are worried if they will not be able to
do agriculture practices once the trees were growing up due to canopy density.
Planting schedule was not considering local climate (particularly the beginning of rainy
season), sometime the seeds were provided within dry season.
There is no support system/program to anticipate when there is a water scarcity. Thus
integrated water management system is needed for the success of the proposed project.
Farmers are lack of capital to do proper maintenance (e.g renting water pump, applying
fertilizer)
There was no regular maintenance and evaluation program from government. The fund
was usually only disbursed for planting program and nothing for the maintenance.
Limited extension workers/field assistances to assist farmers. The farmers needed to be
assisted and to be convinced that a good agroforestry system will give more benefits
rather than cropping activities.
The percentage of survivals were also differs between villages. The following Tableshows
standing trees on the rehabilitation zone based on its surrounding village.
Table 12. Standing trees on the rehabilitation zone
No Village Farmers
group
Rehabilitation
area (ha)
Percentage of
planted trees (%)*
1 Wonoasri 25 650 61.91
2 Curahnongko 17 430 23.50
3 Andongrejo 28 650 19.74
4 Sanenrejo+Curahtakir 36 805 18.77
Total 2,535 Average = 31%
4The number is then compared with the result of Gerakan Rehabilitasi Lahan dan Hutan (GERHAN) or
Forest and Land Rehabilitation Movement in West Java as reference. The survival rate of GERHAN in West Java is 26% (Boer, 2012)This program is intended to restore forest damage occurred in recent years. Currently, deforestation reached 1.18 million ha / yr, but the ability to rehabilitate are far below. This is mainly due to the limited budget that can be allocated to this activity. The legal basis for GERHAN is Presidential Decree number 89 of 2007 whereby the Minister as Chairman of the Implementation Coordination Team and Forestry Minister as Administrator.

PROJECT DESCRIPTION: VCS Version 3
22
* Planting space 5m x 5m (1ha = 400 trees)
(Source: survey on rehabilitation zone, MBNP Authority 2010)
According toTable 11, highest number of standing trees are exists within Wonoasri area, this
is because most farmers in Wonoasri have alternative economic activities such as working in
plantation companies located nearby their village. Their village‘s location is also closer to
the center of subdistrict, providing easier access to market etc.
2.5 Additionality
Additionallity of the proposed project is assessed using VT0001: Tool for the Demonstration
and Assessment of Additionality in VCS Agriculture, Forestry and Other Land Use
(AFOLU) Project Activities Version 3.0.
The following four steps were applied:
- STEP 1. Identification of alternative land use scenarios to the AFOLU project activity;
- STEP 2. Investment analysis to determine that the proposed project activity is not the
most economically or financially attractive of the identified land use scenarios; or
- STEP 3. Barriers analysis; and
- STEP 4. Common practice analysis
Step 1. Alternative Land Use Scenario
The main land use scenario in Meru Betiri National Park is conservation. The area within
MBNP including rehabilitation zone is very restricted for other land use outside
conservation. The single land use is regulated by Act Number 5 of 1990 on Conservation of
Natural Resources and the Ecosystems, and Government Regulation No 28 of 2011 on
Management of Conservation Area. Thus, based on this analysis, the proposed project shows
no additionality.
However, considering the baseline situation, in which:
- tree density is 124 trees/ha, success rate of replanting program of 31.89%;
- the schedule of seeds distribution from government‘s aid was way behind planting
season;
- lack of field assistants; and
- farmers are in general lacking in capital to implement proper seedling maintenance
(such as renting water pump to water the land, apply fertilizer, etc).
The government funding was only allocated for seedling, not maintenanceClearly, there is a
need of intervention to achieve sink (forest carbon stock) enhancement. Without
intervention from the proposed project, it will be difficult to increase average number of
trees per hectare in rehabilitation zone of MBNP.
Moreover, it is projected that most likely there will be no new replanting program in near
future. It is because the funding from National Government for replanting/species
enrichment program has been fully disbursed and the program is considered finalized. This

PROJECT DESCRIPTION: VCS Version 3
23
is the basis argument to see the proposed project activity as additonality, while the current
situation is selected as baseline scenario.
Step 2. Investment Analysis
To determine whether the proposed project activity, without the revenue from the sale of
GHG credits is economically or financially less attractive, a simple economic calculation
was conducted on agroforestry business in rehabilitation zone by planting scenario. The
result is presented in Table 135.
Table 13. Economic calculation of proposed project by planting scenario*
Note:
* calculation was done for rehabilitation zone which is fall under type 1—3 (or equal to 1,750 ha)
** for 6 consecutive years components: cost of labour, seedlings, fertilizers, pump rent for watering
the land, fee for field assistance
*** NVP is calculated for fruit harvesting period of 20 years. Small discount factors is selected
considering that this project can be categorized as a social investment
**** the income is calculated based on the multiplication of potential CO2 emission reduction with
CER price per ton CO2e. The assumption of CER price is 5US$ per ton CO2e.
From Table 13, it is found out that the cost of planting program is still smaller than the
annual income. It is supported with the positive value of NVP6. The IRR itself was
calculated only from the selling of fruits; excluding the income from carbon trading. Even
though the recorded IRR are quite low (below 21% threshold of feasible regular business),
the income from carbon trading can be considered as interesting financial benefit that the
proposed project can bring to local community.
Based on analysis in step 2, it is concluded that the proposed project is likely to be
financially attractive. Then the project activity cannot be considered additional by means of
financial analysis. Therefore barrier analysis (step 3) is conducted to prove that the proposed
project activity faces barriers that do not prevent the baseline land use scenario(s) from
occurring.
5For a more detailed calculation, please see separated file titled Economic_Meru Betiri_Dollar.xls
6The net present value (NPV) and internal rate of return (IRR) are two most-used measures for
evaluating an investment.
Baseline Success
Rate
Investment
Cost **
(US$/year)
Net Present Value (NPV) – US$***
Internal
Rate of
Return
(IRR)
Estimated
income
from CER
(US$)****
6.8% 7% 8%
Scenario 1
160 trees/ha
37.5% 575,444 33,529,664 32,974,828 30,397,03 1% 3,701,190
Scenario 2 200 trees/ha
45% 665,339 34,776,633 34,189,199 31,461,34 8% 4,535,440
Scenario 3
300 trees/ha
75% 760,833 38,849,397 38,169,669 35,015,84 19% 6,621,075
PROJECT DESCRIPTION: VCS Version 3
24
Step 3. Barriers Analysis
Based on economic calculation, the existing planting activities and added value chain (which
is further developed with the proposed project) has positive impact in optimizing livelihood
of local communities in MBNP. Thus, it is actually cannot be categorized as additionality
since it is profitable.
However, there are some barriers that made the business are not well developed up to know,
such as:
a. No clear agreement between MBNP Authority and local communities regarding
utilization of rehabilitation zone as agroforestry. It causes insecure feeling for local
community. They are afraid that once the tree is growing they will be chased out from
rehabilitation zone and cannot harvest the fruit.
b. Farmers do not have access to capital to support and develop the business. It is almost
impossible for them to lend the money from the bank since they do not have collateral.
c. Other source of financial support is government funding, namely ―Hutan
Kemasyarakatan Scheme‖ from Ministry of Forestry. However due to (i) difficult
bureaucracy, (ii) institutional obstacle, and (iii) high transaction cost, only 1% of the
funding has been disbursed to society.
Thus, based on the result of Barrier Analysis, the proposed project can be considered as
additional.
Step 4. Common Practices Analysis
For the last 10 years (prior to the project‘s starting date), MBNP Authority has conducted
several rehabilitation activities (replanting and/or species enrichment program). For more
detailed information please see Table 10 Rehabilitation activities conducted by MBNP
Authority.
Table 10shows that since 2002 to 2007, MBNP Authority was able to plant the trees in
entire 2,535 ha of the rehabilitation zone (with planting distance of 5m X 5m, or 400
trees/ha). It means that MBNP Authority is able to conduct planting activity with rate of
422.5 ha per year. Based on rapid assessment conducted by MBNP in 2010 the survival rate
is only about 31 % or 124 trees are survived in 1 (one) ha of land.
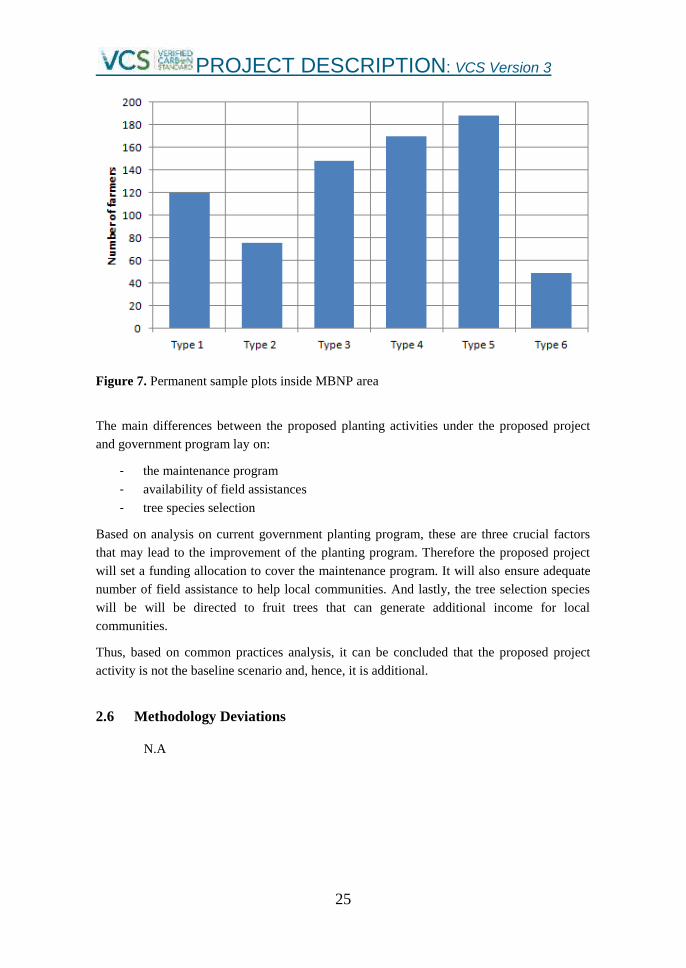
This result is also supported by the finding from KAIL tree census conducted in MBNP
rehabilitation zone in 2012. The recorded survival rate is 31.89%. The quantitative result of
each typology is presented in Figure 7.
PROJECT DESCRIPTION: VCS Version 3
25
Figure 7. Permanent sample plots inside MBNP area
The main differences between the proposed planting activities under the proposed project
and government program lay on:
- the maintenance program
- availability of field assistances
- tree species selection
Based on analysis on current government planting program, these are three crucial factors
that may lead to the improvement of the planting program. Therefore the proposed project
will set a funding allocation to cover the maintenance program. It will also ensure adequate
number of field assistance to help local communities. And lastly, the tree selection species
will be will be directed to fruit trees that can generate additional income for local
communities.
Thus, based on common practices analysis, it can be concluded that the proposed project
activity is not the baseline scenario and, hence, it is additional.
2.6 Methodology Deviations
N.A
PROJECT DESCRIPTION: VCS Version 3
26
3 QUANTIFICATION OF GHG EMISSION REDUCTIONS AND
REMOVALS
3.1 Baseline Emissions
Historical emissions
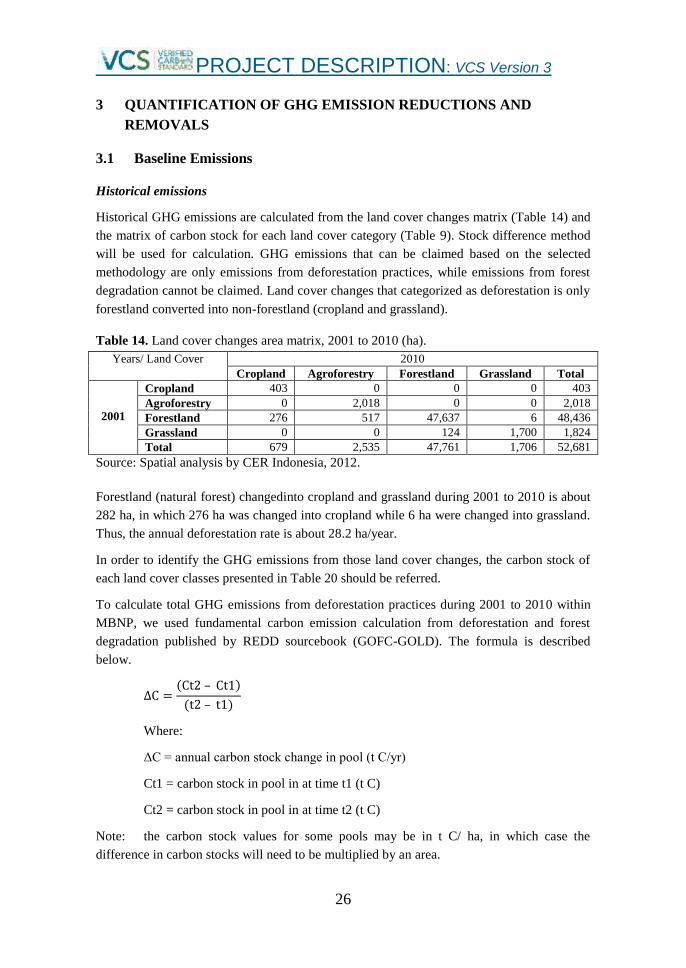
Historical GHG emissions are calculated from the land cover changes matrix (Table 14) and
the matrix of carbon stock for each land cover category (Table 9). Stock difference method
will be used for calculation. GHG emissions that can be claimed based on the selected
methodology are only emissions from deforestation practices, while emissions from forest
degradation cannot be claimed. Land cover changes that categorized as deforestation is only
forestland converted into non-forestland (cropland and grassland).
Table 14. Land cover changes area matrix, 2001 to 2010 (ha).
Years/ Land Cover
2010
Cropland Agroforestry Forestland Grassland Total
2001
Cropland 403 0 0 0 403
Agroforestry 0 2,018 0 0 2,018
Forestland 276 517 47,637 6 48,436
Grassland 0 0 124 1,700 1,824
Total 679 2,535 47,761 1,706 52,681
Source: Spatial analysis by CER Indonesia, 2012.
Forestland (natural forest) changedinto cropland and grassland during 2001 to 2010 is about
282 ha, in which 276 ha was changed into cropland while 6 ha were changed into grassland.
Thus, the annual deforestation rate is about 28.2 ha/year.
In order to identify the GHG emissions from those land cover changes, the carbon stock of
each land cover classes presented in Table 20 should be referred.
To calculate total GHG emissions from deforestation practices during 2001 to 2010 within
MBNP, we used fundamental carbon emission calculation from deforestation and forest
degradation published by REDD sourcebook (GOFC-GOLD). The formula is described
below.
( )
( )
Where:
ΔC = annual carbon stock change in pool (t C/yr)
Ct1 = carbon stock in pool in at time t1 (t C)
Ct2 = carbon stock in pool in at time t2 (t C)
Note: the carbon stock values for some pools may be in t C/ ha, in which case the
difference in carbon stocks will need to be multiplied by an area.
PROJECT DESCRIPTION: VCS Version 3
27
GHG emissions (t C) = [Deforestation area, forestland converted to cropland, ha (from
2001 to 2010) X carbon stock change, t C/ha, forestland ><
cropland] + [Deforestation area, forestland converted to
grassland, ha (from 2001 to 2010) X carbon stock change, t C/ha,
forestland >< grassland]
= 276 ha x (148.7 - 2.9)t C/ha + 6 ha x ( 148.7 – 7.2) t C/ha
= 40,240.8 t C + 849 t C
= 41,089.8 t C ≈ 150,662.6 t CO2e
Annual GHG emissions = 41,089.8 t C : 10 years
= 4,108.98 tC/year
= 15,066.3 t CO2e/year
Total GHG emissions from deforestation practices in 2001 to 2010 within MBNP national
park is about 150,662.6 t CO2e or annually 15,066.3 CO2e/ year. This number is quite
significant, considering that MBNP is a National Park in which by law is a protected area
with restricted access and a strictly prohibited land use aside from conservation.
Projected emissions
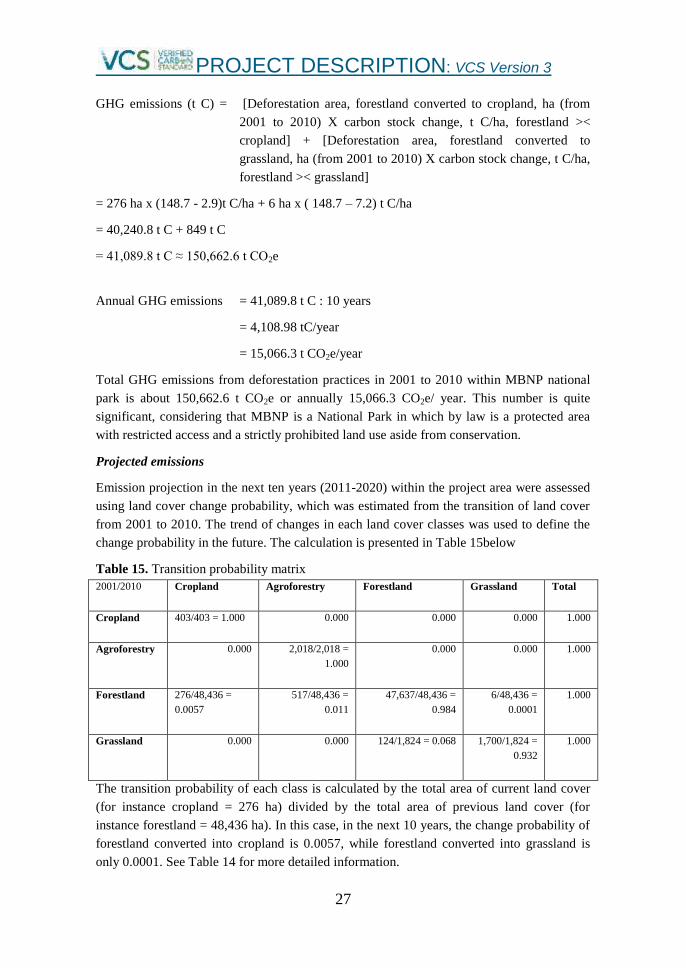
Emission projection in the next ten years (2011-2020) within the project area were assessed
using land cover change probability, which was estimated from the transition of land cover
from 2001 to 2010. The trend of changes in each land cover classes was used to define the
change probability in the future. The calculation is presented in Table 15below
Table 15. Transition probability matrix
2001/2010 Cropland Agroforestry Forestland Grassland Total
Cropland 403/403 = 1.000 0.000 0.000 0.000 1.000
Agroforestry 0.000 2,018/2,018 =
1.000
0.000 0.000 1.000
Forestland 276/48,436 =
0.0057
517/48,436 =
0.011
47,637/48,436 =
0.984
6/48,436 =
0.0001
1.000
Grassland 0.000 0.000 124/1,824 = 0.068 1,700/1,824 =
0.932
1.000
The transition probability of each class is calculated by the total area of current land cover
(for instance cropland = 276 ha) divided by the total area of previous land cover (for
instance forestland = 48,436 ha). In this case, in the next 10 years, the change probability of
forestland converted into cropland is 0.0057, while forestland converted into grassland is
only 0.0001. See Table 14 for more detailed information.
PROJECT DESCRIPTION: VCS Version 3
28
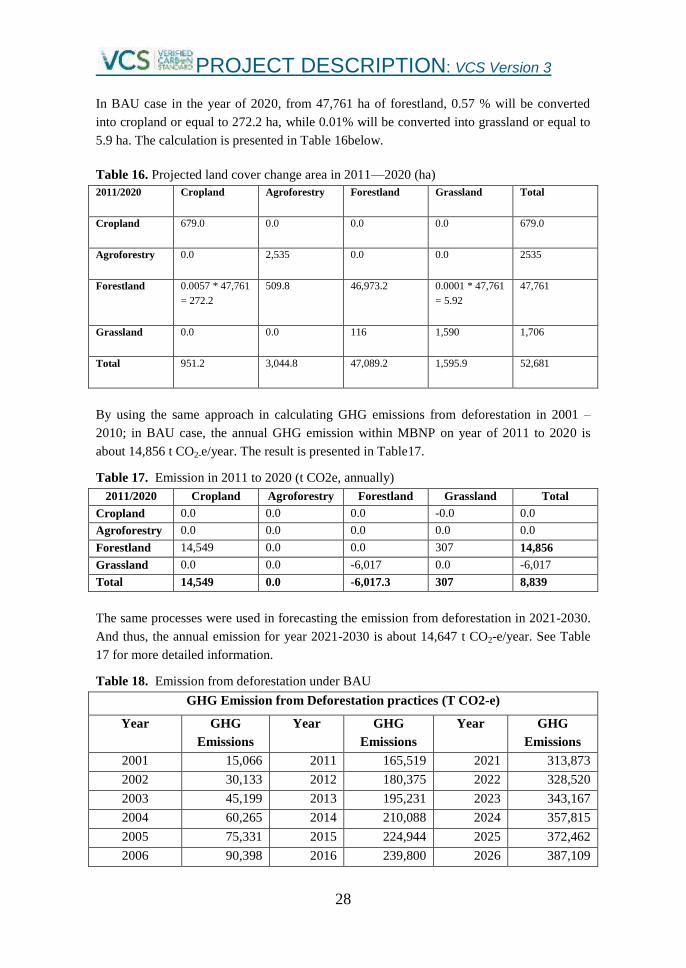
In BAU case in the year of 2020, from 47,761 ha of forestland, 0.57 % will be converted
into cropland or equal to 272.2 ha, while 0.01% will be converted into grassland or equal to
5.9 ha. The calculation is presented in Table 16below.
Table 16. Projected land cover change area in 2011—2020 (ha)
2011/2020 Cropland Agroforestry Forestland Grassland Total
Cropland 679.0 0.0 0.0 0.0 679.0
Agroforestry 0.0 2,535 0.0 0.0 2535
Forestland 0.0057 * 47,761
= 272.2
509.8 46,973.2 0.0001 * 47,761
= 5.92
47,761
Grassland 0.0 0.0 116 1,590 1,706
Total 951.2 3,044.8 47,089.2 1,595.9 52,681
By using the same approach in calculating GHG emissions from deforestation in 2001 –
2010; in BAU case, the annual GHG emission within MBNP on year of 2011 to 2020 is
about 14,856 t CO2-e/year. The result is presented in Table17.
Table 17. Emission in 2011 to 2020 (t CO2e, annually)
2011/2020 Cropland Agroforestry Forestland Grassland Total
Cropland 0.0 0.0 0.0 -0.0 0.0
Agroforestry 0.0 0.0 0.0 0.0 0.0
Forestland 14,549 0.0 0.0 307 14,856
Grassland 0.0 0.0 -6,017 0.0 -6,017
Total 14,549 0.0 -6,017.3 307 8,839
The same processes were used in forecasting the emission from deforestation in 2021-2030.
And thus, the annual emission for year 2021-2030 is about 14,647 t CO2-e/year. See Table
17 for more detailed information.
Table 18. Emission from deforestation under BAU
GHG Emission from Deforestation practices (T CO2-e)
Year GHG
Emissions
Year GHG
Emissions
Year GHG
Emissions
2001 15,066 2011 165,519 2021 313,873
2002 30,133 2012 180,375 2022 328,520
2003 45,199 2013 195,231 2023 343,167
2004 60,265 2014 210,088 2024 357,815
2005 75,331 2015 224,944 2025 372,462
2006 90,398 2016 239,800 2026 387,109
PROJECT DESCRIPTION: VCS Version 3
29
2007 105,464 2017 254,657 2027 401,757
2008 120,530 2018 269,513 2028 416,404
2009 135,596 2019 284,369 2029 431,051
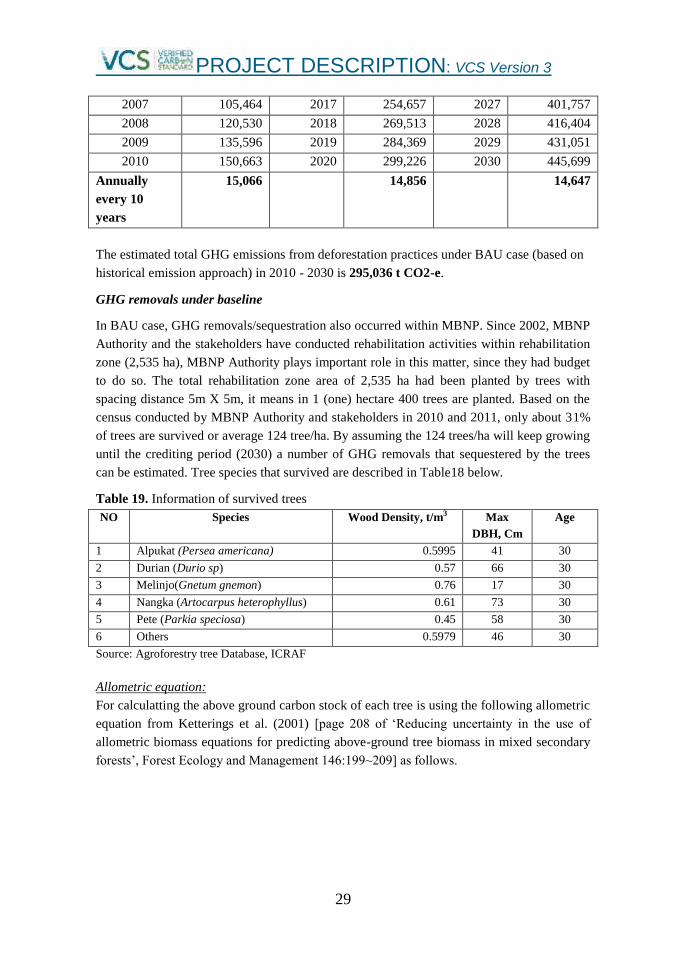
2010 150,663 2020 299,226 2030 445,699
Annually
every 10
years
15,066
14,856
14,647
The estimated total GHG emissions from deforestation practices under BAU case (based on
historical emission approach) in 2010 - 2030 is 295,036 t CO2-e.
GHG removals under baseline
In BAU case, GHG removals/sequestration also occurred within MBNP. Since 2002, MBNP
Authority and the stakeholders have conducted rehabilitation activities within rehabilitation
zone (2,535 ha), MBNP Authority plays important role in this matter, since they had budget
to do so. The total rehabilitation zone area of 2,535 ha had been planted by trees with
spacing distance 5m X 5m, it means in 1 (one) hectare 400 trees are planted. Based on the
census conducted by MBNP Authority and stakeholders in 2010 and 2011, only about 31%
of trees are survived or average 124 tree/ha. By assuming the 124 trees/ha will keep growing
until the crediting period (2030) a number of GHG removals that sequestered by the trees
can be estimated. Tree species that survived are described in Table18 below.
Table 19. Information of survived trees
NO Species Wood Density, t/m3 Max
DBH, Cm
Age
1 Alpukat (Persea americana) 0.5995 41 30
2 Durian (Durio sp) 0.57 66 30
3 Melinjo(Gnetum gnemon) 0.76 17 30
4 Nangka (Artocarpus heterophyllus) 0.61 73 30
5 Pete (Parkia speciosa) 0.45 58 30
6 Others 0.5979 46 30
Source: Agroforestry tree Database, ICRAF
Allometric equation:
For calculatting the above ground carbon stock of each tree is using the following allometric
equation from Ketterings et al. (2001) [page 208 of ‗Reducing uncertainty in the use of
allometric biomass equations for predicting above-ground tree biomass in mixed secondary
forests‘, Forest Ecology and Management 146:199~209] as follows.

PROJECT DESCRIPTION: VCS Version 3
30
(Dry Biomass, kg) = 0.11 x ρ x D2.62
,
where:
ρ Wood density (g/cm3), which is derived from ICRAF database
(http://www.worldagroforestrycentre.org/sea/Products/AFDbases/WD),
D Diameter breast high (DBH, cm).
Estimation of DBH of the tree species is using equation y = a/(1+b*exp(ct)), where
a = maximum DBH, b and c are constanta. The DBH increment of each tree species
is describe on Figure8.
Figure 8. DBH Growth of Selected Tree Species
Total C (carbon) content within tree is 50% of its biomass, conversion from C to
CO2-e = T C * 44/12.
Total gross GHG removals/sequestration by tree planting during crediting period is about
869,386 t CO2-e. Meanwhile, as stated in previous paragraph, the emission from
deforestation practices in BAU case is 295,036 t CO2-e. Thus, total net GHG removals
within the project boundary under BAU are about 574,350 t CO2-e (see Figure 9).

PROJECT DESCRIPTION: VCS Version 3
31
Figure 9. Net GHG Removals/Sequestration Under BAU.
3.2 Project Emissions
GHG emissions reduction by project will be estimated by the stooping the emission from
deforestation, plus the GHG removals/sequestration by enhancing carbon stocks (Planting
trees);
Estimated GHG emission reduction = avoided GHG emission by stopping deforestation +
GHG sequestration by enhancing carbon stocks
GHG Emissions under project scenario
In the proposed project‘s scenario, all activities that lead to avoid deforestation will be
optimized, therefore the emissions from deforestation practices are expected to be zero (see
Figure 10).
Table20. Projected GHG emissions when deforestation is no longer occur
GHG Emission reduction (T CO2-e) by ending deforestation
Year Emissions BAU Emissions Project Scenario Emission reduction
2011 14,856 0 14,856
2012 14,856 0 14,856
2013 14,856 0 14,856
2014 14,856 0 14,856
2015 14,856 0 14,856
2016 14,856 0 14,856
2017 14,856 0 14,856

PROJECT DESCRIPTION: VCS Version 3
32
2018 14,856 0 14,856
2019 14,856 0 14,856
2020 14,856 0 14,856
2021 14,647 0 14,647
2022 14,647 0 14,647
2023 14,647 0 14,647
2024 14,647 0 14,647
2025 14,647 0 14,647
2026 14,647 0 14,647
2027 14,647 0 14,647
2028 14,647 0 14,647
2029 14,647 0 14,647
2030 14,647 0 14,647
Total 295,036 0 295,036
Figure 10. Projected emissions under BAU and project scenario
Estimated total emissions that can be reduced by ending deforestation practices during
crediting period is 295,036 tCO2-e.
GHG removals under project scenario
Aside from avoiding emission from Deforestation, the proposed project also aim at
increasing the stock carbon by planting the selected trees within 2,535 ha of rehabilitation
zone. A target of 150-200 trees/ha was set for this part of the project.Existing trees within
2,535 ha of rehabilitation zone is about 314,340 trees (Table21).
Ending
Deforestation

PROJECT DESCRIPTION: VCS Version 3
33
Table 21. Number of existing trees on rehabilitation zone
Tree Species Number of trees
Pete 143,083
Nangka 15,919
Alpukat 6,198
Melinjo 402
Durian 535
Others (Kemiri) 148,203
Total 314,340
Tree species used in the plantingactivitywas decided based on inputs from stakeholders and
also considering the distribution of existing trees. The input from the farmer groups are:
petai, nangka, alpukat, melinjo, durian, and kemiri. However, after assessing the current
distribution of tree species in rehabilitation zone, it is suggested to plant alpukat, melinjo,
durian and others (in this case, to simplify the carbon calculation ―others‖ category is
represented by kemiri) rather than pete and nangka. This is to prevent over suply of petai
and nangka—that possibly leads to decreased income for farmers—since those tree species
have existed a lot.Distribution of the tree species can be seen in Table 21.
Another important discussion regarding tree species selection is that the tree selection for
planting scenario in rehabilitation zone should be dominated by native forestry tree species.
It is because rehabilitation zone is an integrated area of Meru Betiri National Park.
Based on the review of MBNP Flora Database (which contains list of native trees of
MBNP), the selected species for project planting scheme namely durian, melinjo and kemiri
can be considered as native species. Only alpukat which can be considered as a new species.
However, reflecting on the previous re-planting program experience at the field level whre
the success of planting activitiesis involvement of local community, preference and request
from the community should be considered and thereforealpukat (avocado tree) is included in
the planting.
Table 22. Tree distribution under baseline and project scenario
Species 124 trees/ha (Baseline) 200 trees/ha (project scenario)
Petai 45% 28%
Nangka 5% 3%
Alpukat 2% 11%
Melinjo <1% 10%
Durian <1% 10%
Others 47% 39%

PROJECT DESCRIPTION: VCS Version 3
34
Using the approach and equation from Kettering et.al (2001), GHG removals/sequestrations
by tree planting under project scenario is projected as described in Table 23.
Table 23. Gross GHG removal / sequestration under project scenario
Year GHG removals (tCO2e)
2010 0
2011 11,815
2012 19,313
2013 29,355
2014 41,396
2015 54,223
2016 66,189
2017 75,630
2018 81,294
2019 82,729
2020 80,447
2021 75,784
2022 70,447
2023 65,968
2024 63,268
2025 62,466
2026 62,949
2027 63,653
2028 63,454
2029 61,514
2030 57,491
Total 1,189,387
3.3 Leakage
It is projected that the proposed REDD+ project will not lead to any leakage. See 1.13.1
section for more explanation on leakage.
3.4 Summary of GHG Emission Reductions and Removals
Total estimated net GHG emissions reductions/removals (Table 24) are calculated using
inputs from:
i. estimated GHG emissions or removals under BAU scenario. In this case, the project
area is a GHG sinker/removal because the GHG sequestration is bigger than GHG
emission

PROJECT DESCRIPTION: VCS Version 3
35
ii. estimated GHG emissions or removals under project scenario. In this case, the project
area is also a GHG sinker/removal because the GHG emission will be zero/stopped,
and sequestration are occurred due to enhancement of C stock activity
iii. leakage
In this case the leakage is zero
Net project emissions/removals (4) = Estimated Project removals (2) – Estimated Baseline
Removals (1) - Leakage (3)
Table 24. Summary of GHG removals
Years Estimated
baseline emissions
or removals
(tCO2e)
Estimated project
emissions or
removals (tCO2e)
Estimated
leakage emissions
(tCO2e)
Estimated net
GHG emission
reductions or
removals (tCO2e)
2010 0 0 0 0
2011 (3,042) 26,672 0 29,714
2012 4,453 34,169 0 29,716
2013 14,488 44,211 0 29,724
2014 26,519 56,253 0 29,734
2015 39,308 69,079 0 29,771
2016 51,193 81,046 0 29,852
2017 60,447 90,486 0 30,039
2018 65,707 96,151 0 30,444
2019 66,325 97,585 0 31,261
2020 62,522 95,303 0 32,781
2021 55,484 90,431 0 34,947
2022 46,167 85,094 0 38,927
2023 36,142 80,615 0 44,473
2024 26,473 77,915 0 51,442
2025 17,823 77,114 0 59,290
2026 10,493 77,596 0 67,103
2027 4,524 78,300 0 73,776
2028 (196) 78,101 0 78,298
2029 (3,849) 76,162 0 80,010
2030 (6,630) 72,138 0 78,768
Total 574,350 1,484,423 910,073
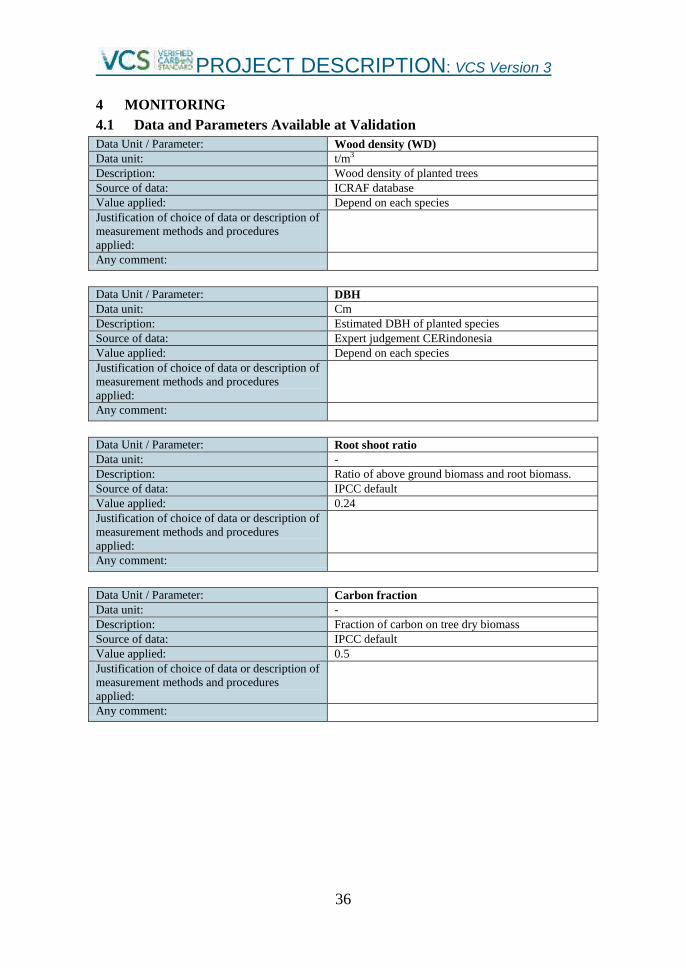
PROJECT DESCRIPTION: VCS Version 3
36
4 MONITORING
4.1 Data and Parameters Available at Validation
Data Unit / Parameter: Wood density (WD)
Data unit: t/m3
Description: Wood density of planted trees
Source of data: ICRAF database
Value applied: Depend on each species
Justification of choice of data or description of
measurement methods and procedures
applied:
Any comment:
Data Unit / Parameter: DBH
Data unit: Cm
Description: Estimated DBH of planted species
Source of data: Expert judgement CERindonesia
Value applied: Depend on each species
Justification of choice of data or description of
measurement methods and procedures
applied:
Any comment:
Data Unit / Parameter: Root shoot ratio
Data unit: -
Description: Ratio of above ground biomass and root biomass.
Source of data: IPCC default
Value applied: 0.24
Justification of choice of data or description of
measurement methods and procedures
applied:
Any comment:
Data Unit / Parameter: Carbon fraction
Data unit: -
Description: Fraction of carbon on tree dry biomass
Source of data: IPCC default
Value applied: 0.5
Justification of choice of data or description of
measurement methods and procedures
applied:
Any comment:

PROJECT DESCRIPTION: VCS Version 3
37
4.2 Data and Parameters Monitored
Data Unit / Parameter: Forestland Area
Data unit: Ha
Description: The Land cover that classified as forestland will be
monitored through remote sensing.
Source of data: Satellite Imagery (Landsat, and etc)
Description of measurement methods and
procedures to be applied:
The complete procedure to monitor the land cover
changes is describe in the Appendix 2
Frequency of monitoring/recording: 5 years
Value applied: Area of forestland
Monitoring equipment: Computer and GPS
QA/QC procedures to be applied: -
Calculation method: The complete procedure to monitor the land cover
changes is describe in the Appendix 2
Any comment: -
Data Unit / Parameter: Deforestation Area
Data unit: Ha
Description: The Land cover changes from forested area to non
forested area.
Source of data: Satellite Imagery (Landsat, and etc)
Description of measurement methods and
procedures to be applied:
The complete procedure to monitor the land cover
changes is describe in the Appendix 2
Frequency of monitoring/recording: 5 years
Value applied: Average annual historic deforestation rate in the
reference region
Monitoring equipment: Computer and GPS
QA/QC procedures to be applied: -
Calculation method: The complete procedure to monitor the land cover
changes is describe in the Appendix 2
Any comment: -
Data Unit / Parameter: Planted Trees
Data unit: -
Description: Number of planted trees within project
boundary
Source of data: Survey/census
Description of measurement methods
and procedures to be applied:
The field survey will use a Guideline of field
survey
Frequency of monitoring/recording: Each year
Value applied: Number of planted trees
Monitoring equipment: Computer and GPS
QA/QC procedures to be applied: -
Calculation method: -
Any comment: -
Data Unit / Parameter: Survived Trees
Data unit: -
Description: Number of Survived trees within project
boundary
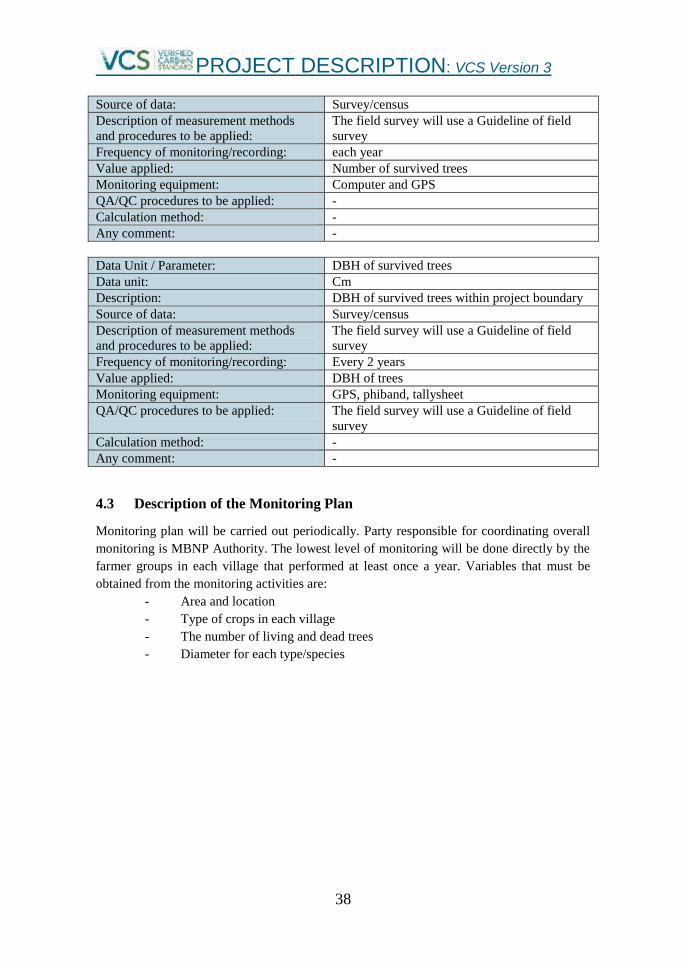
PROJECT DESCRIPTION: VCS Version 3
38
Source of data: Survey/census
Description of measurement methods
and procedures to be applied:
The field survey will use a Guideline of field
survey
Frequency of monitoring/recording: each year
Value applied: Number of survived trees
Monitoring equipment: Computer and GPS
QA/QC procedures to be applied: -
Calculation method: -
Any comment: -
Data Unit / Parameter: DBH of survived trees
Data unit: Cm
Description: DBH of survived trees within project boundary
Source of data: Survey/census
Description of measurement methods
and procedures to be applied:
The field survey will use a Guideline of field
survey
Frequency of monitoring/recording: Every 2 years
Value applied: DBH of trees
Monitoring equipment: GPS, phiband, tallysheet
QA/QC procedures to be applied: The field survey will use a Guideline of field
survey
Calculation method: -
Any comment: -
4.3 Description of the Monitoring Plan
Monitoring plan will be carried out periodically. Party responsible for coordinating overall
monitoring is MBNP Authority. The lowest level of monitoring will be done directly by the
farmer groups in each village that performed at least once a year. Variables that must be
obtained from the monitoring activities are:
- Area and location
- Type of crops in each village
- The number of living and dead trees
- Diameter for each type/species

PROJECT DESCRIPTION: VCS Version 3
39
Organizational structure, responsibilities and competencies
Figure 11. Organizational structure of monitoring process
As seen on the Figure 11, party responsible to coordinate overall monitoring is MBNP
Authority. Farmers Group will have responsibilities in monitoring and collecting
development data on the field at least once a year. The results of this process will be verified
by KAIL before submitted to MBNP Authority. The verified data will be discussed with
MBNP Authority for approval through investigation report.Competencies of each party
involved in monitoring process are presented in Table 25.
Table 25. Competencies of party involved in monitoring process
Party Competencies / Rationale
Farmers
Groups
Involving farmers in monitoring scheme will be useful since they live closely to the site
of project area, so it is easy for them to do monitoring activities at any given times, and
report immediately to KAIL and/or MBNP Authority if there is any problem at the field.
They also part of the society, so it can avoid any friction or misunderstanding if local
context became a challenge in the monitoring proces
KAIL A local NGO with extensive experience in assisting the community particulary in social
forestry. In addition to their long experienced in MBNP, some of KAIL founders are
members of local community who care about the preservation of MBNP. KAIL is born
as a continuation of LATIN – IPB collaboration project in MBNP in 1992 (see section
1.10 about history of MBNP)
LATIN An experienced environmental NGO that has long portfolio in forest management
activities and in collaborating with various institutions. Latin has already worked in
MBNP since 1992. The first activity in 1992 was to develop medicinal plants farming
around MBNP to improve the livelihood of local people as well as encouraging the local
society to preserve the forest.
MBNP
Authority
Consists of government official who has responsibility in managing MBNP area. They
have experience in handling activities related to forests and communities. They
MBNP Authority
(Coordinating)
Farmers group
(Data Gathering)
Farmers group
(Data Gathering)
Farmers group
(Data Gathering)
KAIL
(Verifying & Assistance)

PROJECT DESCRIPTION: VCS Version 3
40
established many activities in collaboration with local society to preserve MBNP and to
increase public income.
Methods for generating, recording, storing, aggregating, collating and reporting data on
monitored parameters
Based on the results of meetings between MBNP Authority, NGO, and farmer groups, there
is an agreement that the monitoring process will be conducted jointly and on participatory
basis. Farmer groups are entrusted and assigned to conduct a full survey or sampling based
on specified indicator or criteria. KAIL and LATIN will verify the survey results obtained
by the Farmers Groups. The verification results will be further discussed with MBNP
Authority, community leaders and farmers. If there are things that need to be adjusted, joint
meeting between MBNP, NGO & farmer groups will assign farmer groups or NGOs to do
the adjustment.
The documentation and e-filing of data gathered from monitoring activities will be
conducted by KAIL and LATIN. They will recap the data from farmers group and do data
input using their computer.
For preparation and reporting of the verified data, KAIL and LATIN will work in
collaboration with MBNP Authority. Joint effort aims to minimize errors in decision-making
and MRV process.
To ensure the accountability of the obtained data, an internal audit will be conducted.
Internal Audit Team will be appointed from the members of KAIL and LATIN who have
skill in monitoring and plants census. Audit Team will be ratified through joint meeting
between MBNP, NGO and farmers group. The results of internal audit will be presented at
annual collaboration meeting between MBNP, farmers group and KAIL.
If there is a data gap between the reports of farmers 'groups and the verified data, MBNP
Authority will coordinate the effort to fix the problem by: (i) request farmers group to re-
conducting field measurements (ii) assign KAIL and LATIN to re-verify and (iii) MBNP
Authority to improve the report.

PROJECT DESCRIPTION: VCS Version 3
41
5 ENVIRONMENTAL IMPACT
The basic law in conducting Environmental Impact Assessment (EIA) is Minister of
Environment‘s regulation No.5/2012. It is stated in the regulation that EIAs are required if
the following conditions exist:
a. Concession Forest, all area scale
b. Timber Plantation, with area bigger than or equal to 5,000 Ha
Since the proposed project is not located in a concession forest and timber plantation, EIA is
not required. However, based on field survey, it is noted that the species enrichment
program to be carried out by this project has a potential to create domination of certain
species. Based on the focus group discussion that were organized in 3 villages, it can be
predicted that farmers will choose to plant only commercial tree, such as petai (Parkia
speciosa), alpukat (Persea americana), durian (Durio zibethinus), It has been happened
during the first planting program in rehabilitation zone in 1999.There were some farmers
who planted their plot with only one species.
Homogenous forest is not a good option from ecological as well as economical point of view
since it is more vulnerable to pest and disease. Also, when the harvesting time comes, all
farmers will have the same commodities thus the selling price can be extremely cheap. It is
better to have various tree species, which can provide whole year income for the farmers if
the farmers choose to plant species that have different harvest time.
6 STAKEHOLDER COMMENTS
a. Initial Consultation with stakeholders
Several consultation meetings were made before the implementation of REDD+ program in
2010. There was a meeting in Jember on 13 July 2000, to determine the most applicable
scheme for communty and other stakeholders participations to support the sustainability of
MBNP and community welfare.
About 60 participants attending the consultation meeting, consisting of main groups of
stakeholder namely local community, management of MBNP, Local NGO, Community
Leaders and Religion Leaders, University, Local Government and Police Institution.
Results of the consultation meeting were as follows:
- Head of MBNP made commitment to community to allow them to prticipate of
making agroforestry planting in rehabilitation zone with example of rehabilitation
demonstration plot of 7 ha that has been planted since 1994, with principle of main
plantation (tree species) and agriculture crops including medicinal plants.
- Community were encouraged to seek main tree plantation seedlings from the forest.
- There were processes to make Written Agreement
PROJECT DESCRIPTION: VCS Version 3
42
- There were bargaining processes between community and MBNP. Community was
accompanied by local NGO (LATIN and KAIL). Community interest related to
economic results meanwhile MBNP concerned with forest conservation. However
there were commitments from both sides to do something for their interests.
- Important finding related to community awareness. Community realized that the land
in MBNP belonged to the state (represented by MBNP) therefore community to obey
certain rules
- In implementation of activities, community was represented in groups through the
heads of farmer groups.
- There was motivation from farmers due to accompanying by local NGO (Latin and
Kail).
- There were significant results of improvement of community income due to their
involvement in rehabilitation zone to make agroforestry system.
b. Supporting the assurance of legal aspect for community that utilize rehabilitation
zone of MBNP.
Stakeholder meeting was made on 4 October 2011, in Curahnongko village in the house of
the one of the farmer groups, to discuss community involvement in the rehabilitation zone
especially related to supporting the assurance of legal aspect for community that utilize
rehabilitation zone of MBNP
Legal assurance for community to have access of lands that have been rehabilitated through
agroforestry is very important. Through legal assurance, community can have guarantee to
gain benefits from agroforestry system that has been developed such as fruits, grass and
medicinal plants. Effort has been done to facilitate cooperation agreement between
community groups in Curahnongko village with MBNP that is going to be developed in
other villages in surrounding MBNP.
Through the lengthy process, finally the MOU was signed between farmer groups in
Curahnongko village which is joined in a group called JAKETRESI (Network of
rehabilitation farmers) with MBNP. This agreement was still in general form and needed to
be more specific for particular activities. For instance, rehabilitation activity will be made in
more detail agreement by utilizing the results of inventory in rehabilitation zone.
c. Stakeholder Consultation for REDD+
Stakeholder consultation was made on 4 July 2012, in Royal Hotel, Jember, to discuss the
role of community to support REDD+ and sustainability of the Meru Betiri National Park
(NBNP). There were 40 participants attending the meeting. The participants were
representing Meru Betiri National Park Office (Head of MBNP and Head of Sections I, II
and III of the MBNP), Jember District Government (Forestry Office and Industry Office),
Sub District of Tempur Rejo, Villages of Andongrejo, Sanenrejo, Wonoasri, Curahnongko,
Sarongan, Extension Center for Farmers (SPKP) of Wonoasri, Curahnongko and Sanenrejo

PROJECT DESCRIPTION: VCS Version 3
43
villages, community from villages of Andongrejo, Sanenrejo, Wonoasri, and Curahnongko,
KAIL NGO Sarongan of Jember
Minutes of the meeting:
- Agreements of all stakeholders to support REDD+ activities, considering Indonesia
Government target to reduce emission
- MBNP management and community in surrounding MBNP area agreed to
increase/improve survival rate of main tree plantations, through the followings:
o MBNP Office to provide nursery, seedlings ready for planting, distribution and
monitoring
o Community to make planting, and maintenance of tree plantations
o There were diseases that attack local tree species of petai (Parkia speciosa),
efforts would be made to control the diseases involving extension officers,
Agriculture and Estate Crops Research Center, or Universities
- Agreement has been made to come back to the initial/previous agreement
(MOU), such as:
o Only to make plantation according to species that have been approved for the
national park
o Species of estate crops were prohibited (such as oilpalm, coffee, rubber)
o For species that have been planted but do not include in the list of species agreed
(39 species), would be left in the field while wait for the further next decision.
- To encourage the implementation of the current existing local wisdom to support
sustainability of MBNP.
- Agree to provide important information related to this meeting to other community
members especially those who still violate the agreement.
d. Activities with Community
Several activities have been conducted involving community to improve their awareness for
the issue of climate change, REDD+ and sustainability of MBNP. Activities related to

PROJECT DESCRIPTION: VCS Version 3
44
community to improve their livelihood showed their active participations in REDD+
activities, and support the conservation program, as follows:
- Accompanying in Wonoasri Village in, September 2013, involving 20 participants to
cultivate orchids after training of orchid cultivation.
- Some 400 orchids have been distributed consisting of 400 dendrobium plants.
- In Kebunrejo village, some farmers have been supported with cultivation of catfish
and the skills for cultivation.
- This activity could actually provide alternative source of in come to farmers.
- Accompanying to farmers in Curahnongko village related to development of oyster
mushroom cultivation.
- Several activities have been carried out involving community to cultivate mushroom
as an alternative source of inclome. The activities included training, comparative
study, providing equipment, guidance and practice to produce mushrooms.
e. Activities Related to Rehabilitation
MBNP Authority has numerous experiences in carried out rehabilitation activities, whether
independently or in collaboration with local communities and NGOs. Cooperation with
NGOs has been started since the beginning of 1990. In 1992 the national park was piloting
rehabilitation activities. The implementation of the activities is carried out in collaboration
with LATIN and IPB. The pilot project aimed to establish the location as much as 7 ha in
Curahnongko village. Medicinal Plant Conservation Program is the starting point for the
pilot rehabilitation program because most of local people utilizing medicinal plants from
MBNP forests.
On 1995, Head of MBNP Authority gave permission to local farmers to cultivate
rehabilitation area of 7 ha using mix cropping method (trees and herbal tubers). On 1995,
LATIN established Kelompok Tanaman Obat Keluarga (Toga) to strengthen herbal
production plant of local society and initiative to develop herbal drink home industry.
Numbers of local people who joins this program was 43 households`. All of them originated
from Curahnongko village. The land was divided equally among 43 households. To avoid
any jealousy, the distribution of the land was done using lottery method.
On 1999, Head of MBNP Authority sign up collaboration with LATIN to develop Farmer
Group for Rehabilitation Kelompok Tani Rehabilitasi/KTR). He gave target to LATIN to
establish farmers group to work on area of 2.500 ha within 6 months. LATIN was able to
establish 104 KTR in 3 months. The number of KTR members are varies between 20 – 30
persons per group. On 2000, they started to replicate this model to other rehabilitation zone.
The number and development of KTR are described on Table 26.

PROJECT DESCRIPTION: VCS Version 3
45
Table 26. KTR program
No Year Number of members
(persons)
Remarks
1 1999 700 The beginning of KTR establishment. It aims to
reduce illegal logging and encroachment in MBNP.
There were 104 groups.
2 2000 900 The number of members increased due to intensive
approach and people feel there is no guarantee to
cultivate the land owned by national park
3 2004 1.500 This amount increase but the intensity of activity is
reduced because of Latin‘s assistance is not as
intensive as 1995 - 2002
4 2012 - There is no measurement. It is estimated that the
number exceed 1.500 persons.
Up to now, MBNP Authority keeps land rehabilitation activities in collaboration with NGOs
and local community. However, there are still some obstacles at the field level. It is mainly
because of the vast area of MBNP. There is a mutual awareness among each party that to
preserve MBNP forest from activities that could damage the national park they need
continuous cooperation with various parties.
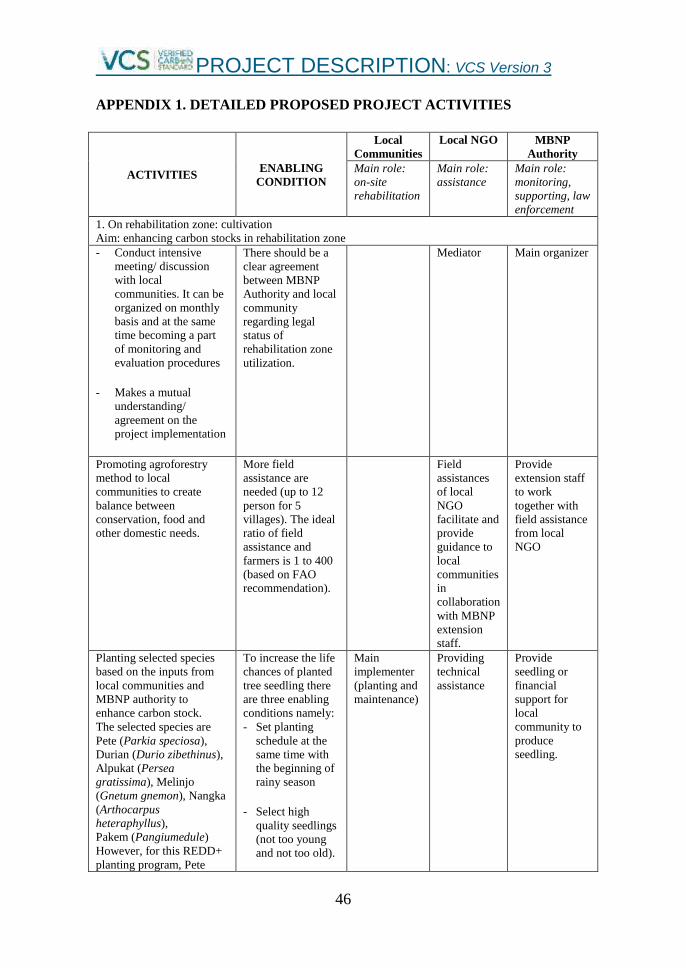
PROJECT DESCRIPTION: VCS Version 3
46
APPENDIX 1. DETAILED PROPOSED PROJECT ACTIVITIES
ACTIVITIES ENABLING
CONDITION
Local
Communities
Local NGO MBNP
Authority
Main role:
on-site
rehabilitation
Main role:
assistance
Main role:
monitoring,
supporting, law
enforcement
1. On rehabilitation zone: cultivation
Aim: enhancing carbon stocks in rehabilitation zone
- Conduct intensive
meeting/ discussion
with local
communities. It can be
organized on monthly
basis and at the same
time becoming a part
of monitoring and
evaluation procedures
- Makes a mutual
understanding/
agreement on the
project implementation
There should be a
clear agreement
between MBNP
Authority and local
community
regarding legal
status of
rehabilitation zone
utilization.
Mediator Main organizer
Promoting agroforestry
method to local
communities to create
balance between
conservation, food and
other domestic needs.
More field
assistance are
needed (up to 12
person for 5
villages). The ideal
ratio of field
assistance and
farmers is 1 to 400
(based on FAO
recommendation).
Field
assistances
of local
NGO
facilitate and
provide
guidance to
local
communities
in
collaboration
with MBNP
extension
staff.
Provide
extension staff
to work
together with
field assistance
from local
NGO
Planting selected species
based on the inputs from
local communities and
MBNP authority to
enhance carbon stock.
The selected species are
Pete (Parkia speciosa),
Durian (Durio zibethinus),
Alpukat (Persea
gratissima), Melinjo
(Gnetum gnemon), Nangka
(Arthocarpus
heteraphyllus),
Pakem (Pangiumedule)
However, for this REDD+
planting program, Pete
To increase the life
chances of planted
tree seedling there
are three enabling
conditions namely:
- Set planting
schedule at the
same time with
the beginning of
rainy season
- Select high
quality seedlings
(not too young
and not too old).
Main
implementer
(planting and
maintenance)
Providing
technical
assistance
Provide
seedling or
financial
support for
local
community to
produce
seedling.
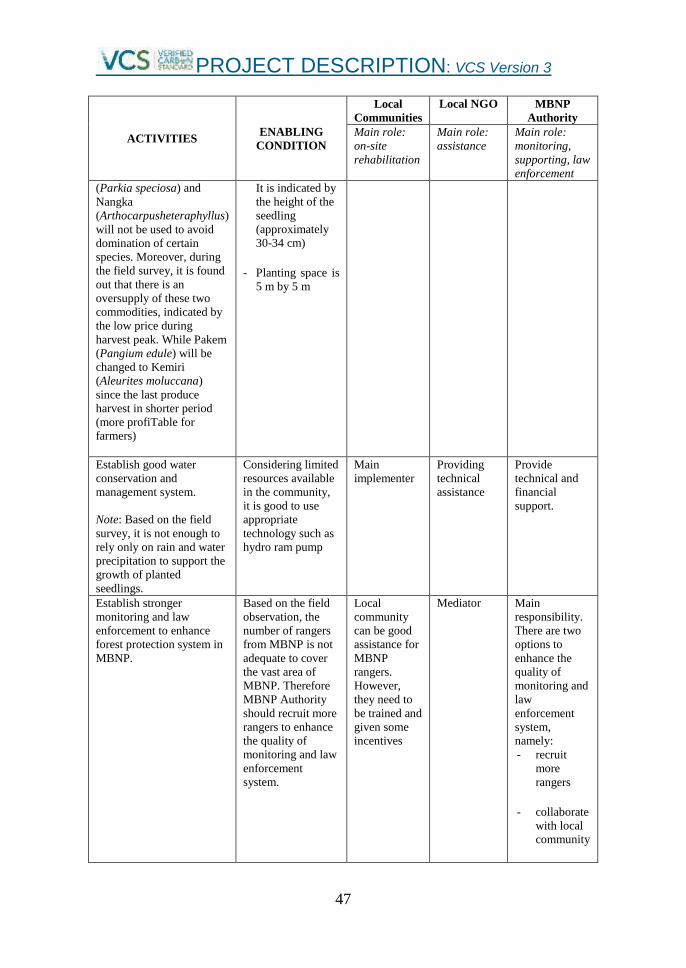
PROJECT DESCRIPTION: VCS Version 3
47
ACTIVITIES ENABLING
CONDITION
Local
Communities
Local NGO MBNP
Authority
Main role:
on-site
rehabilitation
Main role:
assistance
Main role:
monitoring,
supporting, law
enforcement
(Parkia speciosa) and
Nangka
(Arthocarpusheteraphyllus)
will not be used to avoid
domination of certain
species. Moreover, during
the field survey, it is found
out that there is an
oversupply of these two
commodities, indicated by
the low price during
harvest peak. While Pakem
(Pangium edule) will be
changed to Kemiri
(Aleurites moluccana)
since the last produce
harvest in shorter period
(more profiTable for
farmers)
It is indicated by
the height of the
seedling
(approximately
30-34 cm)
- Planting space is
5 m by 5 m
Establish good water
conservation and
management system.
Note: Based on the field
survey, it is not enough to
rely only on rain and water
precipitation to support the
growth of planted
seedlings.
Considering limited
resources available
in the community,
it is good to use
appropriate
technology such as
hydro ram pump
Main
implementer
Providing
technical
assistance
Provide
technical and
financial
support.
Establish stronger
monitoring and law
enforcement to enhance
forest protection system in
MBNP.
Based on the field
observation, the
number of rangers
from MBNP is not
adequate to cover
the vast area of
MBNP. Therefore
MBNP Authority
should recruit more
rangers to enhance
the quality of
monitoring and law
enforcement
system.
Local
community
can be good
assistance for
MBNP
rangers.
However,
they need to
be trained and
given some
incentives
Mediator Main
responsibility.
There are two
options to
enhance the
quality of
monitoring and
law
enforcement
system,
namely:
- recruit
more
rangers
- collaborate
with local
community
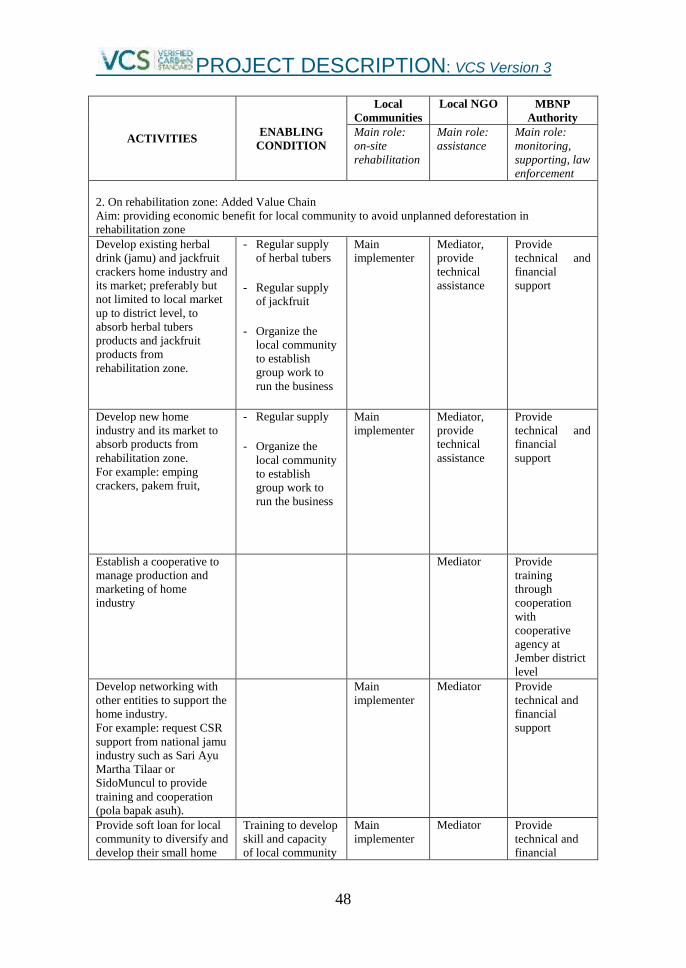
PROJECT DESCRIPTION: VCS Version 3
48
ACTIVITIES ENABLING
CONDITION
Local
Communities
Local NGO MBNP
Authority
Main role:
on-site
rehabilitation
Main role:
assistance
Main role:
monitoring,
supporting, law
enforcement
2. On rehabilitation zone: Added Value Chain
Aim: providing economic benefit for local community to avoid unplanned deforestation in
rehabilitation zone
Develop existing herbal
drink (jamu) and jackfruit
crackers home industry and
its market; preferably but
not limited to local market
up to district level, to
absorb herbal tubers
products and jackfruit
products from
rehabilitation zone.
- Regular supply
of herbal tubers
- Regular supply
of jackfruit
- Organize the
local community
to establish
group work to
run the business
Main
implementer
Mediator,
provide
technical
assistance
Provide
technical and
financial
support
Develop new home
industry and its market to
absorb products from
rehabilitation zone.
For example: emping
crackers, pakem fruit,
- Regular supply
- Organize the
local community
to establish
group work to
run the business
Main
implementer
Mediator,
provide
technical
assistance
Provide
technical and
financial
support
Establish a cooperative to
manage production and
marketing of home
industry
Mediator Provide
training
through
cooperation
with
cooperative
agency at
Jember district
level
Develop networking with
other entities to support the
home industry.
For example: request CSR
support from national jamu
industry such as Sari Ayu
Martha Tilaar or
SidoMuncul to provide
training and cooperation
(pola bapak asuh).
Main
implementer
Mediator Provide
technical and
financial
support
Provide soft loan for local
community to diversify and
develop their small home
Training to develop
skill and capacity
of local community
Main
implementer
Mediator Provide
technical and
financial
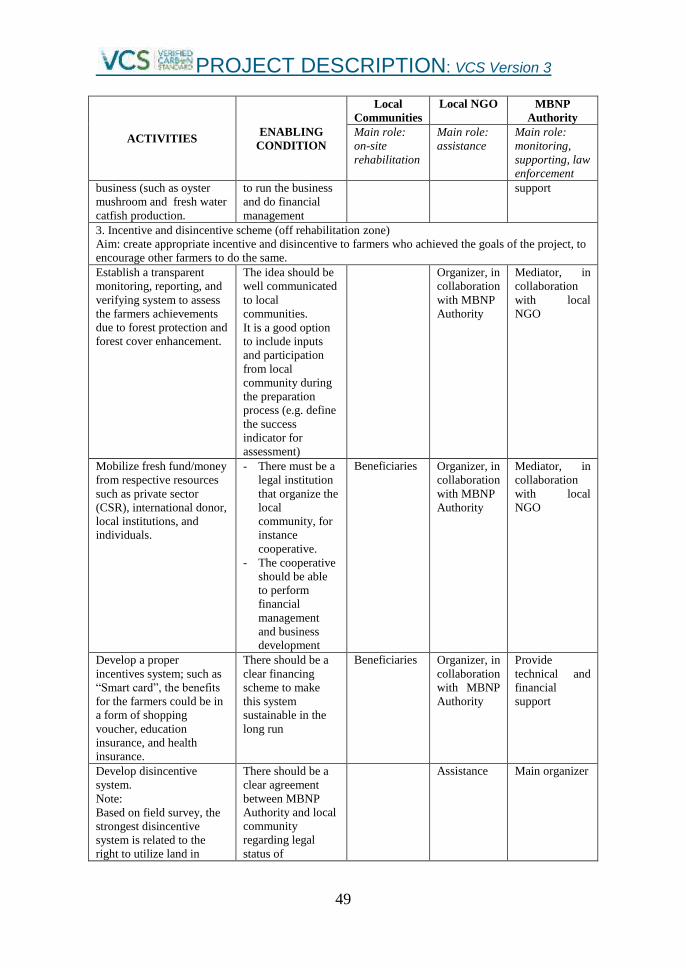
PROJECT DESCRIPTION: VCS Version 3
49
ACTIVITIES ENABLING
CONDITION
Local
Communities
Local NGO MBNP
Authority
Main role:
on-site
rehabilitation
Main role:
assistance
Main role:
monitoring,
supporting, law
enforcement
business (such as oyster
mushroom and fresh water
catfish production.
to run the business
and do financial
management
support
3. Incentive and disincentive scheme (off rehabilitation zone)
Aim: create appropriate incentive and disincentive to farmers who achieved the goals of the project, to
encourage other farmers to do the same.
Establish a transparent
monitoring, reporting, and
verifying system to assess
the farmers achievements
due to forest protection and
forest cover enhancement.
The idea should be
well communicated
to local
communities.
It is a good option
to include inputs
and participation
from local
community during
the preparation
process (e.g. define
the success
indicator for
assessment)
Organizer, in
collaboration
with MBNP
Authority
Mediator, in
collaboration
with local
NGO
Mobilize fresh fund/money
from respective resources
such as private sector
(CSR), international donor,
local institutions, and
individuals.
- There must be a
legal institution
that organize the
local
community, for
instance
cooperative.
- The cooperative
should be able
to perform
financial
management
and business
development
Beneficiaries Organizer, in
collaboration
with MBNP
Authority
Mediator, in
collaboration
with local
NGO
Develop a proper
incentives system; such as
―Smart card‖, the benefits
for the farmers could be in
a form of shopping
voucher, education
insurance, and health
insurance.
There should be a
clear financing
scheme to make
this system
sustainable in the
long run
Beneficiaries Organizer, in
collaboration
with MBNP
Authority
Provide
technical and
financial
support
Develop disincentive
system.
Note:
Based on field survey, the
strongest disincentive
system is related to the
right to utilize land in
There should be a
clear agreement
between MBNP
Authority and local
community
regarding legal
status of
Assistance Main organizer
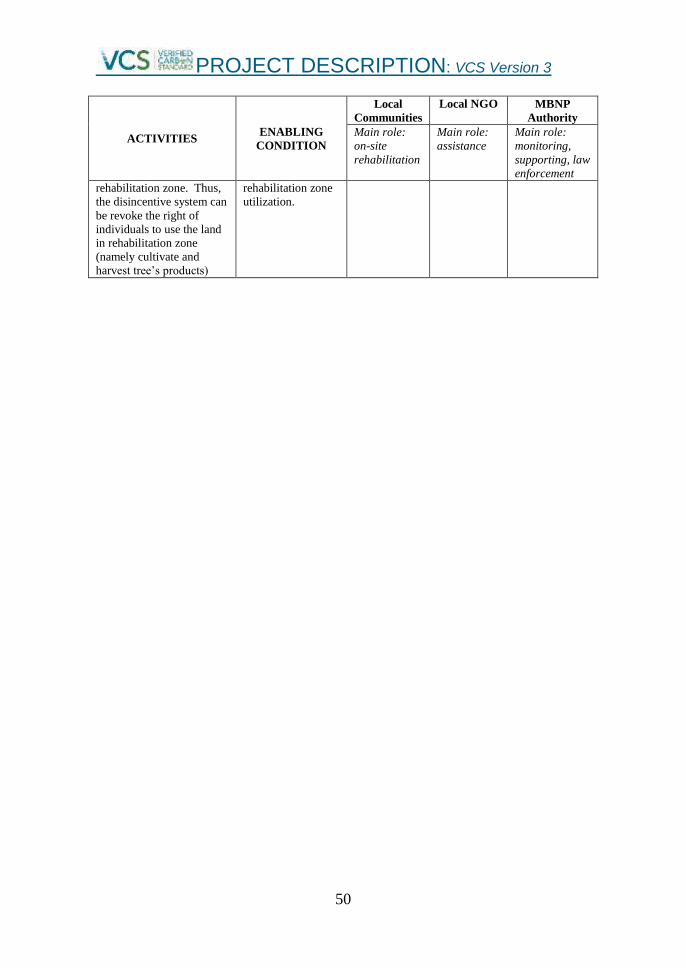
PROJECT DESCRIPTION: VCS Version 3
50
ACTIVITIES ENABLING
CONDITION
Local
Communities
Local NGO MBNP
Authority
Main role:
on-site
rehabilitation
Main role:
assistance
Main role:
monitoring,
supporting, law
enforcement
rehabilitation zone. Thus,
the disincentive system can
be revoke the right of
individuals to use the land
in rehabilitation zone
(namely cultivate and
harvest tree‘s products)
rehabilitation zone
utilization.

PROJECT DESCRIPTION: VCS Version 3
51
APPENDIX 2. FLORA IN MERU BETIRI NATIONAL PARK
Meru Betiri National Park region is tropical rain forest with varied forest formations which
are divided into five types of vegetation namely coastal forest, mangrove forest, swamp
forest, rheophyte forest and lowland rain forest. Conditions and spercies of each type of
vegetation in the area of Meru Betiri National Park can be explained as follows :
Vegetation Type of Coastal Forest
This vegetation type spreads along the southern coast in the narrow forest group, generally
occupy the area around the bay that has flat topography, for example in Permisan Gulf,
Meru Bay, Bandealit Gulf , and Rajegwesi Gulf. Formation of coastal forest vegetation
consists of two main types, namely the formation of beach potato (Ipomea pescaprae), and
Barringtonia formation (with height of 25-50 m ) on a flat slope beach area and decrease the
extent on the steep and rocky beaches. Baringtonia formation consists of keben (Baringtonia
asiatica) , nyamplung (Calophyllum inophyllum) , ketapang (Terminalia catappa), pandan
(Pandanus tectorius) and others.
Pescaprae Formation consists of low-growing vegetationwith type of herbs, mostly creepers
such as sweet potato (Ipomoea pescaprae) and grass (Spinifex squarosus).
Vegetation Type of Mangrove Forest
This vegetation can be found in the eastern part of the Gulf Rajegwesi which is in the mouth
of the Sungai Lembu and Karang Tambak, Gulf Meru and Sukamade a forest vegetation that
grows in tidal lines. The dominant types of vegetation are: pedada (Sonneratia caseolaris)
and tancang (Bruguiera gymnorhiza). At the estuary of the Sukamade river there are good
formationsof palm (Nypa fruticans).
Vegetation Type of Swamp Forest
This vegetation can be found behind the Sukamade brackish forest.Types of vegetation
found include: mango (Mangifera sp), sawo kecik (Manilkara kauki) rengas (Gluta
renghas), Pulai (Alstonia scholaris), kepuh (Sterculia foetida) .
Vegetation Type of RheophytForest This vegetation type is found in areas flooded by the river flow and the type of vegetation
that grows supposedly influenced by the swift currents of the river, such as valleys of
Sukamade river, Sanen River and Bandealit River. Species that grow include glagah
(Saccharum spontanum), elephant grass (Panisetum curcurium) and some short-lived herbs
and grasses.
Vegetation Type of Tropical Lowland Rain Forest
This vegetation type is a mixture of lowland tropical rain forest and mountain tropical rain
forest. Various flora of lowland tropical rain forests cover almost all of the land surface of
Meru Betiri National Park, with a hot climate and quite a lot of rainfall with even
distribution. Tropical rain forest in the mountains grow on the altitude of 600-1300 m above
sea level . Most of the forest area Betiri Meru National Park is the type of vegetation of
lowland tropical rain forest. In this type of vegetation also grows many species of epiphytes,
such as orchids and ferns and lianas.
Vegetation species that are often found include: walangan (Pterospermum diversifolium),
Winong (Tetrameles nudiflora), gondang (Ficus variegata), budengan (Diospyros
cauliflora), pancal (Aglaia variegata , rau (Dracontomelon mangiferum), glintungan
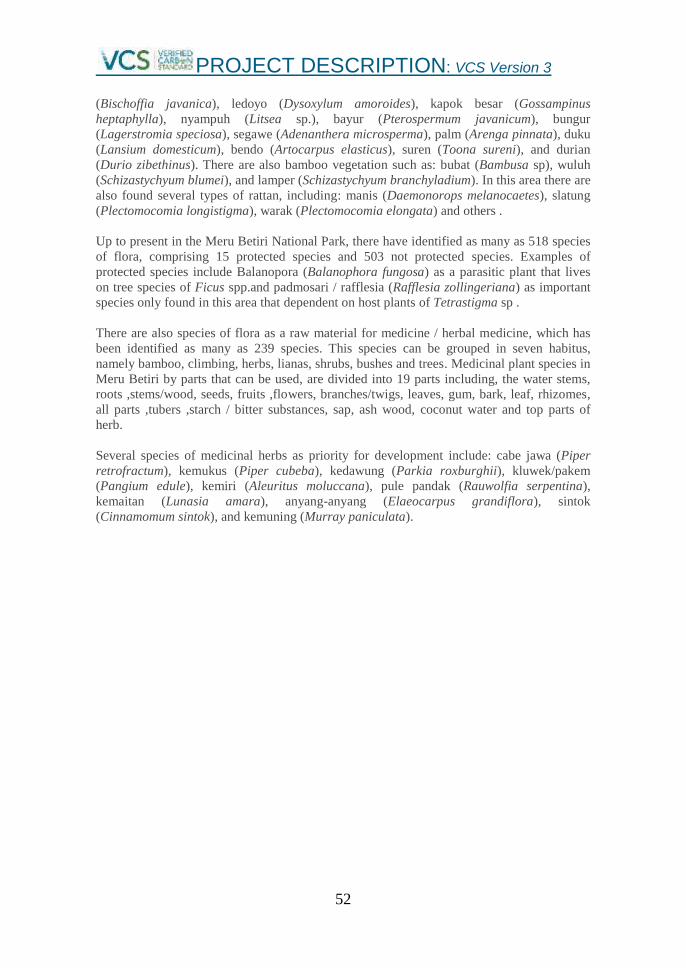
PROJECT DESCRIPTION: VCS Version 3
52
(Bischoffia javanica), ledoyo (Dysoxylum amoroides), kapok besar (Gossampinus
heptaphylla), nyampuh (Litsea sp.), bayur (Pterospermum javanicum), bungur
(Lagerstromia speciosa), segawe (Adenanthera microsperma), palm (Arenga pinnata), duku
(Lansium domesticum), bendo (Artocarpus elasticus), suren (Toona sureni), and durian
(Durio zibethinus). There are also bamboo vegetation such as: bubat (Bambusa sp), wuluh
(Schizastychyum blumei), and lamper (Schizastychyum branchyladium). In this area there are
also found several types of rattan, including: manis (Daemonorops melanocaetes), slatung
(Plectomocomia longistigma), warak (Plectomocomia elongata) and others .
Up to present in the Meru Betiri National Park, there have identified as many as 518 species
of flora, comprising 15 protected species and 503 not protected species. Examples of
protected species include Balanopora (Balanophora fungosa) as a parasitic plant that lives
on tree species of Ficus spp.and padmosari / rafflesia (Rafflesia zollingeriana) as important
species only found in this area that dependent on host plants of Tetrastigma sp .
There are also species of flora as a raw material for medicine / herbal medicine, which has
been identified as many as 239 species. This species can be grouped in seven habitus,
namely bamboo, climbing, herbs, lianas, shrubs, bushes and trees. Medicinal plant species in
Meru Betiri by parts that can be used, are divided into 19 parts including, the water stems,
roots ,stems/wood, seeds, fruits ,flowers, branches/twigs, leaves, gum, bark, leaf, rhizomes,
all parts ,tubers ,starch / bitter substances, sap, ash wood, coconut water and top parts of
herb.
Several species of medicinal herbs as priority for development include: cabe jawa (Piper
retrofractum), kemukus (Piper cubeba), kedawung (Parkia roxburghii), kluwek/pakem
(Pangium edule), kemiri (Aleuritus moluccana), pule pandak (Rauwolfia serpentina),
kemaitan (Lunasia amara), anyang-anyang (Elaeocarpus grandiflora), sintok
(Cinnamomum sintok), and kemuning (Murray paniculata).
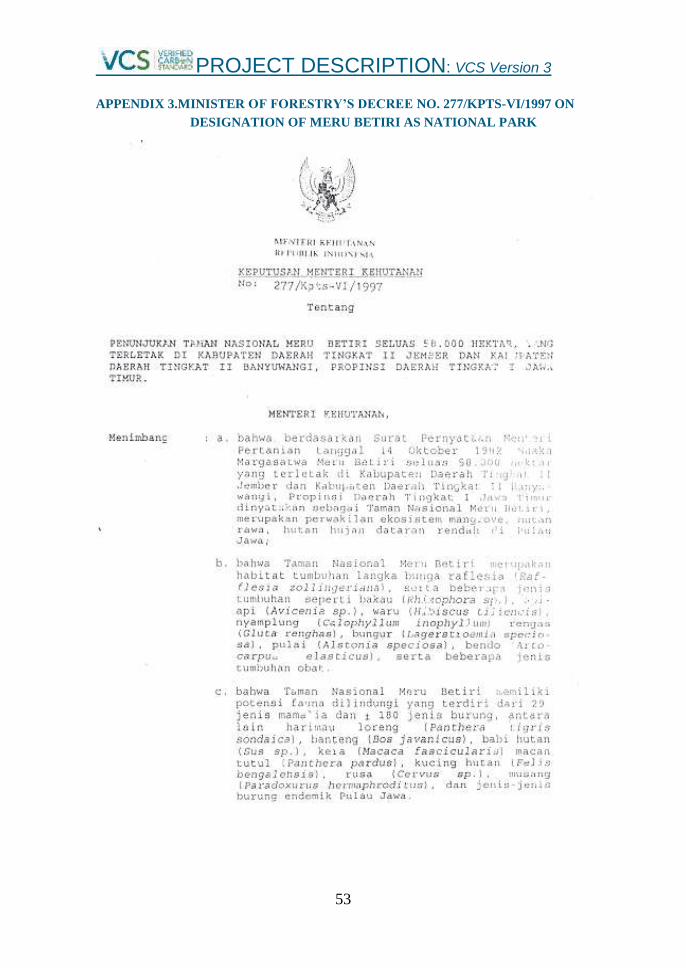
PROJECT DESCRIPTION: VCS Version 3
53
APPENDIX 3.MINISTER OF FORESTRY’S DECREE NO. 277/KPTS-VI/1997 ON
DESIGNATION OF MERU BETIRI AS NATIONAL PARK

PROJECT DESCRIPTION: VCS Version 3
54
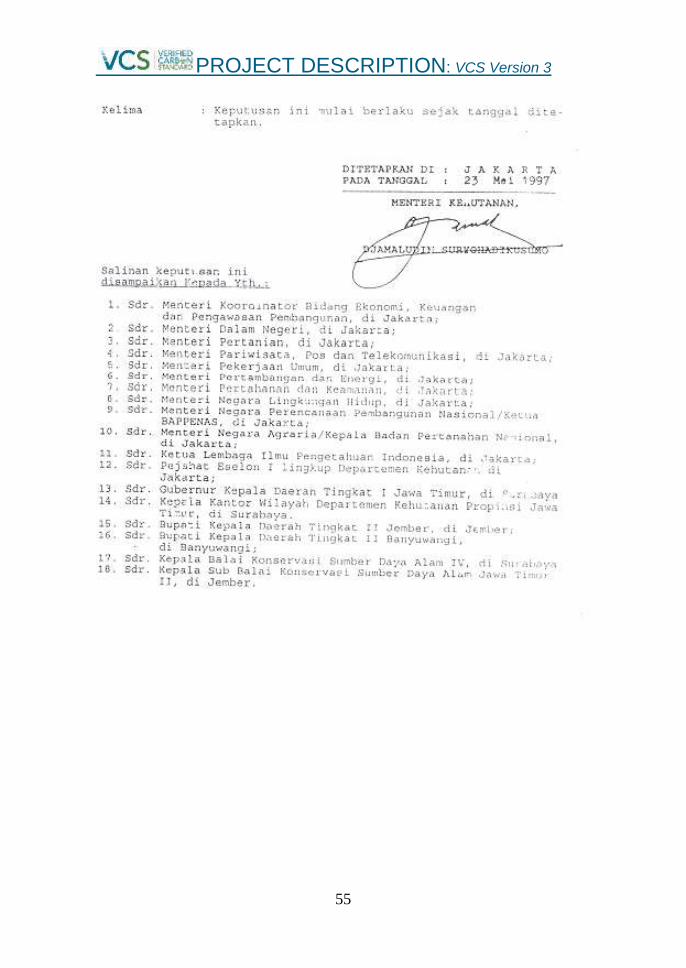
PROJECT DESCRIPTION: VCS Version 3
55

PROJECT DESCRIPTION: VCS Version 3
56
APPENDIX 4. SAMPLE OF MOU BETWEEN MBNP AUTHORITY AND FARMER
GROUPS REGARDING REDD+ AND UTILIZATIONOFREHABILITATION ZONE
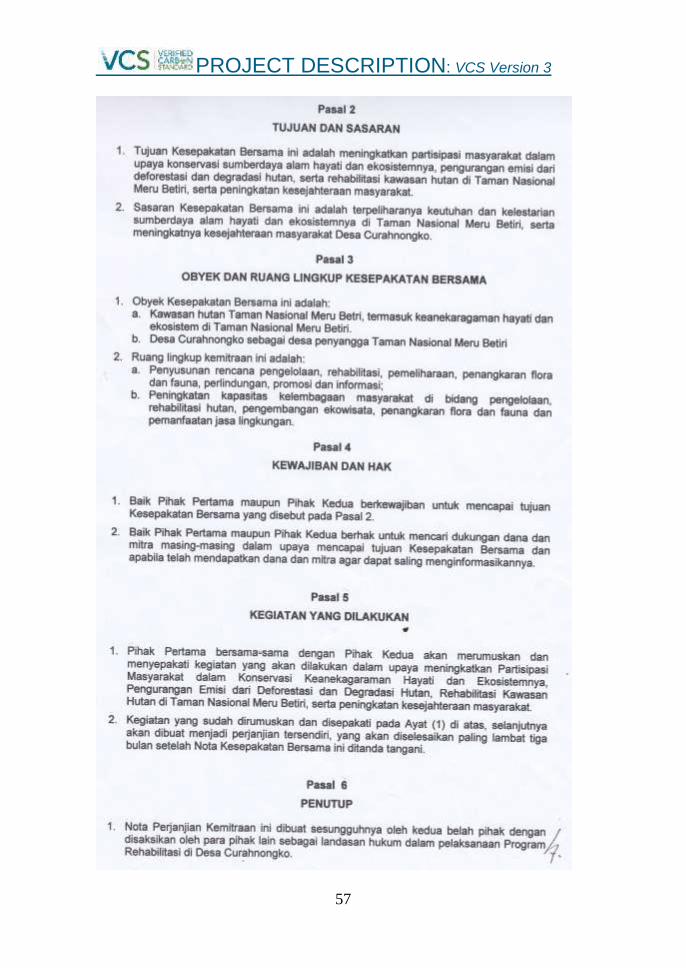
PROJECT DESCRIPTION: VCS Version 3
57
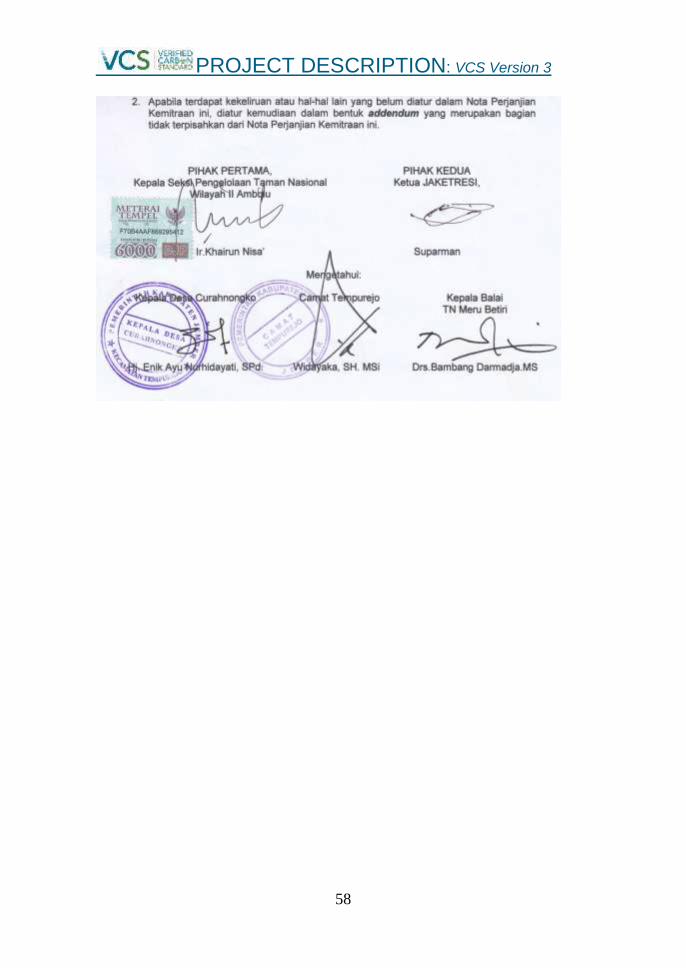
PROJECT DESCRIPTION: VCS Version 3
58
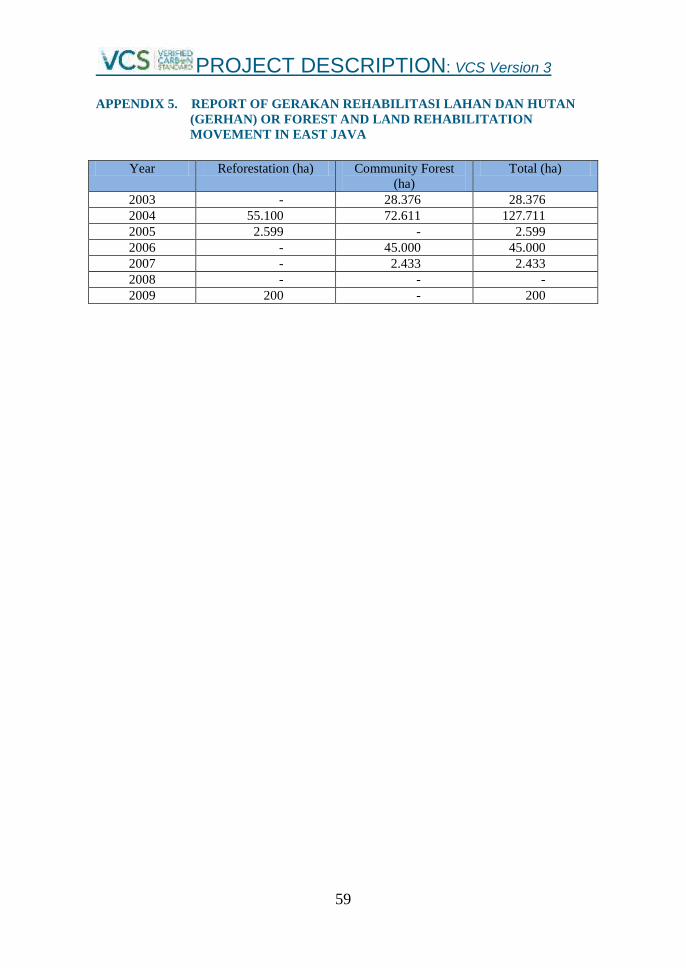
PROJECT DESCRIPTION: VCS Version 3
59
APPENDIX 5. REPORT OF GERAKAN REHABILITASI LAHAN DAN HUTAN
(GERHAN) OR FOREST AND LAND REHABILITATION
MOVEMENT IN EAST JAVA
Year Reforestation (ha) Community Forest
(ha)
Total (ha)
2003 - 28.376 28.376
2004 55.100 72.611 127.711
2005 2.599 - 2.599
2006 - 45.000 45.000
2007 - 2.433 2.433
2008 - - -
2009 200 - 200
Related Documents