A Vector Field Color Rendition Model for Characterizing Color Shifts and Metameric Mismatch Aurelien David 1 Tony Esposito 2 Kevin Houser 3 Michael Royer 4 Kevin A.G. Smet 5 Lorne Whitehead 6 1 Soraa, 2 Esposito Research, 3 Pennsylvania State University, 4 Pacific Northwest National Laboratory, 5 ESAT / Light & Lighting Laboratory, KU Leuven, 6 Department of Physics and Astronomy, University of British Columbia This is an archival copy of an article published in LEUKOS. Please cite as: Aurelien David, Tony Esposito, Kevin Houser, Michael Royer, Kevin A. G. Smet & Lorne Whitehead (2019) A Vector Field Color Rendition Model for Characterizing Color Shifts and Metameric Mismatch, LEUKOS, DOI: 10.1080/15502724.2018.1554369

Welcome message from author
This document is posted to help you gain knowledge. Please leave a comment to let me know what you think about it! Share it to your friends and learn new things together.
Transcript
A Vector Field Color Rendition Model for Characterizing Color Shifts and Metameric Mismatch Aurelien David1 Tony Esposito2 Kevin Houser3 Michael Royer4 Kevin A.G. Smet5 Lorne Whitehead6
1Soraa, 2Esposito Research, 3Pennsylvania State University, 4Pacific Northwest National Laboratory, 5ESAT / Light & Lighting Laboratory, KU Leuven, 6Department of Physics and Astronomy, University of British Columbia
This is an archival copy of an article published in LEUKOS. Please cite as:
Aurelien David, Tony Esposito, Kevin Houser, Michael Royer, Kevin A. G. Smet & Lorne Whitehead (2019) A Vector Field Color Rendition Model for Characterizing Color Shifts and Metameric Mismatch, LEUKOS, DOI: 10.1080/15502724.2018.1554369
1
A Vector Field Color Rendition Model for Characterizing
Color Shifts and Metameric Mismatch
Aurelien David1, Tony Esposito2, Kevin Houser3, Michael Royer4, Kevin A.G. Smet5, Lorne Whitehead6
1Soraa, 2Esposito Research, 3Pennsylvania State University, 4Pacific Northwest National Laboratory, 5ESAT / Light & Lighting Laboratory, KU Leuven, 6Department of Physics and Astronomy, University of British
Columbia
Abstract This article describes a way to distinguish between two distinct components of light-source-induced color shifts, base color shift and metameric color shift, to provide a more complete understanding of color rendition. Working within the existing framework of IES TM-30-18 and CIE 224:2017, it shows that base color shift varies smoothly with location in color space in a pattern that is determined by the SPD of the light source. Patterns of smooth variation can often be approximated well with a low-order polynomial function. Here, a vector field model is presented, based on a second order polynomial function. The polynomial coefficients are adjusted, for a given light source, to provide a least squares fit to the calculated color shifts of a standard set of color samples. The adequacy of this model was verified by comparing it to another approach for characterizing base color shift that is based on discretization of color space and a much larger set of color samples. Once the vector field model of base color shifts for a given light source is determined, the metameric color shifts can be calculated from the residuals, and the distribution of those shifts can be statistically summarized. Based on this information, a Metameric Uncertainty Index (Rt) is proposed to provide new information about a light source. In particular, it can be used to estimate the likelihood of noticeable metameric mismatches induced by a given light source, which could lead to improved predictions of the perceived color quality of light. 1. Introduction The color appearance of an object can shift when the spectral power distribution (SPD) of the illumination is altered, even if the chromaticity and illuminance are held constant. This phenomenon of light-source-induced color shifts is an important concept underlying color perception research, which includes studies that range from the purely objective, such as spectral radiometry, to highly subjective issues of human well-being. Because there is some inconsistency in the use of some terms within the relevant literature, we present definitions for key terms that appear herein in Table 1. This work builds upon existing methods and introduces new color rendition measures, with the ultimate goal of better understanding the effect of illumination on human color experience, and finding practical ways to improve it. Generally speaking, quantitative efforts for characterizing color rendition seek to capture the complex interaction of a light source SPD and objects’ spectral reflectance functions (SRFs) by distilling this extremely large data set to a much smaller one that correlates with key aspects of people’s experiences. Much like image compression formats (for example, JPEG), quantitative color rendition measures and metrics “compress” information by assessing salient aspects of color information that are important for developing and specifying light sources. Table 1 summarizes terms employed in this manuscript. Most color rendition measures and metrics rely on a common framework to characterize a light source. These are: (1) a set of SRFs that are intended to
2
represent the diverse range of colors found in real lighting applications, (2) a perception-based mathematical model of color appearance, and (3) a defined means for specifying the SPD of the reference illuminant, to which the test light source is compared. Accordingly, for each color sample, the color shift is calculated as the vector difference between the sample’s color appearance under the test light source and under the reference illuminant. This calculated set of color shifts is often too much data for practical purposes, so the information is usually further simplified by summarizing it mathematically to yield measures or metrics of color rendition that correlate with people’s experiences. In this work, we build on the common framework of color samples, color appearance model, and reference illuminants established in IES TM-30 [IES 2015, 2018] and CIE 224:2017 [CIE 2017]. These are
Table 1. Terminology.
Term Description
Spectral Power Distribution (SPD) The quantity of electromagnetic radiation as a function of wavelength.
Spectral Radiance Factor, or Spectral Reflectance Function (SRF)
The reflectance of surface as a function of wavelength. A given SRF may be referred to as a color sample.
Color Appearance The perceived color of a surface, under a selected illuminant, in a selected context, as quantified with a set of coordinates in a color space, such as (J', a', b') coordinates in CAM02-UCS.
Color Shift The vector difference between an object’s color appearance when illuminated by a test light source and its color appearance when illuminated by a specified reference illuminant.
Metameric Mismatch A color difference that appears under a test light source between two color samples that are metameric when illuminated by a specified reference illuminant.
Base Color Shift At a specified location in color space, the vector average of the color shifts of many color samples whose color appearance values are the same (or approximately the same), when illuminated by a reference illuminant.
Metameric Color Shift The vector difference between a color sample’s actual color shift and the base color shift for the location in color space corresponding to that sample’s color appearance when illuminated by the reference illuminant.
Color Rendition The effect of an illuminant spectral power distribution on the color appearance of objects, including the color appearance and color shift of an individual object (color sample), of sets of objects (color samples), and in more general observations, and related subjective assessments of the color quality of illumination.
Color Rendition Measure A numerical quantity summarizing, and calculated from, color shift data, for the purpose of characterizing a comparatively objective aspect of color rendition for a nominally white light source.
Color Rendition Metric A numerical quantity summarizing, and calculated from, color shift data, for the purpose of characterizing a comparatively subjective aspect of color rendition for a nominally white light source.
3
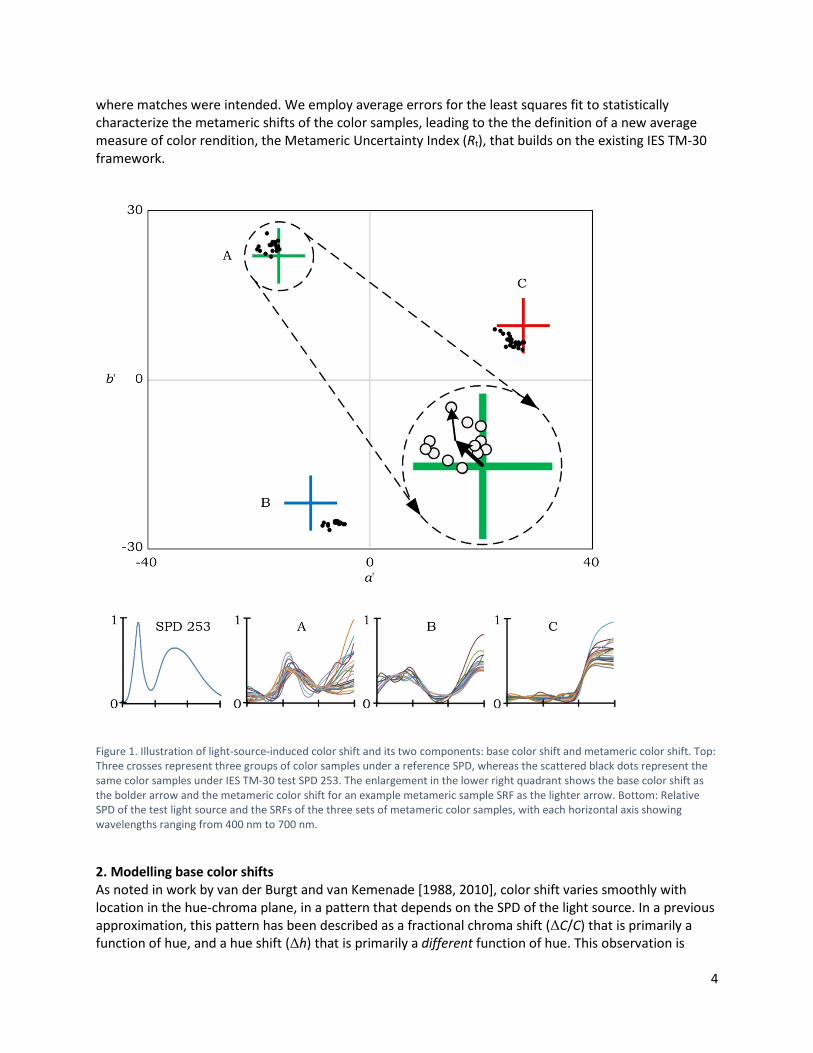
now in use worldwide by lighting manufacturers (see LED Lighting Facts), specification programs (for example, WELL Building Standard, U.S. Department of Defense, and ENERGY STAR), researchers, and others; no change is proposed to them. Further, both IES TM-30 and CIE 224 present certain color rendering measures: both define the same color fidelity metric, Rf, and TM-30 presents a range of additional measures, including a gamut measure Rg and information about color shift averages in 16 hue-angle bins. This paper proposes no change to those existing color rendition measures. Rather, two new color rendition measures are presented. They provide new information that may also be helpful for developing future color rendition metrics for better predicting overall human color experience. Both are based on an observation from previous studies of large numbers of color samples representing real objects: For any selected light source, in any given region in color space, there is an average color shift compared to a reference (here called the base color shift), and a distribution of color shifts around that average (here called the metameric color shift). 1.1 Base color shift versus metameric color shift A pair (or set) of objects may have different spectral reflectance functions but the same color coordinates. Such objects are said to be a metameric, and this general concept is often called object metamerism. Object metamerism is not absolute because it depends on the SPD of the illuminant. Accordingly, metameric objects will generally not appear the same color when illuminated by an SPD other than the one under which they are metamers, even if the light source chromaticities match. Metameric mismatch is therefore one factor affecting the color rendering characteristics of light sources. Figure 1 represents color coordinates for three different groups of color samples under a test SPD (dots) and reference illuminant SPD (crosses). Under the reference illuminant SPD, the color samples in each group share a color coordinate (J', a', b') in the CAM02-UCS color space [Luo and others 2006]—and hence plot to the same, single coordinate in the two-dimensional (a', b') graph. The cloud-like scatter of points for the color samples under the test SPD shows how these color samples shift in different ways. The points in each cloud can be described by a base color shift toward the center of the pattern, plus an additional metameric color shift about the center that arises from the light-source-induced breakdown of metamerism. They are similar in two ways: both depend on the SPD of the light source, and typically, the magnitude of the metameric color shift is neither much greater, nor much less, than that of the base color shift. Nevertheless, these are distinctly different phenomena. As will be illustrated, the base shift varies smoothly with location in color space in a pattern that is determined by the SPD of the light source. We use the word “smoothly” to mean that adjacent positions in the (a', b') plane of color space are free from abrupt unevenness in the orientation and magnitude of base color shifts. This behavior allows base color shifts for unknown color samples to be predicted from an array of actual color shifts from known color samples. We propose a model of base color shift in the (a', b') plane that is a second order polynomial vector function, with the coefficients adjusted to yield the least squares best fit to the actual color shift data. This is generally referred to here as the vector field approach, and as the VF method when used in the specific framework of IES TM-30. In contrast, the metameric color shift is dependent on the specific color sample. Thus, metameric color shift becomes a source of uncertainty when applying color rendition measures based on a standardized sample set to any other SRFs, such as the objects in a real space. As will be shown, some light sources induce relatively higher levels of this uncertainty, independent of other measures of color rendition, such as color fidelity. This also means that such light sources are more likely to lead to color mismatches
4
where matches were intended. We employ average errors for the least squares fit to statistically characterize the metameric shifts of the color samples, leading to the the definition of a new average measure of color rendition, the Metameric Uncertainty Index (Rt), that builds on the existing IES TM-30 framework.
Figure 1. Illustration of light-source-induced color shift and its two components: base color shift and metameric color shift. Top: Three crosses represent three groups of color samples under a reference SPD, whereas the scattered black dots represent the same color samples under IES TM-30 test SPD 253. The enlargement in the lower right quadrant shows the base color shift as the bolder arrow and the metameric color shift for an example metameric sample SRF as the lighter arrow. Bottom: Relative SPD of the test light source and the SRFs of the three sets of metameric color samples, with each horizontal axis showing wavelengths ranging from 400 nm to 700 nm.
2. Modelling base color shifts As noted in work by van der Burgt and van Kemenade [1988, 2010], color shift varies smoothly with location in the hue-chroma plane, in a pattern that depends on the SPD of the light source. In a previous approximation, this pattern has been described as a fractional chroma shift (ΔC/C) that is primarily a function of hue, and a hue shift (Δh) that is primarily a different function of hue. This observation is
5
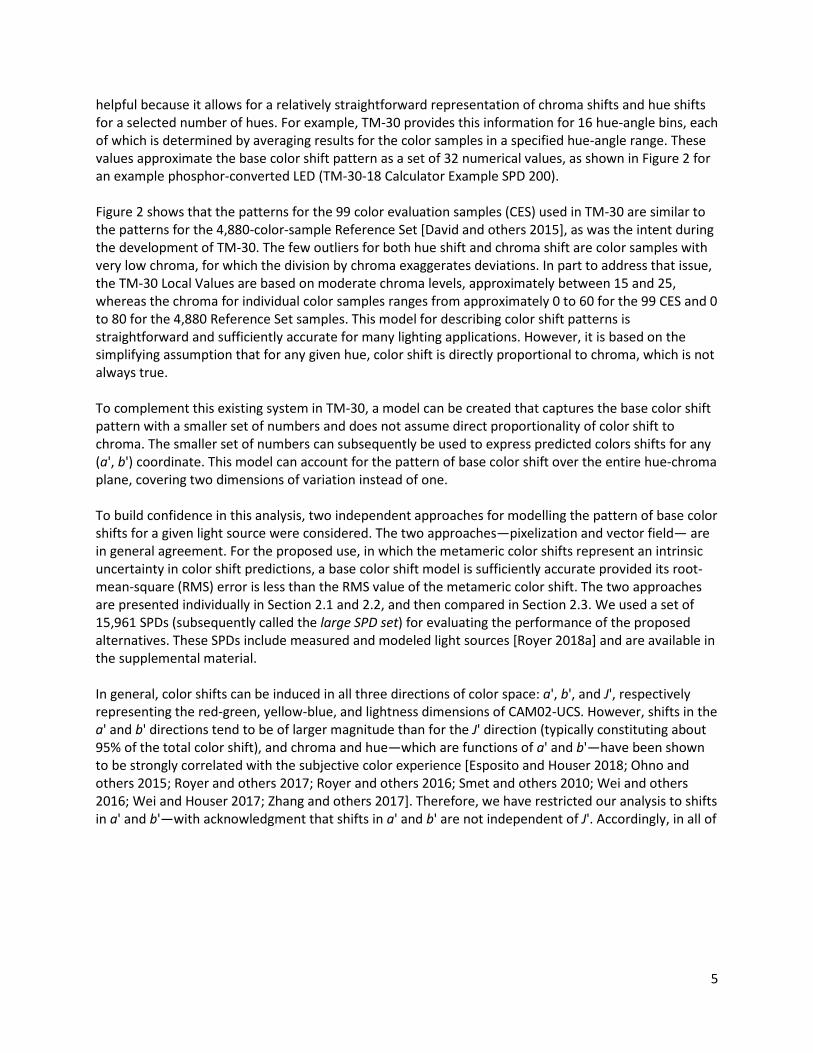
helpful because it allows for a relatively straightforward representation of chroma shifts and hue shifts for a selected number of hues. For example, TM-30 provides this information for 16 hue-angle bins, each of which is determined by averaging results for the color samples in a specified hue-angle range. These values approximate the base color shift pattern as a set of 32 numerical values, as shown in Figure 2 for an example phosphor-converted LED (TM-30-18 Calculator Example SPD 200). Figure 2 shows that the patterns for the 99 color evaluation samples (CES) used in TM-30 are similar to the patterns for the 4,880-color-sample Reference Set [David and others 2015], as was the intent during the development of TM-30. The few outliers for both hue shift and chroma shift are color samples with very low chroma, for which the division by chroma exaggerates deviations. In part to address that issue, the TM-30 Local Values are based on moderate chroma levels, approximately between 15 and 25, whereas the chroma for individual color samples ranges from approximately 0 to 60 for the 99 CES and 0 to 80 for the 4,880 Reference Set samples. This model for describing color shift patterns is straightforward and sufficiently accurate for many lighting applications. However, it is based on the simplifying assumption that for any given hue, color shift is directly proportional to chroma, which is not always true. To complement this existing system in TM-30, a model can be created that captures the base color shift pattern with a smaller set of numbers and does not assume direct proportionality of color shift to chroma. The smaller set of numbers can subsequently be used to express predicted colors shifts for any (a', b') coordinate. This model can account for the pattern of base color shift over the entire hue-chroma plane, covering two dimensions of variation instead of one. To build confidence in this analysis, two independent approaches for modelling the pattern of base color shifts for a given light source were considered. The two approaches—pixelization and vector field— are in general agreement. For the proposed use, in which the metameric color shifts represent an intrinsic uncertainty in color shift predictions, a base color shift model is sufficiently accurate provided its root-mean-square (RMS) error is less than the RMS value of the metameric color shift. The two approaches are presented individually in Section 2.1 and 2.2, and then compared in Section 2.3. We used a set of 15,961 SPDs (subsequently called the large SPD set) for evaluating the performance of the proposed alternatives. These SPDs include measured and modeled light sources [Royer 2018a] and are available in the supplemental material. In general, color shifts can be induced in all three directions of color space: a', b', and J', respectively representing the red-green, yellow-blue, and lightness dimensions of CAM02-UCS. However, shifts in the a' and b' directions tend to be of larger magnitude than for the J' direction (typically constituting about 95% of the total color shift), and chroma and hue—which are functions of a' and b'—have been shown to be strongly correlated with the subjective color experience [Esposito and Houser 2018; Ohno and others 2015; Royer and others 2017; Royer and others 2016; Smet and others 2010; Wei and others 2016; Wei and Houser 2017; Zhang and others 2017]. Therefore, we have restricted our analysis to shifts in a' and b'—with acknowledgment that shifts in a' and b' are not independent of J'. Accordingly, in all of
6
the following, calculations were performed in the a'-b' plane, and the J' component of the color coordinates was not taken into account. In theory, the final models presented for future consideration
Figure 2. Patterns in base color shift can be identified using first-order approximations of ΔC/C versus hue angle and Δh versus hue angle. IES TM-30-18 quantifies this pattern with 16 Local Chroma Shift and 16 Local Hue Shift values, which are plotted in these charts at the center of each hue angle bin.
7
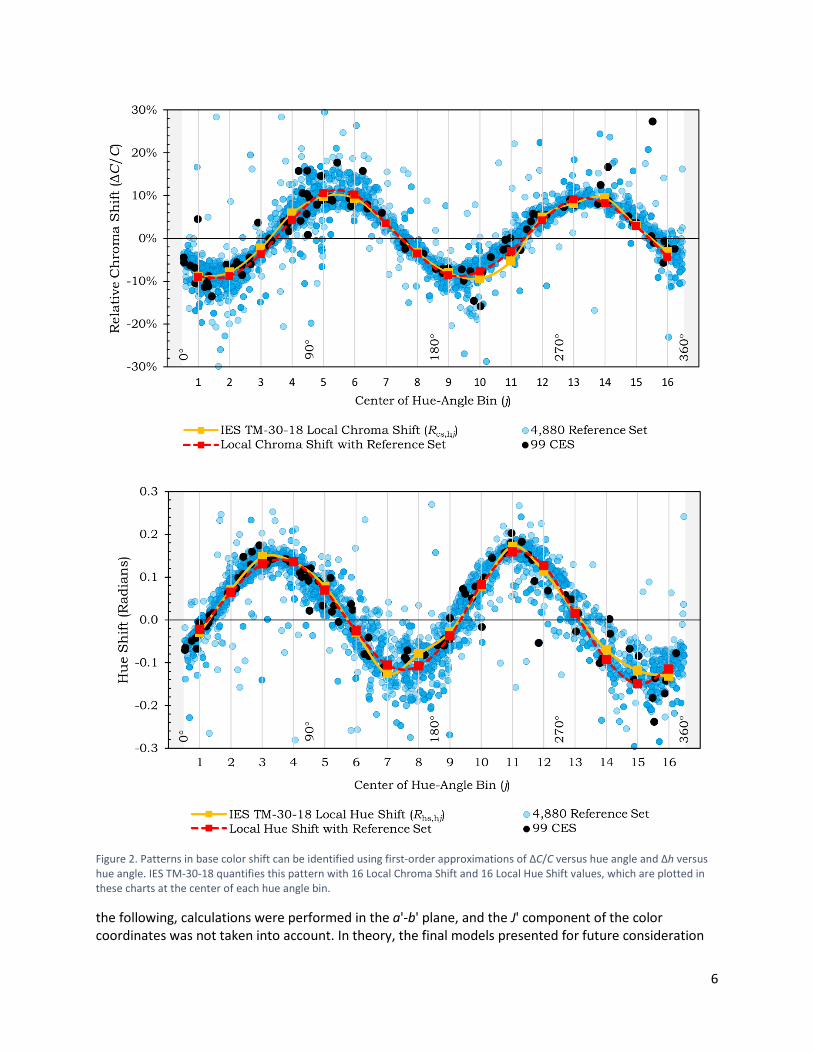
could be expanded with additional terms to capture behavior in the J’ dimension, but complexity would be increased with minimal expected benefit. 2.1 Method 1: Pixelization One method for characterizing the pattern of base color shifts is to divide the a'-b' plane of CAM02-UCS into a series of constituent pixels to evenly sample the entire plane with sufficient resolution. Given a sufficiently large set of color samples and a reference illuminant SPD, each pixel contains a number of samples, which undergo individual color shifts (that is, a vector in the a'-b' plane) when changing to the test SPD. The local base color shift at a pixel center’s location in the a'-b' plane is estimated as the average over all color samples belonging to that pixel. We applied the pixelization method to the TM-30 Reference Set, with this combination subsequently denoted PXL. This set of 4,880 carefully-selected color samples, used as a precursor to the 99 CES of TM-30, possesses desirable properties: it has a sufficient quantity of real color samples and they are uniformly distributed in color space and in wavelength space [Smet and others 2015]. The pixelization approach requires that the pixels be large enough to contain enough color samples (so that metameric color shifts are averaged out) but small enough that the scale over which the average color shift varies is greater than the pixel size. We have found that pixel sizes in the range of 5-10 units fulfilled these criteria (with the specific size of the pixel having negligible influence on the results) when using the Reference Set. Figure 3 illustrates the process of estimating the local base color shift with the PXL method.
Figure 3: Illustration of the PXL method. For a given SPD (here a phosphor-converted LED), color shifts are computed for the Reference Set. (a) Individual color shifts for all color samples inside a given pixel (here of size 5, shown as the black box). (b) The same shifts once the origin of each vector is offset to the center of the pixel (blue arrows), and the average resulting shift in the pixel (red arrow). (c) The corresponding vector field, built by repeating this procedure for each pixel.
2.2 Method 2: Vector Field An alternative approach to identifying base color shift patterns is to use a vector field model. In this application, the vector field model is simply a function that generates, for each point in the a'-b' plane, a color shift vector (Δa'm, Δb'm) for the test SPD relative to the reference illuminant SPD, where the subscript m indicates the modelled value. Δa'm and Δb'm are both parametric functions of the coordinates a' and b'. The function’s coefficients are determined such that the modelled base color
8
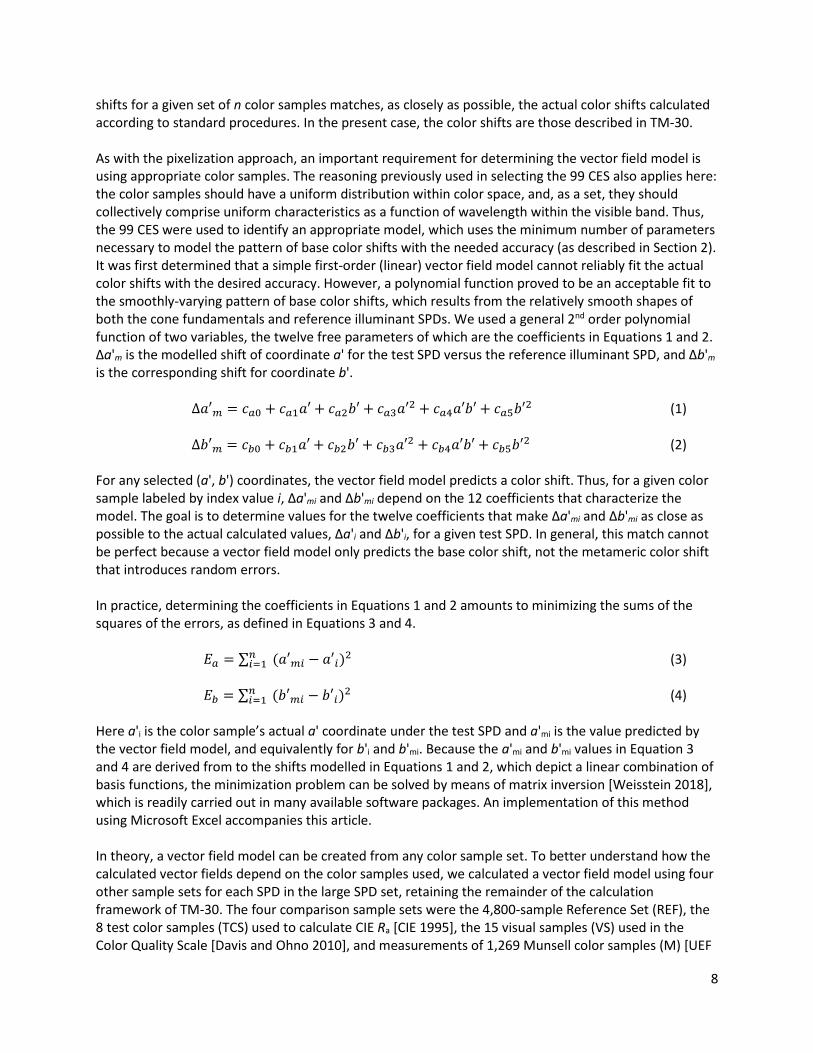
shifts for a given set of n color samples matches, as closely as possible, the actual color shifts calculated according to standard procedures. In the present case, the color shifts are those described in TM-30. As with the pixelization approach, an important requirement for determining the vector field model is using appropriate color samples. The reasoning previously used in selecting the 99 CES also applies here: the color samples should have a uniform distribution within color space, and, as a set, they should collectively comprise uniform characteristics as a function of wavelength within the visible band. Thus, the 99 CES were used to identify an appropriate model, which uses the minimum number of parameters necessary to model the pattern of base color shifts with the needed accuracy (as described in Section 2). It was first determined that a simple first-order (linear) vector field model cannot reliably fit the actual color shifts with the desired accuracy. However, a polynomial function proved to be an acceptable fit to the smoothly-varying pattern of base color shifts, which results from the relatively smooth shapes of both the cone fundamentals and reference illuminant SPDs. We used a general 2nd order polynomial function of two variables, the twelve free parameters of which are the coefficients in Equations 1 and 2. Δa'm is the modelled shift of coordinate a' for the test SPD versus the reference illuminant SPD, and Δb'm is the corresponding shift for coordinate b'.
∆𝑎𝑎′𝑚𝑚 = 𝑐𝑐𝑎𝑎0 + 𝑐𝑐𝑎𝑎1𝑎𝑎′+ 𝑐𝑐𝑎𝑎2𝑏𝑏′ + 𝑐𝑐𝑎𝑎3𝑎𝑎′2 + 𝑐𝑐𝑎𝑎4𝑎𝑎′𝑏𝑏′+ 𝑐𝑐𝑎𝑎5𝑏𝑏′2 (1) ∆𝑏𝑏′𝑚𝑚 = 𝑐𝑐𝑏𝑏0 + 𝑐𝑐𝑏𝑏1𝑎𝑎′+ 𝑐𝑐𝑏𝑏2𝑏𝑏′+ 𝑐𝑐𝑏𝑏3𝑎𝑎′2 + 𝑐𝑐𝑏𝑏4𝑎𝑎′𝑏𝑏′ + 𝑐𝑐𝑏𝑏5𝑏𝑏′2 (2)
For any selected (a', b') coordinates, the vector field model predicts a color shift. Thus, for a given color sample labeled by index value i, Δa'mi and Δb'mi depend on the 12 coefficients that characterize the model. The goal is to determine values for the twelve coefficients that make Δa'mi and Δb'mi as close as possible to the actual calculated values, Δa'i and Δb'i, for a given test SPD. In general, this match cannot be perfect because a vector field model only predicts the base color shift, not the metameric color shift that introduces random errors.
In practice, determining the coefficients in Equations 1 and 2 amounts to minimizing the sums of the squares of the errors, as defined in Equations 3 and 4.
𝐸𝐸𝑎𝑎 = ∑ (𝑎𝑎′𝑚𝑚𝑚𝑚 − 𝑎𝑎′𝑚𝑚)2𝑛𝑛
𝑚𝑚=1 (3) 𝐸𝐸𝑏𝑏 = ∑ (𝑏𝑏′𝑚𝑚𝑚𝑚 − 𝑏𝑏′𝑚𝑚)2𝑛𝑛
𝑚𝑚=1 (4) Here a'i is the color sample’s actual a' coordinate under the test SPD and a'mi is the value predicted by the vector field model, and equivalently for b'i and b'mi. Because the a'mi and b'mi values in Equation 3 and 4 are derived from to the shifts modelled in Equations 1 and 2, which depict a linear combination of basis functions, the minimization problem can be solved by means of matrix inversion [Weisstein 2018], which is readily carried out in many available software packages. An implementation of this method using Microsoft Excel accompanies this article. In theory, a vector field model can be created from any color sample set. To better understand how the calculated vector fields depend on the color samples used, we calculated a vector field model using four other sample sets for each SPD in the large SPD set, retaining the remainder of the calculation framework of TM-30. The four comparison sample sets were the 4,800-sample Reference Set (REF), the 8 test color samples (TCS) used to calculate CIE Ra [CIE 1995], the 15 visual samples (VS) used in the Color Quality Scale [Davis and Ohno 2010], and measurements of 1,269 Munsell color samples (M) [UEF
9
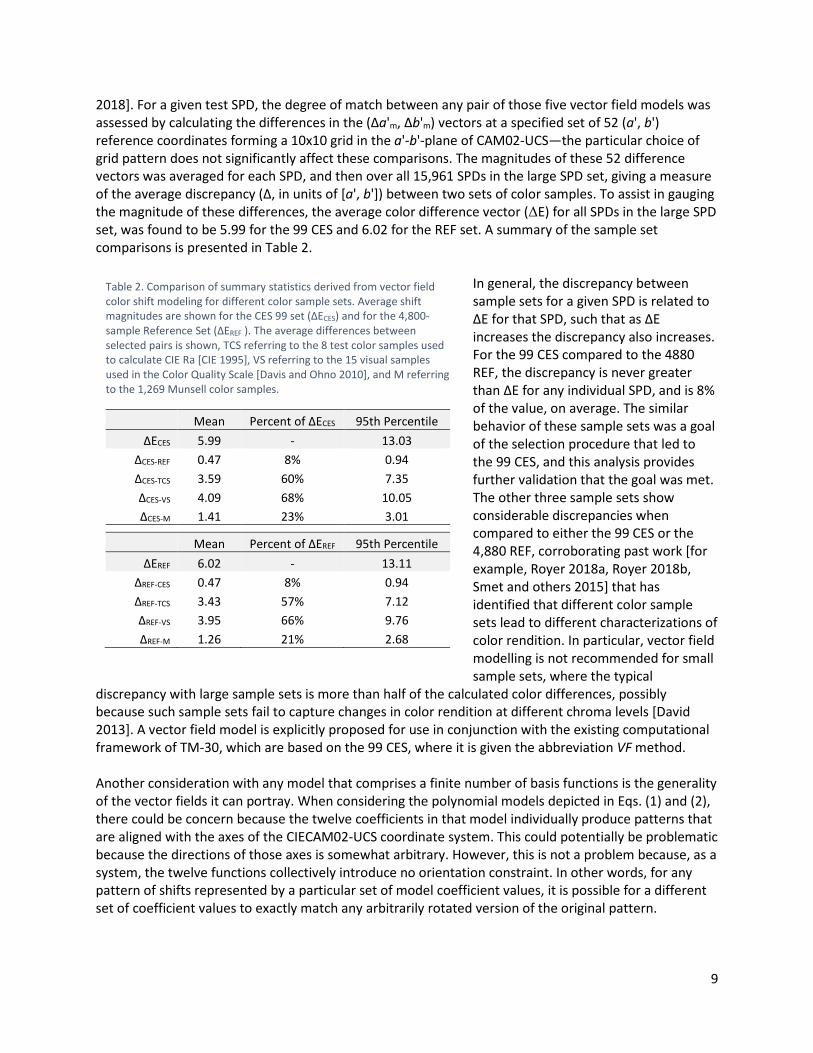
2018]. For a given test SPD, the degree of match between any pair of those five vector field models was assessed by calculating the differences in the (Δa'm, Δb'm) vectors at a specified set of 52 (a', b') reference coordinates forming a 10x10 grid in the a'-b'-plane of CAM02-UCS—the particular choice of grid pattern does not significantly affect these comparisons. The magnitudes of these 52 difference vectors was averaged for each SPD, and then over all 15,961 SPDs in the large SPD set, giving a measure of the average discrepancy (Δ, in units of [a', b']) between two sets of color samples. To assist in gauging the magnitude of these differences, the average color difference vector (ΔE) for all SPDs in the large SPD set, was found to be 5.99 for the 99 CES and 6.02 for the REF set. A summary of the sample set comparisons is presented in Table 2.
In general, the discrepancy between sample sets for a given SPD is related to ΔE for that SPD, such that as ΔE increases the discrepancy also increases. For the 99 CES compared to the 4880 REF, the discrepancy is never greater than ΔE for any individual SPD, and is 8% of the value, on average. The similar behavior of these sample sets was a goal of the selection procedure that led to the 99 CES, and this analysis provides further validation that the goal was met. The other three sample sets show considerable discrepancies when compared to either the 99 CES or the 4,880 REF, corroborating past work [for example, Royer 2018a, Royer 2018b, Smet and others 2015] that has identified that different color sample sets lead to different characterizations of color rendition. In particular, vector field modelling is not recommended for small sample sets, where the typical
discrepancy with large sample sets is more than half of the calculated color differences, possibly because such sample sets fail to capture changes in color rendition at different chroma levels [David 2013]. A vector field model is explicitly proposed for use in conjunction with the existing computational framework of TM-30, which are based on the 99 CES, where it is given the abbreviation VF method. Another consideration with any model that comprises a finite number of basis functions is the generality of the vector fields it can portray. When considering the polynomial models depicted in Eqs. (1) and (2), there could be concern because the twelve coefficients in that model individually produce patterns that are aligned with the axes of the CIECAM02-UCS coordinate system. This could potentially be problematic because the directions of those axes is somewhat arbitrary. However, this is not a problem because, as a system, the twelve functions collectively introduce no orientation constraint. In other words, for any pattern of shifts represented by a particular set of model coefficient values, it is possible for a different set of coefficient values to exactly match any arbitrarily rotated version of the original pattern.
Table 2. Comparison of summary statistics derived from vector field color shift modeling for different color sample sets. Average shift magnitudes are shown for the CES 99 set (ΔECES) and for the 4,800-sample Reference Set (ΔEREF ). The average differences between selected pairs is shown, TCS referring to the 8 test color samples used to calculate CIE Ra [CIE 1995], VS referring to the 15 visual samples used in the Color Quality Scale [Davis and Ohno 2010], and M referring to the 1,269 Munsell color samples.
Mean Percent of ΔECES 95th Percentile ΔECES 5.99 - 13.03
ΔCES-REF 0.47 8% 0.94 ΔCES-TCS 3.59 60% 7.35 ΔCES-VS 4.09 68% 10.05 ΔCES-M 1.41 23% 3.01
Mean Percent of ΔEREF 95th Percentile ΔEREF 6.02 - 13.11
ΔREF-CES 0.47 8% 0.94 ΔREF-TCS 3.43 57% 7.12 ΔREF-VS 3.95 66% 9.76 ΔREF-M 1.26 21% 2.68
10
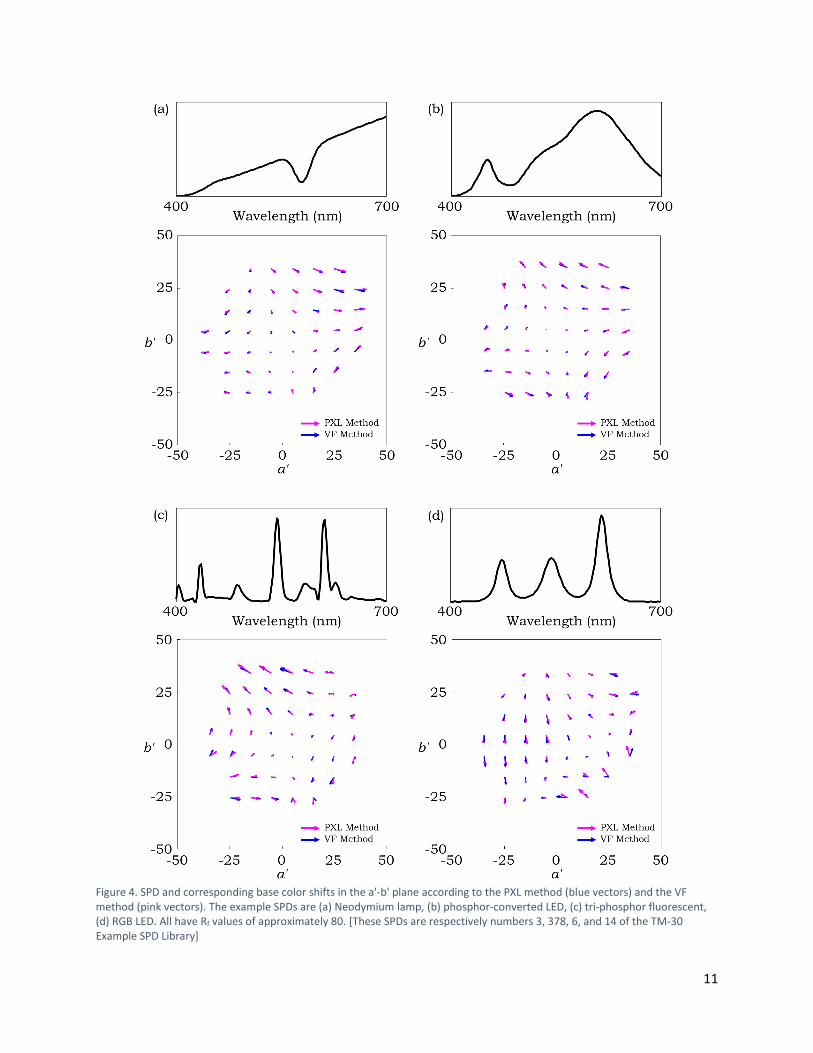
As one basis for justifying the suitability of Eqs. (1), (2), (3), and (4), we also note that we tested more complex versions of the model of Eqs. (1) and (2) with more parameters, including cubic terms. We found that these yielded immaterial improvement to the fit accuracy (that is, the residuals of the least-mean-squares fit were just slightly reduced). From this, we inferred that the present model adequately captures the base shift, while the residuals are mostly caused by each sample’s metameric shift around this base shift. From a theoretical perspective, this approach aligns with the Wyszecki hypothesis, which states that a color stimulus consists of two parts: the fundamental and the residual (or metameric black) [Wyszecki 1953, Cohen and Kappauf 1982]. As a second, independent evaluation of the suitability of this model, the next section assesses the degree of equivalency of the VF method, which is based on Eqs. (1) and (2), and the PXL method, which does not use Eqs. (1) and (2). 2.3 VF versus PXL As with color sample sets, for any given SPD, the PXL and VF methods—using the Reference Set and 99 CES, respectively—can be compared by analyzing the resulting vector fields. That is, the VF method can be used to generate vectors corresponding to the center coordinate for each pixel of the PXL method. Figure 4 shows the two vector fields for four SPDs. All four demonstrate strong agreement between the two methods. A pixel size of 10x10 units² in CAM02-UCS was used for visual convenience; other pixel sizes yield similar results. To confirm this quantitatively, the agreement between the two methods was quantified in the same way as done to compare vector field models with different sample sets. In each pixel (p), the difference between the two vectors was computed. This difference is a vector with length Δp. Δp was averaged over all pixels, giving a measure of the average discrepancy Δ (in units of [a', b']) between the two approaches. Figure 5a illustrates the definition of Δp. Figure 5b shows that Δ is typically about 25% of ΔECES (the mean CAM02-UCS color shift over the 99 CES) when evaluated over the large SPD set. Therefore, the discrepancy between the two methods is reasonably small compared to the mean light-source-induced color shift, suggesting that both PXL and VF are comparable models of base color shift. Of these two methods, the VF method has three practical advantages for use in conjunction with TM-30: (1) it requires no new color samples, because it is computed using the already-well-established 99 CES, rather than requiring a larger color sample set; (2) it compresses the shift information into just the 12 coefficients of the vector field model; and (3) it enables the calculation of base color shift at any selected point in the a'-b' plane, unrestricted by pixels. For these reasons, the VF method is recommended for use and future consideration by the IES and/or CIE, where it can be implemented within the existing framework defined in IES TM-30 and CIE 224:2017 (that is, the 99 color samples, CAM02-UCS, and reference illuminant scheme).
11
Figure 4. SPD and corresponding base color shifts in the a'-b' plane according to the PXL method (blue vectors) and the VF method (pink vectors). The example SPDs are (a) Neodymium lamp, (b) phosphor-converted LED, (c) tri-phosphor fluorescent, (d) RGB LED. All have Rf values of approximately 80. [These SPDs are respectively numbers 3, 378, 6, and 14 of the TM-30 Example SPD Library]
12
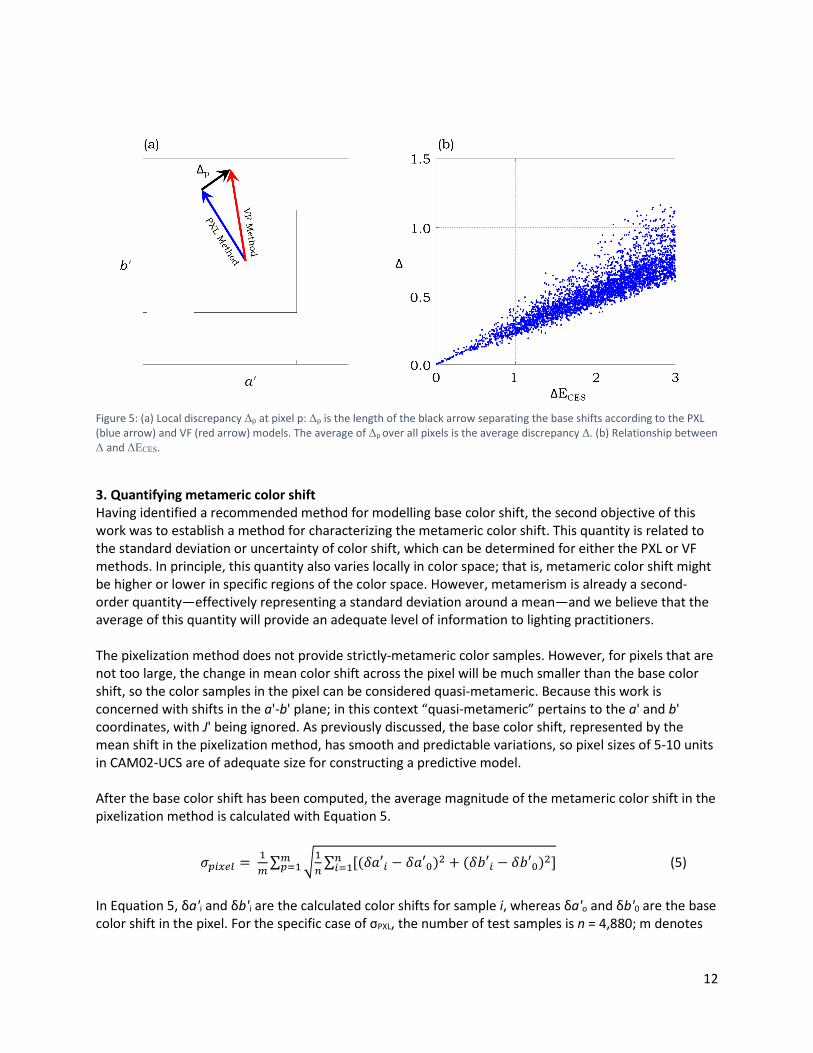
Figure 5: (a) Local discrepancy Δp at pixel p: Δp is the length of the black arrow separating the base shifts according to the PXL (blue arrow) and VF (red arrow) models. The average of Δp over all pixels is the average discrepancy Δ. (b) Relationship between Δ and ΔΕCES.
3. Quantifying metameric color shift Having identified a recommended method for modelling base color shift, the second objective of this work was to establish a method for characterizing the metameric color shift. This quantity is related to the standard deviation or uncertainty of color shift, which can be determined for either the PXL or VF methods. In principle, this quantity also varies locally in color space; that is, metameric color shift might be higher or lower in specific regions of the color space. However, metamerism is already a second-order quantity—effectively representing a standard deviation around a mean—and we believe that the average of this quantity will provide an adequate level of information to lighting practitioners. The pixelization method does not provide strictly-metameric color samples. However, for pixels that are not too large, the change in mean color shift across the pixel will be much smaller than the base color shift, so the color samples in the pixel can be considered quasi-metameric. Because this work is concerned with shifts in the a'-b' plane; in this context “quasi-metameric” pertains to the a' and b' coordinates, with J' being ignored. As previously discussed, the base color shift, represented by the mean shift in the pixelization method, has smooth and predictable variations, so pixel sizes of 5-10 units in CAM02-UCS are of adequate size for constructing a predictive model. After the base color shift has been computed, the average magnitude of the metameric color shift in the pixelization method is calculated with Equation 5.
𝜎𝜎𝑝𝑝𝑚𝑚𝑝𝑝𝑝𝑝𝑝𝑝 = 1𝑚𝑚∑ �1
𝑛𝑛∑ [(𝛿𝛿𝑎𝑎′𝑚𝑚 − 𝛿𝛿𝑎𝑎′0)2 + (𝛿𝛿𝑏𝑏′𝑚𝑚 − 𝛿𝛿𝑏𝑏′0)2]𝑛𝑛𝑚𝑚=1
𝑚𝑚𝑝𝑝=1 (5)
In Equation 5, δa'i and δb'i are the calculated color shifts for sample i, whereas δa'o and δb'0 are the base color shift in the pixel. For the specific case of σPXL, the number of test samples is n = 4,880; m denotes
13
the pixel’s index; σpixel is the average difference between the modelled and actual color shift inside a pixel, averaged over all pixels. For the vector field model, the average magnitude of the metameric color shift can be derived from the differences between calculated color shifts for a set of standardized color samples and modelled color shifts based on the (a', b') coordinates of those color samples under the reference illuminant, which is the residual of the least-mean-squares fit of Equations 3 and 4. The underlying justification is that the discrepancy between the vector-field-modelled base color shift and the actual color shift is expected to be due to the sample’s metameric color shift. By averaging the n metameric color shifts (Equation 6) for a given light source SPD, an overall estimate is obtained for the uncertainty of the color shifts due to metamerism:
𝜎𝜎𝑣𝑣𝑝𝑝𝑣𝑣𝑣𝑣𝑣𝑣𝑣𝑣 = 1
𝑛𝑛∑ �(𝑎𝑎′𝑚𝑚 − 𝑎𝑎′𝑚𝑚𝑚𝑚)2 + (𝑏𝑏′𝑚𝑚 − 𝑏𝑏′𝑚𝑚𝑚𝑚)2𝑛𝑛𝑚𝑚=1 (6)
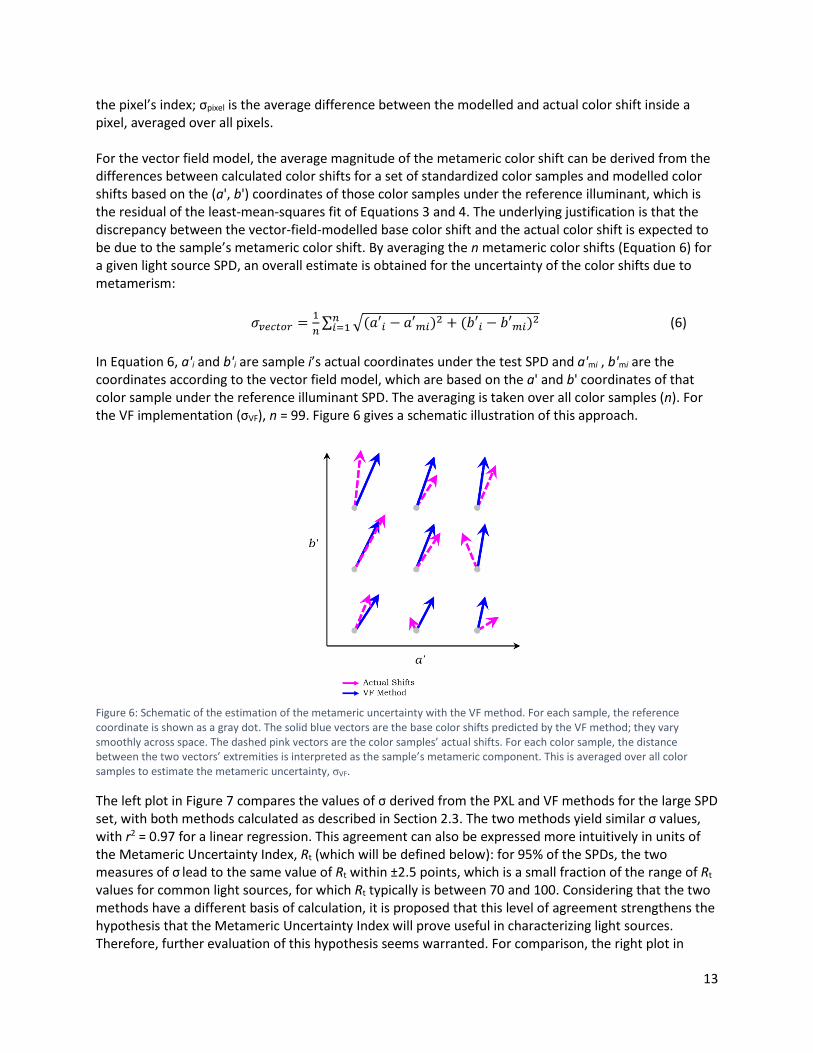
In Equation 6, a'i and b'i are sample i’s actual coordinates under the test SPD and a'mi , b'mi are the coordinates according to the vector field model, which are based on the a' and b' coordinates of that color sample under the reference illuminant SPD. The averaging is taken over all color samples (n). For the VF implementation (σVF), n = 99. Figure 6 gives a schematic illustration of this approach.
Figure 6: Schematic of the estimation of the metameric uncertainty with the VF method. For each sample, the reference coordinate is shown as a gray dot. The solid blue vectors are the base color shifts predicted by the VF method; they vary smoothly across space. The dashed pink vectors are the color samples’ actual shifts. For each color sample, the distance between the two vectors’ extremities is interpreted as the sample’s metameric component. This is averaged over all color samples to estimate the metameric uncertainty, σVF.
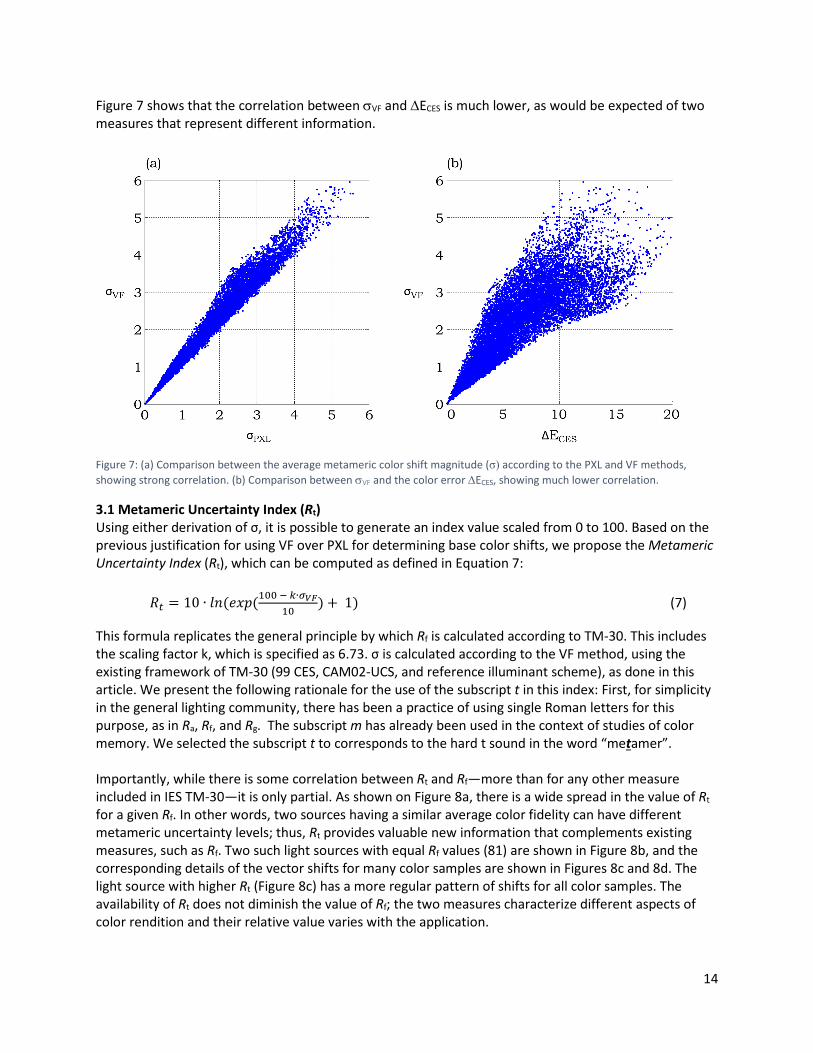
The left plot in Figure 7 compares the values of σ derived from the PXL and VF methods for the large SPD set, with both methods calculated as described in Section 2.3. The two methods yield similar σ values, with r2 = 0.97 for a linear regression. This agreement can also be expressed more intuitively in units of the Metameric Uncertainty Index, Rt (which will be defined below): for 95% of the SPDs, the two measures of σ lead to the same value of Rt within ±2.5 points, which is a small fraction of the range of Rt
values for common light sources, for which Rt typically is between 70 and 100. Considering that the two methods have a different basis of calculation, it is proposed that this level of agreement strengthens the hypothesis that the Metameric Uncertainty Index will prove useful in characterizing light sources. Therefore, further evaluation of this hypothesis seems warranted. For comparison, the right plot in
14
Figure 7 shows that the correlation between σVF and ∆ECES is much lower, as would be expected of two measures that represent different information.
Figure 7: (a) Comparison between the average metameric color shift magnitude (σ) according to the PXL and VF methods, showing strong correlation. (b) Comparison between σVF and the color error ∆ECES, showing much lower correlation.
3.1 Metameric Uncertainty Index (Rt) Using either derivation of σ, it is possible to generate an index value scaled from 0 to 100. Based on the previous justification for using VF over PXL for determining base color shifts, we propose the Metameric Uncertainty Index (Rt), which can be computed as defined in Equation 7:
𝑅𝑅𝑣𝑣 = 10 ∙ 𝑙𝑙𝑙𝑙(𝑒𝑒𝑒𝑒𝑒𝑒(100 − 𝑘𝑘∙𝜎𝜎𝑉𝑉𝑉𝑉10
) + 1) (7)
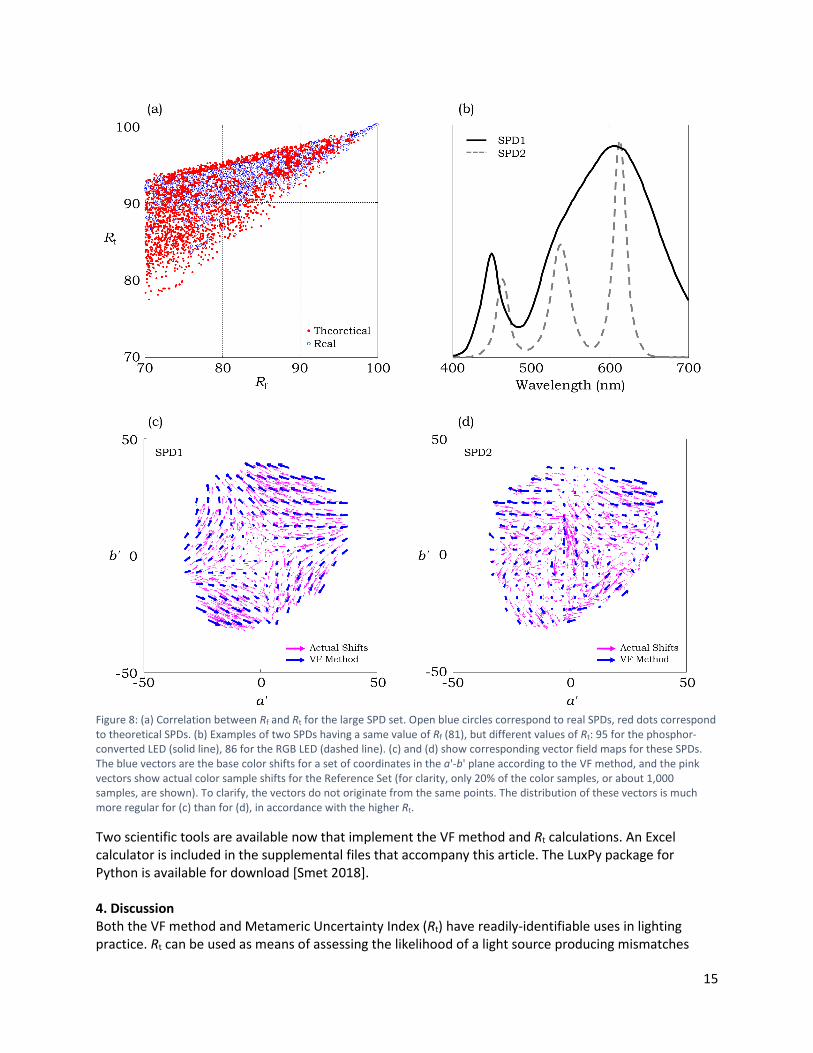
This formula replicates the general principle by which Rf is calculated according to TM-30. This includes the scaling factor k, which is specified as 6.73. σ is calculated according to the VF method, using the existing framework of TM-30 (99 CES, CAM02-UCS, and reference illuminant scheme), as done in this article. We present the following rationale for the use of the subscript t in this index: First, for simplicity in the general lighting community, there has been a practice of using single Roman letters for this purpose, as in Ra, Rf, and Rg. The subscript m has already been used in the context of studies of color memory. We selected the subscript t to corresponds to the hard t sound in the word “metamer”. Importantly, while there is some correlation between Rt and Rf—more than for any other measure included in IES TM-30—it is only partial. As shown on Figure 8a, there is a wide spread in the value of Rt for a given Rf. In other words, two sources having a similar average color fidelity can have different metameric uncertainty levels; thus, Rt provides valuable new information that complements existing measures, such as Rf. Two such light sources with equal Rf values (81) are shown in Figure 8b, and the corresponding details of the vector shifts for many color samples are shown in Figures 8c and 8d. The light source with higher Rt (Figure 8c) has a more regular pattern of shifts for all color samples. The availability of Rt does not diminish the value of Rf; the two measures characterize different aspects of color rendition and their relative value varies with the application.
15
Figure 8: (a) Correlation between Rf and Rt for the large SPD set. Open blue circles correspond to real SPDs, red dots correspond to theoretical SPDs. (b) Examples of two SPDs having a same value of Rf (81), but different values of Rt: 95 for the phosphor-converted LED (solid line), 86 for the RGB LED (dashed line). (c) and (d) show corresponding vector field maps for these SPDs. The blue vectors are the base color shifts for a set of coordinates in the a'-b' plane according to the VF method, and the pink vectors show actual color sample shifts for the Reference Set (for clarity, only 20% of the color samples, or about 1,000 samples, are shown). To clarify, the vectors do not originate from the same points. The distribution of these vectors is much more regular for (c) than for (d), in accordance with the higher Rt.
Two scientific tools are available now that implement the VF method and Rt calculations. An Excel calculator is included in the supplemental files that accompany this article. The LuxPy package for Python is available for download [Smet 2018]. 4. Discussion Both the VF method and Metameric Uncertainty Index (Rt) have readily-identifiable uses in lighting practice. Rt can be used as means of assessing the likelihood of a light source producing mismatches
16
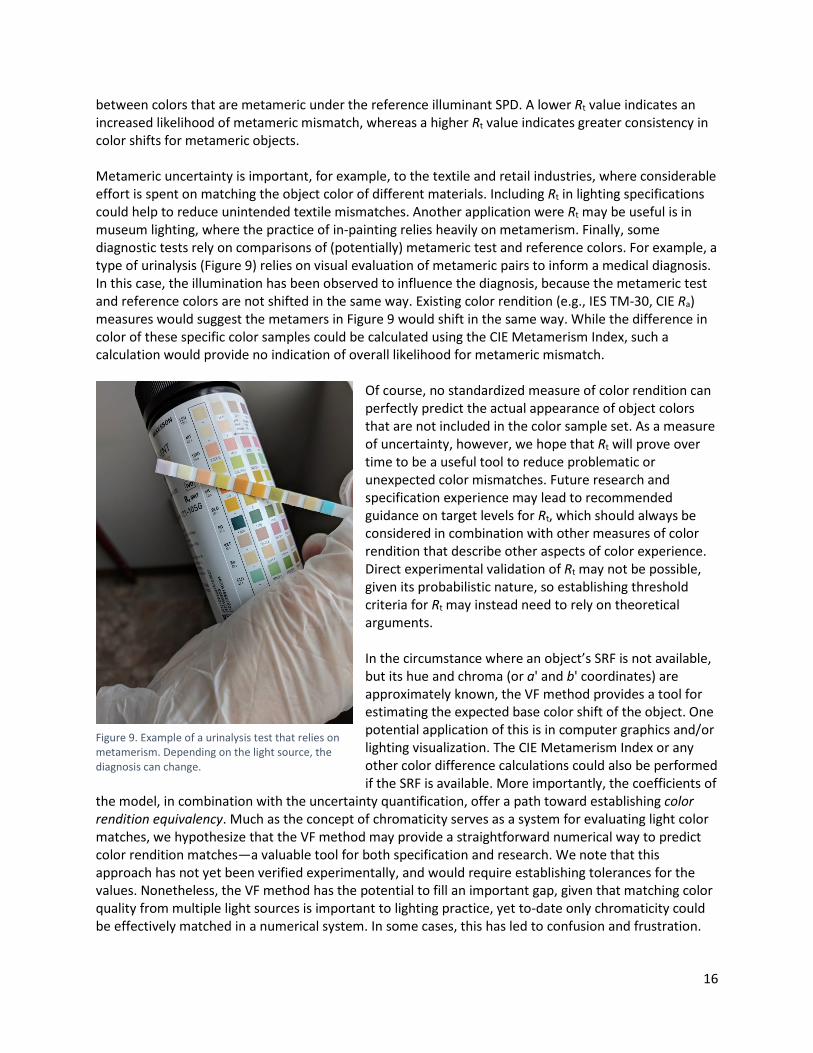
between colors that are metameric under the reference illuminant SPD. A lower Rt value indicates an increased likelihood of metameric mismatch, whereas a higher Rt value indicates greater consistency in color shifts for metameric objects. Metameric uncertainty is important, for example, to the textile and retail industries, where considerable effort is spent on matching the object color of different materials. Including Rt in lighting specifications could help to reduce unintended textile mismatches. Another application were Rt may be useful is in museum lighting, where the practice of in-painting relies heavily on metamerism. Finally, some diagnostic tests rely on comparisons of (potentially) metameric test and reference colors. For example, a type of urinalysis (Figure 9) relies on visual evaluation of metameric pairs to inform a medical diagnosis. In this case, the illumination has been observed to influence the diagnosis, because the metameric test and reference colors are not shifted in the same way. Existing color rendition (e.g., IES TM-30, CIE Ra) measures would suggest the metamers in Figure 9 would shift in the same way. While the difference in color of these specific color samples could be calculated using the CIE Metamerism Index, such a calculation would provide no indication of overall likelihood for metameric mismatch.
Of course, no standardized measure of color rendition can perfectly predict the actual appearance of object colors that are not included in the color sample set. As a measure of uncertainty, however, we hope that Rt will prove over time to be a useful tool to reduce problematic or unexpected color mismatches. Future research and specification experience may lead to recommended guidance on target levels for Rt, which should always be considered in combination with other measures of color rendition that describe other aspects of color experience. Direct experimental validation of Rt may not be possible, given its probabilistic nature, so establishing threshold criteria for Rt may instead need to rely on theoretical arguments. In the circumstance where an object’s SRF is not available, but its hue and chroma (or a' and b' coordinates) are approximately known, the VF method provides a tool for estimating the expected base color shift of the object. One potential application of this is in computer graphics and/or lighting visualization. The CIE Metamerism Index or any other color difference calculations could also be performed if the SRF is available. More importantly, the coefficients of
the model, in combination with the uncertainty quantification, offer a path toward establishing color rendition equivalency. Much as the concept of chromaticity serves as a system for evaluating light color matches, we hypothesize that the VF method may provide a straightforward numerical way to predict color rendition matches—a valuable tool for both specification and research. We note that this approach has not yet been verified experimentally, and would require establishing tolerances for the values. Nonetheless, the VF method has the potential to fill an important gap, given that matching color quality from multiple light sources is important to lighting practice, yet to-date only chromaticity could be effectively matched in a numerical system. In some cases, this has led to confusion and frustration.
Figure 9. Example of a urinalysis test that relies on metamerism. Depending on the light source, the diagnosis can change.
17
Color rendition matching is important for psychophysical research related to the subjective color experience. In such experiments, stimuli are created by researchers using a variety of different lighting products, with different SPDs—in most cases today, generated by tunable, color-mixed LED systems. The VF method is anticipated to provide researchers a straightforward way to assess color rendition equivalency between light sources that may be generated from different lighting systems for different experiments. The VF method may also offer a solution for a simplified graphical representation of color shift, which could be suitable for consumers. Because the method supports predicting base color shifts at any color coordinate, the values for chroma shift and hue shift for a set of six colors (comprising 12 parameters) is sufficient to constrain the parameters in the VF model. It is possible to use these numbers in an icon to completely describe color rendition, as well as the associated metameric uncertainty—although further consideration of specifics is necessary. This type of icon could be viewed as a further simplification of the TM-30 Color Vector Graphic, which uses 16 hue-angle bins. The Color Vector Graphic provides specifiers and others a more nuanced picture that can be used to estimate color appearance of specific objects, but it may be more complex than necessary for addressing the basic needs of a consumer. Finally, although it is not directly an end use, the VF method and quantification of metameric uncertainty are important for contextualizing other measures of color rendition, in particular those included in TM-30. In general, there is measurable uncertainty in using a standardized framework for evaluating color rendition to predict color appearance of a real environment. With a quantification of at least one aspect of that uncertainty, users can be more aware of this limitation of standardized measures of color rendition. 4.1 Other Methods and Measures Related to Vector Fields and Metamerism Neither color rendition vector fields nor metamerism indices are entirely unprecedented. As previously noted, van der Burgt and van Kemenade reported on the hue-based pattern of color shifts, in conjunction with plots of a vector field (using real color samples), beginning in 1988. The work presented in this article is unique because it separates base color shift and metameric color shift—or the smooth hue-based pattern and the uncertainty within the pattern—by fitting a polynomial model. This allows for subsequent calculation of Rt. Several versions of a metamerism index have been defined, although all are fundamentally different from Rt. The CIE Special Metamerism Index: Change in Illuminant (M), originally published in 1971, defines a calculation for the color difference (ΔE) of a specific color sample under two illuminants in CIE LAB color space [CIE 2004]. This type of measure is also defined in DIN and ISO standards. This measure is more like a sample-specific color fidelity calculation than Rt, which is a global measure of metameric uncertainty. Another existing measure is the Degree of Metamerism [Nimeroff and Yurow 1965], which can be used to compare two SPDs or SRFs. Again, the focus is on comparing two specific things, rather than a global characterization of a light source, making this unlike Rt. Observer metamerism has also been quantified in parallel with these approaches [CIE 2004, Fairchild and Heckaman 2015], but this is a phenomenon separate from Rt and the VF method, which focus on object metamerism. One proposed measure that is similar in aim to Rt is the Metamer Mismatch Index (MMCRI) [Mirzaei and Funt 2015]. This metric utilizes a method of determining the convex volume in XYZ tristimulus space corresponding to potential coordinates under a test illuminant of any theoretical SRF having a specified XYZ (that is, a metameric set) under a reference illuminant [Logvinenko and others2014]. Thus, although
18
the phenomenon being characterized is similar, the computation is different. Comparisons between Rt and the Metamer Mismatch Index (MMCRI) are left for future work. 5. Conclusions The color shifts of a test light source SPD versus a reference illuminant SPD can be divided into two components: base color shift and metameric color shift. Base color shift follows a regular pattern that is intrinsic to the position in the hue-chroma plane of an object color space. Metameric color shift stems from deviations in the spectral radiance factors of color samples having the same coordinates in color space. This article documents a method for determining base color shifts using a vector field model. This method is explicitly proposed for use in conjunction with the existing computational framework of IES TM-30-18 and CIE 224:2017, and is given the abbreviation VF method. The VF method, using the 99 CES, was validated by comparing the results to an alternative approach based on pixelization and to an equivalent vector field model, both of which used a 4,880-color-sample Reference Set. The VF method allows for calculations of base color shift from coordinates in the a'-b' plane of CAM02-UCS, providing validation of the appropriateness of the 99 CES. It has potential future uses as a means to establish color rendition equivalency and to generate simple graphical representations of color rendition. Because the VF method specifically isolates base color shift, the remaining metameric color shift can also be determined. The Metameric Uncertainty Index (Rt) quantifies the uncertainty associated with measures of color rendition when the test light source SPD illuminates color samples having unspecified spectral reflectance factors. Like the VF method, it is based on the IES TM-30-18 and CIE 224:2017 framework. It establishes the generalizability of color rendition calculations, and provides an estimate of the likelihood of metameric mismatch that might be induced by a given light source. The latter makes Rt a useful tool for any lighting applications where prevention of metameric mismatch is important, including the textile industry, retail display, and medical applications. Rt provides new information that complements other previously-established measures of color rendition.
References [CIE] Commission Internationale de l’Eclairage. 2017. CIE 2017 Colour Fidelity Index for accurate scientific use. Vienna (Austria): Commission Internationale de l’Eclairage.
[CIE] Commission Internationale de l’Eclairage. 1995. 13.3: Method of measuring and specifying colour rendering properties of light sources, 3rd Ed. Vienna (Austria): Commission Internationale de l’Eclairage.
Cohen JB, Kappauf WE. 1982. Metameric color stimuli, fundamental metamers, and Wyszecki’s metameric blacks. American Journal of Psychology 95(4):537-564.
David A. 2013. Color Fidelity of Light Sources Evaluated over Large Sets of Reflectance Samples. Leukos 10(2):59-75.
David A, Fini PT, Houser KW, Ohno Y, Royer MP, Smet KAG, Wei M, Whitehead L. 2015. Development of the IES method for evaluating the color rendition of light sources. Optics Express 23(12) 15888-15906.
Davis W, Ohno Y. 2010. Color Quality Scale. Opt. Eng. 49(3).
Esposito T, Houser K. 2018. Models of colour quality over a wide range of spectral power distributions. Lighting Research & Technology Online Before Print. DOI: 10.1177/1477153518765953.
19
Fairchild M, Heckaman RL. 2015. Measuring observer metamerism: the Nimeroff Approach. Col Res App 41(2):115-124.
[IES] Illuminating Engineering Society. 2015. IES-TM-30-15: Method for Evaluating Light Source Color Rendition. New York, NY: The Illuminating Engineering Society of North America.
[IES] Illuminating Engineering Society. 2018. IES-TM-30-15: Method for Evaluating Light Source Color Rendition. New York, NY: The Illuminating Engineering Society of North America.
Logvinenko AD, Funt B, Godau C. 2014. Metamer mismatching. IEEE Transactions on Image Processing 23(1):34-43.
Luo MR, Cui G, Li C. 2006. Uniform colour spaces based on CIECAM02 colour appearance model. Color Research & Application 31(4):320-330.
Mirzaei H, Funt B. 2015. Metamer mismatching as a measure of the color rendering of lights. Proceedings of AIC 2015 Color and Image. Tokyo, Japan. 1001-1006.
Nimeroff I, Yurow JA. 1965. Degree of Metamerism. JOSA 55(2):185-190.
Ohno Y, Fein G, Miller C. Vision Experiment on chroma saturation for color quality preference. 28th CIE Session; Jun 28 - Jul 4 2015; Manchester, UK: Vienna (Austria): Commision Internationale de l'Eclairage. p. 2124.
Royer M. 2018a. Comparing measures of average color fidelity. Leukos 14(2): 69-85.
Royer M. 2018b. Comparing measures of gamut area. Leukos. Accepted for publication.
Royer M, Wilkerson A, Wei M. 2017. Human Perceptions of Color Rendition at Different Chromaticities. Lighting Research & Technology Online before print. DOI: 10.1177/1477153517725974.
Royer MP, Wilkerson A, Wei M, Houser K, Davis R. 2016. Human perceptions of colour rendition vary with average fidelity, average gamut, and gamut shape. Lighting Research & Technology 49(8):966-991.
Smet KAG. 2018. LuxPy. Available from: https://github.com/ksmet1977/luxpy. Accessed September 25 2018.
Smet KAG, David A, Whitehead L. 2016. Why color space uniformity and sample set spectral uniformity are essential for color rendering measures. LEUKOS 12(1-2) 39-50.
Smet KAG, Ryckaert WR, Pointer MR, Deconinck G, Hanselaer P. 2010. Memory colours and colour quality evaluation of conventional and solid-state lamps. Opt Express 18(25):26229-44.
[UEF] University of Eastern Finland. Spectral database. http://www.uef.fi/spectral/spectral-database (Accessed 2018).
van der Burgt P, van Kemenade J. 1988. Light sources and colour rendering, additional information to the Ra index. Proceedings of CIBSE National Lighting Conference 133-148.van der Burgt P, van Kemenade J. 2010. About color rendition of light sources: The balance between simplicity and accuracy. Color Research and Application 35(2) 85–93.
20
Wei M, Houser K, David A, Krames M. 2016. Colour gamut size and shape influence colour preference. Lighting Research and Technology Online before print. DOI: 10.1177/1477153516651472.
Wei M, Houser KW. 2017. Systematic Changes in Gamut Size Affect Color Preference. Leukos 13(1):23-32.
Weisstein EW. "Least Squares Fitting--Polynomial." From MathWorld--A Wolfram Web Resource. http://mathworld.wolfram.com/LeastSquaresFittingPolynomial.html Accessed April 10, 2018.
Wyszecki G. 1953. Valenzmetrische untersuchung des zusammenhanges zwischen normaler und anomaler. Die Farbe 2, 39-52.
Zhang F, Xu H, Feng H. 2017. Toward a unified model for predicting color quality of light sources. Applied Optics 56(29):8186-8195.
Related Documents