A tightening gas market: supply, demand and price outlook for NSW Briefing Paper No 4/2014 by Andrew Haylen

Welcome message from author
This document is posted to help you gain knowledge. Please leave a comment to let me know what you think about it! Share it to your friends and learn new things together.
Transcript

A tightening gas market: supply, demand and price outlook for NSW
Briefing Paper No 4/2014 by Andrew Haylen

RELATED PUBLICATIONS
• Electricity prices, demand and supply in NSW, NSW Parliamentary Research Service Briefing Paper 03/2014 by Andrew Haylen
• Economic Indicators NSW (July 2014), NSW Parliamentary Research Service Statistical Indicators 04/2014 by Andrew Haylen
• Gas: resources, industry structure and domestic reservation
policies, NSW Parliamentary Research Service Briefing Paper 12/2013 by Andrew Haylen and Daniel Montoya
ISSN 1325-5142
ISBN 978-0-7313-1924-4
September 2014
© 2014
Except to the extent of the uses permitted under the Copyright Act 1968, no part of this document may be reproduced or transmitted in any form or by any means including information storage and retrieval systems, without the prior consent from the Manager, NSW Parliamentary Research Service, other than by Members of the New South Wales Parliament in the course of their official duties.

A tightening gas market: supply,
demand and price outlook for NSW
by
Andrew Haylen
NSW PARLIAMENTARY RESEARCH SERVICE
Gareth Griffith (BSc (Econ) (Hons), LLB (Hons), PhD), Manager, Politics & Government/Law .......................................... (02) 9230 2356 Daniel Montoya (BEnvSc (Hons), PhD), Senior Research Officer, Environment/Planning ......................... (02) 9230 2003 Lenny Roth (BCom, LLB), Senior Research Officer, Law ....................................................... (02) 9230 2768 Alec Bombell (BA, LLB (Hons)), Research Officer, Law .................................................................. (02) 9230 3085 Tom Gotsis (BA, LLB, Dip Ed, Grad Dip Soc Sci) Research Officer, Law .................................................................. (02) 9230 2906 Andrew Haylen (BResEc (Hons)), Research Officer, Public Policy/Statistical Indicators .................. (02) 9230 2484 John Wilkinson (MA, PhD), Research Officer, Economics ...................................................... (02) 9230 2006
Should Members or their staff require further information about this publication please contact the author.
Information about Research Publications can be found on the Internet at:
http://www.parliament.nsw.gov.au/prod/parlment/publications.nsf/V3LIstRPSubject
Advice on legislation or legal policy issues contained in this paper is provided for use in parliamentary debate and for related parliamentary purposes. This paper is not professional legal opinion.

CONTENTS
Summary .......................................................................................................... iii
List of Abbreviations ...................................................................................... vii
1. Introduction ............................................................................................... 1
2. East Coast gas markets ............................................................................ 2
2.1 Short term trading market ...................................................................... 2
2.2 Declared Wholesale Gas Market ........................................................... 3
2.3 Wallumbilla Gas Supply Hub ................................................................. 4
3. Wholesale gas prices ................................................................................ 4
3.1 Historical developments in the wholesale gas market ........................... 4
3.2 Recent trends in wholesale gas prices .................................................. 6
3.2.1 New domestic and LNG export contract prices ............................... 8
3.3 Wholesale gas price outlook ............................................................... 10
3.3.1 Short term price outlook ................................................................ 11
3.3.2 Longer term price outlook ............................................................. 11
4. Retail gas prices ...................................................................................... 13
4.1 Regulated retail gas prices and forecasts ........................................... 14
4.2 Gas retail market offers ....................................................................... 15
4.3 Composition of retail gas prices .......................................................... 16
4.4 Profile of the retail gas market ............................................................. 18
4.4.1 Assessment of competition in the retail market – Independent Pricing and Regulatory Tribunal ................................................................ 20
5. Gas demand ............................................................................................. 21
5.1 Aggregate consumption ...................................................................... 21
5.2 Composition of gas demand ................................................................ 23
5.2.1 Residential gas consumption ....................................................... 24
5.3 Variability of gas demand .................................................................... 26

5.4 Liquefied natural gas demand ............................................................. 27
5.5 Outlook for gas demand ...................................................................... 30
5.5.1 Domestic gas demand .................................................................. 30
5.5.2 Prospective liquefied natural gas export demand ......................... 32
6. Gas production ........................................................................................ 33
6.1 Aggregate production .......................................................................... 33
6.1.1 New South Wales coal seam gas developments .......................... 34
6.2 Sources of gas supply ......................................................................... 35
6.2.1 Development of new supply sources ............................................ 37
6.3 Market concentration in production and gas resources ....................... 39
6.4 Gas production costs ........................................................................... 42
6.5 Gas supply adequacy in the eastern market ....................................... 44
6.5.1 Gas reserves adequacy in the eastern market ............................. 46
7. Gas transmission and distribution ........................................................ 49
7.1 Transmission pipelines ........................................................................ 49
7.2 Distribution network ............................................................................. 51
7.3 Investment in pipeline capacity ........................................................... 52
7.3.1 Proposed Moomba to Alice Springs gas pipeline.......................... 53
7.4 The effect of LNG on pipeline utilisation .............................................. 54
8. Conclusion ............................................................................................... 55

SUMMARY
This briefing paper provides an overview of wholesale and retail gas prices in New South Wales and more broadly in the eastern Australian Market. The specific causes of gas price movements over recent years are discussed, as are consumption and supply forecasts.
Note that this paper does not deal with debates around the environmental and social impacts of the gas industry.
This is the second of a series of companion briefing papers on utilities. The first related to electricity; the next two deal with water and renewable energy sources.
East Coast gas markets
The two predominant wholesale gas markets on the East Coast are the Declared Wholesale Gas Market (DWGM) in Victoria; and the Short Term Trading Market (STTM) which caters for the supply of gas into, or via, Adelaide, Brisbane or Sydney.
A new voluntary gas trading exchange was developed in early 2014 by the Australian Energy Market Operator (AEMO) in Wallumbilla, Queensland.
The primary purpose of these markets is to enable participants to trade gas supply imbalances that arise on a day because their actual demand for gas differs from their contracted supply. These markets may therefore be viewed as a market-based balancing mechanism that overlays the bilateral contracting arrangements. [2]
Wholesale gas prices
The capital-intensive nature of gas supply infrastructure, combined with a desire for long-term supply certainty from major gas users, has meant that the bilateral contract market has been the preferred vehicle to trade gas and manage long-term risks.
Until approximately 2010 new gas contracts were available in eastern Australia at price levels that had remained steady in real terms over the previous decade or longer.
A significant proportion of the long-term gas contracts in the eastern market have expired within the last five years, and more are due to expire in the next five years. The competition for gas supply from Queensland liquefied natural gas (LNG) developments creates an incentive for producers to seek to rollover contracts at higher short run prices rather than renegotiate them at long run prices. [3.1]
Gas spot prices (which respond in the short term to the balance of supply capacity) trended higher between the end of 2010 (from around $2-3 per gigajoule (GJ)) and mid-2013 (to around $6-7/GJ).

According to Jacobs SKM (2014), the upward trend in spot prices suggests that the spot markets are signalling future increases in the value of gas. While this may be the case, the signals have recently weakened, with spot prices falling back to average contract price levels. [3.2]
In the short to medium term, eastern market gas prices will be significantly influenced by the expansion of LNG exports out of Queensland, with the connection to export markets projected to increase demand and result in a convergence to the LNG netback price (which is the LNG sale price, less the costs incurred in producing and transporting the LNG to the point of sale).
Despite the general expectation of a price rise in the short term, followed by stabilisation in the medium to longer term, there is considerable uncertainty in the outlook because of variability in key price drivers such as oil prices, LNG export volumes and costs of gas production. [3.3]
Retail gas prices
At March 2014, the gas price index was highest for Adelaide (132.9) and Melbourne (127.2), followed by Sydney (125.8), Brisbane (121.8) and Perth (119.2). Perth has experienced the highest rate of growth in gas prices over the last decade, with the index more than doubling since June 2004 at an average quarterly rate of 2.2 per cent; compared to Sydney gas prices which grew at an average quarterly rate of 1.6 per cent. [4]
The Independent Pricing and Regulatory Tribunal (IPART) is responsible for regulating retail gas prices for around 28 per cent of residential and small business customers in New South Wales. On 1 July 2014, IPART published the latest review on regulated prices for 2014-15 and 2015-16 which determined that average regulated retail gas prices can increase by up to 17.7 per cent across NSW over the next 2 years. [4.1]
As at 30 June 2013, AGL Energy, Origin Energy and EnergyAustralia jointly supplied over 85 per cent of small gas customers in eastern Australia and account for around 95 per cent of such customers in New South Wales. [4.2]
IPART (2014) concluded that the competiveness of the retail gas market in NSW has continued to increase and suggested that the gas market is already transitioning towards a largely deregulated market, where few customers remain on regulated prices. [4.2.1]
Gas demand
New South Wales was the fourth highest consumer of natural gas in Australia in 2012-13 at 162 petajoules (PJ). Growth in natural gas consumption has remained relatively subdued in New South Wales, increasing by 13 per cent between 2002-03 and 2012-13.
On a per capita basis, New South Wales is the lowest consumer of natural gas (at 21.8 GJ/annum in 2012-13) when compared with the other States and the Northern Territory. Western Australia had the highest per capita consumption in 2012-13 at 289 GJ/annum. [5.1]

The manufacturing (50 per cent in 2012-13), electricity generation (25 per cent) and residential (16 per cent) sectors account for the majority of gas consumption in New South Wales; although consumption in the manufacturing sector, in absolute terms and as a proportion of State consumption, has been declining over the last decade. [5.2]
The influence of Queensland LNG developments on demand and supply conditions in the eastern market is expected to be significant because of the scale of the projects being developed which will demand around 1500 PJ annually; exceeding the combined capacity of existing LNG projects in other Australian markets. [5.4]
Eastern market annual gas demand is expected to increase from 745 PJ in 2014 to 2,182 PJ in 2033; at which point LNG exports are projected to account for 66 per cent of total annual gas demand.
Domestic demand (excluding LNG) is projected to grow slowly at approximately 0.9 per cent annually to approximately 750 PJ by 2033. On a State by State basis, average annual demand growth between 2014 and 2033 is projected by the AEMO to be highest in Tasmania (1.9 per cent), followed by Queensland (1.1 per cent) and Victoria (1.0 per cent). Annual demand in NSW is projected to grow by 0.8 per cent over this period. [5.5]
Gas production
Natural gas production in Australia has grown at a relatively high annual rate of 5.2 per cent over the last decade, increasing from 1,464 PJ in 2002-03 to 2,439 PJ in 2012-13. In absolute terms, production in New South Wales was estimated at 6.2 PJ in 2012-13 (or 0.25 per cent of Australian production), a decline of around 25 per cent since 2002-03.
Coal seam gas (CSG) developments in New South Wales have the potential to supply more than half of current New South Wales domestic demand within the next five years. The CSG industry is regulated by the Office of Coal Seam Gas and the Environment Protection Authority; recent regulatory reforms, including the Strategic Regional Land Use Policy, have slowed the expansion of the industry in New South Wales. [6.1]
Australia’s gas has historically been sourced largely from the Carnarvon, Cooper-Eromanga and Gippsland Basins. In recent years, production from unconventional resources (i.e. coal seam gas or shale gas) in the Surat-Bowen Basins and conventional (i.e. large underground chambers of trapped gas)1 offshore resources in the Bonaparte Basin and the Otway Basin has grown strongly.
In August 2013 Australia’s 2P gas reserves2 stood at around 141,000 PJ, comprising 97,000 PJ of conventional natural gas and 44,000 PJ of CSG. Eastern Australia contains 36 per cent of Australia’s gas reserves, of which the majority are CSG reserves in the Surat−Bowen Basin. [6.2]
The eastern gas market is highly concentrated and characterised by a relatively small number of players at each level of the supply chain. However, the growth

of the CSG and LNG industries has led to considerable new entry in Queensland’s Surat−Bowen Basin over the past decade. The three largest gas retailers, AGL, Origin and EnergyAustralia, all have commercial interests in upstream reserves. [6.3]
The cost of new gas developments has increased in recent years, both domestically and worldwide. A number of market analysts have developed gas supply curves for the eastern market and a common characteristic is an increase in production costs as the quantity of gas supplied increases. This tends to occur because cheaper more accessible resources are the first to be extracted, leaving behind progressively more expensive sources of supply. [6.4]
Based on the analysis completed by the AEMO (2013), potential gas supply shortfalls may occur in Queensland in 2019 if facilities currently dedicated to domestic demand are prioritised to supply rising LNG export demand.
If production in Queensland and South Australia is prioritised for export, there will be flow-on effects to New South Wales with potential daily shortfalls of 50 to 100 TJ over winter peak demand days from 2018. BREE and the Department of Industry (2014) recommended that unnecessary impediments to supply be removed to overcome any potential shortfalls in the coming years. [6.5]
Analysis by the AEMO (2013) indicates that sufficient reserves are likely to be commercially viable to satisfy projected gas demand for at least the next 20 years. However, production and distribution capacity is the key source of uncertainty going forward for the eastern gas market. [6.6]
Gas transmission and distribution
Gas pipelines provide a transportation link between upstream gas producers and downstream energy customers.
Transmission pipelines enable gas to be transported under high pressure from production facilities to either the entry point of the distribution system or directly to users that are connected to the transmission pipeline. The ownership of gas transmission pipelines is highly concentrated. APA Group, a publicly listed company, has the most extensive portfolio of gas transmission assets in Australia. [7.1]
The distribution pipeline network delivers gas from demand hubs to industrial and residential customers and typically consists of high, medium and low pressure pipelines. The major gas distribution networks in southern and eastern Australia are privately owned by Envestra (which owns networks in Victoria, South Australia, Queensland and the Northern Territory) and Jemena (New South Wales). [7.2]
Investment in distribution networks in eastern Australia (including investment to augment capacity) is forecast at around $2.7 billion in the current access arrangement period (typically five years). [7.3]

LIST OF ABBREVIATIONS
AEMC Australian Energy Market Commission
AEMO Australian Energy Market Operator
AER Australian Energy Regulator
APLNG Australia Pacific Liquefied Natural Gas
BREE Bureau of Resources and Energy Economics
CSG Coal seam gas
DWGM Domestic wholesale gas market
GJ Gigajoule
GLNG Gladstone Liquefied Natural Gas
GSOO Gas Statement of Opportunities
IPART Independent Pricing and Regulatory Tribunal
LNG Liquefied natural gas
MJ Megajoule
PJ Petajoule
QCLNG Queensland Curtis Liquefied Natural Gas
STTM Short term trading market
TJ Terajoule

A tightening gas market: supply, demand and price outlook for NSW
1
1. INTRODUCTION
The eastern Australian gas market is in a period of transition from being an isolated, relatively stable and low-priced market to being linked, via liquefied natural gas (LNG), to international gas markets where prices are higher and more variable.3
This transition has been accompanied by significant growth in production and economic benefits through higher national income, extensive gas infrastructure and enhanced regional development. However, associated higher prices will impact on residential customers and large industrial end users; and these price rises are not expected to abate without significant new supplies of gas.4 Confidence in stable long-term gas prices is consequently being eroded by these LNG linked pricing risks and higher production costs associated with commissioning new supply from unconventional, coal seam gas sources.
The significant growth in gas demand from the Queensland LNG developments, combined with potential supply constraints, means that there is likely to be tightness in gas supply in the eastern market; most notably in the critical period between 2015 and 2020 when LNG facilities reach capacity.5 According to the Bureau of Resources and Energy Economics (2014), however, it is becoming increasingly difficult to predict the extent and duration of any potential tightness and associated price rises given the uncertainty regarding the supply response.6
The main purpose of this briefing paper is to assess historical movements in wholesale and retail gas prices in New South Wales and more broadly in the eastern market. By presenting associated trends in gas consumption (demand) and production (supply), this paper highlights the specific causes of gas price movements in recent years. Demand and supply forecasts from the Australian Energy Market Operator are also presented in this paper to provide insight into the possible future trajectory of gas prices in the eastern market.
To supplement this discussion, the paper briefly discusses the functions and administration of the three wholesale gas markets on the East Coast; and also provides a general overview of both the upstream and downstream segments of the gas supply chain, including historical and prospective investment, capacity and ownership structures.
Note that this paper does not deal with debates around the environmental and social impacts of the gas industry.
Information and data in this paper is sourced primarily from the Australian Energy Regulator, Australian Energy Market Operator, Australian Energy Market Commission, the Independent Pricing and Regulatory Tribunal, and the Bureau of Resources and Energy Economics.
A tightening gas market: supply, demand and price outlook for NSW
2
2. EAST COAST GAS MARKETS
The two predominant wholesale gas markets on the East Coast are the Declared Wholesale Gas Market in Victoria; and the Short Term Trading Market which caters for the supply of gas into, or via, Adelaide, Brisbane or Sydney.
The primary purpose of these markets is to enable participants to trade gas supply imbalances that arise on a day because their actual demand differs from their contracted supply. These markets may therefore be viewed as a market-based balancing mechanism that overlays the bilateral contracting arrangements (Section 3.1).
This section of the paper provides an overview of the eastern Australia wholesale gas trading markets, with the information presented sourced primarily from the Australian Energy Market Operator (AEMO). Detailed information related to the operation and administration of the short term trading market and the declared wholesale gas market can be found in their respective overviews.
A new voluntary gas trading exchange was developed in early 2014 by the AEMO in Wallumbilla, Queensland, and is discussed briefly in this section.
2.1 Short term trading market
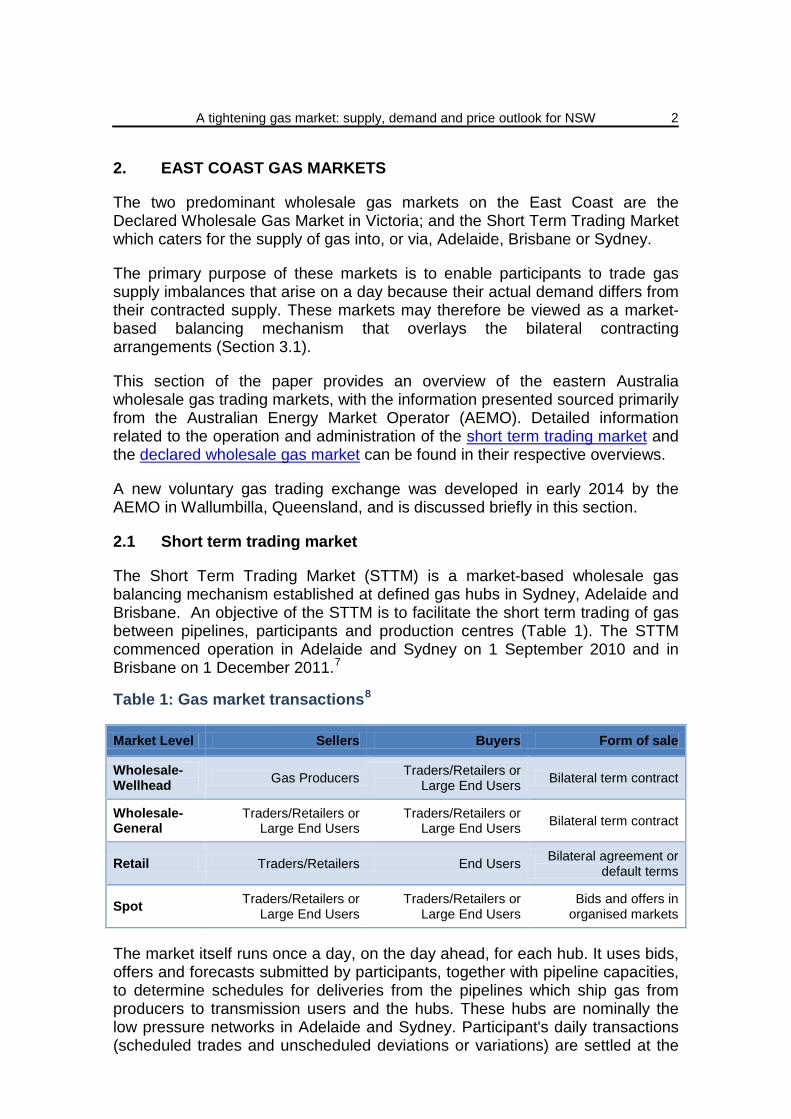
The Short Term Trading Market (STTM) is a market-based wholesale gas balancing mechanism established at defined gas hubs in Sydney, Adelaide and Brisbane. An objective of the STTM is to facilitate the short term trading of gas between pipelines, participants and production centres (Table 1). The STTM commenced operation in Adelaide and Sydney on 1 September 2010 and in Brisbane on 1 December 2011.7
Table 1: Gas market transactions8
Market Level Sellers Buyers Form of sale
Wholesale-Wellhead Gas Producers Traders/Retailers or
Large End Users Bilateral term contract
Wholesale-General
Traders/Retailers or Large End Users
Traders/Retailers or Large End Users Bilateral term contract
Retail Traders/Retailers End Users Bilateral agreement or default terms
Spot Traders/Retailers or Large End Users
Traders/Retailers or Large End Users
Bids and offers in organised markets
The market itself runs once a day, on the day ahead, for each hub. It uses bids, offers and forecasts submitted by participants, together with pipeline capacities, to determine schedules for deliveries from the pipelines which ship gas from producers to transmission users and the hubs. These hubs are nominally the low pressure networks in Adelaide and Sydney. Participant's daily transactions (scheduled trades and unscheduled deviations or variations) are settled at the

A tightening gas market: supply, demand and price outlook for NSW
3
daily market price and billed regularly (monthly).
The National Gas Law and National Gas Rules authorise and control conduct in the STTM. Amendments to the National Gas Rules are the responsibility of the Australian Energy Market Commission (AEMC) in accordance with the rule change procedures defined in the National Gas Law. Compliance with the STTM rules and relevant instruments is monitored and enforced by the Australian Energy Regulator (AER).
The AEMO is responsible for the formal market procedures that cover matters of a technical or procedural nature, as required by the National Gas Rules. The process by which the AEMO makes and amends the market procedures is specified in the National Gas Rules.9 However, the AEMO does not operate the physical pipeline or network assets, and actual physical operation of assets is carried out by the asset owners.
While the STTM is operated by the AEMO, which produces the market schedule based on participants’ bids to buy gas and offers to sell gas, contracts between shippers and pipeline operators remain the basis for actual allocations. Participants are responsible for ensuring that their scheduled flow is supported by sufficient capacity.10
2.2 Declared Wholesale Gas Market
The Declared Wholesale Gas Market (DWGM) was established by the Victorian Government in March 1999 to enable competitive trading in Victoria based on injections into and withdrawals from the transmission system that links multiple producers, major users and retailers. The DWGM covers the Victorian Transmission System, which transports gas primarily from Longford, Culcairn and Iona to Victorian customers.
The regulatory and institutional arrangements underpinning the operation of the DWGM are also set out in the National Gas Law and the National Gas Rules.
The AEMO is both market and system operator and is responsible for operating the Declared Transmission System (including producing market schedules for the day-ahead and five intra-day trading intervals), and managing system security, reliability and safety. It also operates and administers the DWGM, developing any procedures that may be required for this market.
Transportation rights are allocated to market participants by the AEMO and APA-Gasnet (the owner of the Victorian Transmission System). Transportation rights provide market participants with priority in scheduled injections and protection against curtailment and uplift payments (in the event that gas that is priced higher than the market price is required to be scheduled because of system constraints).11
The AEMC is responsible for assessing any proposed rule changes, which, in accordance with the National Gas Law, can only be made by the AEMO or the Victorian Minister for Energy and Resources. The AER is responsible for
A tightening gas market: supply, demand and price outlook for NSW
4
monitoring trading activity in the DWGM and reporting on significant price variations.
2.3 Wallumbilla Gas Supply Hub
The Queensland Government proposed the development of a gas supply hub centred on Wallumbilla in its 2011 Gas Market Review. The Gas Market Review foresaw significant changes to the Queensland market when new LNG projects at Gladstone reach operation, driven by the leap in gas volumes through the market.
The Review identified a need for transparent market structures to support trading among LNG participants and other gas producers and users. Wallumbilla was seen as an appropriate centre for trading given its location in gas production areas and given that at Wallumbilla, three major gas transmission pipelines interconnect.12
The Wallumbilla Gas Supply Hub was established by the AEMO in March 2014 in response to a request from the Standing Council on Energy and Resources:13
…in order to enhance transparency and reliability of gas supply by creating a voluntary market that offers a low-cost, flexible method to buy and sell gas at interconnecting transmission pipelines.
The gas supply hub is an exchange with an electronic trading platform for the wholesale trading of natural gas. Participants place anonymous offers (to sell) or bids (to buy) a specified quantity at a specified price which are automatically matched on the exchange to form transactions.
The gas supply hub was established for the sale and purchase of gas delivered via one of the three major connecting pipelines at Wallumbilla. Participation is voluntary and designed to complement existing bilateral gas supply arrangements and gas transportation agreements. According to the AEMO (2014):14
The new voluntary market responds to emerging challenges in the east coast gas markets. Queensland in particular is experiencing substantial developments in liquefied natural gas (LNG) exports, which has increased the need for more flexible and transparent upstream transactions between parties.
For more detailed information relating to the operation, administration and trading arrangements of the Wallumbilla Gas Supply Hub see the AEMO website.
3. WHOLESALE GAS PRICES
3.1 Historical developments in the wholesale gas market
The capital-intensive nature of gas supply infrastructure, combined with a desire for long-term supply certainty from major gas users, has meant that longer term bilateral contracts have been the preferred vehicle to manage commercial

A tightening gas market: supply, demand and price outlook for NSW
5
risks.15 The pricing structure for these contracts was typically based on the cost of production plus an annual price escalator such as the consumer price index.
Examples and detailed discussion of recent long term contracts can be found in Section 5.1 of the 2013 Gas Market Scoping Study and Section 6 of Jacobs SKM report New Contract Gas Price Projections.
Compared to electricity, there has always been less transparency around wholesale gas costs and prices. This is because these longer term supply contracts have been subject to confidentiality regarding price and other conditions. Despite the relatively early establishment of the formalised gas spot market arrangements in Victoria and the later commencement of the STTM, there are few sources of publically available relevant price information.16
Forward pricing of gas is even more problematic as, unlike for electricity, financial contract markets in gas have not developed. This may not have mattered in the past as wholesale prices were relatively static in real terms because supply was abundant and demand was relatively weak.17
A significant proportion of the aforementioned long-term gas contracts in the eastern market have expired within the last five years, and more are due to expire in the next five years (Figure 1).
Figure 1: East coast domestic gas contracts, by basin, 2012 to 203118
The competition for gas supply from Queensland LNG developments (Section 5.4) has created an incentive for producers to rollover contracts at higher, short run prices rather than renegotiate them at long run prices.19 This has meant that an increasing proportion of the gas trade on the east coast is being done through the spot markets. While the LNG proponents expect to fulfil existing commitments to the domestic market, there may be a reluctance to offer additional gas domestically until LNG contract volumes are assured.20 BREE and the Department of Industry (2014) noted that:21

A tightening gas market: supply, demand and price outlook for NSW
6
Some major industrial users of gas have reported they are unable to secure domestic gas supply contracts during this period at any price. Others are reporting being offered short term contracts at much higher prices than existing contracts. While many gas producers are reporting that they are willing to sign gas contracts but it is a question of price and term.
Once developed, the LNG projects in Queensland will increase the demand for east coast gas; and the exposure to domestic and international supply and demand variables makes the wholesale gas price outlook highly uncertain (Section 3.3). According to ACIL Tasman (2013):22
One view is that gas in the domestic market will henceforth be priced at international LNG prices (“net-backed” by subtracting liquefaction costs such that producers are indifferent between supplying domestic and international customers). Another view is that these prices will serve as a price ceiling and that the “net-backed” international price can be expected to be further discounted to reflect the fact that once gas has been sourced for the initial LNG trains, incremental export will be capacity constrained and it will be a number of years before additional capacity is provided to enable further export opportunities.
3.2 Recent trends in wholesale gas prices
Wholesale gas spot prices, which respond in the short term to the balance of supply capacity, are generally quoted at the three main hubs that connect transmission and distribution networks in Adelaide, Brisbane and Sydney and for the Victorian wholesale market. Only about half the gas sold in eastern Australia is currently traded through the spot market23, so the spot market volume data does not tell the full story. As ACIL Tasman (2013) describes:24
Unlike the electricity spot prices which arise from a gross pool arrangement in which, market customers including electricity retailers, and with few exceptions generators are required to participate, gas spot prices apply only to imbalance quantities. These imbalance quantities are the difference between the gas injected into the network by or on behalf of the retailer, and the gas withdrawn by the retailer to supply its customers. These quantities can be positive or negative and are generally small compared to total system withdrawals.
ACIL Tasman (2013) does not consider that spot prices are a relevant or completely accurate benchmark for the supply costs of gas retailers:25
In gas, spot prices apply to imbalance quantities which are relatively small compared to total system withdrawals. As yet, a financial contract market has not, and in fact may not, develop around these spot prices. Antecedent spot price outcomes do not inform price negotiations for gas, in the way they do for electricity. There is in gas at present, no evident linkage between contract prices and spot prices.
Design differences between the east coast markets limit the validity of price comparisons. In particular, the Victorian market is for gas only, while prices in the STTM cover gas and transmission pipeline delivery to the hub.26

A tightening gas market: supply, demand and price outlook for NSW
7
Short term trading market spot prices trended higher between the end of 2010 (from around $2-3 per gigajoule) and mid-2013 (to around $6-7 per gigajoule).
A large price increase occurred during the 2012 winter (Figure 2), driven by a spike in seasonal demand and in conjunction with the introduction of carbon pricing on 1 July 2012 (although at a level not wholly explained by the carbon price). The AER (2013), however, noted that market participants were speculatively driving prices higher than expected during July 2012 in response to the carbon pricing.
Figure 2: Ex ante short term trading market spot prices27
Combined with the tightening (i.e. limited supply) in the contract market for gas, winter prices in 2012 rose above $5 per gigajoule in all spot markets, with Sydney prices averaging almost $7 per gigajoule.28
Gas prices eased during spring 2012, settling between $4 and $5 per gigajoule. Prices generally remained within this range throughout 2013 for Sydney and Adelaide, although market volatility was considerable, with an above average frequency of price spikes. Brisbane prices diverged markedly from prices in other markets in 2013, with weekly averages as high as $10 per gigajoule in January 2013 and complemented the higher contract prices in Queensland.29
Sydney prices spiked briefly during June 2013 which was the result of colder temperatures and higher demand.30 In Victoria, a mostly mild winter and a reduction in gas powered generation contributed to an 8.8 per cent decrease in gas demand during winter 2013. Eastern market winter demand in 2013 was generally subdued, resulting in prices easing for all hubs. Winter prices were lower in 2013 than in the previous year in Melbourne (16 per cent lower), Sydney (22 per cent lower) and Adelaide (10 per cent).31
$/GJ
1
2
3
4
5
6
7
8
9
10/2
010
01/2
011
04/2
011
07/2
011
10/2
011
01/2
012
04/2
012
07/2
012
10/2
012
01/2
013
04/2
013
07/2
013
10/2
013
01/2
014
04/2
014
07/2
014
Sydney Brisbane
Adelaide

A tightening gas market: supply, demand and price outlook for NSW
8
Prices peaked in 2013 at $9.50 per gigajoule in Sydney (on 25 June), $6.02 per gigajoule in Adelaide (on a number of days in June and July) and $7.31 per gigajoule in Melbourne (on 24 June). Brisbane’s average winter price was 16 per cent higher in 2013 than in 2012, peaking at $8.01 per gigajoule on 23 June.32
According to Jacobs SKM (2014), the upward trend in spot prices led some commentators to suggest that the spot markets are signalling future increases in the value of gas. While this may be the case, the spot market signals have recently weakened, with spot prices falling back to average contract price levels.33
In an efficient market, falling prices usually come about because of lower demand, higher supply, or a combination of both. The total quantity of gas being traded (i.e. demand) through the markets is trending downward. The year-on-year aggregate spot market volume for the month of June has fallen from 45,000 TJ in 2012 to 41,000 TJ in 2014.34 According to Balfe (2014), a softening of demand, consistent with weak conditions in the manufacturing sector and falling electricity demand, appears to be at least part of the explanation.
On the supply side, volumes of gas traded through the Brisbane market are rising against the overall decline in the other eastern States: May and June 2014 showed the highest monthly volumes since the start of the Brisbane STTM, with volumes in both months exceeding 5,000 TJ for the first time. Balfe (2014) suggests that we may, therefore, be seeing for the first time the long-anticipated price effects of the CSG production ramp-up in advance of LNG plant commissioning. Certainly this could explain why the recent price falls have been greater in Brisbane than in the southern markets.35
3.2.1 New domestic and LNG export contract prices
Details relating to the structure and features of gas supply contracts are discussed in Section 3 and Appendix A of the Jacobs SKM (2014) report on New Contract Gas Price Projections.
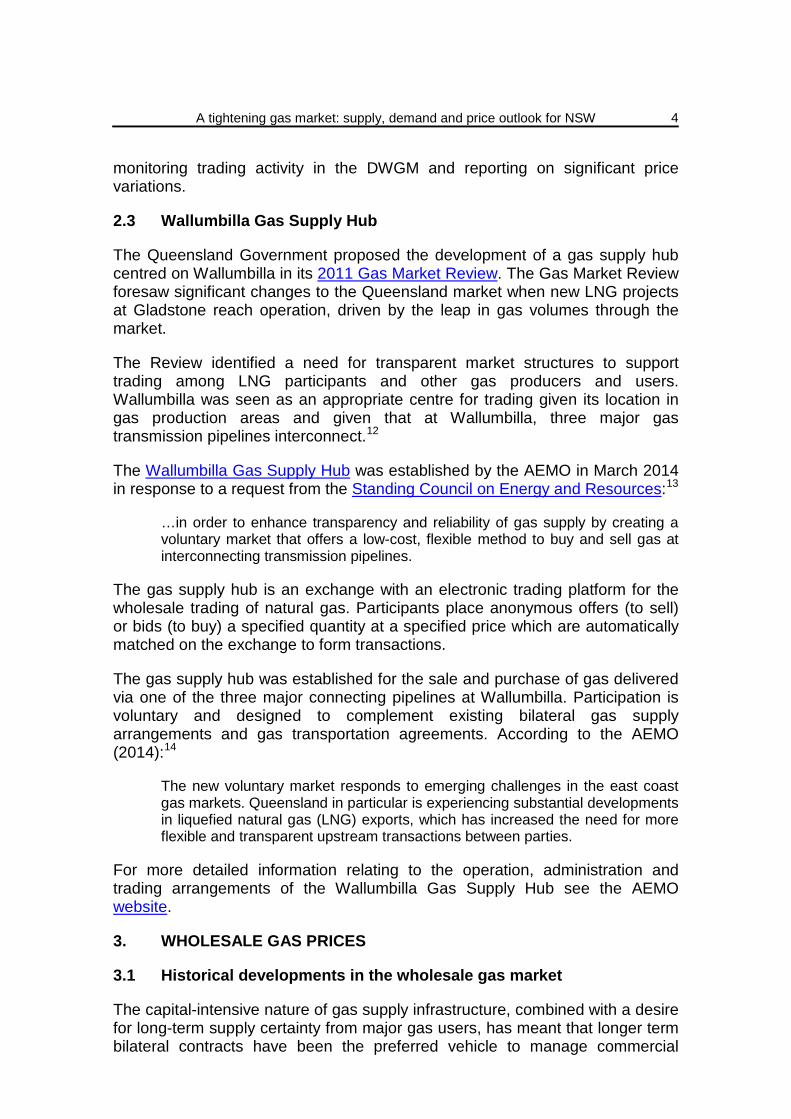
In their report, Jacobs SKM (2014) provide price data for domestic contracts (Table 2) and third party contracts with LNG proponents (Table 3).
Table 2: Recent eastern market domestic contracts36
Seller Buyer Source Start Date Term - years
Annual Volume (PJ)
Term Average
Price ($/GJ)
AGL Xstrata Surat CSG 1/05/2013 10.5 13.1 6
Origin MMG OE Portfolio 1/01/2013 7 3 8.29
A tightening gas market: supply, demand and price outlook for NSW
9
Santos Unknown STO Portfolio Unknown Short Low 8
Beach Petroleum Origin Cooper 1/01/2015 8 17 8.5
BHPB-Esso Lumo Gippsland
JV 1/01/2016 3 7 7.29
BHPB-Esso Origin Gippsland
JV 1/01/2014 9 48 6.76
BHPB-Esso Orica Gippsland
JV 1/01/2017 3 14 5.86
Nexus Santos Gippsland Longtom 1/07/2013 5.5 15.1 5.95
AGL Incitec Pivot Surat CSG 1/02/2015 1.9 8.5 10.02
Table 3: Recent third party contracts with LNG projects37
Seller Buyer Source Start Date Term - Years
Annual Volume (PJ)
Term average
price ($/GJ)
APLNG QCLNG Surat CSG 1/10/2014 20 95 7.5
Santos GLNG Cooper Basin 1/01/2015 15 50 7.73
AGL QCLNG Surat CSG 1/01/2014 3 25 5.72
Origin GLNG OE Portfolio 1/01/2015 10 36.5 9.05
Origin QCLNG OE Portfolio 1/01/2014 2 15 8.34
Origin GLNG OE Portfolio 1/01/2016 5 20 8.8
Stanwell Unknown Wallum-billa 1/10/2014 3 10 NA
AGL Unknown Wallum-billa 1/07/2014 NA 15 10
These contract prices should be interpreted with care for reasons noted by Jacobs SKM (2014):38
The domestic and LNG contract data has been derived entirely from public sources and is in general, though not precise, agreement with that in similar lists presented by other parties.
The quality of timing and volume data is reasonable but price estimates are in many cases more speculative, relying upon statements by equity market analysts and energy journalists. It is difficult to draw definitive conclusions about contract prices.

A tightening gas market: supply, demand and price outlook for NSW
10
Despite the limitations in the data, there are a number of key points identified by Jacobs SKM (2014) in their analysis:39
• Prices have escalated since before 2010 and cover a wide range from approximately $5.50/GJ to $10.00/GJ.
• Prices in Queensland (i.e. Surat CSG) appear to have escalated further in 2013 relative to 2010 and 2012 as more third party gas has been purchased by LNG projects. The most recent price in Queensland is $10/GJ for a 23 month contract starting in February 2015.
• Prices for gas in southern states, sourced from the Gippsland Joint Venture (Victoria), are lower than those in Queensland.
• All LNG contracts are oil linked.
3.3 Wholesale gas price outlook
According to BREE (2013), the lack of transparency regarding contracted gas arrangements, combined with the use of different economic models and assumptions, has resulted in a variety of gas price projections for the eastern market.40
Broadly speaking though, eastern market gas prices will be significantly influenced by the expansion of LNG exports out of Queensland. The connection to export markets is projected to increase eastern market demand (Section 5.4) and result in a convergence to the LNG netback price which is:41
…calculated as the LNG sale price, less the costs incurred in producing and transporting the LNG to the point of sale (for example, liquefaction costs, shipping costs if sold ‘delivered ex shipping’ and the exchange rate as well as a margin for risk and marketing overheads).
The netback price will decrease the closer to the point of production on the supply chain it is measured (for example, the further along a pipeline network from the point of production the netback price is calculated, the greater the transport costs and, therefore, the higher the netback price). At the point of LNG delivery to the customer, the delivery price minus the netback is essentially the producer’s per unit profit.
Because of the uncertainty of production costs and other supply and demand variables, Jacobs SKM (2014) disputes the notion that domestic wholesale gas prices will converge to the netback price:42
Jacobs SKM does not subscribe to the widely expressed view that the domestic prices must inevitably equal the netback value, or export parity value, for [other] reasons including [gas production costs] and because there is no unique netback value, due to variations in LNG pricing formulas and liquefaction and shipping costs between different LNG projects.
Nevertheless, once connected, domestic prices will be exposed to both domestic and international supply and demand variables which will influence the trajectory of prospective gas prices; these are discussed in detail in Section 10 of the NSW Parliamentary Research Service paper Gas: resources, industry

A tightening gas market: supply, demand and price outlook for NSW
11
structure and domestic reservation policies.
3.3.1 Short term price outlook
Jacobs SKM (2014) as part of their report to IPART estimated updated new contract gas price projections. The details around the methodology, scenarios and assumptions underlying these projections can be found in Chapter 4 of the Jacobs SKM (2014) report.
Jacobs SKM (2014) considers that a new gas retailer (or end-user) in New South Wales should be able to negotiate a new gas contract at Longford (a gas processing plant 20 kilometres from Sale in South Gippsland, Victoria) on the following basis: in 2014/15 in the range between $6.00 and $6.50/GJ and in 2015/16 in the range between $6.50 and $7.00/GJ. These prices represent premiums of between $0.50 and $1.00/GJ over prices in other recent contracts, which is due to further tightening of the gas market.
Jacobs SKM (2014) is less confident that a new gas retailer (or end-user) in New South Wales will be able to negotiate a new gas contract at Moomba at all (a gas processing plant located in central Australia, approximately 770 kilometres north of Adelaide). Although their modelling indicates that small volumes should be available, there are no recent contracts to support this and key participants in the Cooper Basin Joint Venture, Origin and Santos, are strongly aligned with LNG projects. If a retailer negotiates with a Moomba producer without the benefit of competition from Gippsland, the price will be high, in the range of between $8.00 and $10.00/GJ; towards the lower end of this range for small volumes (2-3 PJ pa) and towards the higher end for larger volumes (5-10 PJ pa) (Table 4).43
Table 4: Comparison of AGL gas commodity costs and Jacobs SKM estimates of new entrant gas contract prices ($/GJ)44
2014-15 2015-16
Moomba AGL $8.65 $9.73
Jacobs SKM $8.00-$10.00 $8.00-$10.00
Longford AGL $5.59 $6.50
Jacobs SKM $6.00-$6.50 $6.50-$7.00
Weighted Average AGL $7.12 $8.12
Jacobs SKM $7.00-$8.25 $7.25-$8.50
3.3.2 Longer term price outlook
According to BREE (2013), over the longer term, the linkage with export markets and a competitive domestic gas market should support investment and increase gas production in eastern Australia.45 Prices are consequently

A tightening gas market: supply, demand and price outlook for NSW
12
expected to stabilise over the longer term, albeit at higher levels than previously realised.
Based on these expectations, there are some general trends that appear across the projections (Figure 3). ACIL Allen (2013) assume a sizeable price shock around 2014 when Queensland LNG commences and expect a return towards production costs (which increase consistently in the long run) in the years after LNG reaches capacity.
Similarly, EnergyQuest (2013) forecast a considerable price jump in the coming years (particularly in Brisbane) as medium-term prices approach short run LNG netback prices. This jump is expected to last through to the middle of the decade. Prices are expected to return toward production costs once all the Queensland LNG projects are operating and fully producing from their own reserves (around 2019–20).
EnergyQuest (2013) and ACIL Allen (2013) consider the key determinant of medium term pricing is whether projects can source sufficient gas from their own reserves without having to purchase from the market, which would drive prices even higher.46
Figure 3: Eastern market gas price projections, 2012 to 203447
Despite the general expectation of a price rise in the short term, followed by stabilisation in the medium to longer term, there is considerable uncertainty in the outlook because of variability in key price drivers such as oil prices, LNG export volumes and costs of gas production. Jacobs SKM (2014) emphasise this point but also subscribe to the view that prices will be higher in the short to medium term:48
With respect to the impact of LNG exports on spot prices, supply will progressively switch to higher priced new contracts which will most likely have a progressive impact. More importantly, as the export projects ramp up to full

A tightening gas market: supply, demand and price outlook for NSW
13
production, gas supply capacity across eastern Australia will be stretched, possibly to the extent that material load curtailment occurs from 2016 onwards and this will be accompanied by persistent high spot prices in most market areas.
BREE (2013) suggests that until significantly more supply is commissioned and/or domestic demand falls sharply, the eastern market is likely to be a sellers’ market. This is because sellers will have considerably more influence in contract negotiations with domestic buyers because of the profits available to them in selling gas overseas. BREE (2014) argues that the imbalance of market power could result in adverse price outcomes in the eastern market:49
In a period of transition, there is a risk price may overshoot export parity until there is sufficient gas supply or information available to the market to overcome any transient market power and readjust risk expectations.
Long-run contracting, the potential for the exercise of market power and a lack of transparency may conspire to make this transition longer than it might otherwise be. Whether this risk is material is unclear to the extent that the level of market efficiency is not measurable.
4. RETAIL GAS PRICES
Using the gas component of the ABS consumer price index, Figure 4 tracks movements in gas prices for metropolitan households over the last decade. At June 2014, the gas price index was highest for Adelaide (132.9) and Melbourne (127.2), followed by Sydney (125.8), Brisbane (121.8) and Perth (119.2). Given the reference period for the index is 2011-12, Adelaide and Melbourne have experienced the highest rate of growth in retail gas prices in the last two to three years.
Figure 4: Gas price indices for Australian capital cities50
Index 2011-12
20
40
60
80
100
120
140
Sydney Melbourne
Brisbane Adelaide
Perth
A tightening gas market: supply, demand and price outlook for NSW
14
Perth has experienced the highest rate of growth in gas prices over the last decade, with the index more than doubling since June 2004 at an average quarterly rate of 2.2 per cent. Brisbane (2.1 per cent quarterly growth) and Adelaide (1.9 per cent) also experienced relatively high rates of retail gas price growth over the last decade; while Sydney gas prices grew at an average quarterly rate of 1.6 per cent.
4.1 Regulated retail gas prices and forecasts
The Independent Pricing and Regulatory Tribunal (IPART) is responsible for regulating retail prices for around 28 per cent of residential and small business gas customers in New South Wales. These are the prices the Standard Retailers in New South Wales (AGL, ActewAGL and Origin Energy) charge customers who have not signed a market contract with them or another retailer.51
Under IPART’s final decision, average regulated retail gas prices were scheduled to increase, on average, by 8.5 per cent across NSW for the 2013-14 financial year; or by between 5.2 per cent and 9.2 per cent in the Standard Retailers’ individual supply area (9.2 per cent for AGL; 5.5 per cent for ActewAGL; 5.8 per cent for Origin Energy (Wagga Wagga); and 5.2 per cent for Origin Energy (Albury/Murray Valley)).52
According to IPART (2014), the sustained increases in network costs have been the largest contributor to gas price rises in the last two years53 and was responsible for around 60 per cent of the price increase over the 2013-14 financial year for AGL customers. The retail component was responsible for 39 per cent of the price increase over 2013-14 for AGL customers.54
On 1 July 2014, IPART (2014) published the latest price review on regulated prices for 2014-15 and 2015-16 in which it determined that average regulated retail gas prices can increase by up to 17.7 per cent across NSW over the next 2 years; or between 14.6 per cent and 18.1 per cent in the Standard Retailers’ individual supply areas (18 per cent for AGL; 17.8 per cent for ActewAGL; 14.6 per cent for Origin Energy (Albury/Murray Valley); 18.1 per cent for Origin Energy (Wagga Wagga)).55
Given recent changes in carbon pricing legislation, no carbon component is applied from the start of 2014-15 and the nominal increase in AGL’s regulated retail prices over the next 2 years will be 11.7 per cent in 2014-15 and 5.8 per cent in 2015-16.56
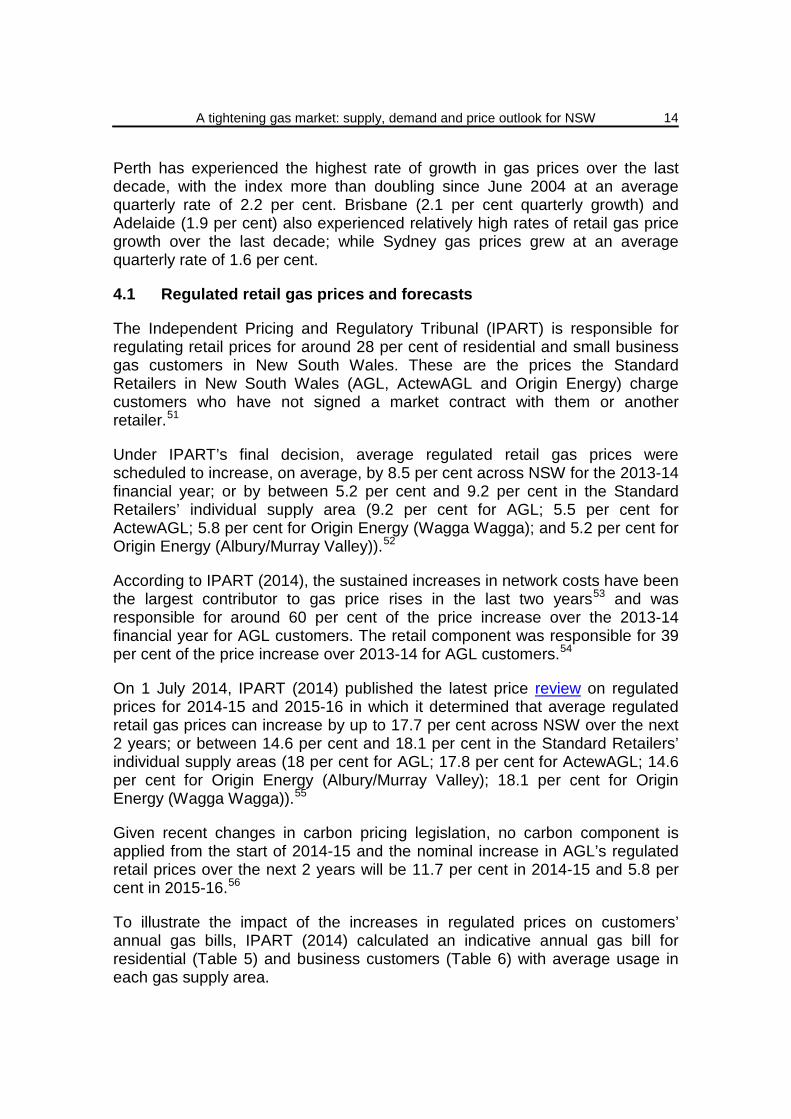
To illustrate the impact of the increases in regulated prices on customers’ annual gas bills, IPART (2014) calculated an indicative annual gas bill for residential (Table 5) and business customers (Table 6) with average usage in each gas supply area.
A tightening gas market: supply, demand and price outlook for NSW
15
Table 5: Indicative annual bill for typical residential customers57
Standard Retailer Current bill (2013-14)
Estimated bill (2014/15)
Estimated bill (2015/16)
$ increase over 2 years
AGL 901 1056 1063 162
ActewAGL 1292 1515 1522 230
Origin Energy (Albury/Murray Valley) 933 1107 1069 136
Origin Energy (Wagga Wagga) 1027 1237 1212 186
Table 6: Indicative annual bill for typical business customers58
Standard Retailer Current bill (2013-14)
Estimated bill (2014/15)
Estimated bill (2015/16)
$ increase over 2 years
AGL 4201 4926 4959 757
ActewAGL 4997 5858 5885 888
Origin Energy (Albury/Murray Valley) 3295 3911 3776 481
Origin Energy (Wagga Wagga) 3503 4221 4136 633
4.2 Gas retail market offers
Retailers offer contracts for a range of products with different price structures. The offers may include standard products, green products, ‘dual fuel’ contracts (for gas and electricity) and packages that bundle energy with services such as telecommunications. The variety of discounts and non-price inducements therefore make direct price comparisons difficult.
Nevertheless, the AER used data from price comparison website Energy Made Easy and State regulators’ price comparison websites to estimate gas price offerings for residential customers in Queensland, New South Wales, Victoria and South Australia (Table 7). Data are based on market offers (adjusted for discounts) for a customer consuming 24 gigajoules of gas per year on a peak only (single rate) tariff. Data do not account for Greenpower offers.
The data indicate varying degrees of price diversity. Victoria exhibited the greatest price diversity, with the annual cost under the cheapest contract 35−40 per cent lower than under the most expensive contract. The annual gas bill spread in August 2013 (measured within a particular distribution network) varied among jurisdictions, but was around $200 for most networks. The spread for all networks rose between August 2012 and August 2013.59

A tightening gas market: supply, demand and price outlook for NSW
16
The average discount in annual gas bills across all contracts in August 2012 was 5–6 per cent below the base offer in Queensland, New South Wales and South Australia, and 8–9 per cent lower in Victoria. The average discount in August 2013 remained relatively unchanged in Queensland, but fell in New South Wales (to below 4 per cent) and South Australia (to 1.5 per cent).60
Table 7: Price diversity in retail product offers for gas – August 2012 and August 201361
Distribution network Date Min Mean Max
Queensland
Envestra (north Brisbane) August 2012 1069 1098 1113
August 2013 962 1091 1203 APT Allgas (south Brisbane) August 2012 965 992 1013
August 2013 974 1018 1054
New South Wales
Jemena August 2012 775 841 953
August 2013 834 904 1041
Victoria
SP Ausnet (central 1) August 2012 616 677 754
August 2013 612 703 800
Multinet (main 1) August 2012 598 662 784
August 2013 612 685 812
Envestra (central 1) August 2012 586 651 740
August 2013 588 672 752
South Australia
Envestra (metropolitan) August 2012 891 945 1010
August 2013 968 1080 1207
4.3 Composition of retail gas prices
The gas bills paid by retail customers typically cover wholesale costs, as well as network and retail costs. The AEMC estimated the composition of a typical gas retail bill in 2013 for a residential customer in New South Wales (Figure 5).
Transmission and distribution (or network) charges accounted for 48 per cent of gas retail prices in New South Wales. Distribution charges account for the bulk of pipeline costs. Wholesale costs (28 per cent), retailer operating costs (19 per cent), including margins, and carbon costs (5 per cent) accounted for the

A tightening gas market: supply, demand and price outlook for NSW
17
remainder of the gas costs in 2013.62
Figure 5: Indicative composition of NSW residential gas bill, 201363
Wholesale gas costs, as defined by IPART (2014) in the retail gas price determination report, include gas commodity and transmission costs, the costs associated with being able to serve peak demand and market-related costs. The three Standard Retailers proposed significant increases in gas commodity costs over the remainder of the regulatory period and this cost increase is the main driver of the increase in regulated retail gas prices.64
To further analyse these costs, IPART (2014) commissioned expert advice from Jacobs SKM (2014) on the potential range for wholesale gas costs; the findings from this analysis are presented below.
IPART (2014) concluded that Jacobs SKM’s analysis and ACIL’s previous analysis for the 2013 price review establish a reasonable range for benchmark wholesale gas costs over the remainder of the regulatory period (Table 8).
Table 8: Reasonable range for wholesale gas costs over remainder of regulatory period ($2013/14 per GJ)65
2014-15 2015-16
Jacobs SKM 2014
Final advice 6.25 - 9.00 6.75 - 9.00
Modelled prices:
Long run LNG netback 6.52 - 9.38 7.09 - 8.60
Short run LNG netback 6.04 - 8.39 6.72 - 9.74
ACIL 2013 6.46 - 8.31 6.4 - 8.28
Network costs 48%
Wholesale energy costs
28%
Retail costs 19%
Carbon costs 5%

A tightening gas market: supply, demand and price outlook for NSW
18
Retail operating costs are the costs a retailer incurs in performing the functions required to serve its customer base. This includes the costs of billing and revenue collection, call centres, marketing and an appropriate allocation of corporate overheads. Retail costs may also include the costs associated with customer acquisition and retention.
In the 2013 IPART price review, it was found that the reasonable range for efficient retail operating costs excluding customer acquisition and retention costs was $94 to $113 per customer ($2013/14). IPART (2014) considered that this range would remain appropriate for the duration of the regulatory period (2013 to 2016).
For the 2013 price review, IPART engaged Strategic Finance Group to estimate a reasonable range for the margin of gas retail suppliers. SFG’s final advice was that this range is between 6.3 and 7.3 per cent of earnings before interest, tax, depreciation and amortisation (EBITDA). For 2014-15 and 2015-16, all three Standard Retailers have proposed a retail margin within this range.66
Table 9: Assumptions used in pricing scenarios for 2014-15 and 2015-16 ($2013-14)67
Assumption Comments
LOW CASE SCENARIO
Gas commodity costs
6.52/GJ in 2014-15 and 7.09/GJ in 2015-16 Consistent with Jacobs SKM and ACIL advice
Retail costs $115/customer Midpoint of retail operating costs and added customer acquisition/retention costs
Retail margin 6.3 per cent Bottom of benchmark range
HIGH CASE SCENARIO
Gas commodity costs
8.39/GJ in 2014-15 and 8.60/GJ in 2015-16 Consistent with Jacobs SKM and ACIL advice
Retail costs $115/customer Midpoint of retail operating costs and added customer acquisition/retention costs
Retail margin 7.3 per cent Top of benchmark range
4.4 Profile of the retail gas market
AGL Energy, Origin Energy and EnergyAustralia are the leading energy retailers in eastern Australia, having jointly supplied over 85 per cent of small gas customers in the region as at 30 June 2013 (Figure 6).

A tightening gas market: supply, demand and price outlook for NSW
19
Figure 6: Retail gas market share (small customers), eastern Australia, August 201368
During the third quarter of the 2013-14 financial year, AGL, EnergyAustralia and Origin Energy accounted for around 95 per cent of residential and small business gas customers in New South Wales.
The rate at which customers switch their supply arrangements can indicate customer participation in the market. While switching rates may indicate competitive activity, they must be interpreted with care, the reasons for which are discussed by the AER (2013):69
Switching is sometimes high during the early stages of market development, when customers can first exercise choice, but may then stabilise as a market acquires depth. Similarly, switching may be low in a competitive market if retailers deliver good quality and low priced service that gives customers no reason to change.
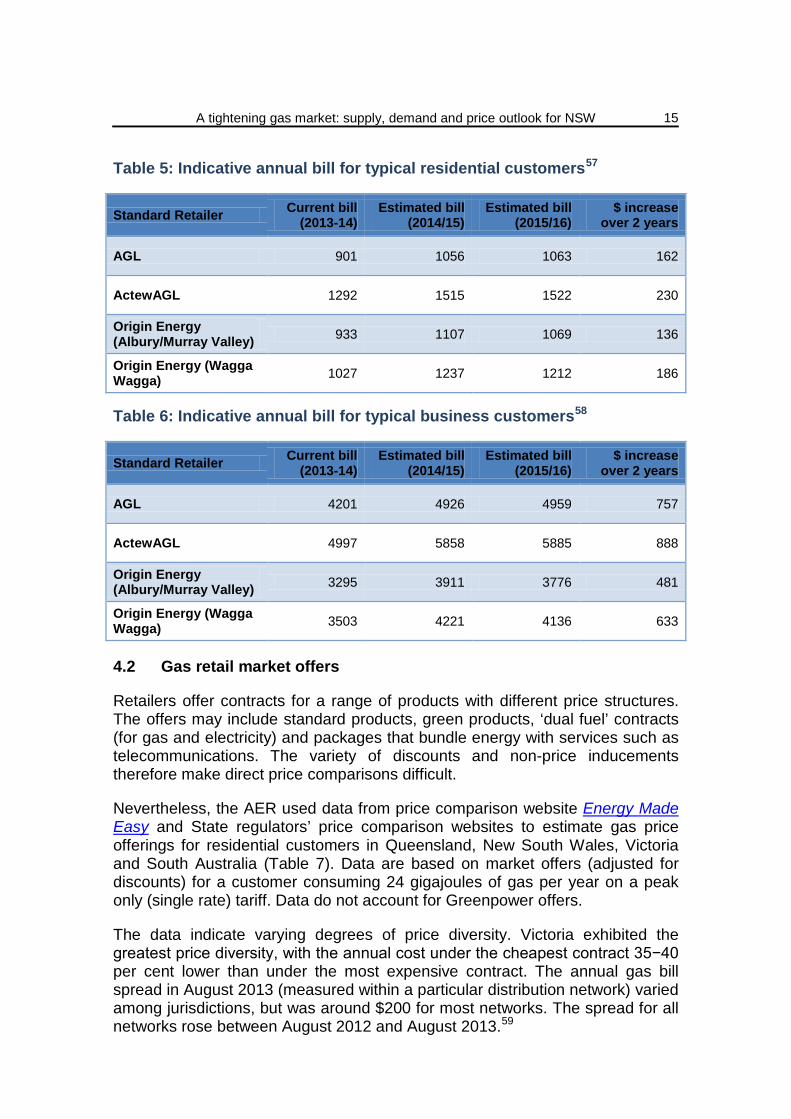
Victoria continues to have a higher switching rate than that of other jurisdictions (Figure 7) and in 2012-13 recorded its highest ever switching rates in gas (27 per cent of customers).
Switching activity in New South Wales and South Australia rose in each of the past few years, with rates in 2012−13 being the highest recorded in each state for gas.
Switching levels remain lower in gas than electricity in all jurisdictions, reflecting the lower number of active participants in the gas market.70
%
20
40
60
80
100
Queensland New SouthWales
Victoria SouthAustralia
Tasmania ACT Overall
Origin AGL EnergyAustralia ErgonLumo Aurora Red ActewAGLSimply Alinta Tas Gas Retail Other
A tightening gas market: supply, demand and price outlook for NSW
20
Figure 7: Small customer switching of gas retailers71
4.4.1 Assessment of competition in the retail market – Independent Pricing and Regulatory Tribunal
IPART (2014) concluded that the competiveness of the retail gas market in New South Wales has continued to increase. It specifically found that:72
Small retail customers have continued to move from regulated prices to market-based prices. Currently less than 25 per cent remain on regulated prices in NSW, compared to around 31 per cent in 2011/12. Most customers who participate in the competitive market are experiencing positive outcomes.
IPART (2014) analysis suggested that the gas market is already transitioning towards a largely deregulated market, where few customers remain on regulated prices. In addition, it noted that AGL’s share of the small customer market has decreased to around 60 per cent (from nearly 100 per cent at the outset of retail competition).
IPART’s (2014) view is that competition in the retail gas market in New South Wales now protects customers against market power by offering more choices and better price and service outcomes. It concluded that gas retail price regulation is no longer necessary in New South Wales and that the removal of retail price regulation is likely to:73
Improve customer engagement in the market by removing the confusion in relation to the difference between regulated and market prices.
Remove the risk that price regulation distorts the competitive market, particularly given the dynamic nature of energy markets. This will encourage more retailers to enter the market, which should deliver better customer outcomes in the long term, including providing a better ‘value for money’ service through reduced costs and/or innovation.
%
6
12
18
24
30
QLD NSW VIC SA
2009-10 2010-11
2011-12 2012-13
2013-14 (YTD)
A tightening gas market: supply, demand and price outlook for NSW
21
IPART (2014), in finding this, referenced the AEMC (2013) report on competitiveness in the New South Wales energy market which found that removing retail price regulation for all consumers will likely lead to more innovation, increased product choice and competitive pricing.
5. GAS DEMAND
The eastern market accounted for 61 per cent of Australia’s gas consumption in 2012-13, equivalent to 863 PJ; 2.5 per cent higher than the previous year’s consumption. Queensland and Victoria are the two largest consumers in the eastern market, which together accounted for around 544 PJ of gas demand in 2012-13.
5.1 Aggregate consumption
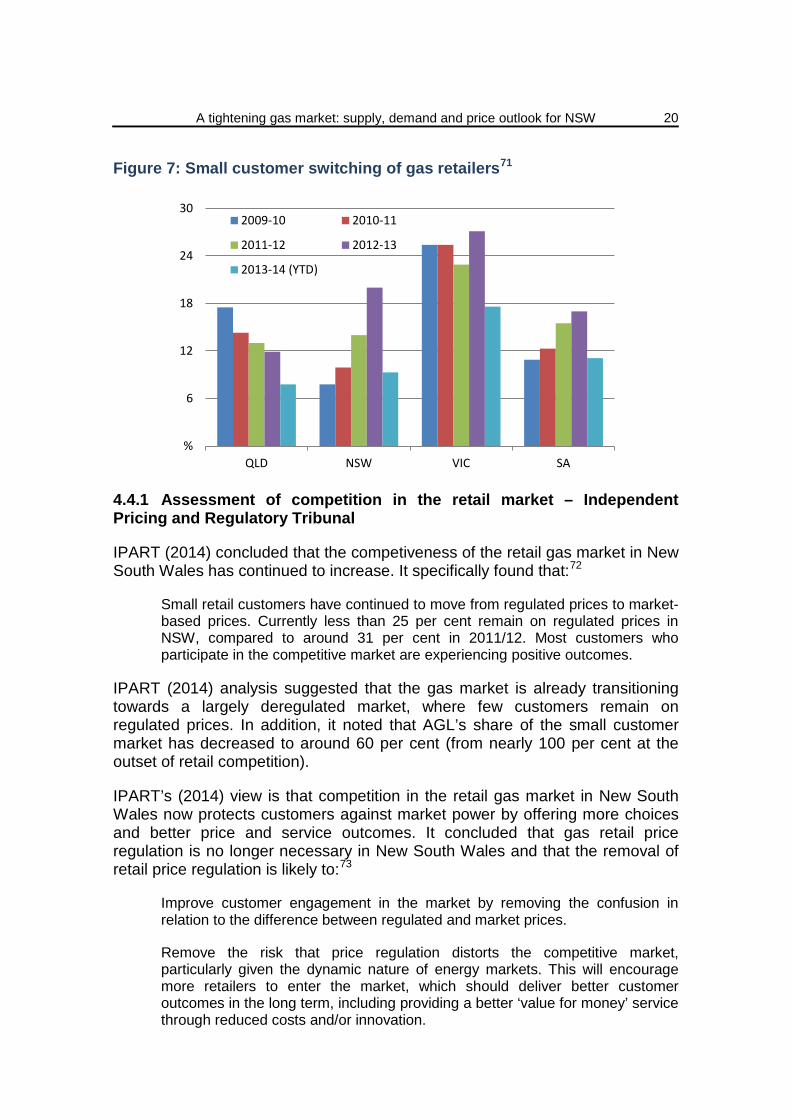
New South Wales was the fourth highest consumer of natural gas in Australia in 2012-13 at 162 PJ. Growth in natural gas consumption has remained relatively subdued in New South Wales, increasing by 13 per cent between 2002-03 and 2012-13.
Western Australia is the highest aggregate gas consumer among the other States and Territories and in 2012-13 consumption was recorded at 516 PJ; 41 per cent higher over the last decade (Figure 8).
Figure 8: Australian consumption of gas, by State74
Victoria is the second largest consumer of natural gas in Australia; although, like New South Wales, it has experienced relatively subdued growth in consumption of 16 per cent between 2002-03 and 2012-13. Queensland has experienced the highest growth in natural gas consumption of the States and Territories, more than doubling from 94 PJ in 2002-03 to 235 PJ in 2012-13.
New South Wales (including the ACT) is the third highest daily consumer of gas in the eastern market (Figure 9). In 2012-13 average daily consumption of gas
PJ
200
400
600
800
1000
1200
1400
1600NSW VIC QLD WA SA TAS NT

A tightening gas market: supply, demand and price outlook for NSW
22
for New South Wales was estimated at 385 TJ, slightly down on the previous year.
Figure 9: Average daily regional Gas Bulletin Board demand75
Victoria has the highest average daily consumption of the other jurisdictions in the eastern market (604 TJ in 2012-13), followed by Queensland (386 TJ in 2012-13).
On a per capita basis, New South Wales (including the ACT) is the lowest consumer of natural gas when compared the other States and the Northern Territory. In 2012-13, New South Wales per capita consumption was 21.8 GJ/annum (Figure 10).
Figure 10: Aggregate consumption per capita, by State
TJ
100
200
300
400
500
600
700
2008/09 2009/10 2010/11 2011/12 2012/13
QLD NSW/ACT VIC SA TAS
GJ/capita
50
100
150
200
250
300
350
NSW
VIC
QLD
WA
SA
TAS
NT
A tightening gas market: supply, demand and price outlook for NSW
23
Western Australia had the highest per capita consumption in 2012-13 at 289 GJ/annum, followed by the Northern Territory at 174 GJ/annum. Western Australia (average annual growth of 13.9 per cent), the Northern Territory (10.4 per cent) and Queensland (7.8 per cent) have experienced considerable growth in per capita consumption over the last decade.
5.2 Composition of gas demand
Gas is used widely in the manufacturing sector and is of particular importance to a relatively small number of large consumers in the metal product industries (mainly smelting and refining activities) and the chemical industry (fertilisers and plastics) where it is a major energy source and/or production input.76 Large industrial gas demand from the manufacturing sector, however, has been declining in recent years. As BREE and the Department of Industry (2014) outline:77
The trend of declining manufacturing activity in New South Wales, Victoria and South Australia may result in further reductions in gas demand from the large industrial sector. Notable closures have occurred or have been announced by Shell (Clyde Refinery) and Norsk Hydro (Hunter Valley aluminium smelter). Other large industrial gas users, such as BlueScope Steel and Caltex, have announced restructuring or changes to operations that will reduce gas consumption. These changes may also have implications for electricity demand which could reinforce the effects on gas-powered generation. The exception to this trend may be in Queensland, where large industrial gas demand is projected to grow.
Demand from electricity generation has grown as a result of previously low gas prices, expectations around carbon prices and gas-fired generation targets set in Queensland.78 The share of gas-fired generation relative to total electricity generation consequently increased from 9.8 per cent to 19.3 per cent over the six years to 2011–12.79 Electricity generation sector consumption has more than doubled from 114 PJ in 2002-03 to 274 PJ in 2012-13.
Residential consumption has also increased in the eastern market in line with population and economic growth, up by 25 per cent between 2002-03 and 2012-13.
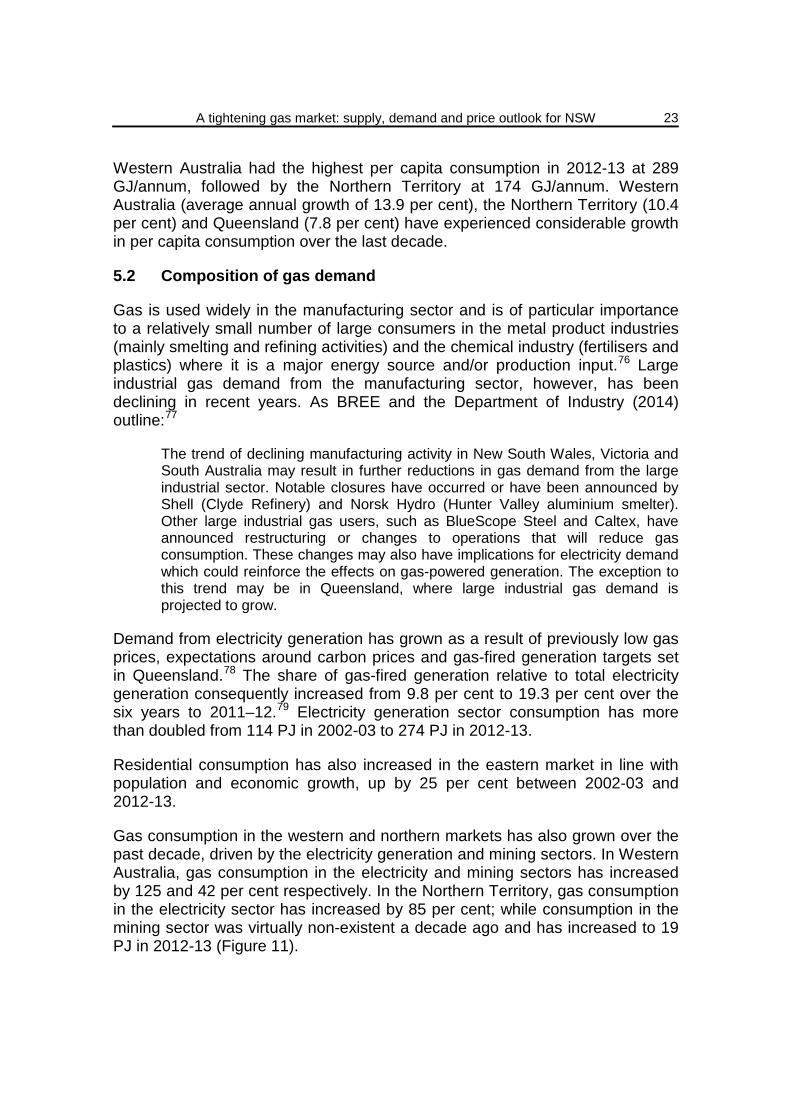
Gas consumption in the western and northern markets has also grown over the past decade, driven by the electricity generation and mining sectors. In Western Australia, gas consumption in the electricity and mining sectors has increased by 125 and 42 per cent respectively. In the Northern Territory, gas consumption in the electricity sector has increased by 85 per cent; while consumption in the mining sector was virtually non-existent a decade ago and has increased to 19 PJ in 2012-13 (Figure 11).
A tightening gas market: supply, demand and price outlook for NSW
24
Figure 11: Australian gas consumption by market and sector80
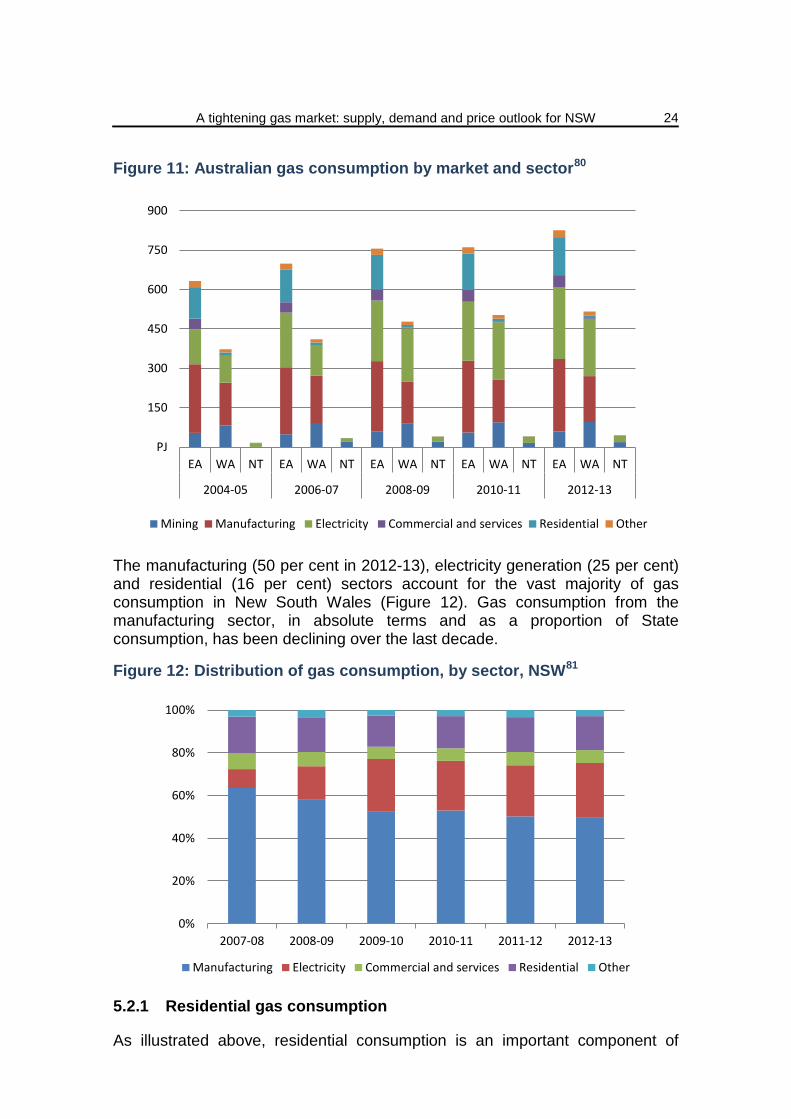
The manufacturing (50 per cent in 2012-13), electricity generation (25 per cent) and residential (16 per cent) sectors account for the vast majority of gas consumption in New South Wales (Figure 12). Gas consumption from the manufacturing sector, in absolute terms and as a proportion of State consumption, has been declining over the last decade.
Figure 12: Distribution of gas consumption, by sector, NSW81
5.2.1 Residential gas consumption
As illustrated above, residential consumption is an important component of
PJ
150
300
450
600
750
900
EA WA NT EA WA NT EA WA NT EA WA NT EA WA NT
2004-05 2006-07 2008-09 2010-11 2012-13
Mining Manufacturing Electricity Commercial and services Residential Other
0%
20%
40%
60%
80%
100%
2007-08 2008-09 2009-10 2010-11 2011-12 2012-13
Manufacturing Electricity Commercial and services Residential Other

A tightening gas market: supply, demand and price outlook for NSW
25
demand, accounting for approximately 145 PJ (or 18 per cent) of eastern market demand in 2013.
Residential demand is mainly temperature dependent and has a strong seasonal winter peak, attributable to gas demand for heating in New South Wales and Victoria.
A significant proportion of the residential demand in the eastern market is accounted for by Victoria which has a more extensive gas distribution networks for residential customers. Queensland has very low gas penetration in the mass market.82
BREE (2014) anticipate that the rising wholesale gas prices will translate into higher retail prices but do not expect a significant consumption response from the retail segment in the short to medium term:83
A significant demand response to higher wholesale gas prices in this sector is unlikely in the near- and medium-terms. Although an increase in the wholesale price of gas will increase the retail price, this component only accounts for about 30 per cent of the retail price and consumers are relatively slow in switching from gas to electricity appliances.
The Australian Bureau of Statistics published the results of the first Household Energy Consumption Survey in 2013 which included information on household energy expenditure, consumption, behaviours, perceptions and other characteristics related to household energy use.
When compared to the other States and Territories, New South Wales ranked fourth in terms of household gas consumption, consuming on average 411.6 megajoules (MJ) per household per week (Figure 13).
Figure 13: Mean weekly household mains gas consumption, 201284
According to the survey results, the ACT (1,157 MJ) consumed the most gas per household, followed by Victoria (1,047 MJ) and Tasmania (564 MJ).
MJ
200
400
600
800
1000
1200
NSW VIC QLD SA WA TAS NT ACT

A tightening gas market: supply, demand and price outlook for NSW
26
New South Wales ranked fifth in terms of household gas expenditure, spending on average $7 per household per week (Figure 14). According to the survey results, the ACT ($21/week) spent the most on gas per household, followed by Victoria ($18/week) and Western Australia ($10/week).
Figure 14: Average weekly household expenditure on gas, 201285
5.3 Variability of gas demand
As illustrated in Section 5.2, gas in eastern Australia is currently consumed by:
• residential customers and small to medium sized industrial and commercial customers who tend to purchase their gas on a delivered basis from licenced retailers;
• large industrial customers operating in the mining and manufacturing sectors; and
• gas fired electricity generators.
The volume of gas consumed by these groups of end-users and the pattern of their consumption during the year will depend on their end-use requirements and, in some cases, their location.
For example, large industrial customers that have stable demand for their end products and have a relatively constant production process are likely to exhibit a relatively flat consumption profile (i.e. stable rather than fluctuating demand). On the other hand, mining companies that are exposed to international commodity markets may have quite a lumpy consumption profile over time, as output changes in response to changing conditions in the commodity markets.
Similarly, the consumption profile of residential customers that live in areas subject to a distinct seasonal influence (e.g. Victoria and the ACT) is likely to be quite volatile in the winter months given the reliance placed on gas fuelled heating. In constrast, the consumption profile of a group of customers living in more temperate climates (e.g. South East Queensland) is likely to be relatively
$/week
5
10
15
20
25
NSW VIC QLD SA WA TAS NT ACT

A tightening gas market: supply, demand and price outlook for NSW
27
flat because gas is predominantly used for cooking.86
For this reason, the demand for gas in Victoria is far more variable than it is in other jurisdictions and exhibits a distinct seasonal trend (Figure 15). This variation is not surprising given residential heating load accounts for such a significant portion of demand in the State and there are more than 1.8 million residential gas customers in Victoria.87
The consumption profile of NSW exhibits a reasonable degree of variability and, like Victoria, has a distinct seasonal trend, with demand peaking in winter and reaching its lows in summer.
Figure 15: Variability of demand between eastern market jurisdictions88
South Australia’s consumption profile also exhibits a reasonable degree of variability, but rather than just peaking in winter it also peaks in summer. The prevalence of gas fired generation in South Australia, coupled with the fact that electricity demand in South Australia has tended to peak in summer, would appear to explain this profile.89
Queensland’s consumption profile is relatively flat, which is consistent with the fact that its largest group of end-users, large industrial customers, tend to have a relatively flat load profile
5.4 Liquefied natural gas demand
The announcement by Arrow Energy in May 2007 that it was considering developing an LNG facility in Queensland heralded a new era in the eastern gas market.90 In the immediate period following, Santos, Origin and BG Group announced that they were considering developing LNG facilities at Gladstone, supplied by coal seam gas from the Bowen/Surat basins (Table 10).
A tightening gas market: supply, demand and price outlook for NSW
28
Table 10: LNG projects under development91
Under construction Owner/Proponent Capacity
(Mtpa) LNG
trains Cost
(A$b) Estimated
completion date
Australia Pacific LNG
Origin Energy (37.5%); ConocoPhillips (37.5%);
Sinopec (25%) 9 2 24.7 2015
Queensland Curtis LNG
BG Group (73.75%); CNOOC (25%); Tokyo Gas
(1.25%) 8.5 2 20.4 2014
Gladstone LNG
Santos (30%); PETRONAS (27.5%); Total (27.5%);
KOGAS (15%) 7.8 2 18.5 2015
Planned
Arrow LNG Shell (50%); PetroChina (50%) 8 2 na 2017+
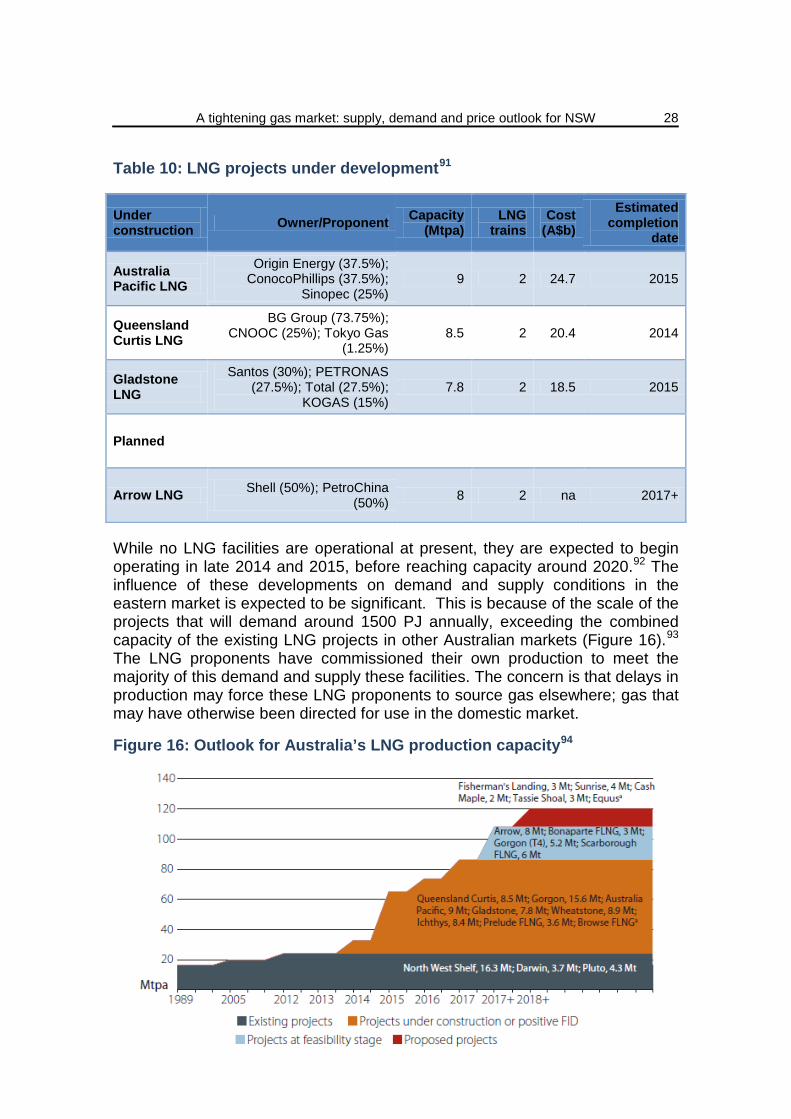
While no LNG facilities are operational at present, they are expected to begin operating in late 2014 and 2015, before reaching capacity around 2020.92 The influence of these developments on demand and supply conditions in the eastern market is expected to be significant. This is because of the scale of the projects that will demand around 1500 PJ annually, exceeding the combined capacity of the existing LNG projects in other Australian markets (Figure 16).93 The LNG proponents have commissioned their own production to meet the majority of this demand and supply these facilities. The concern is that delays in production may force these LNG proponents to source gas elsewhere; gas that may have otherwise been directed for use in the domestic market.
Figure 16: Outlook for Australia’s LNG production capacity94

A tightening gas market: supply, demand and price outlook for NSW
29
BREE and the Department of Industry (2014) also noted that these LNG developments appear to be progressing in line with project timelines:95
The upstream development timetables for the projects remain tight but all appear to be making progress on well and field development. QGC has reported an additional 225 wells being drilled in Q3 2013 and is on track to meet the requirement of 2,000-plus wells for project commencement. Santos has reported a further 67 development wells being spudded in Q3 2013, and the 200th well for the year spudded in early October 2013. Origin Energy has reported an additional 105 wells spudded in Q3 2013, with 448 wells drilled for APLNG Phase 1. While the performance of these wells is unknown, the APLNG and QCLNG drilling rates appear to be on schedule.
Table 11: CSG development wells drilled for LNG projects96
LNG Project Total wells drilled Estimated wells
required - 2 trains Additional production
QCLNG 1700 2,000 plus additional gas 50 PJ domestic gas
APLNG 448 1,100 85 PJ QCLNG; 110 PJ domestic gas
GLNG 380; final investment decision (~540 total)
1,000–1,400 plus Cooper Basin 40–50 PJ domestic gas
Arrow 2,500 25–30 PJ domestic gas
However, K Lowe Consulting (2013) pointed out that some proponents have experienced difficulties developing the productive capacity of their gas fields in time. Because of this, LNG proponents have been entering into gas supply agreements with other producers to supplement their production.97 This creates additional supply tightness (Section 6.5) and may exacerbate existing price pressures in the eastern market.
While prospective LNG production and capacity expectations remain more subdued now than perhaps 12 months ago (Section 5.5.2), once fully operational there will be a significant jump in demand in the eastern market. The period over which this is to occur coincides with the time at which a large number of domestic gas supply contracts are due to expire (between 2015 and 2017). K Lowe Consulting (2013) concluded that:98
The market is therefore likely to be placed under additional pressure over the next three to five years as domestic customers whose contracts are due to expire compete with each other, and potentially LNG proponents, to secure supply from a much smaller set of producers.
The potential price response is dependent on how quickly domestic production responds to these tightening market signals. As BREE and the Department of Industry (2014) noted:99
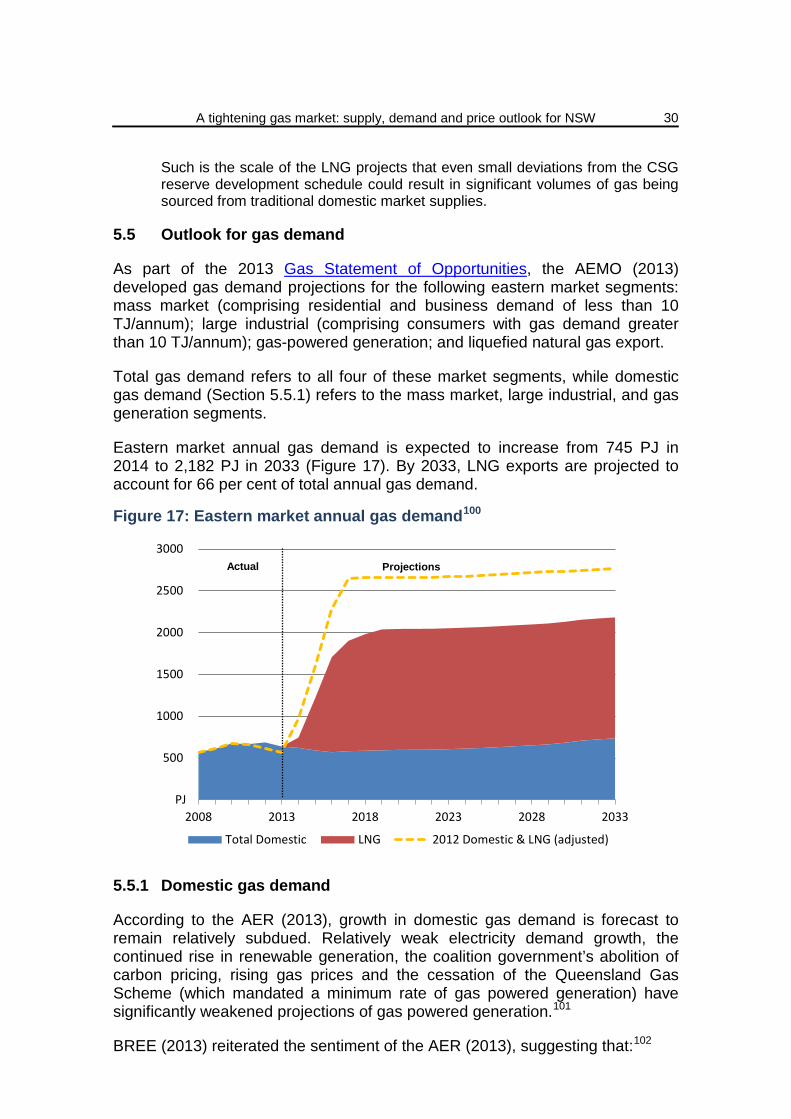
A tightening gas market: supply, demand and price outlook for NSW
30
Such is the scale of the LNG projects that even small deviations from the CSG reserve development schedule could result in significant volumes of gas being sourced from traditional domestic market supplies.
5.5 Outlook for gas demand
As part of the 2013 Gas Statement of Opportunities, the AEMO (2013) developed gas demand projections for the following eastern market segments: mass market (comprising residential and business demand of less than 10 TJ/annum); large industrial (comprising consumers with gas demand greater than 10 TJ/annum); gas-powered generation; and liquefied natural gas export.
Total gas demand refers to all four of these market segments, while domestic gas demand (Section 5.5.1) refers to the mass market, large industrial, and gas generation segments.
Eastern market annual gas demand is expected to increase from 745 PJ in 2014 to 2,182 PJ in 2033 (Figure 17). By 2033, LNG exports are projected to account for 66 per cent of total annual gas demand.
Figure 17: Eastern market annual gas demand100
5.5.1 Domestic gas demand
According to the AER (2013), growth in domestic gas demand is forecast to remain relatively subdued. Relatively weak electricity demand growth, the continued rise in renewable generation, the coalition government’s abolition of carbon pricing, rising gas prices and the cessation of the Queensland Gas Scheme (which mandated a minimum rate of gas powered generation) have significantly weakened projections of gas powered generation.101
BREE (2013) reiterated the sentiment of the AER (2013), suggesting that:102
PJ
500
1000
1500
2000
2500
3000
2008 2013 2018 2023 2028 2033
Total Domestic LNG 2012 Domestic & LNG (adjusted)
Actual Projections

A tightening gas market: supply, demand and price outlook for NSW
31
Long run gas demand in the Eastern market is expected to be affected by a range of factors, notably lower projected growth in electricity demand and upcoming LNG exports and the associated effect of linking to international LNG prices.
Based on AEMO (2013) analysis, domestic demand is projected to grow relatively slowly at approximately 0.9 per cent annually to approximately 750 PJ by 2033 (Figure 18).103
The projected growth in domestic gas demand is driven by the mass market and large industrial market segments; the latter being the largest contributor, accounting for approximately 51 per cent of domestic gas demand in 2033.
Figure 18: East coast domestic gas demand104
Over the 20-year outlook period and on a market segment basis:105
• Mass market demand is projected to grow at an average annual rate of 1.2 per cent, driven by: economic growth; growth in real household per capita incomes and household dwelling numbers; and a moderation in residential and business gas prices.
• Large industrial demand is expected to grow at an average annual rate of 1.2 per cent, driven by: a moderation in energy price growth; and assumed positive economic growth over the outlook period for energy-intensive industry sectors in New South Wales and Queensland.
• Gas generation demand is expected to fall by an average annual rate of 0.4 per cent, due to: decreasing electricity demand and low carbon price assumptions.
On a State by State basis, average annual domestic demand growth between 2014 and 2033 is projected to be highest in Tasmania (1.9 per cent), followed by Queensland (1.1 per cent) and Victoria (1.0 per cent). Annual demand in
PJ
100
200
300
400
500
600
700
800
2008 2013 2018 2023 2028 2033Residential and business Large industrial Gas powered generation
Actual Projections

A tightening gas market: supply, demand and price outlook for NSW
32
NSW is projected to grow by 0.8 per cent over this period (Table 12).
Table 12: Average annual domestic gas demand growth by demand group and market segment, 2014 to 2033106
SA VIC TAS NSW/ACT QLD Total
Gas generation -0.4% 12.6% 3.5% -2.3% -0.7% -0.4%
Mass market 0.7% 1.1% 2.7% 1.6% 2.4% 1.2%
Large industrial 0.4% 0.2% 1.3% 1.3% 1.7% 1.2%
Total 0.0% 1.0% 1.9% 0.8% 1.1% 0.9%
Growth in Tasmania is driven by projected increases in large industrial demand, which is the largest market segment there. In Queensland growth reflects large industrial activity, including basic and fabricated metal manufacturing. In Victoria and South Australia mass market growth is higher than large industrial growth, which is flat or declining. Both the mass market and large industrial segments contribute to domestic gas demand growth in New South Wales.
Demand projections for the eastern market in the 2013 GSOO are lower than those in the 2012 GSOO because: mass market demand growth is higher due to lower projected gas price growth and higher economic growth; gas generation demand is lower, reflecting lower electricity demand; and large industrial demand growth is lower due to decreased expectations for development of new gas intensive projects.107
5.5.2 Prospective liquefied natural gas export demand
Annual LNG gas demand in Queensland is projected to rise from zero to approximately 1,450 by 2019 (Figure 19), posing significant challenges to producers to supply both domestic demand and LNG exports.108
Figure 19: Eastern market LNG export demand109
PJ
500
1000
1500
2000
2500
2013 LNG 2012 LNG (adjusted)
GSOO May Update

A tightening gas market: supply, demand and price outlook for NSW
33
Since publication of the 2013 GSOO, AEMO updated its projections of LNG exports and associated gas and electricity consumption. The new projections show changes in the expected ramp-up profile for the Queensland Curtis LNG (QCLNG), Gladstone LNG (GLNG), and Australia Pacific Liquefied Natural Gas (APLNG) projects.
QCLNG and APLNG are expected to reach full capacity in 2016 and 2017 respectively; however, the latest LNG demand projections show reduced demand from these facilities during the ramp-up phase.
In contrast, the GLNG project is expected to reach full capacity in 2018, six months earlier than previously assumed. The updated projections show an average demand reduction of 123 TJ/day between 2014 and 2015, and an average demand increase of 92 TJ/day between 2016 and 2018.
The AEMO engaged Core Energy Group to review the outlook for LNG in eastern and south-eastern Australia. Further details around the eastern market LNG can be found in its report which was published in July 2013.
Jacobs SKM (2014) also provided LNG export projections in their June 2014 report to the AEMO on Gas & Electricity Use in LNG.
6. GAS PRODUCTION
6.1 Aggregate production
Natural gas production in Australia has grown at a relatively high annual rate of 5.2 per cent over the last decade, increasing from 1,464 PJ in 2002-03 to 2,439 PJ in 2012-13 (Figure 20). Western Australia accounted for 76 per cent of this growth; with production increasing from 794 PJ in 2002-03 to 1,532 PJ in 2012-13. Production also increased in Victoria (by 178 PJ) and Queensland (104 PJ).
Figure 20: Natural gas production in Australia, by State and Territory110
PJ
500
1000
1500
2000
2500
NSW VIC QLD WA SA NT

A tightening gas market: supply, demand and price outlook for NSW
34
Natural gas production remains relatively insignificant in New South Wales when taken as a proportion of Australian production (Figure 21). In absolute terms, production in New South Wales was estimated at 6.2 PJ in 2012-13 (or 0.25 per cent of Australian production), a decline of around 25 per cent since 2002-03.
Figure 21: Natural gas production in NSW111
6.1.1 New South Wales coal seam gas developments
According to BREE and the Department of Industry (2014), coal seam gas (CSG) developments in New South Wales have the potential to supply more than half of current New South Wales domestic demand within the next five years.112 These developments include Santos’s Narrabri CSG Project, Metgasco’s Casino Project and AGL’s Gloucester CSG Project (Table 13).
Table 13: New CSG projects and expansion projects under development113
Project Company Basin Estimated start-up
New Capacity (PJ/year)
Capital expenditure
($m)
Feasibility stage
Gloucester CSG Project AGL Gloucester 2016 15 200
Narrabri CSG Phase 1 Santos Gunnedah - 35 1300
Suspended development
Casino (West Casino Gas) Metgasco Clarence-
Moreton - 18 0-250
CSG development in New South Wales has been slowed by recent regulatory reform. For example, Santos is proceeding with its exploration and appraisal program near Narrabri, having gained the necessary State and Federal government approvals for the first stage of the program in October 2013. BREE
%
0.1
0.2
0.3
0.4
0.5
0.6
0.7
PJ
2
4
6
8
10
12
NSW Production
% of Australian production

A tightening gas market: supply, demand and price outlook for NSW
35
and the Department of Industry (2014) note however, that regulatory reforms may see the project delayed over the coming years.114
One key reform is the Government’s Strategic Regional Land Use Policy. On 19 February 2013, the NSW Government announced that new measures would be put in place to limit CSG activity in residential areas and ‘critical industry clusters’. Some of the more significant measures are set out below:115
• a 2 km exclusion zone will apply to all residential areas, which will prohibit any new exploration or production activities;
• exclusion zones will also apply to any areas that are identified as being part of a critical industry cluster (e.g. viticulture and equine industries); and
• all exploration, assessment and production titles and activities will need to hold an Environment Protection Licence
In July 2014, related changes were made to the State Environmental Planning Policy (Mining, Petroleum Production and Extractive Industries) 2007 regarding assessment pathways for CSG exploration, the status of existing approved CSG activities, and the operation of exclusion zones.
The Office of Coal Seam Gas, which regulates the industry with the Environment Protection Authority, provides an overview of the current regulatory framework, which includes these and other regulations and policies related to coal seam gas development.
6.2 Sources of gas supply
Australia’s gas has historically been sourced from the Carnarvon, Cooper and Gippsland Basins (Figure 22). In recent years, production from a number of other basins has increased rapidly, particularly from unconventional resources in the Surat-Bowen Basin and conventional offshore resources in the Bonaparte Basin and the Otway Basin.116
In August 2013 Australia’s 2P gas reserves117 were estimated at 141,000 PJ, comprising 97,000 PJ of conventional natural gas and 44,000 PJ of CSG (Table 14).
Australia produced 2,206 PJ of gas in 2012−13, half of which was for the domestic market. Production for domestic use was up 3.3 per cent from levels in 2011−12. The CSG share of production for domestic use was steady at 23 per cent.118
Around half of Australia’s gas production (all currently sourced from offshore basins in Western Australia and the Northern Territory) is exported as LNG. This ratio will increase, with the development of new LNG projects in Queensland and Western Australia.
Eastern Australia contains around 36 per cent of Australia’s gas reserves, the majority of which are CSG reserves in the Surat−Bowen Basin. The Basin,

A tightening gas market: supply, demand and price outlook for NSW
36
which extends from Queensland into northern New South Wales, accounts for 81 per cent of reserves in eastern Australia.
The Gippsland Basin off coastal Victoria accounts for 37 per cent of the eastern market production. Production in Victoria’s offshore Otway Basin (15 per cent of eastern market production) has risen significantly since 2004.
Figure 22: Australian gas basins and transmission pipelines119
After several years of decline, Cooper Basin reserves in central Australia rose in the past three years, and were up 14 per cent in the year to June 2013. Production in the Basin may continue to rise, with new activity focused on the development of shale gas.120
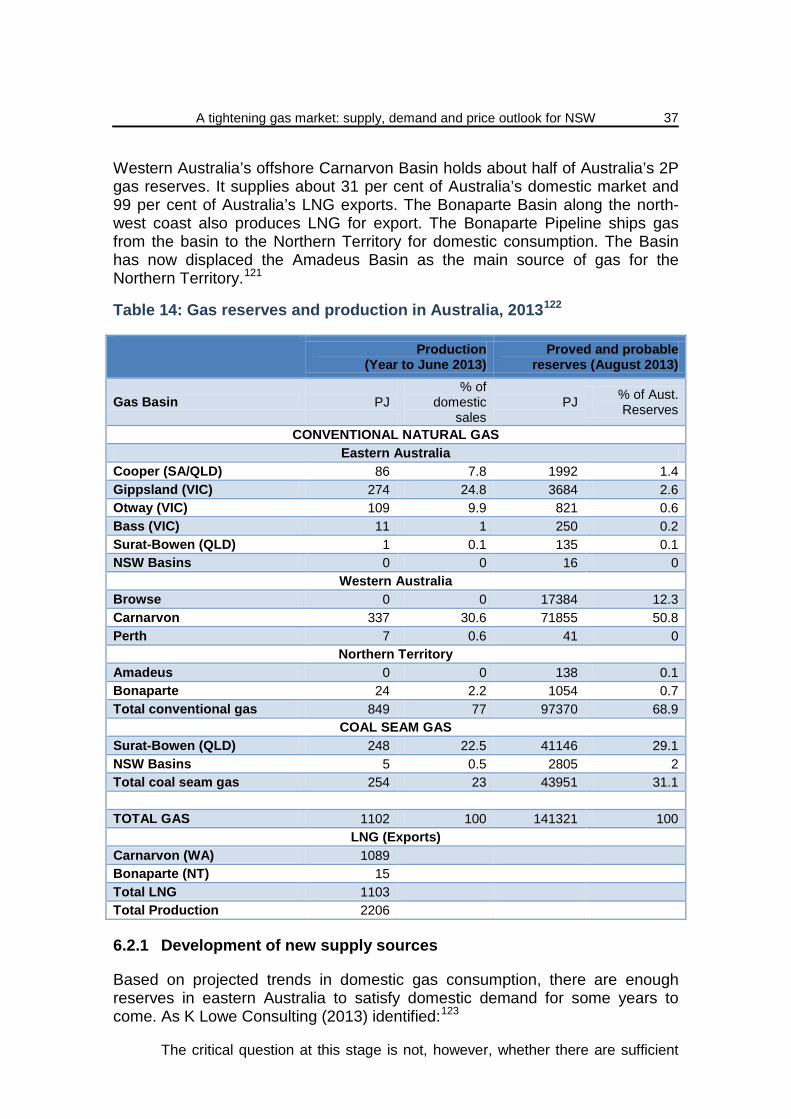
A tightening gas market: supply, demand and price outlook for NSW
37
Western Australia’s offshore Carnarvon Basin holds about half of Australia’s 2P gas reserves. It supplies about 31 per cent of Australia’s domestic market and 99 per cent of Australia’s LNG exports. The Bonaparte Basin along the north-west coast also produces LNG for export. The Bonaparte Pipeline ships gas from the basin to the Northern Territory for domestic consumption. The Basin has now displaced the Amadeus Basin as the main source of gas for the Northern Territory.121
Table 14: Gas reserves and production in Australia, 2013122
Production (Year to June 2013)
Proved and probable reserves (August 2013)
Gas Basin PJ % of
domestic sales
PJ % of Aust. Reserves
CONVENTIONAL NATURAL GAS Eastern Australia
Cooper (SA/QLD) 86 7.8 1992 1.4 Gippsland (VIC) 274 24.8 3684 2.6 Otway (VIC) 109 9.9 821 0.6 Bass (VIC) 11 1 250 0.2 Surat-Bowen (QLD) 1 0.1 135 0.1 NSW Basins 0 0 16 0
Western Australia Browse 0 0 17384 12.3 Carnarvon 337 30.6 71855 50.8 Perth 7 0.6 41 0
Northern Territory Amadeus 0 0 138 0.1 Bonaparte 24 2.2 1054 0.7 Total conventional gas 849 77 97370 68.9
COAL SEAM GAS Surat-Bowen (QLD) 248 22.5 41146 29.1 NSW Basins 5 0.5 2805 2 Total coal seam gas 254 23 43951 31.1 TOTAL GAS 1102 100 141321 100
LNG (Exports) Carnarvon (WA) 1089 Bonaparte (NT) 15 Total LNG 1103 Total Production 2206
6.2.1 Development of new supply sources
Based on projected trends in domestic gas consumption, there are enough reserves in eastern Australia to satisfy domestic demand for some years to come. As K Lowe Consulting (2013) identified:123
The critical question at this stage is not, however, whether there are sufficient

A tightening gas market: supply, demand and price outlook for NSW
38
reserves. Rather, the question is whether the reserves can be developed in time to address the shortfall in supply that is expected to arise once the LNG projects start exporting, and to counter the projected decline of the Otway Basin, which is expected to occur from around 2019.
Some of the new sources of supply that have been proposed in eastern Australia are identified in Table 15. K Lowe Consulting (2013) noted that:124
…the list of potential new sources has diminished somewhat following the introduction of the NSW Government’s Strategic Regional Land Use Policy, with a number of projects (accounting for at least 570 PJ of reserves) now on hold including: Metgasco’s Clarence-Moreton Basin project; Dart Energy’s Fullerton Cove project; AGL’s Hunter gas project and its proposed expansion of Camden.
Table 15: Potential new sources of supply in the eastern market125
Project Proponent Progress Reserves Annual Production
Start Date
Kipper field (Gippsland Basin)
BHP, ExxonMobil and Santos
Final investment decision (FID) made but commencement delayed
622 PJ 30 PJ 2016
Gunnedah Basin
Santos and EnergyAust
-ralia
Exploration stage so no FID has yet been made
and no environmental approvals have been
obtained
1,426 PJ 36.5 PJ 2016
-2017
Gloucester Basin AGL
FID not yet made but environmental approvals
obtained 669 PJ 30 PJ 2016
Ironbark field (Bowen/Surat basins)
Origin
Exploration stage so no FID has yet been made
but environmental approvals have been
sought
178 PJ 20-40 PJ 2015
-2016
Cooper Basin
Beach/Che-vron,
Santos, Senex,
Drillsearch/BG
Exploration stage only so no FID has yet been
made
Contingent resource
estimated to be 4,358 PJ
NA NA
South Nicholson and Isa Super basins
Armour Energy
Exploration stage only so no FID has yet been
made
No reserves certified,
establishing contingent resources
130 PJ- 200 PJ 2016
Despite the potential for gas production to increase through the development of these new reserves, there is still considerable uncertainty as to whether these new sources of supply will be sufficient to fill the potential void left by LNG demand because it is unclear whether:126
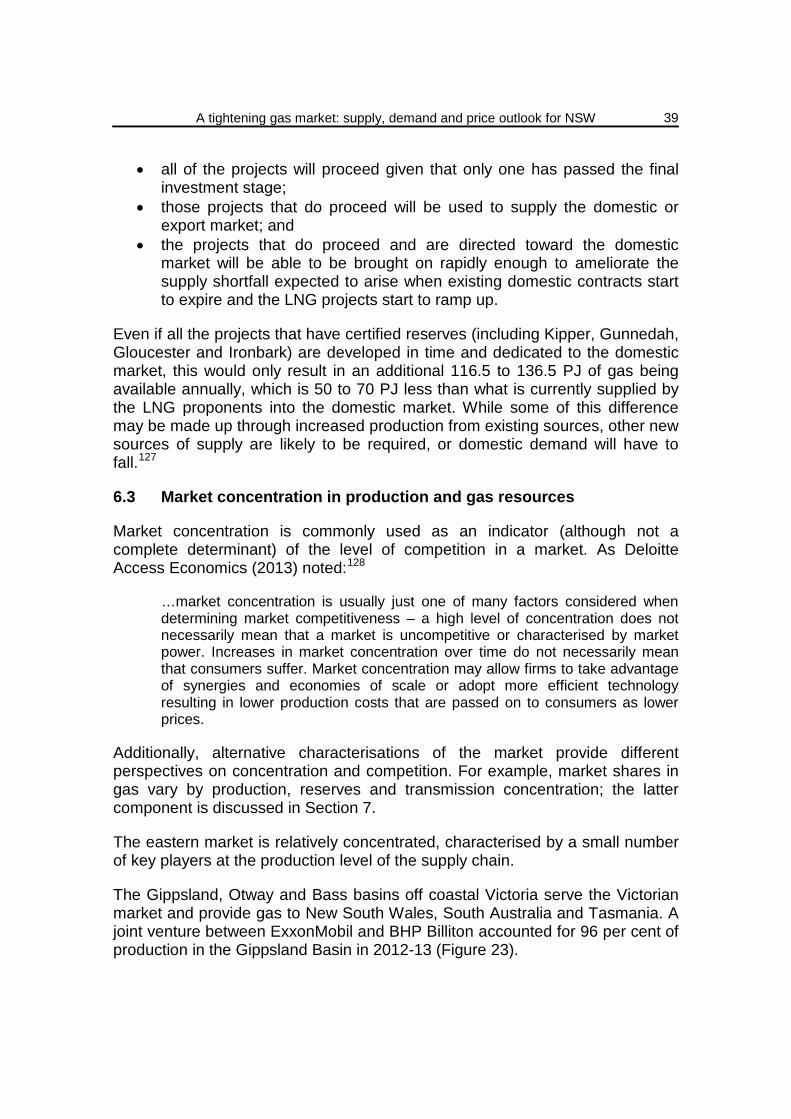
A tightening gas market: supply, demand and price outlook for NSW
39
• all of the projects will proceed given that only one has passed the final investment stage;
• those projects that do proceed will be used to supply the domestic or export market; and
• the projects that do proceed and are directed toward the domestic market will be able to be brought on rapidly enough to ameliorate the supply shortfall expected to arise when existing domestic contracts start to expire and the LNG projects start to ramp up.
Even if all the projects that have certified reserves (including Kipper, Gunnedah, Gloucester and Ironbark) are developed in time and dedicated to the domestic market, this would only result in an additional 116.5 to 136.5 PJ of gas being available annually, which is 50 to 70 PJ less than what is currently supplied by the LNG proponents into the domestic market. While some of this difference may be made up through increased production from existing sources, other new sources of supply are likely to be required, or domestic demand will have to fall.127
6.3 Market concentration in production and gas resources
Market concentration is commonly used as an indicator (although not a complete determinant) of the level of competition in a market. As Deloitte Access Economics (2013) noted:128
…market concentration is usually just one of many factors considered when determining market competitiveness – a high level of concentration does not necessarily mean that a market is uncompetitive or characterised by market power. Increases in market concentration over time do not necessarily mean that consumers suffer. Market concentration may allow firms to take advantage of synergies and economies of scale or adopt more efficient technology resulting in lower production costs that are passed on to consumers as lower prices.
Additionally, alternative characterisations of the market provide different perspectives on concentration and competition. For example, market shares in gas vary by production, reserves and transmission concentration; the latter component is discussed in Section 7.
The eastern market is relatively concentrated, characterised by a small number of key players at the production level of the supply chain.
The Gippsland, Otway and Bass basins off coastal Victoria serve the Victorian market and provide gas to New South Wales, South Australia and Tasmania. A joint venture between ExxonMobil and BHP Billiton accounted for 96 per cent of production in the Gippsland Basin in 2012-13 (Figure 23).

A tightening gas market: supply, demand and price outlook for NSW
40
Figure 23: Market shares in domestic gas production, by basin, 2012-13129
The Otway Basin has a more diverse ownership base, with Origin Energy (31 per cent), BHP Billiton (21 per cent) and Santos (18 per cent) accounting for the bulk of production. The principal producers in the smaller Bass Basin are Origin Energy and Australian Worldwide Exploration.
The growth of the CSG and LNG industries has led to considerable new entry in Queensland’s Surat−Bowen Basin over the past decade. In 2008, Origin Energy (35 per cent), Santos (22 per cent) and Queensland Gas (18 per cent) owned 75 per cent of reserves in the Surat−Bowen Basin. However, new entry and a series of mergers and acquisitions between 2009 and 2011 led to a more diverse market structure. As at 2012-13, the largest producers were BG Group (21 per cent), Origin Energy (17 per cent), ConocoPhillips (17 per cent), Sinopec (11 per cent), Santos (9 per cent), Shell and PetroChina (6 per cent each). The same businesses own the majority of reserves in the Basin (Table 16).
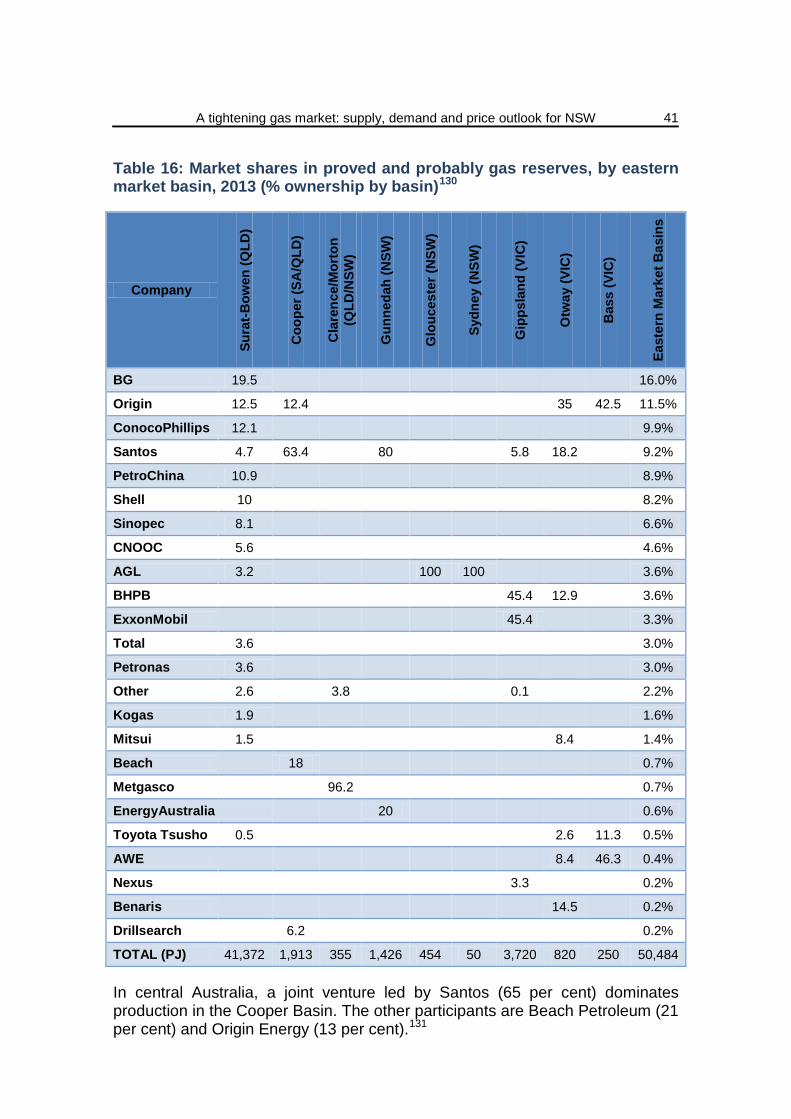
A tightening gas market: supply, demand and price outlook for NSW
41
Table 16: Market shares in proved and probably gas reserves, by eastern market basin, 2013 (% ownership by basin)130
Company
Sura
t-Bow
en (Q
LD)
Coo
per (
SA/Q
LD)
Cla
renc
e/M
orto
n (Q
LD/N
SW)
Gun
neda
h (N
SW)
Glo
uces
ter (
NSW
)
Sydn
ey (N
SW)
Gip
psla
nd (V
IC)
Otw
ay (V
IC)
Bas
s (V
IC)
East
ern
Mar
ket B
asin
s
BG 19.5 16.0%
Origin 12.5 12.4 35 42.5 11.5%
ConocoPhillips 12.1 9.9%
Santos 4.7 63.4 80 5.8 18.2 9.2%
PetroChina 10.9 8.9%
Shell 10 8.2%
Sinopec 8.1 6.6%
CNOOC 5.6 4.6%
AGL 3.2 100 100 3.6%
BHPB 45.4 12.9 3.6%
ExxonMobil 45.4 3.3%
Total 3.6 3.0%
Petronas 3.6 3.0%
Other 2.6 3.8 0.1 2.2%
Kogas 1.9 1.6%
Mitsui 1.5 8.4 1.4%
Beach 18 0.7%
Metgasco 96.2 0.7%
EnergyAustralia 20 0.6%
Toyota Tsusho 0.5 2.6 11.3 0.5%
AWE 8.4 46.3 0.4%
Nexus 3.3 0.2%
Benaris 14.5 0.2%
Drillsearch 6.2 0.2%
TOTAL (PJ) 41,372 1,913 355 1,426 454 50 3,720 820 250 50,484
In central Australia, a joint venture led by Santos (65 per cent) dominates production in the Cooper Basin. The other participants are Beach Petroleum (21 per cent) and Origin Energy (13 per cent).131

A tightening gas market: supply, demand and price outlook for NSW
42
Several major companies have equity in Western Australia’s Carnarvon Basin, which is Australia’s largest producing basin. The businesses participate in joint ventures, typically with overlapping ownership interests. Chevron (36 per cent), Shell (17 per cent) and ExxonMobil (14 per cent) have the largest reserves in the Basin, given their equity in the Gorgon project.
Woodside (25 per cent) and Apache Energy (24 per cent) are the largest producers for Western Australia’s domestic market. Santos (19 per cent), BP and Chevron (9 per cent each), and BHP Billiton and Shell (5.5 per cent each) also have significant market shares in Western Australian production.
The principal reserves in the Northern Territory are located in the Bonaparte Basin in the Timor Sea. Eni Australia owns over 80 per cent of Australian reserves in the Basin.
An interesting point to note from Table 16 is that the three largest gas retailers, AGL, Origin and EnergyAustralia, have interests in upstream reserves. While Origin has been involved in the upstream segment for quite some time, AGL and EnergyAustralia’s entry into this segment of the supply chain has been more recent, with AGL entering in 2005 and EnergyAustralia in 2011.132
6.4 Gas production costs
The cost of new gas developments has increased in recent years, both domestically and worldwide. As BREE and the Department of Industry (2014) point out:133
…the average [worldwide] cost [of new gas developments] has more than doubled between 2004 and 2008. Over the same period, development costs in Australia increased sharply and have increased further as a result of technology requirements, skills shortages, tight engineering and construction markets and productivity issues.
CSG developments at the scale required to support LNG export is a new phenomenon in Australia and, although many technical aspects remain uncertain, production costs are generally high (Table 17). This reflects the high costs associated with the exploration and appraisal, well drilling and development, and project execution phases.134
Table 17: Jacobs SKM estimates of gas production breakeven costs ($/GJ)135
Basin Joint Venture 2P Reserves 3P + 2C Resources
Gippsland, Longford BHPB, Exxon $3.50 $4.50
Gippsland, Orbost Nexus $4.00 $5.00
Bass Origin, AWE $4.00 $5.00
Otways, Minerva BHPB, Santos $4.00 $5.00

A tightening gas market: supply, demand and price outlook for NSW
43
Otways, Geographe Origin, Others $4.00 $5.00
Otways, Casino Santos, Others $4.00 $5.00
Cooper Eromanga Santos, Beach, Origin $4.00 $5.00
Cooper Eromanga Others $6.00 $6.00
Sydney AGL $5.50 $6.50
Gloucester AGL $3.50 $4.50
Gunnedah Santos/TRU $3.50 $4.50
Clarence Morton Metgasco $6.00 $8.00
Bowen AGL/Arrow $4.50 $5.50
Surat APLNG $3.50 $4.50
Surat QCLNG $3.50 $4.50
Surat/Bowen GLNG $3.50 $4.50
Surat Arrow Energy $4.50 $5.50
Surat/Bowen Second Tier $5.00 $6.00
BREE (2013) suggests that production costs, plus the cost of transport and business margins, reflect what could be considered a long run market floor (i.e. minimum price). This can be visualised on a supply curve which shows the production cost for each additional unit of gas extracted based on existing and potential gas resources (i.e. the marginal cost).
A number of market analysts have developed gas supply curves for the eastern market. A characteristic of these gas supply curves is an increase in production costs as the quantity of gas supplied increases. This tends to occur because cheaper more accessible resources are extracted first, leaving behind progressively more expensive sources of supply.
Figure 24 shows gas supply curves developed by ACIL Tasman, Intelligent Energy Systems, EnergyQuest and Core Energy Group (ACIL Tasman, EnergyQuest and Core’s supply curves are for the entire eastern market while the Intelligent Energy System supply curve is only for unconventional gas resources). Differences in supply curves arise from differing assumptions on the quantity of gas, accessibility, well flow, depletion rates and a number of other factors.136
Based on Intelligent Energy System analysis, production costs for gas from coal seams and other unconventional sources begin at around $3.50/GJ, but rise steadily after that as new reserves are exploited. Under their scenario, around 80,000 PJ of unconventional gas can be extracted at less than $7/GJ, and 120,000 PJ can be extracted at less than $10/GJ.
This view is reasonably consistent with the ACIL Tasman and EnergyQuest

A tightening gas market: supply, demand and price outlook for NSW
44
supply curves for the entire eastern market (which includes conventional sources) as both show costs moving towards $10/GJ at around 100,000 PJ.
Figure 24: Estimated eastern market gas supply curves137
Core Energy Group presented a considerably lower supply curve than the other three analysts. This outcome appears to be a result of the assumed quantity and cost of gas resources in coal seams in the Surat-Bowen basins. Core Energy Group assumes that around 80,000 PJ are available at around $3.50/GJ, which is considerably more gas at a lower cost than other analysts’ expectations.138
Jacobs SKM (2014) concluded that the wide gap between the estimates prepared illustrates the degree of uncertainty in gas costs, particularly for resources beyond the first 50,000 PJ. They also noted that:139
Since the latter resources are not yet in the 2P category even the producers concerned would not have accurate estimates of production costs and access to better information would probably not reduce the uncertainty. However what is of most relevance to this study is the cost of gas applicable to recent new contracts, which is determined by how far along the curves the gas already committed to the LNG projects takes the next contracts.
6.5 Gas supply adequacy in the eastern market
The 2013 Gas Statement of Opportunities provides an adequacy assessment of gas supply infrastructure to meet demand across eastern and south-eastern Australia over a 10 to 20 year outlook period. The forecasts should be interpreted with care regarding the methodology and results; and as the AEMO (2013) noted:140
…modelling results indicating that supply is insufficient to meet demand are referred to as “potential shortfalls”. This is intended to signal potential opportunities for investment in production, pipeline, processing, or storage facilities. Potential shortfalls are not intended to predict future shortfalls unless

A tightening gas market: supply, demand and price outlook for NSW
45
they occur before there is an opportunity for market correction. In this case, a market response affecting the timing or scope of projects could result, with potential shortfalls avoided due to lower demand.
Based on the analysis completed by the AEMO (2013), potential gas supply shortfalls may occur in Queensland if facilities that are currently dedicated to domestic demand are prioritised to supply rising LNG export demand (Figure 25). Without further production investment, potential daily shortfalls in Queensland are projected to exceed 250 TJ once all six committed LNG trains reach full output in 2019.141
Figure 25: Annual potential eastern market shortfalls142
If production in Queensland and South Australia is prioritised for export, there will be flow-on effects to New South Wales with potential daily shortfalls of 50 to 100 TJ over winter peak demand days from 2018. Observed potential shortfalls increase slowly in frequency and magnitude until 2027, when consumption of conventional gas reserves in the south begins to affect supply across the system.143
The AEMO (2013) suggests that committed and advanced projects in New South Wales are not sufficient to completely alleviate these shortfalls without further support from the Moomba–Sydney Pipeline. Additionally, the magnitude and timing of potential supply shortfalls in New South Wales is sensitive to actions taken by producers in the Cooper and Gloucester Basins.
The AEMO (2013) highlighted opportunities that exist to offset potential supply shortfalls in New South Wales by: augmenting transmission capability between Victoria and New South Wales; increasing production in the Cooper Basin; undertaking moderate development of the Gunnedah Basin; and/or developing an alternative transmission route between Queensland and New South Wales.144 For example, if the moderate development (100 TJ per day) was
PJ
50
100
150
200
250Queensland New South Wales
South Australia Victoria
Tasmania
A tightening gas market: supply, demand and price outlook for NSW
46
undertaken in the Gunnedah Basin, the AEMO (2013) estimated that shortfalls in New South Wales may be deferred until 2024.
Since the 2013 GSOO was published, Santos and the New South Wales Government signed a Memorandum of Understanding for the Narrabri gas project in February 2014. Under the Memorandum of Understanding, the New South Wales Government assures streamlined approvals process coordination, with Santos agreeing to provide a high quality environmental assessment and comprehensive community consultation.145
The AEMO (2014) made subsequent adjustments to the New South Wales supply shortfalls forecast in the 2013 GSOO. In the May 2014 GSOO Update Narrabri is represented as a 100 TJ/day processing facility and a 100 TJ/day pipeline from Narrabri to Young, commencing from 2018.
The Narrabri project, combined with proposed new production in the Gloucester Basin, could reduce shortfalls in New South Wales to 47 TJ across four winter days in 2020, down from 2,083 TJ across 86 days projected in the 2013 GSOO.
However, if production in Queensland and South Australia is prioritised for export (which restricts flows on the Moomba to Sydney Pipeline) potential shortfalls in New South Wales could increase to 1,330 TJ across 53 days in 2020.
In the Eastern Australian Domestic Gas Market Study, BREE and the Department of Industry (2014) recommended that unnecessary impediments to supply be removed to overcome any potential shortfalls in the coming years:146
Facilitating and encouraging a supply response is also vital to dealing with any potential physical shortage and addressing supply uncertainty. Governments should focus on removing unnecessary impediments to developing new gas resources particularly during a period of tightness in gas supply and providing a certain and predictable regulatory and investment environment.
Some stakeholders argue that domestic gas should be retained for domestic use, and that the wholesale cost should reflect the cost of production.147 To date, most Australian governments have been reluctant to intervene in gas markets by imposing domestic reservation policies. Currently, only Western Australia has an active reservation policy. Queensland has the power to require that gas produced in the state be supplied only to the Australian market. However, it has not exercised this power as yet.
For more discussion around the issue of domestic gas reservation, see Part Two of the NSW Parliamentary Research Service paper Gas: resources, industry structure and domestic reservation policies.
6.5.1 Gas reserves adequacy in the eastern market
Analysis by the AEMO (2013) indicates that sufficient reserves are likely to be commercially viable to satisfy projected gas demand for at least the next 20

A tightening gas market: supply, demand and price outlook for NSW
47
years.
However, the nature and extent of reserve sufficiency is not consistent across all the basins, with proven and probable reserves (2P) projected to expire for a number of basins over the outlook period. Under the modelled production-cost conditions from the AEMO (2013), consumption (or ‘depletion’) of Otway Basin 2P reserves occurs in 2020. Bass and Cooper Basin conventional 2P reserves are consumed in 2025 (Figure 26). Gippsland 2P reserves are consumed in late 2026. The 2P CSG reserves in Queensland are sufficient to supply demand until the end of the 20-year outlook period.148
Figure 26: Conventional 2P reserves consumption149
Additional 3P reserves and 2C resources (i.e. gas with a lower probability of economically and/or technically feasible extraction) are available in the Otway, Bass, Gippsland and Cooper Basins. The AEMO (2013) concluded that 3P/2C reserves in the Bass, Gippsland, and Cooper Basins are sufficient to ensure supply until the end of the 20-year outlook period, provided current transmission and production limitations remain unchanged.
However, the 3P/2C reserves in the Otway Basin are only sufficient to ensure supply until 2028 or 2029, depending on the level of support the southern States receive from production in the north.150
According to the AEMO (2013), consumption of Otway Basin reserves presents significant challenges for supply of gas to New South Wales, Victoria, and South Australia. Once conventional reserves in Victoria are consumed, current reserves estimates indicate new supply will be required from CSG reserves in Queensland and New South Wales and unconventional reserves in South Australia.
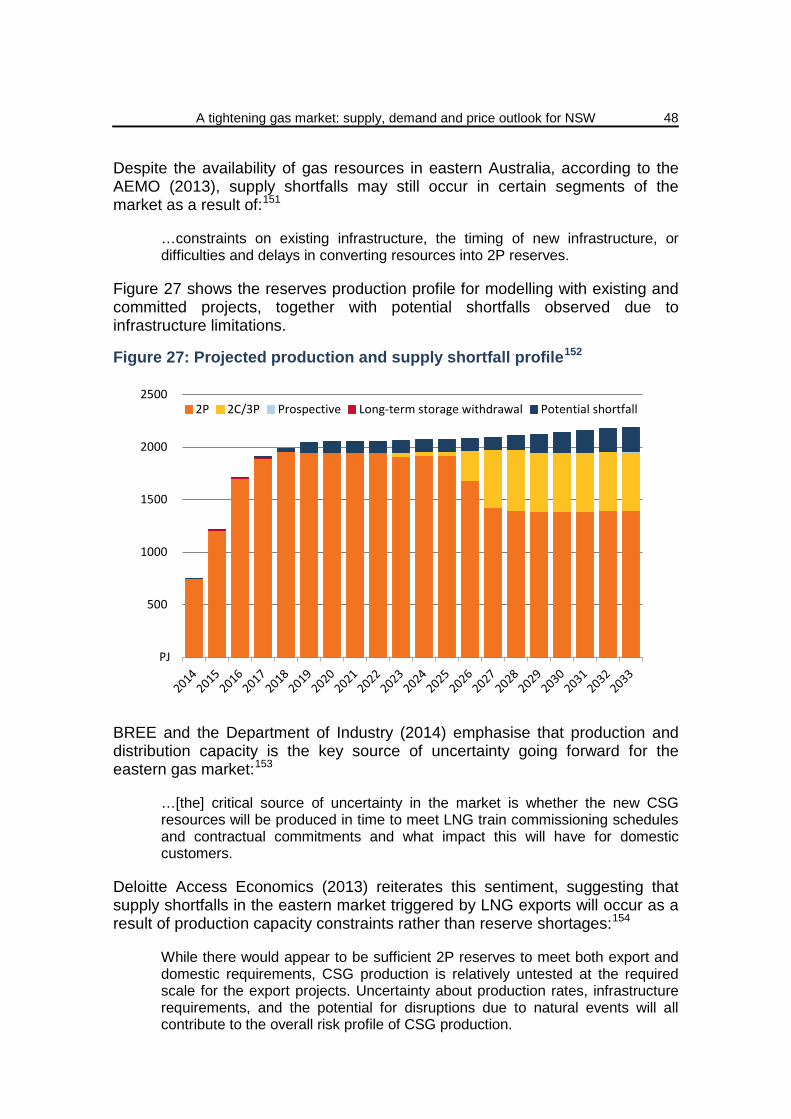
A tightening gas market: supply, demand and price outlook for NSW
48
Despite the availability of gas resources in eastern Australia, according to the AEMO (2013), supply shortfalls may still occur in certain segments of the market as a result of:151
…constraints on existing infrastructure, the timing of new infrastructure, or difficulties and delays in converting resources into 2P reserves.
Figure 27 shows the reserves production profile for modelling with existing and committed projects, together with potential shortfalls observed due to infrastructure limitations.
Figure 27: Projected production and supply shortfall profile152
BREE and the Department of Industry (2014) emphasise that production and distribution capacity is the key source of uncertainty going forward for the eastern gas market:153
…[the] critical source of uncertainty in the market is whether the new CSG resources will be produced in time to meet LNG train commissioning schedules and contractual commitments and what impact this will have for domestic customers.
Deloitte Access Economics (2013) reiterates this sentiment, suggesting that supply shortfalls in the eastern market triggered by LNG exports will occur as a result of production capacity constraints rather than reserve shortages:154
While there would appear to be sufficient 2P reserves to meet both export and domestic requirements, CSG production is relatively untested at the required scale for the export projects. Uncertainty about production rates, infrastructure requirements, and the potential for disruptions due to natural events will all contribute to the overall risk profile of CSG production.
PJ
500
1000
1500
2000
25002P 2C/3P Prospective Long-term storage withdrawal Potential shortfall

A tightening gas market: supply, demand and price outlook for NSW
49
7. GAS TRANSMISSION AND DISTRIBUTION
Gas pipelines provide a transportation link between upstream gas producers and downstream customers.
Transmission pipelines enable gas to be transported under high pressure from production facilities to either the entry point of the distribution system or directly to users that are connected to the transmission pipeline. The transmission pipelines have wide diameters and operate under high pressure to optimise shipping capacity. Australia’s gas transmission network covers over 20,000 kilometres.155
The distribution pipeline network delivers gas from demand hubs to industrial and residential customers and consists of high, medium and low pressure pipelines. The high and medium pressure mains service areas of high demand and transport gas between population concentrations within a distribution area. The low pressure pipes lead off the high pressure mains to end customers. The gas distribution networks in eastern Australia covers around 74,000 kilometres.
The distribution and transmission networks have a combined asset value of $8 billion.156
7.1 Transmission pipelines
The ownership of gas transmission pipelines is highly concentrated. APA Group, a publicly listed company, has the most extensive portfolio of gas transmission assets in Australia. It owns three pipelines in New South Wales (including the Moomba to Sydney Pipeline), the Victorian Transmission System, five major Queensland pipelines (including three pipelines linking the Cooper Basin in central Australia to Brisbane) and a Northern Territory pipeline.157
Over the last decade there has been significant investment in this segment of the gas supply chain, underwritten by long term transport contracts and ownership interests in the pipeline. This investment has involved:158
• a number of new pipelines being constructed, including the SEA Gas Pipeline in 2004, the QSN Link in 2009 and the three LNG pipelines currently under construction; and
• the capacity of a number of others being expanded, including the Eastern Gas Pipeline, the Interconnect, the Moomba to Sydney Pipeline, the Roma to Brisbane Pipeline, the Queensland Gas Pipeline and the Victorian Declared Transmission System.
According to K Lowe Consulting (2013), these investments have facilitated the development of a more interconnected network in eastern Australia, increasing the supply options available to buyers in most major demand centres.

A tightening gas market: supply, demand and price outlook for NSW
50
Table 18: Major gas transmission pipelines159
PIPELINE Length (km)
Capacity (TJ/d)
Valuation ($m) Operator
EASTERN AUSTRALIA Queensland North Queensland Gas Pipeline 391 108 160
(2005) AGL Energy, Arrow
Energy Queensland Gas Pipeline (Wallumbilla to Gladstone) 629 142 N/A Jemena Asset
Management Carpentaria Pipeline (Ballera to Mount Isa) 840 119 N/A APA Group
Berwyndale to Wallumbilla Pipeline 113 N/A 70 (2009) APA Group Dawson Valley Pipeline 47 30 8 (2007) Westside
Roma (Wallumbilla) to Brisbane 440 219 418 (2012) APA Group
Wallumbilla to Darling Downs Pipeline 205 400 90 (2009) Origin Energy
South West Queensland Pipeline (Ballera to Wallumbilla) 756 181 N/A APA Group
QSN Link (Ballera to Moomba) 180 212 165 (2009) APA Group
New South Wales Moomba to Sydney Pipeline 2029 420 835
(2003) APA Group
Central West Pipeline (Marsden to Dubbo) 255 10 28 (1999) APA Group
Central Ranges Pipeline (Dubbo to Tamworth) 300 7 53 (2003) Jemena Asset
Management Eastern Gas Pipeline (Longford to Sydney) 795 268 450
(2000) Jemena Asset Management
Victoria Victorian Transmission System (GasNet) 2035 1030 618
(2013) APA Group/AEMO
South Gippsland Natural Gas Pipeline 250 N/A 50 (2012) Jemena Asset
Management
VicHub N/A 150 N/A Jemena Asset Management
South Australia Moomba to Adelaide Pipeline 1185 253 370
(2001) Epic Energy SA
SEA Gas Pipeline 680 303 500 APA Group Tasmania Tasmanian Gas Pipeline 734 129 440
(2005) Tas Gas Networks
NORTHERN TERRITORY Bonaparte Pipeline 287 80 170
(2008) APA Group
Amadeus Gas Pipeline 1512 104 92 (2011) APA Group Daly Waters to McArthur River Pipeline 330 16 N/A APA Group
Palm Valley to Alice Springs Pipeline 140 27 N/A APA Group

A tightening gas market: supply, demand and price outlook for NSW
51
While the current degree of pipeline interconnection means that it is technically feasible to transport gas between a number of basins and demand centres, in practice the ability to move gas between locations depends on:160
• whether there are any capacity constraints on the relevant pipeline(s) or a lack of physical interconnection between pipelines; and
• the extent to which there is any un-contracted capacity on the relevant pipeline(s).
The choice between alternative supply sources also depends on the costs that would be incurred in transporting the gas from the basin to the demand centre.
7.2 Distribution network
The major gas distribution networks in southern and eastern Australia are privately owned by:161
• Envestra which owns networks in Victoria, South Australia, Queensland and the Northern Territory. APA Group (33 per cent) and Cheung Kong Infrastructure (17 per cent) have shareholdings in Envestra.
• Jemena which owns the principal New South Wales gas distribution network (Jemena Gas Networks) and has a 50 per cent share of the ACT network (ActewAGL).
Table 19: Gas distribution networks in eastern Australia162
Network Customers Length (km)
Asset base (2012
$m)
Investment Current
regulatory Period (2012
$m)
Current regulatory
period
QUEENSLAND
Allgas Energy 84 400 2 900 432 135 1 Jul 2011– 30 Jun 2016
Envestra 89 100 2 640 323 142 1 Jul 2011– 30 Jun 2016
NEW SOUTH WALES/ACT
Jemena Gas Networks (NSW)
1 050 000 24 430 2 425 759 1 Jul 2010– 30 Jun 2015
ActewAGL 124 000 4 720 292 92 1 Jul 2010– 30 Jun 2015
Wagga Wagga 23 800 680 62 21 1 Jul 2010– 30 Jun 2015
Central Ranges System 7 000 180 na na 2006–19
VICTORIA SP AusNet 602 000 9 860 1 255 459 1 Jan 2013–
31 Dec 2017
Multinet 668 000 9 960 1 038 239 1 Jan 2013– 31 Dec 2017
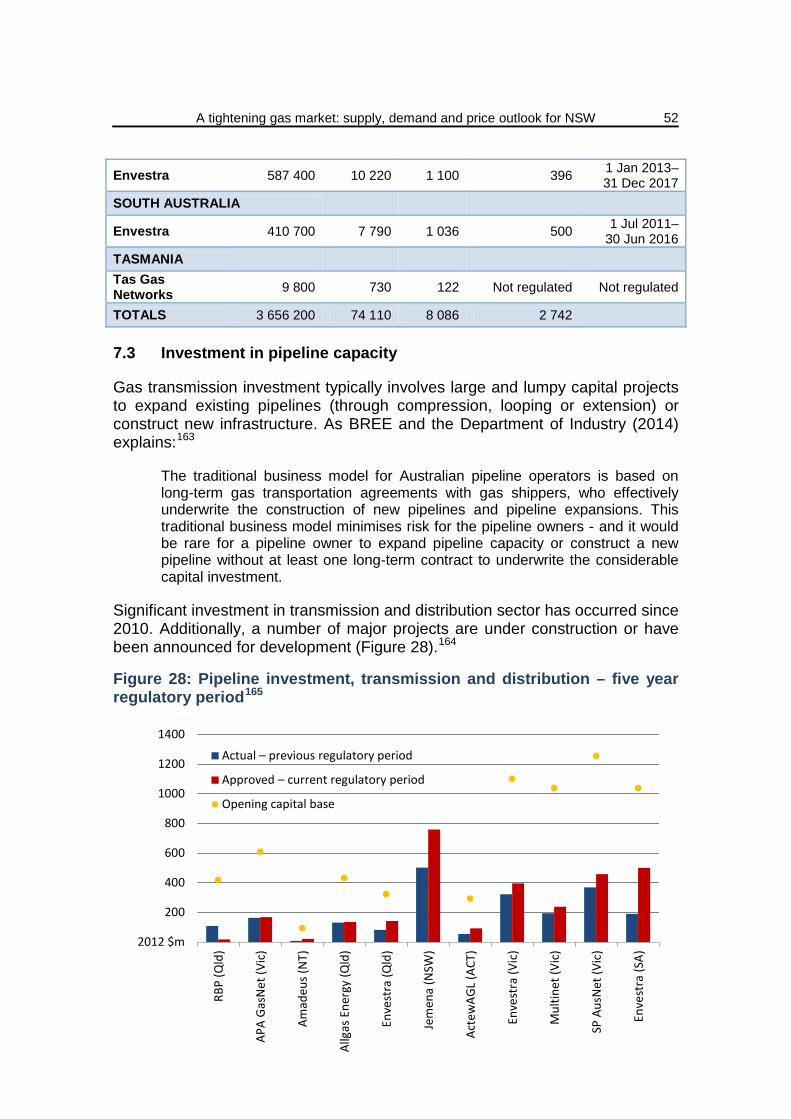
A tightening gas market: supply, demand and price outlook for NSW
52
Envestra 587 400 10 220 1 100 396 1 Jan 2013– 31 Dec 2017
SOUTH AUSTRALIA
Envestra 410 700 7 790 1 036 500 1 Jul 2011– 30 Jun 2016
TASMANIA Tas Gas Networks 9 800 730 122 Not regulated Not regulated
TOTALS 3 656 200 74 110 8 086 2 742
7.3 Investment in pipeline capacity
Gas transmission investment typically involves large and lumpy capital projects to expand existing pipelines (through compression, looping or extension) or construct new infrastructure. As BREE and the Department of Industry (2014) explains:163
The traditional business model for Australian pipeline operators is based on long-term gas transportation agreements with gas shippers, who effectively underwrite the construction of new pipelines and pipeline expansions. This traditional business model minimises risk for the pipeline owners - and it would be rare for a pipeline owner to expand pipeline capacity or construct a new pipeline without at least one long-term contract to underwrite the considerable capital investment.
Significant investment in transmission and distribution sector has occurred since 2010. Additionally, a number of major projects are under construction or have been announced for development (Figure 28).164
Figure 28: Pipeline investment, transmission and distribution – five year regulatory period165
2012 $m
200
400
600
800
1000
1200
1400
RBP
(Qld
)
APA
Gas
Net
(Vic
)
Amad
eus (
NT)
Allg
as E
nerg
y (Q
ld)
Enve
stra
(Qld
)
Jem
ena
(NSW
)
Acte
wAG
L (A
CT)
Enve
stra
(Vic
)
Mul
tinet
(Vic
)
SP A
usN
et (V
ic)
Enve
stra
(SA)
Actual – previous regulatory period
Approved – current regulatory period
Opening capital base
A tightening gas market: supply, demand and price outlook for NSW
53
Investment in distribution networks in eastern Australia (including investment to augment capacity) is forecast at around $2.7 billion in the current access arrangement period (typically five years). The underlying drivers include rising connection numbers, the replacement of aging networks and the maintenance of capacity to meet customer demand.
Given the potential impediments to supply in New South Wales, infrastructure management and investment may take on particular significance. A number of strategies are being developed that will assist in managing supply risk for New South Wales. Those strategies include the following:166
• APA is expanding the capacity of the South West Pipeline by over 70 TJ per day, which will allow increased access to the gas supplies from the Otway Basin and the underground storage at Port Campbell, for delivery to New South Wales through the Interconnect if required.
• APA is also expanding the Interconnect to allow contracted flows of between 100 and 118 TJ per day from Victoria into New South Wales, which are to be agreed between APA and AEMO. The expansion is under relatively short-term contracts with the shippers. This is in addition to the Eastern Gas Pipeline, which can flow 288 TJ per day to New South Wales at full capacity (and which can be expanded by compression if required).
• AGL is constructing an LNG peak shaving facility at Newcastle with a daily send-out of up to 120 TJ per day.
There may also be potential to supplement supply on peak days with storage in the Moomba to Sydney Pipeline or at Moomba.
7.3.1 Proposed Moomba to Alice Springs gas pipeline
In August 2014, Industry Minister Ian Macfarlane outlined his plans to create a national gas market that could theoretically send gas all the way from the Browse Basin in Western Australia to Sydney, heading off a potential gas shortage in New South Wales and expected price rises on the east coast. In an interview with Fairfax Media, Mr Macfarlane said the missing link in creating a single national gas market could be a 1000-kilometre pipeline between Alice Springs and Moomba, South Australia, which would link up the Northern Territory to the east coast gas market and could cost about $1.3 billion.167
Mr Macfarlane declared the project was "more than a vision" and said he was in talks with NT chief minister Adam Giles, the industry and NSW Energy Minister Anthony Roberts.
The construction of the 900-kilometre pipeline from Browse Basin on the Kimberley coast to Darwin, which is already underway, would then effectively link the eastern Australian gas market to the gas-rich west. Gas from the Browse Basin is currently slated to be sold overseas but in the future it could also be sold into the domestic market.168

A tightening gas market: supply, demand and price outlook for NSW
54
Figure 29: Proposed gas pipeline connecting east and west coast169
Central Petroleum Chief Executive Richard Cottee stated that the construction of the Moomba to Alice Springs pipeline:
…would be a critical step to a hub-based pricing system for natural gas that will eventually bring down prices across the eastern States [and] could result in a transparent gas price at Moomba - a local version of the US benchmark Henry Hub price – that would provide the necessary price signal to stimulate investment in increased supply.
There is a golden opportunity…to create long term structural advantage and you can then create a deep and liquid market with all of the States interconnected.
7.4 The effect of LNG on pipeline utilisation
The LNG developments underway in the market could affect the utilisation of a number of pipelines and/or cause the directional flow of some pipelines to change. K Lowe Consulting (2013) put forth a number of hypothetical examples which demonstrate the way in which this could occur:170
• If there is a significant reduction in gas supplied from the Cooper and Bowen/Surat basins into NSW/ACT and South Australia once existing contracts expire, and more gas has to be supplied to these jurisdictions from Victoria until new sources are developed, then the utilisation of both the Moomba to Adelaide Pipeline System and Moomba Sydney Pipeline could fall. If this was to occur, the utilisation of the other pipelines servicing Sydney, Canberra and Adelaide (e.g. the Eastern Gas Pipeline, and the SEA Gas Pipeline) would need to increase.
• If significant volumes of gas from the Cooper Basin flow to Queensland, the predominant flow of gas on the QSN Link and South West

A tightening gas market: supply, demand and price outlook for NSW
55
Queensland Pipeline could revert to an easterly direction (i.e. from Moomba to Wallumbilla).
• If significant volumes of gas flow from Victoria to Queensland, then, depending on which route the gas takes, the predominant flow of gas on the Moomba to Adelaide Pipeline System or Moomba Sydney Pipeline could change, along with the flow of the QSN Link and South West Queensland Pipeline.
K Lowe Consulting (2013) noted that it is not possible to determine whether any of these hypotheticals is likely to eventuate or, if they do, the likely timing or extent of their effect on pipeline utilisation/directional flow.
8. CONCLUSION
Wholesale gas prices in the eastern Australian market rose at a relatively rapid rate between 2010 and 2013, induced through a combination of cyclical spikes in demand, the market response to carbon pricing and the expiration of longer term and more affordably priced gas supply contracts.
While wholesale spot price rises have remained relatively subdued over the past year, there is an expectation among various analysts that prices will peak in the next few years. A projected surge in gas demand combined with potential production constraints means that there is likely to be tightness in the eastern gas market; most notably in the critical period between 2015 and 2020 when LNG facilities in Queensland reach capacity.171
The eastern market has sufficient reserves to meet the projected growth in demand (both domestic and LNG) over the coming decade. However, there is considerable uncertainty as to whether production is able to respond efficiently enough to meet LNG demand; largely because the vast majority of the gas commissioned for LNG supply is being sourced from unconventional reserves in the Surat-Bowen Basin. The scale of production from such gas reserves is unprecedented.
If there are deficits in production reserved for LNG facilities, there is an expectation that supplies of gas will be diverted from domestic use to meet the shortfall, with the likely outcome an exacerbation of market tightness and associated price rises.
The rate of energy consumption in the Australian economy has been declining over time and rising gas prices are likely to contribute to a continuation of that trend. The extent to which the intensity of gas use could be reduced has the potential to provide some buffer against the current tight market, although the ability for individual businesses to make such adjustments varies widely.172
Nevertheless, it is generally accepted that an effective response to tightness in the gas market will need to come from the supply-side. Although many supply-side factors are determined privately, the government does exert regulatory influence, particularly with respect to the mining approvals process. From this perspective, in their Eastern Australian Domestic Gas Market Study, BREE and

A tightening gas market: supply, demand and price outlook for NSW
56
the Department of Industry (2014) noted that New South Wales could supply up to half its annual demand and recommended that unnecessary impediments to supply be removed to overcome any potential shortfalls in the coming years.173
1 For more discussion of conventional and unconventional reserves see: Haylen, A, and Montoya, D., Gas: resources, industry structure and domestic reservation policies, 2013, NSW Parliamentary Research Service, Briefing Paper No 12/2013, p.4 2 For more discussion of gas reserve definitions see: Haylen, A, and Montoya, D., Gas: resources, industry structure and domestic reservation policies, 2013, NSW Parliamentary Research Service, Briefing Paper No 12/2013, p. 6 3 BREE, Eastern Australian Domestic Gas Market Study, January 2014, Joint Study with the Department of Industry, p.16 4 BREE, Gas Market Report, October 2013, p.21 5 BREE, Eastern Australian Domestic Gas Market Study, January 2014, Joint Study with the Department of Industry, p.8 6 Ibid, p.13 7 AEMO, STTM General Overview and Publications, 2014 8 Jacobs SKM, New Contract Gas Price Projections, April 2014, Final Report for IPART, Table 2-2, p.6 9 AEMO, Overview of the short term trading market for natural gas, December 2011, p.4 10 Deloitte Access Economics, Assessment of the East Coast gas market and opportunities for long-term strategic reform, May 2013, Final Report for the Energy Supply Association of Australia, p.30 11 Deloitte Access Economics, Assessment of the East Coast gas market and opportunities for long-term strategic reform, May 2013, Final Report for the Energy Supply Association of Australia, p.30 12 Seaton, A., Wallumbilla Gas Supply Hub, February 2014, Johnson, Winter and Slattery Lawyers 13 AEMO, Gas Supply Hub Frequently Asked Questions, March 2014 14 Ibid 15 BREE, Eastern Australian Domestic Gas Market Study, January 2014, Joint Study with the Department of Industry, p.16 16 ACIL Tasman, Cost of gas for the 2013 to 2016 regulatory period, June 2013, Final Public Version, A report on the wholesale cost of gas for the review for Standard Retailers in New South Wales, p.14 17 BREE, Gas Market Report, October 2013, p.35 18 Ibid, Figure 14, p.42 19 Ibid, p.36 20 BREE, Eastern Australian Domestic Gas Market Study, January 2014, Joint Study with the Department of Industry, p.28 21 Ibid, p.8 22 ACIL Tasman, Cost of gas for the 2013 to 2016 regulatory period, June 2013, Final Public Version, A report on the wholesale cost of gas for the review for Standard Retailers in New South Wales, p.15 23 Balfe, P., Eye on the market, 2014, Gas Today - Spring 2014, Issue 29 24 Ibid, p.29 25 Ibid, p.30 26 AER, State of the Energy Market 2013, December 2013, p.99 27 AEMO, Short Term Trading Market Data, 2014 28 AER, State of the Energy Market 2013, December 2013, p.100 29 Ibid 30 AER, State of the Energy Market 2013, December 2013, p.101 31 Ibid 32 Ibid 33 Jacobs SKM, New Contract Gas Price Projections, April 2014, Final Report for IPART, p.7 34 Balfe, P., Eye on the market, 2014, Gas Today - Spring 2014, Issue 29 35 Ibid
A tightening gas market: supply, demand and price outlook for NSW
57
36 Jacobs SKM, New Contract Gas Price Projections, April 2014, Final Report for IPART Table 6-1, p.22 37 Ibid, Table 6-3, p.24 38 Ibid, p.21 39 Ibid, p.21 40 BREE, Gas Market Report, October 2013, p.42 41 Ibid, p.37 42 Jacobs SKM, New Contract Gas Price Projections, April 2014, Final Report for IPART, p.ii 43 Ibid, p.34 44 Ibid, p.iv-v 45 BREE, Gas Market Report, July 2012 46 BREE, Gas Market Report, October 2013, p.42 47 BREE, Gas Market Report, October 2013, Figure 15, p.43 48 Jacobs SKM, New Contract Gas Price Projections, April 2014, Final Report for IPART, p.ii 49 BREE, Eastern Australian Domestic Gas Market Study, January 2014, Joint Study with the Department of Industry, p.3-4 50 ABS, Consumer Price Index, Australia, Cat. No. 6401.0, June 2014, Table 11 51 IPART, Review of regulated retail prices and charges for gas, June 2013, Final Report, p.1 52 Ibid, p.2 53 IPART, Changes in regulated retail gas price from 1 July 2014, June 2014, Final Report, p.5 54 IPART, Review of regulated retail prices and charges for gas, June 2013, Final Report, p.3-4 55 IPART, Changes in regulated retail gas price from 1 July 2014, June 2014, Final Report, p.1 56 Ibid, p.5 57 Ibid, p.7 58 Ibid, p.7 59 AER, State of the Energy Market 2013, December 2013, p.133 60 Ibid 61 Ibid, Table 5.4, p.135 62 Ibid, p.128 63 Ibid, p.129 64 IPART, Changes in regulated retail gas price from 1 July 2014, June 2014, Final Report, p.24 65 Ibid, Table 3.1, p.25 66 Ibid, p.27 67 Ibid, Table 3.2, p.28 68 AER, State of the Energy Market 2013, December 2013, Figure 5.1, p.122 69 Ibid, p.127 70 Ibid, p.128; For similar information relating to the electricity sector, see: Haylen, A., Electricity prices, demand and supply in NSW, 2014, NSW Parliamentary Research Service, Briefing Paper No 3/2014 71 AER, Retail Statistics, 2014 72 IPART, Changes in regulated retail gas price from 1 July 2014, June 2014, Final Report, p.12 73 Ibid, p.13 74 BREE, 2014 Australian energy statistics data, July 2014, Table Q1 75 AER, Wholesale Statistics, 2014 76 BREE, Gas Market Report, October 2013, p.26 77 BREE, Eastern Australian Domestic Gas Market Study, January 2014, Joint Study with the Department of Industry, p.41 78 Ibid, p.43 79 Ibid, p.43 80 BREE, 2014 Australian energy statistics data, July 2014, Table F 81 Ibid 82 BREE, Eastern Australian Domestic Gas Market Study, January 2014, Joint Study with the Department of Industry, p.45 83 Ibid 84 ABS, Household Energy Consumption Survey, Australia, 2012, Cat. No. 4670 85 Ibid

A tightening gas market: supply, demand and price outlook for NSW
58
86 K Lowe Consulting, Gas Market Scoping Study, July 2013, A Report for the AEMC, p.15 87 Ibid, p.18 88 Ibid, Figure 3.3, p.18 89 Ibid, p.18 90 K Lowe Consulting, Gas Market Scoping Study, July 2013, A Report for the AEMC, p.21 91 BREE, Eastern Australian Domestic Gas Market Study, January 2014, Joint Study with the Department of Industry, Table 1.1, p.12 92 AEMO, Gas Statement of Opportunities, 2013 93 EnergyQuest, Energy Quarterly, May 2013, p. 60-68 94 BREE, Gas Market Report, October 2013, Figure 8, p.31 95 BREE, Eastern Australian Domestic Gas Market Study, January 2014, Joint Study with the Department of Industry, p.28 96 Adapted from: BREE, Eastern Australian Domestic Gas Market Study, January 2014, Joint Study with the Department of Industry, Table 2.4, p.29 97 K Lowe Consulting, Gas Market Scoping Study, July 2013, A Report for the AEMC, p.22 98 Ibid, p.25 99 BREE, Eastern Australian Domestic Gas Market Study, January 2014, Joint Study with the Department of Industry, p.14 100 AEMO, Gas Statement of Opportunities, 2013, Figure 4, p.7 101 AER, State of the Energy Market 2013, December 2013, p.17 102 BREE, Gas Market Report, October 2013, p.40 103 AEMO, Gas Statement of Opportunities, 2013, p.iii-iv 104 AER, State of the Energy Market 2013, December 2013, Figure 13, p.17; AEMO, Gas Statement of Opportunities, 2013 105 AEMO, Gas Statement of Opportunities, 2013, p. 9 106 Ibid, Table 3.1, p.9 107 Ibid, p. 7 108 Ibid, p.iii 109 Ibid, Figure 4 110 BREE, 2014 Australian energy statistics data, July 2014, Table Q2 111 Ibid 112 BREE, Eastern Australian Domestic Gas Market Study, January 2014, Joint Study with the Department of Industry, p.30 113 Ibid, Table 2.5, p.31 114 Ibid, p.30 115 K Lowe Consulting, Gas Market Scoping Study, July 2013, A Report for the AEMC, p.8 116 BREE, Gas Market Report, October 2013, p.28 117 See for more discussion of gas reserve definitions: Haylen, A, and Montoya, D., Gas: resources, industry structure and domestic reservation policies, 2013, NSW Parliamentary Research Service, Briefing Paper No 12/2013, p. 6 118 AER, State of the Energy Market 2013, December 2013, p.86 119 Ibid, Figure 3.2, p.89 120 Ibid, p.88 121 Ibid, p.86 122 AER, State of the Energy Market 2013, December 2013, Table 3.1, p.88 123 K Lowe Consulting, Gas Market Scoping Study, July 2013, A Report for the AEMC, p.25 124 Ibid, p.27 125 Ibid, Table 4.2, p.28 126 Ibid, p.28 127 K Lowe Consulting, Gas Market Scoping Study, July 2013, A Report for the AEMC, p.32 128 Deloitte Access Economics, Assessment of the East Coast gas market and opportunities for long-term strategic reform, May 2013, Final Report for the Energy Supply Association of Australia 129 AER, State of the Energy Market 2013, December 2013, Figure 3.3, p.92 130 Ibid, Table 3.2, p.93 131 Ibid, p.91

A tightening gas market: supply, demand and price outlook for NSW
59
132 IPART, Changes in regulated retail gas price from 1 July 2014, June 2014, Final Report, p.12 133 BREE, Eastern Australian Domestic Gas Market Study, January 2014, Joint Study with the Department of Industry, p.35 134 Ibid 135 Jacobs SKM, New Contract Gas Price Projections, April 2014, Final Report for IPART, Table 5-2, p.16 136 BREE, Gas Market Report, October 2013, p.38-39 137 Ibid, Figure 12, p.39 138 Ibid, p.39 139 Jacobs SKM, New Contract Gas Price Projections, April 2014, Final Report for IPART, p.17 140 K Lowe Consulting, Gas Market Scoping Study, July 2013, A Report for the AEMC, p.7 141 AEMO, Gas Statement of Opportunities, 2013, p.iv 142 Ibid, Figure 15, p.19 143 Ibid, p.15 144 Ibid, p.iv 145 AEMO, Gas Statement of Opportunities Update, May 2014, p.4 146 BREE, Eastern Australian Domestic Gas Market Study, January 2014, Joint Study with the Department of Industry, p.5 147 IPART, Changes in regulated retail gas price from 1 July 2014, June 2014, Final Report, p.15 148 AEMO, Gas Statement of Opportunities, 2013, p.25 149 Ibid, Figure 19, p.26 150 Ibid, p.26 151 Ibid, p. v 152 AEMO, Gas Statement of Opportunities, 2013, Figure 14, p.18 153 BREE, Eastern Australian Domestic Gas Market Study, January 2014, Joint Study with the Department of Industry, p.12 154 Deloitte Access Economics, Assessment of the East Coast gas market and opportunities for long-term strategic reform, May 2013, Final Report for the Energy Supply Association of Australia 155 K Lowe Consulting, Gas Market Scoping Study, July 2013, A Report for the AEMC, p.8 156 AER, State of the Energy Market 2013, December 2013, p.106 157 Ibid 158 K Lowe Consulting, Gas Market Scoping Study, July 2013, A Report for the AEMC, p.8 159 AER, State of the Energy Market 2013, December 2013, Table 4.1, p.108 160 K Lowe Consulting, Gas Market Scoping Study, July 2013, A Report for the AEMC, p.9 161 AER, State of the Energy Market 2013, December 2013, p.106 162 AER, State of the Energy Market 2013, December 2013, Table 4.2, p.110 163 BREE, Eastern Australian Domestic Gas Market Study, January 2014, Joint Study with the Department of Industry, p.15 164 AER, State of the Energy Market 2013, December 2013, p.114 165 Ibid, Figure 4.4, p.115; Note: Regulatory periods vary and are shown in Table 20. Jemena’s opening capital base is not reflected in the graph and was $2,425 million 166 BREE, Eastern Australian Domestic Gas Market Study, January 2014, Joint Study with the Department of Industry, p.58 167 Sydney Morning Herald, Ian Macfarlane outlines ambitious plan for national gas network, August 26 2014 168 Ibid 169 Ibid 170 K Lowe Consulting, Gas Market Scoping Study, July 2013, A Report for the AEMC, p.35 171 BREE, Eastern Australian Domestic Gas Market Study, January 2014, Joint Study with the Department of Industry, p.8 172 Ibid, p.41 173 Ibid, p.5
Related Documents