M. Grgic et al. (Eds.): Rec. Advan. in Mult. Sig. Process. and Commun., SCI 231, pp. 631–657. springerlink.com © Springer-Verlag Berlin Heidelberg 2009 A Survey of Image Processing Algorithms in Digital Mammography Jelena Bozek, Mario Mustra, Kresimir Delac, and Mislav GrgicAbstract. Mammography is at present the best available technique for early detec- tion of breast cancer. The most common breast abnormalities that may indicate breast cancer are masses and calcifications. In some cases, subtle signs that can also lead to a breast cancer diagnosis, such as architectural distortion and bilateral asymmetry, are present. Breast abnormalities are defined with wide range of fea- tures and may be easily missed or misinterpreted by radiologists while reading large amount of mammographic images provided in screening programs. To help radiologists provide an accurate diagnosis, a computer-aided detection (CADe) and computer-aided diagnosis (CADx) algorithms are being developed. CADe and CADx algorithms help reducing the number of false positives and they assist radi- ologists in deciding between follow up and biopsy. This chapter gives a survey of image processing algorithms that have been developed for detection of masses and calcifications. An overview of algorithms in each step (segmentation step, feature extraction step, feature selection step, classification step) of the mass detection al- gorithms is given. Wavelet detection methods and other recently proposed methods for calcification detection are presented. An overview of contrast enhancement and noise equalization methods is given as well as an overview of calcification classifi- cation algorithms. 1 Introduction Detection and diagnosis of breast cancer in its early stage increases the chances for successful treatment and complete recovery of the patient. Screening mam- mography is currently the best available radiological technique for early detection of breast cancer [1]. It is an x-ray examination of the breasts in a woman who is asymptomatic. The diagnostic mammography examination is performed for symp- tomatic women who have an abnormality found during screening mammography. Nowadays, in most hospitals the screen film mammography is being replaced with digital mammography. With digital mammography the breast image is captured Jelena Bozek, Mario Mustra, Kresimir Delac, and Mislav Grgic University of Zagreb, Faculty of Electrical Engineering and Computing Department of Wireless Communications Unska 3/XII, HR-10000 Zagreb, Croatia e-mail: [email protected] http://www.mammoimage.org/

Welcome message from author
This document is posted to help you gain knowledge. Please leave a comment to let me know what you think about it! Share it to your friends and learn new things together.
Transcript
M. Grgic et al. (Eds.): Rec. Advan. in Mult. Sig. Process. and Commun., SCI 231, pp. 631–657. springerlink.com © Springer-Verlag Berlin Heidelberg 2009
A Survey of Image Processing Algorithms in Digital Mammography
Jelena Bozek, Mario Mustra, Kresimir Delac, and Mislav Grgic1
Abstract. Mammography is at present the best available technique for early detec-tion of breast cancer. The most common breast abnormalities that may indicate breast cancer are masses and calcifications. In some cases, subtle signs that can also lead to a breast cancer diagnosis, such as architectural distortion and bilateral asymmetry, are present. Breast abnormalities are defined with wide range of fea-tures and may be easily missed or misinterpreted by radiologists while reading large amount of mammographic images provided in screening programs. To help radiologists provide an accurate diagnosis, a computer-aided detection (CADe) and computer-aided diagnosis (CADx) algorithms are being developed. CADe and CADx algorithms help reducing the number of false positives and they assist radi-ologists in deciding between follow up and biopsy. This chapter gives a survey of image processing algorithms that have been developed for detection of masses and calcifications. An overview of algorithms in each step (segmentation step, feature extraction step, feature selection step, classification step) of the mass detection al-gorithms is given. Wavelet detection methods and other recently proposed methods for calcification detection are presented. An overview of contrast enhancement and noise equalization methods is given as well as an overview of calcification classifi-cation algorithms.
1 Introduction
Detection and diagnosis of breast cancer in its early stage increases the chances for successful treatment and complete recovery of the patient. Screening mam-mography is currently the best available radiological technique for early detection of breast cancer [1]. It is an x-ray examination of the breasts in a woman who is asymptomatic. The diagnostic mammography examination is performed for symp-tomatic women who have an abnormality found during screening mammography. Nowadays, in most hospitals the screen film mammography is being replaced with digital mammography. With digital mammography the breast image is captured Jelena Bozek, Mario Mustra, Kresimir Delac, and Mislav Grgic University of Zagreb, Faculty of Electrical Engineering and Computing Department of Wireless Communications Unska 3/XII, HR-10000 Zagreb, Croatia e-mail: [email protected] http://www.mammoimage.org/
632 J. Bozek et al.
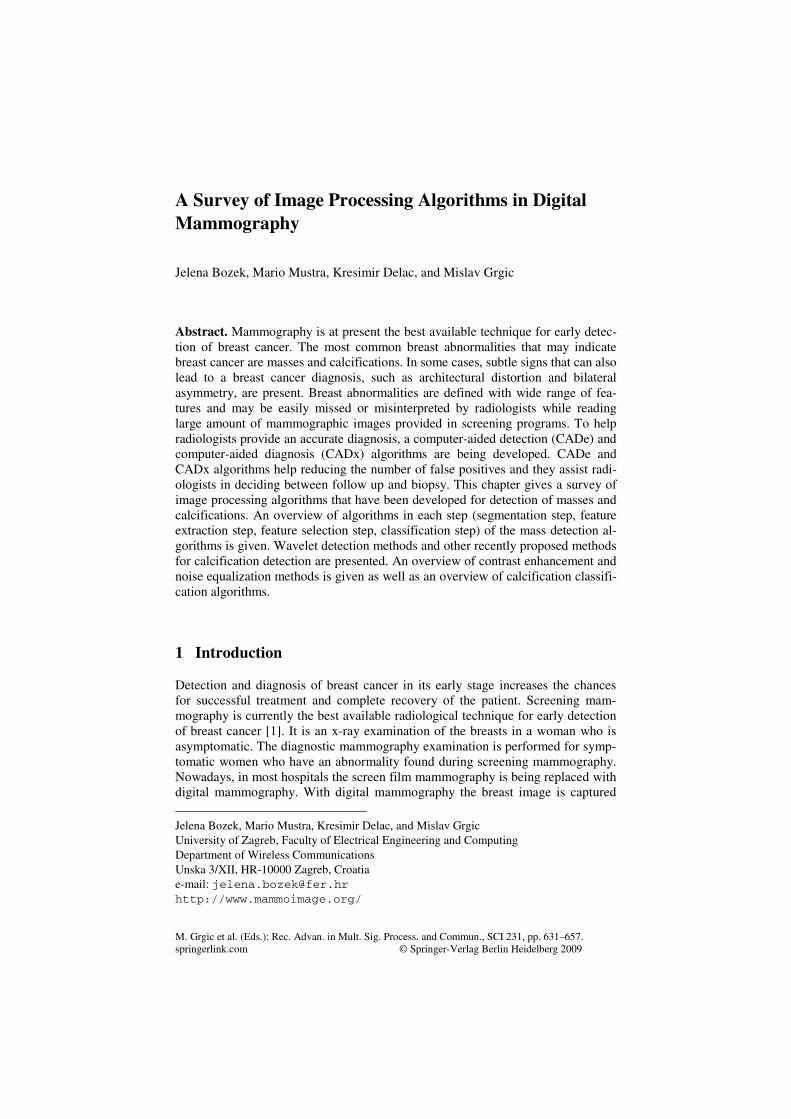
using a special electronic x-ray detector which converts the image into a digital mammogram for viewing on a computer monitor or storing. Each breast is imaged separately in craniocaudal (CC) view and mediolateral-oblique (MLO) view shown in Figure 1(a) and Figure 1(b), respectively. The American College of Ra-diology (ACR) Breast Imaging Reporting and Data System (BI-RADS) suggests a standardized method for breast imaging reporting [2]. Terms have been developed to describe breast density, lesion features and lesion classification. Screening mammography enables detection of early signs of breast cancer such as masses, calcifications, architectural distortion and bilateral asymmetry.
(a) (b)
Fig. 1 Two basic views of mammographic image: (a) craniocaudal (CC) view, (b) mediolateral-oblique (MLO) view
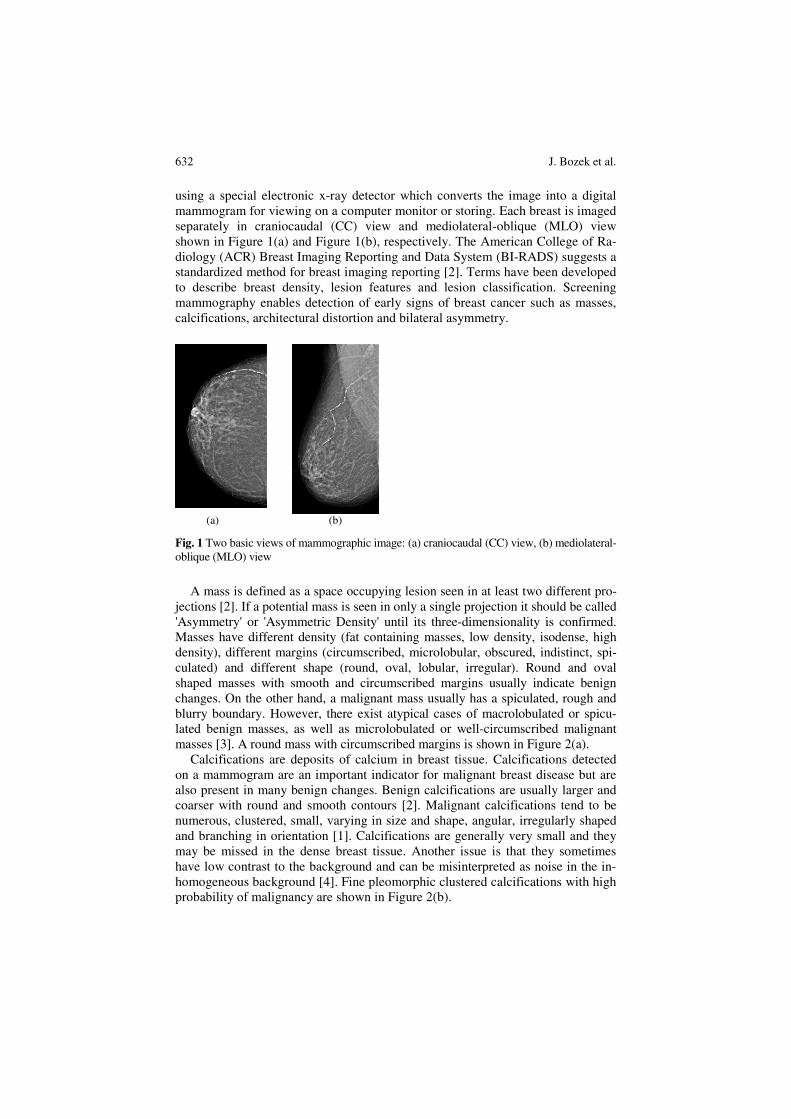
A mass is defined as a space occupying lesion seen in at least two different pro-jections [2]. If a potential mass is seen in only a single projection it should be called 'Asymmetry' or 'Asymmetric Density' until its three-dimensionality is confirmed. Masses have different density (fat containing masses, low density, isodense, high density), different margins (circumscribed, microlobular, obscured, indistinct, spi-culated) and different shape (round, oval, lobular, irregular). Round and oval shaped masses with smooth and circumscribed margins usually indicate benign changes. On the other hand, a malignant mass usually has a spiculated, rough and blurry boundary. However, there exist atypical cases of macrolobulated or spicu-lated benign masses, as well as microlobulated or well-circumscribed malignant masses [3]. A round mass with circumscribed margins is shown in Figure 2(a).
Calcifications are deposits of calcium in breast tissue. Calcifications detected on a mammogram are an important indicator for malignant breast disease but are also present in many benign changes. Benign calcifications are usually larger and coarser with round and smooth contours [2]. Malignant calcifications tend to be numerous, clustered, small, varying in size and shape, angular, irregularly shaped and branching in orientation [1]. Calcifications are generally very small and they may be missed in the dense breast tissue. Another issue is that they sometimes have low contrast to the background and can be misinterpreted as noise in the in-homogeneous background [4]. Fine pleomorphic clustered calcifications with high probability of malignancy are shown in Figure 2(b).
A Survey of Image Processing Algorithms in Digital Mammography 633
(a) (b)
Fig. 2 Examples of abnormalities: (a) round mass with circumscribed margins, (b) fine pleomorphic clustered calcifications
Architectural distortion is defined as distortion of the normal architecture with no definite mass visible, including spiculations radiating from a point and focal re-traction or distortion at the edge of the parenchyma [2]. Architectural distortion of breast tissue can indicate malignant changes especially when integrated with visi-ble lesions such as mass, asymmetry or calcifications. Architectural distortion can be classified as benign when there is a scar and soft-tissue damage due to trauma.
Asymmetry of breast parenchyma between the two sides is useful sign for de-tecting primary breast cancer. Bilateral asymmetries of concern are those that are changing or enlarging or new, those that are palpable and those that are associated with other findings, such as microcalcifications or architectural distortion [5]. If a palpable thickening or mass corresponds to an asymmetric density, the density is regarded with a greater degree of suspicion for malignancy.
As mentioned, breast lesions have a wide range of features that can indicate malignant changes, but can also be part of benign changes. They are sometimes indistinguishable from the surrounding tissue which makes the detection and diag-nose of breast cancer more difficult. Radiologist's misinterpretation of the lesion can lead to a greater number of false positive cases. 65-90% of the biopsies of suspected cancers turn out to be benign [6]. Thus, it is important to develop a sys-tem that could aid in the decision between follow-up and biopsy. The use of com-puters in processing and analyzing biomedical images allows more accurate diag-nosis by a radiologist. Humans are susceptible to committing errors and their analysis is usually subjective and qualitative. Objective and quantitative analysis facilitated by the application of computers to biomedical image analysis leads to a more accurate diagnostic decision by the physician [7]. Computer-aided detection (CADe) and computer-aided diagnosis (CADx) systems can improve the results of mammography screening programs and decrease number of false positive cases.
634 J. Bozek et al.
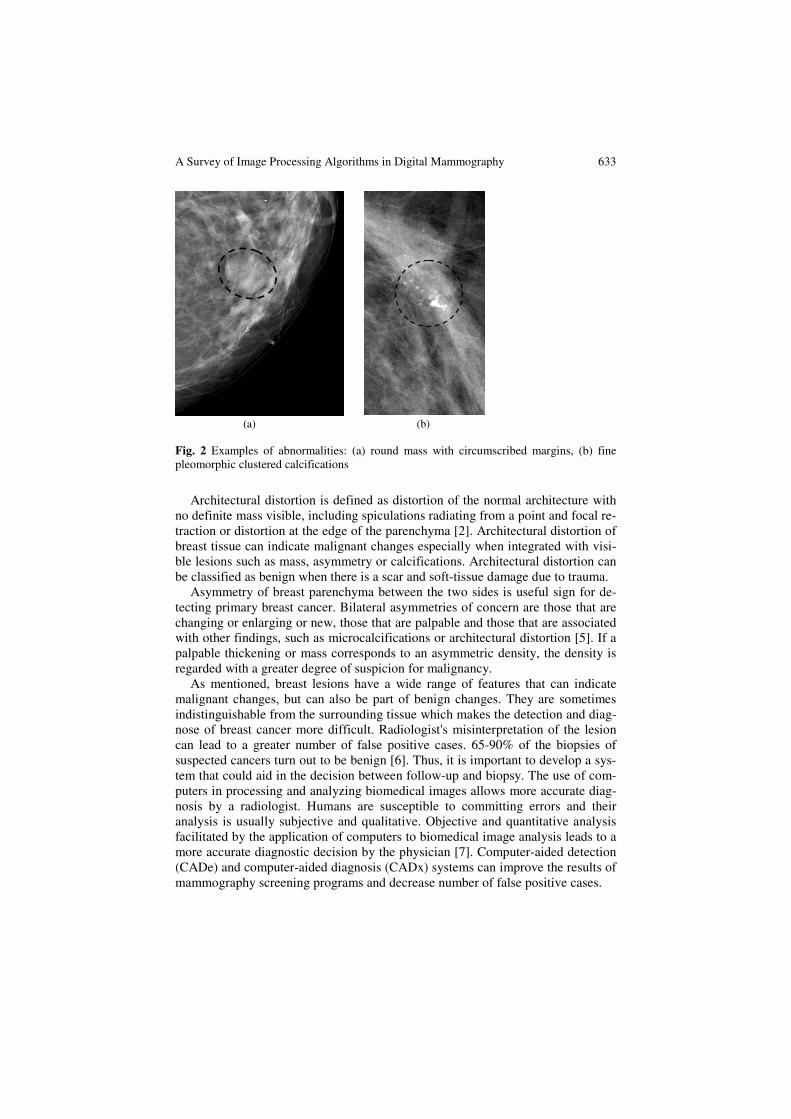
Most image processing algorithms consist of a few typical steps depicted in Figure 3. The screen film mammographic images need to be digitized prior the image processing. This is one of the advances of digital mammography where the image can be directly processed. The first step in image processing is the preproc-essing step. It has to be done on digitized images to reduce the noise and improve the quality of the image. Most digital mammographic images are high quality im-ages. Another part of the preprocessing step is removing the background area and removing the pectoral muscle from the breast area if the image is a MLO view. The segmentation step aims to find suspicious regions of interest (ROIs) contain-ing abnormalities. In the feature extraction step the features are calculated from the characteristics of the region of interest. Critical issue in algorithm design is the feature selection step where the best set of features are selected for eliminating false positives and for classifying lesion types. Feature selection is defined as se-lecting a smaller feature subset that leads to the largest value of some classifier performance function [8]. Finally, on the basis of selected features the false posi-tive reduction and lesion classification are performed in the classification step.
Fig. 3 Typical steps in image processing algorithms
Segmentation
Feature extraction
Feature selection
Classification
Preprocessing
In the case of mammographic image analysis, the results produced using a cer-
tain method can be presented in a few ways. The interpretation being mostly used is the confusion matrix (1) or just the number of true positives (TPs) and false positives (FPs). The confusion matrix consists of true negative (TN), false positive (FP), false negative (FN) and true positive (TP).
⎥⎦
⎤⎢⎣
⎡=
TPFN
FPTNC (1)
A Survey of Image Processing Algorithms in Digital Mammography 635
There are some often mentioned terms such as accuracy (2), precision (3), sen-sitivity or true positive rate (TPR) (4) and false positive rate (FPR) (5).
TPFNFPTN
TNTPaccuracy
++++= (2)
TPFP
TPprecision
+= (3)
TPFN
TPTPR
+= (4)
FPTN
FPFPR
+= (5)
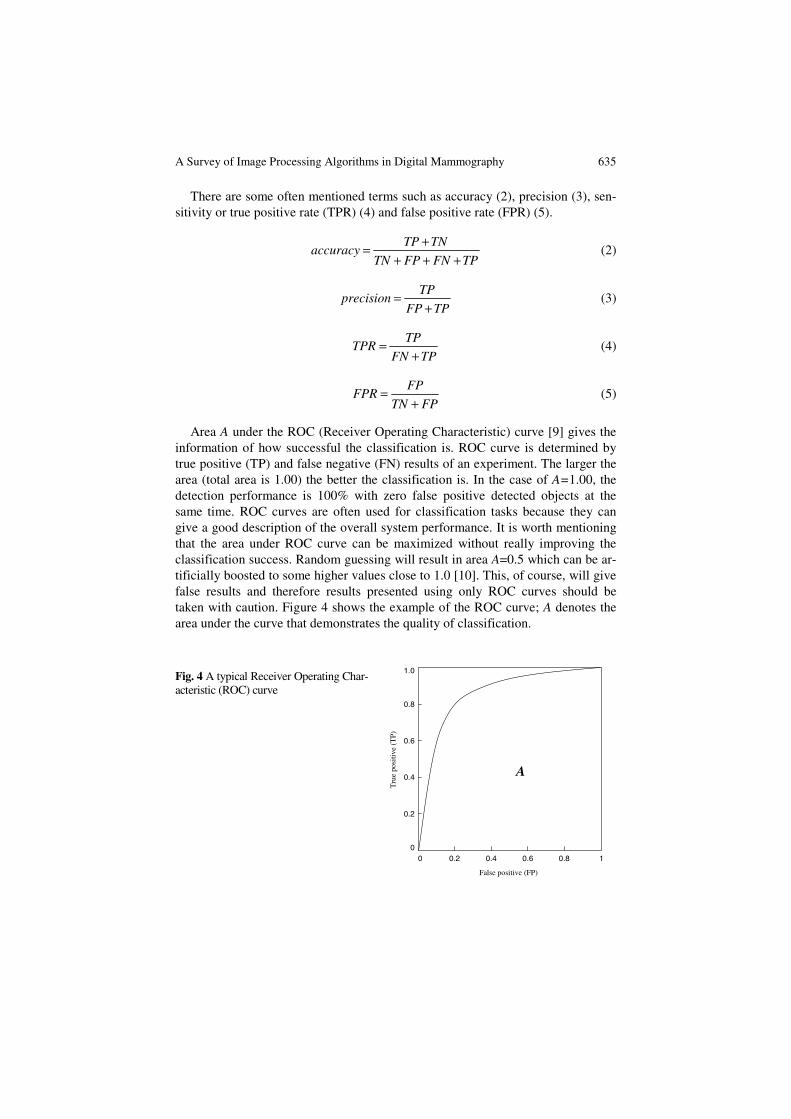
Area A under the ROC (Receiver Operating Characteristic) curve [9] gives the information of how successful the classification is. ROC curve is determined by true positive (TP) and false negative (FN) results of an experiment. The larger the area (total area is 1.00) the better the classification is. In the case of A=1.00, the detection performance is 100% with zero false positive detected objects at the same time. ROC curves are often used for classification tasks because they can give a good description of the overall system performance. It is worth mentioning that the area under ROC curve can be maximized without really improving the classification success. Random guessing will result in area A=0.5 which can be ar-tificially boosted to some higher values close to 1.0 [10]. This, of course, will give false results and therefore results presented using only ROC curves should be taken with caution. Figure 4 shows the example of the ROC curve; A denotes the area under the curve that demonstrates the quality of classification.
Fig. 4 A typical Receiver Operating Char-acteristic (ROC) curve
Tru
e po
sitiv
e (T
P)
0.6
1.0
0.8
0.4
0.2
00 0.2 0.4 0.6 0.8 1
A
False positive (FP)
636 J. Bozek et al.
In this chapter the algorithms for detection of two most common signs of breast cancer, masses and calcifications are presented. Algorithms for architectural distor-tion detection and bilateral asymmetry detection are often a part of mass detection algorithms. Thus, a detailed description of those algorithms is not given. Also, there exist algorithms specially designed for architectural distortion detection and bilateral asymmetry detection, but due to the lack of space they will be described in detail in our future survey paper. The organization of the chapter is as follows. In Section 2 some of the recent algorithms for mass detection are presented. Subsections 2.1, 2.2 and 2.3 provide overview of algorithms in segmentation step, feature extraction and selection steps and classification step, respectively. Section 3 is devoted to microcal-cification detection algorithms. Subsections 3.1 and 3.2 outline the Wavelet detection methods and other recently proposed methods. Subsection 3.3 gives an overview of contrast enhancement and noise equalization methods and subsection 3.4 gives an overview of calcification classification algorithms. Finally, Section 4 summarizes and concludes the chapter.
2 Mass Detection Algorithms
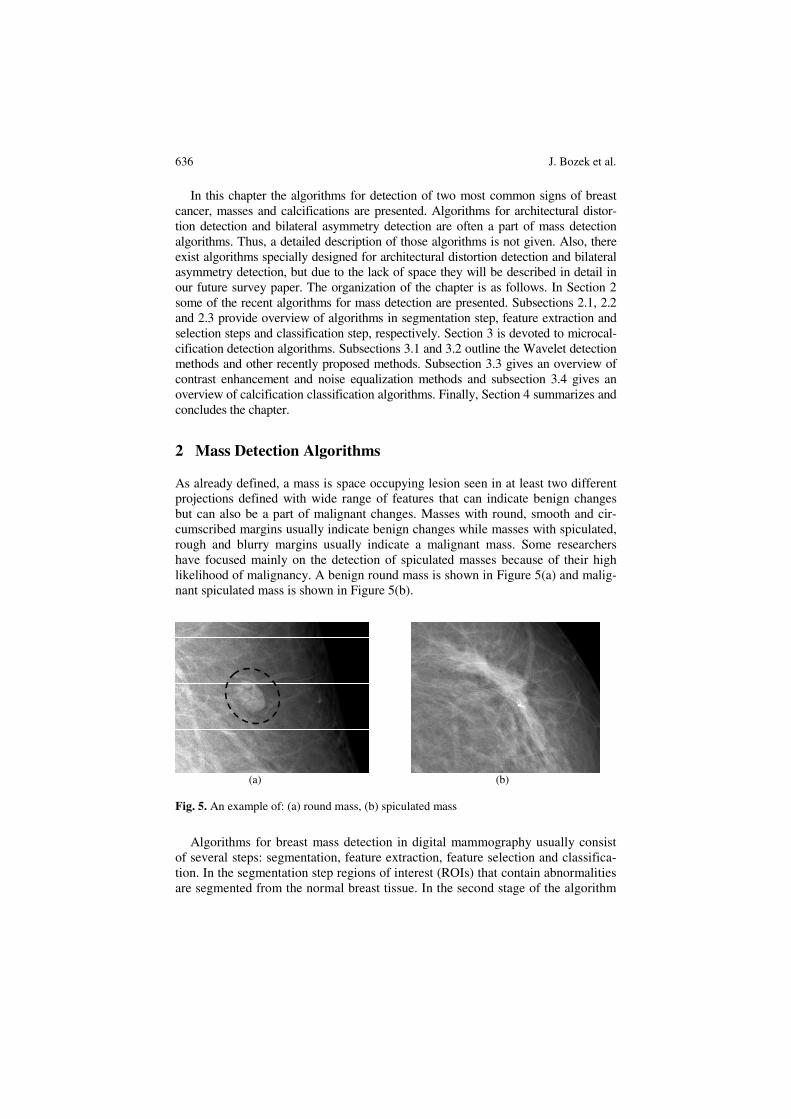
As already defined, a mass is space occupying lesion seen in at least two different projections defined with wide range of features that can indicate benign changes but can also be a part of malignant changes. Masses with round, smooth and cir-cumscribed margins usually indicate benign changes while masses with spiculated, rough and blurry margins usually indicate a malignant mass. Some researchers have focused mainly on the detection of spiculated masses because of their high likelihood of malignancy. A benign round mass is shown in Figure 5(a) and malig-nant spiculated mass is shown in Figure 5(b).
(a) (b)
Fig. 5. An example of: (a) round mass, (b) spiculated mass
Algorithms for breast mass detection in digital mammography usually consist of several steps: segmentation, feature extraction, feature selection and classifica-tion. In the segmentation step regions of interest (ROIs) that contain abnormalities are segmented from the normal breast tissue. In the second stage of the algorithm

A Survey of Image Processing Algorithms in Digital Mammography 637
each ROI is characterized with the set of features. In the feature selection step the best set of features are selected and in the classification step suspicious ROIs are classified as benign masses or malignant masses.
2.1 Segmentation
The aim of the segmentation is to extract ROIs containing all masses and locate the suspicious mass candidates from the ROI. Segmentation of the suspicious re-gions on a mammographic image is designed to have a very high sensitivity and a large number of false positives are acceptable since they are expected to be re-moved in later stage of the algorithm [4]. Researchers have used several segmen-tation techniques and their combinations.
2.1.1 Thresholding Techniques
Global thresholding [11] is one of the common techniques for image segmenta-tion. It is based on the global information, such as histogram. The fact that masses usually have greater intensity than the surrounding tissue can be used for finding global threshold value. On the histogram, the regions with an abnormality impose extra peaks while a healthy region has only a single peak [6]. After finding a threshold value the regions with abnormalities can be segmented. Global thresh-olding is not a very good method to identify ROI because masses are often super-imposed on the tissue of the same intensity level. Global thresholding has good re-sults when used as a primary step of some other segmentation techniques.
Local thresholding is slightly better than global thresholding. The threshold value is defined locally for each pixel based on the intensity values of its neighbor pixels [6]. Multiple pixels belonging to the same class (pixels at the periphery of the mass and pixels at the center of the mass) are not always homogenous and may be represented by different feature values. Li et al. [12] used local adaptive thresholding to segment mammographic image into parts belonging to same classes and an adaptive clustering to refine the results.
Matsubara et al. [13] developed an adaptive thresholding technique that uses histogram analysis to divide mammographic image into three categories based on the density of the tissue ranging from fatty to dense. ROIs containing potential masses are detected using multiple threshold values based on the category of the mammographic image.
Dominguez and Nandi [14] performed segmentation of regions via conversion of images to binary images at multiple threshold levels. For images in the study, with grey values in the range [0, 1], 30 levels with step size of 0.025 were ade-quate to segment all mammographic images.
Varela et al. [15] segmented suspicious regions using an adaptive threshold level. The images were previously enhanced with an iris filter.
Li et al. [16] used adaptive gray-level thresholding to obtain an initial segmen-tation of suspicious regions followed by a multiresolution Markov random field model-based method.
638 J. Bozek et al.
2.1.2 Region-Based Techniques
Markov random field (MRF) or Gibbs random field (GRF) is one of the segmenta-tion methods in iterative pixel classification category. MRFs/GRFs are statistical methods and powerful modeling tools [16]. Székely et al. [17] used MRF in "fine" segmentation to improve the preliminary results provided by the "coarse" segmen-tation. In "coarse" segmentation the feature vector is calculated and passed to a set of decision trees that classifies the image segment. After the "fine" segmentation they used a combination of three different segmentation methods: a modification of the radial gradient index method, the Bézier histogram method and dual binari-zation to segment a mass from the image.
Region growing and region clustering are also based on pixel classification. In region growing methods pixels are grouped into regions. A seed pixel is chosen as a starting point from which the region iteratively grows and aggregates with neighboring pixels that fulfill a certain homogeneity criterion. Zheng et al. [18] used an adaptive topographic region growth algorithm to define initial boundary contour of the mass region and then applied an active contour algorithm to modify the final mass boundary contour.
Region clustering searches the region directly without initial seed pixel [6]. Pappas [19] used a generalization of K-means clustering algorithm to separate the pixels into clusters based on their intensity and their relative location. Li et al. [12] used an adaptive clustering to refine the result attained from the localized adaptive thresholding. Sahiner et al. [20] used K-means clustering algorithm followed by object selection to detect initial mass shape within the ROI. The ROI is extracted based on the location of the biopsied mass identified by a qualified radiologist. Initial mass shape detection is followed by an active contour segmentation method to refine the boundaries of the segmented mass.
2.1.3 Edge Detection Techniques
Edge detection algorithms are based on the gray level discontinuities in the image. Basis for edge detection are gradients or derivatives that measure the rate of change in the gray level. Rangayyan [7] described standard operators for edge de-tection such as Prewitt operator, Sobel operator, Roberts operator and Laplacian of Gaussian (LoG) operator.
Fauci et al. [21] developed an edge-based segmentation algorithm that uses it-erative procedure, a ROI Hunter algorithm for selecting ROIs. ROI Hunter algo-rithm is based on the search of relative intensity maximum inside the square win-dows that form the mammographic image.
Petrick [22] used Laplacian of Gaussian filter in conjunction with density-weighted contrast enhancement (DWCE). DWCE method enhances the structures within the mammographic image to make the edge detection algorithm able to de-tect the boundaries of the objects.
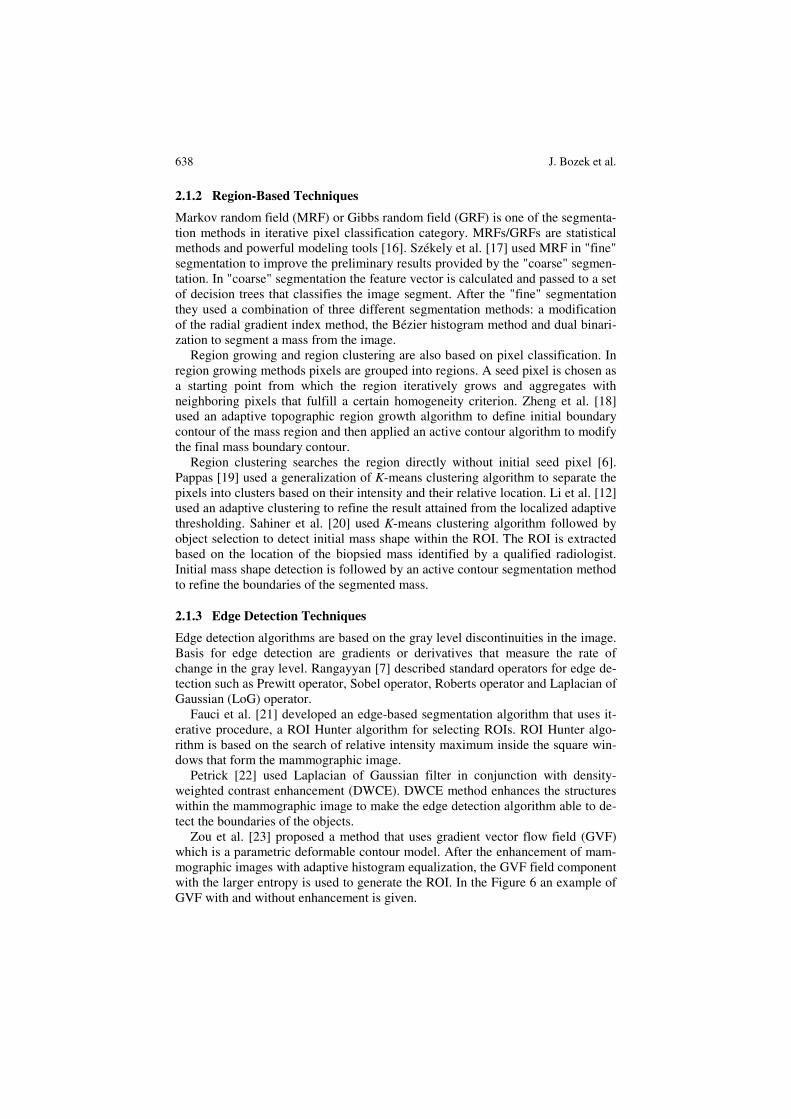
Zou et al. [23] proposed a method that uses gradient vector flow field (GVF) which is a parametric deformable contour model. After the enhancement of mam-mographic images with adaptive histogram equalization, the GVF field component with the larger entropy is used to generate the ROI. In the Figure 6 an example of GVF with and without enhancement is given.
A Survey of Image Processing Algorithms in Digital Mammography 639
(a) (b) (c) (d) (e)
Fig. 6 An example of GVF: (a) the original mammographic image, (b) the horizontal GVF component generated from (a), (c) the enhanced image through adaptive histogram equali-zation, (d) the horizontal GVF component of (c), (e) generated mass mask [23] © IEEE
Ferreira et al. [24] used active contour model (ACM) based on self-organizing network (SON) to segment the ROI. This model explores the principle of isomor-phism and self-organization to create flexible contours that characterizes the shapes in the image.
Yuan et al. [25] employed a dual-stage method to extract masses from the sur-rounding tissues. Radial gradient index (RGI) based segmentation is used to yield an initial contour close to the lesion boundary location and a region-based active contour model is utilized to evolve the contour further to the lesion boundary.
2.1.4 Hybrid Techniques
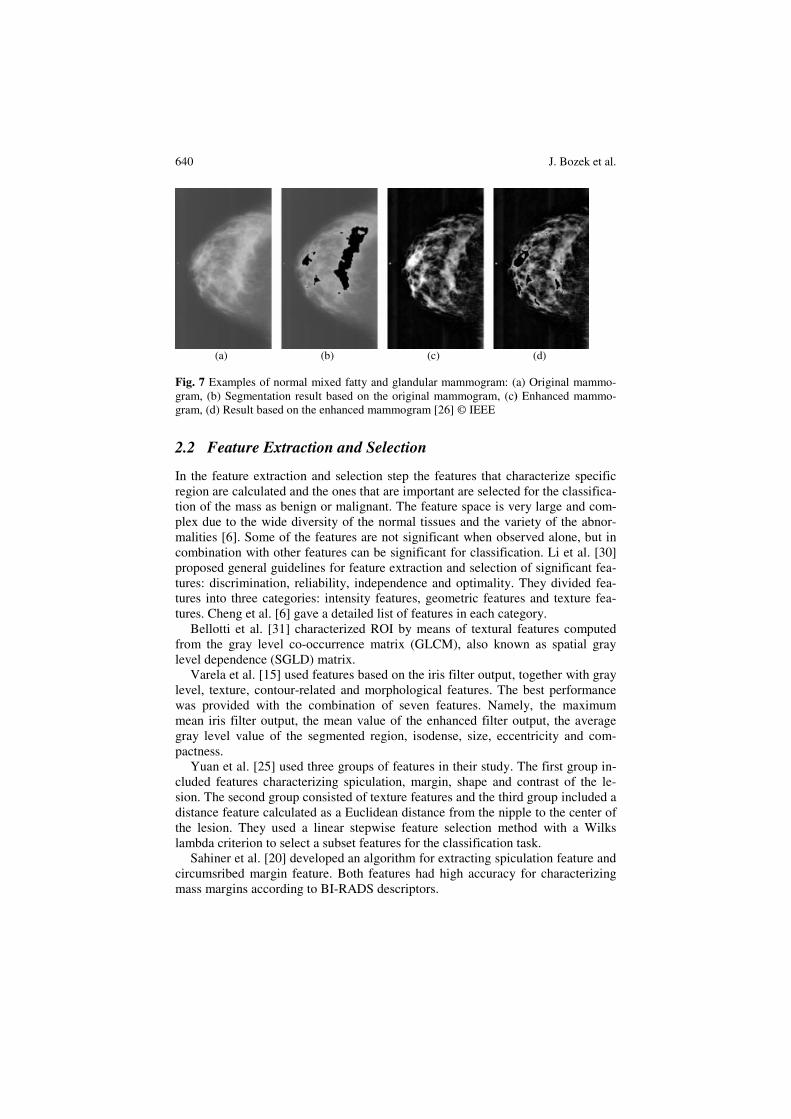
Stochastic model-based image segmentation is a technique for partitioning an im-age into distinctive meaningful regions based on the statistical properties of both gray level and context images. Li et al. [26] employed a finite generalized Gaus-sian mixture (FGGM) distribution which is a statistical method for enhanced seg-mentation and extraction of suspicious mass areas. They used FGGM distribution to model mammographic pixel images together with a model selection procedure based on the two information theoretic criteria to determine the optimal number of image regions. Finally, they applied a contextual Bayesian relaxation labeling (CBRL) technique to perform the selection of the suspected masses. The examples of the segmentation results are shown in Figure 7.
Ball and Bruce [27] segmented suspicious masses in polar domain. They used adaptive level set segmentation method (ALSSM) to adaptively adjust the border threshold at each angle in order to provide high-quality segmentation results. They extended their work in [28] where they used spiculation segmentation with level sets (SSLS) to detect and segment spiculated masses. In conjunction with level set segmentation they used Dixon and Taylor line operator (DTLO) and a generalized version of DTLO (GDTLO).
Hassanien and Ali [29] developed an algorithm for segmenting spiculated masses based on pulse coupled neural networks (PCNN) in conjunction with fuzzy set theory.
640 J. Bozek et al.
(a) (b) (c) (d)
Fig. 7 Examples of normal mixed fatty and glandular mammogram: (a) Original mammo-gram, (b) Segmentation result based on the original mammogram, (c) Enhanced mammo-gram, (d) Result based on the enhanced mammogram [26] © IEEE
2.2 Feature Extraction and Selection
In the feature extraction and selection step the features that characterize specific region are calculated and the ones that are important are selected for the classifica-tion of the mass as benign or malignant. The feature space is very large and com-plex due to the wide diversity of the normal tissues and the variety of the abnor-malities [6]. Some of the features are not significant when observed alone, but in combination with other features can be significant for classification. Li et al. [30] proposed general guidelines for feature extraction and selection of significant fea-tures: discrimination, reliability, independence and optimality. They divided fea-tures into three categories: intensity features, geometric features and texture fea-tures. Cheng et al. [6] gave a detailed list of features in each category.
Bellotti et al. [31] characterized ROI by means of textural features computed from the gray level co-occurrence matrix (GLCM), also known as spatial gray level dependence (SGLD) matrix.
Varela et al. [15] used features based on the iris filter output, together with gray level, texture, contour-related and morphological features. The best performance was provided with the combination of seven features. Namely, the maximum mean iris filter output, the mean value of the enhanced filter output, the average gray level value of the segmented region, isodense, size, eccentricity and com-pactness.
Yuan et al. [25] used three groups of features in their study. The first group in-cluded features characterizing spiculation, margin, shape and contrast of the le-sion. The second group consisted of texture features and the third group included a distance feature calculated as a Euclidean distance from the nipple to the center of the lesion. They used a linear stepwise feature selection method with a Wilks lambda criterion to select a subset features for the classification task.
Sahiner et al. [20] developed an algorithm for extracting spiculation feature and circumsribed margin feature. Both features had high accuracy for characterizing mass margins according to BI-RADS descriptors.
A Survey of Image Processing Algorithms in Digital Mammography 641
Ball and Bruce [28] used features that include patient's age, morphological fea-tures, statistical features and features based on the segmentation boundary and the rubber band straightening transform.
Timp and Karssemeijer [32] proposed temporal feature set consisted of com-plete set of single view features together with temporal features. They extracted 38 single view features and grouped them into 12 main categories according to the type of characteristic they represent. The features from the current mammographic image are combined with the features calculated from the corresponding region in mammographic image taken in previous exam to provide temporal information. Temporal features are obtained by subtracting prior from current feature values which resulted in 29 temporal features. To select a best subset from the temporal feature set the sequential forward floating selection (SFFS) is used. In their later work, Timp et al. [33] designed two kinds of temporal features: difference features and similarity features. Difference features measured changes in feature values be-tween corresponding regions in the prior and the current view. Similarity features measured whether two regions are comparable in appearance.
Fauci et al. [21] extracted 12 features from segmented masses. Some features gave the geometrical information, others provided shape parameters. The criterion for feature selection was based on morphological differences between pathological and healthy regions.
Rangayyan et al. [34] proposed methods to obtain shape features from the turn-ing angle functions of contours. Features are useful in the analysis of contours of breast masses and tumors because of their ability to capture diagnostically impor-tant details of shape related to spicules and lobulations.
Li et al. [26] applied a contextual Bayesian relaxation labeling (CBRL) tech-nique to perform the selection of suspected masses. The large improvement in classification was obtained after several iterations of CBRL algorithm.
Nandi et al. [35] used five stand-alone feature selection algorithms: Kullback-Leibler divergence (KLD), Kolmogorov-Smirnov test (K-S test), Students t test (t test), sequential forward selection (SFS) and sequential backward selection (SBS) to narrow the pool of features for classification step. They concluded that the shape measure of fractional concavity was the most important feature for the classifier.
Hupse and Karssemeijer [36] compared two feature selection criterions: Wilks lambda and the mean sensitivity of the FROC (free response operating characteris-tic) curve, both criterions with and without feature normalization. The feature se-lection method that performed best was the method in which Wilks lambda was used as selection criterion in combination with the use of normalized features.
Kim and Yoon [37] evaluated recursive feature elimination-based support vector machines (SVM-RFE) to improve classification accuracy. SVM-RFE incorporates feature selection in a recursive elimination manner to obtain a ranking of features that are particularly meaningful to SVMs and the top ranked features are chosen for classification. SVM-RFE has revealed that using only a subset of the 22 BI-RADS and gray level features facilitated increased CAD accuracy compared to using all 22 features.
642 J. Bozek et al.
2.3 Feature Classification
In feature classification step masses are classified as benign or malignant using the selected features. Various methods have been used for mass classifications. Some of the most popular techniques are artificial neural networks and linear discrimi-nant analysis.
Varela et al. [15] merged the feature set into a backpropagation neural network (BNN) classifier to reduce the number of false positives. Their results yielded a sensitivity of 88% at an approximate false positive rate per image of 1 when con-sidering lesion-based evaluation and sensitivity of 94% at 1.02 false positive find-ings per image when considering case-based evaluation.
Li et al. [38] merged the selected features using a Bayesian artificial neural network (BANN) classifier to generate an estimate of the probability of malig-nancy. The merged features showed a statistically significant improvement as compared to the individual features in the task of distinguishing between benign and malignant masses. The performance of the method yielded an A value under the ROC curve of 0.83 with a standard error of 0.02.
Fauci et al. [21] performed classification by means of an artificial neural net-work (ANN) with 12 input neurons, a number of hidden neurons which is tuned to obtain the best classification performance and one output neuron. The output neu-ron provides the probability that the ROI is pathological. Their adopted neural network was a feed-forward back-propagation supervised network trained with gradient descent learning rule with momentum. Momentum represents a sort of in-ertia which is added to quickly move along the direction of decreasing gradient, thus avoiding oscillations around secondary minima. Their results (A=0.85 with standard error of 0.08) were comparable with the performance obtained by com-mercial CAD [39].
Ball and Bruce [28] analyzed feature vector using generalized discriminant analysis (GDA) to provide a non-linear classification and to classify masses as spiculated or not. The features extracted from spiculated masses are classified as benign or malignant using k nearest neighbor (k-NN) and maximum likelihood (ML) classifiers. They showed that the k-NN classifier outperformed the ML clas-sifier slightly in terms of higher overall accuracy and fewer numbers of false nega-tives. Using 1-NN or 2-NN classifier they achieved 93% overall accuracy with three FP and one FN. Using ML classifier they achieved 92% overall accuracy with three FP and two FN.
Nandi et al. [35] introduced genetic programming and adapted it for classifica-tion of masses. The genetic programming classifier performed well in discriminat-ing between benign and malignant masses with accuracies above 99.5% for train-ing and typically above 98% for testing.
Mu et al. [40] proposed a 2-plane learning method for binary classification, named as the strict 2-surface proximal (S2SP) classifier. They proposed the S2SP classifier for both linear and nonlinear pattern classification. The S2SP classifier improved the accuracy of discriminating between benign and malignant masses based on features that provided weak performance using classical pattern recogni-tion methods. The linear classification yielded performance of A=0.97 and in the case of nonlinear classification the performance of A=1.0.
A Survey of Image Processing Algorithms in Digital Mammography 643
Li et al. [16] used fuzzy binary decision tree (FBDT) based on a series of ra-diographic, density-related features. They classified ROIs as normal or suspicious. Their results indicate that their approach might be particularly accurate and effec-tive for small tumors (≤10 mm in size) which are not palpable or easily distin-guishable in mammographic images. Their algorithm achieved 90% sensitivity with two false positives per image.
Krishnapuram et al. [41] proposed a multiple-instance learning (MIL) algo-rithm that automatically selects a small set of diagnostically useful features. The algorithm is more accurate than the support vector machine classifier.
For improving classification performance the classifier ensembles can be used. The classification decision is initially made by several separate classifiers and then combined into one final assessment. West et al. [42] investigated the effect of classifier diversity (the number of different classifiers in ensemble) on the gener-alization accuracy of the ensemble. Their results demonstrated that most of the improvement occurred with ensembles formed from 3-5 different classifiers. The most effective ensembles formed in their research resulted from a small and selec-tive subset of the population of available classifiers, with potential candidates identified by jointly considering the properties of classifier generalization error, classifier instability and the independence of classifier decisions relative to other ensemble members.
3 Microcalcification Detection Algorithms
Calcifications are calcium deposits inside the breast. They can be roughly divided in two major groups: macrocalcification and microcalcifications. Macrocalcifica-tions are, as expected, large calcium deposits, while microcalcifications are tiny calcium deposits. Macrocalcifications are usually not linked with the development of breast cancer and that is the reason why no special attention is being devoted to them. On the other hand, detection of microcalcifications is very important for the early breast cancer detection. Microcalcifications are usually associated with extra cell activity in the breast tissue. The extra cell activity does not have to be cancer-ous and it usually is not, but if microcalcifications are grouped in clusters, that can be a sign of developing malignant tumor. Scattered microcalcifications are usually a part of benign breast tissue. In mammograms calcifications are seen as bright dots of different sizes. The exact position of microcalcifications can not be predicted, as well as their number. Microcalcifications can be grouped in clusters, but also more often they are found to be stand-alone. Detection of microcalcifications is a very challenging task for radiologists as well as for computer-aided detection software. Development of the information technology and computers influenced mammogra-phy by giving the possibility of producing high quality digitized images with good resolution. Good spatial resolution is very important for microcalcification detec-tion because of their actual size that can be as small as 100 μm. In digital mammog-raphy which is being mostly used today, displays with high resolution are necessary for delivering sharper images richer with details to radiologists.
CADe software tries to make diagnosis process easier and almost automati-cally. In mammography applications, one of the most important tasks for CADe is

644 J. Bozek et al.
to detect the presence of microcalcifications, especially clustered ones, because they can be the early sign of possible cancer. Since microcalcifications are small and randomly scattered in breast tissue it is possible for a radiologist to overlook them. In that case CADe software should give good results by producing less false negative (FN) results. There also lays the biggest problem of CADe software, be-cause radiologists could possibly overlook some microcalcifications trusting the software detection accuracy too much, which would again give the false negative results. The general microcalcification detection process is shown in Figure 8. Af-ter the image enhancement, region of interest (ROI) should be detected. Feature extraction and selection are the next two steps. Finally, the decision algorithm based on selected features provides detection.
Image enhancement
ROI detection
Feature extraction
Feature selection Detection
Fig. 8 The general microcalcification detection algorithm
During the past two decades, many methods for microcalcification detection have been presented. In this chapter only few commonly used methods published in recent papers will be described. Methods that will be presented combine the use of wavelet analysis, contrast enhancement, noise equalization, higher order statis-tics and classifications for benign and malignant differentiation.
3.1 Wavelet Detection Methods
Many of the recently presented methods for microcalcification detection use wavelet-based algorithms [43-50]. The beginning of wavelet method usage for microcalcification detection was in late 1990s. Wavelet-based subband image de-composition is used to detect and isolate clusters of microcalcifications from the surrounding tissue. Since microcalcifications are rather small objects, they corre-spond to the high-frequency components. Standard dyadic wavelet decomposition filters the original image to the desired level producing sub-images. Sub-images can contain combinations of lowpass and highpass filter components. Next step is to determine which of these new sub-images contains the best results. After sup-pressing low-frequency components using wavelet decomposition filters of the desired level, the image is reconstructed and the process of microcalcification de-tection can begin. This is the generalized approach used in most wavelet-based methods. Differences between them lay in different decomposition and detection process but also in the most important step and that is the reduction of many false positive results. FP results can occur very often in microcalcification detection be-cause detection threshold should be set rather sensitive in order to detect as many high-frequency objects as possible since microcalcifications can be scattered in the breast tissue.
Wavelet transform is used to construct time-frequency representation of a cer-tain dataset. Fourier transform gives only frequency content but can not localize objects of certain frequency in the image. Wavelet transform is therefore superior
A Survey of Image Processing Algorithms in Digital Mammography 645
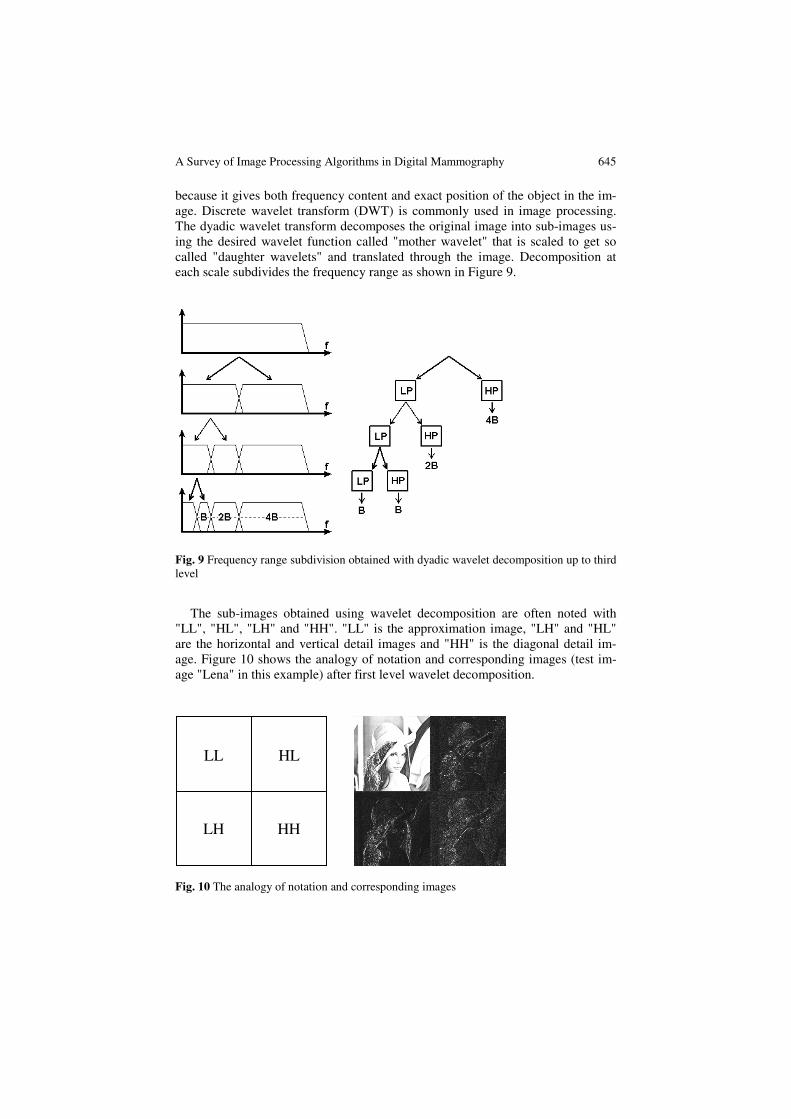
because it gives both frequency content and exact position of the object in the im-age. Discrete wavelet transform (DWT) is commonly used in image processing. The dyadic wavelet transform decomposes the original image into sub-images us-ing the desired wavelet function called "mother wavelet" that is scaled to get so called "daughter wavelets" and translated through the image. Decomposition at each scale subdivides the frequency range as shown in Figure 9.
Fig. 9 Frequency range subdivision obtained with dyadic wavelet decomposition up to third level
The sub-images obtained using wavelet decomposition are often noted with "LL", "HL", "LH" and "HH". "LL" is the approximation image, "LH" and "HL" are the horizontal and vertical detail images and "HH" is the diagonal detail im-age. Figure 10 shows the analogy of notation and corresponding images (test im-age "Lena" in this example) after first level wavelet decomposition.
LL HL
LH HH
Fig. 10 The analogy of notation and corresponding images
646 J. Bozek et al.
In 1996 Strickland and Hahn [43] presented the two-stage method based on wavelet transform for detecting and segmenting calcifications. They have used HH and the combination of LH+HL sub-bands in the detection process. Detected pixel in HH and LH+HL are dilated and then weighted before proceeding with the inverse wavelet transform. By this, individual microcalcifications are greatly en-hanced in the output image. After that the straightforward thresholding can be ap-plied to segment microcalcifications.
In 1998 Wang and Karayiannis [44] proposed a very similar method that uses wavelet decomposition in order to suppress low-frequency components. These components are suppressed by reconstructing the image from HH, LH and HL sub-bands making high-frequency objects distinct from the background. The pro-posed method uses Daubechies wavelets; one is “DAUB 4” with only 4 coeffi-cients and the second is “DAUB 20” with 20 coefficients. Shorter ("DAUB 4") wavelet filters produced more high frequency results as the output with more false positives than longer ones ("DAUB 20").
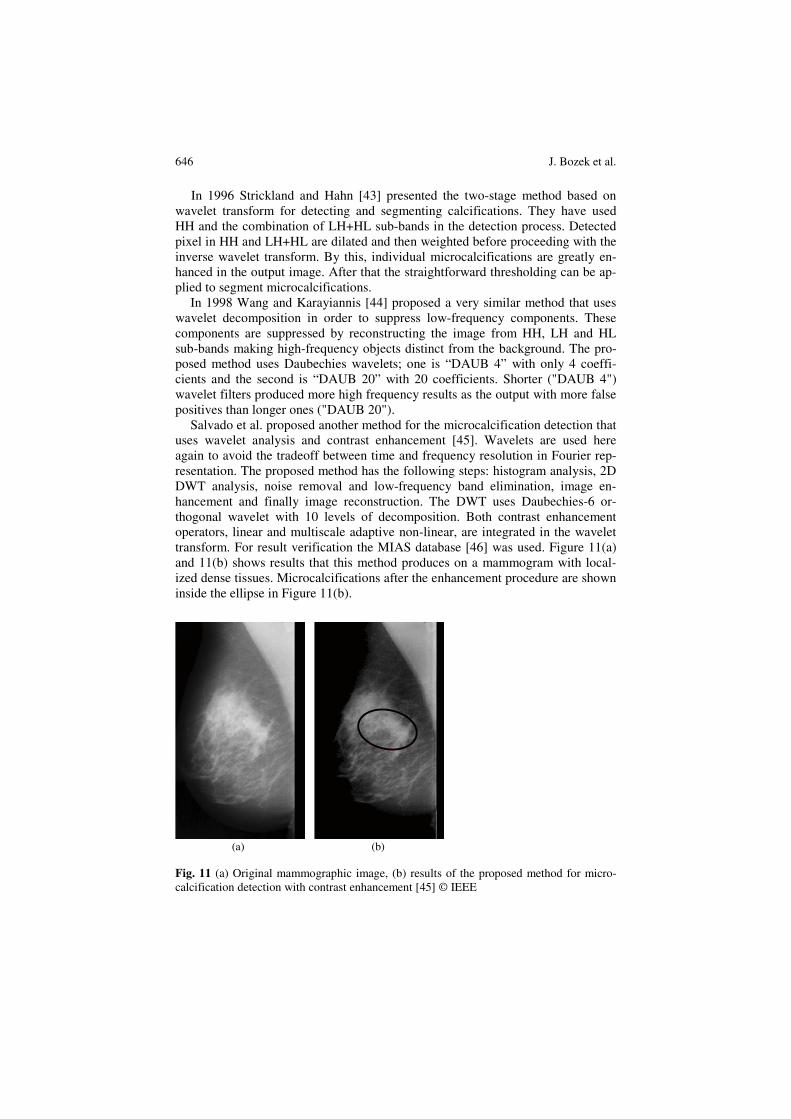
Salvado et al. proposed another method for the microcalcification detection that uses wavelet analysis and contrast enhancement [45]. Wavelets are used here again to avoid the tradeoff between time and frequency resolution in Fourier rep-resentation. The proposed method has the following steps: histogram analysis, 2D DWT analysis, noise removal and low-frequency band elimination, image en-hancement and finally image reconstruction. The DWT uses Daubechies-6 or-thogonal wavelet with 10 levels of decomposition. Both contrast enhancement operators, linear and multiscale adaptive non-linear, are integrated in the wavelet transform. For result verification the MIAS database [46] was used. Figure 11(a) and 11(b) shows results that this method produces on a mammogram with local-ized dense tissues. Microcalcifications after the enhancement procedure are shown inside the ellipse in Figure 11(b).
(a) (b)
Fig. 11 (a) Original mammographic image, (b) results of the proposed method for micro-calcification detection with contrast enhancement [45] © IEEE

A Survey of Image Processing Algorithms in Digital Mammography 647
The computerized scheme for detection of the microcalcifications clusters in mammographic images using wavelets is presented in [47]. The proposed detec-tion algorithm consists of four steps: creation of negative image, decomposition of the negative image using wavelet transform, creating a binary image of approxi-mation coefficients and pre-detecting microcalcifications and finally, identifying clusters of pixels after applying the threshold. Each image has been decomposed using the Daubechies Wavelets (db2, db4, db8 and db16). The detection accuracy is claimed to be up to 80%.
The method that combines the use of wavelet transform and morphology is pre-sented in [48]. The results of both morphology and wavelet transform are com-bined using the logical AND operation. This approach gives lower true positive rate (TPR) but at the same time less false positives (FPs). Results obtained using MIAS database gave TPR of 80.2% with 2.5 false microcalcifications per region of interest.
Wavelets can also be used for enhancement of microcalcifications in mammo-grams [49]. For image enhancement, this method proposes 3 steps. First step is computing an adapted multiresolution decomposition of the image into wavelet coefficients using integrated wavelet transform. Second step is applying a local enhancement operator E on the calculated wavelet coefficients. The final step is image reconstruction. In this method, microcalcifications are approximated by a Gaussian form. Enhancement is done on the discrete decompositions, called inte-grated wavelets. Figure 12(a) shows original image and Figure 12(b) shows results of microcalcifications enhancement obtained using the proposed method. The method is tested on the image set provided by Department of Radiology at the University of Nijmegen, the Netherlands.
Fig. 12 (a) Original image, (b) results of microcalcifica-tion enhancement [49] © IEEE
(a) (b)
Another method for image enhancement and denoising that uses wavelets has
been presented in [50]. Enhancement of microcalcifications and suspicious masses is done using adaptive gain algorithm and fine noise estimation. The adaptive gain is calculated at each scale to adequately enhance coefficients at each level of de-composition. For image denoising, a wavelet shrinkage denoising algorithm with adaptive threshold setting is applied. The proposed method is tested on DDSM database.
648 J. Bozek et al.
3.2 Other Recently Proposed Methods
Besides the use of wavelets contrast enhancement methods with noise estimation, other approaches have also been used to detect microcalcifications. Sankar and Thomas proposed the method that uses fractal modeling of mammograms based on mean and variance to detect microcalcifications [51]. This method was tested on 28 mammograms from the MIAS database and produced the following results: TPR=82% with an average of 0.214 negative clusters per image.
The semiautomatic segmentation method [52] allows some interaction of the ra-diologist. For the detection of microcalcification this method also uses Daubechies 6 wavelets as a central component of the system. Detected components that have a higher or lower spatial frequency than the spatial frequency of calcifications are ze-roed. The result is band pass filtered version of the input image. Segmentation of calcifications can be done by applying a threshold on the filtered image. Instead of that approach, this method proposes an interactive segmentation stage done by the radiologist. The results of the fully automatic and the semiautomatic segmentation on images from the DDSM base [53] are evaluated using areas under the ROC curve. The fully automatic segmentation gave results of A=0.80 while the semiau-tomatic gave significantly higher results of A=0.84.
Another microcalcification detection method [54] presented in 2007 uses a dif-ferent approach. The first stage of the process is extraction of zones that poten-tially correspond to microcalcifications by analyzing the distribution of brightness over the mammogram. The second stage is identification of clusters as ROIs. The final stage is retrieving the information that might have been lost in the previous stages. The method is tested using DDSM database.
Detection of microcalcification by meta-heuristic algorithms was proposed by Thangavel and Karnan [55]. This method uses the meta-heuristic methods such as Ant Colony Optimization (ACO) and Genetic Algorithm (GA) for identification of suspicious regions in mammograms. The method relies on the property of bilateral asymmetry. If the structural asymmetries between the left and the right breast are stronger, possibilities for microcalcifications are higher. Bilateral subtraction is used to determine the structural asymmetry. In the first step mammogram images are enhanced using median filter, pectoral muscle region is removed and breast border is detected. GA is then applied to enhance the detected border. The next step is image alignment using the border points and nipple position. After that im-ages are subtracted to extract the suspicious region. The algorithms are tested on the entire MIAS database (322 mammograms which equals to 161 pairs). Results are presented using FROC (Free-Response Receiver Operating Characteristics) curve. The authors claim this method achieves the area under the curve A=0.94 for the proposed algorithm, which are very good results for a fully automatic method.
3.3 Contrast Enhancement and Noise Equalization
Contrast enhancement is of very high importance in x-ray imaging. It helps in mak-ing diagnosis more accurate. Contrast enhancement can be done globally and lo-cally. Global contrast enhancement uses transforming function which can be shown
A Survey of Image Processing Algorithms in Digital Mammography 649
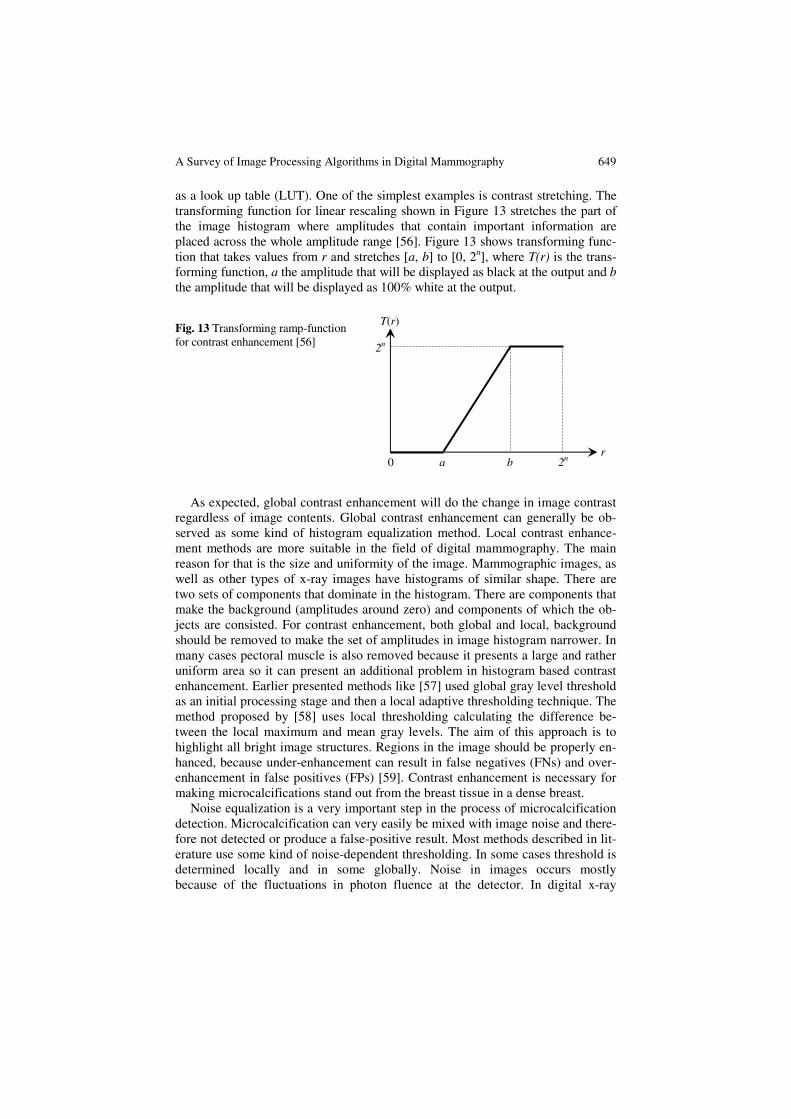
as a look up table (LUT). One of the simplest examples is contrast stretching. The transforming function for linear rescaling shown in Figure 13 stretches the part of the image histogram where amplitudes that contain important information are placed across the whole amplitude range [56]. Figure 13 shows transforming func-tion that takes values from r and stretches [a, b] to [0, 2n], where T(r) is the trans-forming function, a the amplitude that will be displayed as black at the output and b the amplitude that will be displayed as 100% white at the output.
Fig. 13 Transforming ramp-function for contrast enhancement [56]
T(r)
r 0 a b 2n
2n
As expected, global contrast enhancement will do the change in image contrast
regardless of image contents. Global contrast enhancement can generally be ob-served as some kind of histogram equalization method. Local contrast enhance-ment methods are more suitable in the field of digital mammography. The main reason for that is the size and uniformity of the image. Mammographic images, as well as other types of x-ray images have histograms of similar shape. There are two sets of components that dominate in the histogram. There are components that make the background (amplitudes around zero) and components of which the ob-jects are consisted. For contrast enhancement, both global and local, background should be removed to make the set of amplitudes in image histogram narrower. In many cases pectoral muscle is also removed because it presents a large and rather uniform area so it can present an additional problem in histogram based contrast enhancement. Earlier presented methods like [57] used global gray level threshold as an initial processing stage and then a local adaptive thresholding technique. The method proposed by [58] uses local thresholding calculating the difference be-tween the local maximum and mean gray levels. The aim of this approach is to highlight all bright image structures. Regions in the image should be properly en-hanced, because under-enhancement can result in false negatives (FNs) and over-enhancement in false positives (FPs) [59]. Contrast enhancement is necessary for making microcalcifications stand out from the breast tissue in a dense breast.
Noise equalization is a very important step in the process of microcalcification detection. Microcalcification can very easily be mixed with image noise and there-fore not detected or produce a false-positive result. Most methods described in lit-erature use some kind of noise-dependent thresholding. In some cases threshold is determined locally and in some globally. Noise in images occurs mostly because of the fluctuations in photon fluence at the detector. In digital x-ray
650 J. Bozek et al.
images in general, quantum noise is dominant. Pixel values in digital mammogra-phy are linearly proportional to the amount of detected photons. Due to the detec-tor inhomogeneity, the anode heel effect and other sources of variation, noise properties vary across the image. Because of that, noise across the image can not be modeled with the fixed constant. Modeling with the fixed constant would lead to over- or underestimated image noise and could produce more FP or FN results. Nonuniform noise model proposed by G. van Schie and N. Karssemeijer takes the properties of noise variation into account. This method is based on subdividing a mammogram into square tiles of adaptive width and finding a square root noise model per tile [60].
3.4 Classification of Microcalcifications
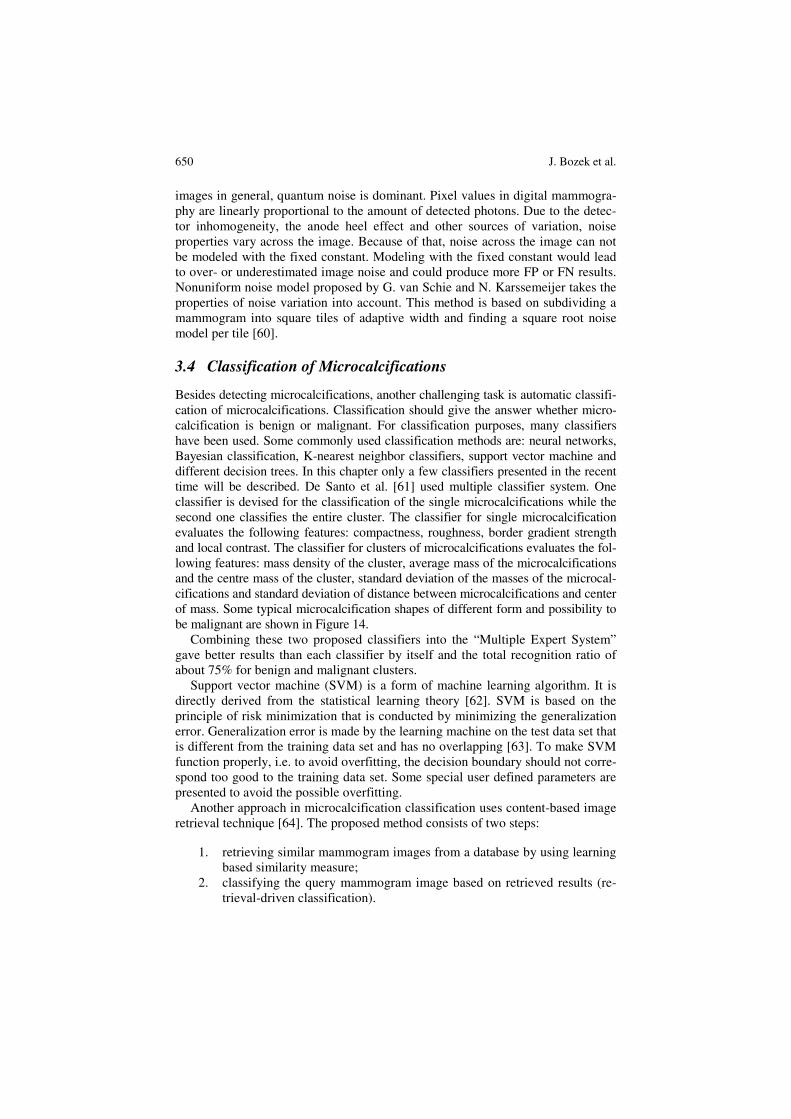
Besides detecting microcalcifications, another challenging task is automatic classifi-cation of microcalcifications. Classification should give the answer whether micro-calcification is benign or malignant. For classification purposes, many classifiers have been used. Some commonly used classification methods are: neural networks, Bayesian classification, K-nearest neighbor classifiers, support vector machine and different decision trees. In this chapter only a few classifiers presented in the recent time will be described. De Santo et al. [61] used multiple classifier system. One classifier is devised for the classification of the single microcalcifications while the second one classifies the entire cluster. The classifier for single microcalcification evaluates the following features: compactness, roughness, border gradient strength and local contrast. The classifier for clusters of microcalcifications evaluates the fol-lowing features: mass density of the cluster, average mass of the microcalcifications and the centre mass of the cluster, standard deviation of the masses of the microcal-cifications and standard deviation of distance between microcalcifications and center of mass. Some typical microcalcification shapes of different form and possibility to be malignant are shown in Figure 14.
Combining these two proposed classifiers into the “Multiple Expert System” gave better results than each classifier by itself and the total recognition ratio of about 75% for benign and malignant clusters.
Support vector machine (SVM) is a form of machine learning algorithm. It is directly derived from the statistical learning theory [62]. SVM is based on the principle of risk minimization that is conducted by minimizing the generalization error. Generalization error is made by the learning machine on the test data set that is different from the training data set and has no overlapping [63]. To make SVM function properly, i.e. to avoid overfitting, the decision boundary should not corre-spond too good to the training data set. Some special user defined parameters are presented to avoid the possible overfitting.
Another approach in microcalcification classification uses content-based image retrieval technique [64]. The proposed method consists of two steps:
1. retrieving similar mammogram images from a database by using learning
based similarity measure; 2. classifying the query mammogram image based on retrieved results (re-
trieval-driven classification).
A Survey of Image Processing Algorithms in Digital Mammography 651
(a) (b) (c)
(d) (e)
Fig. 14 Some typical microcalcification shapes (adapted from [61]): (a) rings-always be-nign, (b) circular, with various sizes, smooth border-frequently benign, (c) pulverulent-sometimes malignant, (d) granule-like, with various sizes and shapes, irregular border-malignant almost always, (e) vermicular-typically malignant © Elsevier B.V.
Similar cases are being used to improve a numerical classifier’s performance and adaptive support vector machine is being used to improve classification per-formance. Experimental setup to test this method used 600 image pairs that have been scored in a human observer study for training the similarity function. 200 mammograms were then used as test samples. Results representation has been done using ROC curves. Content based image-retrieval technique gave the follow-ing results: A=0.7752 using SVM and A=0.8223 using adaptive SVM.
A different approach in microcalcification classification was presented by Had-jiiski et al. [65]. Their work is based on development of CAD systems for assisting radiologists in classification of breast lesions. After detection and segmentation of microcalcification, the classification has been done using 5 morphological features that describe size, density and shape. The presented method gave results of A=0.77 for 117 two-view pairs what seems to be slightly better than the expert radiologist classification.
A new particle swarm optimization algorithm for feature selection has also been recently presented [66]. For the segmentation of microcalcification from the enhanced mammographic image the New Particle Swarm Optimization (NPSO) algorithm hybrid with Markov Random Field (MRF) is being used. Classification is being done using a three-layer Backpropagation Network hybrid with NPSO (BPN-NPSO). Performance of the algorithm was evaluated also using the ROC analysis like the two methods previously described. The results show that the NPSO algorithm selects features better than Genetic Algorithm.
652 J. Bozek et al.
In the process of microcalcification detection, wavelet based methods are being mostly used. Proposed methods work more or less in the same way and give ac-ceptable results. Microcalcifications are very small objects and to detect them it is necessary to extract high frequency components. Wavelet transform, as mentioned before, also gives the spatial information of the detected object and that is the main reason why it is so successful in this area. Also there have been proposed some other methods for microcalcification detection but their number is signifi-cantly smaller. Those other methods presented in this chapter are contrast based, one that uses particle swarm optimization, noise estimation and some that use combination of two or more approaches. Automatic classification is another issue that needs to be solved. There have been some different approaches using different classifiers. The future is to show if it is possible to obtain areas under ROC curve greater than 0.8.
4 Conclusion
Breast cancer is one of the major causes of death among women. Digital mam-mography screening programs can enable early detection and diagnose of the breast cancer which reduces the mortality and increases the chances of complete recovery. Screening programs produce a great amount of mammographic images which have to be interpreted by radiologists. Due to the wide range of breast ab-normalities' features some abnormalities may be missed or misinterpreted. There is also a number of false positive findings and therefore a lot of unnecessary biop-sies. Computer-aided detection and diagnosis algorithms have been developed to help radiologists give an accurate diagnosis and to reduce the number of false positives. There are a lot of algorithms developed for detection of masses and cal-cifications. In this chapter, algorithms that are commonly used and the ones re-cently developed were presented. Over the years there has been an improvement in the detection algorithms but their performance is still not perfect. The area un-der the ROC curve is rarely above 90% which means that there are still many false positive outputs. Possible reason for such a performance may be the characteristics of breast abnormalities. Masses and calcifications are sometimes superimposed and hidden in the dense tissue which makes the segmentation of correct regions of interest difficult. Another issue is extracting and selecting appropriate features that will give the best classification results. Furthermore, the choice of a classifier has a great influence on the final result and classifying abnormalities as benign or ma-lignant is a difficult task even for expert radiologists. Further developments in each algorithm step are required to improve the overall performance of computer-aided detection and diagnosis algorithms.
Acknowledgments
The work in this chapter was conducted under the research project "Intelligent Image Fea-tures Extraction in Knowledge Discovery Systems" (036-0982560-1643), supported by the Ministry of Science, Education and Sports of the Republic of Croatia.
A Survey of Image Processing Algorithms in Digital Mammography 653 The authors would like to thank Prof. Boris Brljacic, Dr. Renata Huzjan Korunic and
Mr. Milan Grzan from the Department of Diagnostic and Interventional Radiology, Univer-sity Hospital "Dubrava", Zagreb, Croatia, for providing digital mammographic images.
References
[1] Acha, B., Rangayyan, R.M., Desautels, J.E.L.: Detection of Microcalcifications in Mammograms. In: Suri, J.S., Rangayyan, R.M. (eds.) Recent Advances in Breast Im-aging, Mammography, and Computer-Aided Diagnosis of Breast Cancer. SPIE, Bel-lingham (2006)
[2] American College of Radiology (ACR): ACR Breast Imaging Reporting and Data System, Breast Imaging Atlas, 4th edn., Reston, VA, USA (2003)
[3] Rangayyan, R.M., Ayres, F.J., Desautels, J.E.L.: A Review of Computer-Aided Di-agnosis of Breast Cancer: Toward the Detection of Subtle Signs. Journal of the Frank-lin Institute 344(3-4), 312–348 (2007)
[4] Sampat, M.P., Markey, M.K., Bovik, A.C.: Computer-Aided Detection and Diagnosis in Mammography. In: Bovik, A.C. (ed.) Handbook of Image and Video Processing. Elsevier Academic Press, Amsterdam (2005)
[5] de Paredes, E.S.: Atlas of Mammography, 3rd edn. Lippincott Williams & Wilkins, Philadelphia (2007)
[6] Cheng, H.D., Shi, X.J., Min, R., Hu, L.M., Cai, X.P., Du, H.N.: Approaches for Automated Detection and Classification of Masses in Mammograms. Pattern Recog-nition 39(4), 646–668 (2006)
[7] Rangayyan, R.M.: Biomedical Image Analysis. CRC Press LLC, Boca Raton (2005) [8] Jain, A.K., Duin, R.P.W., Mao, J.: Statistical Pattern Recognition: A Review. IEEE
Transactions on Pattern Analysis and Machine Intelligence 22(1), 4–37 (2000) [9] Metz, C.E.: Basic principles of ROC analysis. Seminars in Nuclear Medicine, 283–
298 (October 1978) [10] Long, P.M., Servedio, R.A.: Boosting the Area Under the ROC Curve. In: Advances
in Neural Information Processing Systems 20, Conference Proceedings (December 2007)
[11] Brzakovic, D., Luo, X.M., Brzakovic, P.: An approach to automated detection of tu-mors in mammograms. IEEE Transactions on Medical Imaging 9(3), 233–241 (1990)
[12] Li, L.H., Qian, W., Clarke, L.P., Clark, R.A., Thomas, J.: Improving Mass Detection by Adaptive and Multi-Scale Processing in Digitized Mammograms. Proceedings of SPIE—The International Society for Optical Engineering 3661 1, 490–498 (1999)
[13] Matsubara, T., Fujita, H., Endo, T., et al.: Development of Mass Detection Algorithm Based on Adaptive Thresholding Technique in Digital Mammograms. In: Doi, K., Giger, M.L., et al. (eds.) pp. 391–396. Elsevier, Amsterdam (1996)
[14] Dominguez, A.R., Nandi, A.F.: Enhanced Multi-Level Thresholding Segmentation and Rank Based Region Selection for Detection of Masses in Mammograms. In: IEEE International Conference on Acoustics, Speech and Signal Processing 2007, ICASSP 2007, Honolulu, HI, April 15-20, pp. 449–452 (2007)
[15] Varela, C., Tahoces, P.G., Méndez, A.J., Souto, M., Vidal, J.J.: Computerized Detec-tion of Breast Masses in Digitized Mammograms. Computers in Biology and Medi-cine 37, 214–226 (2007)
654 J. Bozek et al.
[16] Li, H.D., Kallergi, M., Clarke, L.P., Jain, V.K., Clark, R.A.: Markov Random Field for Tumor Detection in Digital Mammography. IEEE Transactions on Medical Imag-ing 14(3), 565–576 (1995)
[17] Székely, N., Tóth, N., Pataki, B.: A Hybrid System for Detecting Masses in Mammo-graphic Images. IEEE Transactions on Instrumentation and Measurement 55(3), 944–951 (2006)
[18] Zheng, B., Mello-Thoms, C., Wang, X.H., Gur, D.: Improvement of Visual Similarity of Similar Breast Masses Selected by Computer-Aided Diagnosis Schemes. In: 4th IEEE International Symposium on Biomedical Imaging: From Nano to Macro, ISBI 2007, April 12-15, pp. 516–519 (2007)
[19] Pappas, T.N.: An Adaptive Clustering Algorithm for Image Segmentation. IEEE Transactions on Signal Processing 40(4), 901–914 (1992)
[20] Sahiner, B., Hadjiiski, L.M., Chan, H.P., Paramagul, C., Nees, A., Helvie, M., Shi, J.: Concordance of Computer-Extracted Image Features with BI-RADS Descriptors for Mammographic Mass Margin. In: Giger, M.L., Karssemeijer, N. (eds.) Proc. of SPIE Medical Imaging 2008: Computer-Aided Diagnosis, vol. 6915 (2008)
[21] Fauci, F., Bagnasco, S., Bellotti, R., Cascio, D., Cheran, S.C., De Carlo, F., De Nun-zio, G., Fantacci, M.E., Forni, G., Lauria, A., Torres, E.L., Magro, R., Masala, G.L., Oliva, P., Quarta, M., Raso, G., Retico, A., Tangaro, S.: Mammogram Segmentation by Contour Searching and Massive Lesion Classification with Neural Network. In: 2004 IEEE Nuclear Science Symposium Conference Record, Rome, Italy, October 16–22, vol. 5, pp. 2695–2699 (2004)
[22] Petrick, N., Chan, H.P., Sahiner, B., Wei, D.: An Adaptive Density Weighted Con-trast Enhancement Filter for Mammographic Breast Mass Detection. IEEE Transac-tions on Medical Imaging 15(1), 59–67 (1996)
[23] Zou, F., Zheng, Y., Zhou, Z., Agyepong, K.: Gradient Vector Flow Field and Mass Region Extraction in Digital Mammograms. In: 21st IEEE International Symposium on Computer-Based Medical Systems, CMBS 2008, Jyvaskyla, June 17-19, pp. 41–43 (2008)
[24] Ferreira, A.A., Nascimento Jr., F., Tsang, I.R., Cavalcanti, G.D.C., Ludermir, T.B., de Aquino, R.R.B.: Analysis of Mammogram Using Self-Organizing Neural Networks Based on Spatial Isomorphism. In: Proceedings of International Joint Conference on Neural Networks, IJCNN 2007, Orlando, Florida, USA, August 12-17, pp. 1796–1801 (2007)
[25] Yuan, Y., Giger, M.L., Li, H., Sennett, C.: Correlative Feature Analysis of FFDM Images. In: Giger, M.L., Karssemeijer, N. (eds.) Proc. of SPIE Medical Imaging 2008: Computer-Aided Diagnosis, vol. 6915 (2008)
[26] Li, H., Wang, Y., Liu, K.J.R., Lo, S.B., Freedman, M.T.: Computerized Radiographic Mass Detection C Part I: Lesion Site Selection by Morphological Enhancement and Contextual Segmentation. IEEE Transactions on Medical Imaging 20(4), 289–301 (2001)
[27] Ball, J.E., Bruce, L.M.: Digital Mammographic Computer Aided Diagnosis (CAD) using Adaptive Level Set Segmentation. In: Proceedings of the 29th Annual Interna-tional Conference of the IEEE EMBS, Cité Internationale, Lyon, France, August 23-26, pp. 4973–4978 (2007)
[28] Ball, J.E., Bruce, L.M.: Digital Mammogram Spiculated Mass Detection and Spicule Segmentation using Level Sets. In: Proceedings of the 29th Annual International Con-ference of the IEEE EMBS, Cité Internationale, Lyon, France, August 23-26, pp. 4979–4984 (2007)
A Survey of Image Processing Algorithms in Digital Mammography 655
[29] Hassanien, A.E., Ali, J.M.: Digital Mammogram Segmentation Algorithm Using Pulse Coupled Neural Networks. In: Proceedings of the Third International Confer-ence on Image and Graphics, ICIG 2004 (2004)
[30] Li, H., Wang, Y., Ray Liu, K.J., Lo, S.C.B., Freedman, M.T.: Computerized Radio-graphic Mass Detection—Part II: Decision Support by Featured Database Visualiza-tion and Modular Neural Networks. IEEE Transactions on Medical Imaging 20(4) (April 2001)
[31] Bellotti, R., De Carlo, F., Tangaro, S., Gargano, G., Maggipinto, G., Castellano, M., Massafra, R., Cascio, D., Fauci, F., Magro, R., Raso, G., Lauria, A., Forni, G., Bagnasco, S., Cerello, P., Zanon, E., Cheran, S.C., Lopez Torres, E., Bottigli, U., Ma-sala, G.L., Oliva, P., Retico, A., Fantacci, M.E., Cataldo, R., De Mitri, I., De Nunzio, G.: A Completely Automated CAD System for Mass Detection in a Large Mammo-graphic Database. Medical Physics 33(8), 3066–3075 (2006)
[32] Timp, S., Karssemeijer, N.: Interval Change Analysis to Improve Computer Aided Detection in Mammography. Medical Image Analysis 10, 82–95 (2006)
[33] Timp, S., Varela, C., Karssemeijer, N.: Temporal Change Analysis for Characteriza-tion of Mass Lesions in Mammography. IEEE Transactions on Medical Imag-ing 26(7), 945–953 (2007)
[34] Rangayyan, R.M., Guliato, D., de Carvalho, J.D., Santiago, S.A.: Feature Extraction from the Turning Angle Function for the Classification of Contours of Breast Tu-mors. In: IEEE Special Topic Symposium on Information Technology in Biomedi-cine, Iaonnina, Greece, October 2006, 4 pages (2006) CDROM
[35] Nandi, R.J., Nandi, A.K., Rangayyan, R.M., Scutt, D.: Genetic Programming and Feature Selection for Classification of Breast Masses in Mammograms. In: Proceed-ings of the 28th IEEE EMBS Annual International Conference, New York City, USA, August 30-September 3 (2006)
[36] Hupse, R., Karssemeijer, N.: Feature Selection for Computer-Aided Detection: Com-paring Different Selection Criteria. In: Giger, M.L., Karssemeijer, N. (eds.) Proc. of SPIE Medical Imaging 2008: Computer-Aided Diagnosis, vol. 6915, 6915 691503-1 (2008)
[37] Kim, S., Yoon, S.: Mass Lesions Classification in Digital Mammography using Op-timal Subset of BI-RADS and Gray Level Features. In: 6th International Special Topic Conference on ITAB, 2007, Tokyo, pp. 99–102. IEEE, Los Alamitos (2008)
[38] Li, H., Giger, M.L., Yuan, Y., Lan, L., Sennett, C.A.: Performance of CADx on a Large Clinical Database of FFDM Images. In: Krupinski, E.A. (ed.) IWDM 2008. LNCS, vol. 5116, pp. 510–514. Springer, Heidelberg (2008)
[39] Malich, A., Marx, C., Facius, M.: Tumour Detection Rate of a New Commercialy Available Computer- Aided Detection System. Eur. Radiology 11(12), 2454–2459 (2001)
[40] Mu, T., Nandi, A.K., Rangayyan, R.M.: Strict 2-Surface Proximal Classifier with Application to Breast Cancer Detection in Mammograms. In: IEEE ICASSP 2007, pp. II 477–480 (2007)
[41] Krishnapuram, B., Stoeckel, J., Raykar, V., Rao, B., Bamberger, P., Ratner, E., Mer-let, N., Stainvas, I., Abramov, M., Manevitch, A.: Multiple-Instance Learning Im-proves CAD Detection of Masses in Digital Mammography. In: Krupinski, E.A. (ed.) IWDM 2008. LNCS, vol. 5116, pp. 350–357. Springer, Heidelberg (2008)
[42] West, D., Mangiameli, P., Rampal, R., West, V.: Ensemble Strategies for a Medical Diagnostic Decision Support System: a Breast Cancer Diagnosis Application. Euro-pean Journal of Operational Research 162, 532–551 (2005)
656 J. Bozek et al.
[43] Strickland, R.N., Hahn, H.I.: Wavelet transforms for detecting microcalcifications in mammograms. IEEE Transactions on Medical Imaging 15(2), 218–229 (1996)
[44] Wang, T.C., Karayiannis, N.B.: Detection of Microcalcifications in Digital Mammo-grams Using Wavelets. IEEE Transactions on Medical Imaging 17(4), 498–509 (1998)
[45] Salvado, J., Roque, B.: Detection of Calcifications in Digital Mammograms using Wavelet Analysis and Contrast Enhancement. In: IEEE International Workshop on Intelligent Signal Processing 2005, Faro, Portugal, September 2005, pp. 200–205 (2005)
[46] Suckling, J., Parker, J., Dance, D.R., Astley, S., Hutt, I., Boggis, C.R.M., Ricketts, I., Stamatakis, E., Cernaez, N., Kok, S.L., Taylor, P., Betal, D., Savage, J.: The Mam-mographic Image Analysis Society Digital Mammogram Database. In: Proceedings of the 2nd International Workshop on Digital Mammography, York, England, July 10-12, pp. 375–378. Elsevier Science, Amsterdam (1994)
[47] Juarez, L.C., Ponomaryov, V., Sanchez, R.J.L.: Detection of Microcalcifications in Digital Mammograms Images Using Wavelet Transform. In: Electronics, Robotics and Automotive Mechanics Conference, September 2006, vol. 2, pp. 58–61 (2006)
[48] Song, L., Wang, Q., Gao, J.: Microcalcification detection using combination of wave-let transform and morphology. In: Proceedings of the 8th International Conference on Signal Processing, ICSP 2006, vol. 4, pp. 16–20 (2006)
[49] Heinlein, P., Drexl, J., Schneider, W.: Integrated Wavelets for Enhancement of Mi-crocalcifications in Digital Mammograph. IEEE Transactions on Medical Imag-ing 22(3), 402–413 (2003)
[50] Mencattini, A., Salmeri, M., Lojacono, R., Frigerio, M., Caselli, F.: Mammographic Images Enhancement and Denoising for Breast Cancer Detection Using Dyadic Wavelet Processing. IEEE Transactions on Instrumentation and Measurement 57(7), 1422–1430 (2008)
[51] Sankar, D., Thomas, T.: Fractal Modeling of Mammograms based on Mean and Vari-ance for the Detection of Microcalcifications. In: Proceedings of the 2007 Interna-tional Conference on Computational Intelligence and Multimedia Applications, Sivakasi, India, December 2007, pp. 334–338 (2007)
[52] Elter, M., Held, C.: Semiautomatic segmentation for the computer aided diagnosis of clustered microcalcifications. In: Proc. SPIE, San Diego, CA, USA, February 2008, vol. 6915, 691524-691524-8 (2008)
[53] Heath, M., Bowyer, K., Kopans, D., Moore, R., Kegelmeyer Jr., P.: The Digital Data-base for Screening Mammography. In: Proceedings of the 5th International Workshop on Digital Mammography, Canada, June 11-14, pp. 212–218. Medical Physics Pub-lishing (2001)
[54] Lopez-Aligue, F.J., Poveda-Pierola, A., Acevedo-Sotoca, I., Garcia-Urra, F.: Detec-tion of Microcalcifications in Digital Mammograms. In: 29th Annual International Conference of the IEEE Engineering in Medicine and Biology Society, EMBS 2007, Lyon, France, August 22-26, pp. 3906–3909 (2007)
[55] Thangavel, K., Karnan, M.: Computer Aided Diagnosis in Digital Mammograms: De-tection of Microcalcifications by Meta Heuristic Algorithms. GVIP Journal 5(7), 41–55 (2005)
[56] Mustra, M., Grgic, M., Delac, K.: Efficient Presentation of DICOM Mammography Images using Matlab. In: Proceedings of the 15th International Conference on Sys-tems, Signals and Image Processing (IWSSIP), Bratislava, Slovakia, June 25-28, pp. 13–16 (2008)
A Survey of Image Processing Algorithms in Digital Mammography 657
[57] Nishikawa, R.M., Giger, K.L., Doi, K., Vyborny, C.J., Schmidt, R.A.: Computer-aided detection of clustered microcalcifications on digital mammograms. Medical & Biological Engineering & Computing 33(2), 174–178 (1995)
[58] Neiber, H., Müller, T., Stotzka, R.: Local Contrast Enhancement for the Detection of Microcalcifications. In: IWDM 2000, Canada, pp. 598–604 (2000)
[59] Cheng, H.D., Cai, X., Chen, X., Hu, L., Lou, X.: Computer-aided detection and clas-sification of microcalcifications in mammograms: a survey. Pattern Recogni-tion 36(12), 2967–2991 (2003)
[60] van Schie, G., Karssemeijer, N.: Detection of Microcalcifications Using a Nonuni-form Noise Model. In: Krupinski, E.A. (ed.) IWDM 2008. LNCS, vol. 5116, pp. 378–384. Springer, Heidelberg (2008)
[61] De Santo, M., Molinara, M., Tortorella, F., Vento, M.: Automatic classification of clustered microcalcifications by a multiple expert system. Pattern Recognition 36(7), 1467–1477 (2003)
[62] Vapnik, V.: Statistical Learning Theory. Wiley, New York (1998) [63] Wei, L., Yang, Y., Nishikawa, R.M., Jiang, Y.: A study on several Machine-learning
methods for classification of Malignant and benign clustered microcalcifications. IEEE Transactions on Medical Imaging 24(3), 371–380 (2005)
[64] Yang, Y., Wei, L., Nishikawa, R.M.: Microcalcification Classification Assisted by Content-Based Image Retrieval for Breast Cancer Diagnosis. In: IEEE International Conference on Image Processing 2007, ICIP 2007, September 16-19, vol. 5, pp. 1–4 (2007)
[65] Hadjiiski, L., Filev, P., Chan, H.-P., Ge, J., Sahiner, B., Helvie, M.A., Roubidoux, M.A.: Computerized Detection and Classification of Malignant and Benign Microcal-cifications on Full Field Digital Mammograms. In: Krupinski, E.A. (ed.) IWDM 2008. LNCS, vol. 5116, pp. 336–342. Springer, Heidelberg (2008)
[66] Geetha, K., Thanushkodi, K., Kishore Kumar, A.: New Particle Swarm Optimization for Feature Selection and Classification of Microcalcifications in Mammograms. In: International Conference on Signal Processing Communications and Networking, ICSCN 2008, January 4-6, pp. 458–463 (2008)

Related Documents