Brigham Young University Brigham Young University BYU ScholarsArchive BYU ScholarsArchive Theses and Dissertations 1972-08-01 A quantitative and ecological survey of the algae of Huntington A quantitative and ecological survey of the algae of Huntington Canyon, Utah Canyon, Utah Lorin E. Squires Brigham Young University - Provo Follow this and additional works at: https://scholarsarchive.byu.edu/etd BYU ScholarsArchive Citation BYU ScholarsArchive Citation Squires, Lorin E., "A quantitative and ecological survey of the algae of Huntington Canyon, Utah" (1972). Theses and Dissertations. 7981. https://scholarsarchive.byu.edu/etd/7981 This Thesis is brought to you for free and open access by BYU ScholarsArchive. It has been accepted for inclusion in Theses and Dissertations by an authorized administrator of BYU ScholarsArchive. For more information, please contact [email protected], [email protected].

Welcome message from author
This document is posted to help you gain knowledge. Please leave a comment to let me know what you think about it! Share it to your friends and learn new things together.
Transcript
Brigham Young University Brigham Young University
BYU ScholarsArchive BYU ScholarsArchive
Theses and Dissertations
1972-08-01
A quantitative and ecological survey of the algae of Huntington A quantitative and ecological survey of the algae of Huntington
Canyon, Utah Canyon, Utah
Lorin E. Squires Brigham Young University - Provo
Follow this and additional works at: https://scholarsarchive.byu.edu/etd
BYU ScholarsArchive Citation BYU ScholarsArchive Citation Squires, Lorin E., "A quantitative and ecological survey of the algae of Huntington Canyon, Utah" (1972). Theses and Dissertations. 7981. https://scholarsarchive.byu.edu/etd/7981
This Thesis is brought to you for free and open access by BYU ScholarsArchive. It has been accepted for inclusion in Theses and Dissertations by an authorized administrator of BYU ScholarsArchive. For more information, please contact [email protected], [email protected].
A QUANTITATIVE AND ECOLOGICAL SURVEY
OF THE ALGAE OF HUNTINGTON
CANYON, UTAH
A Thesis
Presented to the
Department of Botany and Range Science
Brigham You11g University
In Partial Fulfillment
of the Requirement for the Degree
Master of Science
by
Lorin E. Squires
August 1972
iii
ACKNOWLEDGEMENTS
Appreciation is expressed to Dr. Samuel R. Rushforth
who served as chairman of my advisory committee and pro-
vided valuable guidance and assistance in conducting the
research and preparing the manuscript for this thesis.
I also express thanks to Dr. Albert D. Swensen who served
on my advisory committee.
Special thanks is expressed to Carol Endsley for
her willing and valuable assistance especially while
collecting, enumerating, and tabulating the algal data.
Special appreciation also goes to my sister Jana Flake
for her diligence and patience• in typing the manuscr5.pt.
I am also grateful to the Center for Environmental
Studies, Brigham Young University for financial support
during part of the study and to Dr. Robert Wingett and
Eugene Devenport of this Center for encouragement and
suggestions. Furthermore, I appreciate the cooperation
of the Department of Botany and Range Science, Brigham
Young University in providing ·facilities and travel
support for this research.
iv
TABLE OF CONTENTS
Page
ACKNOWLEDGEMENTS• • • .... • • * • • • • • • • • • • iii
LIST OF TABLES .. • • • • • ., .. • • • • .. • .. • • • • vi
LIST OF ILLUSTRATIONS•• • • • • • • • • • ., • • • • ix
INTRODUCTION • • • • • • • • • • • • • .. .. « • • • • 1
.REVIEW OF SELECTED ALGAL STUDIES IN UTAH• • • • • • 6
DESCRIPTION OF HUNTI:t-.GTON CANYON DRAINAGE AND DESCRIPTION OF THE SAMPLING SITES• • • • • .. • • 11
DESCRIPTION OF HUNTINGTON CANYON DRAINAGE Geology Climate and Vegetational Zones Description and Uses of Huntington Creek
DESCRIPTION OF SAMPLING SITES · Lawrence (Site 1)
Highway 10 (Site 2) Plant Site (Site 3) Campground (Site 4) Tie Fork Pond (Site 5) Stuart Fire Station (Site 6) Bear Canyon (Site 7)
METHODS••••• • • • • • ., •. •. • • ., .. •., •., 30
PHYSICAL AND CHEMICAL MEASUREMENTS Temperature Turbidity W11.ter Chemistry
PHYTOl?LANKTON Net Plankton Nannoplankton
.PERJ.PHYTON VISIBLE BENTHIC ALGAE FLORISTIC SAMPLING
RESULTS AND DISCUSSION• • ••• • • • •.,. • • • ., 46
LAWRENCE (SITE 1) HIGHWAY 10 (SITE 2)
PLANT SITE (SITE 3) CAMPGROUND (SITE 4) STUART FIRE STATION (SITE 6) BEAR CANYON (SITE 7) TIE FORK POND (SITE 8) ALGAL FLORA OF HUNTINGTON CANYON
LITERATURE CITED.
APPENDIX I ... • • • .. ................ .
• • • • ....... .. .. .. . • • • • • • • APPENDIX II ••
APPENDIX III • • • • • • • • • • • • • • • • • • * •
• • • • • • • • • • • • • • • • .......
V
Page
108
113
125
221
vi
LIST OF TABLES
Table Page
l. Chemical Data for Huntington Creek, December 17, 1971 •••••••••••••
2. July-November 1971 Averages of The Frequency, Per Cent Cover, and Per Cent Composition for £ladophora and Q~ in a Riffle
55
and in a Slow Water Area at Highway 10 (Site 2). • • • • • • • • • • • • • • • • • 57
3. Per Cent Occurrence of Selected Genera of Periphyton and Nannoplankton at Plant Site (Site 3) •••••••••••••••• 67
4. Per Cent Composition of Achnanthes on Glass · Slides at Campground, June 8-September
15, 1971. • • • • • • • • • • • • • • • • • 74
5.
6.
7.
Density in Cells/CM 2 and Relative 6chnAnthes and Qocconeis in the of Site 6 July-October 1971 ••
Abundance of Periphyton • • • • • ••
Nannoplankton Totals for February 19 and February 23, 1972 from Stuart Station. • •
Nannoplankton Totals in Cells per Liter for Stuart Station and Bea,r Canyon for August-
. November 1971 • • • • • • • • . • • • • • •
8. _ Number of Organisms Per Liter and Relative Abundance of the Net Plankton at Lawrence
89
93
96
(Site 1) ••••••••••••••••• 126
9. Number of Organisms Fer Liter and Relative Abundance of the Nannoplankton at Lawrence (Site 1) •••••••••••• • ••••
10. Number o.f Organisms Per CM2 and Relative Abundance of Periphyton on Glass Slides at Lawrence (Site 1) ••••••••••••
11. Number of Organisms Per Liter.and Relative Abundance of the Net Plankton at Plant Site (Site 3) •••••••••••••••
130
134
138
Table
vii
Page
12. Number of Organisms Per Liter and Relative Abundance of the Nannoplankton at Plant Site (Site 3). • • • • • • • • • • • • • • • 142
13. Number of Organisms Per C}-f' and Relative Abundance of Periphyton on Glass Slides at Plant Site (Site 3). • • • • • • • • • • • • 146
14. Number of Organisms Per Liter and Relative Abundance of the Net Plankton at Campground (Site 4) ••••••••••• • • 152
15. Number of Organisms Per Liter and Relative Abundance of the Nannoplankton at Campground (Site 4) • • • • •. • • • ••• • •••• • 156
16. Number of Organisms Per C~ and Relative Abundance of Periphyton on Glass Slides in a Pool at Campground (Site 4). • • • • • • • 160
17. Number of Organisms per CM2 and Relative Abundance of Periphyton on Glass Slides in a Riffle at Campground (Site 4). • • • • • • 166
18. Number of Organisms Fer Liter and Relative Abundance of the Net Plankton at Tie Fork Pond (Site 5)..... • • • • • • • • • • • 170
19. Number of Organisms Per Liter and Relative Abundance of the Nannoplankton at Tie Fork Pond (Site 5).. • • • • • • • • • • • • • • 174
20. Number of Organisms fer CM2 and Relative Abundance of Periphyton on Glass Slides at Tie Fork Pond (Site 5) ••••••• .: • • • 180
21. Number of Organisms Per Liter and Relative Abundance of the Net Plankton at Stuart Station (Site 6) •••••••••••• • • 188
22. Number of Organisms Per Liter and Relative Abundance of the Nannoplankton at Stuart Station (Site 6) • • • • • • • • • • • • • • 192
23. Number of Organisms Per CM!-and Relative Abundance of Periphyton on Glass Slides at Stuart Station (Site 6). • • • • • • • • • • 196
24. Number of Organisms Per Liter and Relative Abundance of the Net Plankton at Bear Canyon (Site 7) ••••••••••••• • • 200
Table
25.
26.
21.
28.
29.
30.
31.
32.
33.
34.
35.
Number of Organisms Per Liter and Relative Abundance of the Nannoplankton at Bear Canyon (Site 7) •••••••••••••
Frequency, Per Cent Cover, and Per Cent Composition of the Visible Benthic Flora at 6 Localities in Huntington Creek, June 1971 - March 1972 •••••••••
Physical and Chemical Data from Huntington Canyon Water Temperature ( 0 c) ••••••
Physical and Chemical Data from Huntington Canyon Turbidity (JTU) •••••••••
Physical and Chemical Data from Huntington Canyon pH ••••••••••••••••
Physical and Chemical Data from Huntington Canyon Dissolved Oxygen _(mg/1) • • • • •
Physical and Chemical Data from Huntington Canyon Dissolved Carbon Dioxide (mg/1) •
Physical and Chemical Data from Huntington Canyon Phosphate (mg/1) ........... .
Physical and Chemical Data from Huntington Canyon Nitrate Nitrogen (mg/1) •••••
Physical and Chemical Data from Huntington Canyon Sulfate (mg/1) ••• · • • • • •••
Physical and Chemical Data from Huntington Canyon Calcium and ~..agnesium Hardness (mg/1 CaC03) • • • • • • • • .• • • • • •
• •
• •
• •
.... • •
• •
• •
• •
• •
• •
• •
viii
Page
202
204
209
210
211
212
213
214
215
216
217
36. Physical and Chemical Data from Huntington Canyon Bicarbonate Allcalinity (mg/1 CaC03) • 219
37. Physical and Chemical Date from Huntington Canyon Silica (mg/1 Si03)• • • • •.... • 220
Figure
1.
2.
3.
4.
s. 6.
7.
8.
9.
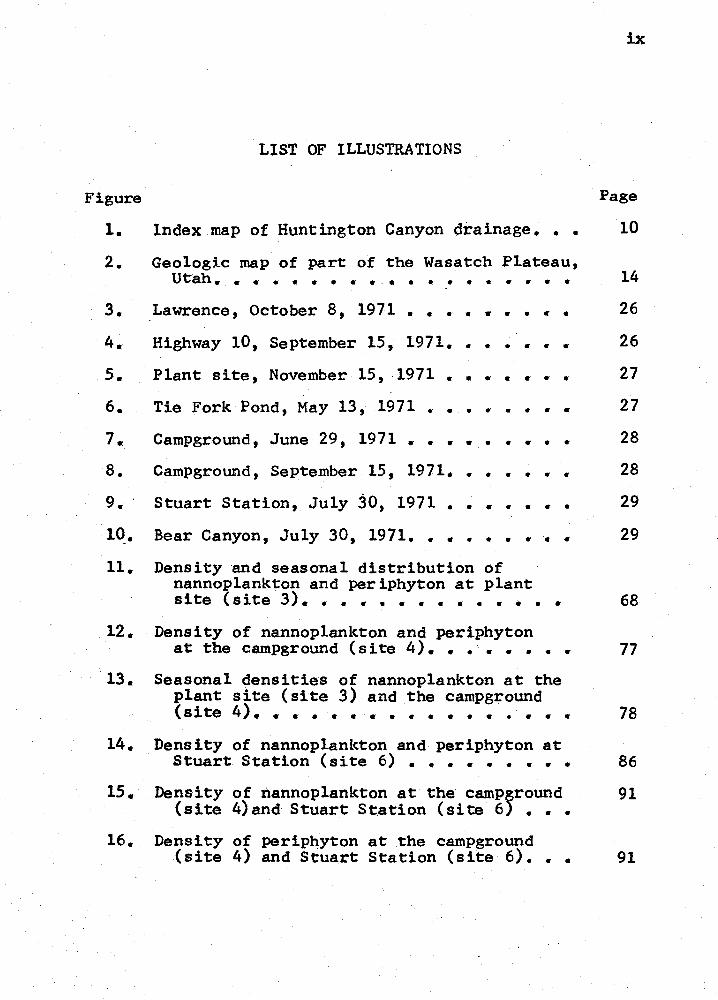
LIST OF ILLUSTRATIONS
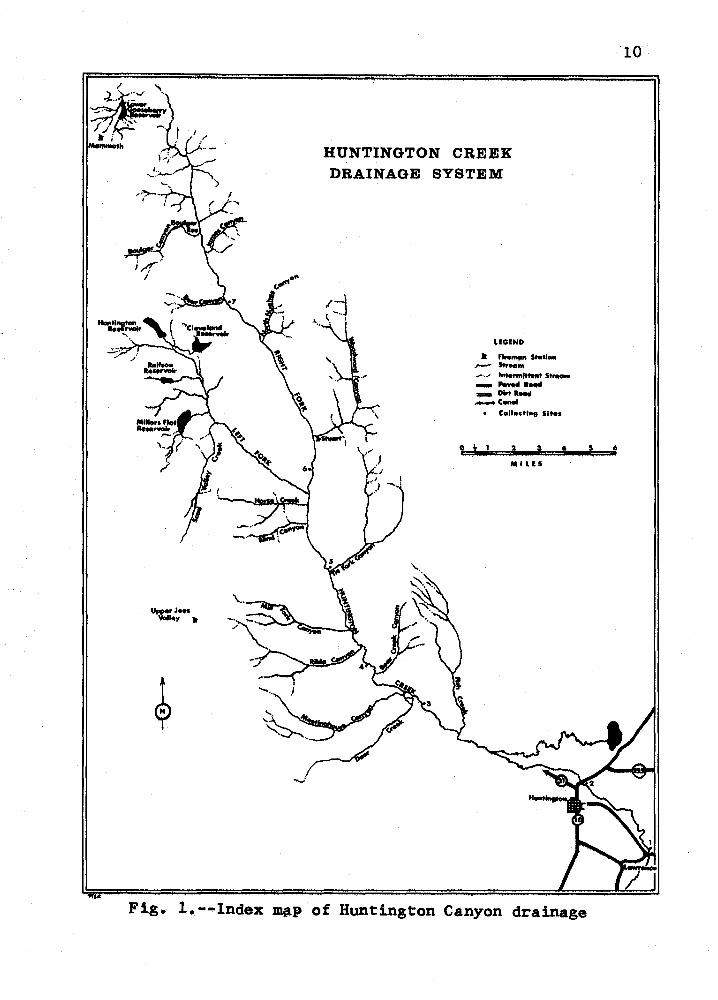
Index map of Huntington Canyon drainage •••
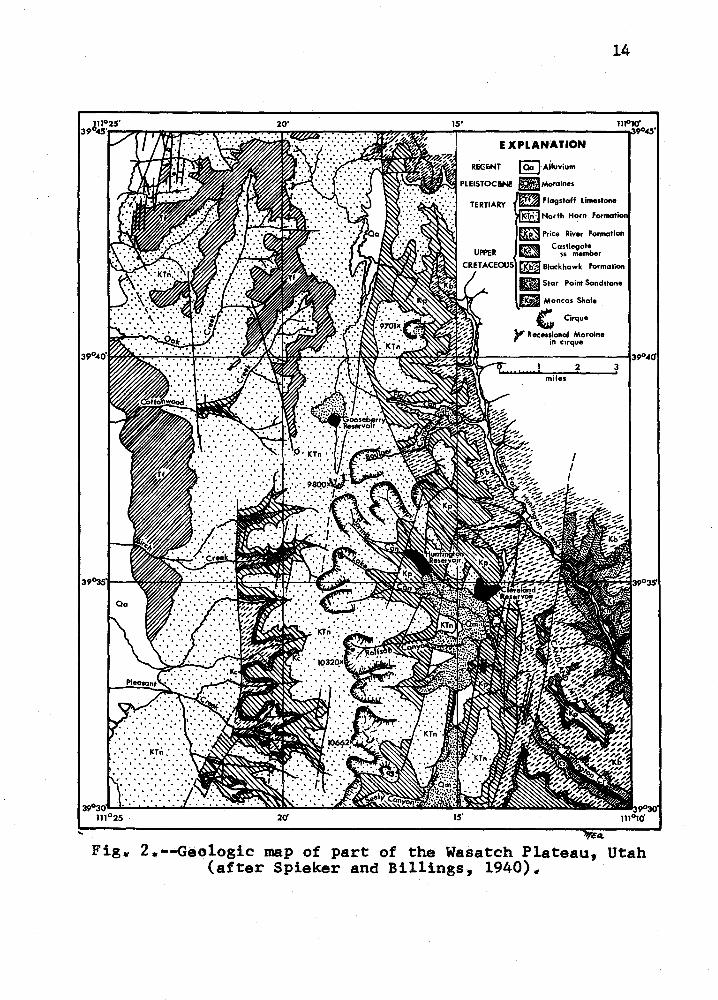
Geologic map of part of the Wasatch Plateau, Utah ••••••••• • ••••••• • •
Lawrence, October 8, 1971. . . . .. . . .. . Highway 10, September 15, 1971.
Plant site, November 15, 1971.
Tie Fork Pond, May 13, 1971.
• • • • • •
• • • • • • . . .. • • • •
Campground, June 29, 1971. . .. . . . .. . . • • Campground, September 15, 1971 ••
Stuart Station, July 30, 1971 • • • • Bear Canyon, July 30, 1971 •••• • •
• • •
• • • .. .. .
ix
Page
10
14
26
26
27
27
28
28
29
29
11. Density and seasonal distribution of nannoplankton and periphyton at plant site (site 3). • • • • • • • • • • • • • 68
12.
13.
14.
15.
16.
Density of nannoplankton and periphyton at the campground (site 4) •••••• • •
Seasonal densities of nannoplanlcton at the plant site (site 3) and the campground (site 4) •••••••••••••••••
Density of nannoplankton and periphyton at Stuart Station (site 6) •••••••••
Density of nannoplankton at the camp~round (site 4)and Stuart Station (site 6) •••
Density of periphyton at the campground (site 4) and Stuart Station (site 6) •••
77
78
86
91
91
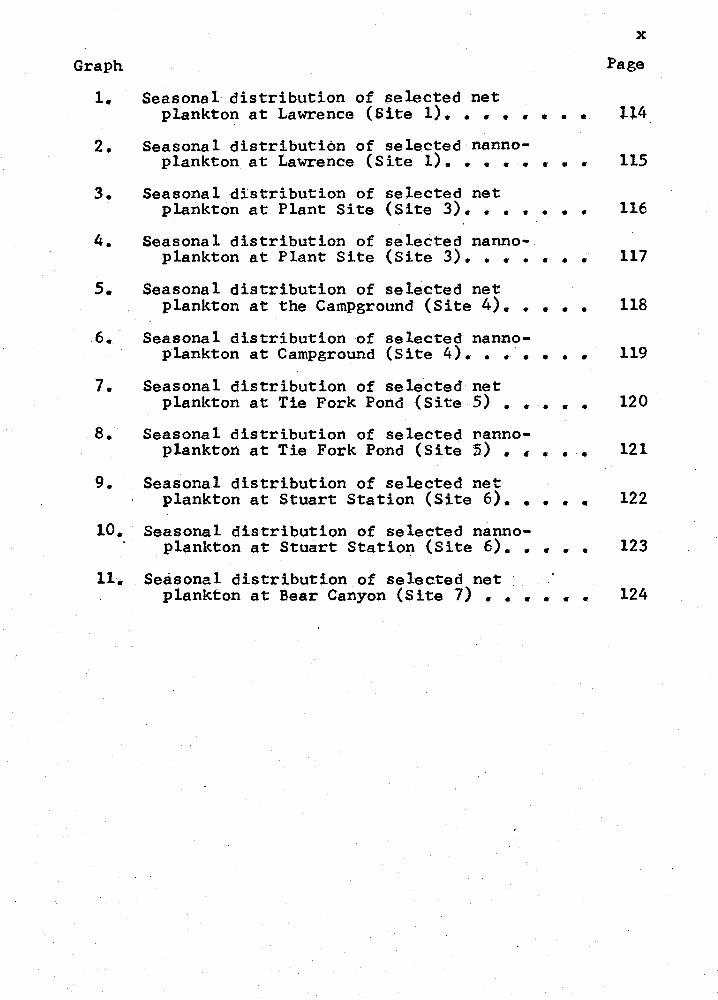
Graph
1.
2.
3.
4.
5.
6.
7.
8.
9.
Seasonal distribution of selected net plankton at Lawrence (Site 1) •••• • • • •
Seasonal distribution of selected nanno-plankton at Lawrence (Site 1) ••••• • • •
Seasonal distribution of selected net plankton at Plant Site (Site 3) ••• • • • •
Seasonal distribution of selected nanno-plankton at Plant Site (Site 3) ••••
Seasonal distribution of selected net plankton at the Campground (Site 4) ••
• • •
• • • Seasonal distribution of selected nanno-
plankton at Campground (Site 4) •••••••
Seasonal distribution of selected net plankton at Tie Fork Pond (Site 5) • • • • •
Seasonal distribution of selected nanno-plankton at Tie Fork Pond (Site 5) • • • • •
Seasonal distribution of selected net plankton at Stuart Station (Site 6). • • • •
X
Page
1l4
115
116
117
118
119
120
121
122
10. Seasonal distribution of selected nanno-
11.
plankton at Stuart Station (Site 6). • • • • 123
Seasonal distribution of selected net plankton at Bear Canyon (Site 7) •• • • • • 124
INTRODUCTION
In October, 1970 a pioneer study of the algal flora
of Huntington Canyon, Emery County, Utah was initiated.
The need for this study stems from the construction of a
coal fired power generating station and a 30,000 acre-
foot reservoir by Utah Power and Light Company. The
-generating station is located in lower Huntington Canyon
approximately 12 miles northwest of Huntington, Utah on
land formerly owned by the Utah State Division of Wildlife
Services and the Bureau- of Land Management. The Peabody
Coal Company will supply coal for the generating station
from a mine 2\ miles southwest of the station, and the
elect~icity will be transmitted south to the four corners
area and north to Camp Williams (Draft of Environmental
Statement, 1971). When completed the station will consist
of 4 generating units. The first unit will generate 430
mega watts of electricity and will be operational in 1974.
The other units will be completed, one during each of three
four year periods thereafter, and it is projected that upon
completion the station will be capable of generating 2,000
mega watts of electricity.
The 4 generators will be water cooled with water
taken from Huntington Creek. To insure that a continuous
supply of water will be available, a new reservoir to be
2
called Electric Lake will be constructed on the Right Fork
of Huntington Creek approximately 20 miles upstream from
the generating station near the mouth of Bear Canyon,
Emery County, Utah. The reservoir will be approximately
4\ miles long and 215 feet deep at the darn. It will store
water from the spring runoff which will be released as
needed during the s~r and fall months. A paved road
will provide access to the reservoir, and facilities will
be provided for recreational use by the public.
Initial impact of this project on the environment
of Huntington Canyon will arise from 4 factors1 (1) the
construction of the generating station itself which
· necessitates extensive excavation and infringes on the
winter deer range; (2) the loss of approximately 4\ miles
of prime fishing stream on the Right Fork of Huntington
Creek above the darn site which currently serves as spawning
grounds by brown and cutthroat trout, (3) the scarring of
the mountain side during the construction of the darn and-
the relocation of approximately 15 miles of road through
heavily forested regions, and (4) the destruction of forest
cover along the path of the power lines to a width of 100
feet.
Other less obvious effects may occur, especially
in the aquatic environment which often becomes a reposi-
tory for chemical and physical pollutants which can enter
via effluents, drainage from surrounding lands, and rains
and snows which remove them from the air. The silt load
3
in the creek is an important factor especially during
construction periods causing abrasion and erosion which
can be very detrimental to the stream ecology. Also, the
release of reservoir water into Huntington Creek may
cause temporary or permanent temperature, chemical, and/or
nutrient changes which will affect the ecological balance
of the biota of the stream.
Because of the possible environrrental effects of
this project, the Center for Environmental Studies at
Brigham Young University, with primary funding from Utah
Power and Light Company, undertook a comprehensive study
of the aquatic environment of the Huntington Canyon region
in September of 1970. The initial goal of this study was
to gather baseline data on physical and chemical para-
meters, aquatic insects, and algae which may be used to
determ.ine future changes in this ecosystem.
Algae are very important in such an environmental
impact study since they are very responsive to changes
in the environment which they inhabit and thus indicate
changes and fluctuations which may occur. Blum (1957)
for instance, found a marked change in the benthic algal
flora as pollution outfalls entered the Saline River in
Michigan. Foerster and Corrin (1970) observed that the
presence or absence of certain algae enable one to deter-
mine the condition of the water in which they are found.
Moghadam (1969) in a diatom study of ·Flathead Lake,
Montana, spoke of the use of diatoms as indicators of
4
changes in environmental conditions and of the capacity
of a body of water to support aquatic life. In referring
specifically to stream algae, Palmer (1961) stated that it
is important to know the algal population of rivers both
quantitatively and qualitatively if one is to assess their
true value in the ecosystem. Palmer ( 1961) further stated
that " ••• it can be important to know the algal population
of a river before any major change is made in the use of
the stream. Also, we need to know the algal population
of rivers throughout the year and not merely for the winter
months.n
This paper reports the initial studies of Hunting-
ton Creek undertaken before a major change in the use of
this stream. It will be augmented by future studies made
during and after construction and operation of the power
plant-reservoir complex.
To characterize all species of the algal flora
and their specific ecological niches is a monumental task,
and this has not been done in the current study. However,
.the initial goal was to obtain an overall picture of the
entire aquatic algal flora rather than of one specific
part. Therefore, sampling included water chemistry,
quantitative analysis of phytoplankton and attached algae
and a floristic survey.
Plankton are interpreted in this study as all
organisms found in the open water (Kofoid, 1908), and only
chlorophyll-bearing phytoplankton (Welch, 1935) are
5
considered in this paper. Phytoplankton are divided
into net pla~kton (those forms large enough to be retained
by a 67 micron mesh plankton net) and nannoplankton (those
forms which can pass through the net). Nannoplankton
are considered to be of primary importance in this study
since diatoms are included in this group, and diatoms are
the dominant algal forms in most rivers (Rice, 1938)
including Huntington Creek.
Sampling the attached algae included both micro-
scopic periphyton, defined by Young (1945) as " ••• that
assemblage of _organisms growing upon free surfaces of
submerged objects in water ••• ," and the visible a tta.ched
algae.
Floristic sampling was done to determine the
composition of the algal flora of the canyon and the
distribution of species.
6
REVIEW OF SELECTED ALGAL STUDIES I~ UTAH
Aquatic research in Utah has not been extensive,
although it has included studies in many areas related to
ecological and pollution i~terests. One significant
contribution was made by Clark (1958) who studied the
phytoplankton of the Logan River in the Bear River Range
of the Wasatch Mountains from November, 1955 to June, 1957 •
. Clark's results were valuable for comparison with those
of the present study since the two streams are similar
in size and certain other characteristics. A companion
study to that conducted by Clark was completed-by
McConnell (1959) who estimated the algal productivity of
the Logan River from chlorophyll extracts of the algae
growing on the river bed.
Samuelson (1950) co~pleted a study illustrating
man's influence on the algal floras in two mountain streams
in the Wasatch Mountain Range east of Salt Lake Valley,
Utah. He observed that livestock grazing and recreation
severely damaged the aquatic ecology in Emigration Canyon
as compared to that of Red Butte Canyon.
Another pollution study was done by Quinn (1958)
who found that organic wastes from the effluent of a sugar
beet factory were detrimental to the algal flora of the
Jordan River in Salt Lake County, Utah. Currently, an
7
algal floristic and ecological investigation is being
conducted along the entire length of the Provo River
(Lawson, per. com.). This study will establish the algal
communities in the river and their responses to man's use
of the river.
More investigations have been conducted on
insect benthos than on algae in Utah streams. These
studies are valuable since they often treat information on
the algae in the ecosystem being studied, and give gen-
eral information concerning biological responses to environ-
mental stresses. One such study was conducted by Smith
(1959) who included algal samples in his macroinvertebrate
study of the Weber River in north central Utah. His results
showed that siltation from watershed misuse, habitat destruc-
tion from dredging, and stream bottom exposure resulting
from irrigation diversion were more destructive to the
aquatic biota than organic pollution.
An earlier study by Dustans (1951) on the Provo
River also discussed the effects of dredging on aquatic life.
He mentioned reduced photosynthesis, loss of marginal
vegetation and the loss of diatoms, desmids, and fila-
mentous algae as primary contributing causes to the
reduction of insect benthos in dredged stream channels.
A pollution study has been previously conducted in
central Utah on the Price River (Miller, 1959). Although
this river, like Huntington Creek, drains the Wasatch
Plateau, it is of little value for comparison to the present
study since the extreme silt load in the Price River and
organic pollution contributed by towns through which it
passes severely restrict biological life. Miller found
only rare and limited amounts of £ladophora sp. and
Chaetophora elegans in the river and a marked absence of
aquatic vascular plants.
8
Work-has also been done in several lentic environ-
ments, especially on the plankton of pond_s, reservoirs and
lakes of Utah. These studies include Piranian's (1937)
report on the plankton of the Bear River Migratory Water-
fowl Refuge, Chatwin's (1956) study of the vertical distri-
bution of phytoplankton in Deer Creek Reservoir, Wasatch
County, Utah, Pratt's (1957) investigation of plankton
periodicity in Salem Pond, Salem, Utah, and Longley 1 s (1969)
discussion of the phytoplankton associations in Flaming
Gorge _Reservoir. The information provided by these and
similar studies is valuable in understanding stream environ-
ments and communities since lentic environments nonnally
exert a definite strong influence on the streams which
drain them. Since several reservoirs presently occur on
the Huntington Creek drainage, and a new one (Electric Lake)
is planned for construction beginni~g in 1972, their
management and algal populations need to be considered as
factors affecting the physical and biological parameters
of Huntington Creek itself.
Mention should also be made of some important
taxonomic references concerning Utah algae. The most
9
significant contribution in this regard has been made by
Dr. Seville Flowers who published mimeographed keys to
the common algae of Utah (nd, a) and to the blue-green
algae of Utah (nd, b). Flowers also has reported on the
nonvascular plants of various regions of the state (1959,
1960). Two other taxonomic studies were those by
Norrington (1~25) and Coombs (1964) of the Wasatch and
Uinta Mountains, and the Western Uinta Mountains respec-
tively. Both reports include ecological notes although
those of Coombs are more extensive and correlate in some
respects with the results from the Huntington Canyon
drainage.
u,,p.,,J .. , van., 1r
\. ..
HUNTINGTON CREEK DRAINAGE SYSTEM
UGEND
• fl,._,, Stat .... ,__ s...a.., .,,,,,. .. .,,1 lntertnft.....-Stl'WIIIII - ,_.d Rocid = 1)1,t ..... -c-,
• Coll•ctfn9 Sit••
0 t 1 3 I ! 1\111 LES
Fig. 1.--lndex DlilP of Huntington Canyon drainage
10
5 6
DESCRIPTION OF THE HUNTINGTON CANYON DRAINAGE AND
DESCRIPTION OF SAMPLING SITES
Description of Huntington Canyon Drainage
Geology.--Huntington Creek is one of the many streams
11
which drain the Wasatch Plateau of Central Utah. This
plateau is the northernmost of the plateaus of Utah and is
situated in the central part of the state between 30 and
40 degrees north latitude and 111 and 112 degrees west
longitude. It merges northward with the higher land of the
Uinta Basin and is separated from the Fish Lake Plateau
to the south by a 20 mile wide erosional depression. The
Wasatch Plateau is essentially a tableland 90 miles long and
20-30 miles ~ide, which rises to elevations of 10,000 to
11,000 feet above sea lavel and 5,000 to 6,000 feet above
Castle Valley on the east and San Pete Valley on the west
(Spieker and Reeside, 1925). Strata in the plateau are
mostly Late Cretaceous and Early Tertiary in age and lie
flat or dip at moderate angles. Resistant rocks alternate
with those less resistant giving cliff, bench and slope pro-
files much like those of the Colorado Plateau (Spieker and
Billings, 1940). Castle Valley on the east is of erosional
origin. The western edge of this valley exhibits a sharp
profile since the eastern edge of the Wasatch Plat~au drops
abruptly through horizontal strata from one formation to
12
another. San Pete and Sevier Valleys west of the plateau
arose from down folding and faulting with the western
front of the plateau itself being a great monoclinal
flexure. Other faults running through the plateau have
created irregularities in stratigraphy, and erosion has
carved canyon~,cliffs, and gullies throughout the area
(Dutton, 1880).
Spieker and Billings (1940) described the strati-
graphy and thickness of each formation of the Huntington
Canyon section of the Wasatch Plateau as follows:
Paleocene Flagstaff limestone. Gray, tan, white limestone, with minor amounts of shale and sandstones lacustrine •••••••• ~~••·300-500
Upper Cretaceous and Paleocene North Horn formation. Buff, gray, red sandstone, gray to variegated shale, conglomerate, some limestone; flood-plain and lacustrine in origin •••.•••••••• 2000
Upper Cretaceous Price River formation.
Upper member, Gray sandstone and conglomerate with minor amounts of shale .......... · ••••••••••••••.••••••••••• 600+
Castlegate sandstone members Massive, cliff-forming gray sandstone, coarse-grained to conglomeratic •••••••••••••••• 300
Blackhawk formation. Medium-to~fine grained buff and gray sandstone, gray shale, coal •••••••••••••••• ••••••••••• 1500
Starpoint sandstone. ~assive, cliff-forming buff sandstone, medium-to fine grained; marine •••••••••••••••••••• 450
Mancos shale. Gray marine shale (only uppermost part exposed in area described)•••••••••••••••••••••••••••••4000+
The upper portion of the Huntington Creek drainage
is mostly North Horn sandstone and shale with glaciated
13
cirques, moraines, and widened valleys with outwash deposits
of Pleistocene age (Spieker and Billings, 1940). Most
cirques occur in Joes Valley Graben, a vertically dis-
placed fault block in the central part of the plateau.
This graben averages 2.5 miles wide and extends south for
60 miles from the north central part of the plateau
(Spieker and Billings, 1940). Most glaciers issued east-
ward from the western edge of the plateau into the graben
valley often coalescing to form large sheetlike moraines ..
Stream notches in many of these moraines have been dammed
in recent years to form storage reservoirs such as Cleve-
land and Huntington Reservoirs.
The Left Fork of Huntington Creek drains the north-
ern part of this graben and the slopes which rise from it.
The headwaters gather from Spring, Lal<:e, Rolfson and Staker
Canyon~, flow across the graben valley and finally descend
through a rocky gorge approximately 3,000 feet deep
(Spieker and Billings, 1940).
The headwaters of the Right Fork of Huntington
Creek arise north of the termination of Joes Valley Graben
which ends at Cleveland Reservoir. The Right Fork originates
in narrow rocky canyons in the Price River Sandstone but
flows early into Blackhawk sediments where the stream
channel widens into a broad U-shaped valley. This valley
remains prominent to Bear Canyon where it narrows again to
a V-shaped mountain gorge. This flat-bottomed valley was
created by lateral erosive cutting by glaciers in this
... Fig.,
2(f
14
EXPLANATION
RECiNT
TERTIARY
! Qa !· Ailuvium
ml Moraines
Flagstaff Limestone
~tri.' North Horn formation
Price River Formation Castlegate
UPPER ss member CRETACEOUS [l<J'iil Blackhawk Formation
15'
- Star Point Sandstone
Mancos Shale . G Cirque
y Reces~onal Moraine ,n cirque
2 3 miles
39°30' 111°10'
2 .. --Geologic map of part of the Wasatch Plateau, (after Spieker and Billings, 1940).
Utah
15
canyon.
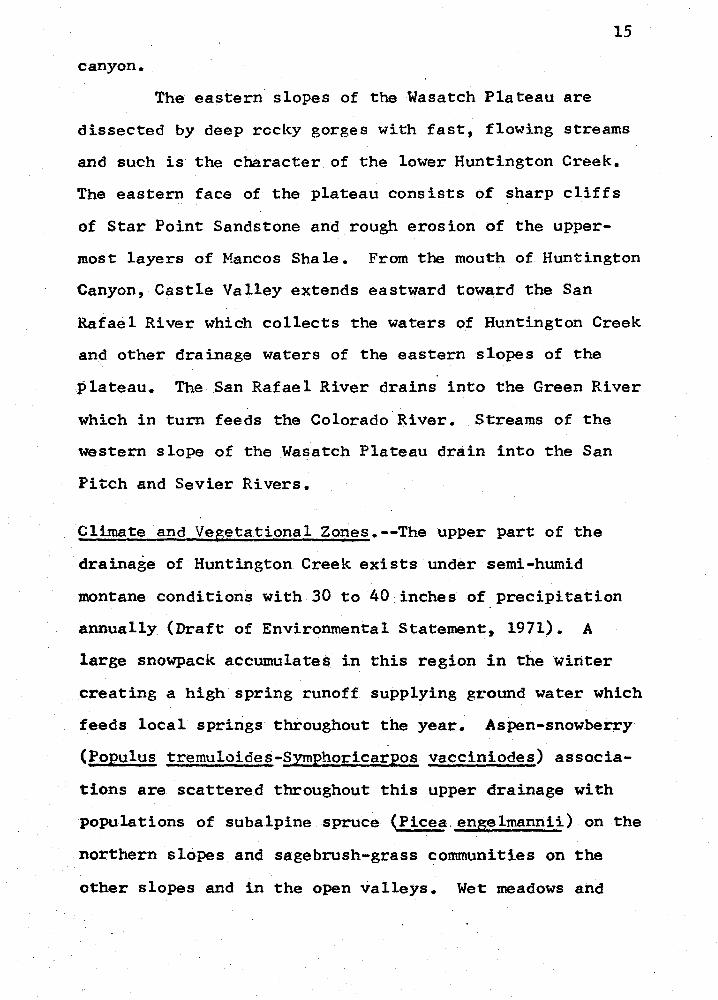
The eastern slopes of the Wasatch Plateau are
dissected by deep rccky gorges with fast, flowing streams
and such is the character of the lower Huntington Creek.
The eastern face of the plateau consists of sharp cliffs
of Star Point Sandstone and rough erosion of the upper-
most layers of Mancos Shale. From the mouth of Huntington
Canyon, Castle Valley extends eastward toward the San
Rafael River which collects the waters of Huntington Creek
and other drainage waters of the eastern slopes of the
plateau. The San Rafael River drains into the Green River
which in turn feeds the Colorado River. Streams of the
western slope of the Wasatch Plateau drain into the San
Pitch and Sevier Rivers.
Climate and Ve5etational Zones.--The upper part of the
drainage of Huntington Creek exists under semi-humid
montane conditions with 30 to 40 inches of precipitation
annually (Draft of Environmental Statement, 1971). A
large snowpack accumulates in this region in the winter
creating a high spring runoff supplying ground water which
feeds local springs throughout the year. Aspen-snowberry
(Populus trernuloides-Symphoricarpos vacciniodes) associa-
tions are scattered throughout this upper drainage with
populations of subalpine spruce (Picea.engelmannii) on the
northern slopes and sagebrush-grass communities on the
other slopes and in the open valleys. Wet meadows and
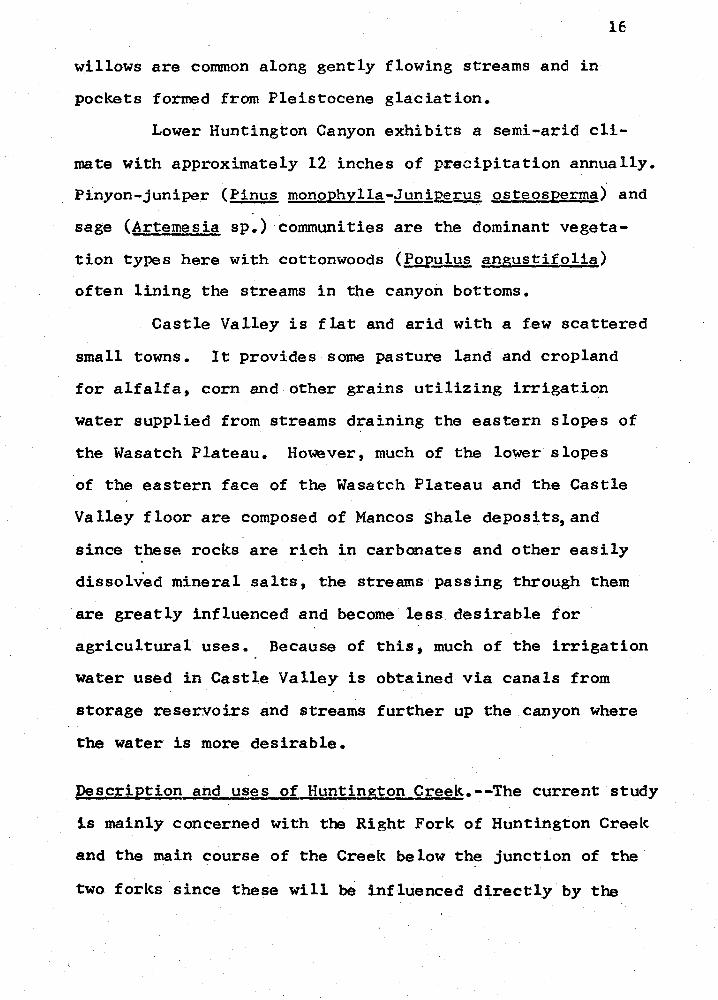
willows are common along gently flowing streams and in
pockets formed from Pleistocene glaciation.
16
Lower Huntington Canyon exhibits a semi-arid cli-
mate with approximately 12 inches of precipitation annually.
Pinyon-juniper (Pinus monophylla-~~~ osteosperrna) and
sage (Artemesia sp.) communities are the dominant vegeta-
tion types here with cottonwoods (Populus ~ngustifolia)
often lining the streams in the canyon bottoms.
Castle Valley is flat and arid with a few scattered
small towns. It provides some pasture land and cropland
for alfalfa, corn and other grains utilizing irrigation
water supplied from streams draining the eastern slopes of
the Wasatch Plateau. However, much of the lower slopes
of the eastern face of the Wasatch Plateau and the Castle
Valley floor are composed of Mancos Shale deposits,and
since these rocks are rich in carbonates and other easily
dissolved mineral salts, the streams passing through them
are greatly influenced and become less desirable for
agricultural uses. Because of this, much of the irrigation
water used in Castle Valley is obtained via canals from
storage reservoirs and streams further up the canyon where
the water is more desirable.
Description and uses of Huntington Creek.--The current study
is mainly concerned with the Right Fork of Huntington Creek
and the main course of the Creek below the junction of the
two forks since these will be influenced directly by the
_17
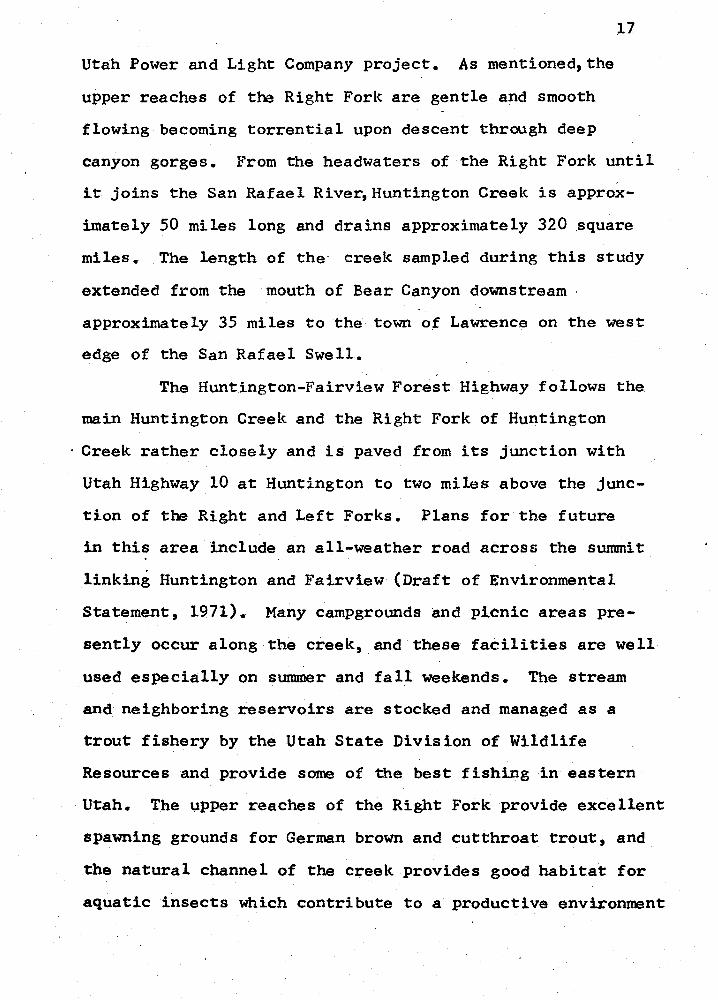
Utah Power and Light Company project. As mentioned, the
upper reaches of tm Right Fork are gentle and smooth
flowing becoming torrential upon descent thro..igh deep
canyon gorges. From the headwaters of the Right Fork until
it joins the San Rafael River,Huntington Creek is approx-
imately 50 miles long and drains approximately 320 _square
miles. The length of the· creek sampled during this study
extended from the mouth of Bear Canyon downstream
approximately 35 miles to the town of Lawrence on the west
edge of the San Rafael Swell.
The Huntington-Fairview Forest Highway follows the
main Huntington Creek and the Right Fork of Huntington
· Creek rather closely and is paved from its junction with
Utah Highway 10 at Huntington to two miles above the junc-
tion of the Right and Left Forks. Plans for the future
in this area include an all-weather road across the summit
linking Huntington and 1'"'airview (Draft of Environmental
Statement, 1971). Many campgrounds and picnic areas pre-
sently occur along the creek, and these facilities are well
used especially on summer and fa 11 weekends. The stream
and neighboring reservoirs are stocked and managed as a
trout fishery by the Utah State Division of Wildlife
Resources and provide some of the best fishing in eastern
Utah. The upper reaches of the Right Fork provide excellent
spawning grounds for German brown and cutthroat trout, and
the natural channel of the creek provides good habitat for
aquatic insects which contribute to a productive environm3nt
for fish. The upper valleys are also used for summer
grazing of cattle and sheep.
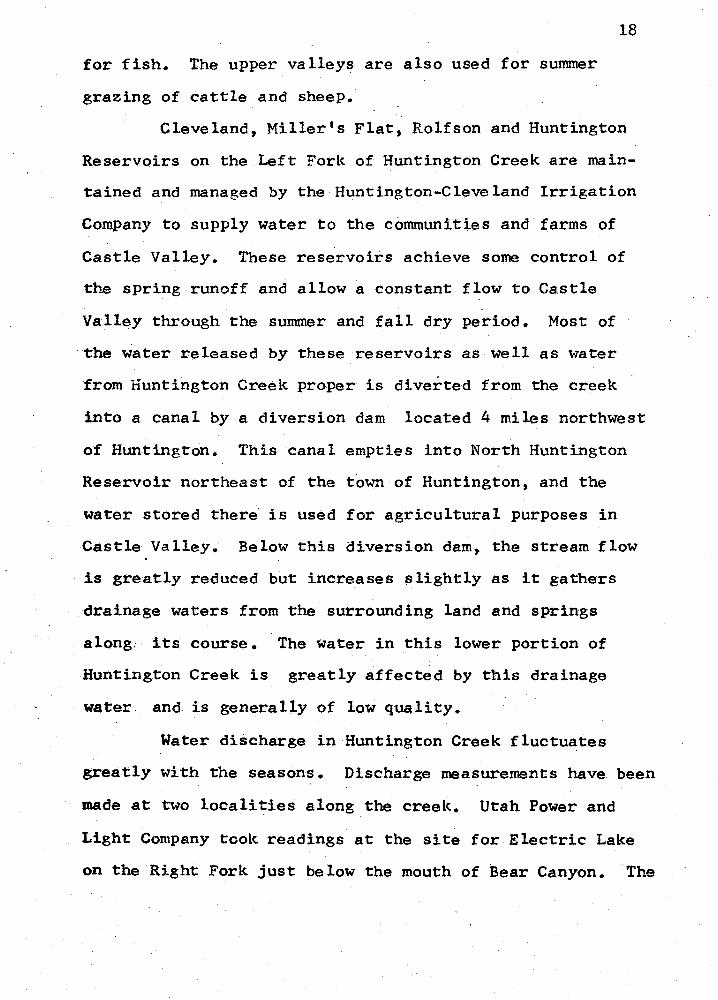
18
Cleveland, Miller's Flat, Rolfson and Huntington
Reservoirs on the Left Fork of Huntington Creek are main-
tained and managed by the Huntington-Cleveland Irrigation
Company to supply water to the communities and farms of
Castle Valley. These reservoirs achieve some control of
the spring runoff and allow a constant flow to Castle
Valley through the sunnner and fall dry period. Most of
the water released by these reservoirs as well as water
from Huntington Creek proper is diverted from the creek
into a canal by a diversion dam located 4 miles northwest
of Huntington. This canal empties into North Huntington
Reservoir northeast of the town of Huntington, and the
water stored there· is used for agricultural purposes in
Castle Valley. Below this diversion dam, the stream flow
is greatly reduced but increases slightly as it gathers
drainage waters from the surrounding land and springs
along; its course. The ~ater in this lower portion of
Huntington Creek is greatly affected by this drainage
water and is generally of low quality.
Water discharge in Huntington Creek fluctuates
greatly with the seasons. Discharge measurements have been
made at two localities along the creek. Utah Power and
Light Company took readings at the site for Electric Lake
on the Right Fork just below the mouth of Bear Canyon. The
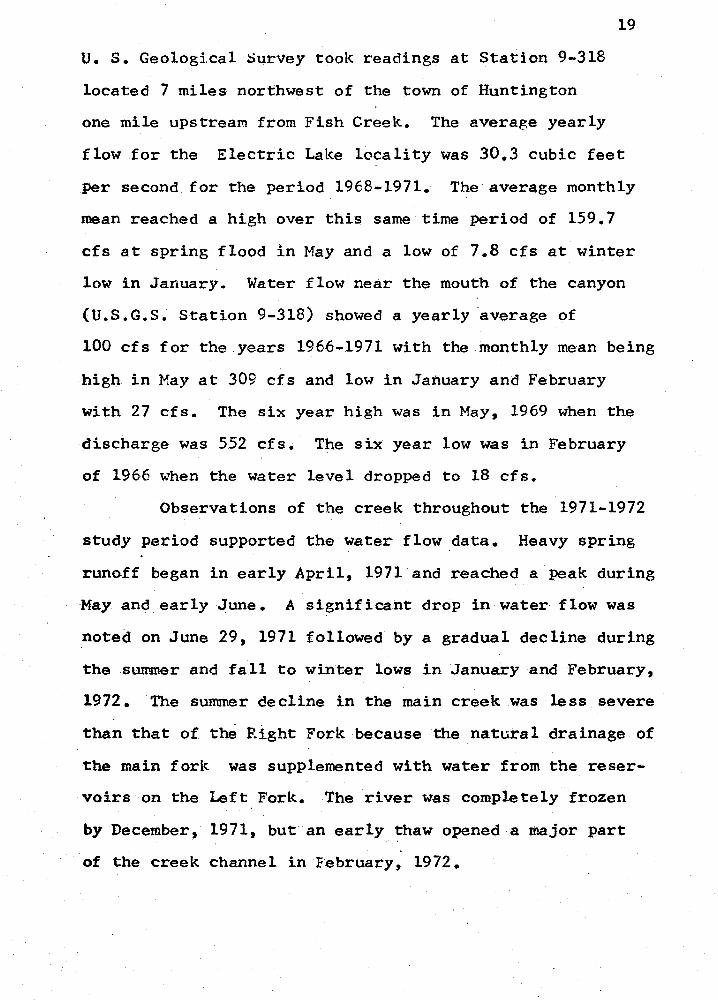
U. s. Geological Survey took readings at Station 9-318
located 7 miles northwest of the town of Huntington
19
one mile upstream from Fish Creek. The average yearly
flow for the Electric Lake locality was 30.3 cubic feet
per second for the period 1968-1971. The average monthly
mean reached a high over this same time period of 159.7
cfs at spring flood in May and a low of 7.8 cfs at winter
low in January. Water flow near the mouth of the canyon
(U.S.G.s. Station 9-318) showed a yearly average of
100 cfs for the years 1966-1971 with the monthly mean being
high in May at 309 cfs and low in January and February
with 27 cfs. The six year high was in May, 1969 when the
discharge was 552 cfs. The six year low was in February
of 1966 when the water level dropped to 18 cfs.
Observations of the creek throughout the 1971-1972
study period supported the water flow data. Heavy spring
runo.ff began in early April, 1971 and reached a peak during
May and early June. A significant drop in water flow was
noted on June 29, 1971 followed by a gradual decline during
the sumner and fall to winter lows in January and February,
1972. The summer decline in the main creek was less severe
than that of the Right Fork because the natural drainage of
the main fork was supplemented with water from the reser-
voirs on the Left Fork. The river wa~ completely frozen
by December, 1971, but an early ~haw opened a major part
of the creek channel in February, 1972.
20
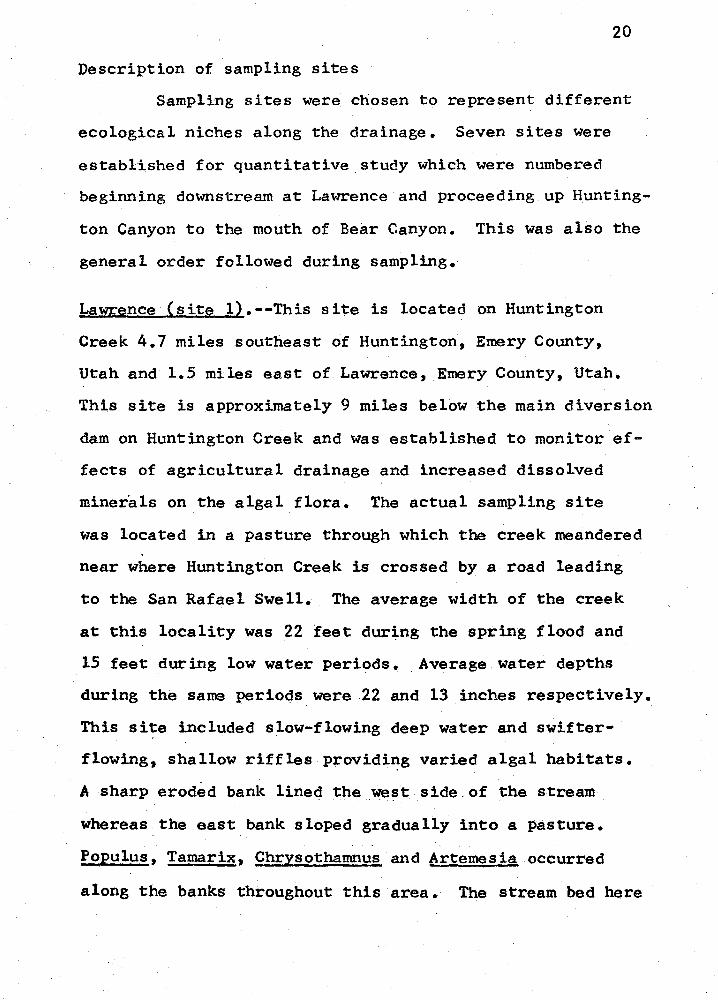
Description of sampling sites
Sampling sites were chosen to represent different
ecological niches along the drainage. Seven sites were
established for quantitative study which were numbered
beginning downstream at Lawrence and proceeding up Hunting-
ton Canyon to the mouth of Bear Canyon. This was also the
general order followed during sampling.
Lawrence (site l}.--This site is located on Huntington
Creek 4.7 miles southeast of Huntington, Emery County,
Utah and 1.5 miles east of Lawrence, Emery County, Utah.
This site is approximately 9 miles below the main diversion
dam on Huntington Creek and was established to monitor ef-
fects of agricultural drainage and increased dissolved
minerals on the algal flora. The actual sampling site
was located in a pasture through which the creek meandered
near where Huntington Creek is crossed by a road leading
to the San Rafael Swell. The average width of the creek
at this locality was 22 feet during the spring flood and
15 feet during low water periods. Average water depths
during the same periods were 22 and 13 inches respectively.
This si~e included slow-flowing deep water and swifter-
flowing, shallow riffles providing varied algal habitats.
A sharp eroded bank lined the west side.of the stream
whereas the east bank sloped gradually into a pasture • . .
Populus, Tamarix, Chrysothamnus and Artemesia occurred
along the banks throughout this area. The stream bed here
21
consisted mostly of silt and sand with small stones in
the riffles, and the water was generally of low quality.
In talking with the rancher who owns the land at this
locality, he mentioned that over the last few years his
cattle will no longer drink the water from the creek unless
they have no other source. This is probably due to the
diversion of the better quality water upstream, and per-
haps to the addition of organic pollutants by Huntington
City.
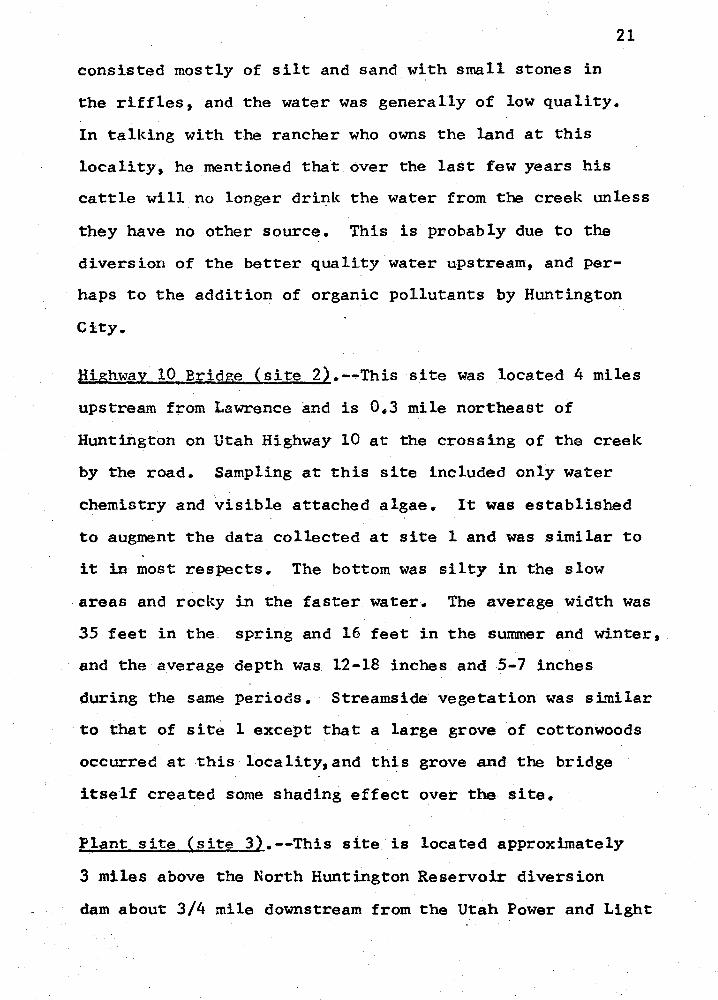
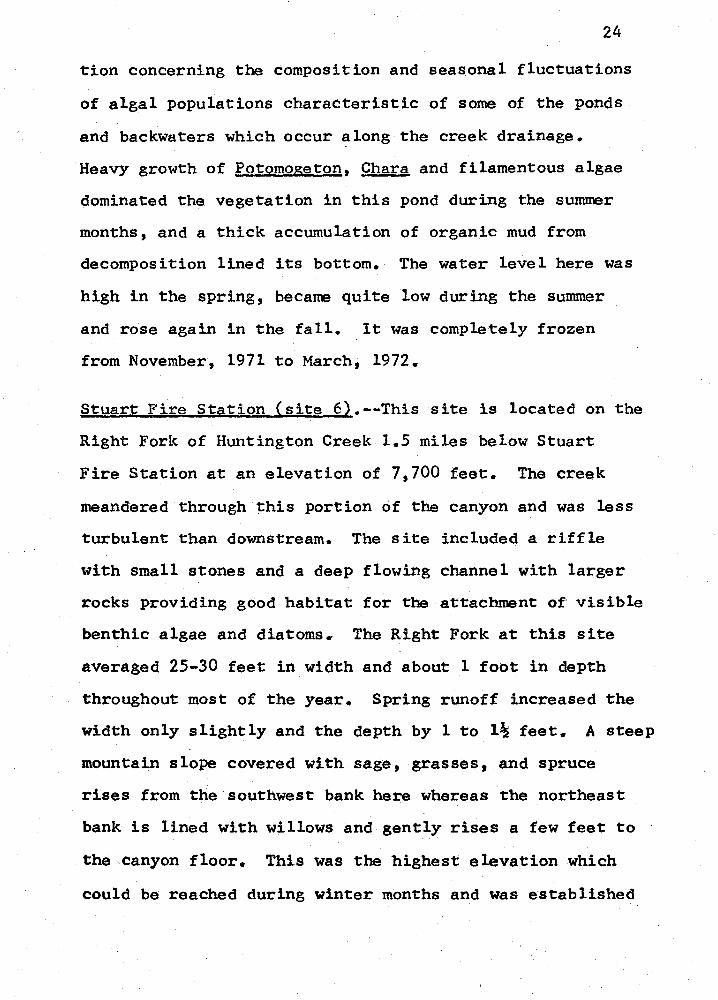
Highway 10 Bridge (site 2).--This sit~ was located 4 miles
upstream from Lawrence and is 0~3 mile northeast of
Huntington on Utah Highway 10 at the crossing of the creek
by the road. Sampling at this site included only water
chemistry and visible attached algae. It was established
to augment the data collected at site 1 and was similar to
it in most respects. The bottom was silty in the slow
areas and rocky in the faster water. The average width was
35 feet in the. spring and 16 feet in the sumner and winter,
and the average depth was 12-18 inches and 5-7 inches
during the same periocls. Streamside vegetation was similar
to that of site 1 except that a large grove of cottonwoods
occurred at this locality, and this grove and the bridge
itself created some shading effect over the site.
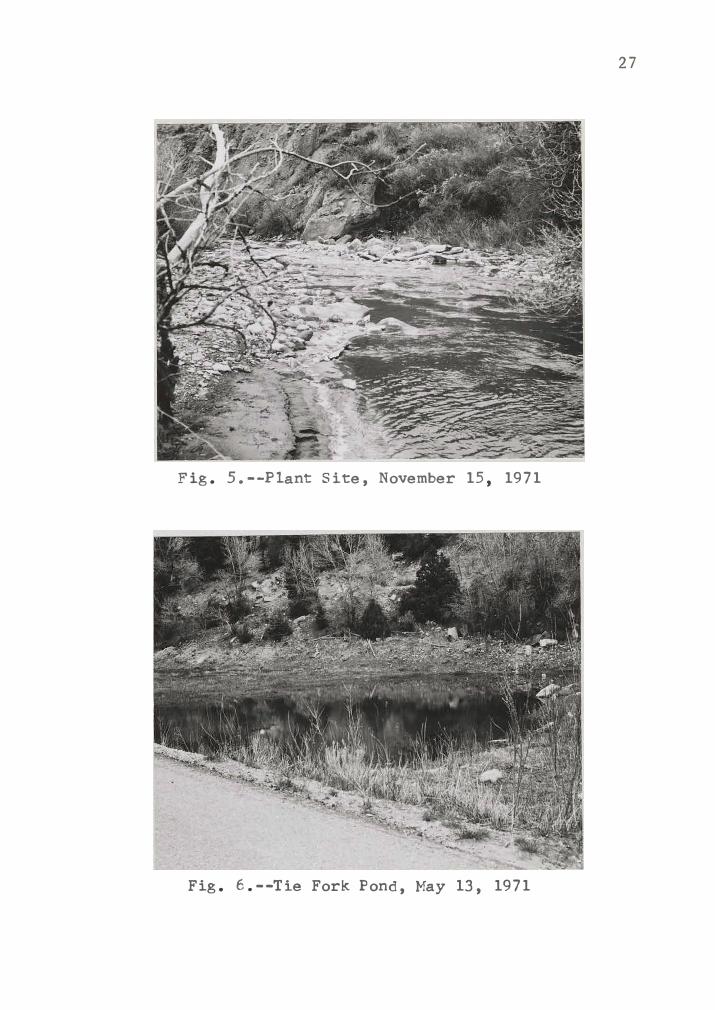
Plant site (site 3).--This site is located approximately
3 miles above the North Huntington Reservoir diversion
dam about 3/4 mile downstream from the Utah Power and Light
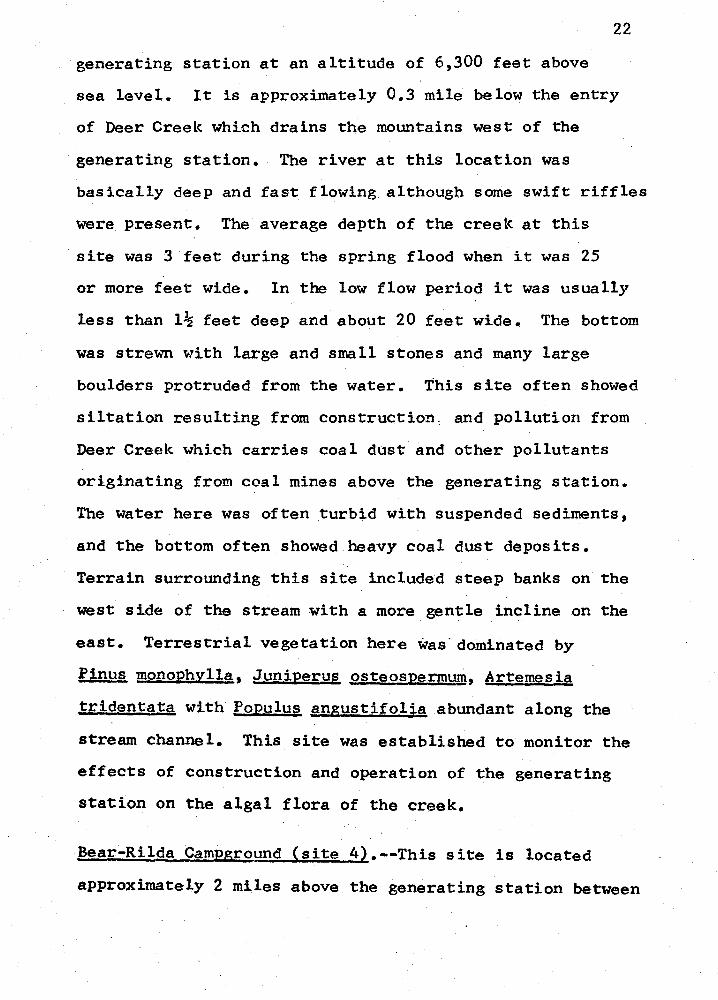
22
generating station at an altitude of 6,300 feet above
sea level. It is approximately 0.3 mile below the entry
of Deer Creek which drains the mountains west of the
generating station. The river at this location was
basically deep and fast flowing although some swift riffles
were present. The average depth of the creek at this
site was 3 feet during the spring flood when it was 25
or more feet wide. In the low flow period it was usually
less than 1\ feet deep and about 20 feet wide. The bottom
was strewn with large and small stones and many large
boulders protruded from the water. This site often showed
siltation resulting from construction, and pollution from
Deer Creek which carries coal dust and other pollutants
originating from coal mines above the generating station.
The water here was often _turbid with suspended sediments,
and the bottom often showed heavy coal dust deposits.
Terrain surrounding this site included steep banks on the
west side of the stream with a more_gentle incline on the
east. Terrestrial vegetation here was· dominated by
Pinus monophylla, Juniperus osteospermum, .Artemes ia
tridentata with Populus angustifolia abundant along the
stream channel. This site was established to monitor the
effects of construction and operation of the generating
station on the algal flora of the creek.
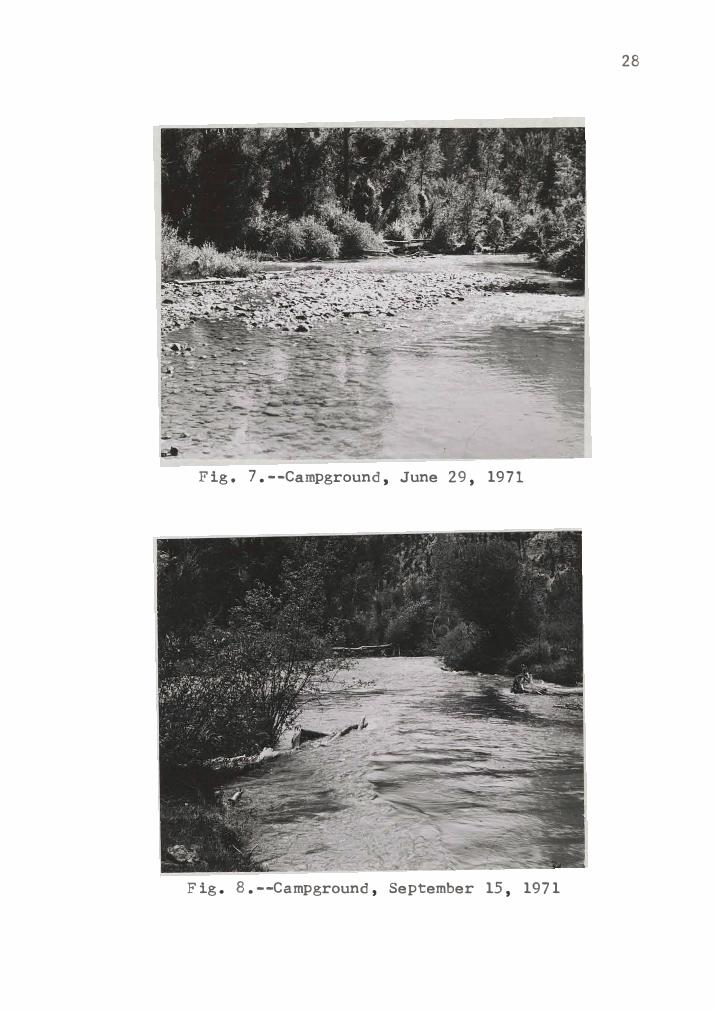
Bear-Rilda Campground ~site 42.--This site is located
approximately 2 miles above the generating station between
Bear Creek and Rilda Canyons at an elevation of 6,600
feet above sea level.
23
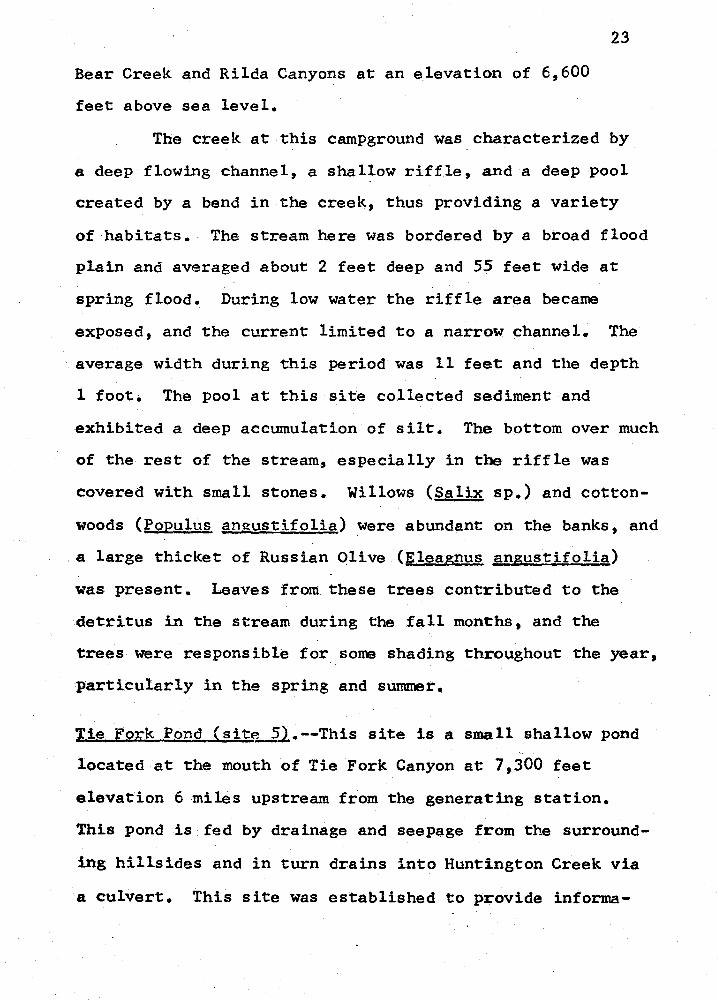
The creek at this campground was characterized by
a deep flowing channel, a shallow riffle, and a deep pool
created by a bend in the creek, thus providing a variety
of habitats •. The stream here was bordered by a broad flood
plain and averaged about 2 feet deep and 55 feet wide at
spring flood. During low water the riffle area became
exposed, and the current limited to a narrow channel. The
average width during this period was 11 feet and the depth
1 foot. The pool at this site collected sediment and
exhibited a deep accumulation of silt. The bottom over much
of the rest of the stream, especially in the riffle was
covered with small stones. Willows (Salix sp.) and cotton-
woods (Populus angustifolia) were abundant on the banks, and
a large thicket of Russian Olive (Eleagnus angustifolia)
was present. Leaves from these trees contributed to the
detritus in the stream during the fall months, and the
trees were responsible for some shading throughout the year,
particularly in the spring and summer.
Tie Fork Pond ~sitEL.21.--This site is a small shallow pond
located at the mouth of Tie Fork Canyon at 7,300 feet
elevation 6 miles upstream from the generating station.
This pond is fed by drainage and seepage from the surround-
ing hillsides and in turn drains into Huntington Creek via
a culvert. This site was established to provide informa-
24
tion concerning the composition and seasonal fluctuations
of algal populations characteristic of some of the ponds
and backwaters which occur along the creek drainage.
Heavy growth of Potomogeton, Chara and filamentous algae
dominated the vegetation in this pond during the summer
months, and a thick accumulation of organic mud from
decomposition lined its bottom. The water level here was
high in the spring, became quite low during the summer
and rose again in the fall. It was completely frozen
from November, 1971 to Marcht 1972.
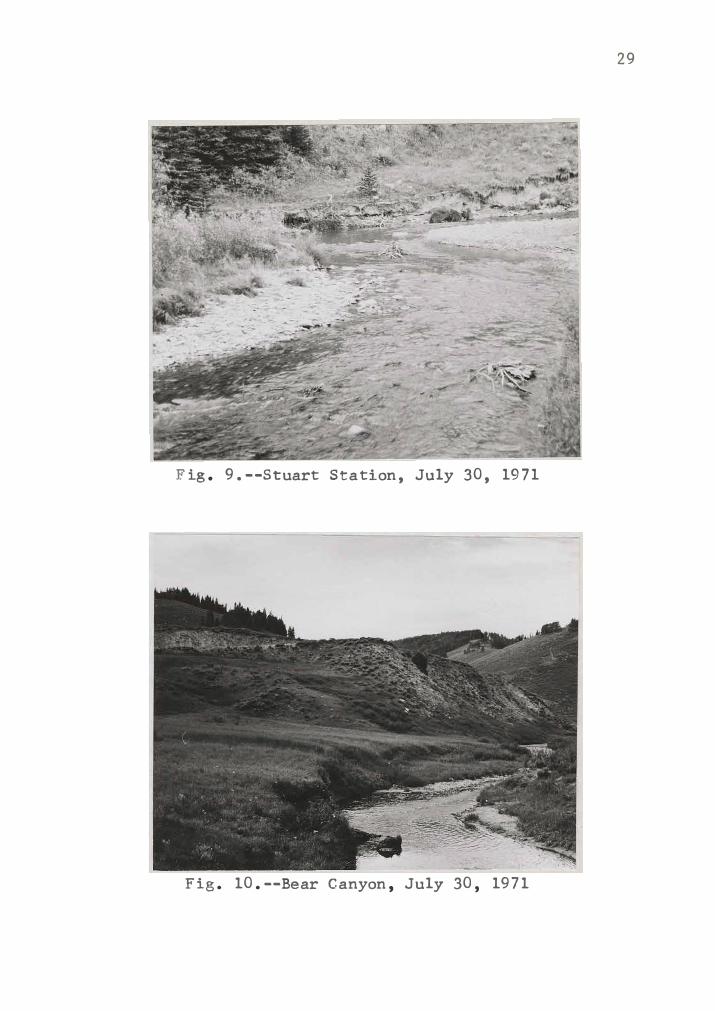
Stuart Fire Station (site 6}.--This site is located on the
Right Fork of Huntington Creek 1.5 miles below Stuart
Fire Station at an elevation of 7,700 feet. The creek
meandered through this portion of the canyon and was less
turbulent than downstream. The site included a riffle
with small stones and a deep flowing channel with larger
rocks providing good habitat for the attachment of visible
benthic algae and diatoms. The Right Fork at this site
averaged 25-30 feet in width and about 1 foot in depth
throughout most of the year. Spring runoff increased the
width only slightly and the depth by l to 1\ feet. A steep
mountain slope covered with sage, grasses, and spruce
rises from the southwest bank here whereas the northeast
bank is lined with willows and gently rises a few feet to
the canyon floor. This was the highest elevation which
could be reached during winter months and was established
25
to study the flora of this part of the stream which will
be directly influenced by discharge from Electric Lake.
Bear Canyon (site 7).--This site is located on the Right
Fork near the mouth of Bear Canyon at the present junction
of the Huntington-Fairview Forest Highway with the Miller's
Flat road. The elevation here is 8,400 feet. This portion
of the creek averaged 20 feet wide and less than 2 feet
deep throughout the study. The bottom was sandy in slow
areas and covered with small stones in the riffles. A clay
shelf along part of the channel supported growths of
benthic Chlorophyta during much of the growing season.
Stream banks at this site are vertical and undercut rising
approximately 10 feet above the stream channel. The creek
valley here is wide with grass covered low hills rising
gently to the mountains. This site is located at the
transition zone between the broad U-shaped valleys of the
upper drainage and the deep gorg~s of the lower canyons.
It was added to the previous 6 sites in June, 1971 to
sample the flora of the upper drainage and for comparison
with site 6. From December to June this site was inacces-
sible due to snow pack.
. " �. . i ..di .-i;• _,.
Fig. 3.--Lawrence, October 8, 1971
Fig. 4.--Highway 10, September 15, 1971
26
27
Fig. 5.--Plant Site, November 15, 1971
Fig. 6.--Tie Fork Pond, May 13, 1971
28
Fig. 7.--Campground, June 29, 1971
Fig. 8.--Campground, September 15, 1971
29
Fig. 9.--Stuart Station, July 30, 1971
Fig. 10.--Bear Canyon, July 30, 1971
30
METHODS
Physical and Chemical Measurements
Physical and chemical sampling was initiated on
June 8, 1971 at sites 1, 3, 4, 5 and 6 and sites 2 and 7
were added on August 20, 1971. Measurements were taken
during each collecting trip until the study was terminated
in March, 1972. However, site 7 became inaccessible
after November, 1971, and site 5 was frozen from November
to February of the study period.
~mper?tur~.--Water temperature was recorded at each
sampling station in degrees centigrade.
Turbiditr.--Turbidity was measured using the coloimeter
in a Hach model DR-EL Portable Water Engineer's Laboratory.
Turbidity .was expressed in Jackson Turbidity Units (JTU)
as a measure of the intensity of light scattered by
particles suspended in the water.
Water chemistry.--The pH was tested using a Sargent-Welch
pH meter. All other chemical tests were run following
standard methods (Amer. Public Health Assoc., 1971) using
a Hach Model DR-EL Portable Water Engineer's Laboratory.
Tests were run for the levels of dissolved oxygen, carbon
dioxide, nitrate, ortho and meta phosphate, silica, cal-
31
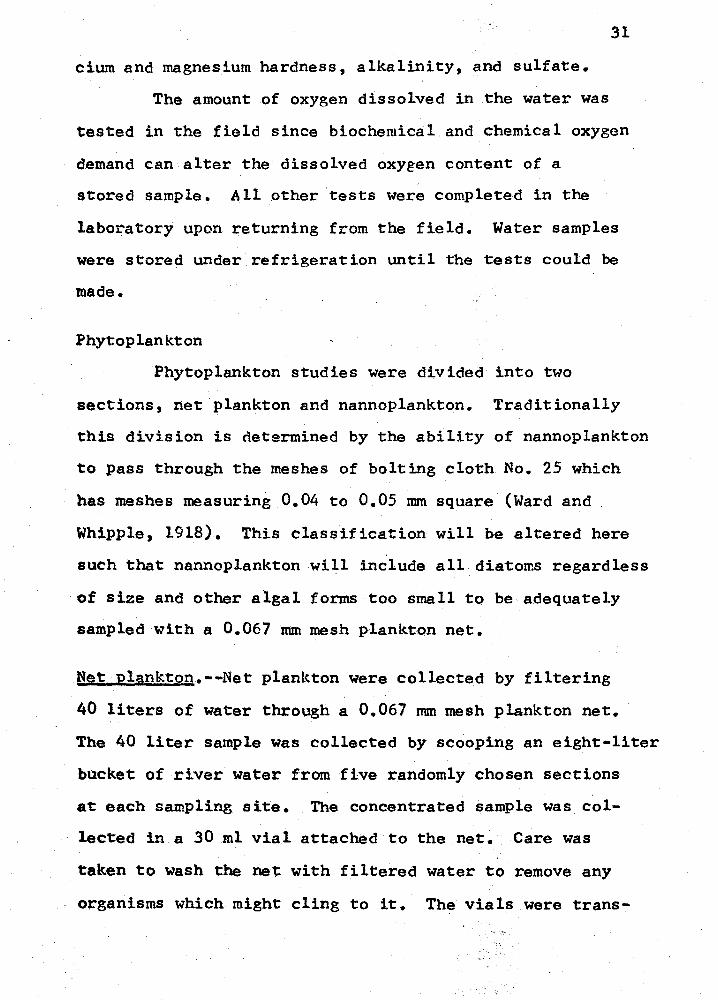
ciurn and magnesium hardness, alkalinity, and sulfate.
The amount of oxygen dissolved in the water was
tested in the field since biochemical and chemical oxygen
demand can alter the dissolved oxygen content of a
stored sample. All other ·tests were completed in the
laboratory upon returning from the field. Water samples
were stored under refrigeration until the tests could be
made.
Phytoplankton
Phytoplankton studies were d~vided into two
sections, net plankton and nannoplankton. Traditionally
this division is determined by the ability of nannoplankton
to pass through the meshes of bolting cloth No. 25 which
has meshes measuring 0.04 to 0.05 mm square (Ward and .
Whipple, 1918). This classification will be altered here
such that nannoplankton will include all diatoms regardless
of size and other algal forms too small to be adequately
sampled with a 0.067 mm mesh plankton net.
tiftt plankton.-•Net plankton were collected by filtering
40 liters of water through a 0.067 mm mesh plankton net.
The 40 liter sample was collected by scooping an eight-liter
bucket of river water from five randomly chosen sections
at each sampling site. The concentrated sample was col-
lected in a 30 ml vial attached to the net. Care was
taken to wash the net with filtered water to remove any
organisms which might cling to it. The vials were trans-
32
ported to the laboratory where net plankton were examined
and enumerated. Since it was possible to count net plank-
ton soon after returning to the laboratory, preservatives
were not used on these algae.
The 40 liter quantitative sample (Clark, 1958)
is similar to the plankton pump method described by Ward
and Whipple (1918). This method is superior to plankton
net tows used by Kofoid (1908), Allen (1920), and others
since a known volume of water is filtered and the chance
of error from an uncertain amount of water passing through
the plankton net is eliminated.
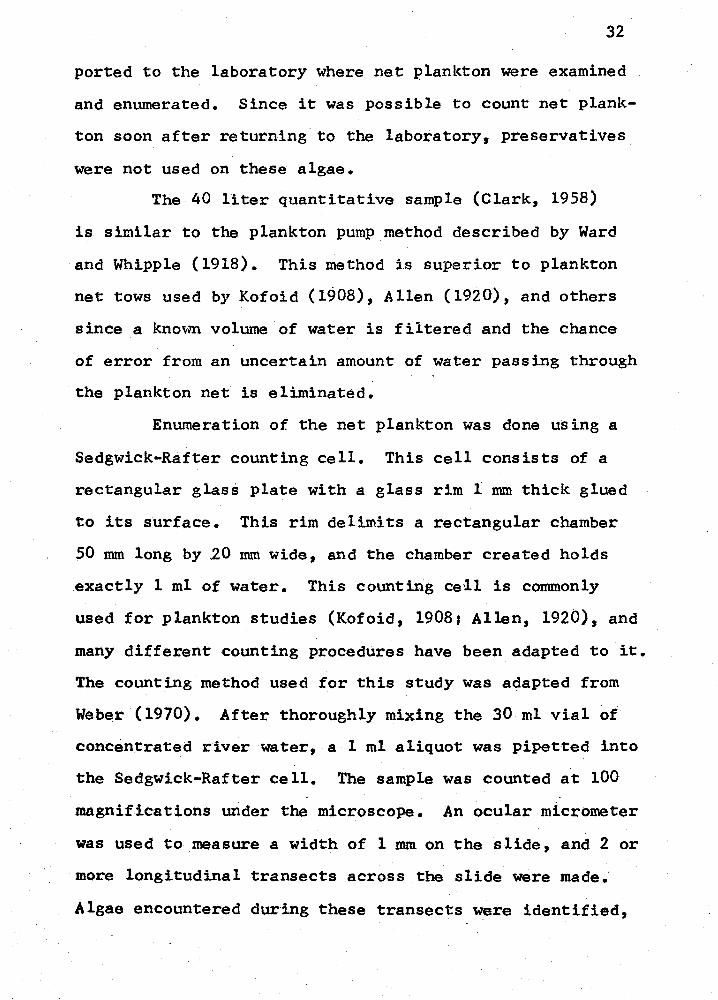
Enumeration of the net plankton was done using a
Sedgwick-Rafter counting cell. This cell consists of a
rectangular glass plate with a glass rim 1 mm thick glued
to its surface. This rim delimits a rectangular chamber
50 mm long by 20 mm wide, and the chamber created holds
exactly 1 ml of water. This counting cell is commonly
used for plankton studies (Kofoid, 19081 Allen, 1920), and
many different counting procedures have been adapted to it.
The counting method used for this study was adapted from
Weber (1970). After thoroughly mixing the 30 ml vial of
concentrated river water, a 1 ml aliquot was pipetted into
the Sedgwick-Rafter cell. The sample was counted at 100
magnifications under the microscope. An ocular micrometer
was used to measure a width of 1 mm on the slide, and 2 or
more longitudinal transects across the slide were made;
Algae encountered during these transects were identified,
33
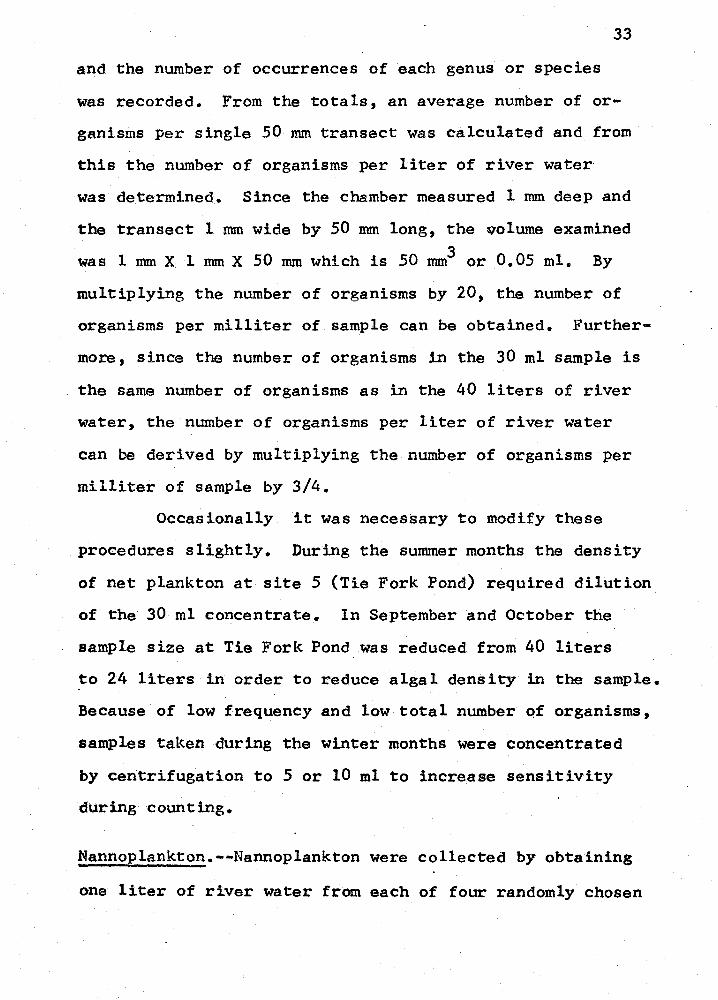
and the number of occurrences of each genus or species
was recorded. From the totals, an average number of or-
ganisms per single 50 mm transect was calculated and from
this the nu.~ber of organisms per liter of river water
was determined. Since the chamber measured 1 mm deep and
the transect 1 mm wide by 50 mm long, the qolume examined
was 1 mm X 1 mm X 50 mm which is 50 mm3 or 0.05 ml. By
multiplying the number of organisms by 20, the number of
organisms per milliter of sample can be obtained. Further-
mo:ce, since the number of organisms in the 30 ml sample is
the same number of organisms as in the 40 liters of river
water, the number of organisms per liter of river water
can be derived by multiplying the number of organisms per
milliter of sample by 3/4.
Occasionally .. it was necessary to modify these
procedures slightly. During the summer months the density
of net plankton at site 5 {Tie Fork Pond) required dilution
of the 30 ml concentrate. In September and October the
sample size at Tie Fork Pond was reduced from 40 liters
to 24 liters in order to reduce algal density in the sample.
Because of low frequency and low total number Qf organisms,
samples taken during the winter months were concentrated
by centrifugation to 5 or 10 ml to increase sensitivity
during counting.
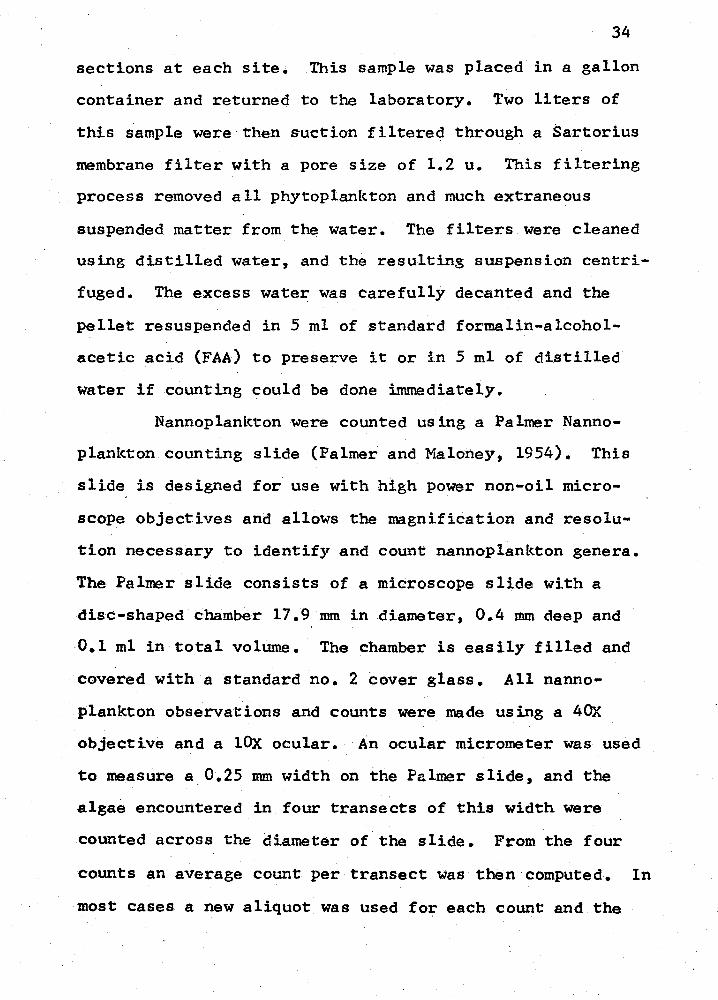
Nannoplankton.--Nannoplankton were collected by obtaining
one liter of river water from each of four randomly chosen
34
sections at each site. This sample was placed in a gallon
container and returned to the laboratory. Two liters of
this sample were then suction filtered through a Sartorius
membrane filter with a pore size of 1.2 u. This filtering
process removed all phytoplankton and much extraneous
suspended matter from the water. The filters were cleaned
using distilled water, and the resulting suspension centri-
fuged. The excess water was carefully decanted and the
pellet resuspended in 5 ml of standard formalin-alcohol-
acetic acid (FAA) to preserve it or in 5 ml of distilled
water if counting could be done immediately.
Nannoplankton were counted using a Palmer Nanno-
plankton counting slide (Palmer and Maloney, 1954). This
slide is designed for use with high power non-oil micro-
scope objectives and allows the magnification and resolu-
tion necessary to identify and count nannoplankton genera.
The Palmer slide consists of a microscope slide with a
disc-shaped chamber 17.9 mm in diameter, 0.4 mm deep and
0.1 ml in total volume. The chamber is easily filled and
covered with a standard no. 2 cover glass. All nanno-
plankton observations and counts were made using a 40X
objective and a lOX ocular. An ocular micrometer was used
to measure a 0.25 mm width on the Palmer slide, and the
algae encountered in four transects of this width were
counted across the diameter of the slide. From the four
counts an average count per transect was then computed. In
most cases a new aliquot was used for each count and the
samples were always thoroughly mixed before the aliquot
was taken to maximize the chances for uniform distribu-
tion of the suspended organisms.
35
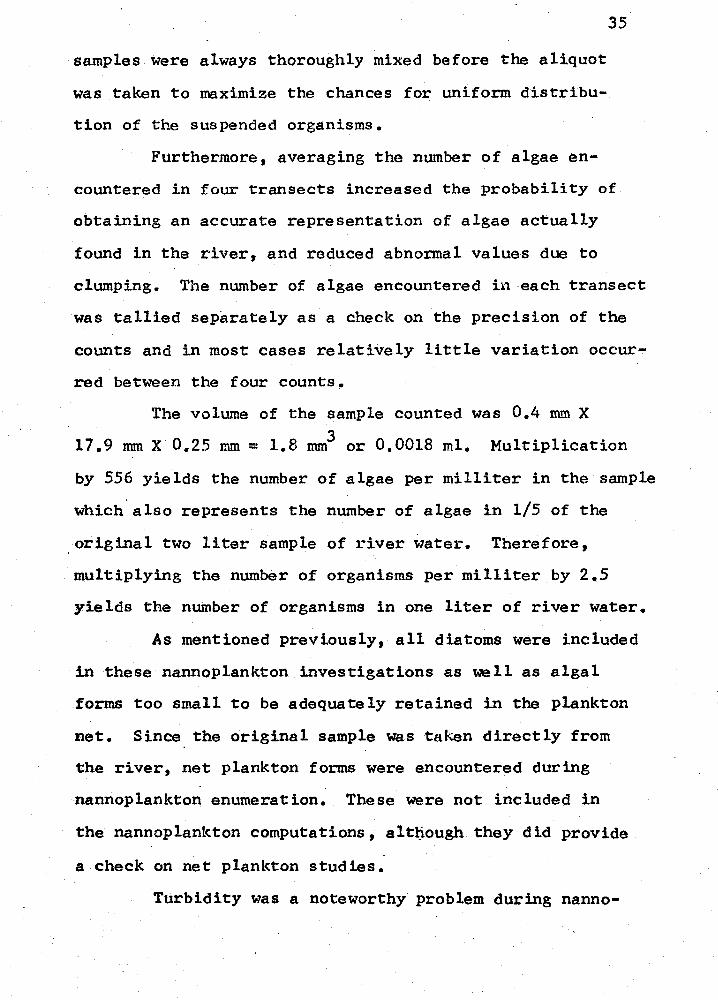
Furthermore, averaging the number of algae en-
countered in four transects increased the probability of
obtaining an accurate representation of algae actually
found in the river, and reduced abnormal values due to
clumping. The number of algae encountered iu -each transect
was tallied separately as a check on the precision of the
counts and in most cases relatively little variation occur-
red between the four counts.
The volume of the sample counted was 0.4 mm X 3 17.9 mm X 0.25 mm= 1.8 mm or 0.0018 ml. Multiplication
by 556 yields the number of algae per milliter in the sample
which also represents the number of algae in 1/5 of the
original two liter sample of river water. Therefore,
multiplying the number of organisms per milliter by 2.5
yields the number of organisms in one liter of river water.
As mentioned previously, all diatoms were included
in these nannoplankton investigations as well as algal
forms too small to be adequately retained in the plankton
net. Since the original sample was taken directly from
the river, net plankton forms were encountered during
nannoplankton enumeration. These were not included in
the nannoplankton computations, altpough they did provide
a check on net plankton studies.
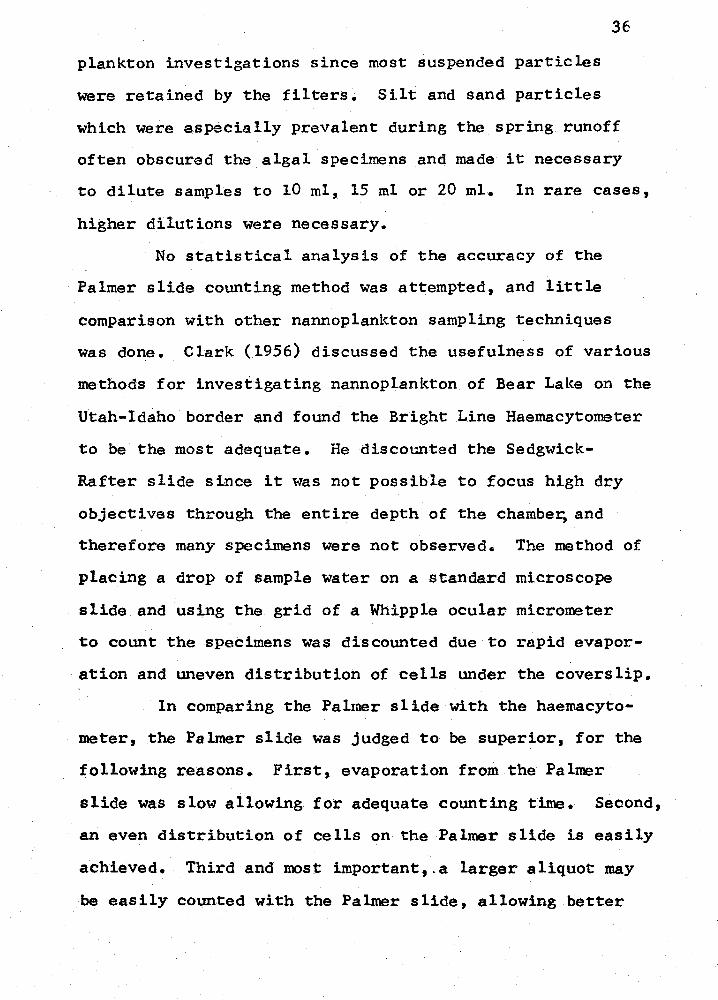
Turbidity was a noteworthy problem during nanno-
36
plankton investigations since most suspended particles
were retained by the filters. Silt and sand particles
which were especially prevalent during the spring runoff
often obscured the algal specimens and made it necessary
to dilute samples to 10 ml, 15 ml or 20 ml. In rare cases,
higher dilutions were necessary.
No statistical analysis of the accuracy of the
Palmer slide counting method was attempted, and little
comparison with other nannoplankton sampling techniques
was done. Clark (1956) discussed the usefulness of various
methods for investigating nannoplankton of Bear Lake on the
Utah-Idaho border and found the Bright Line Haemacytometer
to be the most adequate. He discounted the Sedgwick-
Rafter slide since it was not possible to focus high dry
objectives through the entire depth of the chambe~ and
therefore many specimens were not observed. The method of
placing a drop of sample water on a standard microscope
slide and using the grid of a Whipple ocular micrometer
to count the specimens was discounted due to rapid evapor-
ation and uneven distribution of cells under the coverslip.
In comparing the Palmer slide with the haemacyto-
meter, the Palmer slide was judged to be superior, for the
following reasons. First, evaporation from the Palmer
slide was slow allowing for adequate counting time. Second,
an even distribution of cells on the Palmer slide is easily
achieved. Third and most important,.a larger aliquot may
be easily counted with the Palmer slide, allowing better
representation of the sample and higher sensitivity in
counting.
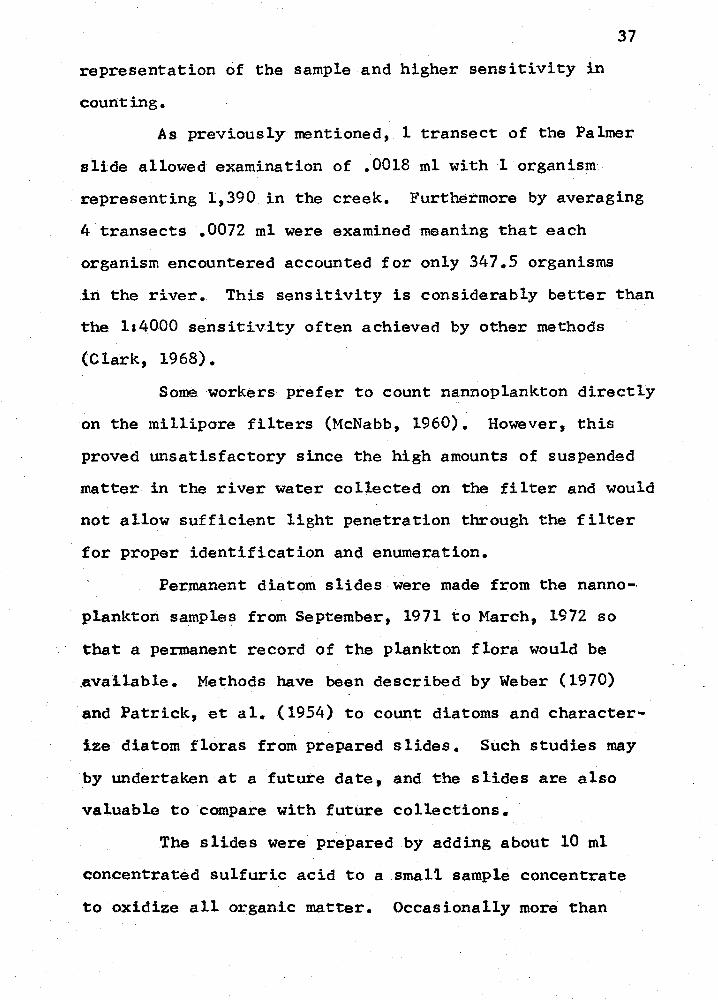
37
As previously mentioned, 1 transect of the Palmer
slide allowed examination of .0018 ml with 1 organism.
representing 1,390 in the creek. Furthermore by averaging
4 transects .0072 ml were examined meaning that each
organism encountered accounted for only 347.5 organisms
in the river. This sensitivity is considerably better than
the 114000 sensitivity often achieved by other methods
(Clarl(, 1968).
Some workers prefer to count nannoplankton directly
on the millipore filters (McNabb, 1960). However, this
proved unsatisfactory since the high amounts of suspended
matter in the river water collected on the filter and would
not allow sufficient light penetration through the filter
for proper identification and enumeration.
Permanent diatom slides were made from the nanno-
plankton samples from September, 1971 to March, 1972 so
that a permanent record of the plankton flora would be
.available. Methods have been described by Weber ( 1970)
and Patrick, et al. (1954) to count diatoms and character-
ize diatom floras from prepared slides. Such studies may
by undertaken at a future date, and the slides are also
valuable to compare with future collections.
The slides were prepared by adding about 10 ml
concentrated sulfuric acid to a small sample concentrate
to oxidize all organic matter. Occasionally more than
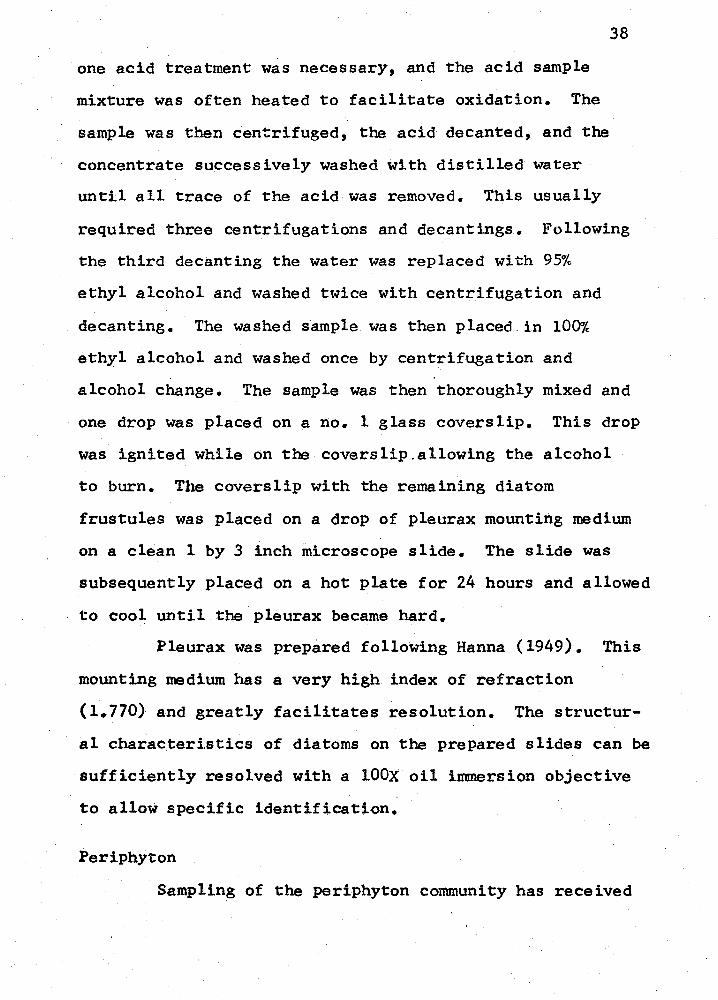
one acid treatment was necessary, and the acid sample
mixture was often heated to facilitate oxidation. The
sample was then centrifuged, the acid decanted, and the
concentrate successively washed with distilled water
38
until all trace of the acid was removed. This usually
required three centrifugations and decantings. Following
the third decanting the water was replaced with 95%
ethyl alcohol and washed twice with centrifugation and
decanting. The washed sample was then placed.in 100%
ethyl alcohol and washed once by centrifugation and
alcohol change. The sample was then thoroughly mixed and
one drop was placed on a no. 1 glass coverslip. This drop
was ignited while on the coverslip.allowing the alcohol
to burn. The coverslip with the remaining diatom
frustules was placed on a drop of pleurax mounting medium
on a clean 1 by 3 inch microscope slide. The slide was
subsequently placed on a hot plate for 24 hours and allowed
to cool until the pleurax became hard.
Pleurax was prepared following Hanna (1949). This
mounting medium has a very high index of refraction
(1.770) and greatly facilitates resolution. The structur-
al characteristics of diatoms on the prepared slides can be
sufficiently resolved with a lOOX oil immersion objective
to allow specific identification.
Periphyton
Sampling of the periphyton community has received
39
the attention of many workers during the past few years,
and as a result many variations in sampling methods have
been attempted. Sladeckova (1962) summarized techniques
and materials that have been developed in periphyton work.
The trend of recent years has been to sub100rge artificial
substrates at study sites to obtain both a qualitative
and quantitative concept of periphyton communities from
studying the algae which become attached to these sub-
strates. Materials such as wood, slate, concrete,
asbestos, asbestos cement, various sheetmetals, plastics,
celluloid, styrofoam and glass have been used. However,
smooth glass is most widely used and has given accurate
results.· Patrick, et al. (1954) found that by using glass
slides for sampling periphyton they were able to sample
75-85% of all species obtained by other collections, and
95% of those species with more than eight individuals per
sample. Dor (1970) compared glass slides with basalt and
limestone substrates in Lake Tiberia in Israel and found
that production on slides was 73% of that produced on
natural substrates. Odum (1957) found that succession of
algae when inhabiting glass slides was similar to that on
Sagittaria •Plants. • In general, Whitford and Schumacher
(1963) found.that colonization on glass slides was similar
to that of rock substrates although somewhat different from
colonization observed on living plants.
Under certain conditions glass may be surpassed by
.~·tyrofoam as a colonization substrate for periphyton
40
studies, especially of diatoms. Hohn and Hellerman (1963)
found that at 16° and 25° C both substrates gave repre-
sentative colonies but at at 3° C diatom species diversity
on the glass was reduced as much as 40 per cent while the
styrofoam continued to support a representative flora.
However, Dillard (1966) reported glass to have higher
diatom populations at both high and low temperatures.
The means of attaching slides to the substrate has
also resulted in the development of many devices. Butcher
(1932), who did a pioneer river study using glass slides
to sample periphyton, used a frame attached to the river
bed to support his slides. Patrick, et al. (1954) developed
a special apparatus for holding slides in the water which
they called the Catherwood Diatometer. This apparatus
consists of a plastic rack with attached floats so it can be
suspended at desired depths in the water. Slides are placed
vertically in the rack which allows diatoms to colonize
the slides and concurrently reduces silt deposition.
Weber and Raschke(l970) described a similar apparatus with
~tyrofoam floats as a standard periphyton sampler for
pollution surveillance. In Huntington Creek the current
is extremely swift during run?ff and quite low in the
summer and fall. In ad~ition, the ~tream and canyon are
heavily used by campers, picnickers, and fishermen, and a
periphyton sampling device such as described above is
impractical.
Consideration has also been given to the length of
41
time the slides should be left in the water. Patrick,
131= al. (1954) found two weeks to be optimu.'ll since by that
time diatom diversity had been established, and longer
periods allowed for excessive silt and debris deposition.
Newcombe (1949) on the other hand suggested 25 days to be
the optimum time period. Patrick, tl 511. (1954) found that
the accumulation of debris and other organisms on the
slides over a long time period made them less favorable
for diatom growth and the more adapted species actually
crowded others out. However, a longer time period allows
dominant species to become well established on the
slides and this may actually be an advantage in aiding an
understanding of relationships between periphyton and the
periphyton influenced plankton assemblages.
Newcombe (1949) discussed the advantages of vertical
placemer1t of the slides versus horizontal placement claim-
· 1ng the latter to be best since production was higher and
the results more reproducable. However, Hohn and Heller-
man (1963) reported no appreciable difference due to
slide placement, and since silt accumulation on horizontal
slides presents a problem, vertical placement is often
· used. Periphyton slides in the present study were oriented
both horizontally and vertically, and no appreciable
difference in silt accumulation or diatom populations was
observed.
Periphyton sampling techniques used in the present
study were similar to those used by Whitford and
42
Schumacher ( 1963). Clean 1 by 3 inch microscope slides
were fastened to a length of copper or stainless steel
wire by means of black electrician's tape. The slides
were then secured in the river by fastening the wire to
submerged sticks, large stones, or other convenient
objects. Generally, the slides were allowed to drift
(reely in the current. Four slides were placed · in the
water at each site monthly and retrieved the following
month. Both sides of the slides were cleaned with dis-
,, tilled water in the laboratory, and the attached algae
were preserved in 10 ml of FAA until counting could be
done. Samples were counted using a Palmer counting
slide, and procedures similar to those used in counting
nannoplankton were followed except that all algal forms
encountered were identified and recorded.
In computing the algal totals an average number
of individuals per transect across the 17.9 mm diameter
of the Palmer slide was made from four individual counts
as was done in enumerating the nannoplankton. A conversion
~actor of 556 gave the number of organisms per milliliter
which was multiplied by the dilution of the concentrate,
and which represented the number of organisms on the slide.
This number was then divided by the area in square centi-
meters of the exposed slide to give the numbers of
individuals per square centimeter. This counting method was
used since it is the most precise commonly used method
(Sladeckova, 1962), and it also correlated with the
43
nannoplankton procedures thus allowing the establishment
of accurate relationships between periphyton and plankton
assemblages.
Difficulty was often encountered due to excessive
silt deposition on the slide which apparently was entrapped
by the mucilage secreted by the algae. Dilutions beyond
10 mls were often necessary for accurate counting although
dilutions were kept as low as possible~
Data presented from periphyton studies were
obtained from counts on slides taken as much as possible
from one specific location at each site. These data
characterize the general periphyton flora of the area but
certainly are not representative of every available eco-
logical condition. Slides submerged at site 1 were suspended
in slow evenly flowing water. Those at site 3 were in deep
fast-flowing water. Slides from site 4 were in a deep
bole where the water was quiet, and in a shallow riffle,
and those from site 6 were in a shallow riffle. Slides
from the pond (site 5) were submerged just below the water
surface in still water.
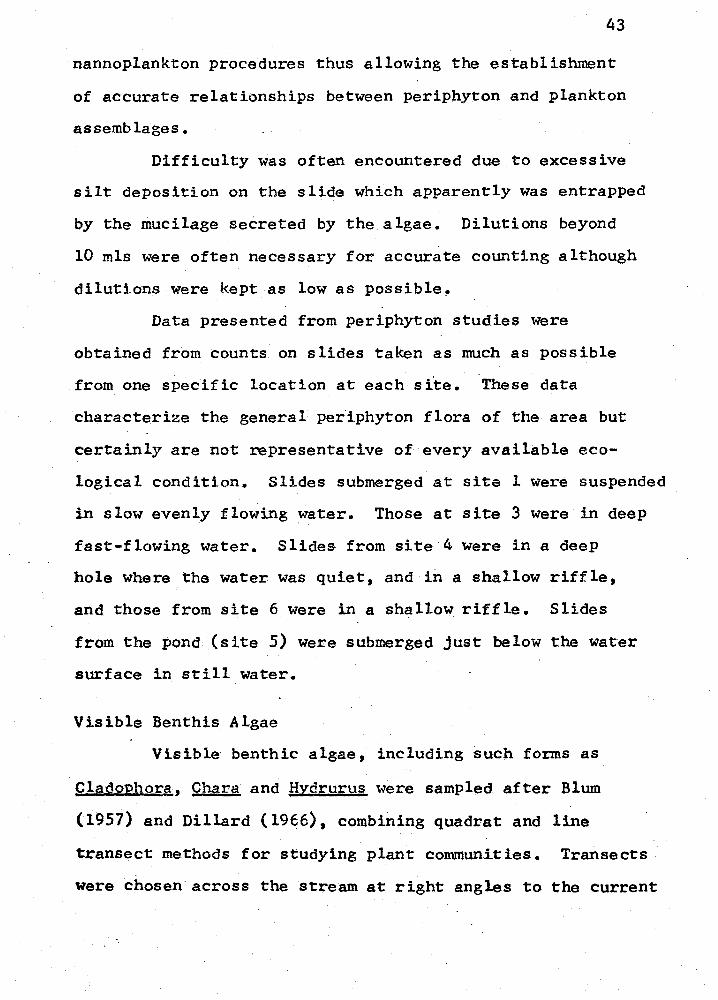
Visible Benthis Algae
Visible benthic algae, including such foons as
Cladophor~, Chara and Hvdrurus were sampled after Blum
(1957) and Dillard (1966), combining quadrat and line
transect methods for studying plant communities. Transects
were chosen across the stream at right angles to the current
44
flow in areas displaying average growth conditions.
The per cent coverage of the substrate _by each genus
encountered was estimated in alternating 10 cm by 25 cm
plots along this transect. Macroscopic benthic algae were
always most abundant in riffles, and so one or more
representative transects of a riffle were taken at each
study site •. At sites 1 and 2 slow water also supported
significant algal growths. Transects were run in these
slow water areas as well as in riffles at these sites, and
the results were averaged to give a figure representative
of the site as a whole.
From data gathered it was possible to calculate
cover, composition, and frequency of each genus on the
stream substrate. The frequency per cent for each genus
was obtained by dividing the total number of quadrats in
the transect into those quadrats in which each genus
occurred by assignin~ coverage classes (Daubenmire, 1968)
to the estimation of each ·genus recorded in the field and
then averaging the midpoints of these coverage classes.
From the cover percentage the per cent composition of the
total community represented by each genus was determined
by dividing the total cover into the cover of each genus
and multiplying by 100.
This method of estimating cover in each quadrat
gave more accurate information than Blum's (1957) method
of only recording the presence or absence of a species
45
beneath the plots.
Where the water was deep and swift this sampling
method was not applicable. Turbid waters also hindered
·its use although a glass jar submerged in the water en-
hanced visibility in the shallow water where most visible
benthic algae occurred. During the first few months a
microscope was taken into the field for identifying the
algae encountered. However with experience it, became
possibl~ to visually determine the algae present.
Floristic Sampling
Samples were taken from rocks, twigs, sand and
macroscopic vegetation at fourteen sites along the creek.
Seven of these sites corresponded with the seven quantita-
tive sites, and the other sites.represented ponds, back-
waters and other areas where algae were found growing.
Floristic sampline began in October, 1970 and continued
throughout the study. The algae in these samples were
identified to species in.the laboratory. Samples of many
filamentous algae were preserved in FAA solution, and
permanent diatom slides were made using the method described
in the section on phytoplankton.
46
RESULTS AND DISCUSSION
Each site in this study was chosen to represent
a unique ecological habitat. Consequently, each site was
studied with the view in mind to characterize the complete
algal community and ecological parameters found under each
set of conditions. The following discussion therefore
treats the algology and ecology of each site of the study
area.
Lawrence (site 1)
The algal flora at Lawrence is dominated by
macroscopic species including Cladophora glomeratA,
Oedogonium §.l2.• and Chara vulgaris and by many diatom genera.
Cladophora glomerata was first recorded from floristic
samples in April 1971. By May it was prevalent. among the
rocks on the stream bottom. The first quantitative sample
in June showed this alga to cover 35% of the stream bottom
in riffle areas. The second sample in June showed a peak
development of ~. glomerata when it covered 43% of the
riffle substrate.as long deep green streamers from the
stones.
~. glomerata declined sharply through July and by
-the end of the month was represented in large measure by
stubby basal portions of the plant. These fragments
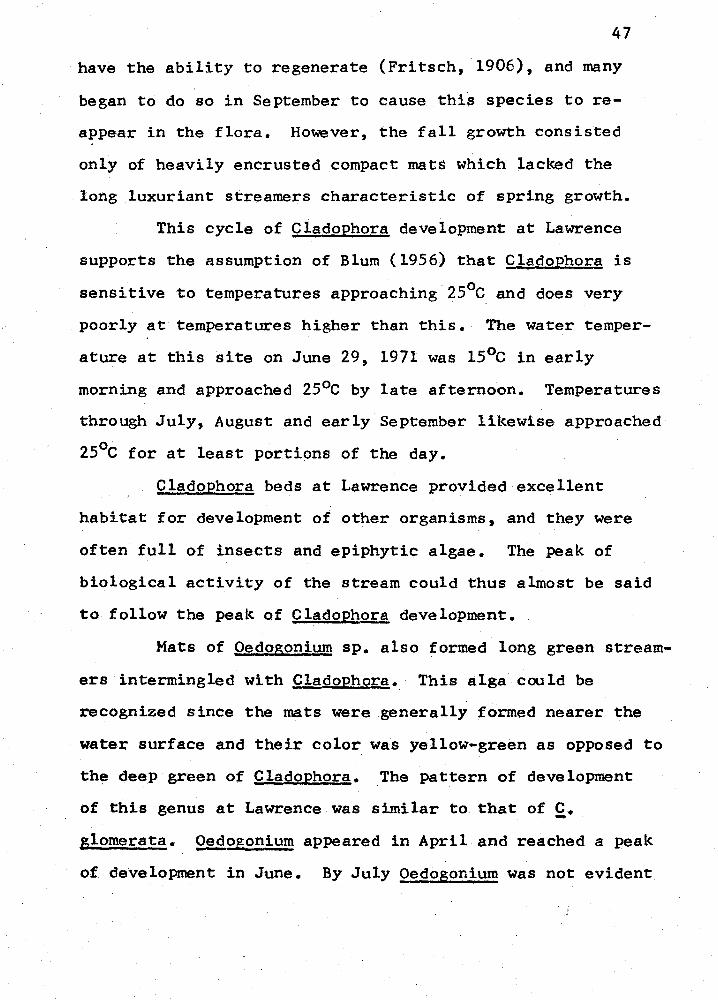
47
have the ability to regenerate (Fritsch, 1906), and many
began to do so in September to cause thfs species to re-
appear in the flora. However, the fall growth consisted
only of heavily encrusted compact mats which lacked the
long luxuriant streamers characteristic of spring growth.
This cycle of Cladophora development at Lawrence
supports the assumption of Blum (1956) that Cladophora is
sensitive to temperatures approaching·2s 0 c and does very
poorly at temperatures higher than this. The water temper-
ature at this site on June 29, 1971 was 15°c in early
morning and approached 25°c by late afternoon. Temperatures
through July, August and early September likewise approached
25°c for at least portions of the day.
Clado_phor~ beds at Lawrence provided excellent
habitat for development of other organisms, and they were
often full of insects and epiphytic algae. The peak of
biological activity of the stream could thus almost be said
to follow the peak of Cladophora development.
Mats of Oedogonium sp. also formed long green stream-
ers intermingled with Cladopho~. This alga could be
recognized since the mats were generally formed nearer the
water surface and their color was yellow-green as opposed to
the deep green of Cladophora. The pattern of development
of this gerius at Lawrence was similar to that of c. -glomerata. Oedogonium appeared in April and reached a peak
of development in June. By July Oedo~onium was not evident
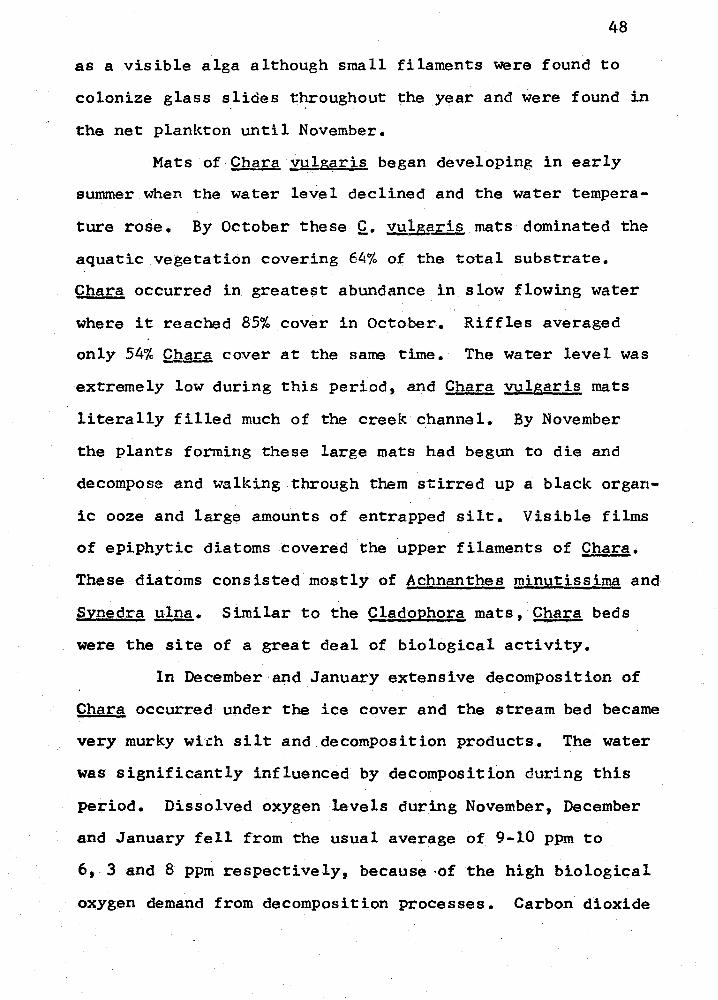
48
as a visible alga although small filaments were found to
colonize glass slides throughout the year and were found in
the net plankton until November.
Mats of Qbara yulgaris began developing in early
summer when the water level declined and the water tempera-
ture rose. By October these Q. vulg~ris mats dominated the
aquatic vegetation covering 64% of the total substrate.
Chara occurred in greatest abundance in slow flowing water
where it reached 85% cover in October. Riffles averaged
only 54% £hara cover at the same time. The water level was
extremely low during this period, and Chara vulgaris mats
literally filled much of the creek channel. By November
the plants forming these large mats had begun to die and
decompose and walking through them stirred up a black organ-
ic ooze and large amounts of entrapped silt. Visible films
of epiphytic diatoms covered the upper filaments of Chara.
These diatoms consisted mostly of Achnanthes minutissima and
Synedra Y.!na. Similar to the Cladophora mats, Chara beds
were the site of a great deal of biological activity.
In December and January extensive decomposition of
Chara occurred under the ice cover and the stream bed became
very murky wh:h silt and decomposition products. The water
was significantly influenced by decomposition during this
period. Dissolved oxygen levels during November, December
and January fell from the usual average of 9-10 ppm to
6, 3 and 8 ppm respectively, because •of the high biological
oxygen demand from decomposition processes. Carbon dloxide
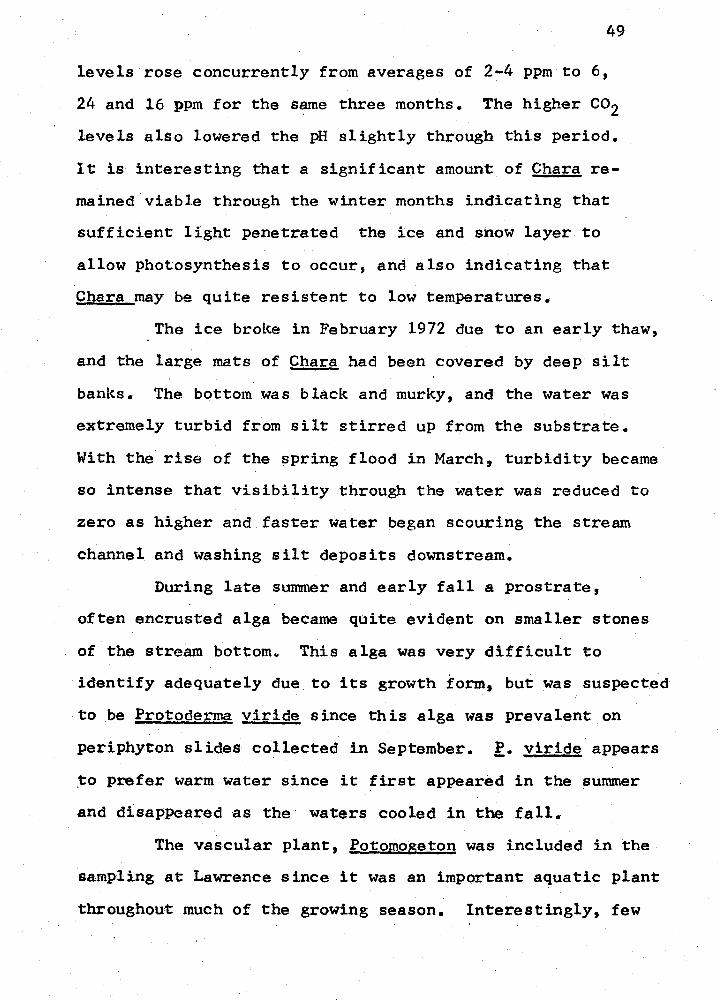
49
levels rose concurrently from averages of 2-4 ppm to 6,
24 and 16 ppm for the same three months. The higher co2 levels also lowered the pH slightly through this period.
It is interesting that a significant amount of Chara re-
mained viable through the winter months indicating that
sufficient light penetrated the ice and snow layer to
allow photosynthesis to occur, and also indicating that
Chara may be quite resistant to low temperatures.
The ice broke in February 1972 due to an early thaw,
and the large mats of Chara had been covered by deep silt
banks. The bottom was black and murky, and the water was
extremely turbid from silt stirred up from the substrate.
With the rise of the ~pring flood in March, turbidity became
so intense that visibility through the water was reduced to
zero as higher and faster water began scouring the stream
channel and washing silt deposits downstream.
During late summer and early fall a prostrate,
often encrusted alga became quite evident on smaller stones
of the stream bottom. This alga was very difficult to
identify adequately due to its growth form, but was suspected
to be Protoderrna viride since this alga was prevalent on
periphyton slides collected in September. P. viride appears . -
~o prefer warm water since it first appeared in the summer
and disappeared as the· waters cooled in the fall.
The vascular plant, fotomogeton was included in the
sampling at Lawrence since it was an important aquatic plant
throughout much of the growing season. Interestingly, few
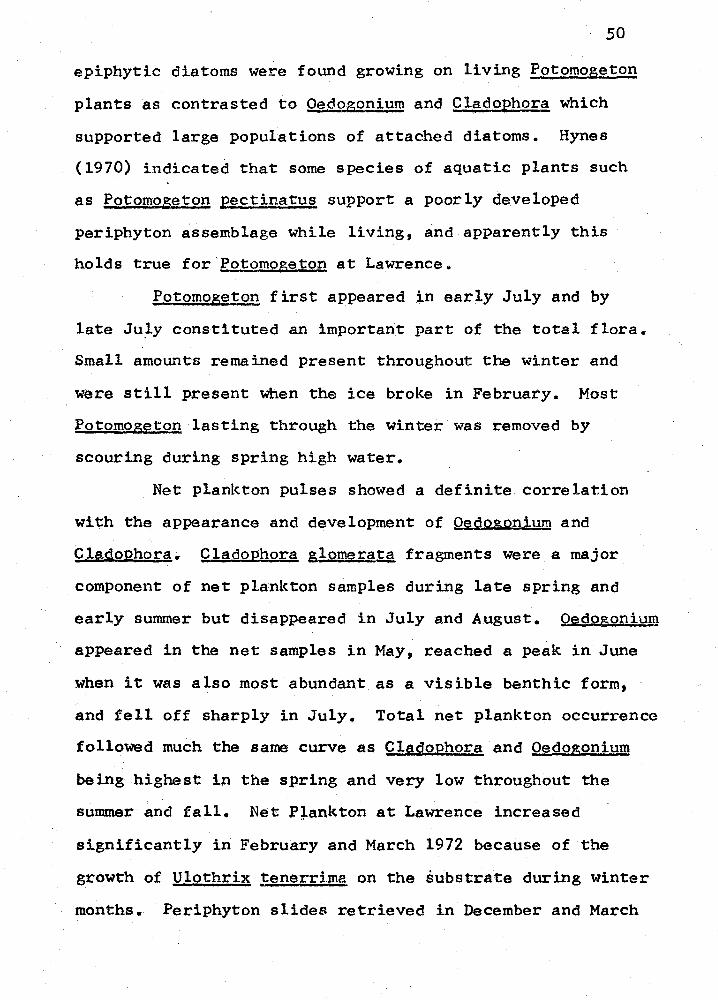
50
epiphytic diatoms were found growing on living Potomogeton
plants as contrasted to Oedogonium and Cladol?hora which
supported large populations of attached diatoms. Hynes
(1970) indicated that some species of aquatic plants such
as Potomogeton pectinatus support a poorly developed
periphyton assemblage while living, and apparently this
holds true for Potomoge'\;:sUl at Lawrence.
Potomog~ton first appeared in early July and by
late Ju~y constituted an important part of the total flora.
Small amounts remained present throughout the winter and
were still present when the ice broke in February. Most
P2tomogeton lasting through the winter was removed by
scouring during spring high water.
Net plankton pulses showed a definite correlation
with the appearance and development of O~gogonium and
Cladophora. CladoJ2hora glomera!sl fragments were a major
component of net plankton samples during late spring and
early summer but disappeared in July and August. Qedogonium
appeared in the net samples in May, reached a peak in June
when it was also most abundant as a visible benthic form,
and fell off sharply in July. Total net plankton occurrence
followed much the same curve as £ladophora and Q§_dogpnium
being highest in the spring and very low throughout the
summer and fall. Net Piankton at Lawrence increased
significantly in February and March 1972 because of the
growth of Ulothrix tenerrima on the substrate during winter
months. Periphyton slides retrieved in December and March
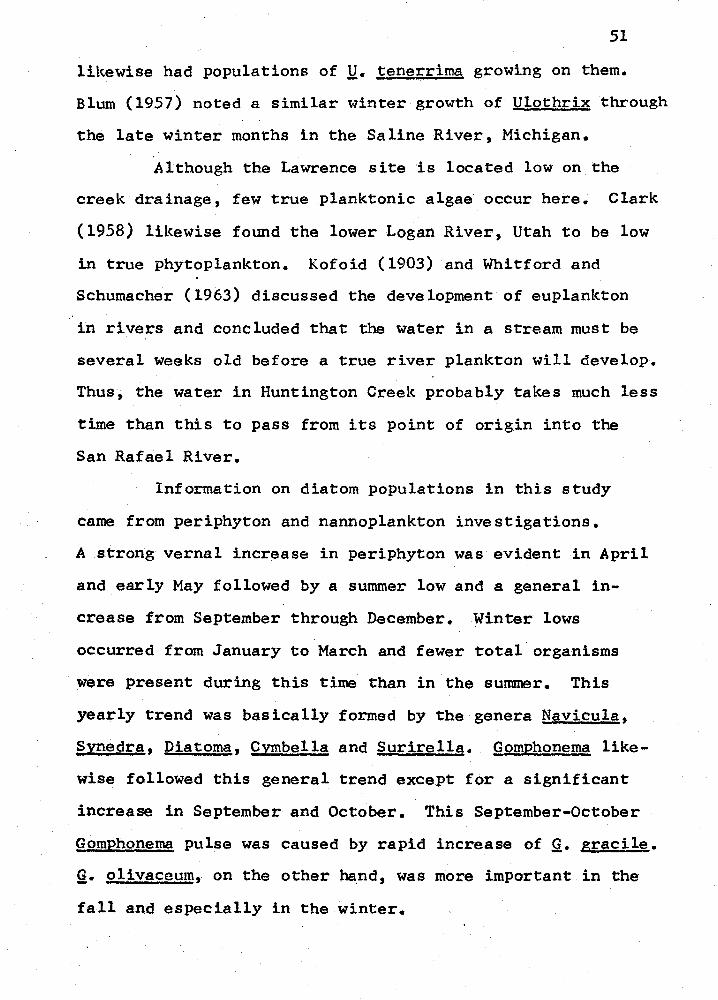
51
likewise had populations of !l,. tenerrima growing on them.
Blum (1957) noted a similar winter growth of Ulothrix through
the late winter months in the Saline River, Michigan.
Although the Lawrence site is located low on the
creek drainage, few true planktonic algae occur here. Clark
(1958) likewise found the lower Logan River, Utah to be low
in true phytoplankton. Kofoid (1903) and Whitford and
Schumacher (1963) discussed the development of euplankton
in rivers and concluded that the water in a stream must be
several weeks old before a true river plankton will develop.
Thus, the water in Huntington Creek probably takes much less
time than this to pass from its point of origin into the
San Rafael River.
Information on diatom populations in this study
came from periphyton and nannoplankton investigations.
A strong vernal increase in periphyton was evident in April
and early May followed by a summer low and a general in-
crease from September through December. Winter lows
occurred from January to March and fewer total organisms
were present during this time than in the summer. This
yearly trend was basically formed by the genera Navicula,
Sy:pedr~, Diatoma, C:vmbella and Surirella. QomEhonerrlJ!. like-
wise followed this general trend except for a significant
increase in September and October. This September-October
Gomphonema pulse was caused by rapid increase of Q. gracile.
Q. olivaceum, on the other hand, was more important in the
fall and especially in the winter.
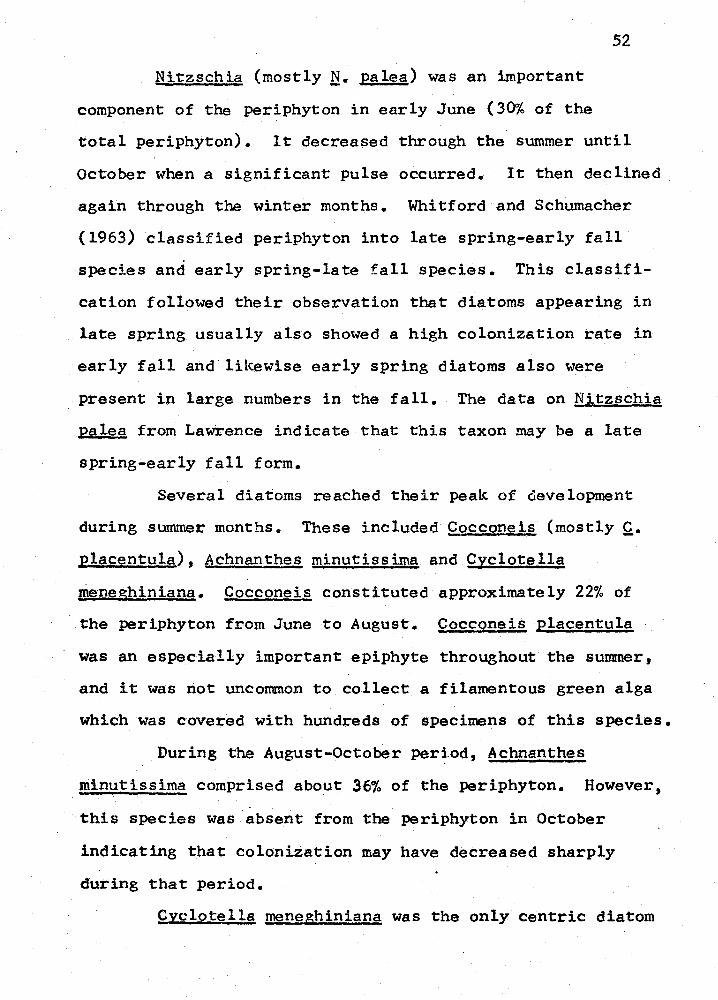
Nitzschia (mostly N- Ealea) was an important
component of the periphyton in early June (30% of the
52
total periphyton). It decreased through the summer until
October when a significant pulse occurred. It then declined
again through the winter months. Whitford and Schumacher
(1963) classified periphyton into late spring-early fall
species and early spring-late fall species. This classifi-
cation followed their observation that diatoms appearing in
late spring usually also showed a high colonization rate in
early fall and likewise early spring diatoms also were
present in large numbers in the fall. The data on Nitzschia
palea from Lawrence indicate that this taxon may be a late
spring-early fall form.
Several diatoms reached their peak of clevelopment
during summer months. These included Qgccopeis (mostly£.
placentula), Achnanthes minutissima and Cyclotella
rneneghiniana. Cocconeis constituted approximately 22% of
the periphyton from June to August. Cocconeis Elacentula
was an especially important epiphyte throughout the sunnner,
and it was riot uncommon to collect a filamentous green alga
which was covered with hundreds of specimens of this species.
During the August-October peri.od, Achnanthes
minutissima comprised about 36% of the periphyton. However,
this species was absent from the periphyton in October
indicating that colonization may have decreased sharply
during that period.
gyclotella meneghiniana was the only centric diatom
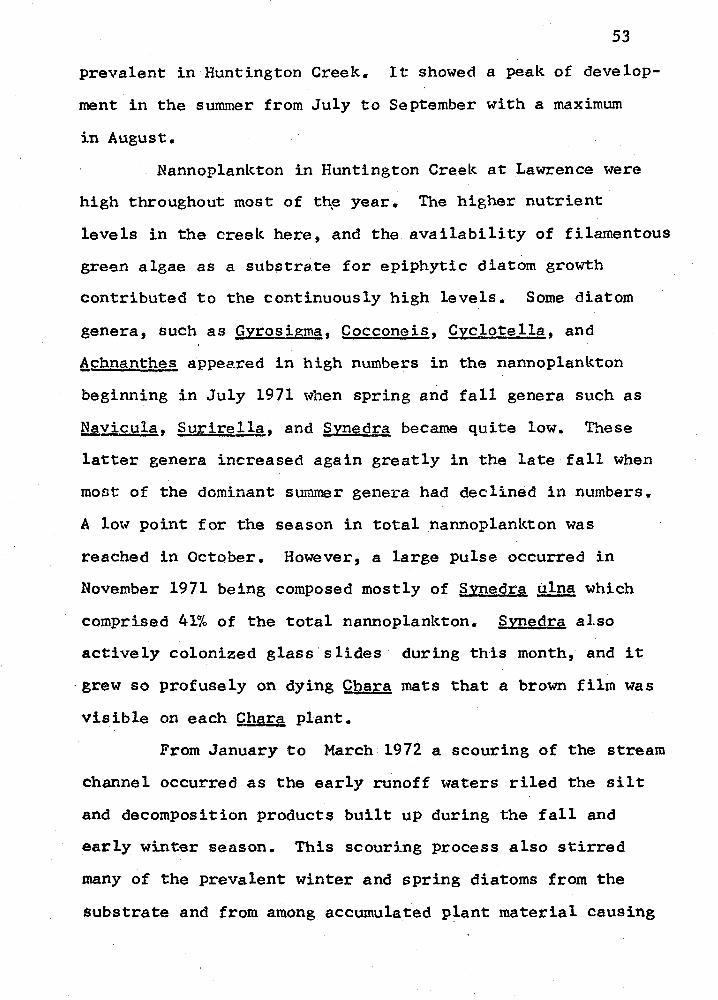
53
prevalent in Huntington Creek. It showed a peak of develop-
ment in the summer from July to September with a maximum
in August.
Nannoplankton in Huntington Creek at Lawrence were
high throughout most of th~ year. The higher nutrient
levels in the creek here, and the availability of filamentous
green algae as a sub~trate for epiphytic diatom growth
contributed to the continuously high levels. Some diatom
genera, such as Gyrosigma, Cocconeis, Cyc,lotella, and
Achnanthes appeared in high numbers in the nannoplankton
beginning in July 1971 when spring and fall genera such as
~vicula, ~urirella, and §ynedr~ became quite low. These
latter genera increased again greatly in the late fall when
most of the dominant summer genera had declined in numbers.
A low point for the season in total nannoplankton was
reached in October. However, a large pulse occurred in
November 1971 being composed mostly of Synedra ulna which
comprised 41% of the total nannoplankton. Syn{'dr§ also
actively colonized glass·slides· during this month, and it
-grew so profusely on dying Chara mats that a brown film was
visible on each gb~U plant.
From January to March 1972 a scouring of the stream
channel occurred as the early runoff waters riled the silt
and decomposition products built up during the fall and
early winter season. This scouring process also stirred
many of the prevalent winter and spring diatoms from the
substrate and from among accumulated plant material causing
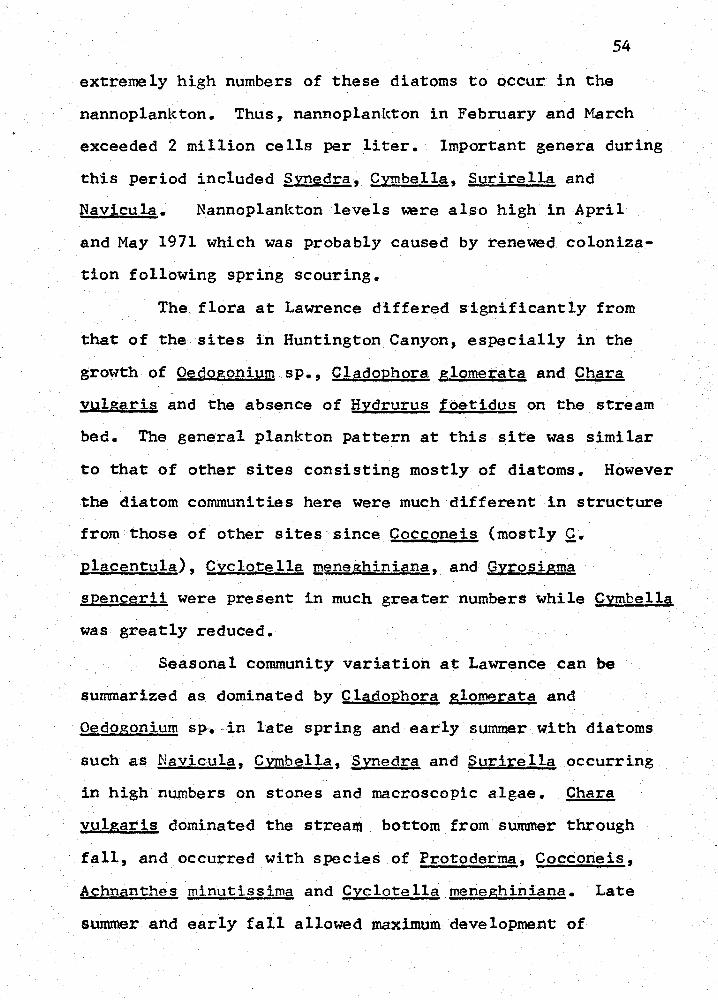
54
extremely high numbers of these diatoms to occur in the
nannoplank.ton. Thus~ nannoplankton in February and March
exceeded 2 million cells per liter. Important genera during
this period included Synedra, Qymbella, Surirella and
Navicula. Nannoplankton levels ~re also high in April
and May 1971 which was probably caused by renewed coloniza-
tion following spring scouring.
The flora at Lawrence differed significantly from
that of the sites in Huntington Canyon, especially in the
growth of O~dogonium sp., Cladophora glomerata and Chara
vulgaris and the absence of Hydrurus foetidus on the stream
bed. The general plankton pattern at this site was similar
to that of other sites consisting mostly of diatoms. However
the diatom communities here were much different in structure
from those of other sites since Cocconeis (mostly Q. £lacentula), Cyclotell~ meneghiniana, and Gyrosigma
spencerii were present in much greater numbers while Cvmbella
was greatly reduced.
Seasonal community variation at Lawrence can be
summarized as dominated by Cladophora glomerata and
O!i?_dogonium sp-.-in late spring and early summer.with diatoms
such as Navicula, Cymbella, Synedra and Surirella occurring
in high numbers on stones and macroscopic algae. Chara
vulgaris dominated the stream bottom from summer through
fall, and occurred with species of Protoderma, Cocconeis,
Achnanthes minutissima and Cyclotella meneghiniana. Late
summer and early fall allowed maximum development of
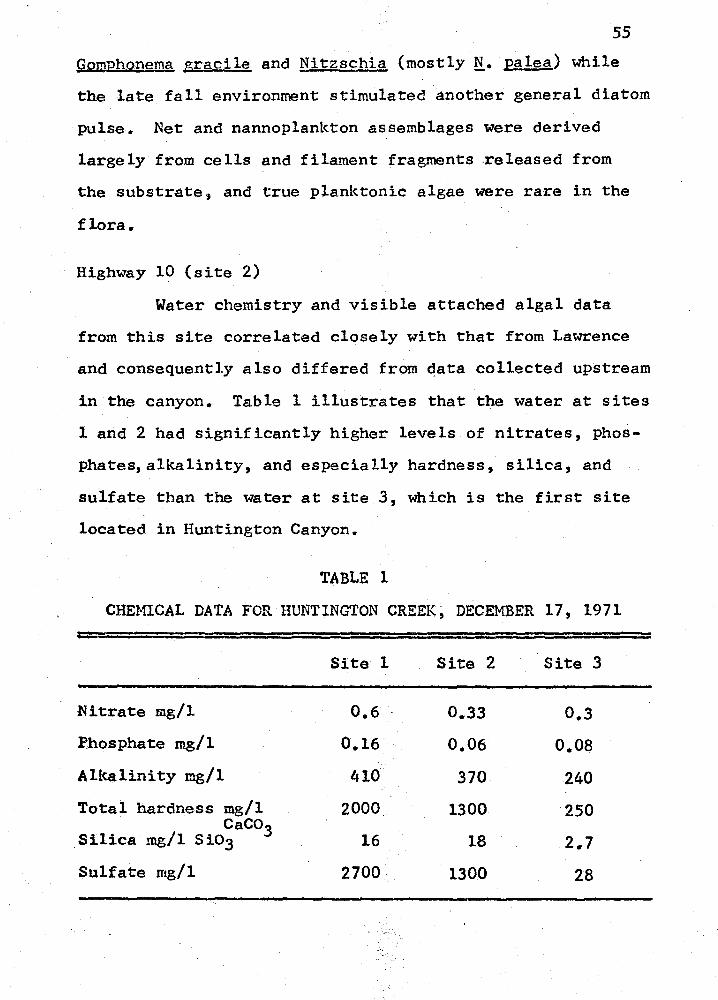
55 ~orophonema gracile and Nitzschia (mostly N. Ealea) while
the late fall environment stimulated another general diatom
pulse. Net and nannoplankton assemblages were derived
largely from cells and filament fragments released from
the substrate, and true planktonic algae were rare in the
flora.
Highway 10 (site 2)
Water chemistry and visible attached algal data
from this site correlated closely with that from Lawrence
and consequently also differed from data collected upstream
in the canyon. Table 1 illustrates that the water at sites
land 2 had significantly higher levels of nitrates, phos-
phates,alkalinity, and especially hardness, silica, and
sulfate than the water at site 3, which is the first site
located in Huntington Canyon.
TABLE l
CHEMICAL DATA FOR HUNTINGTON CREEK, DECEMBER 17, 1971
Site 1 Site 2 Site 3
Nitrate mg/1 0.6 0.33 0.3 Phosphate mg/1 0.16 0.06 0.08
Allcalinity mg/1 410 370 240
Total hardness mg/1 2000 1300 250 . Silica mg/1
Caco 3 Si03 16 18 2.7 Sulfate mg/1 2700 1300 28
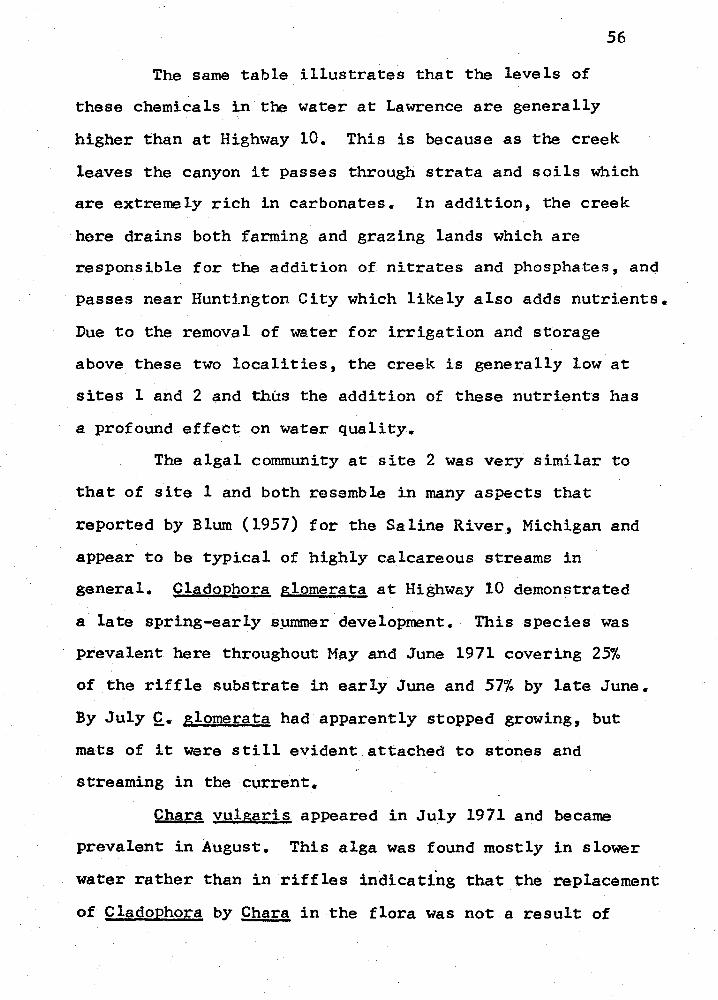
56
The same table illustrates that the levels of
these chemicals in the water at Lawrence are generally
higher than at Highway 10. This is because as the creek
leaves the canyon it passes through strata and soils which
are extremely rich in carbonates. In addition, the creek
here drains both farming and grazing lands which are
responsible for the addition of nitrates and phosphates, and
passes near Huntington City which likely also adds nutrients.
Due to the removal of water for irrigation and storage
above these two localities, the creek is generally low at
sites 1 and 2 and thus the addition of these nutrients has
a profound effect on water quality.
The algal community at site 2 was very similar to
that of site 1 and both resemble in many aspects that
reported by Blum (1957) for the Saline River, Michigan and
appear to be typical of highly calcareous streams in
general. CladoPhora glomerata at Highway 10 demonstrated
a late spring-early sµmmer development. This species was
prevalent here throughout May and June 1971 covering 25%
of the riffle substrate in early June and 57% by late June.
By July~- glomerata had apparently stopped growing, but
mats of it were still evident attached to stones and
streaming in the current.
Chara vulgaris appeared in July 1971 and became
prevalent in August. This alga was found mostly in slower
water rather than in riffles indicating that the replacement
of Cladophora by Chara in the flora was not a result of
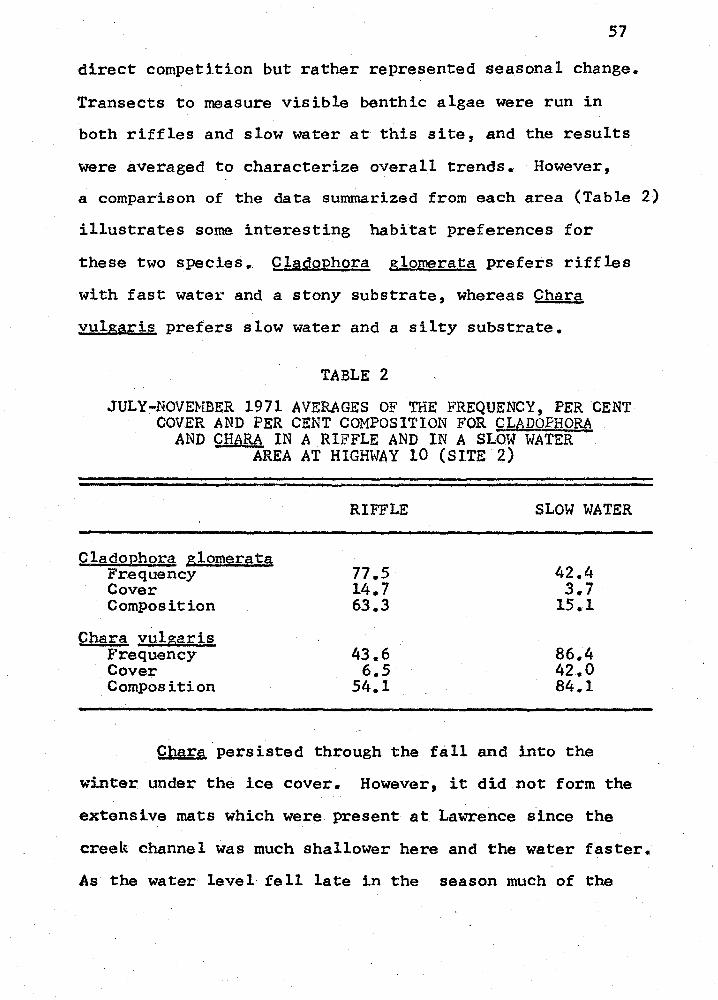
57
direct competition but rather represented seasonal change.
Transects to measure visible benthic algae were run in
both riffles and slow water at this site, and the results
were averaged to characterize overall trends .. However,
a comparison of the data summarized from each area (Table 2)
illustrates some interesting habitat preferences for
these two species. £ladophora g_lomera~a prefers riffles
with fast water and a stony substrate, whereas Chara
vulgaris prefers slow water and a silty substrate.
TABLE 2
JULY-NOVEMBER 1971 AVERAGES OF THE FREQUENCY, PER CENT COVER AND PER CENT COMPOSITION FOR CLbDOPHORA
AND CHARA IN A RIFFLE AND IN A SLOW WATER AREA AT HIGHWAY 10 (SITE 2)
Cladophora glomerata Frequency Cover Composition
Chara vulgari.§ :frequency Cover Composition
RIFFLE
77.5 14.7 63 .. 3
43.6 6.5
54.1
SLOW WATER
42.4 3.,7
15. l
86.4 42.0 84 .. 1
Chara persisted through the fall and into the
winter under the ice cover. However, it did not form the
extensive mats which were present at Lawrence since the
creek channel was much shallower here and the water faster.
As the water level fell late in the season much of the
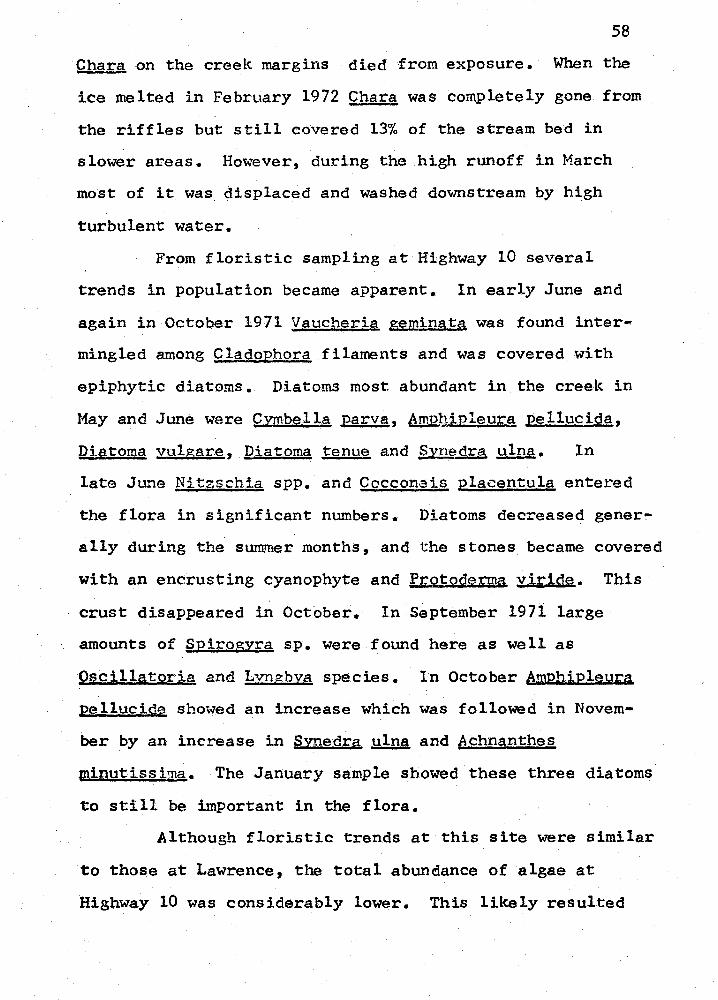
58
Chara on the creek margins died from exposure. When the
ice melted in February 1972 Chara was completely gone from
the riffles but still covered 13% of the stream bed in
slower areas. However, during the .high runoff in March
most of it was displaced and washed downstream by high
turbulent water.
From floristic sampling at Highway 10 several
trends in population became apparent. In early June and
again in October 1971 Vaucheria ~eminata was found inter-
mingled among Cladophora filaments and was covered with
epiphytic diatoms. Diatoms most abundant in the creek in
May and June were Cymbella parva, d!!.l!thipleur~ pellucida,
Diatoma vulgare, Diatoma tenue and §;y:nedra ~- In
late June Nitzschia spp. and Cocconais placentula entered
the flora in significant numbers. Diatoms decreased gener-
ally during the summer months, and the stones became covered
with an encrusting cyanophyte and Protggenna viride. This
crust disappeared in October. In September 197i large
amounts of Spirogyra sp. were found here as well as
Oscillatoria and Lyngbya species. In October a,mPhipleu~~
pellucide showed an increase which was followed in Novem-
ber by an increase in Synedra ulna and ~chnanthes
m,i.nutissima. The January sample showed these three diatoms
to still be important in the flora.
Although floristic trends at this site were similar
to those at Lawrence, the total abundance of algae at
Highway 10 was considerably lower. This likely resulted
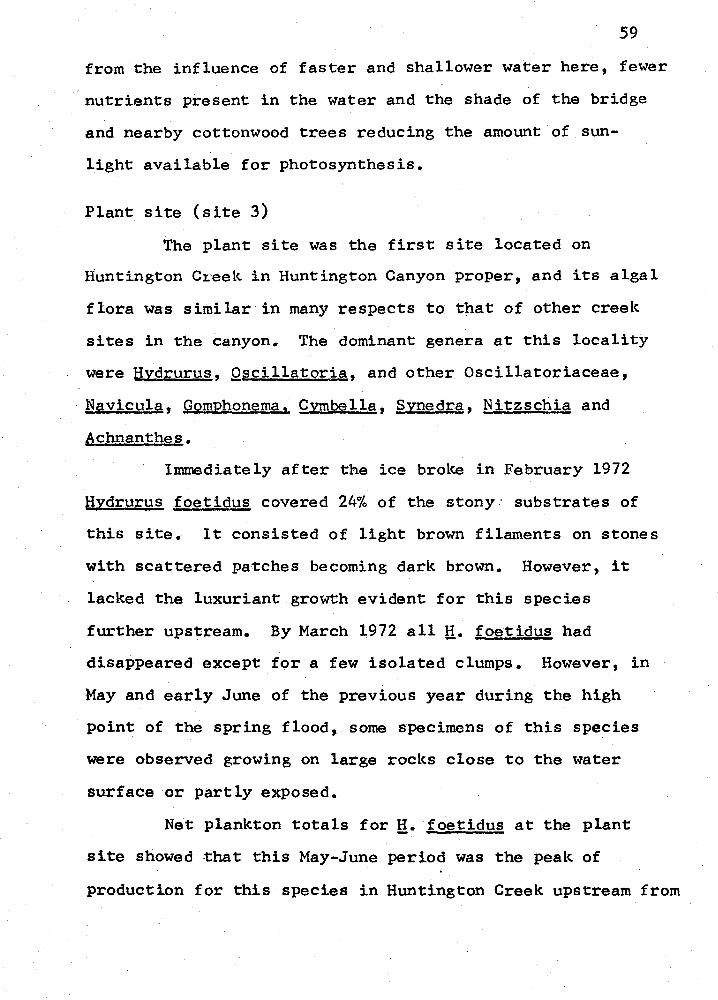
59
from the influence of faster and shallower water here, fewer
nutrients present in the water and the shade of the bridge
and nearby cottonwood trees reducing the amount of sun-
light available for photosynthesis.
Plant site (site 3)
The plant site was the first site located on
Huntington Creek in Huntington Canyon proper, and its algal
flora was similar in many respects to that of other creek
sites in the canyon. The dominant genera at this locality
were Hydrurus, Qscillatoria, and other Oscillatoriaceae,
Navicula, Gomphonema1 Qymbella, Sypedra, Nitzschia and
Achnanth~~-
lmmediately after the ice broke in February 1972
Hydrurus foetidus covered 24% of the stony· substrates of
this site. It consisted of light brown filaments on stones
with scattered patches becoming dark brown. However, it
lacked the luxuriant growth evident for this species
further upstream. By March 1972 all fi. foetidus had
disappeared except for a few isolated clumps. However, in
May and early June of the previous year during the high
point of the spring flood, some specimens of this species
were observed growing on large rocks close to the water
surface or partly exposed.
Net plankton totals for g. foetidus at the plant
site showed that this May-June period was the peak of
production for this species in Huntington Creek upstream from
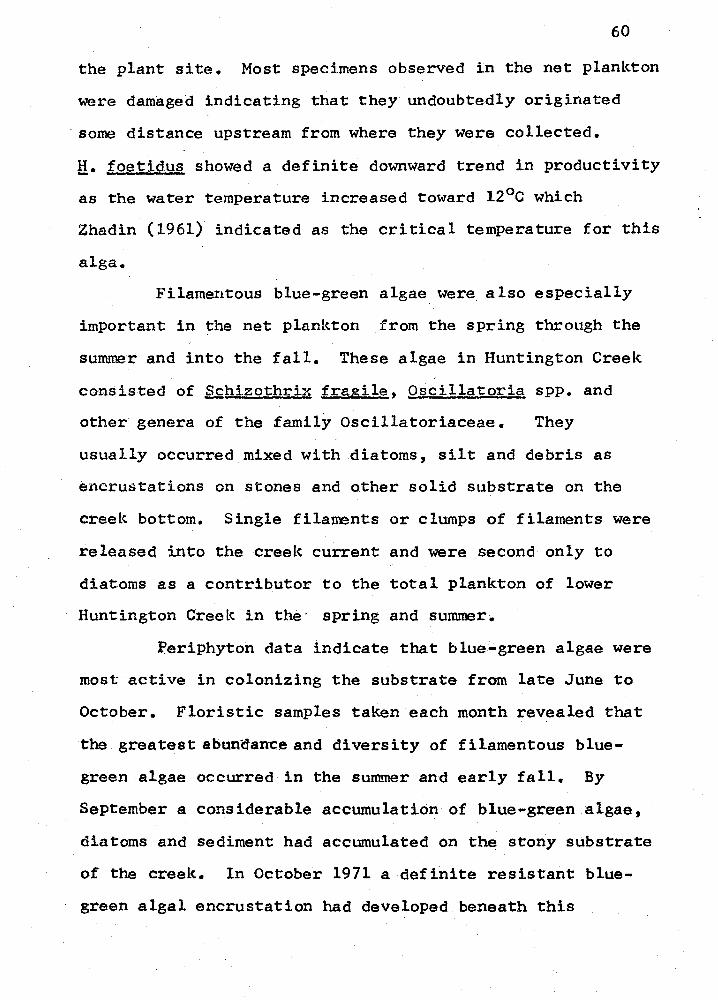
60
the plant site. Most specimens observed in the net plankton
were damaged indicating that they undoubtedly originated
some distance upstream from where they were collected.
fi. foetidus showed a definite downward trend in productivity
as the water temperature increased toward 12°c which
Zhadin (1961) indicated as the critical temperature for this
alga.
Filamentous blue-green algae. were also especially
important in the net plankton from the spring through the
summer and into the fall. These algae in Huntington Creek
consisted of Schizothrix fragile, Oscillatoria spp. and
other genera of the family Oscillatoriaceae. They
usually occurred mixed with diatoms, silt and debris as
encrustations on stones and other solid substrate on the
creek bottom. Single filaments or clumps of filaments were
released into the creek current and were second only to
diatoms as a contributor to the total plankton of lower
Huntington Creek in the· spring and summer.
Periphyton data indicate that blue-green algae were
most active in colonizing the substrate from late June to
October. Floristic samples taken each month revealed that
the greatest abunC,ance and diversity of filamentous blue-
green algae occurred in the summer and early fall. By
September a considerable accumulation of blue-green algae,
diatoms and sediment had accumulated on the stony substrate
of the creek. In October 1971 a definite resistant blue-
green algal encrustation had developed beneath this
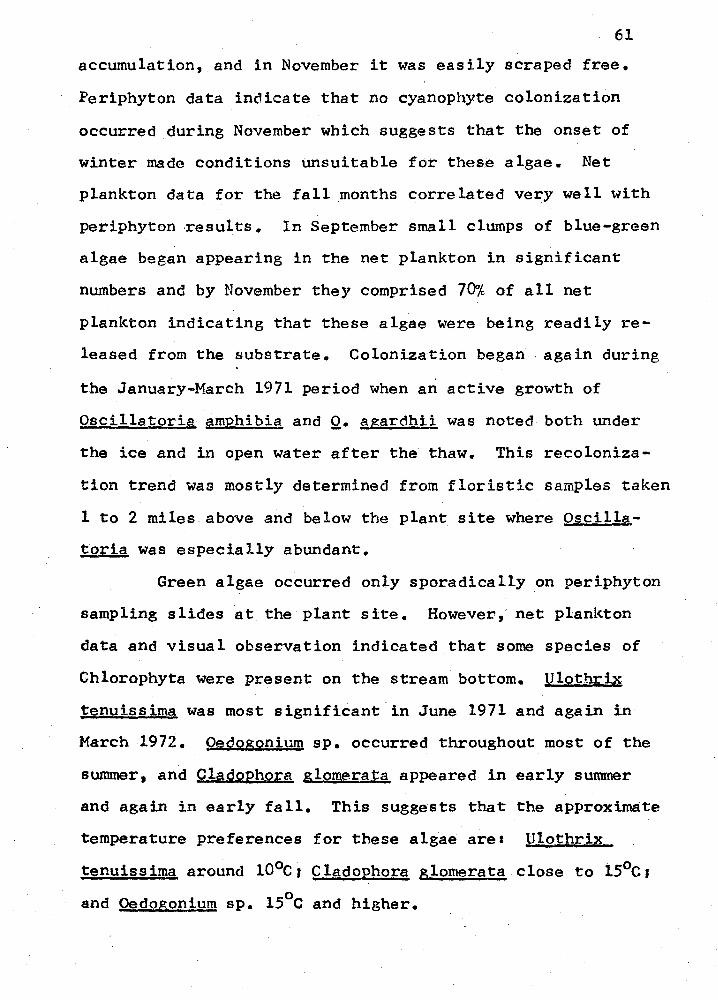
61
accumulation, and in November it was easily scraped free.
Periphyton data indicate that no cyanophyte colonization
occurred during November which suggests that the onset of
winter made conditions unsuitable for these algae. Net
plankton data for the fall months correlated very well with
periphyton ,results. In September small clumps of blue-green
algae began appearing in the net plankton in significant
numbers and by November they comprised 70% of all net
plankton indicating that these algae were being readily re-
leased from the substrate. Colonization began .. again during
the January-March 1971 period when an active growth of
Oscillatoria ~mphibi~. and Q. agardhii was noted both under
the ice and in open water after the thaw. This recoloniza-
tion trend was mostly determined from floristic samples taken
1 to 2 miles above and below the plant site where Oscill~-
toria was especially abundant.
Green algae occurred only sporadically on periphyton
sampling slides ·at the plant site. However, net plankton
data and visual observation indicated that some species of
Chlorophyta were present on the stream bottom. Ulothrix
t~nuissima was most significant in June 1971 and again in
March 1972. Oedogonium sp. occurred throughout most of the
summer, and Clagophora &!ornerata appeared in early summer
and again in early fall. This suggests that the approximate
temperature preferences for these algae area Ulothrix
tenuissima around 10°c, Cladophora glomerata close to 15°c, 0 and pedogonium sp. 15 C and higher.
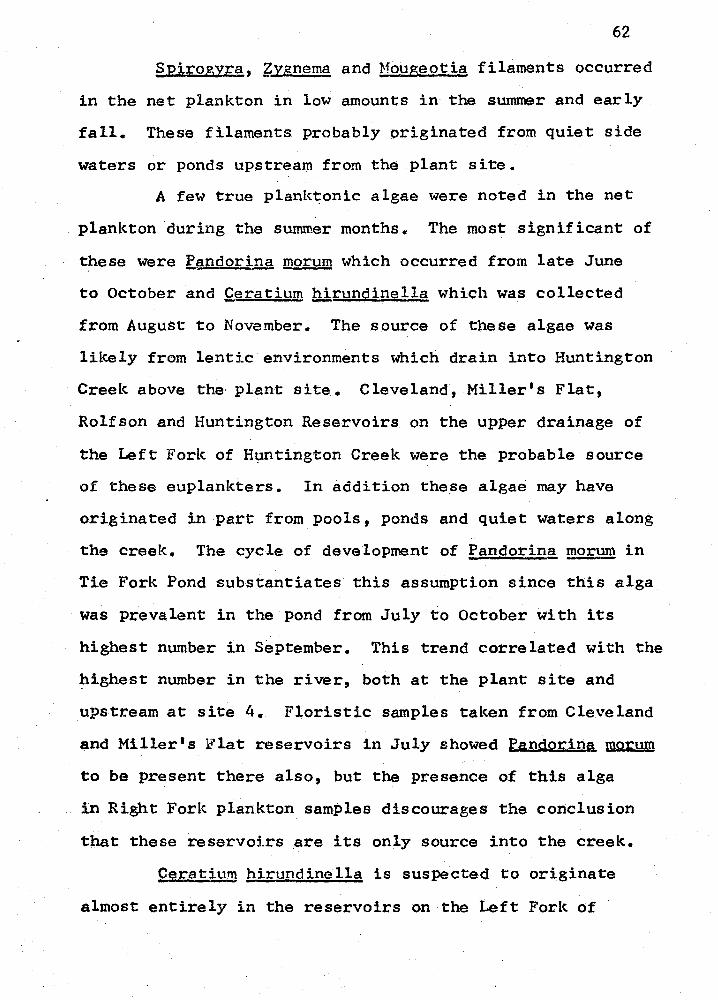
62
Spirogyra, &.Ygnema and :Mougeotia filaments occurred
in the net plankton in low amounts in the summer and early
fall. These filaments probably originated from quiet side
waters or ponds upstream from the plant site.
A few true planktonic algae were noted in the net
plankton during the summer months. The most significant of
these were fandorina morum which occurred from late June
to October and Qeratium !llrundinella which was collected
from August to November. The source of these algae was
likely from lentic environments which drain into Huntington
Creelc above the plant site. Cleveland, Miller's Flat,
Rolfson and Huntington Reservoirs on the upper drainage of
the Left Fork of Hµntington Creek were the probable source
of these euplankters. In addition these algae may have
originated in part from pools, ponds and quiet waters along
the creek. The cycle of development of Pandorina morum in
Tie Fork Pond substantiates this assumption since this alga
· was prevalent in the pond from July to October with its
highest number in September. This trend correlated with the
~ighest number in the river, both at the plant site and
upstream at site 4. Floristic samples taken from Cleveland
and Miller• s li'lat reservoirs in July showed fandorinA. morum
to be present there also, but the presence of this alga
in Right Fork plankton samples discourages the conclusion
that these reservotrs are its only source into the creek.
Ceratium hirundinella is suspected to originate
almost entirely in the reservoirs on the Left Fork of
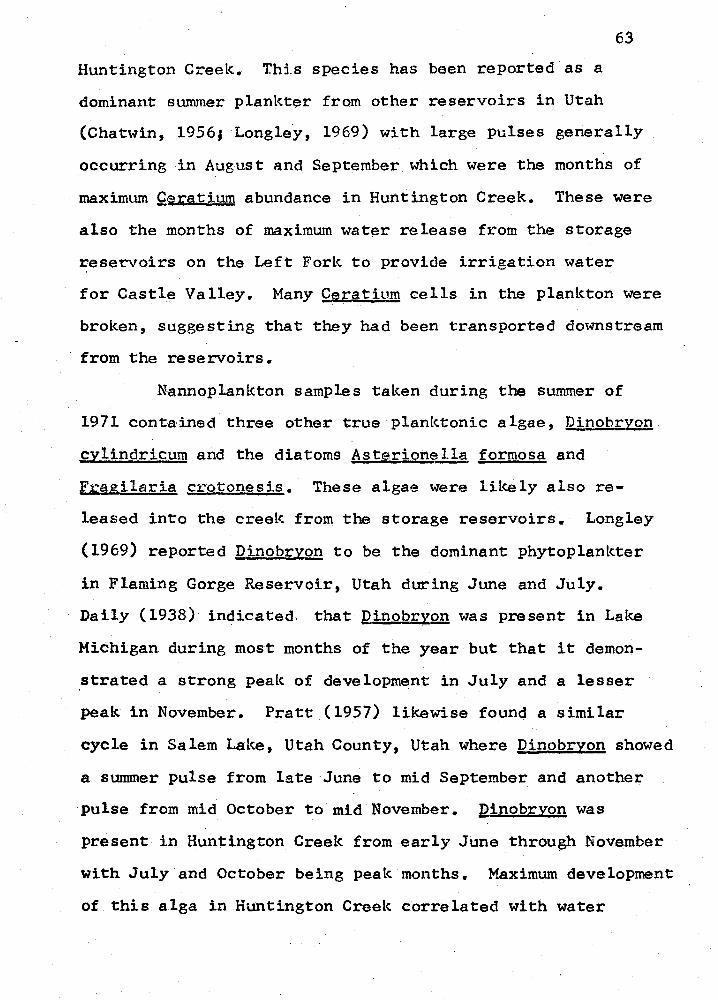
63
Huntington Creek. This species has been reported as a
dominant summer plankter from other reservoirs in Utah
(Chatwin, 1956; Longle·y, 1969) with large pulses generally
occurring in August and September which were the months of
maximum g~ratium abundance in Huntington Creek. These were
also the months of maximum water release from the storage
reservoirs on the Left Fork to provide irrigation water
for Castle Valley. Many Ce~atium cells in the plankton were
broken, suggesting that they had been transported downstream
from the reservoirs ..
Nannoplankton samples taken during the summer of
1971 contained three other true planktonic algae, Dinobryon
cylindricum and the diatoms Asterionella formosa and
Fragilaria crotonesis. These algae were likely also re-
leased into the creek from the storage reservoirs .. Longley
(1969) reported QinobryQ!! to be the dominant phytoplankter
in Flaming Gorge Reservoir, Utah during June and July.
Daily (1938) indicated. that ~inobryon was present in Lake
Michigan during most months of the year but that it demon-
strated a strong peak of development in July and a lesser
peak in November. Pratt (1957) likewise found a similar
cycle in Salem Lake, Utah County, Utah where ~inobryon showed
a summer pulse from late June to mid September and another
pulse from mid October to mid November. Dinobryon was
present in Huntington Creek from early June through November
with July and October being peak months. Maximum development
of this alga in Huntington Creek correlated with water
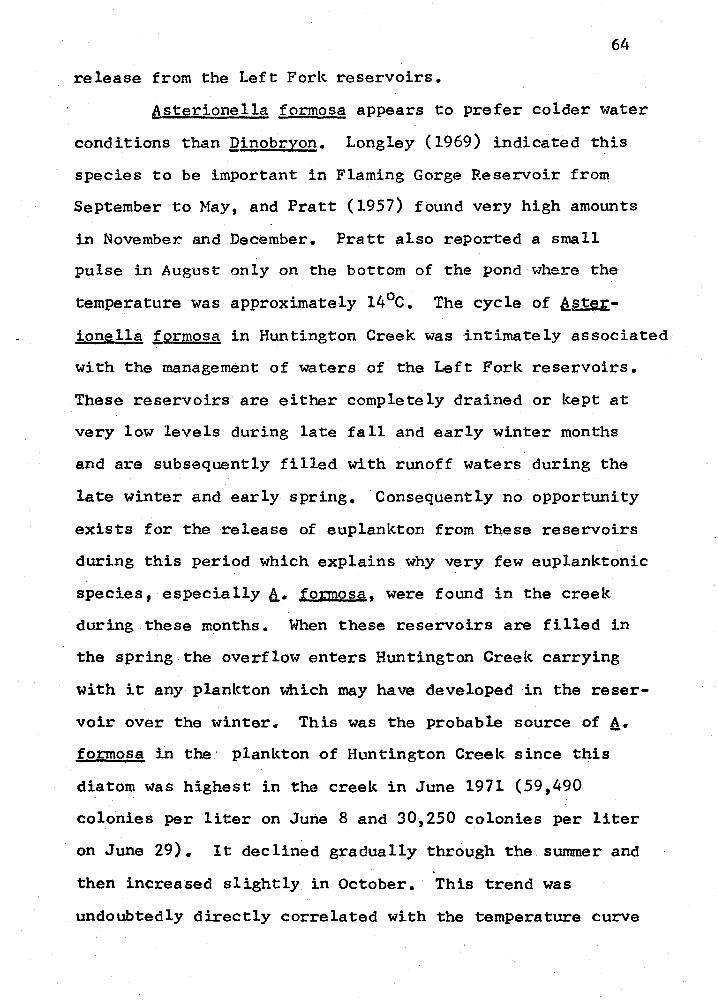
64
release from the Left Fork reservoirs.
Asterionella formosa appears to prefer colder water
conditions than Dinobryon. Longley (1969) indicated this
species to be important in Flaming Gorge Reservoir from
September to May, and Pratt {1957) found very high amounts
in November and December. Pratt also reported a small
pulse in August only on the bottom of the pond where the
temperature was approximately 14°c. The cycle of Aster-
ionella forrnosa in Huntington Creek was intimately associated
with the management of waters of the Left Fork reservoirs •
. These reservoirs are either completely drained or kept at
very low levels during late fall and early winter months
and are subsequently filled with runoff waters during the
late winter and early spring. Consequently no opportunity
exists for the release of euplankton from these reservoirs
during this period which explains why very few euplanktonic
species, especially a. formosa, were found in the creek
during these months. When these reservoirs are filled in
the spring the overflow enters Huntington Creek carrying
with it any plankton which may have developed in the reser-
voir over the winter. This was the probable source of A• formosa in the· plankton of Huntington Creek since this
diatom was highest in the creek in June 1971 (59,490
colonies per liter on June 8 and 30,250 colonies per liter
on June 29). It declined gradually through the summer and
then increased slightly in October. This trend was
undoubtedly directly correlated with the temperature curve
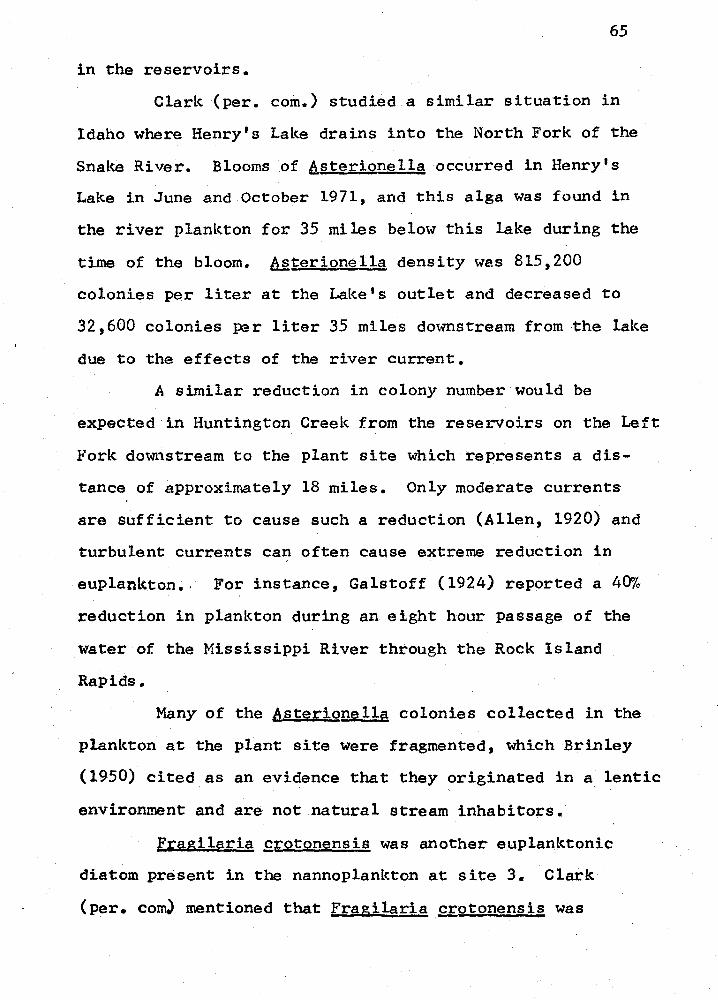
65
in the reservoirs.
Clark (per. corn.) studied a similar situation in
Idaho where Henry's Lake drains into the North Fork of the
Snake River. Blooms of Asterignella occurred in Henry's
Lake in June and October 1971, and this alga was found in
the river plankton for 35 miles below this lake during the
time of the bloom. ~terionella density was 815,200
colonies per liter at the Lake's outlet and decreased to
32,600 colonies per liter 35 miles downstream from the lake
due to the effects of the river current.
A similar reduction in colony number would be
expected in Huntington Creek from the reservoirs on the Left
Fork downstream to the plant site which represents a dis-
tance of approximately 18 miles. Only moderate currents
are sufficient to cause such a reduction (Allen, 1920) and
turbulent currents can often cause extreme reduction in
euplankton •. For instance, Galstoff (1924) reported a 40%
reduction in planlcton during an eight hour passage of the
water of the Mississippi River through the Rock Island
Rapids.
Many of the Asterion&llla colonies collected in the
plankton at the plant site were fragmented, which Brinley
(1950) cited as an evidence that they originated in a lentic
environment and are not natural stream inhabitors.
F~agila~ia £rotonensis was another euplanktonic
diatom present in the nannoplankton at site 3. Clark
(per. com) mentioned that Fragilaria gotonensis was
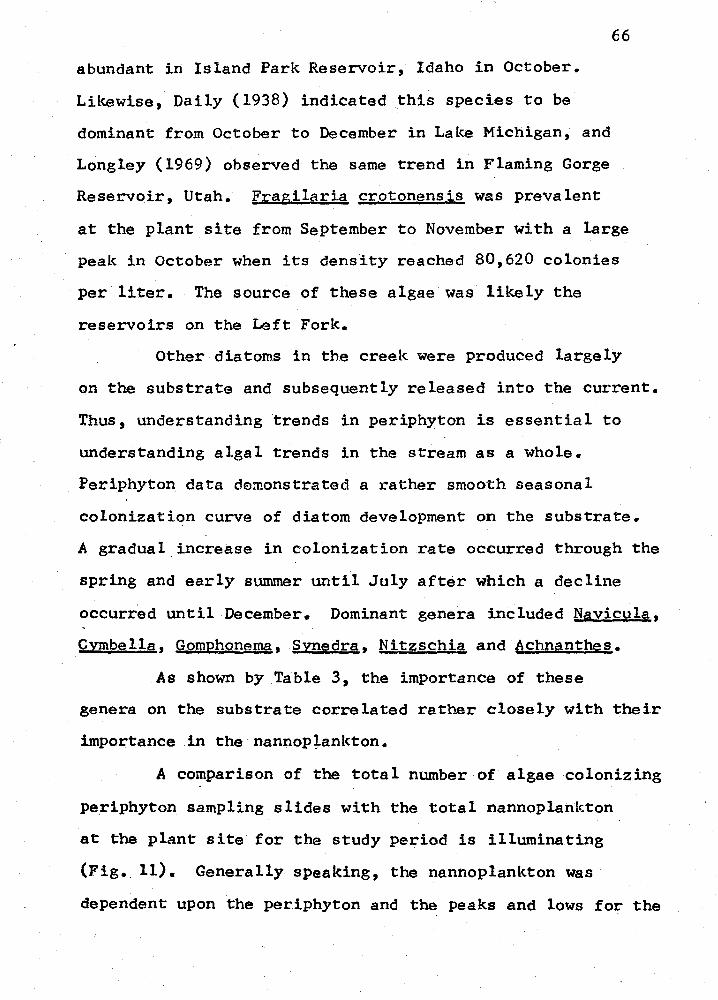
abundant in Island Park Reservoir, Idaho in October.
Likewise, Daily (1938) indicated this species to be
dominant from October to December in Lake Michigan, and
Longley (1969) observed the same trend in Flaming Gorge
Reservoir, Utah. Fragil~ria crotonensis was prevalent
66
at the plant site from September to November with a large
peak in October when its density reached 80,620 colonies
per.liter. The source of these algae was likely the
reservoirs on the Left Fork.
Other diatoms in the creek were produced largely
on the substrate and subsequently released into the current.
Thus, understanding trends in periphyton is essential to
understanding algal trends in the stream as a whole.
Periphyton data demonstrated a rather smooth seasonal
colonization curve of diatom development on the substrate.
A gradual increase in colonization rate occurred through the
spring and early summer until July after which a decline
occurred until December. Dominant genera included Navicula,
Cymbella. Gomphonema, Synedra, Nitzschia and achnanthes.
As shown by Table 3, the importance of these
genera on the substrate correlated rather closely with their
importance .in the nannop+ankton.
A comparison of the total number of algae colonizing
pe_riphyton sampling slides with the total nannoplankton
at the plant site for the study period is illuminating
(Fig. 11). Generally speaking, the nannoplankton was
dependent upon the periphyton and the peaks and lows for the
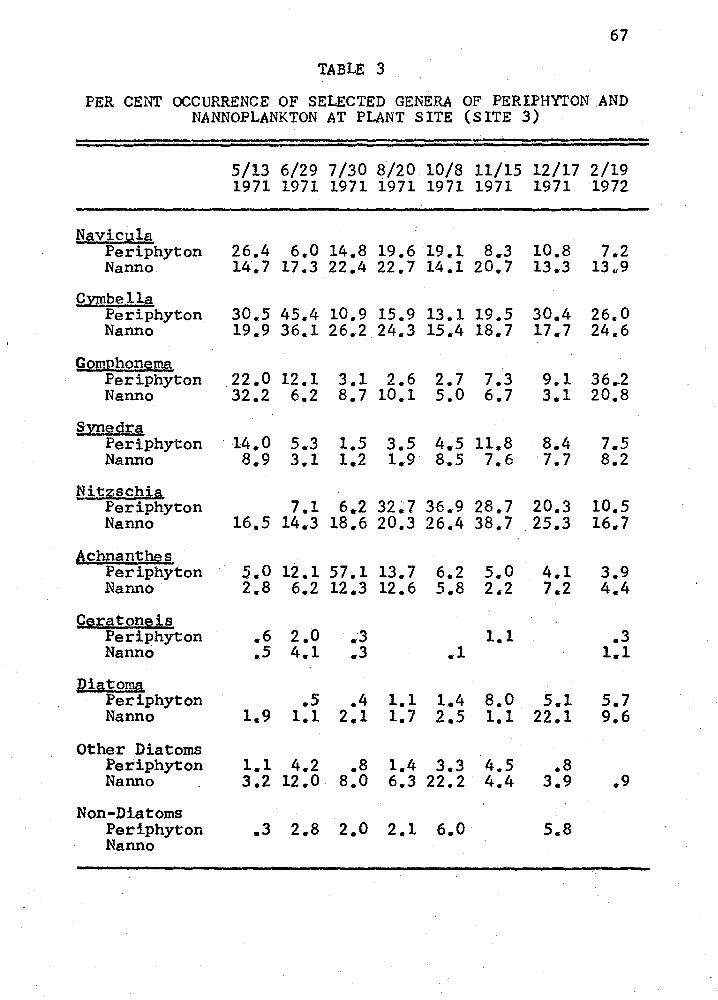
67
TABLE 3
PER CENT OCCURRENCE OF SELECTED GENERA OF PERIPHYTON .AND NANNOPLANKTON AT PLANT SITE (SITE 3)
5/13 6/29 7/30 8/20 10/8 11/15 12/17 2/19 1971 1971 1971 1971 1971 1971 1971 1972
Navicyla Periphyton 26.4 6.0 14.8 19.6 19. l 8.3 10.8 7.2 Nanno 14.7 17.3 22.4 22.7 14.l 20. 7 13.3 13.,.9
Cmbella Periphyton 30.5 45.4 10.9 15.9 13. l 19.5 30.4 26.0 Nanno 19.9 36.1 26.2 24.3 15.4 18.7 17.7 24.6
Gom12hon~ma Periphyton 22.0 12.1 3.1 2.6 2.7 7.3 9.1 36 .. 2 Nanno 32.2 6.2 8.7 10.1 5.0 6.7 3.1 20.8
Sxnedra Periphyton · 14.0 5.3 1.5 3.5 4.5 11.8 8.4 7.5 Nanno 8.9 3.1 1.2 1.9 8.5 7.6 7.7 8.2
Ni;tzschia, Periphyton 7.1 6.2 32;7 36.9 28.7 20.3 10.s Nanno 16.5 14.3 18.6 20.3 26.4 38.7 25.3 16.7
~chnant~s Periphyton 5.0 12. 1 57.1 13.7 6.2 s.o 4.1 3.9 Nanno 2.8 6.2 12.3 12.6 5.8 2.2 7.2 4.4
Q~raton~is Periphyton .6 2.0 _-3 1.1 .3 Nanno .s 4.1 .3 • 1 1.1
)2iatoma Periphyton .s .4 1.1 1.4 s.o 5.1 5.7 Nanno 1.9 1.1 2.1 1.7 2.5 1.1 22.1 9.6
Other Diatoms Periphyton 1.1 4.2 .B 1.4 3.3 4.5 .B Nanno 3.2 12.0 8.0 6.3 22.2· 4.4 3.9 .9
Non-Diatoms Periphyton .3 2.8 2.0 2.1 6.0 5.8 Nanno
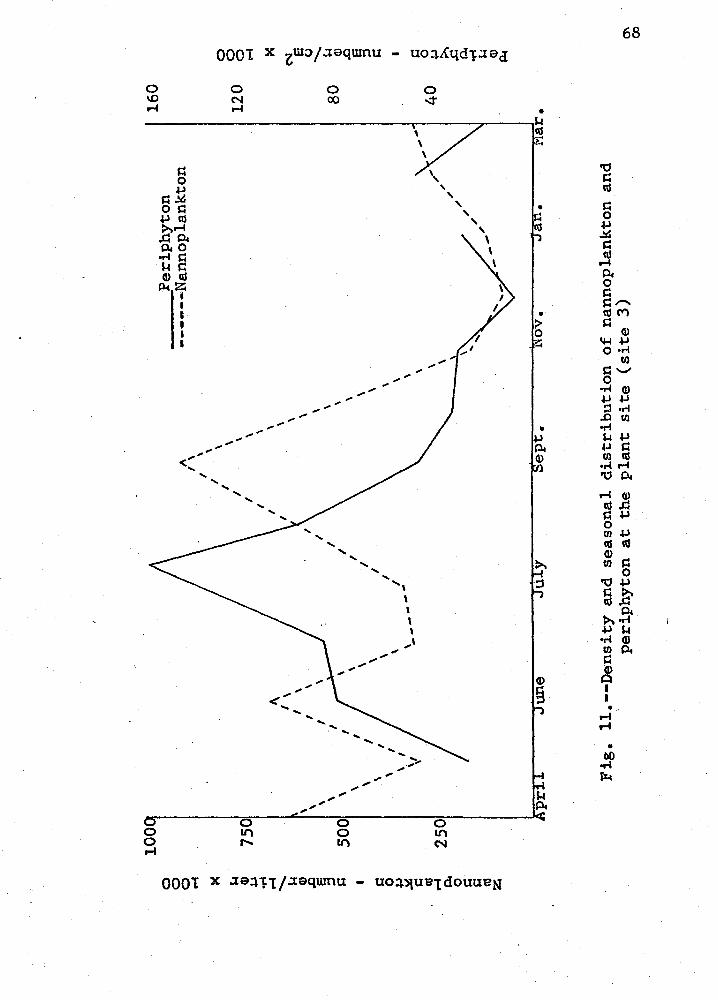
100
0 0 0 ....
J.I
Cl)
750
.µ .... ' J.I C
l) \
1 \ \ \
s::
500
\ \ \ s:
: 0 .µ
s::
«l ....
250
Cl. 0 s::
s::
(1j z
Perip
hyto
n --
----
,Nan
nop
lank
.ton
A
I \
I \
I \ \
I \
I \
I \
I \
I\ I
\ I
\ I
\
I \
\ \ I
\ I
I \
I \
I I
\ I
\ I
I \
I I I
\ \
I \
I \
I I
\
\ I
I \
,, , __
____
_ \
\ \ \
,, ...
\ ,,
/ /
/ / " ---
une
Jury
Se
pt.
ov.
a •
Fig.
11
.--D
ensi
ty
and
seas
onal
di
strib
utio
n of
na
nnop
lank
ton
and
perip
hyto
n at
th
e pl
ant
site
(s
ite
3)
I 160
120 80
......
40
ar •
0 0 0 ....
><
N f::
u ' J.I (!
) .0
9 s::: s::
0 .µ l>'\
.s:::
p.
s..
Cl)
P-t
0\ co
69
two corresponded. However, through the summer, especially
in July, the production of periphyton was high due to
a heavy colonization of achnanthes (mostly a. minutissima)
and Navicula spp. This sumner periphyton increase was
followed by an early fall nannoplankton increase. This
nannoplanl<ton pulse was caused by such genera as 1:!a,yii:;nJ,a,
Cvro,bella, Gomph9nema, s~negr~, li.U~schia, and A,b.nauthes. These genera had developed on the. creek bottom throughout
the ~pring and early summer and apparently were released
into the stream in the late summer due to certain
environmental stimuli. This conclusion is supported by
decreased colonization rates during the nannoplankton pulse.
Nitzschia spp. (especially li• Ealea) were important
in the nannoplankton throughout the study period bµt
demonstrated a peak of occurrence from August to October.
The yearly high occurred in August which was one month later
than the Nitzschia high at Lawrence and one month earlier
than the Nitzschia peak from localities further up the can-
yon.
Cocconeis placentula and achnanthes minutissirna
were predominately summer diatoms at site 3, and Ceratoneis
arcus was a late spring-early summer species. Diatom.a
vulgare and GomPhonema ilivaceum have been reported by
Blum ( 1957) to be important winter colonizers of bare areas.
He found !2_. vulgare most abundant in early winter in the
Saline River, Michigan, and ~._olivaceum most abundant in
late winter and early spring. Periphyton data from the
.plant site show ~iatoma vulgare to be most active in
colonization in November 1971. lt was also high in the
plankton during the fall and winter months. Gomphon~ma
oliyaceµm became most important in the periphyton in
January-March, 1972. 'I'he cells and mucilaginous stalks
70
on which they grow formed an extensive diatom "ooze" on the
entire creek substrate during these months. Nannoplankton
data from the spring of 1971 and the winter of 1972 indicate
that Gpmphonema was important in the flora throughout the
winter and spring.
ln summary the algal flora at site 3 was predom-
inately composed of Hygrurus foetidus in the spring, fil-
amentous blue-green algae in the summer and diatoms through-
out the entire year. Filan:entous algae contributed to the
net plankton of the river and diatoms comprised nearly the
entire nannoplankton. The plankton at site 3 was also
influenced by blooms occurring in Miller's Flat and Cleveland
Reservoir on the headwaters of the Left Fork of Huntington
Creek. Planktonic algae originating from these reservoirs
-included f.andorina mgry.m, aste;:ione lla,· fo;gnosa and J2inobryon
s;xl,indricum in the late spring and summer and Ce;:a.tium birundinella and fragil~ri~ crotonensis in the fall.
Campground (site 4)
The campground locality is located 3 miles upstream
from site 3 and exhibited a similar flora. However, certain
noteworthy variations between the two floras occurred
which are attributed to different ecological conditions
at site 4 and the effects of construction and pollution
from Deer Creek on site 3.
71
The creek at site 4 was high from April to early
June 1971 with a definite decline in water level in late
June. Hydrurue fQetidus appeared here in May on stones
in a broad shallow riffle and increased to cover 25% of
the substrate in early June. By June 29, 1971 this species
had disappeared from the visible benthic algae at site 4,
but was still prevalent in the net plankton indicating that
it was carried downstream from higher elevations where it
persisted later in the season. A light film of fi. fgetidu~
appeared on the substrate in February but disappeared in
March 1972. High water and probable abrasion from ice
break-up upstream contributed to the disappearance of this
alga at sites 3 and 4 during this period.
The summer and early fall diatom ooze and blue-green
algal encrustation noted at the plant site were even more
apparent at site 4 where·the water was shallower creating
more extensive riffles. Algal and sediment buildup began
in July and continued through October when an extensive
blue-green algal crust was evident under the diatom ooze.
In November this crust began flaking off.
lt is possible that ~rotoderma viride or another
encrusting green algae composed part of this community.
However, filamentous blue-green algae were definitely the
predominant constituents since large amounts of blue-green
72
algae were found in the net plankton when the crust began
to break up. Also floristic samples from the campground
and further upstream at the junction of the two forks of
Huntington Creek showed large amounts of Schizothrix
fragile and other filamentous Cyanophyta. The presence of
these algae in Huntington Creek correlates with the findings
of Clark (1958) in the Logan River, Utah where a blue-green
encrusting mat was also found on the substrate under the
diatom ooze. A new buildup on the substrate was noted in
January and February 1972, but it consisted mostly of
diatoms. Filamentous blue-green algae were present at that
time but not in sufficient quantities to create an encrusted
mat. During spring flood the high water and abrasion from
its increased silt load usually scoured the stones of much
of their periphyton.
By July turbulence in the riffle had decreased sig-
nificantly and many scattered mats of Q.§_cilla,toria cf.
t~nuis together with trapped sediments occurred on the
stream bottom. These were small mats covering only 6.4%
of the substrate in shallow water although they occurred
in 77% of the plots observed in transects across the creek.
The mats were gone in August but were evident to a lesser
extent again in September.
Similar to other sites along the creek, net plankton
assemblages at site 4 were directly influenced by the
benthic algae. Oscillatoria cf. agar-dvi filarrents were
most abundant in the net plankton in the spring although
73
they occurred throughout the year. In September and
November many small clumps of filamentous Cyanophyta were
collected in the net plankton because of the aforementioned
breakup of the blue-green algae encrustation. Ulothrix sp.
occurred mostly in May and June, CladoEhora glomerata from
June through August, and Oedogonium sp. from May through
October. Spirogyra sp., !:i2,u&eotia sp., and mnerna sp.
occurred through the summer months, and ~tigeoclonium
stagnatile appeared in the fall.
The same true planktonic algae occurred in the creek
at the campground locality as at the plant site. These
included £eratium hirundinella in .August and September 1971,
Pandorina morym in June through October, Qinopryon £Ylindri-
£.!:!m from June to November, A,ste.i:ionella f2rmosa from .June
to December with highest numbers in June and Fragila~ia,
crotonensis from October to December with highest occurrence
in November. These trends were the same as those at the
plant site with only minor differences.
Periphyton colonization trends were similar to those
of the plant site. A general increase in periphyton was
noted through the spring of 1971 until July followed by a
decline to November 1971. Periphyton data were compiled
from slides placed both in a pool and in riffles in order
to compare colonization in the two habitats. Both areas
showed a general decrease in most genera on slides collected
on June 29, 1971, although A.£hn-S!ll~ minutissima increased
greatly. This species increased from. 2,928 cells per cm2
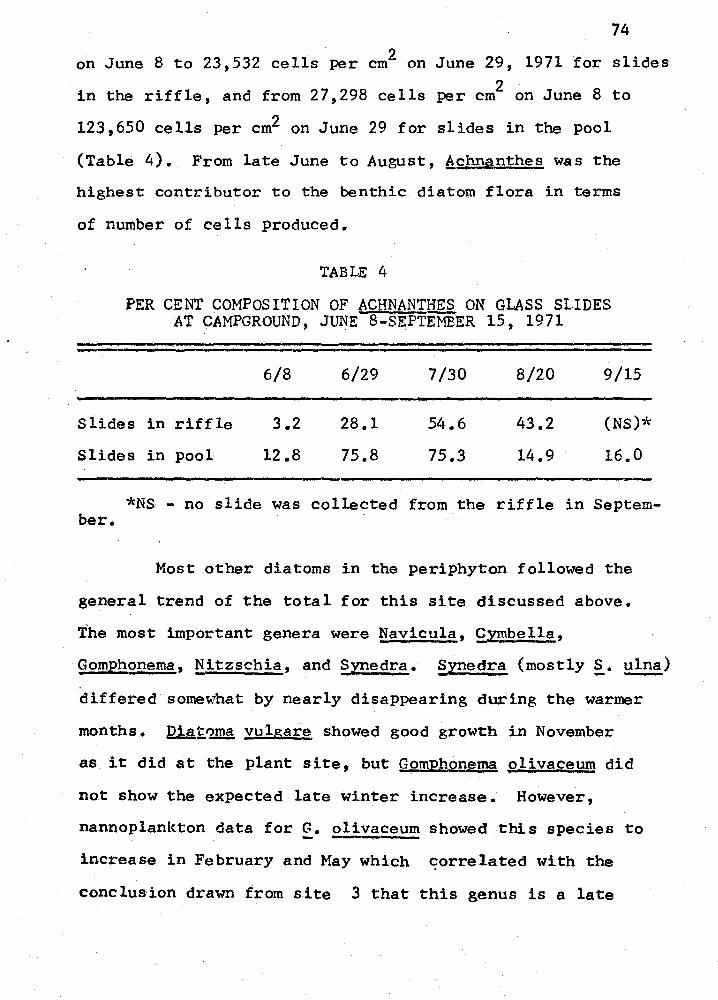
74 2 on June 8 to 23,532 cells per cm on June 29, 1971 for slides
2 in the riffle, and from 27,298 cells per cm on June 8 to
123,650 cells per cm2 on June 29 for slides in the pool
(Table 4). From late June to August, ~chnanthes was the
highest contributor to the benthic diatom flora in terms
of number of cells produced.
TABLE 4
PER CENT COMPOSITION OF ACHNANT~ ON GLASS SLIDES AT CAMPGROUND, JUNE 8-SEPTEMBER 15, 1971
6/8 6/29 7/30 8/20 9/15
Slides in riffle
Slides in pool
3 .. 2
12 .8
28.1
75.8
54.6
75.3
43.2
14.9
(NS)*
16.0
*NS - no slide was collected from the riffle in Septem-ber.
Most .other diatoms in the periphyton followed the
general trend of the total for this site discussed above.
The most important genera were Navicula, Cl!2bella, -gomphonema, Nitzschia, and 2,YEedra. 2Y!1edra (mostly~-~)
differed somewhat by nearly disappearing during the warmer
months. l21.§.toma vulgare showed good growth in November
as it did at the plant site, but Gomph,,Q_nema olivaceum did
not show the expected late winter increase. However,
nannoplankton data for G. olivaceum showed this species to - - ------increase in February and May which correlated with the
conclusion drawn from site 3 that this genus is a late
75
winter and early spring form.
Qertoneis arcus was definitely a late spring
diatom, and 9Qcconeis Elacentula a summer diatom as
indicated by the periphyton and substantiated by nanno-
plankton data. Certain true plankters were occasionally
found on the periphyton sampling slides. These algae be-
came entrapped there as they floated downstream and fell
out of the water column.
A comparison of data from slides placed in the
pool and the riffle reveal certain differences in coloni-
zation in the two habitats. The total number of periphyton
and the number of individuals of most genera were much
higher in the pool. The only exception to this was
Cocconeis Elacentula which showed a comparable colonization
rate in the riffle to that in the pool. The reason for the
high colonization rate in the pool was undoubtedly due to
reduced removal of periphy"ton by the stream current while
concurrently allowing sufficient water flow for adequate
nutrient and gas exchange for rapid algal metabolism.
Periphyton composition percentages for the period
May through August 1971 show certain significant differences
between the- diatoms of the pool and the diatoms of the
faster water. The riffle had a higher composition percentage
of GomEhonema (mostly[. olivaceum), [ynedra (mostly~- ulna),
Cvmbella spp., Nitzschia (mostly~- Ealea), Cocconeis
(mostly Q. E,!acentula), Ulothrix sp., and Hydrurus fgetidus
than the pool, whereas the pool had a. higher percentage of
N~vicula spp., Achnanthes minutissima, DiatgJJJ!!, vulgare
and Surirella (mostly§.. ,2~).
76
From comparing periphyton data with nannoplankton
data at site 4 (Fig. 12), it is evident that high periphy-
ton production in June 1971 caused the high nannoplankton
levels of the same period and slightly later. The turbulance
of high water during this period probably scoured many
diatoms from the substrate into the current. Periphyton
production continued to rise in July 1971 when nannoplankton
levels dropped, probably because fewer diatoms were removed
from the substrate by the current during this period. These
periphytic diatoms were subsequently released into the
current during early fall when plankton levels increased
again,. The November nannoplankton increase and subsequent
relatively high winter levels were probably due to new
colonization since periphyton levels also rose during this
period.
The nannoplankton cycle for site 4 basically followed
the trend described for site 3. High diatom levels were
evident from April to late June, followed by a summer low, and
a high pulse in September (Fig. 13). The decline in
plankton in October and subsequent rise in November followed
a trend similar to that observed at Lawrence, Stuart Station
and Bear Canyon, although the plant site did not exhibit
the November increase. The plant site also 'had much_ lower
plankton levels on June 29, 1971 than the campground.
Turbidity in Huntington Creek at the.plant site was 40 JTU
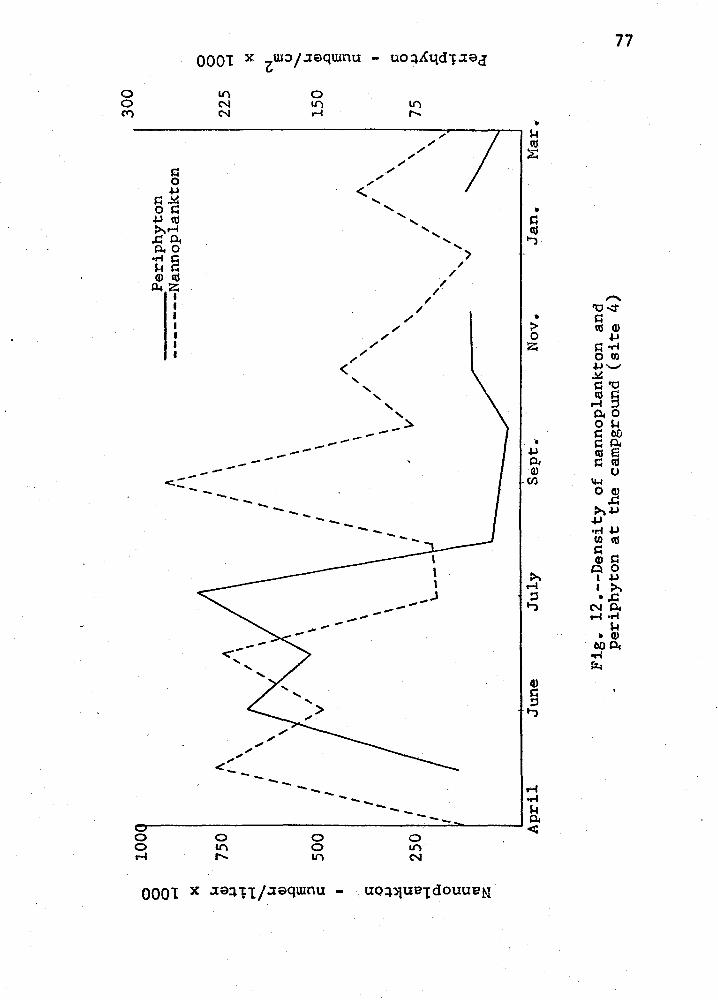
0 10
0 0 0 r-
4 X S-1
G>
750
/\ .µ
,,
....
, \
,-f ......
.. I
\ S-
1 I
\ C
D
I \
.0 e
I ::l
s:
:: 50
0 I I I I
s:::
I 0
I .µ
I
s::
250
I (I
S .
I ,-f
p,.
I 0
I s:
:: s:
:: (I
S z
Apr
il
Perip
hyto
n "
----
---N
anno
plan
kton
I\ I
\ I
\
I \
I \
I \ \
I \
I \
I \
I \
I \
I \
I \
I\ \
/ \
I\ I
\ I
\ I
/ \
I \
I \
I '
I '
\ /
' I
I \
, \I
\ I
\ I
' '
' I
\ '
I
' I
\
' ' I "
"' Ju
ne
July
Se
pt.,
Nov
. Ja
n.
Mar
.
Fig.
, 12
.--D
ensi
ty
of
nann
opla
nkto
n an
d -
perip
hyto
n at
th
e ca
mpg
roun
d (s
ite
4)
300
225
150
75
0 0 0 r-1
N e 0 ...
.....
S-1
(I)
.0 s :J s:::
s:::
0 .µ >,
.c:
p.
.,-1 S-
1 Q
) Ac
....,
....,
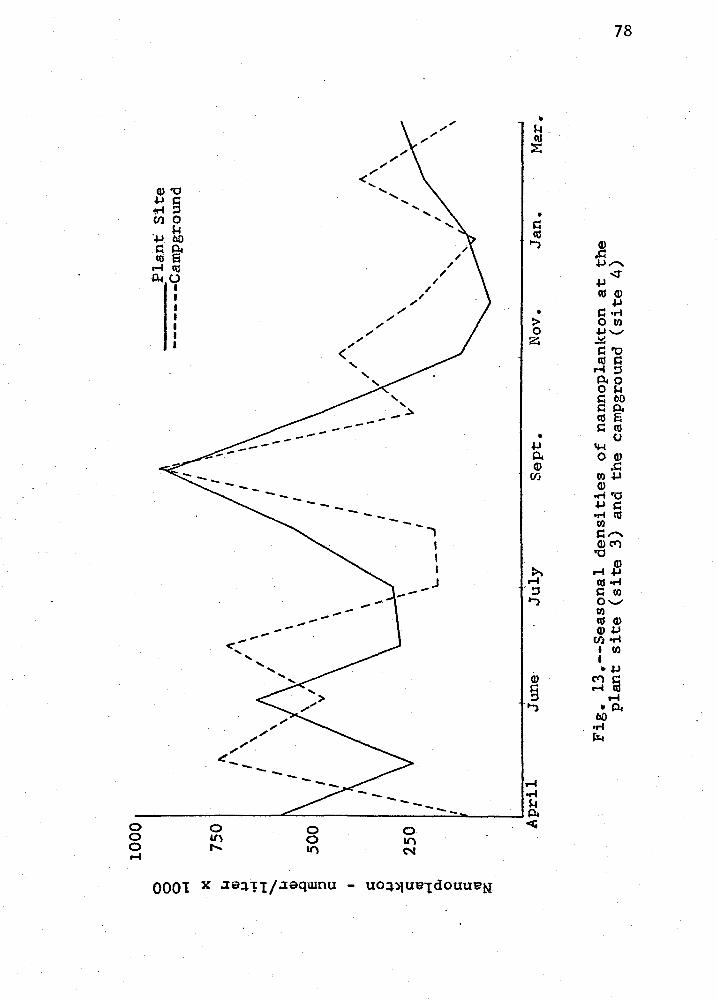
0 0 0 ....
>C
S-1
CD
,µ
•r
-l .... ' S-1
Cl)
.D E:
:, s:::
s:::
0 ,µ s:::
<IS ....
0 s::
s::: cu
z
1000
A Pl
an.t
Site
--
----
-Cam
pgro
und
750
f
" \
I \
/' \ \
1 \,/
xi' \
, \
I \
I \
I \
\ \
I \
I \
I I
I I
500
/ \
/ \
I \
/ V
\
I I
I '
I \
I\ I
\ /
' \
/ '
" !V
\_
_V
I I
/ \
I \
I I
\ I
I \
/ /
\ I
I \
I 25
0 \
v \
I I
\ ,
' I
I \..
---
J ' '
I I
' ' I
I ' '
L .Apr
il Ju
ne·
July
Se
pt.
Nov
. Ja
n.
Fig.
13
.--Se
ason
al
dens
ities
of
na
nnop
lank
ton
at
the
plan
t si
te
(site
3)
an
d th
e ca
mpg
roun
d (s
ite
4)
' \ \ Mar
.
.....,
C
X)
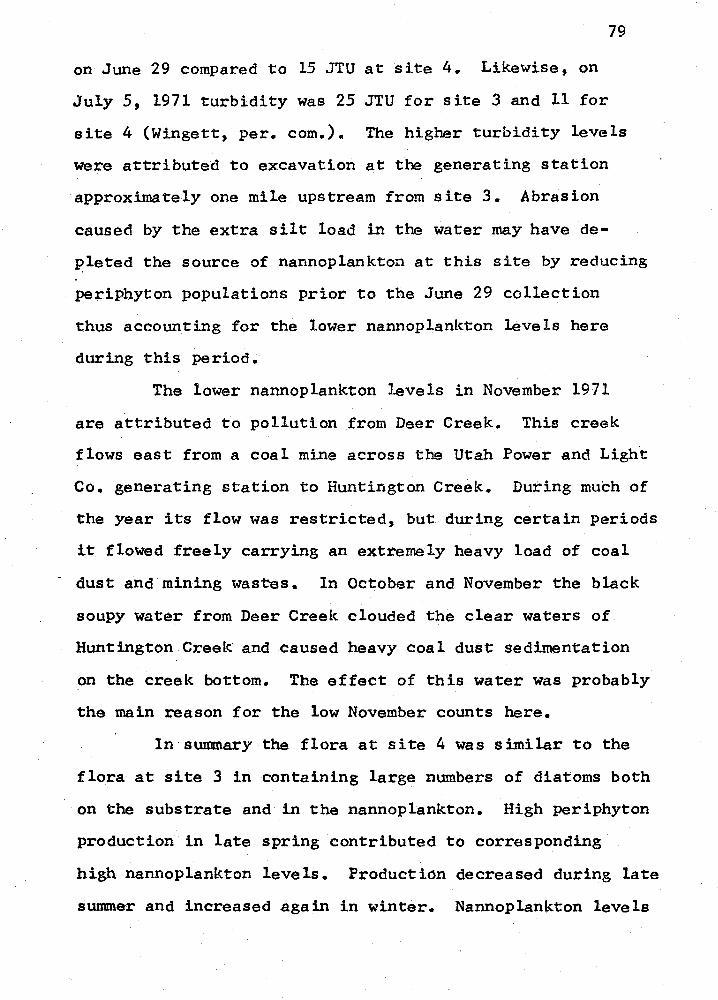
79
on June 29 compared to 15 JTU at site 4. Likewise, on
July 5, 1971 turbidity was 25 JTU for site 3 and 11 for
site 4 (Wingett, per. com.). The higher turbidity levels
were attributed to excavation at the generating station
approximately one mile upstream from site 3. Abrasion
caused by the extra silt load in the water may have de-
~leted the source of nannoplankton at this site by reducing
periphyton populations prior to the June 29 collection
thus accounting for the lower nannoplankton levels here
during this period.
The lower nannoplankton levels in November 1971
are attributed to pollution from Deer Creek. This creek
flows east from a coal mine across the Utah Power and Light
Co. generating station to Huntington Creek. During much of
the year its flow was restricted, but during certain periods
it flowed freely carrying an extremely heavy load of coal
- dust and mining wastes. In October and November the black
soupy water from Deer Creek clouded the clear waters of
Huntington Creek and caused heavy coal dust sedimentation
on the creek bottom. The effect of this water was probably
the main reason for the low November counts here.
In summary the flora at site 4 was similar to the
flora at site 3 in containing large numbers of diatoms both
on the substrate and in the nannoplankton. High periphyton
production in late spring contributed to corresponding
high nannoplankton levels. Production decreased during late
summer and increased again in winter. Nannoplankton levels
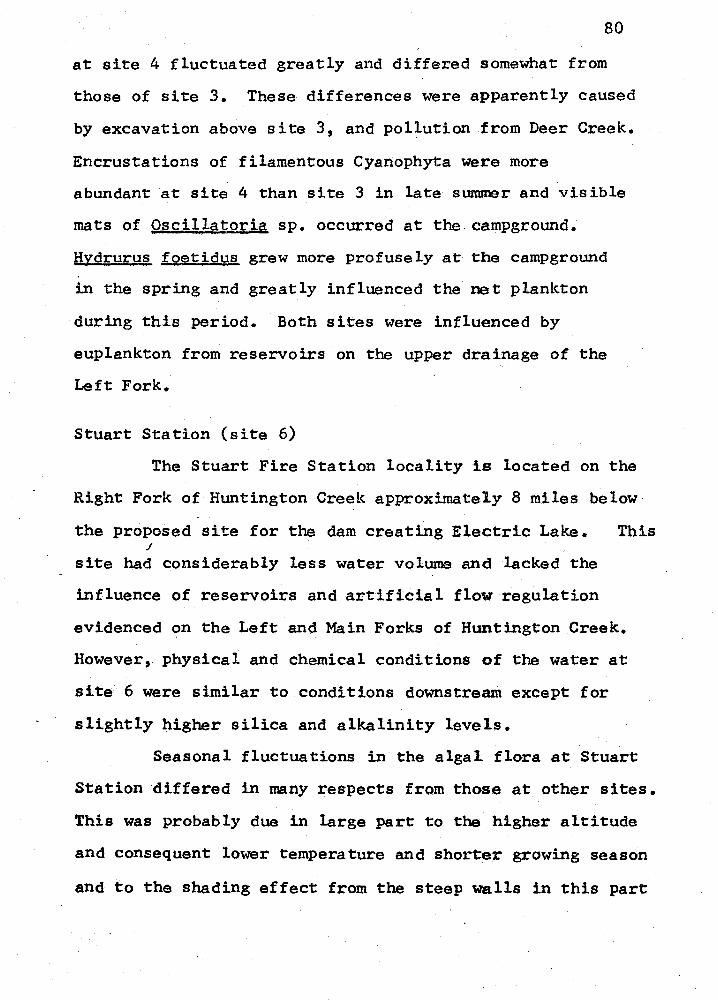
80
at site 4 fluctuated greatly and differed somewhat from
those of site 3. These differences were apparently caused
by excavation above site 3, and pollution from Deer Creek.
Encrustations of filamentous Cyanophyta were more
abundant at site 4 than site 3 in late summer and visible
mats of Oscillatori~ sp. occurred at the.campground.
Hydrurus foetidus grew more profusely at the campground
in the spring and greatly influenced the net plankton
during this period. Both sites were influenced by
euplankton from reservoirs on the upper drainage of the
Left Fork.
Stuart Station (site 6)
The Stuart Fire Station locality is located on the
Right Fork of Huntington Creek approximately 8 miles below·
the proposed site for the dam creating Electric Lake. This /
site had considerably less water volume and lacked the
influence of reservoirs and artificial flow regulation
evidenced on the Left and Main Forks of Huntington Creek.
However, physical and chemical conditions of the water at
site 6 were similar to conditions downstream except for
slightly pigher silica and alkalinity levels.
Seasonal fluctuations in the alga1 flora at Stuart
Station differed in many respects from those at other sites.
This was probably due in large part to the higher altitude
and consequent lower temperature and shorter growing season
and to the shading effect from the steep walls in this part
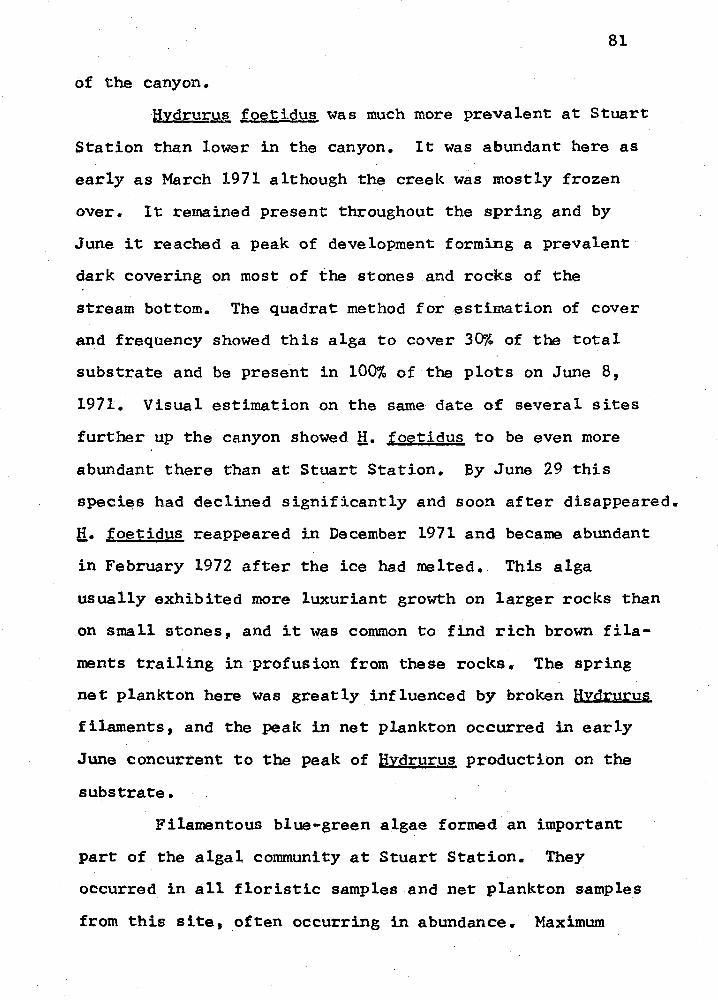
81
of the canyon.
Hydrurus foetidus was much more prevalent at Stuart
Station than lower in the canyon. It was abundant here as
early as March 1971 although the creek was mostly frozen
over. It remained present throughout the spring and by
June it reached a peak of development forming a prevalent
dark covering on most of the stones and rocks of the
stream bottom. The quadrat method for estimation of cover
and frequency showed this alga to cover 30'/o of the total
substrate and be present in 100% of the plots on June 8,
1971. Visual estimation on the same date of several sites
further up the canyon showed H- toetidus to be even more
abundant there than at Stuart Station. By June 29 this
speci~s had declined significantly and soon after disappeared.
H,. f oetidus reappeared in December 1971 and became abundant
in February 1972 after the ice had melted. This alga
usually exhibited more luxuriant growth on larger rocks than
on small stones, and it was common to find rich brown fila-
ments trailing in·profusion from these rocks. The spring
net plankton here was greatly influenced by broken Hydrurus
filaments, and the peak in net plankton occurred in early
June concurrent to the peak of Hydrurus production on the
substrate.
Filamentous blue-green algae formed an important
part of the alga1 community at Stuart Station. They
occurred in all floristic samples and net plankton samples
from this site, _often occurring in abundance. Maximum
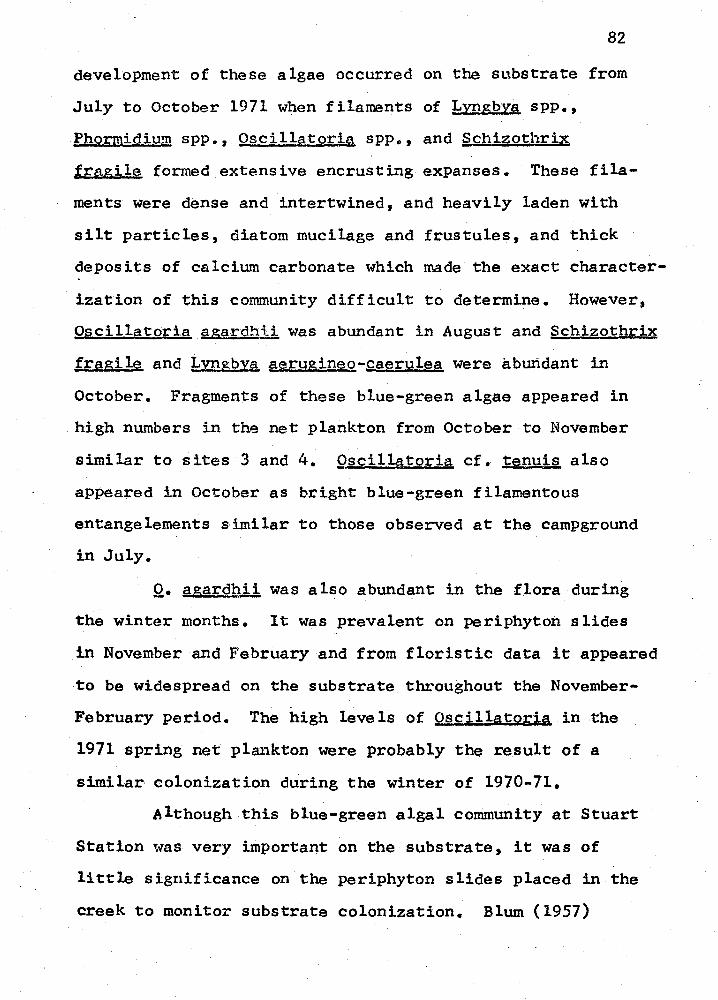
82
development of these algae occurred on the substrate from
July to October 1971 when filaments of Lyngbya spp.,
Phormidiu.'11 spp., Oscillatoria spp., and §.chizothrix
fragile formed extensive encrusting expanses. These fila-
ments were dense and intertwined, and heavily laden with
silt particles, diatom mucilage and frustules, and thick
deposits of calcium carbonate which made the exact character-
ization of this community difficult to determine. However,
Oscillatoria agardh:i.!, was abundant in August and Schizothrix
fragile and Lyngbya aerugineo-caerulea were abundant in
October. Fragments of these blue-green algae appeared in
high numbers in the net plankton from October to November
similar to sites 3 and 4. Oscillatoria cf. tenuis also
appeared in October as bright blue-green filamentous
entangelements similar to those observed at the campground
in July.
Q. agardhii was also abundant in the flora during
the winter months. It was prevalent on periphyton slides
in November and February and from floristic data it appeared
to be widespread on the substrate throughout the November-
February period. The high levels of Oscillatori~ in the
1971 spring net plankton were probably the result of a
similar colonization during the winter of 1970-71.
Although this blue-green algal community at Stuart
Station was very important on the substrate, it was of
little significance on the periphyton slides placed in the
creek to monitor substrate colonization. Blum (1957)
83
reported a similar situation in the Saline River, Michigan
where a crustose Schizothrie-fhormidium community was
dominant on the river bottom. He found that even after
a year's period, sterile rocks placed in the river failed
to develop a community structure comparable to the mature
~chizothrix-f.ttormidiym crust evident in the river. He
concluded that a mature crust required a year or more to
develop, and that the Schi~othrix-Phormidium community
was a permanent member of the algal flora in the Saline
River. A similar situation apparently occurs in Huntington
Creek although other Cyanophyta are involved. The basic
blue-green algal community persists at Stuart Station through-
out the year and develops extensively during summer and
fall months.
~ladophora glomerata likewise did not actively
colonize microscope slides at Stuart Station, although it
occurred abundantly on the substrate and significantly
influenced the net plankton in the spring arid fall. This
species covered 6% of the substrate in September and 10.5%
of the substrate in October 1971. It occurred more on large
rocks than on small stones 8.L,d was covered with epiphytic
Cocconeis plac~ntula, Gomphonems olivaceum, and other
diatoms. It was much reduced in November exhibiting a stubby
growth form but existed through the winter becoming heavily
encrusted with calcium carbonate and sediment.
In December£. g~omerata was intertwined with many
filaments of Ulothrix z;onat51 and y. aegualis. Ulothrix
84
was otherwise most evident in May and June at this locality.
Oedogonium sp. was rare at Stuart Station, although
it occurred throughout the summer. §tigeoclonium attenµatum
ands. stagnatile occurred here mostly in the fall months.
t.12ugeotia sp., S:eirogyra sp., and Z,ygnema sp. were of
unique importance in the summer net plankton at Stuart
Station and were the main reason for the steady relatively
high net plankton rates through this period as contrasted
to the lower summer rates at other sites on Huntington
Creek. These species occurred mostly from late June to
October, but §Pirogyra sp. was found from early June to
February. l::l,Qygeotia sp. showed a significant increase in
July when it comprised 62% of the net plankton, and was the
main reason for the general increase in net plankton during
that month •. The creek upstream from Stuart Station contains
many regions with slow ~ater and meandering stream channels
as well as springs, pools and quiet backwaters. These areas
supported luxuriant growths of these conjugate algae and
undoubtedly represent their source in the net plankton at
Stuart Station. Algae in these ponds and backwaters probably
only entered the creek during runoff from late summer rain
storms, but those growing in pools and side waters of the
creek itself were constantly released into the channel.
Diatom colonization on the creek substrate at Stuart
Station sho~~d peak development in May and November 1971
with lesser peaks in late June 1971 and February 1972. The
November-March diatom density was much·greater at Stuart
85
Station than that of any period at sites 3 and 4 suggesting
that the aquatic habitat here was more conducive to diatom
production than lower in the canyon. The low colonization
rate in early June was likely in part a result of the
extensive ~ydrurus fo~t~ development during that period.
Summer diatom production was low here as it was at sites 3
and 4 although the summer low began in July rather than
August when it began at the localities further down the can-
yon.
Many diatom genera on the substrate contributed to
the total periphyton trends for the study period (Fig. 14).
Certain genera such as CYffibella (mostly£. yentricosa and
£. parva), ~~nedra (mostly~- lll.!!!!,), and Diatoma (mostly
~- vulgare) demonstrated high numbers on the slides collected
on June 29, 1971. These genera were responsible in large
part for the general periphyton increase of that period.
Qmbella was especially abundant in June. Floristic
samples taken on June 15th at Stuart Station and selected
sites downstream demonstrated extremely high numbers of
£ymbella, and· D;i,atoffi!! yulgare was also an important coloni-
zer during this period.
The fall and winter Diatoma ~~!gare-2£mEho~
olivaceum increase was much the same at Stuart Station as
at sites 3 and 4 down canyon. However, increased E• yul~are colonization began in October rather than in Novem--ber and~. olivaceum colonization began increasing in
November rather than later in the winter. ~- ~ulgare began
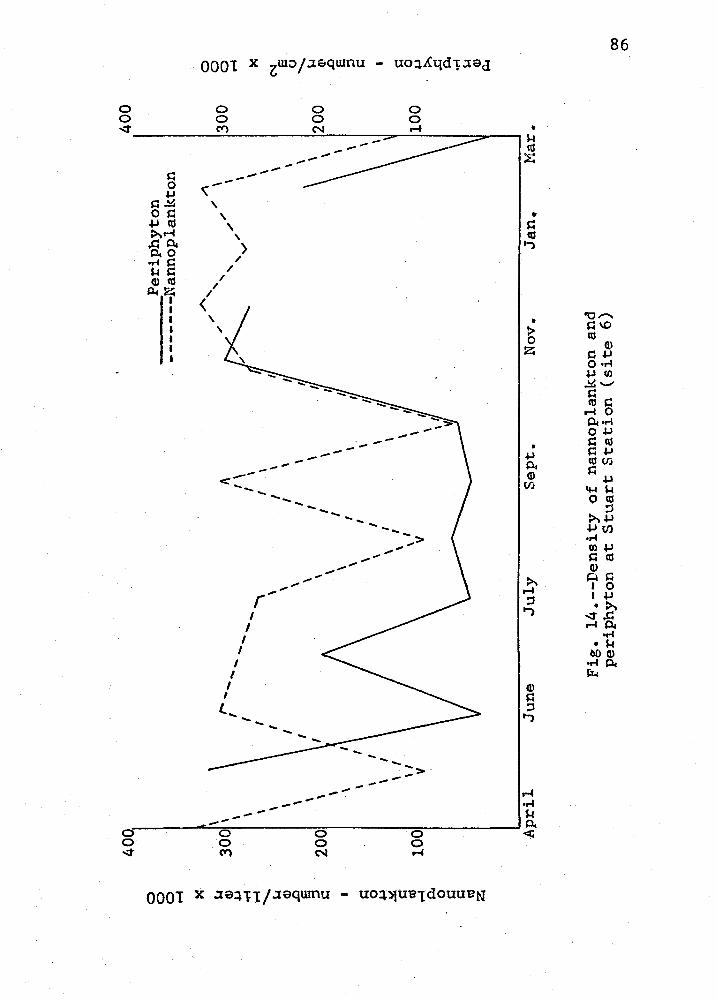
400
400
g __
__ P
erip
hyto
n S
----
---N
anno
plan
kton
X A
\
,,,
' ,'\
0
300,
,,.
......
......
. h
.,,
',,
,,,,,,
,"'
\ 30
0 8
,µ
\ ...
.....
I\ '
,, r-
1 .,-
1 \
I ...
. ...,
I v
\ r-
1 \
I ...
. '\ I
\ \
X ...
...
\ S-
.f \
I \
I \
N
C!)
\ '
\ '
\ E:
.C
J \
\ I
\ 0
9 \
\ '
\ S:
: 2 0
0 \
\\ /
\ 2 0
0 (!
l \
I .a
\
' =
\ \
I \
::,
s::
\ \
' \
s::
0 \
I \
I \
\ I
\ I
, s:
: \
' \
, s:
: j
100
V 'v
' 10
0 .s
0 s::
s::
.....
z C
!)
Apr
il Ju
ne
July
Se
pt.
Nov
.
Fig.
14
.--D
ensi
ty
of
nann
opla
nkto
n an
d pe
riphy
ton
at
Stua
rt St
atio
n (s
ite
6)
p,,.
Jan.
M
ar.
00 "'
87
forming long prominent zigzag colonies in October which
became a dominant part of the periphyton flora in Novem-
ber and continued dominant through the winter until Febru-
ary 1972. Q. olivaceum demonstrated a high colonization
rate throughout the November-early May period.
Nitzschia as a whole demonstrated spring and fall
highs and a summer low thus following the general diatom
trend. However, li• ~icularis occurred mostly in the summer
and early fall when it was found in both the periphyton
and nannoplankton from late June to November. Cocconeis
~lacentula also occurred in greater abundance during the
summer and early fall months. It began colonizing in July
and reached a peak in August and September after which it
decreased significantly.
Butcher (1932) described an Ulvella-Cocconeis
community which was abundant in English calcareous rivers
during summer months. An alga similar to Ulvella, but
identified as Protoderma viride (after Prescott, 1962) was
found colonizing glass slides at Stuart Station on Septem-
ber 1~, 1971. Protoderma is a green alga exhibiting a
prostate, often encrusted growth habit. In Huntington
Canyon it becomes crusted with calcium carbonate and silt
particles making it difficult to identify except when on
periphyton slides. This same species was found abundantly
on slides at Lawrence in September and October 1971 and
was an important alga in the benthic community there. It
was likely also an important constituent of the crusts
88
evident at sites 3 and H during this same early fall
period, although accurate identification was difficult,
and Protoderrna was absent on glass slides at these sites.
Four periphyton slides were retrieved from site 6
in September,and ~rotoderma. yi,...ride was prevalent on three
of the four covering as estimated 10 to 20% of the slide
surface. In October f. yiride was. found on only one
of three slides and had decreased in importance on that
slide. P[otoderm,a yiri~ therefore exhibited a short
colonization period here and was probably not as effective
in colonizing bare surfaces rapidly as some diatoms such as
QQ.cconeis and A~nanthes. However, visual observation of
the stream bottom throughout the summer indicated that this
alga was more prevalent than our data indicate. Such
prostate, often encrusted forms are rare in the plankton
(Butcher, 1932) thus eliminating plankton data as a means
of monitoring their production on the stream bed. Hence,
P[otoderma yiride did not appear in periphyton counts
from Stuart Station. This represents a weakness in sub-
sampling and illustrates that total numbers of individuals
in a flora as determined only by one sampling method may
not always .convey a true picture of the flora as a whole.
frptoderma mats were few in number on the periphyton slides
although each covered a considerable area making it important
in terms of total cover although insignificant in total
number of cells when compared to diatoms on the same slide.
Achnanthes min,utissim~ and Cocconeis 2lacentula
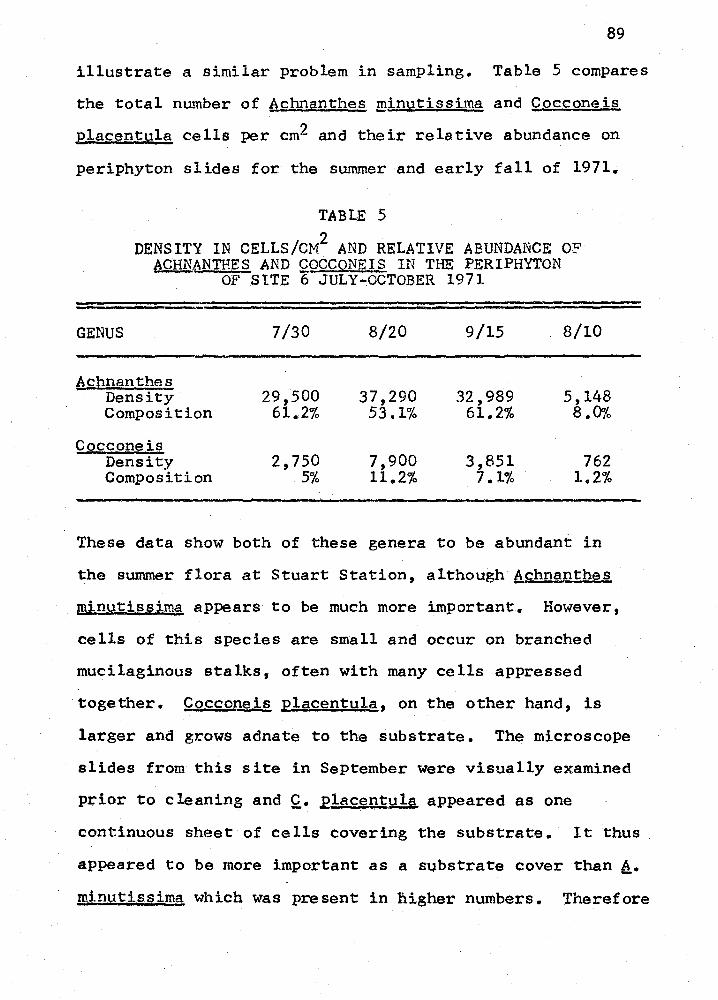
89
illustrate a similar problem in sampling. Table 5 compares
the total number of Achnanthes minutissima and Cocconeis
Elacentula cells per cm2 and their relative abundance on
periphyton slides for the summer and early fall of 1971.
TABLE 5
DENSITY IN CELLS/CM2 AND RELATIVE ABUNDANCE OF hCHN.{\NTHES AND Q.OCCONEIS IN THE PERIPHYTON
OF SITE 6 JULY-OCTOBER 1971
GENUS
Achnanthes Density Composition
Cocconeis Density Composition
7/30
29,500 61.2%
2,750 5%
8/20
37,290 53.1%
7,900 11.2%
9/15
32,989 61.2%
3,851 7 .1%
8/10
5,148 8.0%
762 1.2%
These data show both of these genera to be abundant in
the summer flora at Stuart Station, although6_s;:hnanthe§,
minutissima appears to be much more important. However,
cells of this species are small and occur on branched
mucilaginous stalks, often with many cells appressed
together. Cocconeis E1acentula, on the other hand, is
larger and grows adnate to the substrate. The microscope
slides from this site in September were visually examined
prior to cleaning and Q. 2lacentyla appeared as one
continuous sheet of cells covering the substrate. It thus
appeared to be more important as a substrate cover than 6_.
m,inutissima which was present in nigher numbers. Therefore
90
care must be used in sampling,and whenever possible subjective
description should accompany numerical characterization
when describing a total flora as it occurs in place.
Nannoplankton at Stuart Station were relatively
constant throughout the year except for lows in May, August
and October 1971 anp March 1972 (Fig. 14). The high winter
and spring nannoplankton levels here were supported by
similar high production on the substrate. As periphyton
production declined in July and August the number of nanno-
plankton also dropped. ln September a large number of
Nitzschia spp. and N~vicula spp. released from the substrate
caused an increase in the number of nannoplankton. An
October low occurred at site 6 as it did at site 4.
Generally speaking, nannoplankton levels showed
much less fluctuation at Stuart Station than at sites 3
and 4 (Fig. 15) whereas periphyton levels exhibited more
(Fig. 16). Nannoplankton levels were also generally lower
at site 6 than at sites 3 and 4 (Fig. 15). This was due
to the collection of diatoms in the plankton as the current
carried them downstream thus giving higher levels lower
in the drainage. However, many fluctuations and occasion-
al lack of correspondence between nannoplankton and
periphyton data suggest that many factors along the stream
channel affect these levels. For instance, many algae,
especially non-diatom Species are destroyed as they travel
downstream. The abundance of filamentous conjugales at
Stuart Station and their paucity at sites 3 and 4
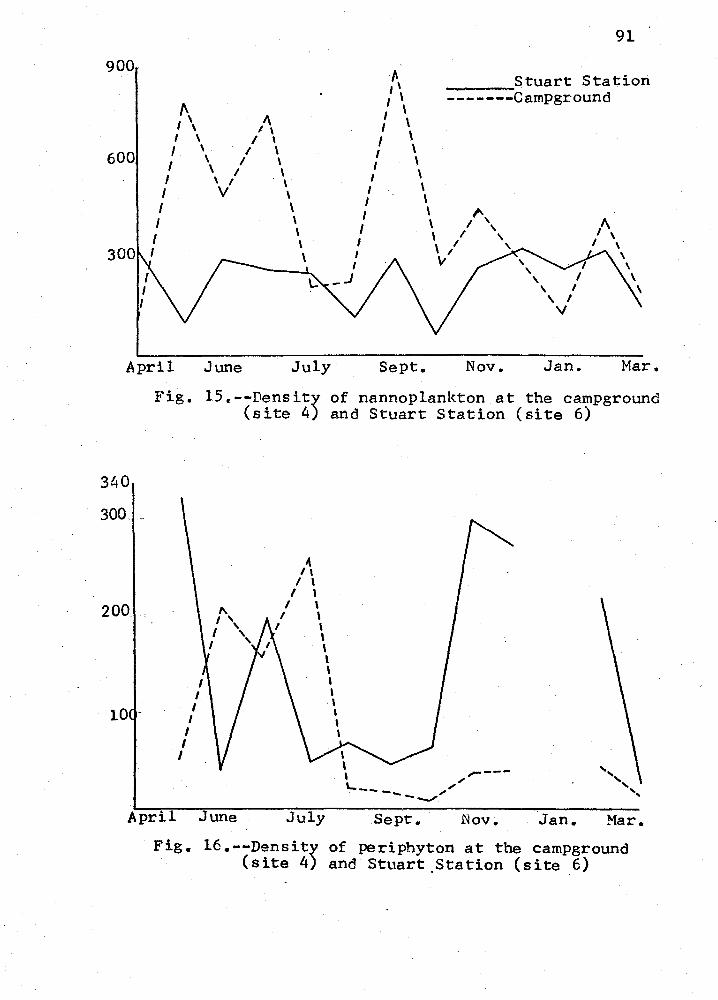
900
600
", I\ I \ I \ I \ I \ I \ I \ I ', I \ I \ I \ I . \
I V , I \
300
I \ / \ I \
91
" Stuart Station ----I \ I \ I \
-------Campground I \ I \ I \ I \
I \ I \ I \ I \ I\. I \ / ', I \ I , I I I \I
_J
/\ I \
\ \ \
\
April June July Sept. Nov. Jan. Mar.
340
300
200. •C
10 -
Fig. 15c--Density of nannoplankton at the campground (site 4) and Stuart Station (site 6)
I I
I I
I I
I
I\ I \
I I I \
I \ I I
\
' \ \ I I I
' ' ' ----,,,. L._____ ,,""
--..,/
April June July Sept. .Nov. Jan. Mar. Fig. 16.--Density of periphyton at the campground
(site 4) and Stuart Station (site 6)
92
illustrate this fact. Likewise, localized habitat
differences are also extremely important in creating
differences between floras of different parts of the stream.
Ceratoneis ~rcus for instance, was important at the plant
site and campground, but was almost nonexistent at site 6.
A noteworthy lack of euplankton was also evident at Stuart
Station.
Successive collections of nannoplankton from Stuart
Station were made on February 19 and 23, 1971. The results
of these two samples are summarized in Table 6. The close
correlation of these two counts supports the reliability
of the sampling techniques used and also indicates relatively
stable conditions in the creek during this four day period.
In sumrr.ary, the flora at Stuart Station demonstrated
many species of diatoms on the substrate throughout the
year with an ~chnanthes-Cocconeis-Protoderma community
prevalent in summer and early fall. Filamentous blue-green
algae were important here throughout the year, especially
in the summer-fall period. H~drurus foetidus was abundant
in spring, and £li&dophora glomerata was quite prevalent
in fall. The dominant diatoms were ~gvicula, Cyrobella,
Gornphonema,. Nitzschia, ~anthes, §.medra, Qocconeis,
Diatoma and Surir~lla.
Bear Canyon (site 7)
Sampling at Bear Canyon was conducted from July
to November 1971. The stream gradient at this site was
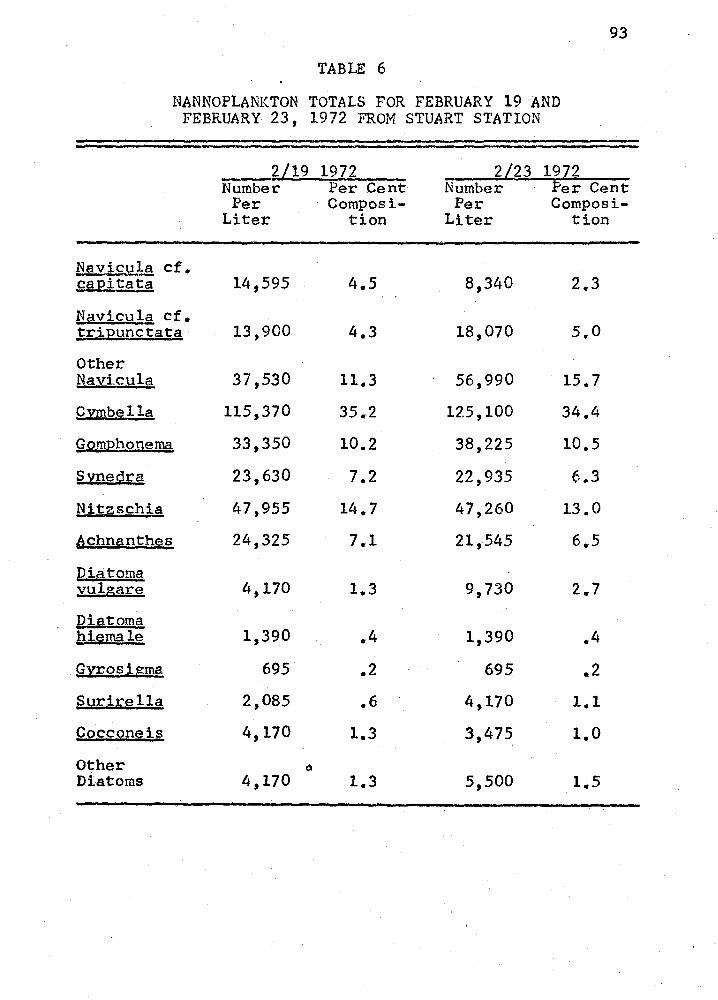
93
TABLE 6
NANNOPLANKTON TOTALS FOR FEBRUARY 19 AND FEBRUARY 23, 1972 FROM STUART STATION
Naviculc1 cf. .saEitata
Navicula cf. trj..punctata
Other Navicula
Cymbella
Gomphonema
Synedra
Nitzschia
fichnanthes
1Jiatoma vulgare
Di~toma bi~ma,le
Gyrosigma
Surirella
Cocconeis
Other Diatoms
2/19 Number
Per Liter
14,595
13,900
37,530
115,370
33,350
23,630
47,955
24,325
4,170
1,390
695
2,085
4,170
4,170
1972 Per Cent Composi-
tion
4.5
4.3
11.3
35.2
10.2
7.2
14.7
7.1
.4
.2
.6
1.3
1.3
2L23 Number
Per Liter
8,340
18,070
56,990
125,100
38,225
22,935
47,260
21,545
9,730
1,390
695
4,170
3,475
5,500
1972 Per Cent Composi-
tion
2.3
s.o
15.7
34.4
10.s
6.3
13.0
6.5
2,,7
.4
.2 1.1
1 .. 0
1.5
94
not steep and the stream ran clear usually with lower
water flow than at Stuart Station 9 miles downstream.
Green and blue-green algae were significant in the flora
at Bear Canyon. Ulothri~ tenuissima was highest in the net
plankton in June indicating that it was an active stream
bottom colonizer during late spring. Oegogonium sp. and
£ladophora glomerata were prevalent throughout the summer
in the plankton, and Qedogonium sp. was also abundant
on the substrate. Long streamers of this alga were found
on stones and a submerged clay shelf in September and
October. In September Oedogonium sp. covered 12 .3% of
the substrate and occurred with 79% frequency, and in
October i.t covered 7 .2% of the substrate and occurred in
86% of the plots studied. In October §_piro_gYI:a sp ..
filaments were intermingled with the Oedogonium sp. strands.
In November the decrease in abundance of Oedogonium sp.
was accompanied by the initiation of growth of Hydrurus
foetidys on the substrate. Much of the creek bottom at
Bear Canyon and upstream was sandy and provided little
opportunity for the attachment of benthic algae, and con-
sequently the total amount of attached algae was low in these
areas.
The seasonal cycle of Hydrurus foetidus at Bear
Canyon probably was much the same as a·t Stuart Station ..
It appeared in the late fall and was likely present through~
out the winter since it was prevalent in the early spring
when the ice broke. Because of the high altitude and
95
consequent lower temperature of the water here, fi. foetidus
persisted longer into the summer than at sites lower in
the drainage. Thus, this species was abundant in the net
plankton as late as June 29, and still present in the July
30 sample.
Growth of CJadophora glomerata was not extensive
at Bear Canyon, and when found it was covered with numerous
epiphytic diatoms such as Cocconeis placentula and Gomphon-
™ olivac~um. Filaments of several conjugate algae were
retrieved in net samples during the summer and early fall
months. These algae largely originated in protected
environments upstream from Bear Canyon where luxuriant mats
. ·of Spirogyra were observed in October. Spirogyra sp. was
more prevalent in these samples in the fall while MQ..ugeotia
sp. and Zygnema sp. occurred mostly during the summer.
Closterium (mostly (2_. moniliferum) was important in
the creek at Bear Canyon. In July its density in the net
plank.ton was 67 .5 cells per liter and in August it was pre-
sent at 42 cells per liter. Closterium production in the
creek. occurred on the substrate in protected areas, among
mats of filamentous algae and in partially submerged stream-
side vegetation. These sane habitats were also the site
of production for T,achelomonas robustg which appeared in
the creek in August, September and November.
Nannoplankton samples were taken during the August-
November period. The total numbers varied somewhat from
the figures obtained at Stuart Station and in general were
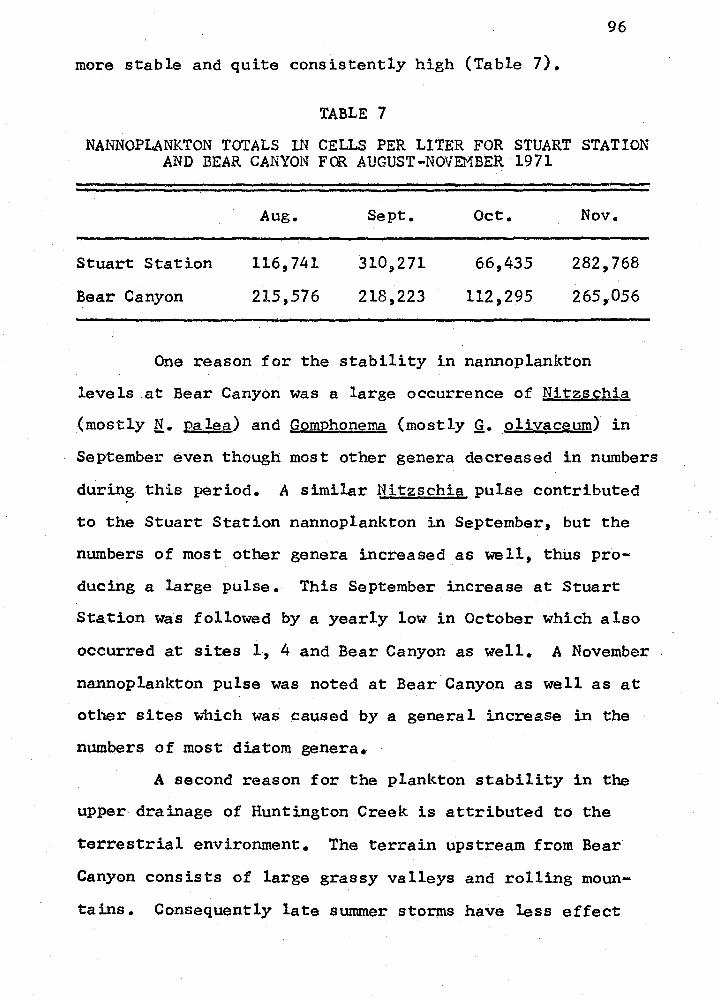
96
more stable and quite consistently high (Table 7).
TABLE 7
NANNOPLANKTON TOTALS IN CELLS PER LITER FOR STUART STATION AND BEAR CANYON FOR AUGUST-NOVEMBER 1971
Stuart Station
Bear Canyon
Aug.
116,741
215,576
Sept.
310,271
218,223
Oct.
66,435
112,295
Nov.
282,768
265,056
One reason for the stability in nannoplankton
levels at Bear Canyon was a large occurrence of Nitzschia
(mostly N,. Ealea) and Gomphonema (mostly g,. olivaceum) in
September even though most other genera decreased in numbers
during this period. A similar Nitzschia pulse contributed
to the Stuart Station nannoplankton in September, but the
numbers of most other genera increased as well, thils pro-
ducing a large pulse. This September increase at Stuart
Sta.tion was followed by a yearly low in October which also
occurred at sites 1, 4 and Bear Canyon as well. A November
nannoplankton pulse was noted at Bear Canyon as well as at
other sites which was caused by a general increase in the
numbers of most diatom genera.
A second reason for the plankton stability in the
upper drainage of Huntington Creek is attributed to the
terrestrial environment. The terrain upstream from Bear
Canyon consists of large grassy valleys and rolling moun-
tains. Consequently late summer sto~s have less effect
97
on the Right Forl< here than in the canyon immediately above
Stuart Station where the mountain sides are steep and
easily eroded during storms thus raising the water level
rapidly and increasing the silt load in the creek. This
increased silt load and high water is likely responsible
for scouring diatoms from the substrate and thereby
altering nannoplankton counts.
Tie Fork Pond (site 5)
The lentic environment of Tie Fork Pond provided
a habitat uniquely different from that of the swift flowing
Huntington Creek~ and thus the flora here contained many
algae which did not occur in the creek. In addition, the
cycles of occurrence of some genera com.~on to both environ-
ments· were very different.
Physical and chemical properties of the water in
Tie Fork Pond differed in several important aspects from that
of the neighboring portion of Huntington Creek. Silica
fluctuated from levels below to levels above those found
in the creek waters. Hardness was usually greater in the
pond with magnesium hardness being much higher and calcium
hardness being somewhat lower than in the creek. Total
alkalinity in the pond was higher, and carbonate alkalinity
was usually present along with bicarbonate alkalinity.
Sulfate was slightly higher than in the creek. Turbidity
was also higher in the pond because of abundant planktonic
alga,l growth, and water temperature was usually 5-10° C
98
higher since the small pond was easily and rapidly warmed
by the sun.
The pond was completely frozen during the winter.
On March 11, l.972 it had begun to thaw, but neither visible
benthic algae nor plankton were evident. A nannoplankton
sample taken from the pond yielded only a few diatom
frustules which appeared to be left from the previous year.
In April 1971 the pond was completely thawed, and
the remains of the previous year's Qh~~a mat were evident
on the bottom. Filamentous algae such as Oedogonium sp.,
Spirogyra sp., and Micros2ora sp. were already floating on
the surface of the pond indicating that spring colonization
is rapid. The plankton during this month were predominately
diatoms including Navicµla, Cvmbel~~, ~omphQD~~s Sypedra,
~itzschia, Achnanthes and Cocconeis.
Filamentous algae developed throughout the summer.
By June a new growth of Qhara vulgaris was evident on the
bottom and ~Rirogyra spp. filaments were abundant through-
out the pond. Mougeotia spp. and kygnerna sp. mats were
abundant near the south shore of the pond where a culvert
drained under the highway into the creek. In July
Potomog~ton sp. was abundant in the pond and the Potomogeton-
Qhara association completely convered the bottom.
Mougeotia {mostly M• genuflexa) development reached a climax
during this month and thoroughly saturated the water when
it formed bright gree~ fluffy "clouds·" throughout the pond.
This surmner development of Mougeotia correlated closely
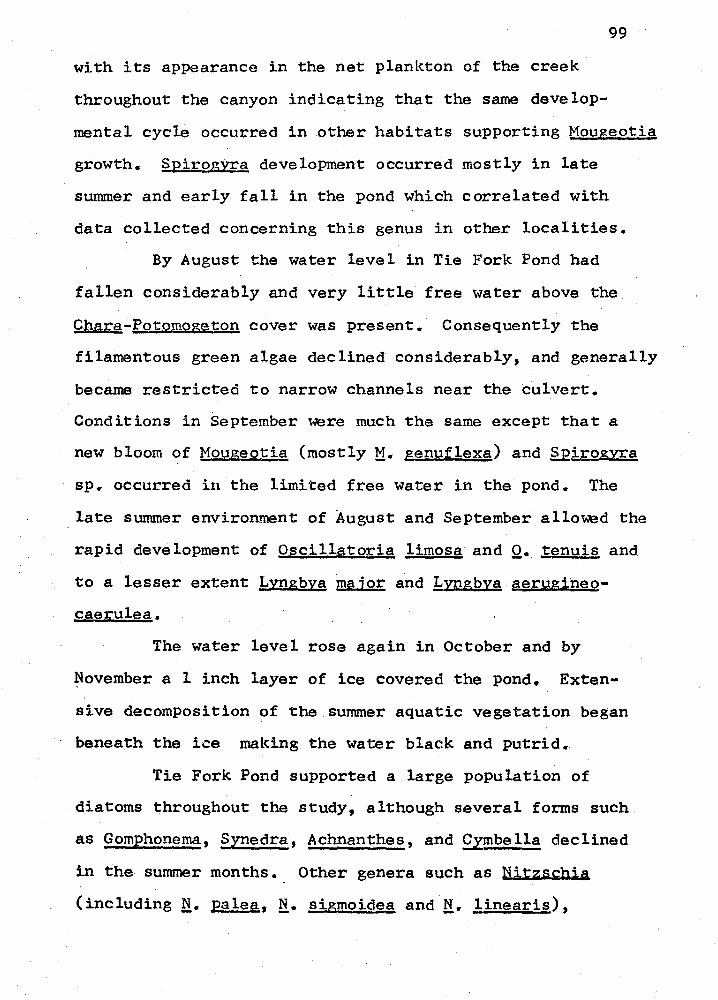
99
with its appearance in the net plankton of the creek
throughout the canyon indicating that the same develop-
mental cycle occurred in other habitats supporting Mougeotia
growth. Spirogyra development occurred mostly in late
summer and early fall in the pond which correlated with
data collected concerning this genus in other localities.
By August the water level in Tie Fork Pond had
fallen considerably and very little free water above the
Chara-Potomogeton cover was present. Consequently the
filamentous green algae declined considerably, and generally
became restricted to narrow channels near the culvert.
Conditions in September were much the same except that a
new bloom of Mougeotia (mostly M- genuflexa) and §.Eirogyra
sp .. occurred in the limited free water in the pond. The
. late summer environment of August and September allowed the
rapid development of Oscillatoria limosa and o. tenuis and
to a lesser extent 1xflgbya major and Lyngbya aerugineo-
caerulea.
The water level rose again in October and by
November a 1 inch layer of ice covered the pond. Exten-
sive decomposition of the summer aquatic vegetation began
beneath the ice making the water black and putrid.
Tie Fork Pond supported a large population of
diatoms throughout the study, although several forms such
as Gomphonema, pY!ledra, Achnanthes, and Cymbella declined
in the summer months. Other genera such as tiitzscha (including~- pale~,~. sigrnoidea and li• 1inearis),
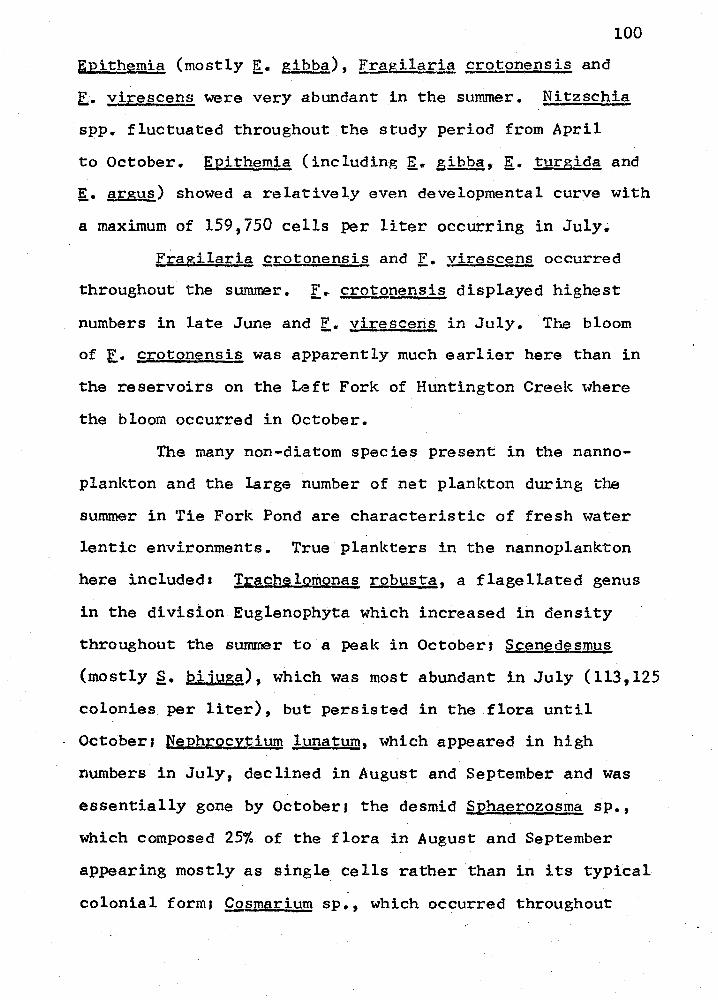
100
~pithemia (mostly E. gibba), [tftgilarg £!..Q.tonensis and
[. virescens were very abundant in the summer. Nitzschia
spp. fluctuated throughout the study period from April
to October. Epithemia (including [e g~, E. turgida and
~- argld.§.) showed a relatively even developmental curve with
a maximum of 159,750 cells per liter occurring in July.
Fragilaria crotonensis and,E. yirescens occurred
throughout the summer. f~ crotonensis displayed highest
numbers in late June and[. virescens in July. Tr~ bloom
of[. crotonensis was apparently much earlier here than in
the reservoirs on the Left Fork of Huntington Creek where
the bloom occurred in October.
The many non-diatom species present in the nanno-
plankton and the large number of net plankton during the
summer in Tie Fork Pond are characteristic of fresh water
lentic environments. True plankters in the nannoplankton
here included• Tr~che!,Qmonas robusta, a flagellated genus
in the division Euglenophyta which increased in density
throughout the summer to a peak in October; Scenedesmus
(mostly~- bijuga), which was most abundant in July (113,125
colonies per liter), but persisted in the flora until
October1 Nephrocytium lunatum, which appeared in high
numbers in July, declined in August and September and was
essentially gone by October; the desmid Sphaerozosma sp.,
which composed 25% of the flora in August and September
appearing mostly as single cells rather than in its typical
colonial form; Cosmarium sp., which occurred throughout
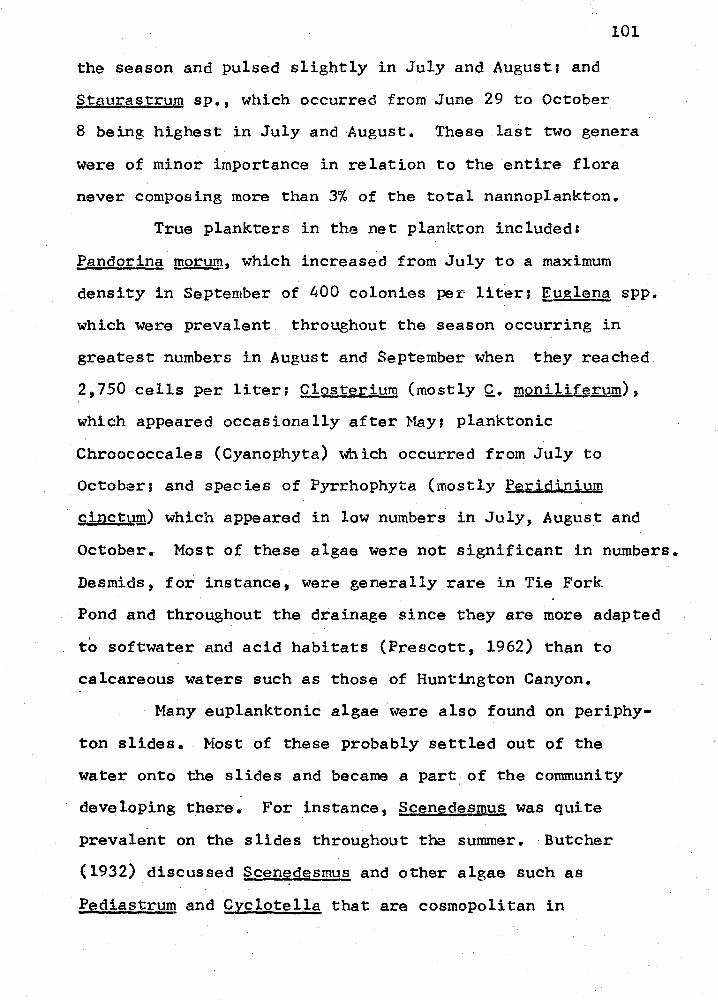
the season and pulsed slightly in July and August; and
Staurastrum sp., which occurred from June 29 to October
101
8 being highest in July and August. These last two genera
were of minor importance in relation to the entire flora
never composing more than 3% of the total nannoplankton.
True plankters in the net plankton included,
Pandorina morum, which increased from July to a maximum
density in September of 400 colonies per liter; !;2_uglena spp ..
which were prevalent throughout the season occurring in
greatest numbers in August and September when they reached
2,750 cells per liter; Clost§r~um (mostly~. moniliferum),
which appeared occasionally after May; planktonic
Chroococcales {Cyanophyta) which occurred from July to
October; and species of Pyrrhophyta (mostly P~[ioinium
cinctum) which appeared in low numbers in July, August and
October. Most of these algae were not significant in numbers.
Desmids, for instance, were generally rare in Tie Fork
Pond and throughout the drainage since they are more adapted
to softwater and acid habitats (Prescott, 1962) than to
calcareous waters such as those of Huntington Canyon.
Many euplanktonic algae were also found on periphy-
ton slides. Most of these probably settled out of the
water onto the slides and became a part_ of the community
developing there,. For instance, Scenedesmus was quite
prevalent on the slides throughout the summer. ·Butcher
(1932) discussed Scenedesmus and other algae such as
Pediastrum and 9yclotella that are cosmopolitan in
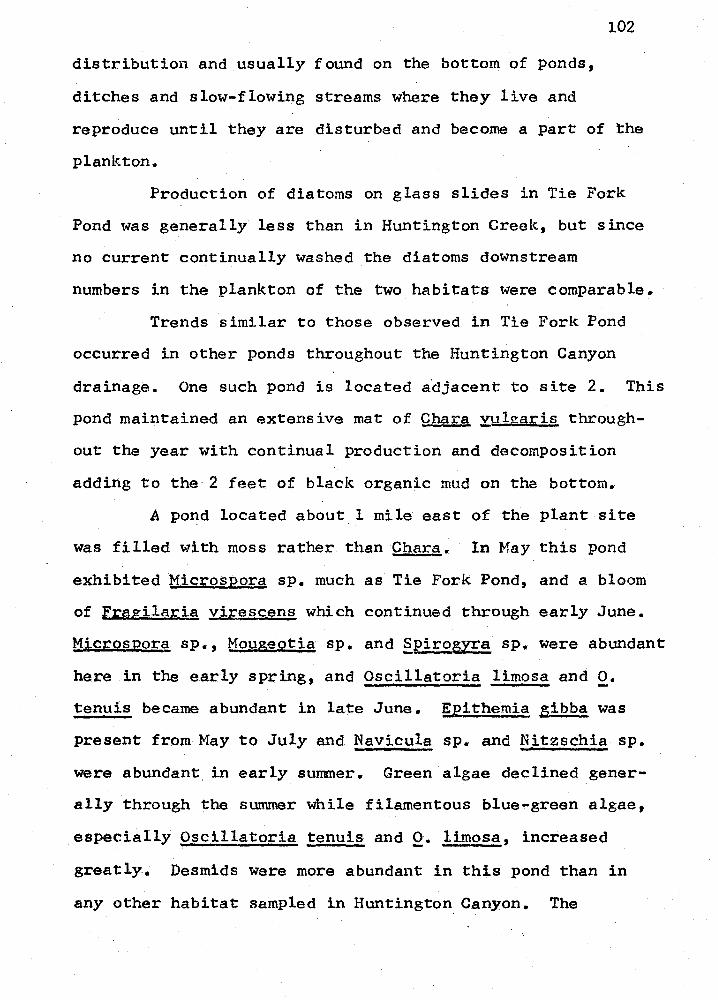
102
distribution and usually found on the bottom of ponds,
ditches and slow-flowing streams where they live and
reproduce until they are disturbed and become a part of the
plankton.
Production of diatoms on glass slides in Tie Fork
Pond was generally less than in Huntington Creek, but since
no current continually washed the diatoms downstream
numbers in the plankton of the two habitats were comparable.
Trends similar to those observed in Tie Fork Pond
occurred in other ponds throughout the Huntington Canyon
drainage. One such pond is located a·djacent to site 2. This
pond maintained an extensive mat of Chara ~ulgaris through-
out the year with continual production and decomposition
adding to the 2 feet of black organic mud on the bottom.
A pond located about 1 mile east of the plant site
was filled with moss rather than Chara. In May this pond
exhibited ~icrospora sp. much as Tie Fork Pond, and a bloom
of Frggilaria virescens which continued through early June.
Microspora sp., Mougeotia sp. and ~pj.roaY!a sp. were abundant
here in the early spring, and Oscillatoria limosa and Q•
tenuis became abundant in late June. EEithemia !ibb~ was
present from May to July and Navicula sp. and Nitzschia sp.
were abundant, in early summer. Green algae declined gener-
ally through the summer while filamentous blue-green algae,
especially Oscillatoria tenuis and Q. limosa, increased
greatly. Desmids were more abundant in this pond than in
any other habitat sampled in Huntington. Canyon. The
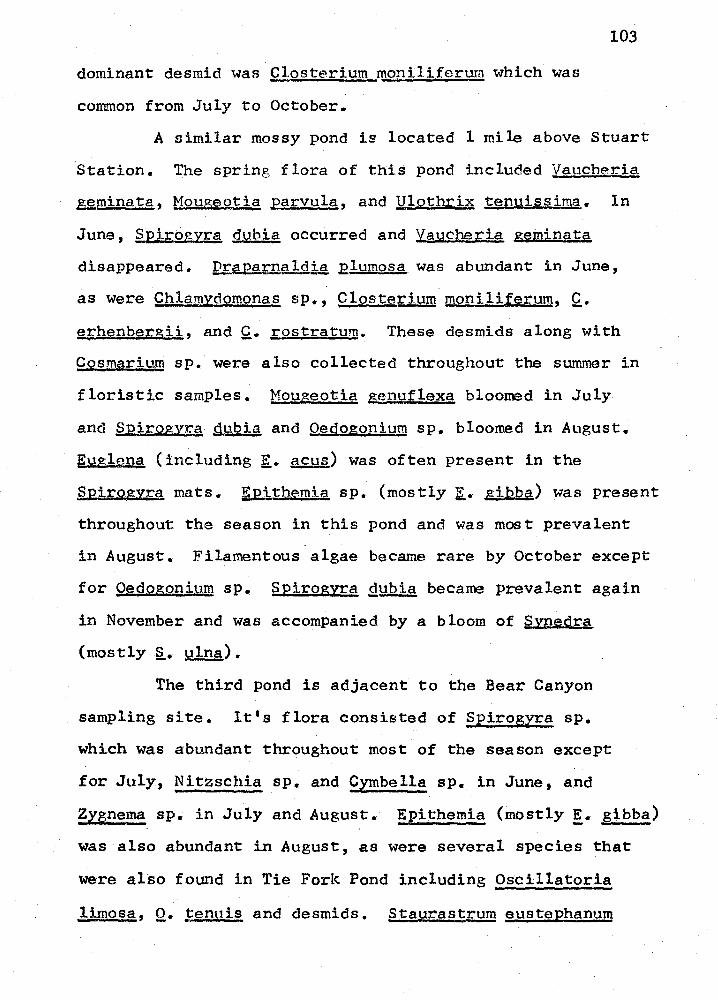
dominant desmid was Closterium moniliferurn which was
common from July to October.
103
A similar mossy pond is located 1 mile above Stuart
Station. The spring flora of this pond included Vaucheria
~~minata, Mougeotia £arvula, and YlQthrix tenuissima. In
June, ~Eirogyra dubia occurred and Yaucheri_g g~minata
disappeared. ~earpaldi~ £lumosa was abundant in June,
as were Chlam_ydomonas sp., Closter:tum woniliferum, Q.. erhenb~rgii, and Q. rostratum. These desmids along with
C9smarium sp. were also collected throughout the summer in
floristic samples. Mougeotia g~nuflexa bloomed in July
and Spirogyra gubi! and O~ogonium sp. bloomed in August.
~ena (including K. acus) was often present in the
§.£irogyra mats. EE.,itllemi 2 sp. (mostly K• gihb~) was present
throughout the season in this pond and was most prevalent
in August. Filamentous algae became rare by October except
for Oedoggnium sp. [~irogn:a 2ubia became prevalent again
in November and was accompanied by a bloom of Syned,ra
(mostly~. ulna).
The third pond is adjacent to the Bear Canyon
sampling site. It's flora consisted of Spirogyra sp.
which was abundant throughout most of the season except
for July, Nitzschia sp. and Cymbella sp. in June, and
Z;rgnema sp. in July and August. Epithemia (mostly E. gibba)
was also abundant in August, as were several species that
were also found in Tie Fork Pond including Oscillatoria
limosa, Q. tenuis and desmids. Staurastrum eusteEhanum
especially was common here in July-September.
In September and October Awphipleura 2ellucide
appeared abundantly in this pond, and Epith~m~ (mostly
~- gibqg_) continued abundant. Early fall filamentous
104
algae included Spirogyra sp .. , Zygnema sp., l::Iougeotia sp.
and Vaucheria g~minata .. Tolypothrix lanata was preva-
lent in September and Oscillatoria tenuis became abundant
in October. Chara yulgaris was present in this pond during
the summer and fall season but did not form the extensive
mats found in Tie Fork Pond.
Algal Flora of Huntington Canyon
Huntington Creek is a cold, clear, fast-flowing,
calcareous stream, which supports a diverse algal flora
adapted to these conditions. Diatoms are the most abundant
algae present occurring throughout the year on the substrate
and in the plankton. The dominant genera are Navicula,
Cyrnbella, ~Qrr~honema, Nitzschia, ~ynedra, Achnanthes, and
Diatoma. Diatoms show maximum production on the substrate
in late spring and early summer and in late fall and early
winter.
Benthic diatoms are the main contributors to the
nannoplankton, and the composition and seasonal fluctuations
of the nannoplankton are largely determined by _similar ..
fluctuations on the substrate. Water level fluctuations,
water temperature changes and mechanical disturbances also
appear to be factors influencing nannoplankton levels.
105 Periphyton colonization is higher in the Right
Fork of Huntington Creek than lower in the canyon, and
nannoplankton amounts increase as the water moves down-
stream. However, the increase is not entirely cumulative
since destruction of cells occurs in the turbulent water.
True planktonic algae including ~sterion~lla
formosa, Fragilaria crotonensis, pinobryon cylindricum,
and Pandorina morum occur in the plankton of Huntington
Creek. These algae are thought to originate. in reservoirs
on the upper drainage of the Left Fork of Huntington Creek,
and their occurrence in the creek basically correlates with
algal cycles in these reservoirs.
Filamentous algae are also important constituents
of the Huntington Creek algal flora. Bydrurus foeti.dus
grows profusely from late winter to early summer especially
in the upper reaches of the canyon forming thick
mucilagineous growths on stones and rocks on the stream bed.
Blue-green algae are present on the creek substrate through-
out the year but show highest production during summer and
fall when encrusted communities form on the stony substrate.
Other filamentous algae present in the canyon include
Ulothrix tenuissima, ~- zonata, and ~tigeoclonium stagna-
which occur mostly in the spring and ~oug~otia spp.,
eEirogyra spp., Zygnema spp. and Vaucheria geminata which
grow in backwaters, pools and ponds along the creek
through the summer and fall.
Fragments from these filamentous algae are an
106
important source of net plankton, and their abundance in
the plankton correlates with their production on the
substrate. H. foetidus fragments are prevalent in the
plankton in the spring and filaments of blue-green algae
occur in large quantities during October and November.
Most filamentous green algae occur during the s~er
months, and they are most prevalent in the Right Fork
where protected areas along the stream channel allow for
their development. Most of these filamentous algae are
quickly destroyed as they are carried downstream by the
current.
Cladophora glomerata and O~qogonium sp. also
occur in significant numbers in Huntington Creek. Q.
glomerata is most abundant in the lower reaches of the Right
Fork during the fall, and Oedggonium sp. is most abundant
in the upper Right Fork during the same period. These
genera are likewise prevalent in the lower Huntington Creek
as it flows through Castle Valley where they form long
streamers from the stones during late spring and early summer.
Phara vulsaris occurs in lower Huntington Creek
from July to December forming large mats and sometimes
fillings large sections of the stream channel.
Diatoms important in the flora of the lower
Huntington Creek include Navicula, Nitzschia, Diatoma,
Gomphonema, Synedra, Surirella, and Cymbella, Cocconeis,
Achnanthes, and Cyclotella.
Ponds in the drainage support abundant summer algal

floras. Filamentous algae and planktonic algae are
especially abundant. Desmids also occur in these ponds
as do such motile genera as Qhlamydomonas, guelena and
Trachelornonas.
107
108
LITERATURE CI TED
Allen, Winfred E. 1920. A quantitative and statistical study of the plankton of the San Joaquin River and its tributaries in and near Stockton, California in 1913. Univ. of Calif. Pub. in Zool., 22(1):1-292 •.
American Public Health Association (APHA), American Water Pollution Control Federation (WPCF), American Water Worlcs Association (AWWA). 1971. Standard methods for the examination of water and waste-water. 13th ed. American Public Health Association, Washington, D. C. 874 pp.
Blum, John L. 1956. The ecology of river algae. Bot. Rev., 22(5)1291-341.
---· 1957. Michigan. An ecological study of the Saline River,
Hydrobiologia, 91361-408.
Brinley, F. J. 1950. Planlcton populations of certain lakes and streams in the Rocky Mountain National Park, Colorado. Ohio Jour. Sci., 50,243-250.
Butcher, R. W. 1932. Studies in the ecology of rivers, 11. The microflora of rivers with special reference to the algae of the river-bed. Ann. Bot., 461813-861.
Chatwin, s. L. 1956. The vertical distribution of phyto-plankton of Deer Creek Reservoir, Wasatch Co., Utah. M.A. Thesis, Univ. of Utah, Salt Lake City.
Clark, William J. 1956. An evaluation of methods of concentrating and counting the phytoplankton of Bear Lake, Utah-Idaho. M.S. Thesis, Utah State Univ., Logan, Utah.
____ • 1958. The phytoplankton of the Logan River, Utah, a mountain stream. Ph.D. Thesis, Utah State Univ., Logan, Utah.
Dillard, Gary E. 1966. A floristic and ecological study of benthic algae in two North Carolina streams. Ph.D. Thesis, North Carolina State Univ., Raleigh, North Carolina.
109
Dustans, William A. 1951. A comparative study of dredged and undredged portions of the Provo River, Utah. M.s. Thesis, Univ. of Utah, Salt Lake City.
Coombs,
Daily,
Robert. 1964. A floristic and ecological survey of the algal flora of the western Uinta Mountains and adjacent areas. M.S. Thesis, Univ. of Utah, Salt Lake City.
William A. 1938. A quantitative study of the phytoplankton of Lake Michigan collected in the vicinity of Evanston, Illinois. Butler Univ. Bot. Studies, 4165-83.
Daubenmire, R. 1968. Plant communities. Harper and Row, New York. 300 pp.
Dor, Inka. 1970. Production rate of the periphyton in Lake Tiberias as measured by the Glass-Slide Method. Israel J. of Bot., 1911-15.
Dutton, C. E. 1880. Report on the geology of the high plateaus of Utah. u. s. Geog. and Geol. Surv., Gov 1t Printing office, Washington D. c. 307 pp.
Flowers, Seville. 1959. Vegetation of Glen Canyon. In Ecological studies of the flora and fauna in Glen Canyon. Univ. Utah Anthropological Papers, 40121-61.
----• 1960. Vegetation of Flaming Gorge Reservoir Basin. In Ecological studies of the flora and fauna of Flaming Gorge Reservoir Basin, Utah and Wyoming. Univ. Utah Anthropological Papers, 48,1-48.
____ • n.d. (a). Common algae of Utah. Univ. of Utah. 70 pp. Mimeo.
----• n.d. of Utah. (b). The blue•gree algae of Utah.
69 pp. Mimeo. Univ.
Foerster, J. A. and B. s. Corrin. 1970. Preliminary study of the Dulaney Valley Stream. Publ. #1, Environ-mental Studies Program, Goucher College, Baltimore, Maryland.
Fritsch, F. F. 1906. Problems in aquatic biology with special reference to the study of algal periodicity. New Phytol., 51149-169.
110
Galtsoff, P. s. 1924. Li.mnological observations in the Upper Mississippi. u.s. Bur. Fish. Bul., 39,347-438.
Hanna, G.D. 1949. A synthetic resin which has unusual properties. J. Roy. Microscop. Soc. London, Ser. 3, 69{1)125-28. ·
Hohn, M. H. and J. Hellerman. 1963. The taxonomy and structure of diatom populations from three eastern North American Rivers using three sampling methods. Trans. Amer. Microscop. Soc., 821250-329.
Hynes, H.B. N. 1970. The ecology of running waters. Univ. of Toronto Press, Toronto, Canada. 555 pp.
Kofoid, c. A. 1903. The plankton of the Illinois River, 1894-1899, with introductory notes upon the hydrography of the Illinois River and its basin, Part I. Quantitative investigations and general results. Bul. Ill. St. Nat. Hist. Surv., 6195-629.
____ • 1908. The plankton of the Illinois River, 1894-1899, Part II. Constituent organisms and their seasonal distribution. Bul. Ill. St. Nat. Hist. Surv., 8:1-360.
Longley, Glenn J. 1969. Plankton associations in Antelope Flat area, Flaming Gorge Reservoir. Ph.D. Thesis, Univ •. of Utah, Salt Lake City.
McConnell, William J. and w. F. Sigler. 1959. and productivity in a mountain river. and Ocean., 41335-351.
Chlorophyll Limnol.
McNabb, Clarence. 1960. Enumeration of freshwater phyto-plankton concentrated on the membrane filter. Limnol. and Ocean., 4157-61.
Miller, Grant L. 1959. An investigation of pollution in the Price River Carbon County, Utah. M.S. Thesis, Univ. of Utah, Salt Lake City.
Moghadam, Fatemeh. 1969. Ecological and systematic study of plankton diatom communities in Flathead Lake, Montana. Ph.D. Thesis, Univ. of Utah, Salt Lake City.
Newcombe, Curtis L. 1949. Attachment materials in relation to water productivity. Trans. Aroer. Microsc. Soc., 64(4)1355-361.
111
Norrington, Annie. 1925. Phycological study of the Wasatch and Uinta Ranges in Utah. Ph.D. Thesis, Univ. of Chicago, Chicago.
Odum, H. T. 1957. Trophic structure and productivity of Silver Springs, Florida. Ecol. Monogr., 27155-112.
Palmer, Mervin c. 1961. Algae in rivers of the United States. In Algae and metropolitan wastes, Trans. 1960 Seminar. R.A. Taft San. Eng. Ctr., Cincinnati, Ohio, Tech. Rpt. W61-3,34-38.
Palmer, Mervin c. and T. E. Maloney. 1954. A new counting slide for nannoplankton. Amer. Soc. Limnol. Ocean., Spec. Publ. No. 21, 6 pp.
Patrick, Ruth, M. H. Hohn, and J. H. Wallace. 1954. A new method for determining the pattern of the diatom flora. Notul. Nat. Acad. Philad., No. 259,1-12.
Piranian, George. 1937. The plankton of the Bear River Migratory Water Fowl Refuge, Utah. M.s. Thesis, Utah State Univ., Logan, Utah.
Pratt, Gene A. 1957. Studies on the periodicity of certain plankton species of Salem Lake, M.S. Thesis, Brigham Young University, Provo, Utah.
Prescott, Gerald W.' 1962. Algae of the western Great Lakes area. Wm. c. Brown Co., Dubuque, Iowa. 977 pp.
Quinn, Barry G. 1958. The effects of sugar beet wastes upon the periphyton of the Jordan River. M.A. Thesis, Univ. of Utah, Salt Lake City.
Rice, c. H. 1938. Studies in the phytoplankton of the River Thames. Ann. Bot., 21539-581.
Samuelson, John A. 1950. A quantitative comparison of the algal populations in two Wasatch Mountain streams. Proc. Utah Acad. Sci., Arts and Letters, 27176.
Sladeckova, Alena. 1962. Limnological investigation methods for the periphyton community. Bot. Rev., 281 287-350.
Smith, Gerald R. 1959. Effects of pollution on the Weber River, Utah. M.S. Thesis, Univ. of Utah, Salt Lake City.
112
Spieker, E. M. and J. B. Rees ide Jr. 1925. Cretaceous and Tertiary formations of the Wasatch Plateau, Utah. Geol. Soc. Amer. Bul., 361435-454.
Spieker, E. M. and M. P. Billings. 1940. Glaciation and the Wasatch Plateau, Utah. Geol. Soc. Amer. Bul., 5111,173-1,198.
- u. s. Dept. Interior, U. s. Dept. Agriculture, and u. s. Dept. Transportation. 1971. Draft of environmental statement Huntington Canyon generation station and transmission line. 90 pp.
Ward, Henry B. and George c. Whipple. 1918. Fresh-water biology. John Wiley and Sons, Inc., New York,
Weber,
Weber,
N. Y. 1,111 pp.
Cornelius I. 1970." Methods of collection and analysis of plankton and periphyton samples in the water pollution surveillance system. Fed. Water Qual. Admin., Div. of Water Qual. Res., Anal. Qual. Control Lab., Cincinnati, Ohio. 22 pp.
Cornelius I~ and R. L. Raschlce. 1970. Use of a floating periphyton sampler for water pollution surveillance. Fed. Water Qual. Admin., Div. of Water Qual. Res~, Anal. Qual. Control Lab., Cincinnati~ Ohio. 26 pp.
Welch, P. s. 1952. Limnology. 2nd Ed. McGraw-Hill Book Co., New York, N.Y. 538 PP~
Whitford, L.A. and G. J. Schumacher. 1963. Communities of algae in North Carolina streams and their seasonal relations.. Hydrobiologia, 221133-196.
Young, Orson W. 1945. A limnological investigation of periphyton in Douglas Lake, Michigan. Trans. Amer. Microsc. Soc., 6411-20.
Zhadin, v. I. ands. v. Gerd. 1961. Fauna and flora of the rivers, lakes, and reservoirs, of the u.s.s.R. tran. 1963, Israel Program for Scientific Translations, Jerusalem, Israel.

113
.APPENDIX I
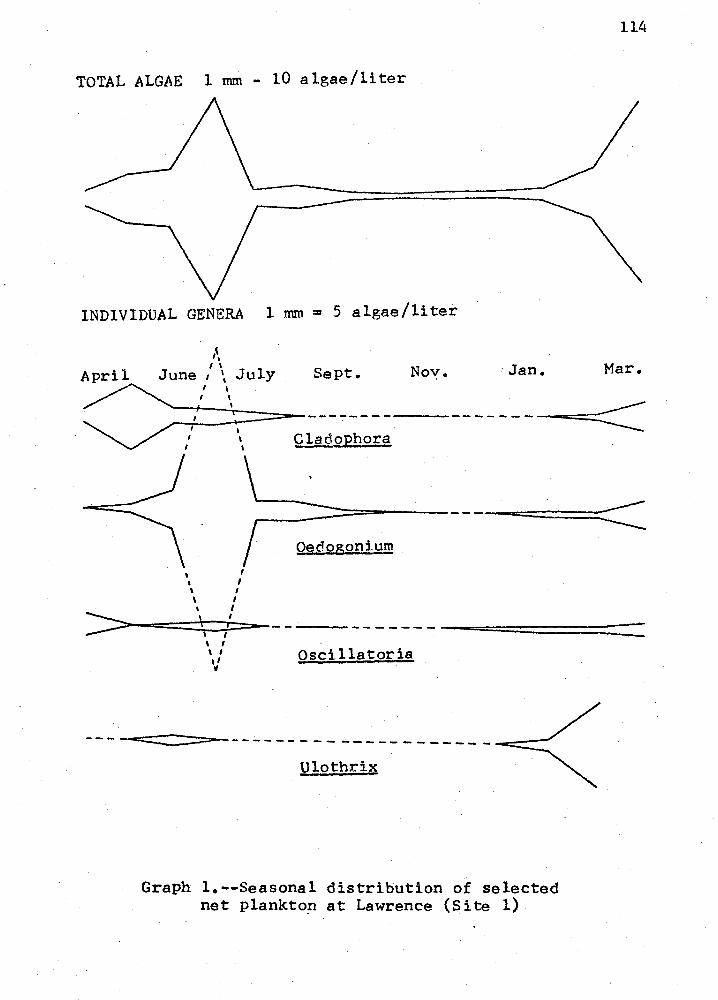
114
TOTAL ALGAE 1 mm - 10 algae/liter .
INDIVIDUAL GENERA 1 mm= 5 algae/liter
,, '
April I ' July June I ' ' I \ I
' I ' I \
I I
\ I ' I \ I
\ I ' I > \ I >---=:::::::j•==:=!:• ===--1 ,
\ I \ I \ I .,
Sept. Nov. Jan. Mar.
-------- ---------=-< ----====<
Oedogonium
-----------========::::::== Oscillatoria
--------========-- -- ------------------------Ulothrix
Graph 1.--Seasonal distribution of selected net planktop at Lawrence (Site 1)
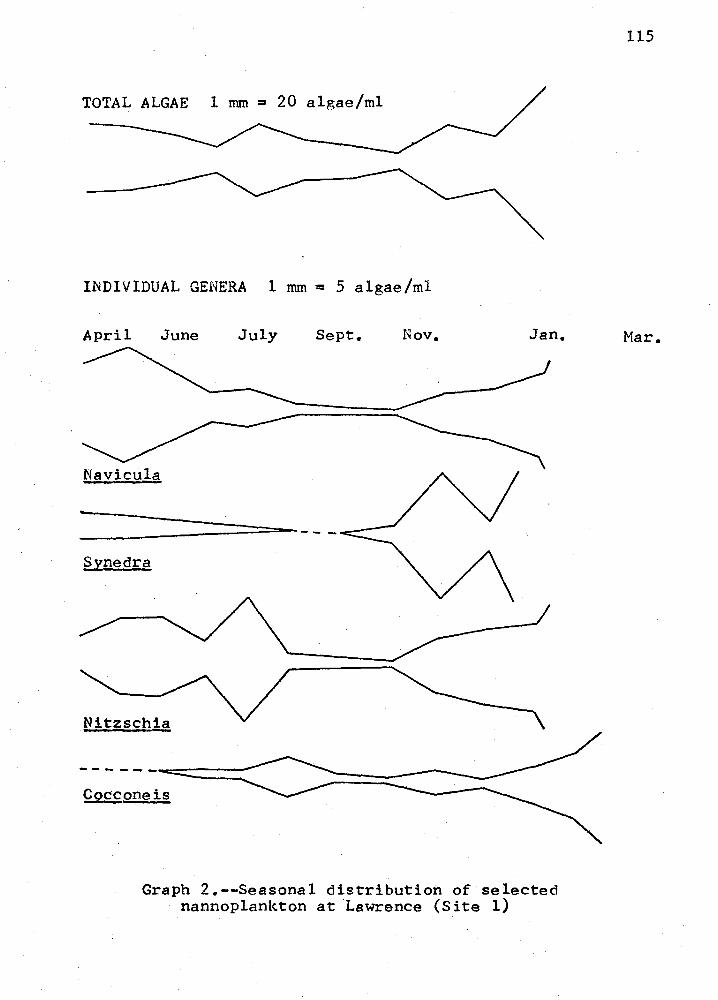
TOTAL ALGAE 1 mm= 20 algae/ml
INDIVIDUAL GENERA 1 mm= 5 algae/ml
April June July Sept. Nov. Jan.
Navicula
=============-----§.ynedra
Nitzschia ............................ _ Cocconeis
Graph 2.--Seasonal distribution of selected nannoplankton at Lawrence (Site 1)
115
Mar.
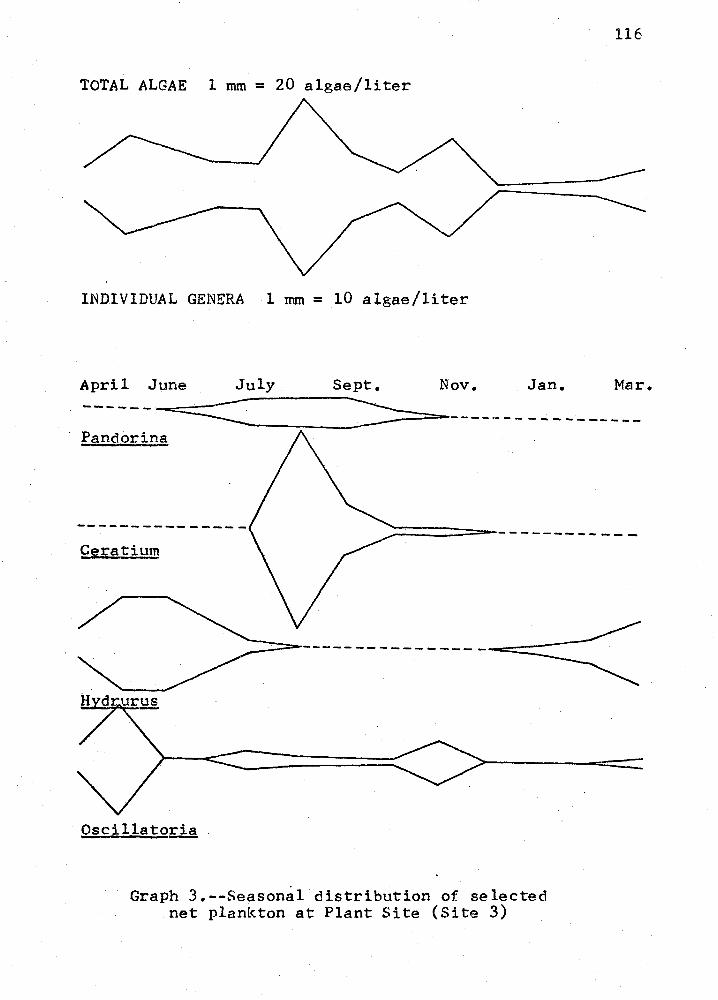
116
TOTAL ALGAE 1 mm= 20 algae/liter
INDIVIDUAL GENERA 1 mm= 10 algae/liter
April June July Sept. Nov. Jan. Mar.
------ --==:::::::::-. --::::=-=====------------------Pandorina
---------- ---- - ...:::======-------------Ceratium
Oscillatoria
Graph 3.--Seasonal distribution of selected net plankton at Plant Site (Site 3)
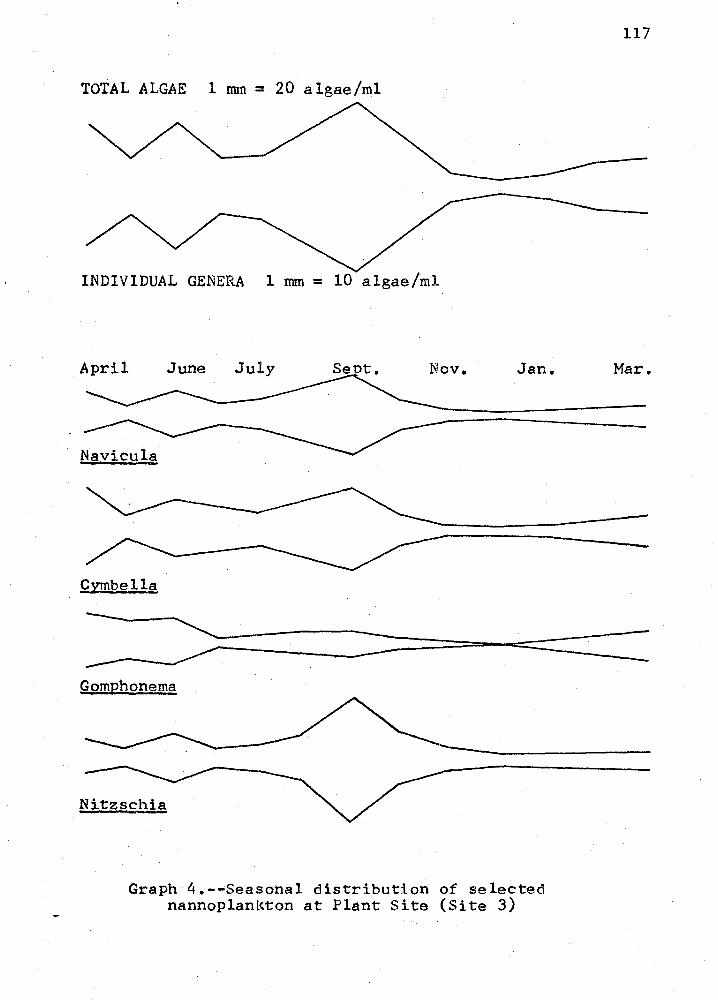
117
TOTAL ALGAE 1 mm = 20 algae/ml
INDIVIDUAL GENERA 1 mm= 10 algae/ml
April June July Seot. Nov. Jan. Mar.
Navicula
Qymbella
= =:::-= ---=========----========= Gomphonema
Nitz s c.!:!i!.
Graph 4.--Seasonal distribution of selected nannoplankton at Plant Site (Site 3)
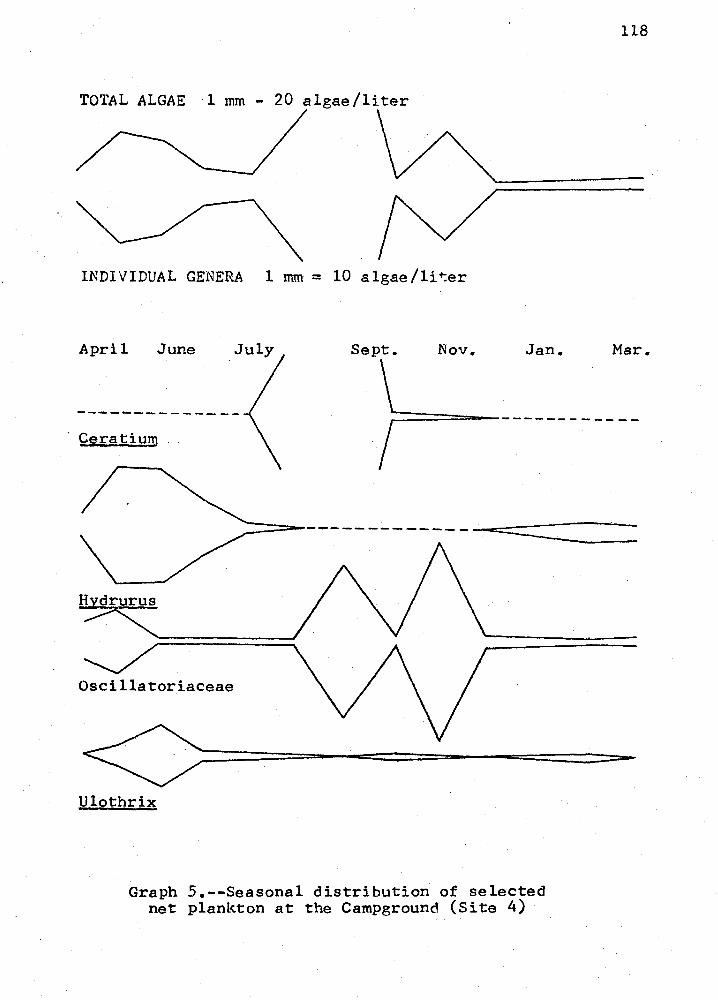
TOTAL ALGAE 1 mm - 20 algae/liter
INDIVIDUAL GENERA 1 mm= 10 algae/li~er
April June Sept. Nov. Jan.
--------------· Ceratium
Oscillatoriaceae
Ulothrix
Graph 5.--seasonal distribution of selected net plankton at the Campground (Site 4)
118
Mar.
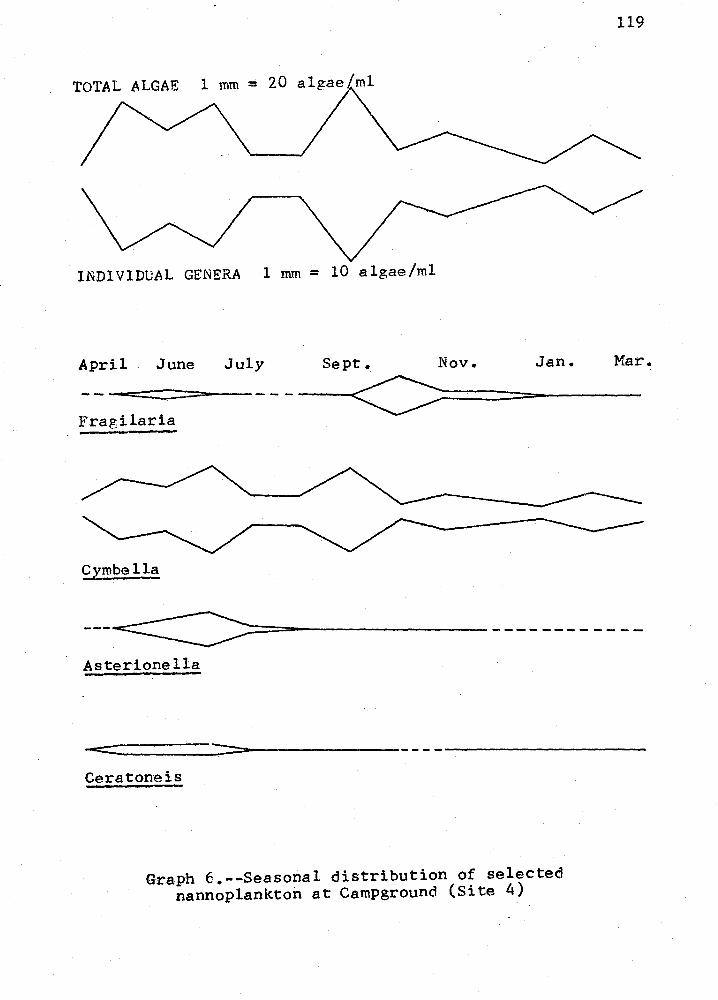
119
TOTAL ALGAE 1 mm= 20 algae/ml
INDIVIDUAL GENERA 1 mm= 10 algae/ml
April June July Sept. Nov. Jan. Mar.
Fragilaria -<=:::::::::==::::=----
Cymbella
::::==--------------------Asterionella
....., _____ __:::::=-----------------------Ceratoneis
Graph E.--Seasonal distribution of selected nannoplankton at Campground (Site 4)
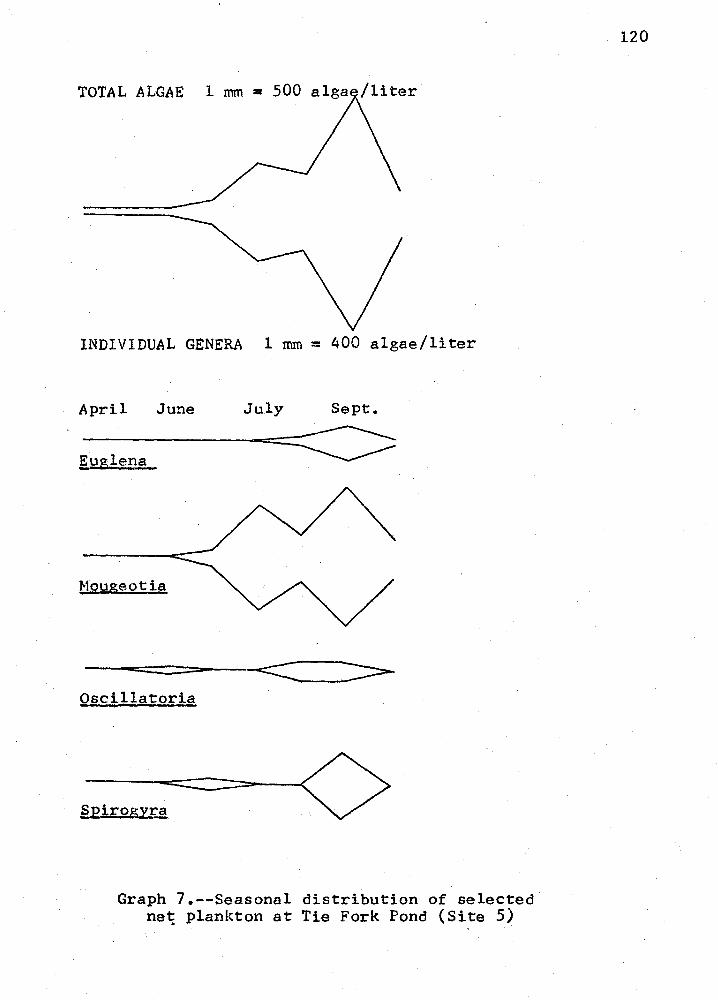
TOTAL ALGAE 1 mm• 500 alga /liter·
INDIVIDUAL GENERA 1 mm= 400 algae/liter
April June July Sept.
Euglena
Mougeotia
--====-----~ Oscillatoria
Graph 7.--Seasonal distribution of selected net plankton at Tie Fork Pond (Site 5)
120
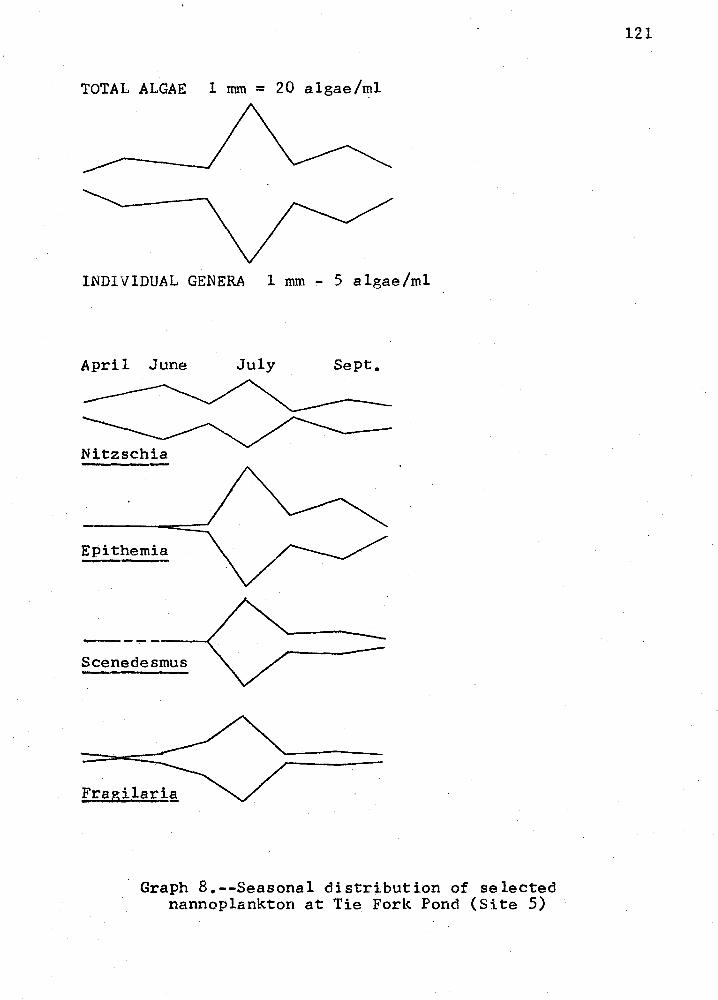
TOTAL ALGAE 1 mm= 20 algae/ml
INDIVIDUAL GENERA 1 mm - 5 algae/ml
April June July Sept.
Epithemia
-------c Scenedesmus
Fragilari~
Graph 8.--Seasonal distribution of selected nannoplankton at Tie Fork Pond (Site 5)
121
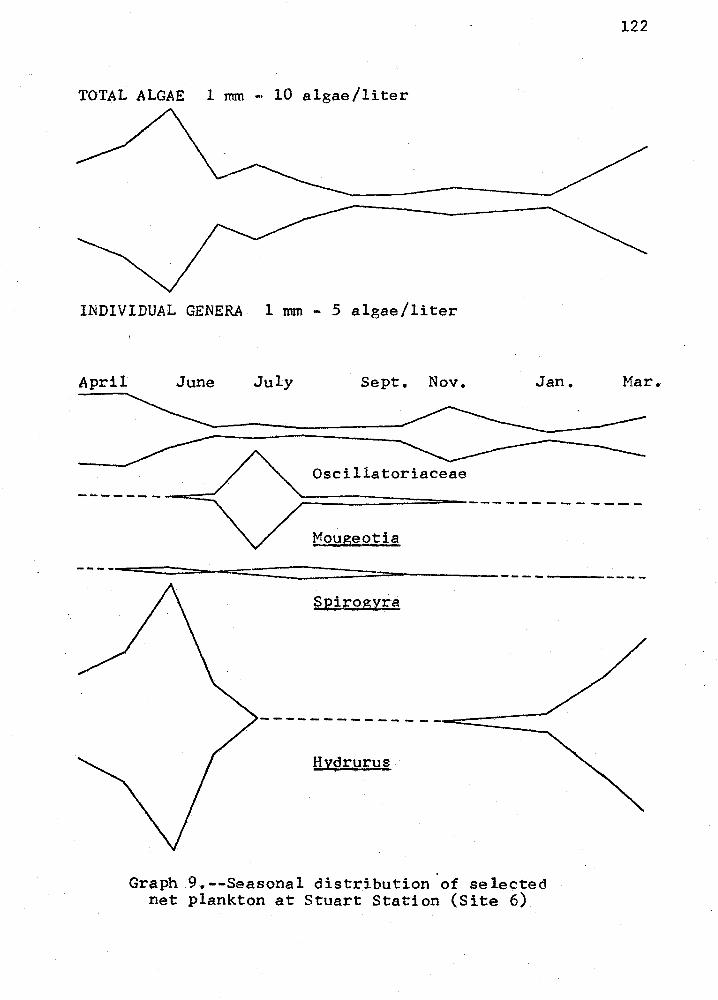
122
TOTAL ALGAE 1 mm •· 10 algae/liter
INDIVIDUAL GENERA 1 mm - 5 algae/liter
April June July Sept. Nov. Jan. Mar. --........
Oscillatoriaceae --------== ~========--------------
t:'fougeotia
-===--==========------------Spirogyrti
tJydrurus
Graph 9.--Seasonal distribution ·of selected net plankton at Stuart Station (Site 6)
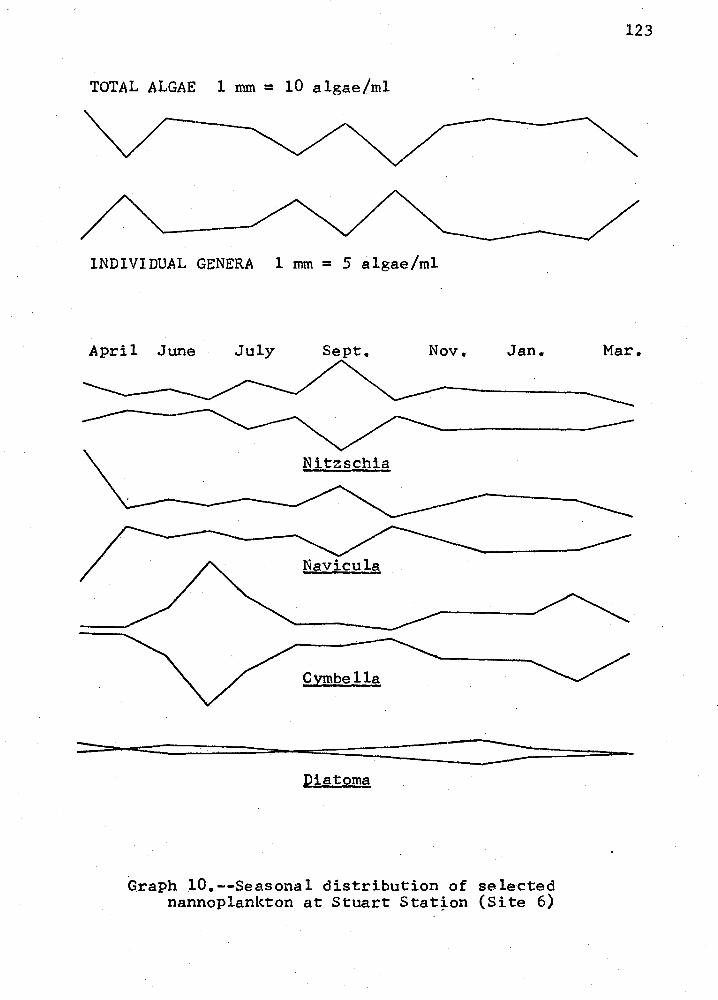
123
TOTAL ALGAE 1 mm= 10 algae/ml
INDIVIDUAL GENERA 1 mm= 5 algae/ml
April June July Sept. Nov. Jan. Mar.
------Navicula
Cymbella
Diatoma
Graph 10.--Seasonal distribution of selected nannoplankton at Stuart Stat~on (Site 6)
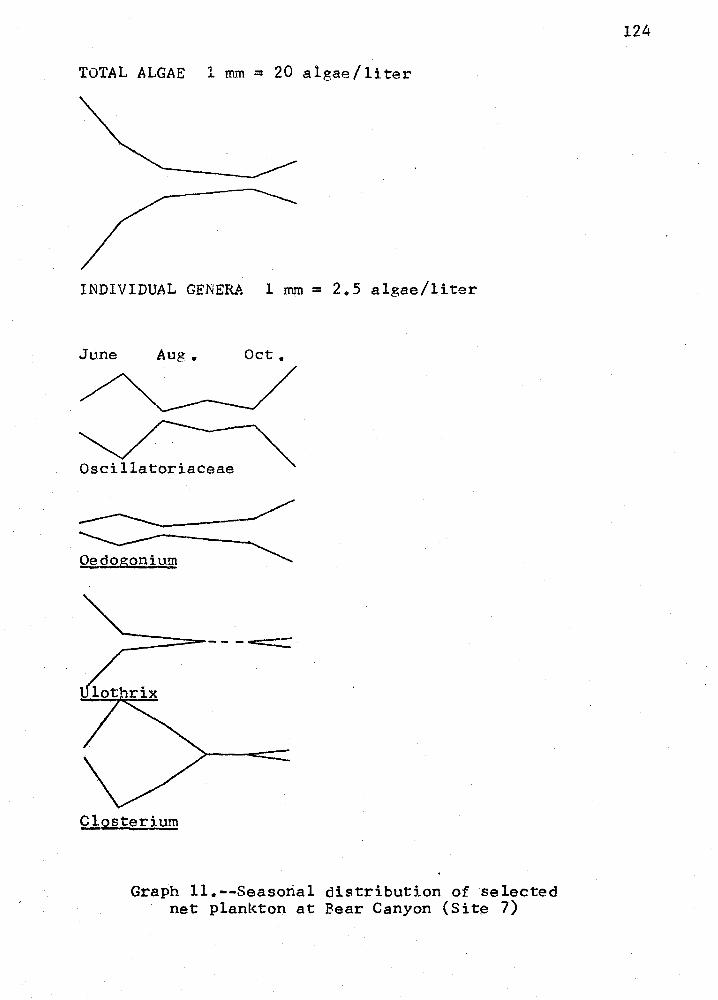
TOTAL ALGAE 1 mm= 20 algae/liter
INDIVIDUAL GENERA 1 mm= 2.5 algae/liter
June Aug. Oct.
Oscillatoriaceae
~Q_Qgonium
========---- --c::::::::::
Closterium
Graph 11.--Seasorial distribution of selected net plankton at Bear Canyon (Site 7)
124

125
APPENDIX 11
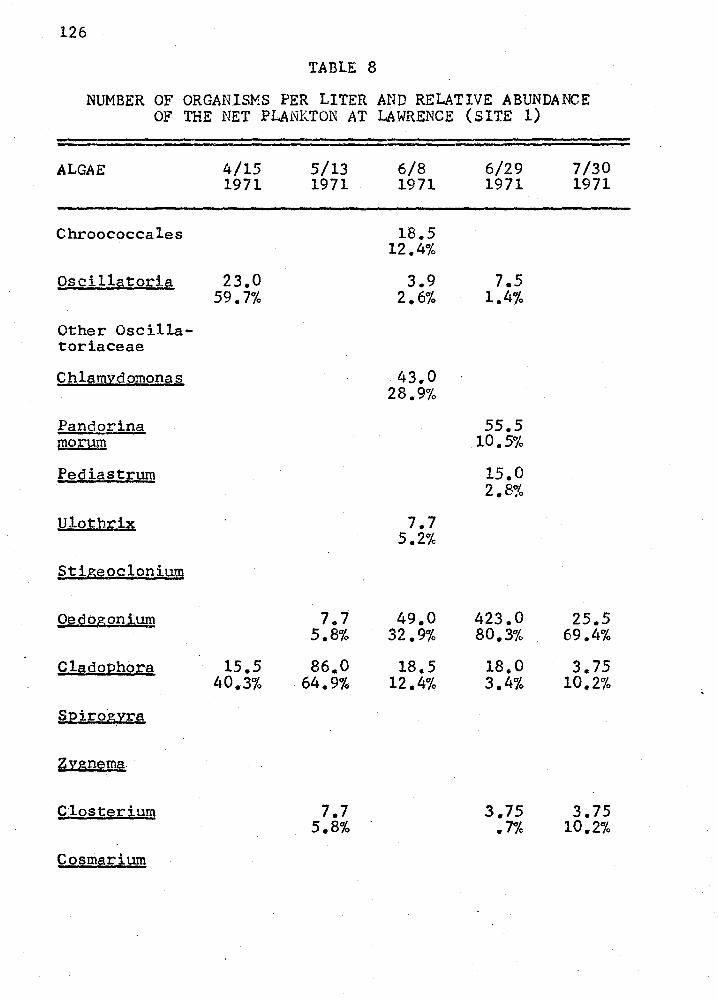
126
TABLE 8
NUMBER OF ORGANISMS PER LITER AND RELATIVE ABUNDANCE OF THE NET PLANKTON AT LAWRENCE (SITE 1)
ALGAE 4/15 5/13 6/8 6/29 7/30 1971 1971 1971 1971 1971
Chroococcales 18.5 12.4%
Oscills1.toria 23.0 3.9 7.5 59.7% 2.6% 1.4%
Other Oscilla-toriaceae
C hlam:2:d omona s 43.0 28.9%
Pandorina 55.5 morum 10.5%
Pediastrum 15.0 2.8%
Uloth;i;:ie 7.7 5.2%
.§tigeoclonium
O~i;logon,!um 7.7 49.0 423.0 25.5 5.8% 32.9% 80.3% 69.4%
Clago]2ho,t:a 15.5 86.0 18.5 18.0 3.75 40.3% 64.9% 12.4% 3.4% 10.2%
SEirogyra
~ygnema
Closte;i;:ium 7.7 3.75 3.75 5.8% .7% 10.2%
Cosrnarium
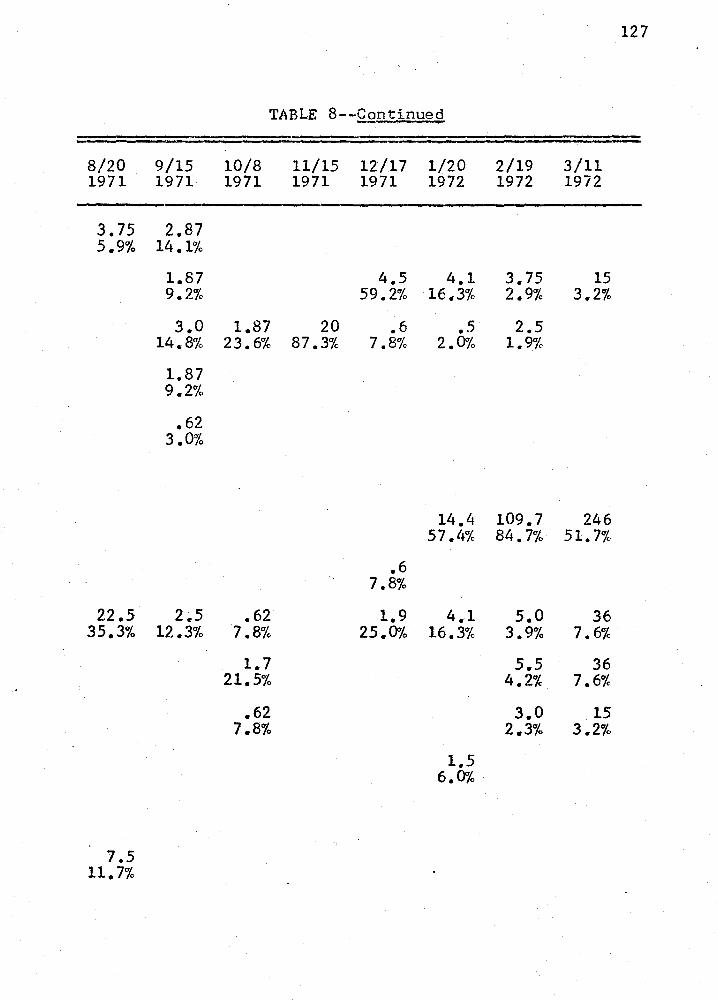
8/20 1971
3.75 5.9%
22.5 35.3%
7.5 11.7%
9/15 1971
2.87 14.1%
1.87 9.2%
3.0 14.8%
1.87 9.2%
.62 3.0%
2.5 12.3%
TABLE 8--Continued
10/8 11/15 12/17 1/20 1971 1971 1971 1972
4.5 4.1 59.2% 16~3%
1.87 20 .6 • .5 23.6% 87.3% 7.8% 2.0%
14.4 57.4%
.6 7.8%
• 62 1.9 4.1 7.8% 25. 0'/4 16.3%
1.7 21.5%
.62 7.8%
1.5 6.0%
127
2/19 3/11 1972 1972
3.75 15 2.9% 3.2%
2.5 1.9%
109.7 246 84.7% 51. 7%
s.o 36 3.9% 7 .6%
5.5 36 4.2% 7.6%
3.0 15 2.3% 3.2%
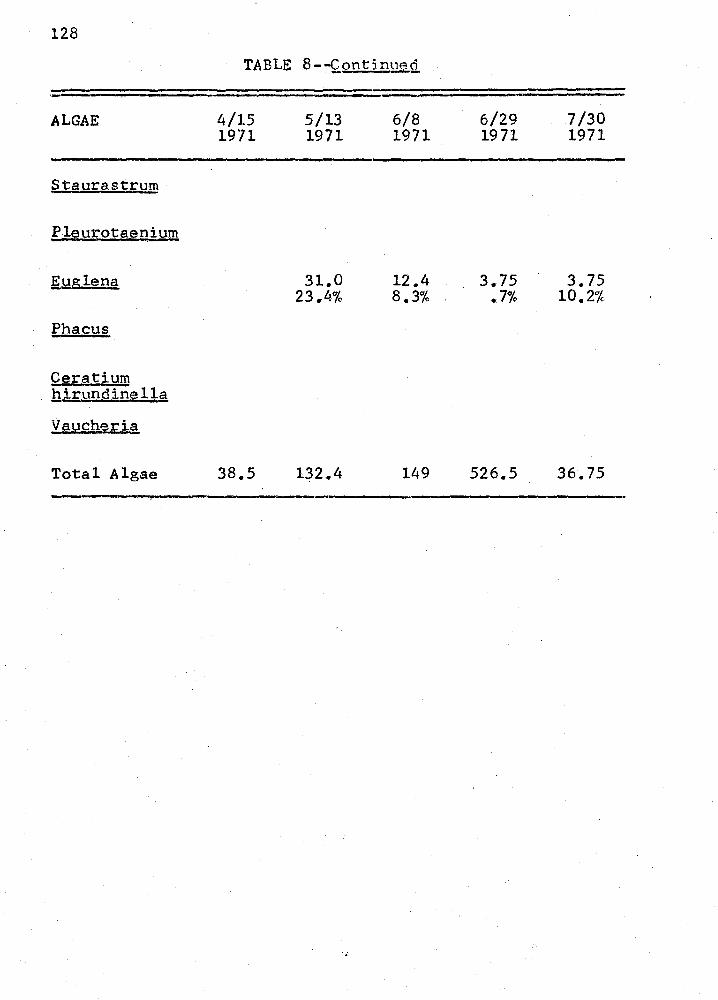
128
TABLE 8--£.ontinued
ALGAE 4/15 5/13 6/8 6/29 7/30 1971 1971 1971 1971 1971
Staurastrum
Pleurotaenium
f:uglena 31.0 12.4 3.75 3.75 23.4% 8.3% .7% 10.2%
Phacus
Ceratium hirundinella
Vaucheria
Total Algae 38.5 132.4 149 526.5 36.75 --
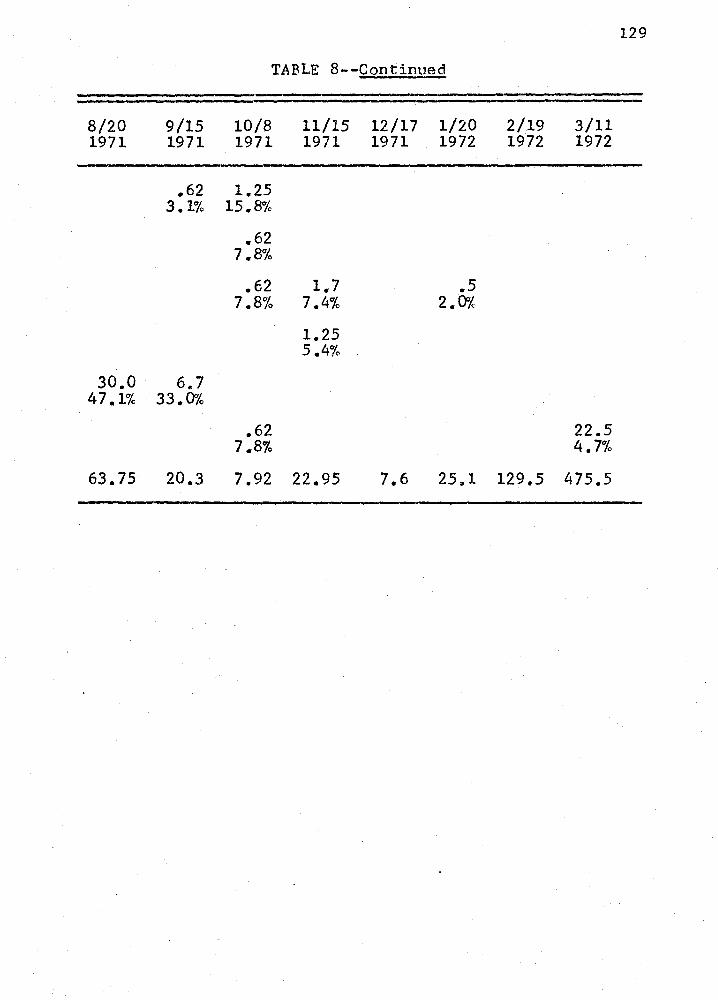
129
TABLE 8--Continued
8/20 9/15 10/8 11/15 12/17 1/20 2/19 3/11 1971 1971 1971 1971 1971 1972 1972 1972
.62 1.25 3.1% 15.8%
.62 7 .8%
.62 1.7 .5 7.8% 7.4% 2.0%
1.25 5.4%
30.0 6.7 47 .1% 33.0%
• 62 22.5 7.8% 4.7%
63.75 20.3 7.92 22.95 7.6 25,.l 129.5 475.5
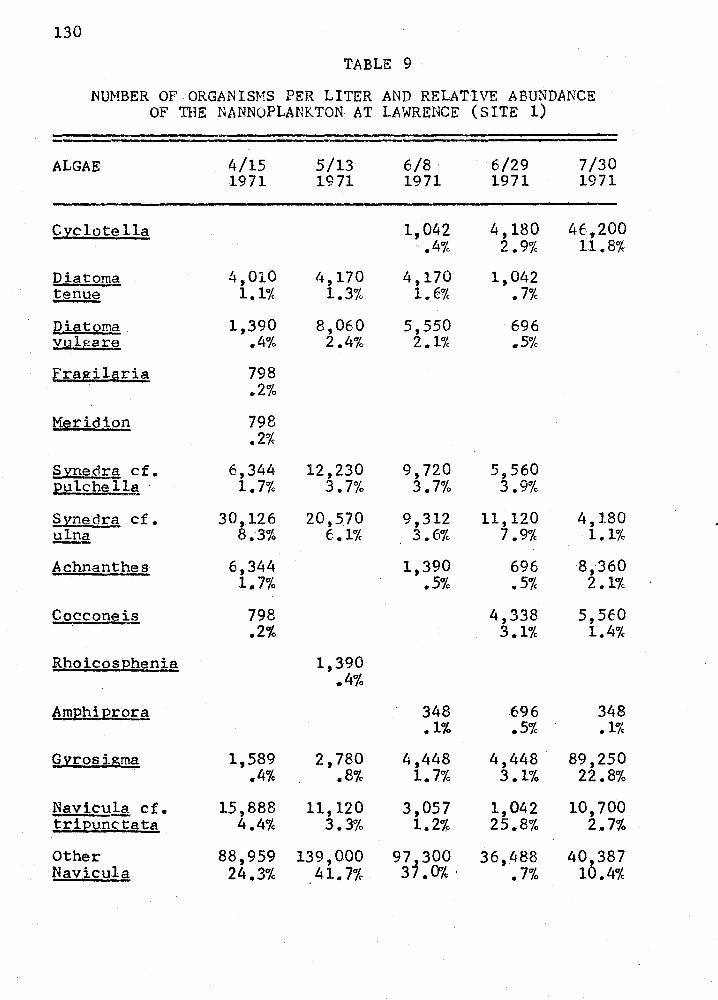
130
TABLE 9
NUMBER OF ORGANISMS PER LITER AND RELATIVE ABUNDANCE OF THE NANNOPLANKTON AT LAWRENCE (SITE 1)
ALGAE 4/15 5/13 6/8 6/29 7/30 1971 1971 1971 1971 1971
ficlote lla 1,042 4,180 46,200 .4% 2.9% 11.8%
Diatoma 4,010 ,~,170 4,170 1,042 tenue 1.1% 1.3% l.E% • 7%
Diatoma 1,390 8,060 5,550 696 vulgare .4% 2.4% 2.1% .5%
FraBilaria 798 .2%
Meridio!} 798 .2%
S ynedri'i cf. 6,344 12,230 9,720 5,560 pulchellg_ 1.7% 3.7% 3.7% 3.9%
S12]edr<1 cf. 30,126 20,570 9,312 11,120 4,180 8.3% 6.1% 3.6% 7.9% 1.1%
Achnanthes 6,344 1,390 696 8,-360 1.7% .5% .5% 2.1%
Cocconeis 798 4,338 5,560 .2% 3.1% 1.4%
Rhoicosphenia 1,390 .4%
AmEhi£rora 348 696 348 .1% .5% .1%
9frosigma 1,589 2,780 4,448 4,448 89,250 .4% .8% 1.7% 3.1% 22.8%
Navicula cf. 15,888 11,120 3,057 1,042 10,700 tripunctata 4.4% 3.3% 1.2% 25.8% 2.7%
Other 88,959 139,000 971300 36,488 400387 Navicula 24.3% 41. 7% 3 .0%. .7% 1 .4%
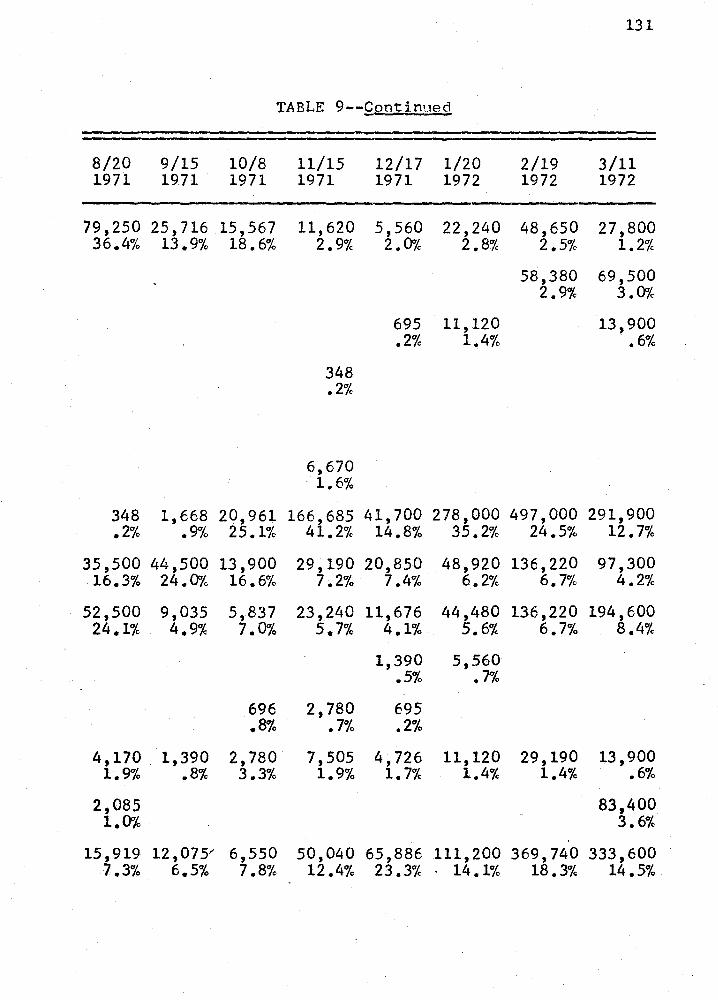
131
TABLE 9--Continued --· . 8/20 9/15 10/8 11/15 12/17 1/20 2/19 3/11 1971 1971 1971 1971 1971 1972 1972 1972
79,250 25,716 15,567 11,620 5,560 22,240 48,650 27,800 36.4% 13.9% 18.6% 2.9% 2.0% 2.8% 2.5% 1.2%
58,380 69,500 2.9% 3.0%
695 11,120 13,900 .2% 1.4% .6%
348 .2%
6,670 1.6%
348 1,668 20,961 166,685 41,700 278,000 497,000 291,900 .2% .9% 25.1% 41.2% 14.8% 35.2% 24.5% 12.7%
35,500 44,500 13,900 29,190 20,850 48,920 136,220 97,300 16.3% 24.0% 16.6% 7.2% 7.4% 6.2% 6.7% 4.2%
52,500 9,035 5,837 23,240 11,676 44,480 136,220 194,600 24.1% 4.9% 7.0% 5.7% 4.1% 5.6% 6.7% 8.4%
1,390 5,560 .5% • 7%
696 2,780 695 .8% • 7% .2%
4,170 1,390 2,780 7,505 4,726 11,120 29,190 13,900 1. 9°/4 .8% 3.3% 1.9% 1.7% 1.4% 1.4% .6%
2,085 83,400 1.0% 3.6%
15,919 12,075" 6,550 50,040 65,886 111,200 369,740 333,600 7.3% 6.5% 7.8% 12.4% 23.3% 14.1% 18.3% 14.5%
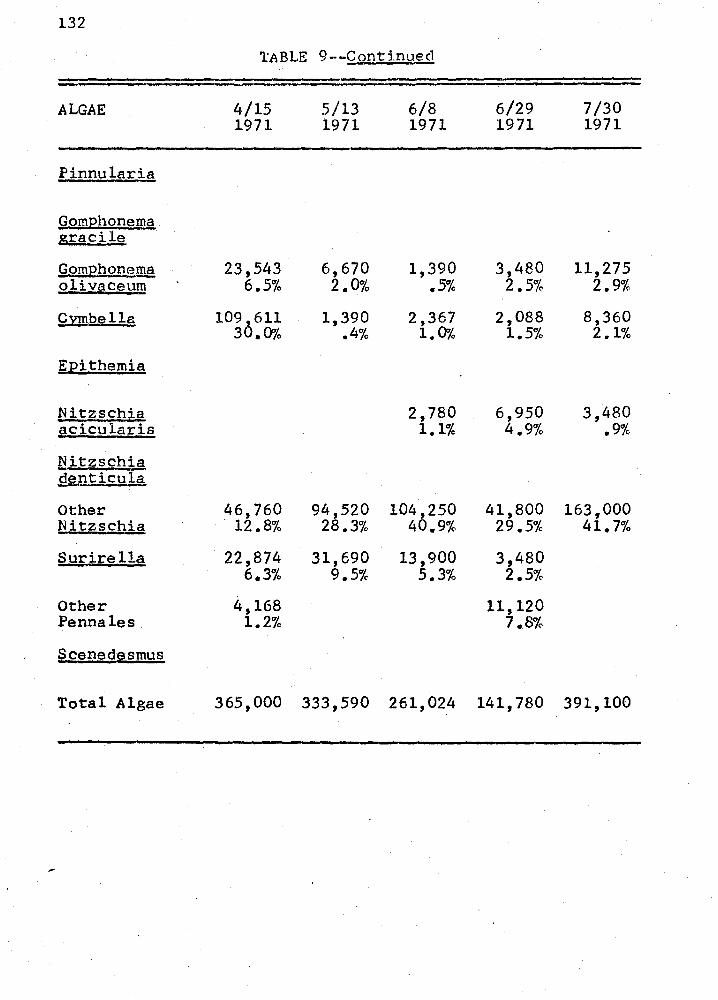
132
TABLE 9--Continued
ALGAE 4/15 5/13 6/8 6/29 7/30 1971 1971 1971 1971 1971
Pinnularia
GomPhonema g,racile
QomE,hone!!!!! 23,543 6,670 1,390 3,480 11,275 olivaceurn 6.5% 2.0% .5% 2.5% 2.9%
CY.mb~lla 1090611 1,390 2,367 2,088 8,360 3 .0% .4% 1.0% 1.5% 2.1%
Epithemia
Nitzschia 2,780 6,950 3,480 acicularis 1.1% 4.9% .9%
Nitzschia ,g~nticu.!£
Other 46,760 94,520 104,250 41,800 163,000 Nitzschia . 12.8% 28.3% 40.,9% 29.5% 41.7%
Surirella 22,874 31,690 13,900 3,480 6.3% 9.5% 5.3% 2.5%
Other 4,168 11,120 Pennales 1.2% 7.,8%
Scenedesmus
Total Algae 365,000 333,590 261,024 141, 780 391,100
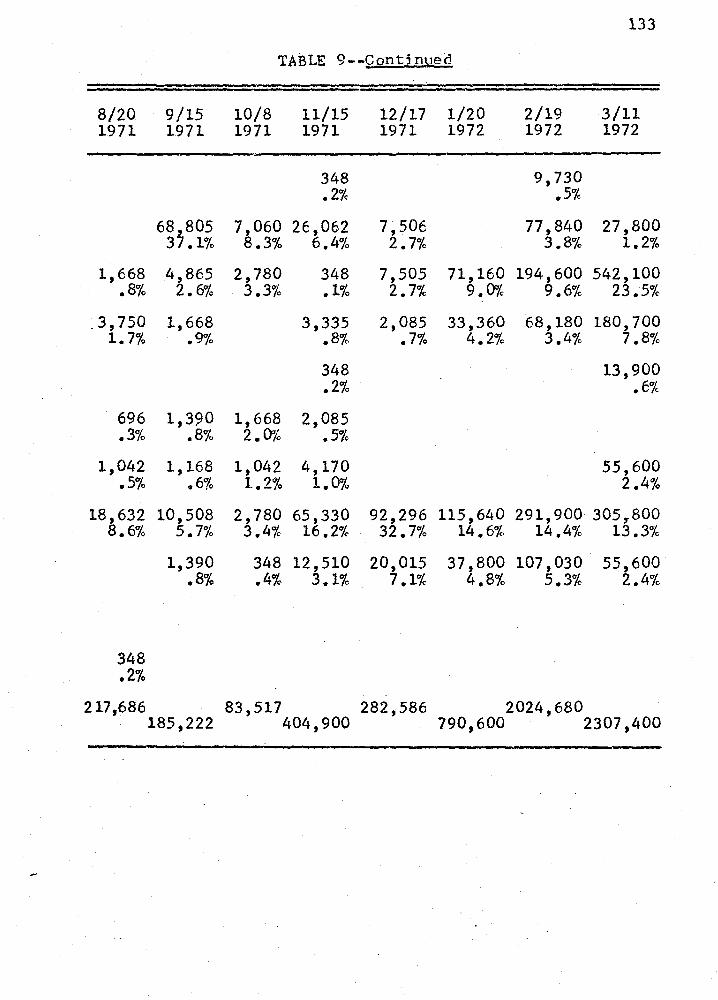
8/20 1971
1,668 .8%
_3,750 1.7%
696 .3%
1,042 .5%
18,632 8.6%
348 .2%
9/15 1971
68,805 37 .1%
4,865 2. 6%
1,668 .9%
1,390 .8%
1,168 .6%
10,508 5.7%
1,390 .8%
133
TABLE 9--CQntinued
10/8 11/15 12/17 1/20 2/19 3/11 1971 1971 1971 1972 1972 1972
348 9,730 .2% .5%
7,060 2E,062 7,506 77,840 27,800 8.3% 6.4% 2.7% 3.8% 1.2%
2,780 348 7,505 71,160 194,600 542,100 3.3% .1% 2.7% 9. 0'/4 9.6% 23.5%
3,335 2,085 33,360 68,180 180,700 .8% .7% 4.2% 3.4% 7.8%
348 13,900 .2% .6%
1,668 2,085 2. 0'/4 .5%
1,042 4,170 55,600 1.2% 1.0% 2.4%
2,780 65,330 92,296 115,640 291,900 305,.800 3.4% 16.2% 32.7% 14.6% 14.4% 13.3%
348 12,510 20,015 37,800 107,030 55,600 .4% 3.1% 7 .1% 4.8% 5.3% 2.4%
217,686 83,517 282,586 2024,680 185,222 404,900 790,600 2307,400
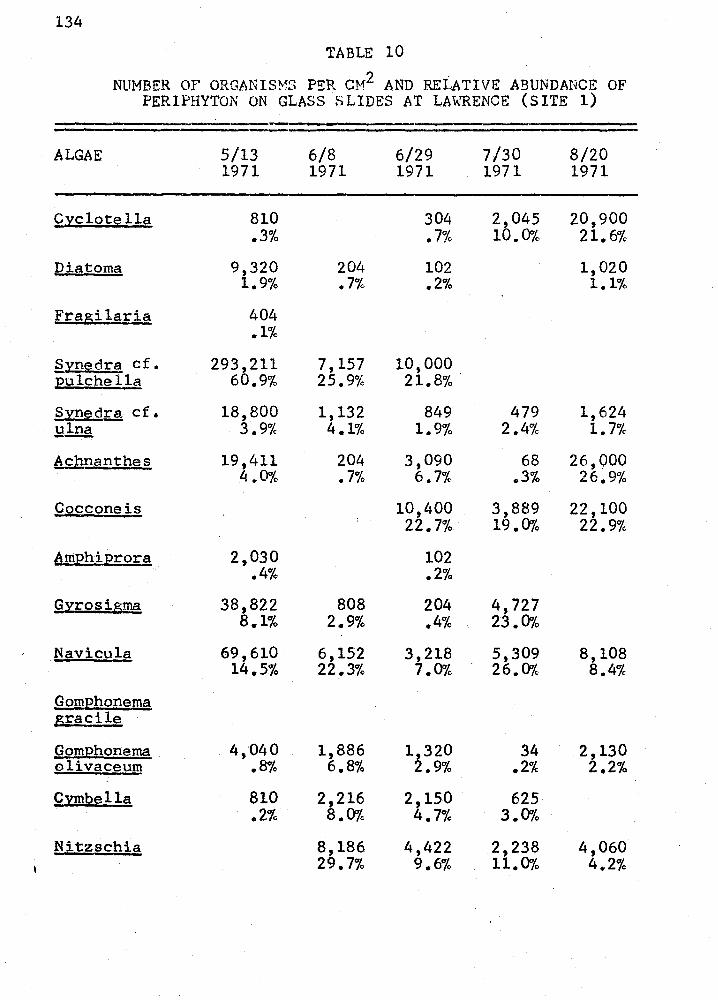
134
TABLE 10
NUMBER OF ORGANISMS P~R CM2 AND RELATIVE: ABUNDANCE OF PERIPHYTON ON GLASS SLIDES AT LAWRENCE (SITE 1)
ALGAE 5/13 6/8 6/29 7/30 8/20 1971 1971 1971 1971 1971
Cyclote lla 810 304 2,045 20,900 .3% .7% 10.0% 21.6%
Diatoma 9,320 204 102 1,020 1.9% .7% .2% 1.1%
Fragilarj..a 404 .1%
§.yri,edra cf. 293,211 7,157 10,000 12ulche lla 60.9% 25.9% 21.8%.
Synedt:s! cf. 18,800 1,132 849 479 1,624 Y1ru! 3.9% 4.1% 1.9% 2.4% 1.7%
b_chnanthes 19,411 204 3,090 68 26,000 4 .0% .7% 6.7% .3% 26.9%
Cgcconeis 10,400 3,889 22,100 22.7% 19.0% 22.9%
AmEhiErora 2,030 102 .4% .2%
Gyrosigma 38,822 808 204 4,727 8.1% 2.9% .4% 23.0%
Navicula 69,610 6,152 3,218 5,309 8,108 14.5% 22.3% 7.CJ¾ 26.0% 8.4%
~omEhonems, gracile
Gom}2honema 4,040 1,886 1,320 34 2,130 olivaceum .8% 6.8% 2.9% .2% 2.2%
Cmbella 810 2,216 2,150 625 .2% 8.0% 4. 7% 3.0%
Nitzschia 8,186 4,422 2,238 4,060 29.7% 9.6% 11.0% 4.2%
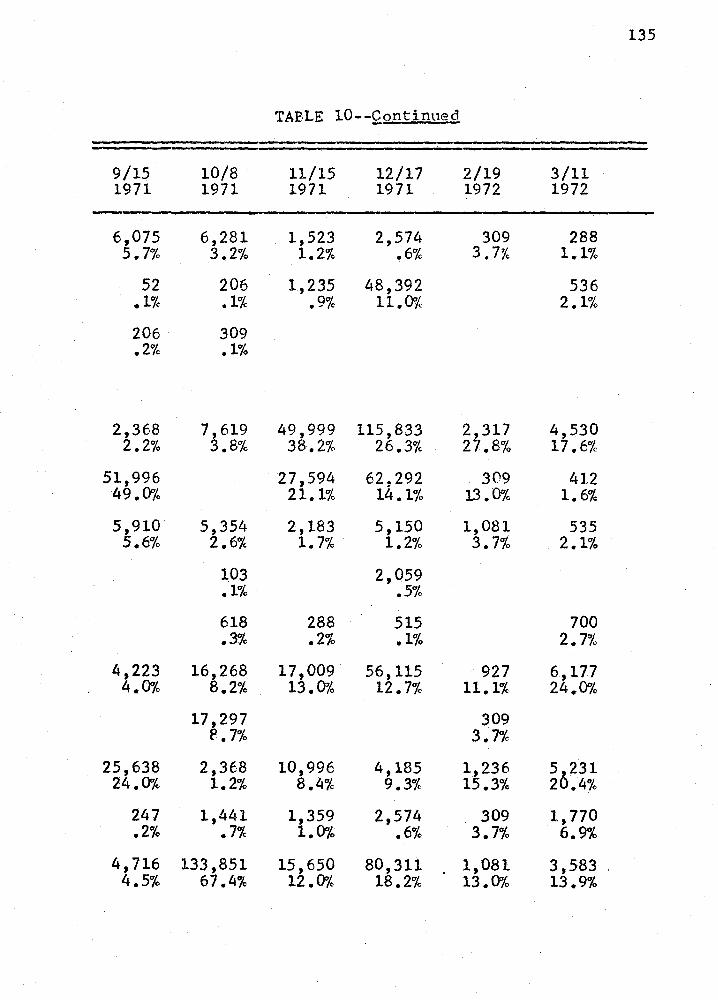
135
TABLE 10--Qontinued
9/15 10/8 11/15 12/17 2/19 3/11 1971 1971 1971 1971 1972 1972
6,075 6,281 1,523 2,574 309 288 5.7% 3.2% 1.2% .6% 3.7% 1.1%
52 206 1,235 48,392 536 .1% .1% ocy. e, C 11.0% 2.1%
206 309 .2% .1%
2,368 7,619 49,999 115,833 2,317 4,530 2.2% 3.8% 38.2% 26.3% 27.8% 17.6%
51,996 27,594 62,292 309 412 49.0% 21.1% 14.1% 13. fr'/4 1.6%
5,910 5,354 2,183 5,150 1,081 535 5.6% 2.6% 1.7% 1.2% 3.7% 2.1%
103 2,059 .1% .5%
618 288 515 700 .3% .2% .1% 2.7%
4,223 16,268 17,009 56,115 927 6,177 4.0% 8.2% 13. O'lo 12.7% 11.1% 24.0%
17,297 309 P.7% 3.7%
25,638 2,368 10,996 4,185 1,236 5 231 24.0% 1.2% 8.4% 9.3% 15.3% 20.4%
247 1,441 1,359 2,574 309 1,770 .2% .7% 1.0% .6% 3.7% 6.9%
4,716 133,851 15,650 80,311 1,081 3,583 . 4.5% 67.4% 12. 0'/4 18.2% 13. 0'/4, 13.9%
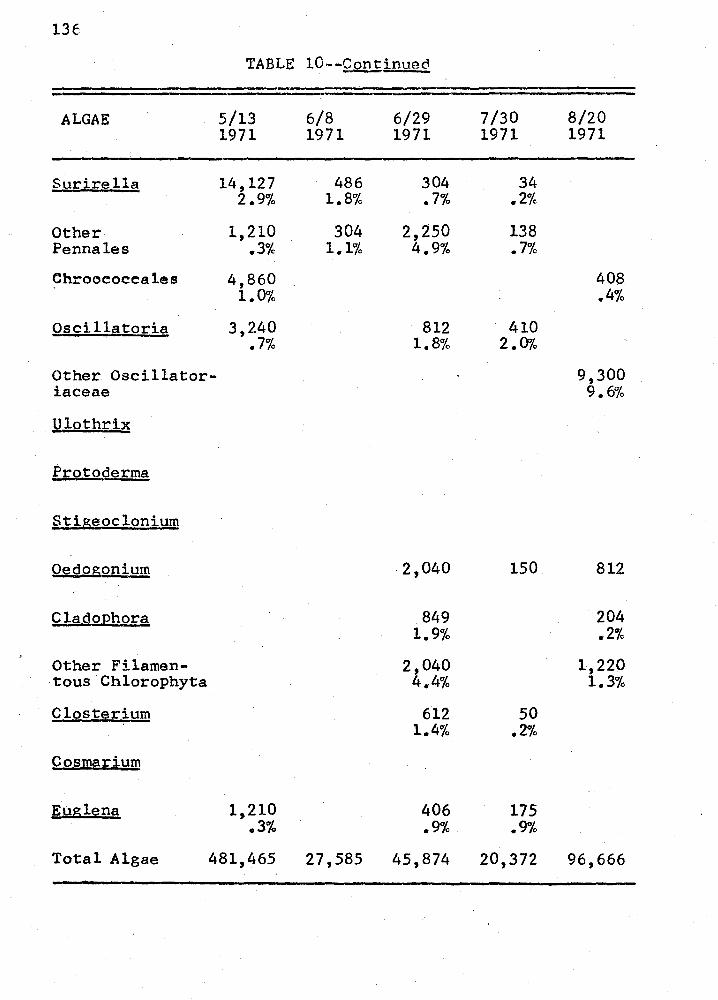
136
TABLE 10--Continued
ALGAE 5/13 6/8 6/29 7/30 8/20 1971 1971 1971 1971 1971
Surirella 14,127 486 304 34 2.9% 1.8% .7% .2%
Other 1,210 304 2,250 138 Pennales .3% 1.1% 4.9% • 7%
Chrooeoeeales 4,860 408 1.0% .4%
Oscillatoria 3,240 812 410 .7% 1.8% 2.0%
Other Oscillator- 9,300 iaceae 9.6%
Ulothrix
Protoderma
Stigeoclonium
Oedogonium 2,040 150 812
CladoEhora 849 204 1.9% .2%
Other Filamen- 2,040 1,220 tous Chlorophyta 4.4% 1.3%
Closterium 612 50 1.4% .2%
Cosmarium
Euglena 1,210 406 175 .3% .9% .9%
Total Algae 481,465 27,585 45,874 20,372 96,666
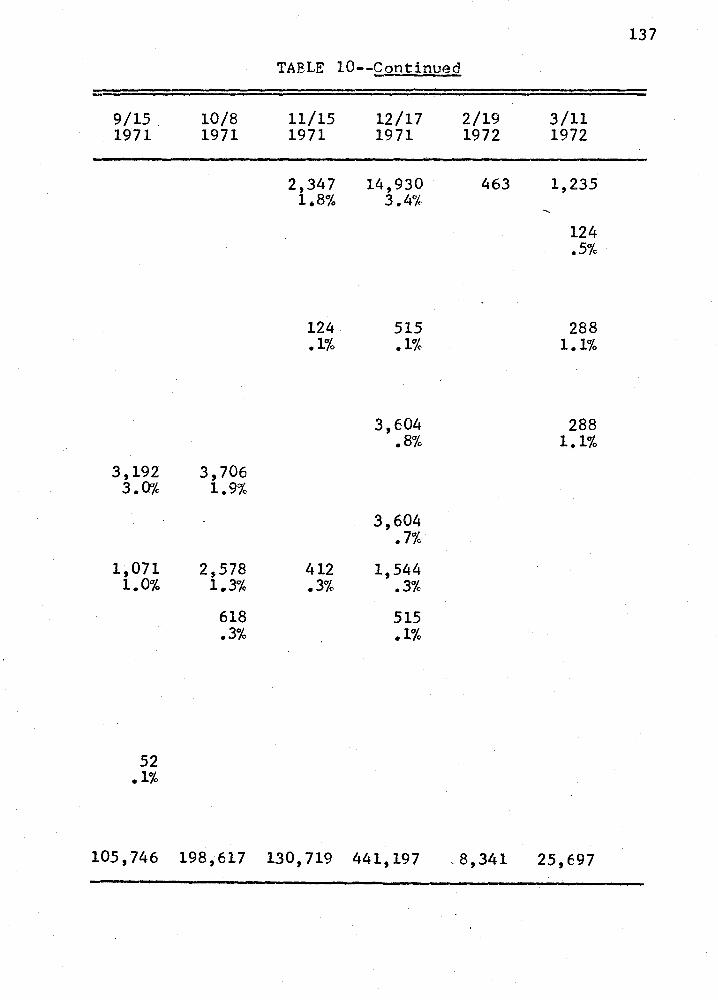
9/15 1971
3,192 3.0%
1,071 1.0%
52 .1%
10/8 1971
3,706 1.9%
2,578 1.3%
618 .3%
TABLE 10--Continued
11/15 1971
12/17 1971
2,347 14,930 1.8% 3.4%
124 .1%
412 .3%
515 .1%
3,604 .8%
3,604 .7%
1,544 .3%
515 .1%
2/19 1972
463
3/11 1972
1,235
124 .5%
288 1.1%
288 1.1%
105,746 198,617 130,719 441,197 _ 8,341 25,697
137
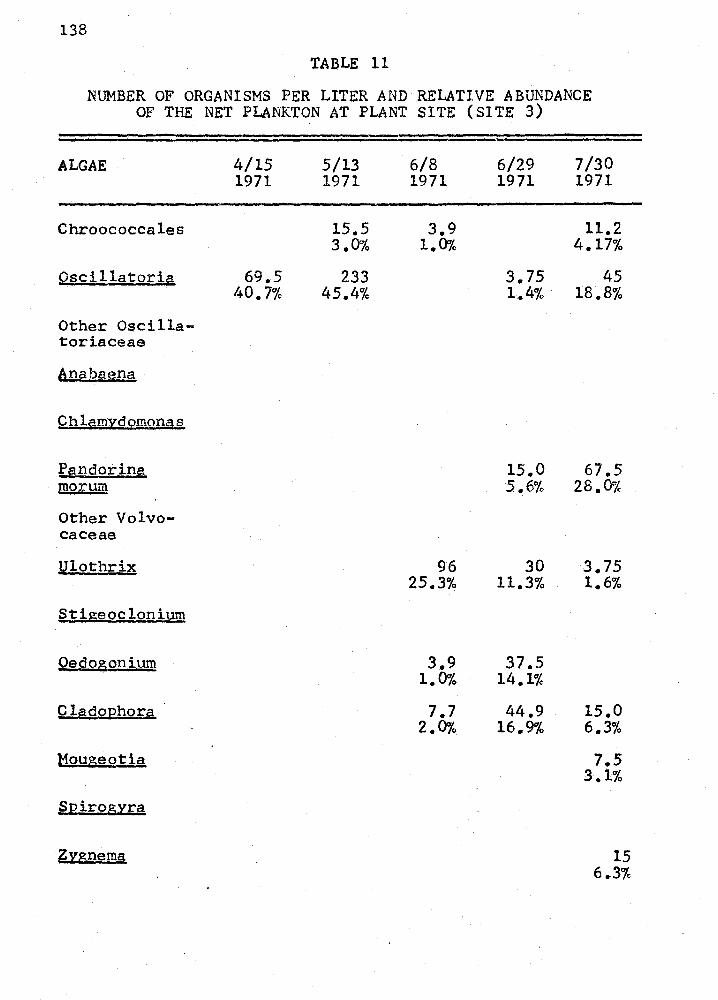
138
TABLE 11
NUMBER OF ORGANISMS PER LITER AND RELATIVE ABUNDANCE OF THE NET PLANKTON AT PLANT SITE (SITE 3)
ALGAE
Chroococcales
Oscillatoria
Other Oscilla-toriaceae
6nabaena
Chlamydomonas
Pandorina morurn
Other Volvo-caceae
lJlothrix
Stigeoclonium
Qgdogoniurn
CladoEhora
Mougeotia
SI?irogyra
Zygnema
4/15 1971
69.5 40.7%
5/13 1971
15.5 3.0%
233 45.4%
6/8 1971
3.9 1.0%
96 25.3%
3.9 1.0%
7.7 2.0%
6/29 7/30 1971 1971
11.2 4.17%
3.75 45 1.4% 18.8%
15.0 67.5 5.6% 28.0%
30 11.3%
37.5 14.1%
44.9 16.9%
3.75 1.6%
15.0 6.3%
7.5 3.1%
15 6.3%
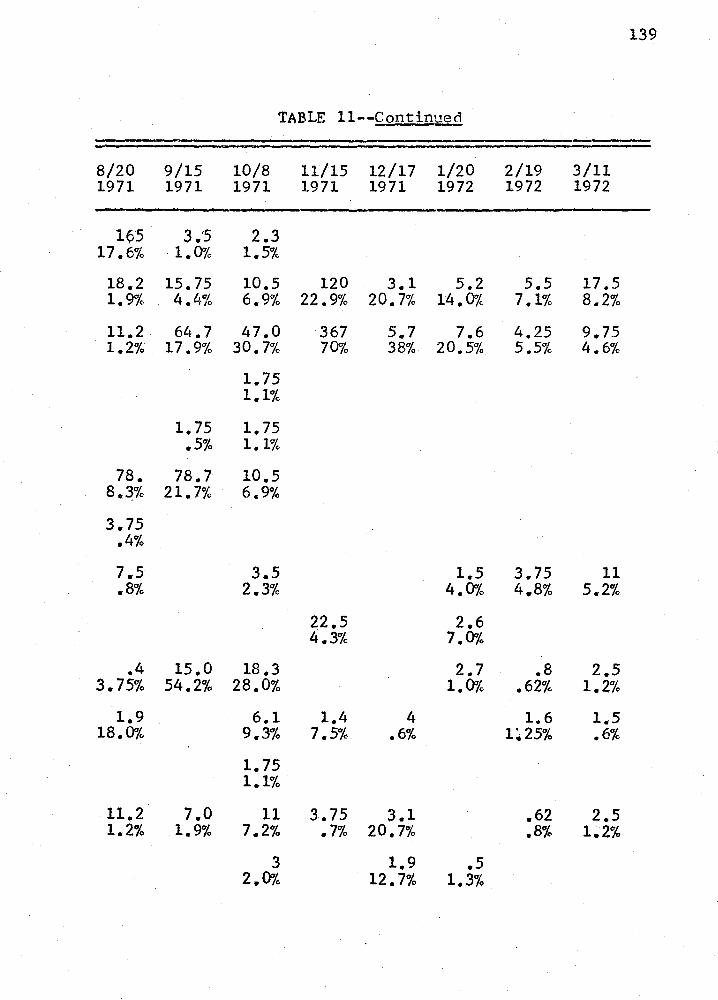
139
TABLE ll--£ontinued
8/20 9/15 10/8 11/15 12/17 1/20 2/19 3/11 1971 1971 1971 1971 1971 1972 1972 1972
165 3.'5 2.3 17.6% 1.0% 1.5%
18.2 15.75 10.5 120 3.1 . 5 .2 5.5 17.5 1.9% 4.4% 6.9% 22.9% 20.7% 14.0% 7 .1% 8.2%
11.2 64.7 47.0 367 5.7 7.6 4.25 9.75 1.2% 17.9% 30.7% 70% 38% 20.5% 5.5% 4.6%
1.75 1.1%
1.75 1.75 .5% 1.1%
78. 78.7 10.5 B.~% 21.7% 6.9%
3.75 .4%
7.5 3.5 1.5 3.75 11 .8% 2.3% 4.0% 4.8% 5.2%
22.5 2.6 4.3% 7.0%
.4 15.0 18.3 2.7 .8 2.5 3.75% 54.2% 28.0% 1.0% .62% 1.2%
1.9 6.1 1.4 4 1.6 1.5 18.0% 9.3% 7.5% .6% 1~25% .6%
1.75 1.1%
11.2 7.0 11 3.75 3.1 .62 2.5 1.2% 1.9% 7.2% • 7% 20.7% .8% 1~2%
3 1.9 .5 2.0% 12.7% 1.3%
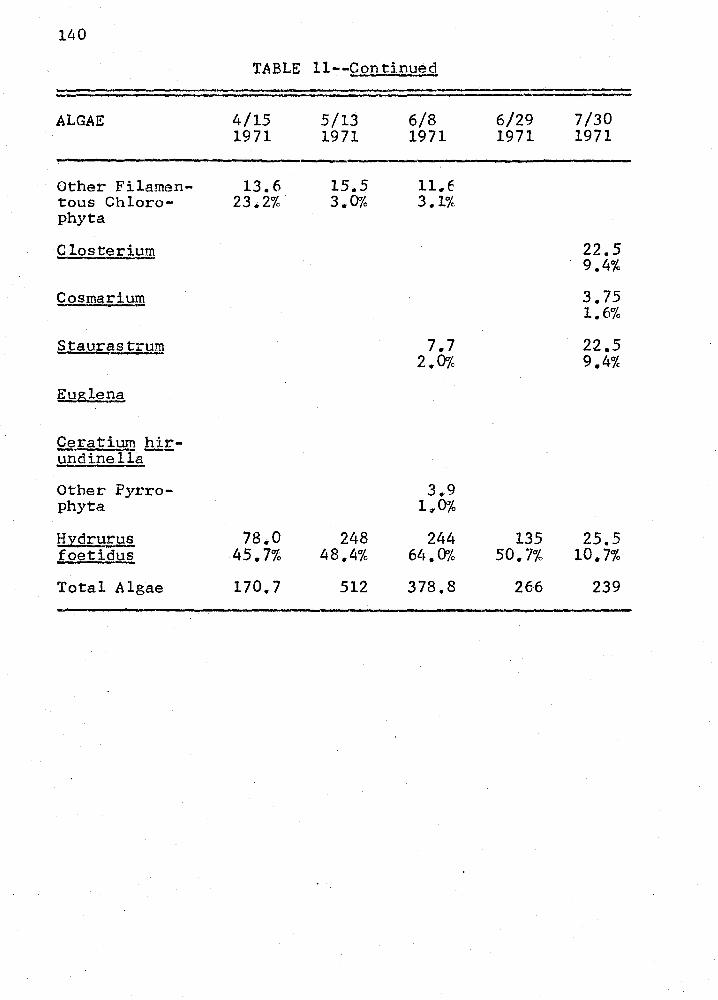
140
TABLE 11--Con tinued
ALGAE 4/15 5/13 6/8 6/29 7/30 1971 1971 1971 1971 1971
Other Filamen- 13.6 15.5 11.6 tous Chloro- 23.2% 3.0% 3.1% phyta
Closterium 22.5 9.4%
Cosmarium 3.75 1.6%
Staurastrum 7.7 22.5 2.0% 9.4%
Euglel.l?
Ceratium hir-...... --undinella
Other Pyrro- 3.9 phyta 1 ... 0%
H:2:drury.§_ 78.0 248 244 135 25.5 foetidus 45.7% 48.4% 64.0% 50. 7% 10.7%
Total Algae 170.7 512 378.8 266 239
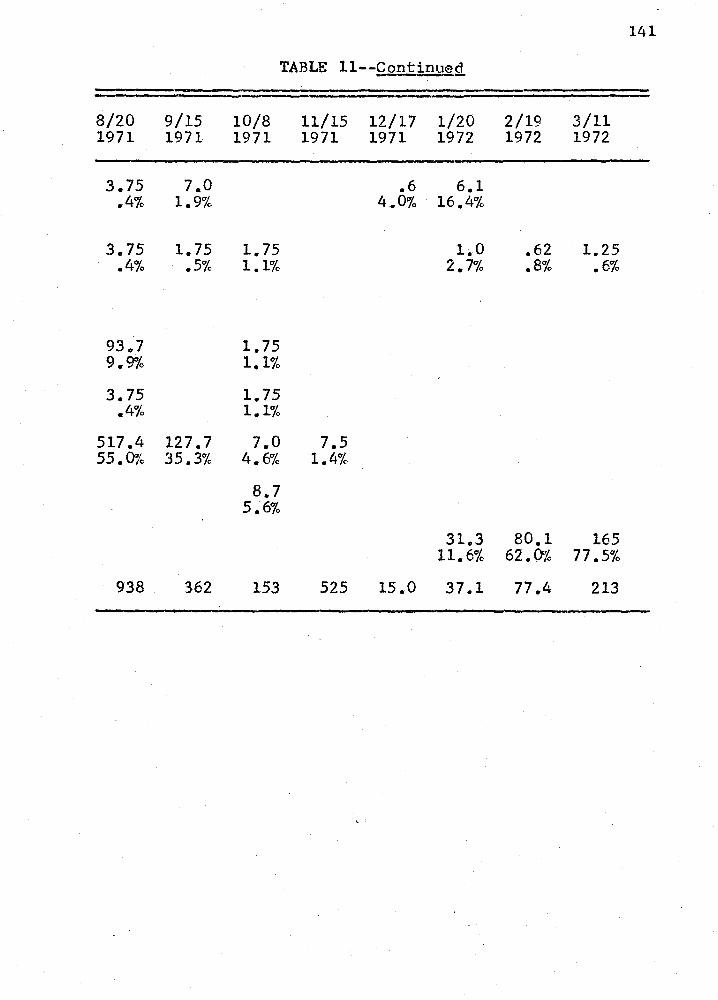
141
TABLE 11--QQ.ntinued
8/20 9/15 10/8 11/15 12/17 1/20 2/19 3/11 1971 1971 1971 1971 1971 1972 1972 1972
3.75 7.0 .6 6.1 .4% 1.9% 4.0% 16.4%
3.75 1.75 1.75 1.0 .62 1.25 .4% .5% 1.1% 2.7% .8% .6%
93.,7 1.75 9.9% 1.1%
3.75 1.75 .4% 1.1%
517 .4 127.7 7,.0 7.5 55.0% 35.3% 4.6% 1.4%
B.7 5.6%
31.3 80.1 165 11.6% 62.0% 77.5%
938 362 153 525 15.0 37.1 77.4 213
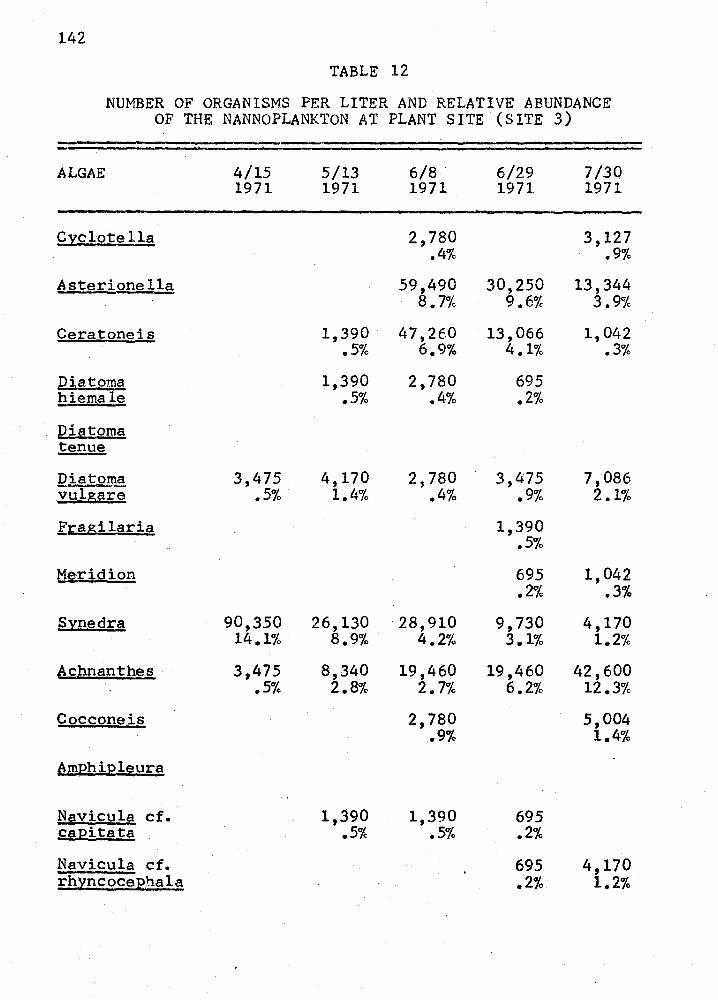
142
TABLE 12
NUMBER OF ORGANISMS PER LITER AND RELATIVE ABUNDANCE OF THE NANNOPLANKTON AT PLANT SITE (SITE 3)
ALGAE 4/15 5/13 6/8. 6/29 7/30 1971 1971 1971 1971 1971
Cyclotella 2,780 3,127 .4% .9%
Asterione lla 59,490 30,250 13,344 8.7% 9.6% 3.9%
Cera tone is 1,390 47,260 13,066 1,042 .5% 6.9% 4.1% .3%
Diatorna 1,390 2,780 695 hiemale .5% .4% .2%
Diatoma tenue
Diatoma 3,475 4,170 2,780 3,475 7,086 yuigare .5% 1.4% .4% .9% 2.1%
f;cagilaria 1,390 .5%
Meridion 695 1,042 .2% .3%
sinedra 90,350 26,130 28,910 9,730 4,170 14.1% 8.9% 4.2% 3.1% 1.2%
I! chnan the s 3,475 8,340 19,460 19,460 42,600 .5% 2.8% 2.7% 6.2% 12.3%
Cocconeis 2,780 5,004 .9% 1.4%
d!9PhiJ2leura
Navicula cf. 1,390 1,390 695 capitata .5% .5% .2%
Navicula cf. 695 4,170 rhincoce;ehala .2% 1.2%
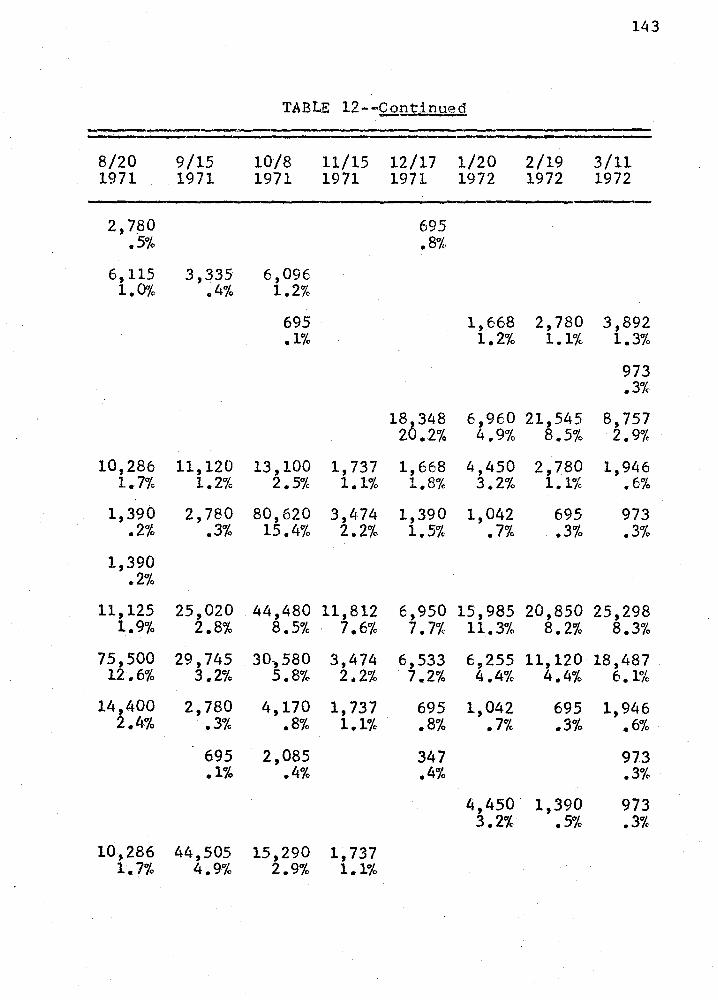
143
TABLE 12--Continued
8/20 9/15 10/8 11/15 12/17 1/20 2/19 3/11 1971 1971 1971 1971 1971 1972 1972 1972
2, 7f30 695 .5% .8%
6,115 3,335 6,096 1.0% .4% 1.2%
695 1,668 2,780 3,892 .1% 1.2% 1.1% 1.3%
973 .3%
isc/48 6,960 21,545 8,757 2 .2% 4.9% 8.5% 2.9%
10,286 11,120 13,100 1,737 1,668 4,450 2,780 1,946 1.7% 1.2% 2.5% 1.1% 1.8% 3.2% 1.1% .6%
1,390 2,780 80,620 3,474 1,390 1,042 695 973 .2% .3% 15.4% 2.2% 1.5% .7% .3% .3%
1,390 .2%
11,125 25,020 44,480 11,812 6,950 15,985 20,850 25,298 1.9% 2.8% 8.5% 7.6% 7.7% 11.3% 8.2% 8.3%
75,500 29,745 30-, 580 3,474 6,533 E,255 11,120 18,487 12.6% 3.2% 5.8% 2.2% 7.2% 4.4% 4.4% 6.1%
14,400 2,780 4,170 1,737 695 1,042 695 1,946 2.4% .3% .8% 1.1% .8% .7% .3% .6%
695 2,085 347 973 .1% .4% .4% .3%
4,450 1,390 973 3.2% .5% .3%
10,286 44,505 15,290 1,737 1.7% 4.9% 2.9% 1.1%
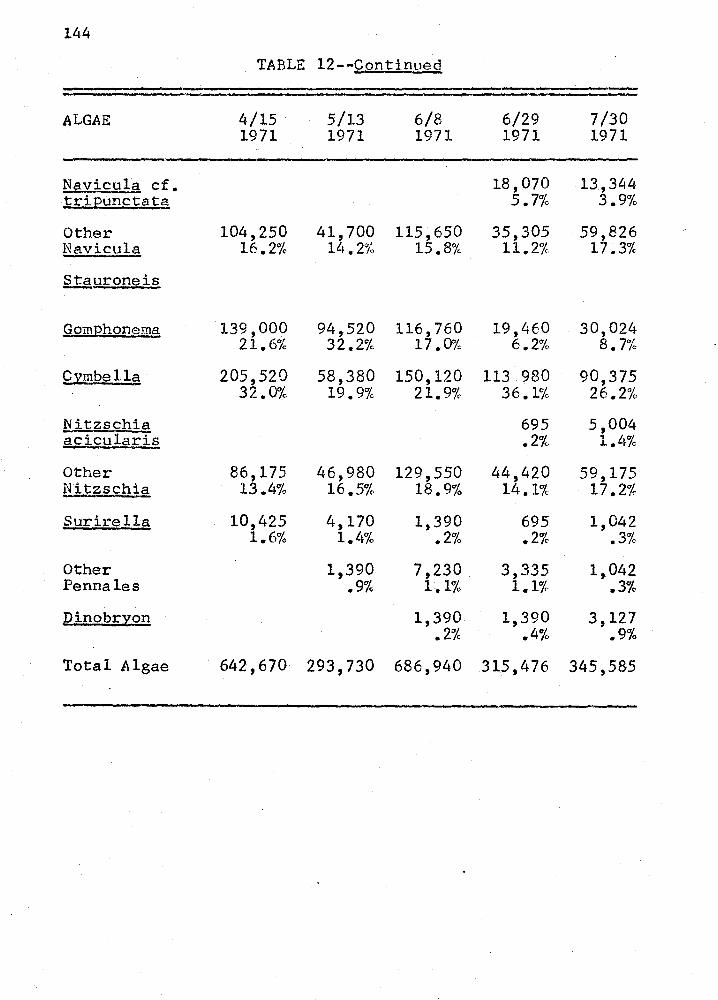
144
TABLE 12--Q.ontinued
ALGAE 4/15 5/13 6/8 6/29 7 /30 1971 1971 1971 1971 1971
Navicula cf. 18,070 13,344 triEunctata 5.7% 3.9%
Other 104,250 41,700 115,650 35,305 59,826 Navicula 16.2% 14.2% 15.8% 11.2% 17.3%
lliuroneis
Gom}2honema 139,000 94,520 116,760 19,460 30,024 21.6% 32.2% 17 .0% 6.2% 8.7%
£2mbell~ 205,520 58,380 150,120 113.980 90,375 32.0% 19.9% 21.9% 36.1% 26.2%
Nitzschia 695 5,004 acicularis .2% l .L~%
Other 86,175 46,980 129,550 44,420 59,175 !iitzschia 13.4% 16.5% 18.9% 14.1% 17.2%
Surirella 10,425 4,170 1,390 695 1,042 1.6% 1.4% .2% .2% .3%
Other 1,390 7,230 3,335 1,042 Pennales .9% 1.1% 1.1% .3%
Qinobrion 1,390 1,390 3,127 .2% .4% .9%
Total Algae 642,670 293,730 686,940 315,476 345,585
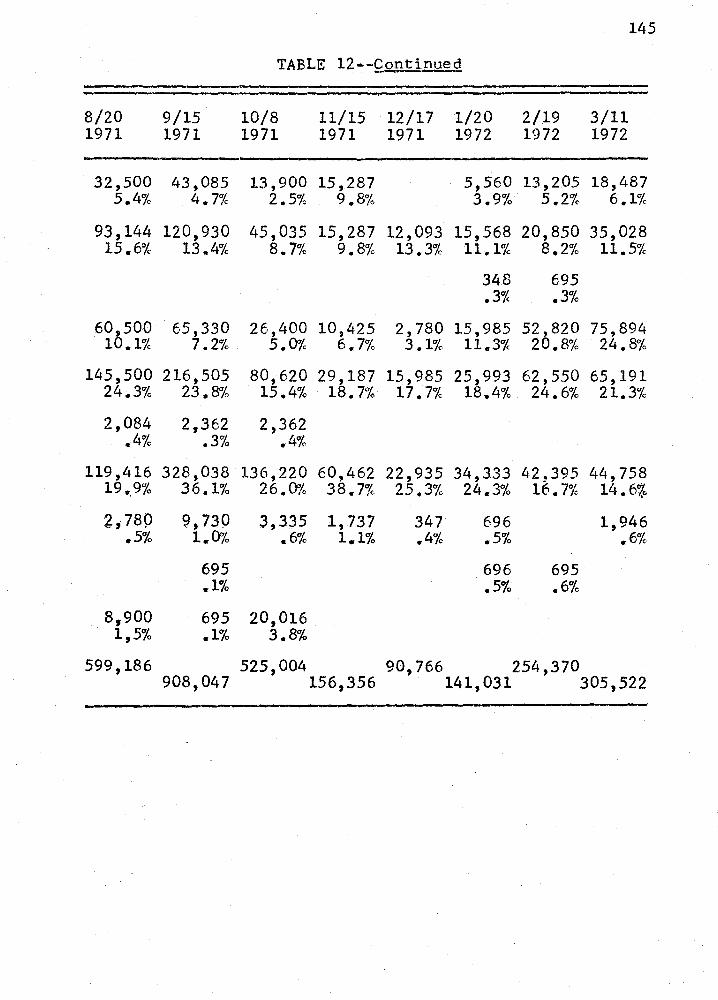
145
TABLE 12--Continued
8/20 9/15 10/8 11/15 12/17 1/20 2/19 3/11 1971 1971 1971 1971 1971 1972 1972 1972
32,500 43,085 13,900 15,287 5,560 13,205 18,487 5.4% 4. 7% 2.5% 9.8% 3.9% 5.2% 6.1%
93,144 120,930 45,035 15,287 12,093 15,568 20,850 35,028 15.6% 13 .. 4% 8. 7% 9.8% 13.3% 11.1% 8.2% 11.5%
348 695 .3% .3%
60,500 65,330 26,400 10,425 2,780 15,985 52,820 75,894 10.1% 7.2% 5.0% 6.7% 3.1% 11.,3% 20.8% 24.8%
145,500 216,505 80,620 29,187 15,985 25,993 62,550 65,191 24.3% 23.8% 15.4% 18,,7% 17.7% 18 .. 4% 24.6% 21.3%
2,084 2,362 2,362 .4% .3% .4%
119,416 328,038 136,220 60,462 22,935 34,333 42,395 44,758 19.,9% 36.1% 26.0% 38.7% 25.3% 24.3% 16.7% 14.6i
·2, 780 9,730 3,335 1,737 347 696 1,946 .5% 1.0'/4 .6% 1.1% .4% .5% .6%
695 696 695 .1% .5% .6%
8,900 695 20,016 . 1,5% .1% 3.8%
599,186 525,004 90,766 254,370 908,047 156,356 . 141,031 305,522
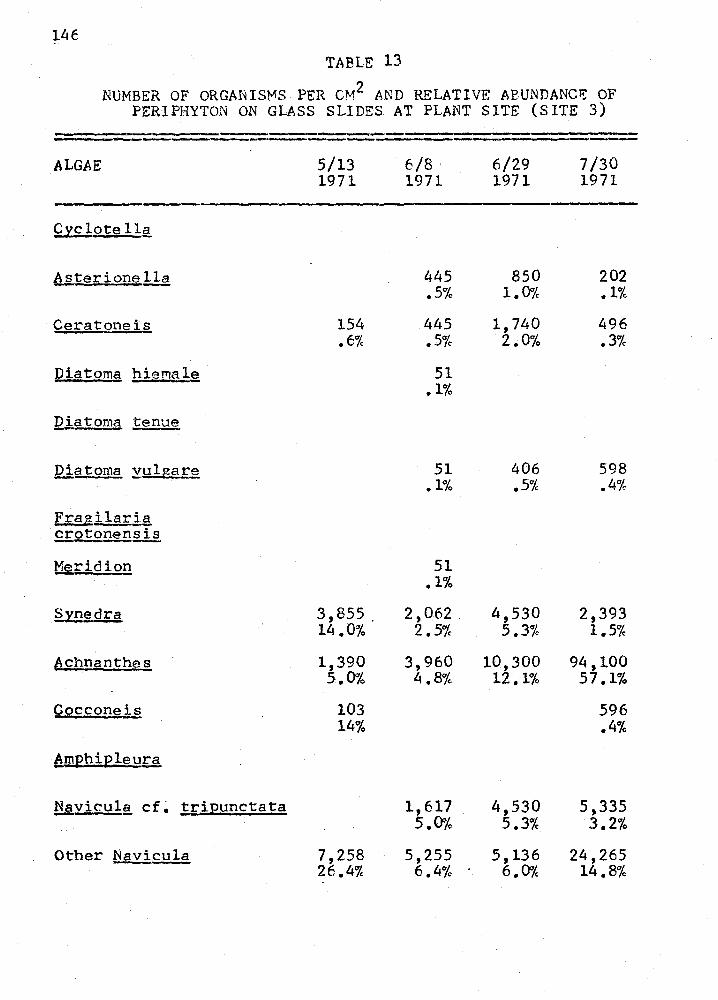
l4E TABLE 13
NUMBER OF ORGANISMS PER CM2 AND RELATIVE AP.UNDANCE OF PERIPHYTON ON GLASS SLIDES AT PLANT SITE (SITE 3)
--------==·========= ALGAE
£yclote lla
·Ceratoneis
piatoma hiernale
giatoma tenue
Diatoma yulgar~
Fr a_gj_,l{!!:ll crotonensis ------~rid ion
§ynedra
Achnanthes
Cocconeis
6_mphipleura
lli!,vicula cf~ tripunctata
5/13 1971
154 .6%
3,855 . 14 .0%
1,390 5.0%
103 14%
7,258 26.4%
E/8 1971
445 .5%
445 .5% 51
.1%
51 .1%
51 .1%
2,062 2.5%
3,960 4 .8%
1,617 5.0%
5,255 6.4%
6/29 1971
850 1.0%
1,740 2.0%
406 .5%
7/30 1971
202 .1%
496 .3%
598 .4%
4,530 2,393 5 .3% 1 .5%
10,300 94,100 12 .1% 57 .1%
4,530 5.3%
s, 136 6.0%
596 .4%
5,335 3.2%
24,265 14.8%
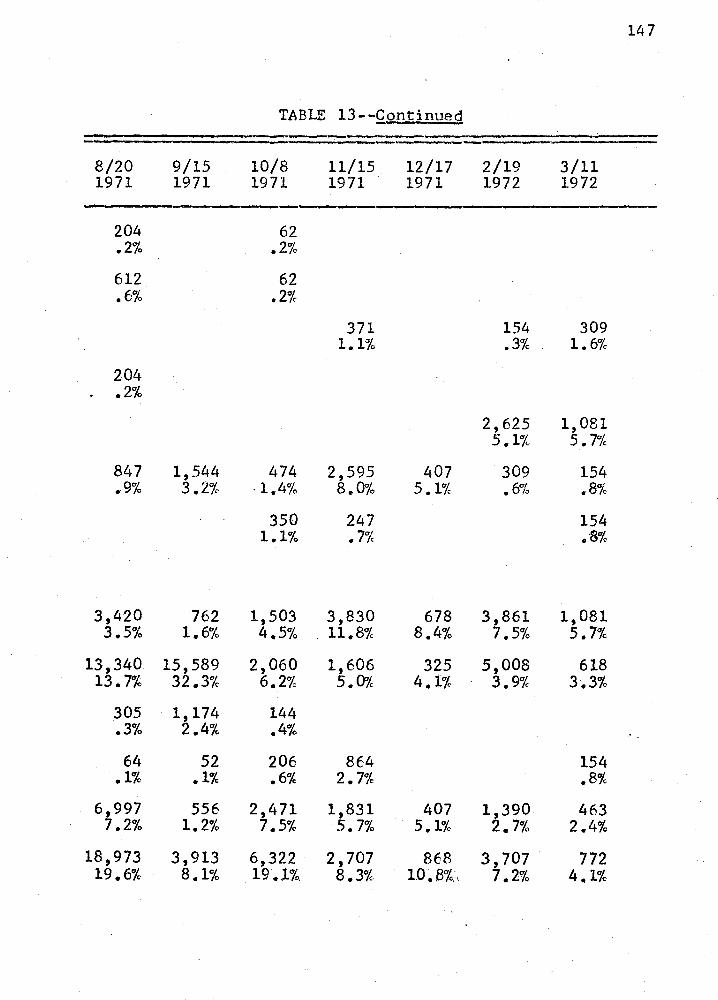
147
TABLE 13--Continued -- ----8/20 9/15 10/8 11/15 12/17 2/19 3/11 1971 1971 1971 1971 1971 1972 1972
---204 62 .2% .2%
612 62 .6% .2%
371 154 309 1.1% .3% 1.6%
204 .2%
2,625 1,081 5.1% s. 7%
847 1,544 474 2,595 407 309 154 .9% 3.2% -1.4% 8.0% 5.1% • 6~k .8%
350 247 154 1.1% • 7% .'f~%
3,420 762 1,503 3,830 678 3,861 1,081 3.5% 1.6% 4.5% . 11.8% 8.4% 7.5% 5.7%
13,340 15,589 2,060 1,606 325 5,008 618 13. 7% 32.3% 6.2% 5.0% 4.1% 3.9% 3.3%
305 1,174 144 .3% 2.4% .4%
64 52 206 8E4 154 .1% .1% .6% 2. 7% .8%
6,997 556 2,471 1,831 407 1,390 463 7.2% 1.2% 7.5% 5.7% 5.1% 2. 7% 2.4%
18,973 3,913 6,322 2,707 868 3,707 772 19.6% 8.1% 19.l%. 8.3% 1.0.8%., 7.2% 4.1%
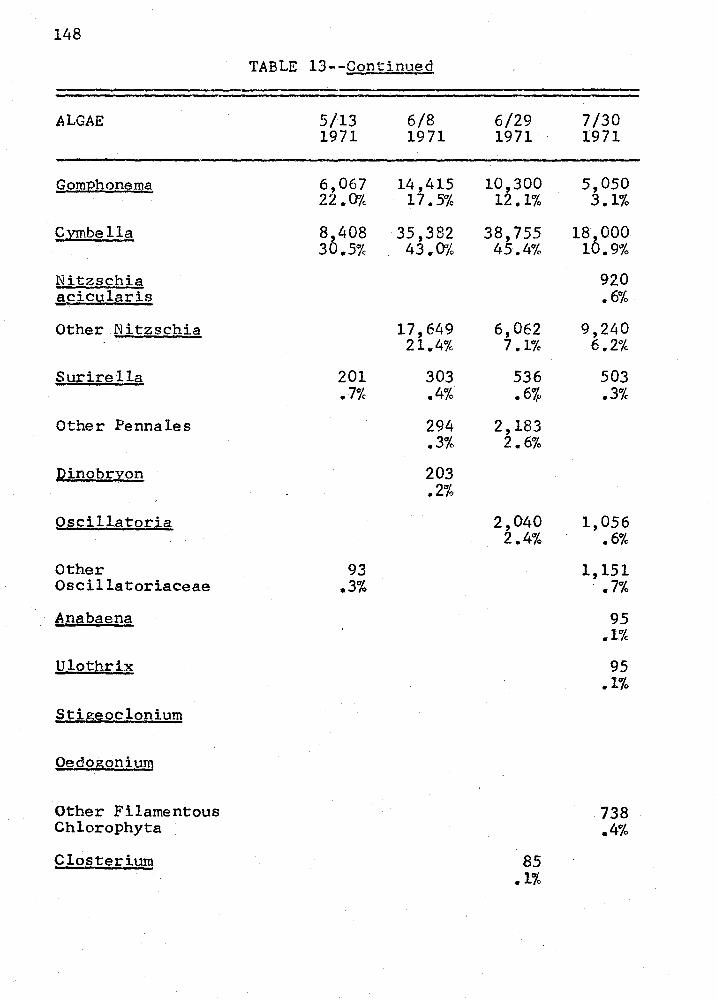
148
TABLE 13--Continued
ALGAE 5/13 6/8 6/29 7/30 1971 1971 1971 1971
Qom:ehonema 6,067 14,415 10,300 5,050 22 .ore 17 .5% 12.1% 3.1%
~ymbella 8,408 35,382 38,755 18,000 30.5% 43. 0'/4 45.4% 10.9%
Nitzschia 920 mcularis .6%
Other Nitzschia 17,649 6,062 9,240 21.,4% 7 .1% 6.2%
Su[irella 201 303 536 503 .7% .4% • 6i .3%
Other Pennales 294 2,183 .3% 2.6%
Dinobryon 203 .2%
Oscillatoria 2,040 1,056 2.4% .6%
Other 93 1,151 Oscillatoriaceae .3% .7%
Anabaena 95 .1%
Ulothrix 95 .1%
Stigeoclonium
Oedogonium
Other Filamentous 738 Chlorophyta .4%
Closterium 85 .1%
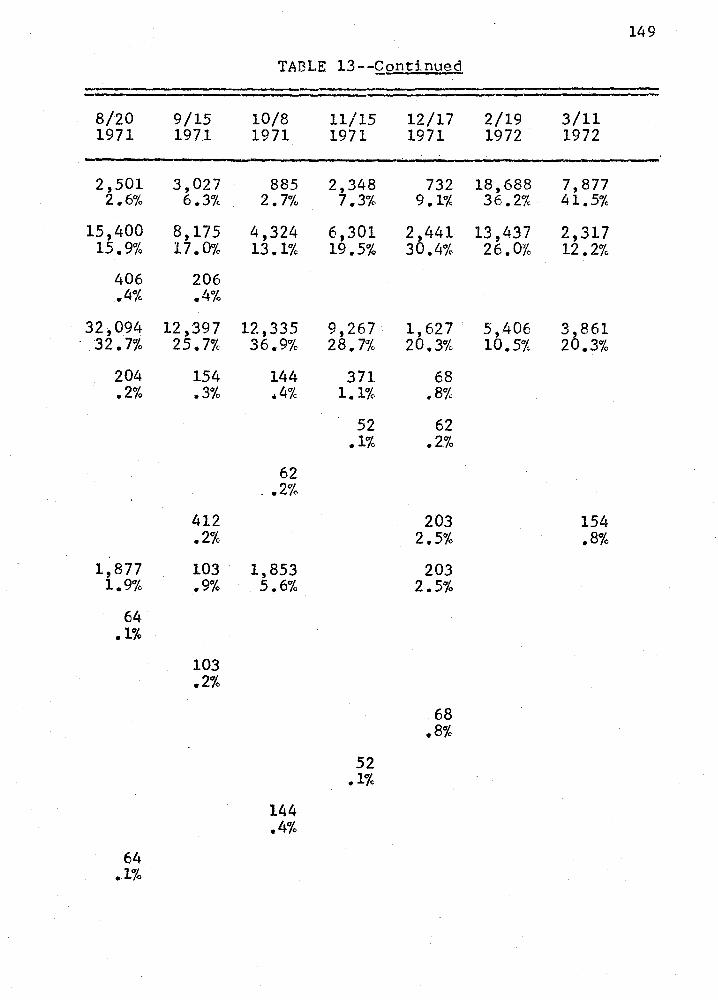
149
TABLE 13--Qontinued
8/20 9/15 10/8 11/15 12/17 2/19 3/11 1971 1971 1971 1971 1971 1972 1972
2,501 3,027 885 2,348 732 18,688 7,877 2.6% 6.3% 2.7% 7.3% 9.1% 36.2% 41.5%
15,400 8,175 4,324 6,301 2,441 13,437 2,317 15.9% 17.0% 13.1% 19.5% 30.4% 26.0% 12 .2%
406 206 .4% .4%
32,094 12,397 12,335 9,267 1,627 5,406 3,861 32.7% 25.7% 36.9% 28.7% 20.3% 10.5% 20.3%
204 154 144 371 68 .2% .3% .4% 1.1% .8%
52 62 .1% .2%
62 .• 2%
412 203 154 .2% 2.5% .8%
1,877 103 1,853 203 1. 9°'/4 .9% 5.6% 2.5%
64 .1%
103 .2%
68 .8%
52 .1%
144 .4%
64 .1%
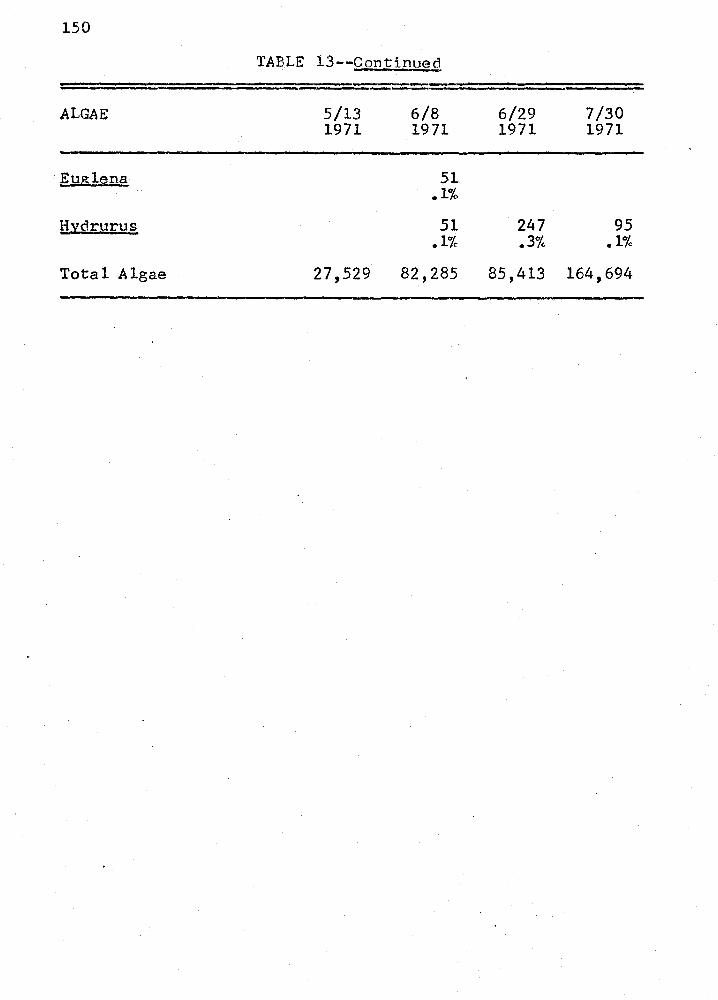
150
TABLE 13--Continuen
ALGAE 5/13 6/8 6/29 7 /30 1971 1971 1971 1971
Euglena 51 .1%
tl_ydrurus 51 247 95 .1% .3% .1%
Total Algae 27,529 82,285 85,413 164,694
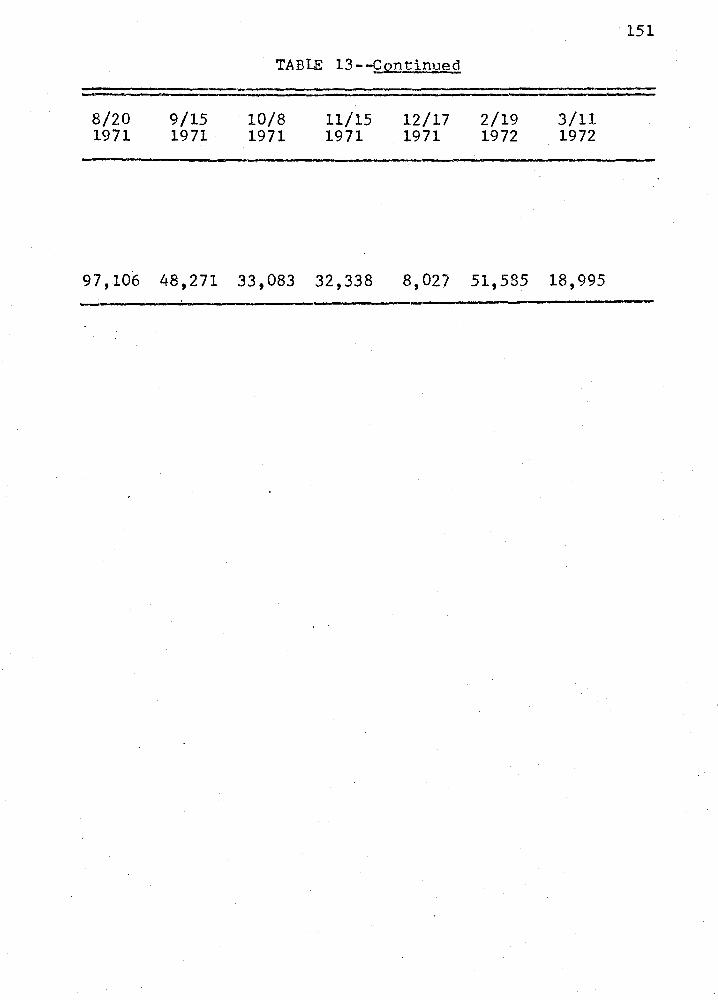
8/20 1971
9/15 1971
TABLE 13--CQ.Dtin~,-1ecl
10/8 1971
11/15 12/17 2/19 1971 1971 1972
3/11 1972
97,106 48,271 33,083 32,338 8,027 51,585 18,995
151
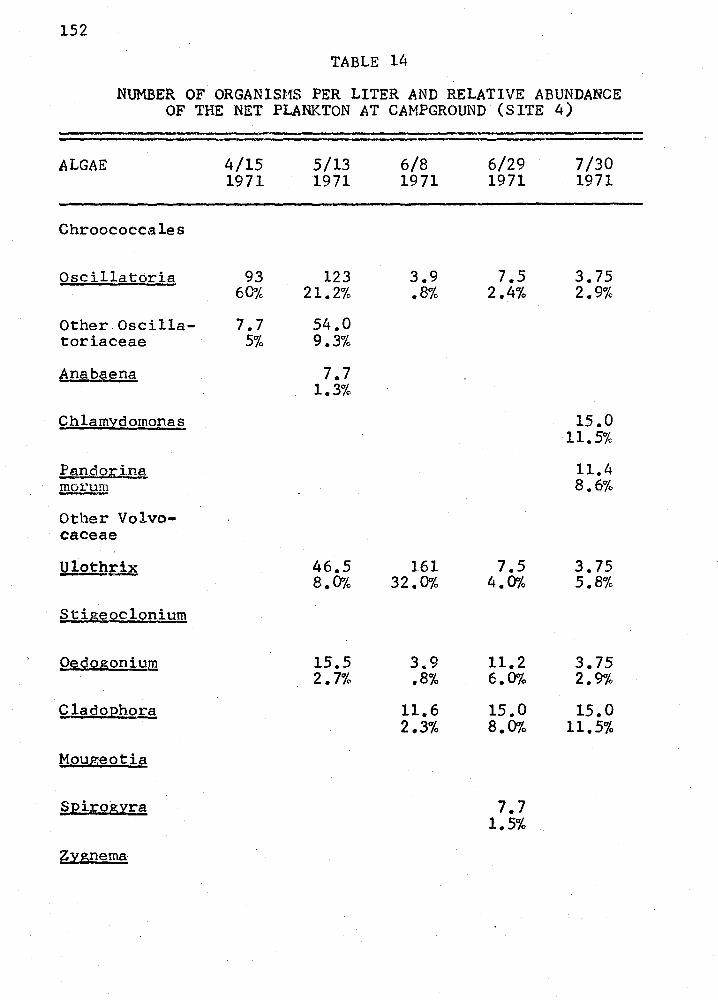
152
TABLE 14
NUMBER OF ORGANISMS PER LITER AND RELATIVE ABUNDANCE OF THE NET PLANKTON AT CAMPGROUND (SITE 4)
ALGAE 4/15 5/13 6/8 6/29 7/30 1971 1971 1971 1971 1971
Chroococcales
Oscillatoria 93 123 3.9 7.5 3.75 60% 21.2% .8% 2.4% 2.9%
Other Oscilla- 7.7 54.0 toriaceae 5% 9.3%
Anabaena 7.7 1.3%
£hlamidomonas 15.0 11.5%
Pandot:.J .. rna 11.4 morum 8.6%
Other Volvo-caceae
Ulothri~ 46.5 161 7.5 3.75 8.0% 32.0% 4.0% 5.8%
Stigeoclonium
g~dogonium 15.5 3 .. 9 11.2 3.75 2. 7% .8% 6.0% 2.9%
Qlado:eho~ 11.6 15.0 15.0 2.3% 8.0% 11.5%
Mougeotia
S)2iroiu~ra 7.7 1.5%
zi~nema
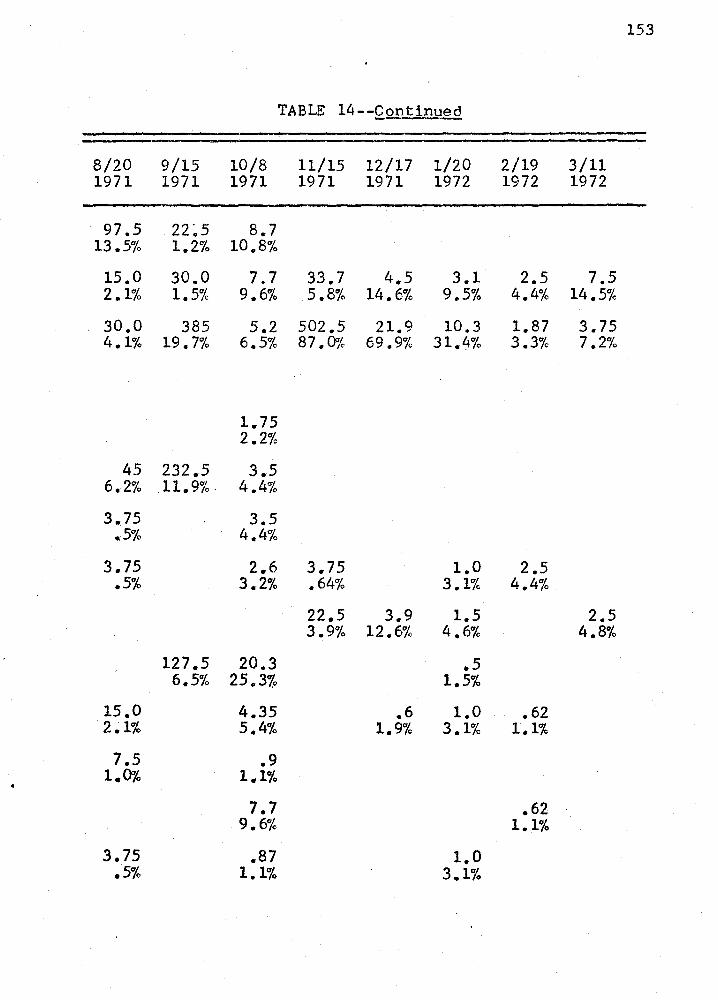
153
TABLE 14--Q.ontinued
8/20 9/15 10/8 11/15 12/17 1/20 2/19 3/11 1971 1971 1971 1971 1971 1972 1972 1972
97.5 22~5 8.7 13.5% 1.2% 10.8%
15.0 30.0 7.7 33.7 4.5 3.1 2.5 7.5 2.1% 1.5% 9.6% 5.8% 14.6% 9.5% 4.4% 14.5%
30.0 385 5.2 502.5 21.9 10.3 1.87 3.75 4.1% 19.7% 6.5% 87 .0% 69.9% 31.4% 3.3% 7.2%
1,.75 2.2%
45 232.5 3.5 6.2% 11. 9%. 4.4%
3.75 3.5 .5% 4.4%
3.75 2.6 3.75 1.0 2.5 .5% 3.2% .64% 3.1% 4.4%
22.5 3.9 1.5 2.5 3.9% 12.6% 4.6% 4.8%
127.5 20.3 .5 6.5% 25 .. 3%, 1.5%
15.0 4.35 .6 1.0 .62 2~ 1% 5.4% 1.9% 3.1% 1.1%
7.5 .9 1.0% 1.1%
7.7 .62 9.6% 1.1%
3.75 .87 1.0 .5% 1.1% 3.1%
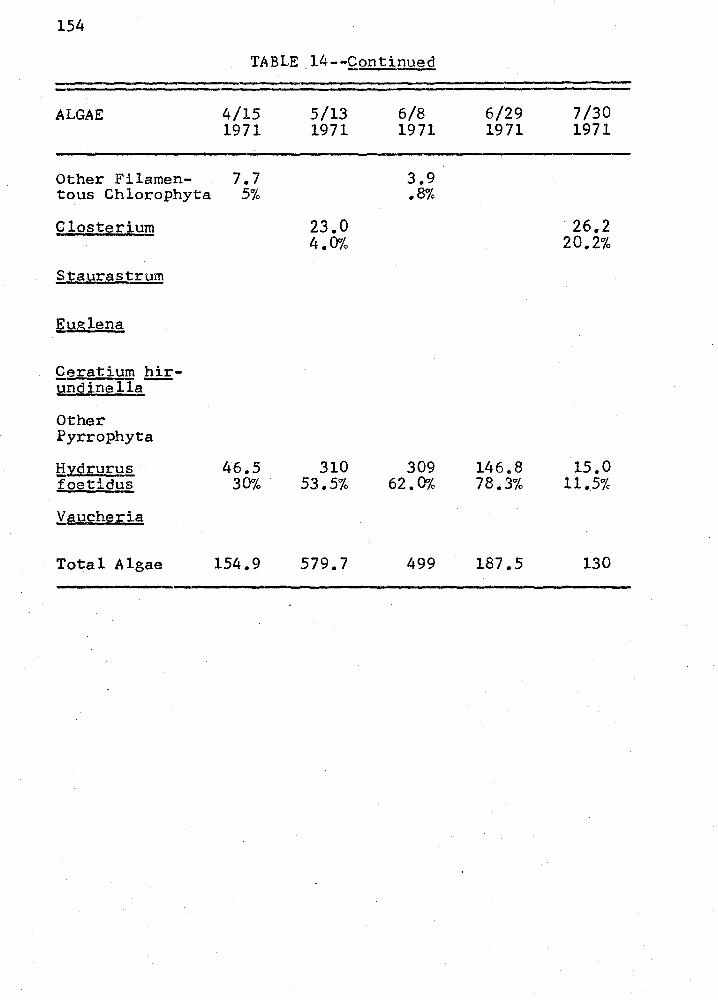
154
TABLE _14--Continued
ALGAE 4/15 5/13 6/8 6/29 7/30 1971 1971 1971 1971 1971
Other Filamen- 7.7 3.9 tous Chlorophyta 5% .8%
Closterium 23.0 26.2 4.0% 20.2%
Staurastrum
~uglelli!
Ceratium hir-undinella-
Other Pyrrophyta
fiydrurus 46.5 310 309 146.8 15.0 foetidus 30% 53.5% 62.0% 78.3% 11.5%
faucheria
Total Algae 154.9 579.7 499 187.5 130
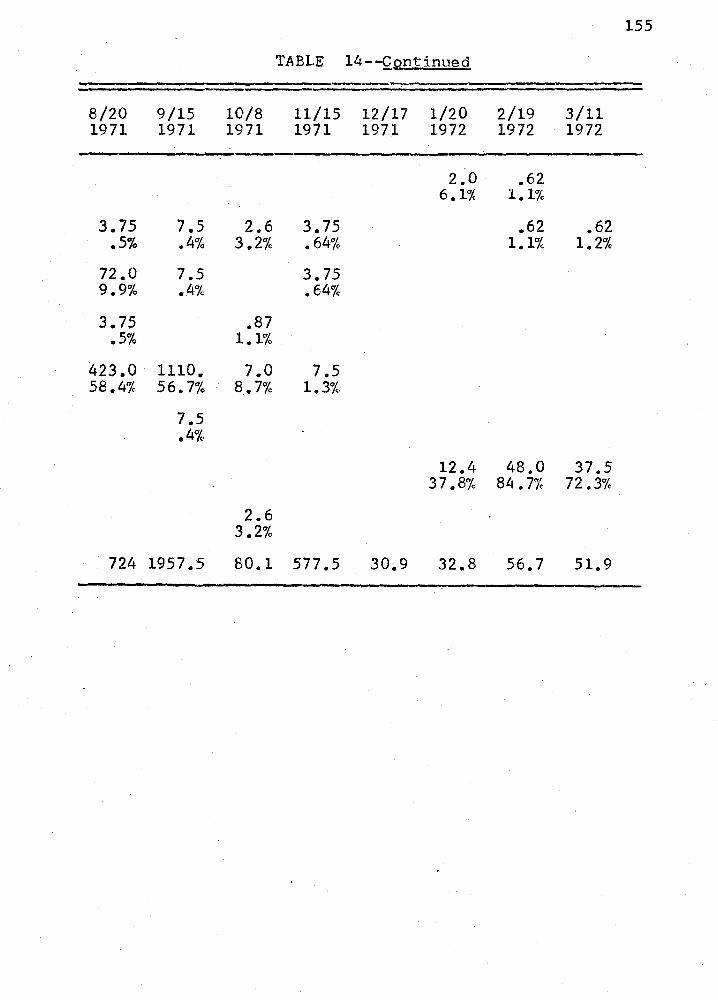
155
TABLE 14--Q.QJJ,:-inued
8/20 9/15 10/8 11/15 12/17 1/20 2/19 3/11 1971 1971 1971 1971 1971 1972 1972 1972
--2.0 .62
6.1% 1.1%
3.75 7.5 2.6 3.75 .62 .62 .5% .4% 3 .2% .64% 1.1% 1.2%
72.0 7.5 3.75 9.9% .4% .64%
3.75 .87 .5% 1.1%
423.0 1110. 7.0 7.5 58.4% 56 .. 7% 8.7% 1.3%
7.5 .4%
12.4 48.0 37.5 37.8% 84. 7% 72.3%
2.6 3.2%
724 1957 .5 80.1 577.5 30.9 32.8 56.7 51. 9
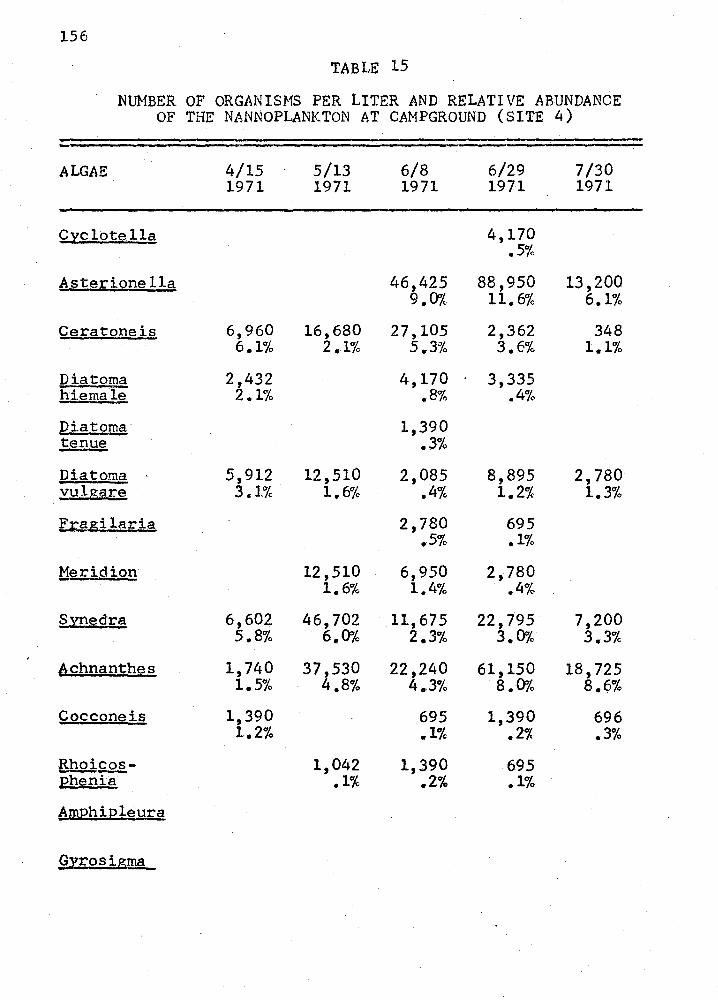
156
TABLE 15
NUMBER OF ORGANISMS PER LITER AND RELATIVE ABUNDANCE OF THE NANNOPLANKTON AT CAMPGROUND (SITE 4)
ALGAE 4/15 5/13 6/8 6/29 7/30 1971 1971 1971 1971 1971
Cyclotella 4,170 .5%
Aste~ionella 46,425 88,950 13,200 9.0% 11. 6% 6.1%
Cera tone is 6,960 16,680 27,105 2,362 348 6.1% 2 .. 1% 5 .. 3% 3.6% 1.1%
Diatorna 2,432 4,170 3,335 hiemale 2.1% .8% .4%
Diatoma 1,390 tenue .3% Diatoma 5,912 12,510 2,085 8,895 2,780 vulgare 3.1% 1.6% .4% 1.2% 1.3%
f.;:agilaria 2,780 695 .5% .1%
Meridion 12,510 6,950 2,780 1.6% 1.4% .4%
Synedrs, 6,602 46,702 11,675 22,795 7,200 5.8% 6.0% 2.3% 3.0% 3.3%
6, chnanthe s 1,740 37,530 22,240 61,150 18,725 1.5% 4.8% 4.3% 8. 0'/4 8.6%
Cocconeis 1,390 695 1,390 696 1.2% .1% .2% .3%
Rhoico.§.- 1,042 1,390 695 ,Ehenia .1% .2% .1%
amphipleura
Qyrosigma
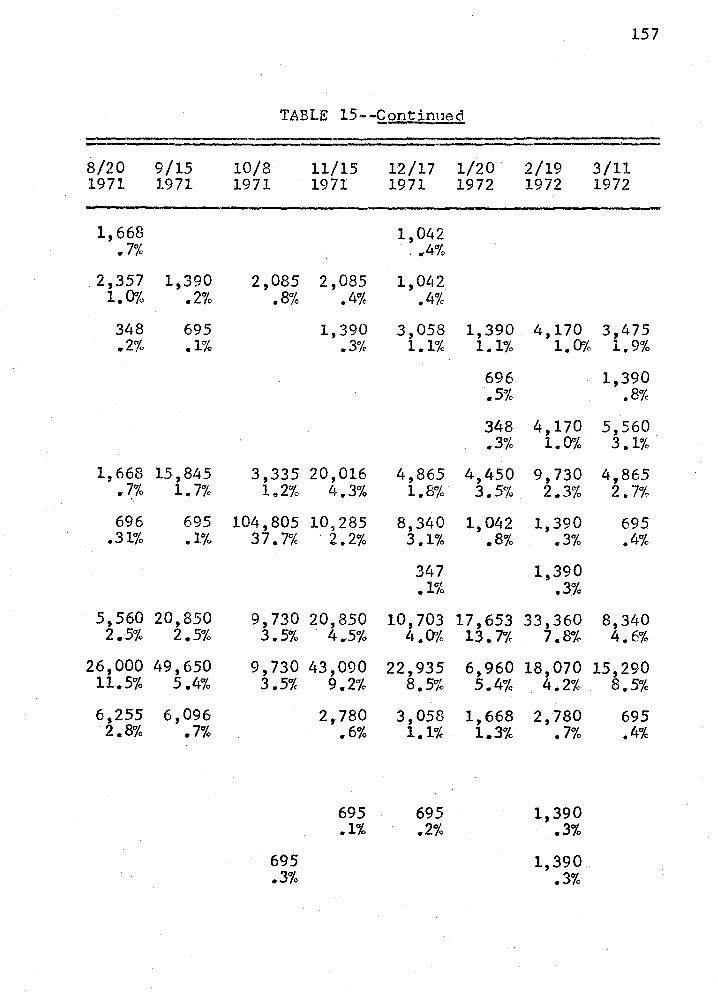
8/20 9/15 1971 1971
1,668 • 7%
2,357 1,390 1.0% .2% 348 695 .2% .1%
1,668 15,845 .7% 1. 7%
696 695 .31% .1%
5,560 20,850 2.5% 2.5%
26,000 49,650 11.5% 5.4%
6,255 6,096 2.8% .7%
TABLE 15--£ontinued
10/8 11/15 1971 1971
2,085 2,085 .8% .4%
1,390 .3%
3,335 20,016 le2% 4.3%
104,805 10,285 37. 7% · 2.2%
9,730 20,850 3.5% . 4.5%
9,730 43,090 3.5%
695 .3%
9.2%
2,780 .6%
695 .1%
12/17 1971
1,042 , .4%
1,042 .4%
3,058 1.1%
4,865 1.8%
8,340 3.1%
347 .1%
10,703 4 .00/4
22,935 8.5%
3,058 1.1%
695 .2%
1/20 2/19 1972 1972
1,390 4,170 1.1% 1.0%
696 .5%
348 4,170 .3% 1. CI'/4
4,450 9,730 3.5% 2.3%
1,042 1,390 .8% .3%
1,390 .3%
17,653 33,360 13. 7% 7.8%
6,960 18,070 5.4%
1,668 1.3%
4.2%
2,780 • 7%
1,390 .3%
1,390 .3%
157
3/11 1972
3,475 1.9%
1,390 .8%
5,560 3.1%
4,865 2. 7%
695 .4%
8,340 4.6%
15,290 8.5%
695 .4%
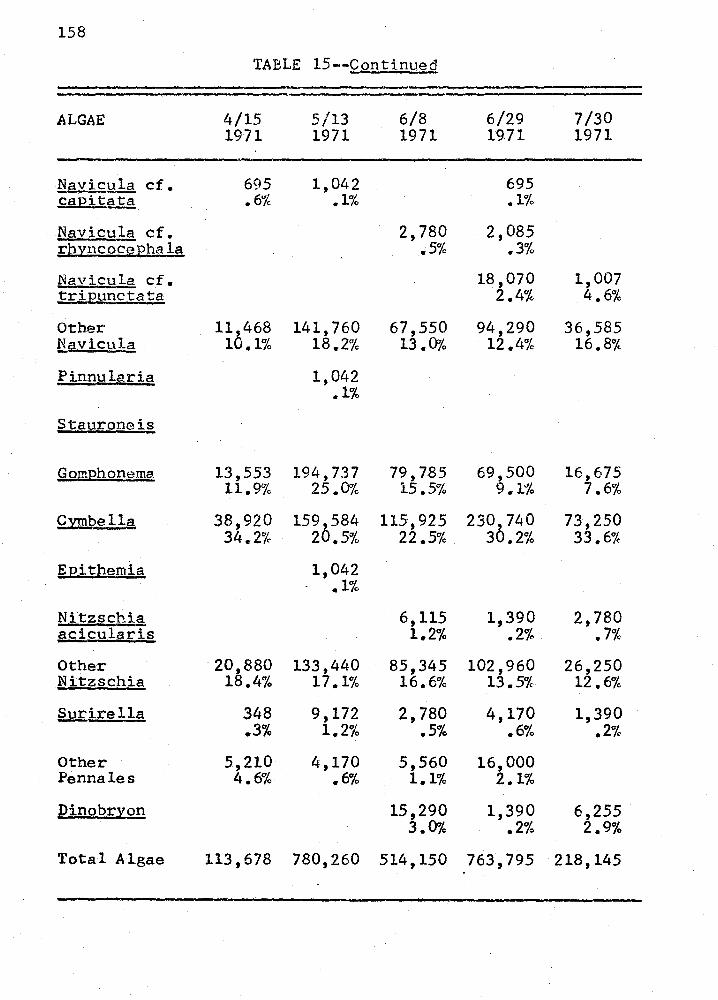
158
TABLE 15--Continued
ALGAE 4/15 5/13 6/8 6/29 7/30 1971 1971 1971 1971 1971
Navicula cf. 695 1,042 695 capit~ .6% .1% .1%
Navicula cf. 2,780 2,085 rhincoc~Eha la .5% .3% Navicula cf. 18,070 1,007 tri12tmctata 2.4% 4.6%
Other 11,468 141,760 67,550 94,290 36,585 !isCTJcula 10.,1% 18.2% 13. Oo/0 12.4% 16.8%
Pinnularia 1,042 .1%
Stauroneis
S3omJ2honema 13,553 194,737 79,785 69,500 16,675 11.9% 25.0% 15.5% 9.1% 7.6%
C~bella 38,920 159,584 115,925 230,740 73,250 34.2% 20.5% 22.5% 30.2% 33.6%
E12ithemia 1,042 .1%
Nitzschia 6,115 1,390 2,780 {!Cicularis 1.2% .2% .7%
Other ·208880 133,440 85,345 102,960 26,250 Nitzschia 1 .4% 17 .1% 16.6% 13.5% 12.6%
21!!:ire lla 348 9,172 2,780 4,170 1,390 .3% 1.2% .5% .6% .2%
Other 5,210 4,170 5,560 16,000 Pennales 4.6% .6% 1.1% 2.1%
!2inobrion 15,290 1,390 6,255 3.0% .2% 2.9%
Total Algae 113,678 780,260 514,150 763,795 218,145
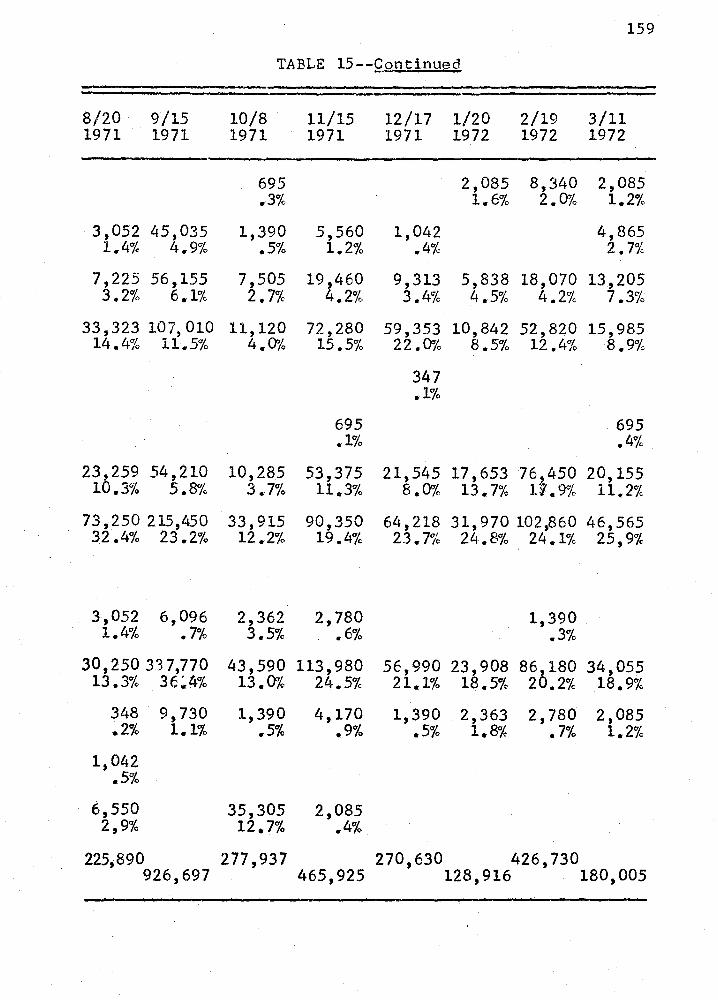
159
TABLE 15--Continued
8/20 9/15 10/8 11/15 12/17 1/20 2/19 3/11 1971 1971 1971 1971 1971 1972 1972 1972
695 2,085 8,340 2,085 .3% 1.6% 2.0% 1.2%
3,052 45,035 1,390 5,560 1,042 4,865 1.4% 4.9% .5% 1.2% .4% 2. 7%
7,225 56,155 7,505 19,460 9,313 5,838 18,070 13,205 3.2% 6.1% 2. 7% 4.2% 3.4% 4.5% 4.2% 7.3%
33,323 107,010 11,120 72,280 59,353 10,842 52,820 15,985 14.4% 11.5% 4 .. 0% 15.5% 22.0% 8.5% 12.4% 8.9%
347 .1%
695 695 .. 1% .4%
23,259 54,210 10,285 53,375 21,545 17,653 76,450 20,155 10.3% 5.8% 3.7% 11.3% 8.0% 13. 7% 11.9% 11.2%
73,250 215,450 33,915 90,350 64,218 31,970 102,860 46,565 32.4% 23.2% 12 .. 2% 19.4% 23.7% 24.8% 24.1% 25,9%
3,052 6,096 2,362 2,780 1,390 1.4% .7% 3.5% .6% .3%
30,250 337,770 43,590 113,980 56,990 23,908 86,180 34,055 13.3% 36~4% 13.0% 24.5% 21.1% 18.5% 20.2% 18.9%
348 9,730 1,390 4,170 1,390 2,363 2,780 2,085 .2% 1.1% .5% .9% .5% 1.8% • 7% 1.2%
1,042 .5%
6,550 35,305 2,085 2,9% 12.7% .4%
225,890 277,937 270,630 426,730 180,005 926,697 465,925 128,916
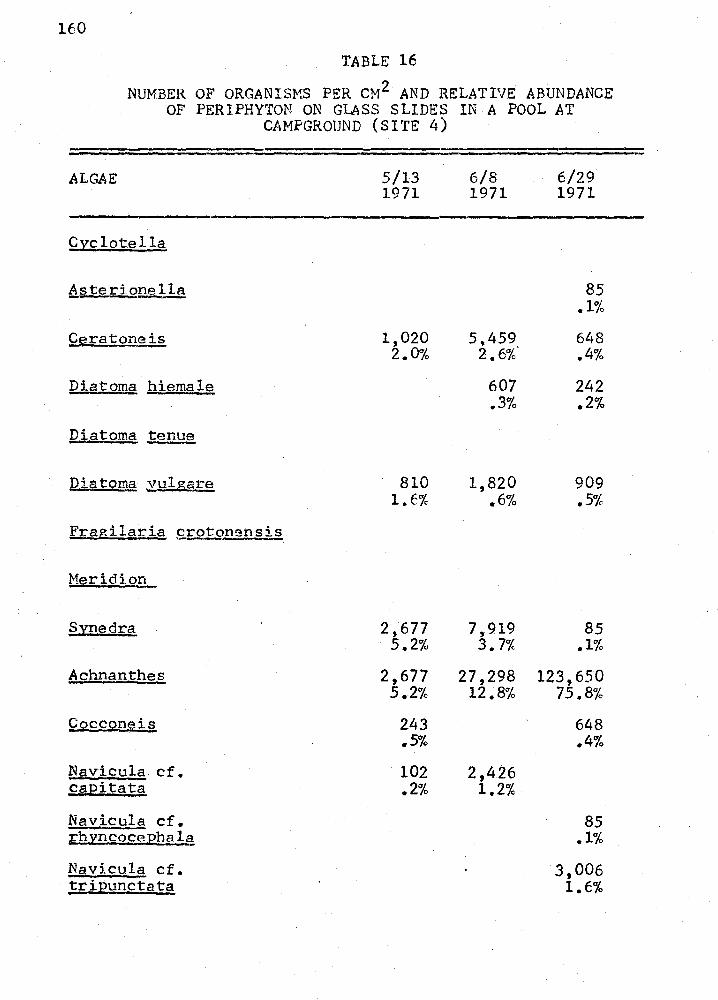
160
TABLE 16
NUMBER OF ORGANISMS PER CM2 AND RELATIVE ABUNDANCE OF PERIPHYTON ON GLASS SLIDES IN A POOL AT
CAMPGROUND (SITE 4)
ALGAE
Cyclotella
Asterionella --------C~ratone~s
Diatoma hiemale
Diatoma tenue
;Qiatoms_ yulgare
F~agilaria ~_J'."otonensis
Meripion
§_ynedra
.Achnanthes
Cocconeis
Navicula cf. capitata
Navicula cf. a;:h~ncocephal~
Navicula cf. !,r ,ipuncta ta
5/13 1971
1,020 2.0%
810 l.f.%
2,677 5.2%
2,677 5.2%
243 .5%
102 .2%
6/8 1971
5 ,459_ 2.6%
607 .3%
1,820 .6%
7,919 3. 7%
27,298 12.8%
2,426 1.2%
6/29 1971
85 .1%
648 .4%
242 .2%
909 .5%
85 .1%
123,650 75.8%
648 .4%
85 .1%
3,006 1.6%
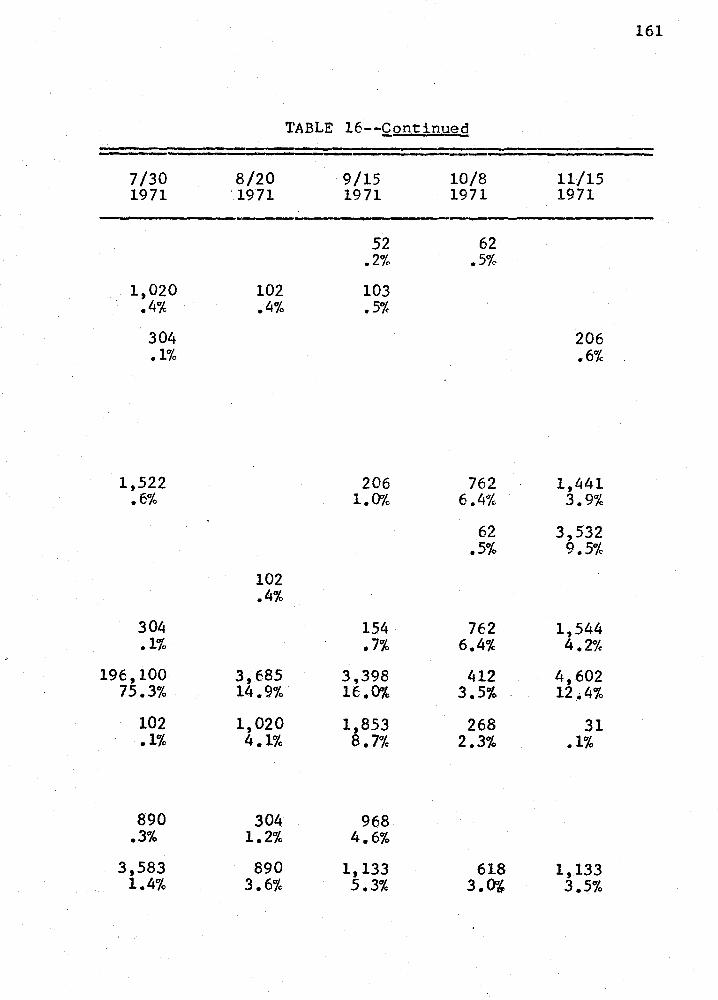
7/30 1971
1,020 .4%
304 .1%
1,522 .6%
304 .1%
196,100 75.3%
102 .1%
890 .3%
3,583 1.4%
8/20 1971
102 .4%
102 .4%
3,685 14.9%
1,020 4.1%
304 1.2%
890 3.6%
TABLE 16--Qontinued
9/15 1971
52 .2%
103 .5%
206 1.0%
154 .7%
3.398 16.0%
1,853 8. 7%
968 4.6%
1,133 5.3%
10/8 1971
62 .5%
762 6.4%
62 .5%
762 6.4%
412 3.5%
268 2.3%
618 3.(}'~
11/15 1971
206 .6%
1,441 3.9%
3.,532 9.5%
1,544 4.2%
4,602 12.4%
31 .1%
1,133 3.5%
161
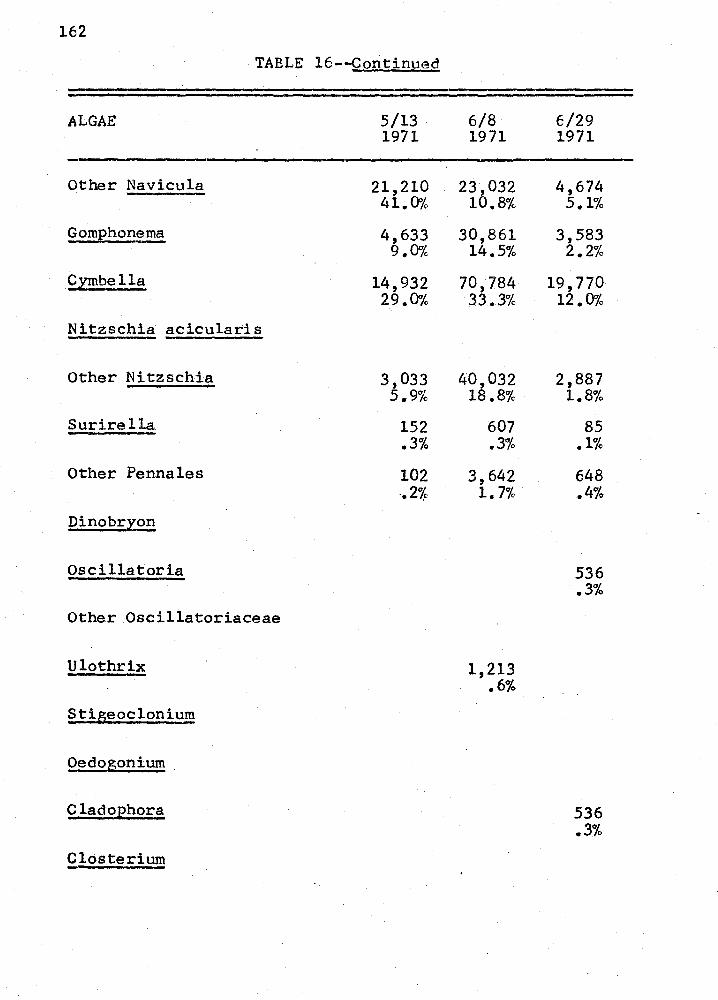
162
TABLE 16--Q.ontinued
ALGAE
Other Navicula
Gomphonema
Cyrnbella
Nitzschia acicularis
Other Nitzschia
Surirella
Other Pennales
pinobryon
Oscillatoria
Other Oscillatoriaceae
Ulothrix
Stigeocloniu,m
Oedogonium
Clado:phora
Closterium
5/13 1971
21,210 41. 0%
4,633 9.0%
14,932 29.0%
3,033 5.9%
152 .3%
102 -. 2o/o
6/8 1971
23,032 10.8%
30,861 14.5%
70,784 33.3%
40,032 18.8%
607 .3%
3,642 1 .. 7%
1,213 .6%
6/29 1971
4,674 5.1%
3,583 2.2%
19,770 12.0%
2,887 1.8%
85 .1%
648 .4%
536 .3%.
536 .3%
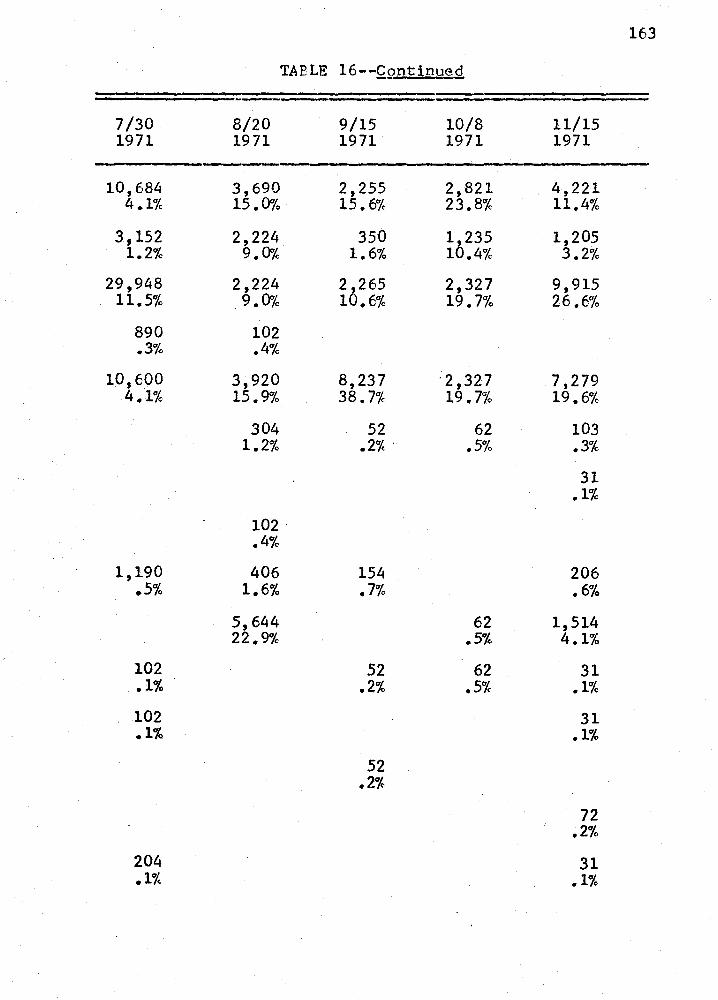
163
TABLE 16--£0_1.ltinueg
---7/30 8/20 9/15 10/8 11/15 1971 1971 1971 1971 1971
10,684 3,690 2,255 2,821 4,221 4.1% 15.0% 15.6% 23.8% 11.4%
3,152 2,224 350 1 235 1,205 1.2% 9.0% 1.6% 10.4% 3.2%
29,948 2,224 2 265 2,327 9,915 11.5% . 9.0% 10.6% 19.7% 26.6%
890 102 .3% .4%
10,600 3,920 8,237 : 2,327 7,279 4.1% 15.9% 38. 7% 19. 7% 19.6%
304 52 62 103 1.2% .2%. .5% .3%
31 .1%
102 .4%
1,190 406 154 206 .5% 1.6% .7% .6%
5,644 62 1,514 22.9% .5% 4.1%
102 52 62 31 .1% .2% .5% .1% 102 31 .1% .1%
52 .2%
72 .2%
204 31 .1% .1%
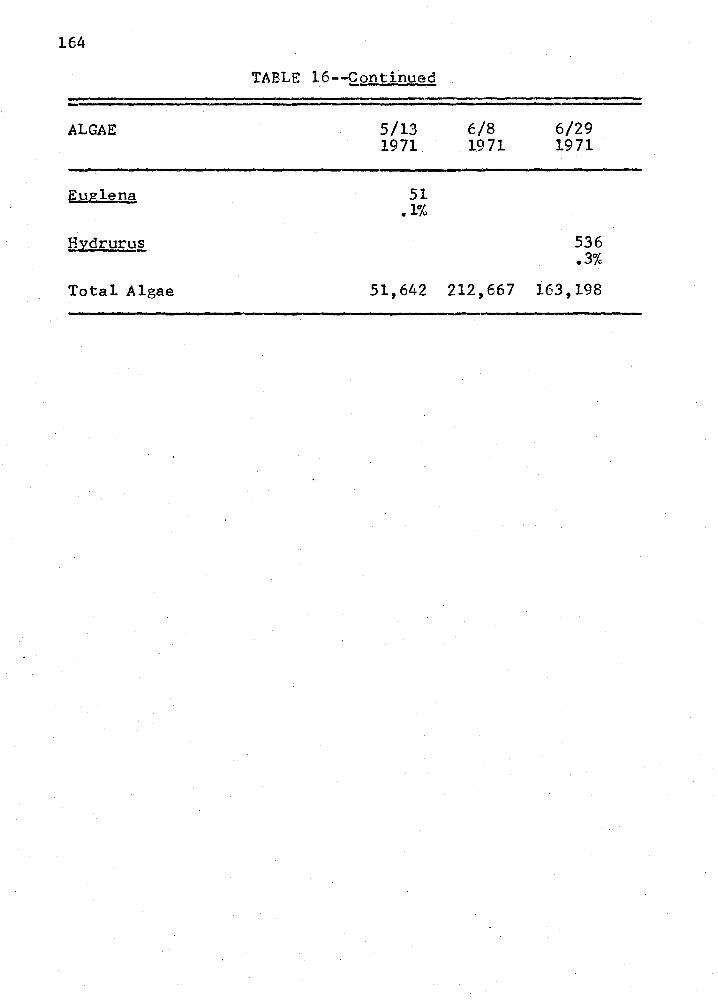
164
TABLE 16--Continued
ALGAE 5/13 6/8 6/29 1971 1971 1971
~uglena 51 .1%
H;xdruru.§. 536 .3%
Total Algae 51,642 212,667 163,198
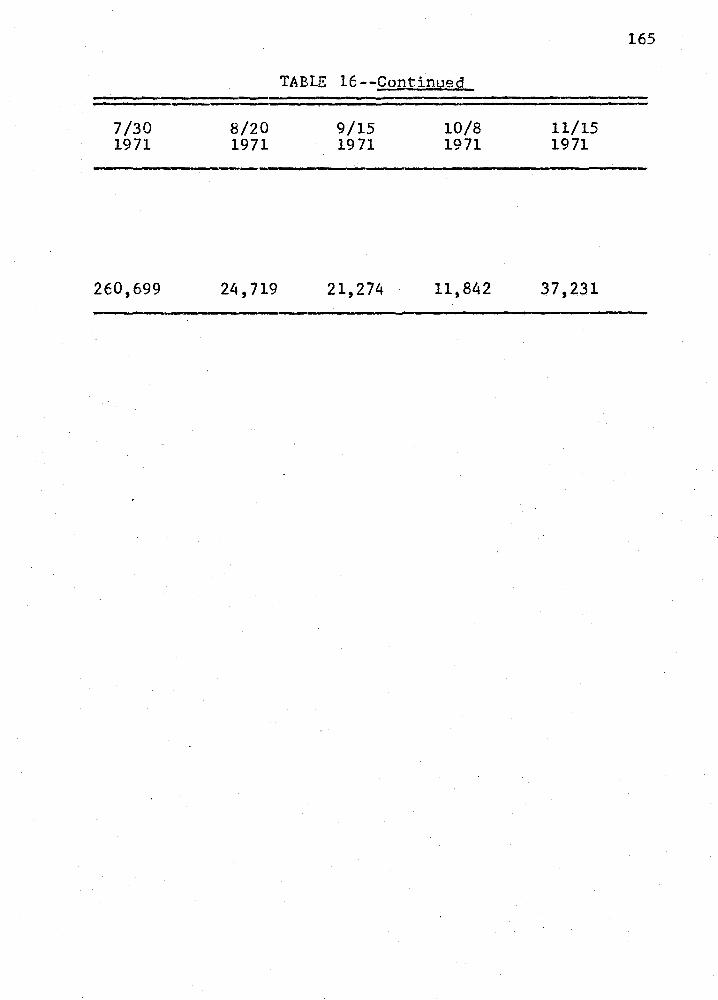
7/30 1971
2E0,699
8/20 1971
24,719
TABLE 16--Continued
9/15 1971
21,274
10/8 1971
11,842
11/15 1971
37,231
165
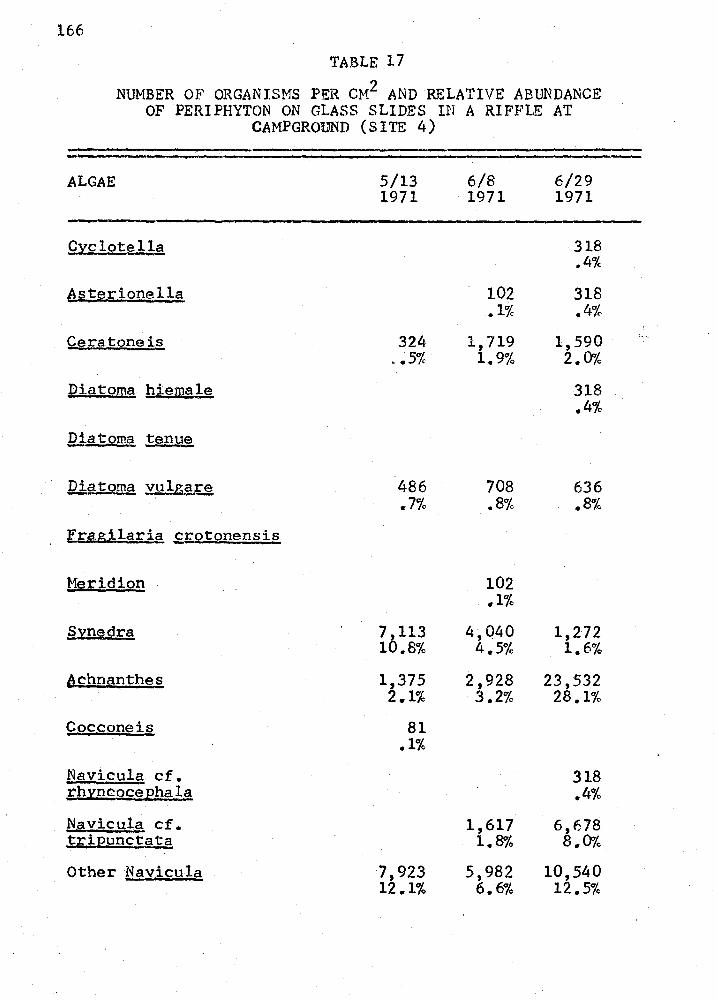
166
TABLE 17
NUMBER OF ORGANISMS PER CM2 AND RELATIVE ABUNDANCE OF PERIPHYTON ON GLASS SLIDES IN A RIFFLE AT
CAMPGROUND (SITE 4)
ALGAE 5/13 6/8 6/29 1971 1971 1971 --
Cyclot~ 318 .4%
Asterionella 102 318 .1% .4%
Cera tone is 324 1,719 1,590 •• 5% 1.9% 2.0%
Diatorna hiemale 318 .4%
Diatoma tenue
filatoma y~lg~~ 486 708 636 .7% .8% .8%
[.ra.gilaria crotonensis
M~;i;:idion 102 .1%
§inedra 7,113 4,040 1,272 10.8% 4.,5% 1.6%
Achnanthes 1,375 2,928 23,532 2 .. 1% 3.2% 28.1%
Cocconeis 81 .1%
Navicula cf. 318 _;:hyncocephala .. 4% Navicula cf. 1,617 6,678 tripunctata 1.8% 8.0% Other Navicula 7,923 5,982 10,540
12.1% 6.6% 12.5%
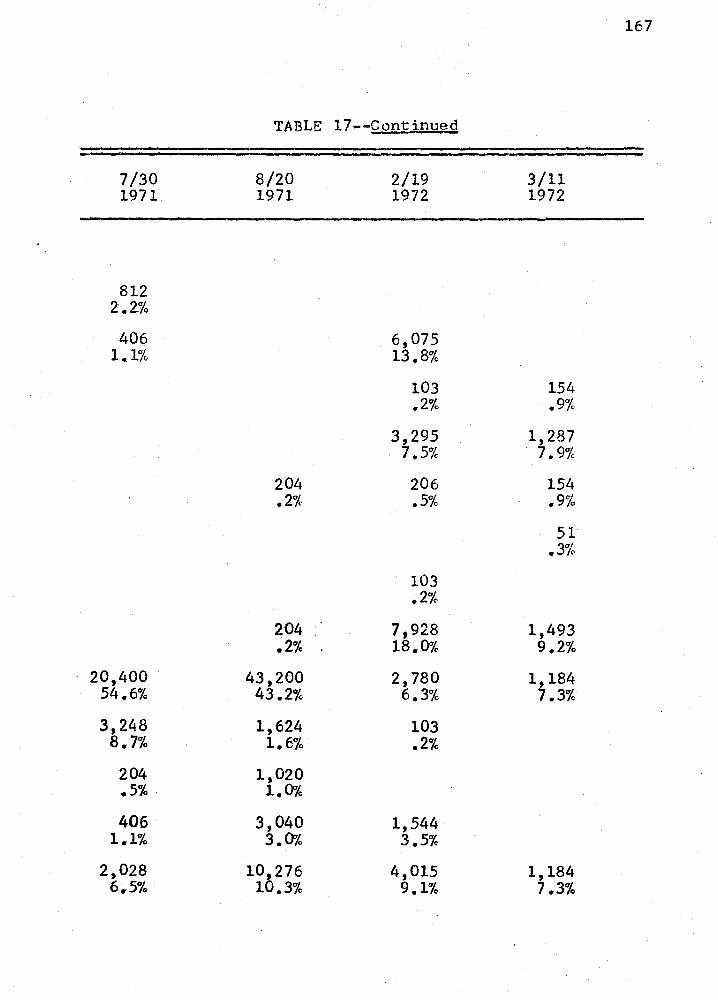
7/30 1971
812 2.2%
406 1.1%
20,400 54.6%
3,248 8.7%
204 .5%
406 1.1%
2,028 6.5%
TABLE 17--Continued
8/20 1971
204 .2%
204 .2%
43,200 43.2%
1,624 1.6%
1,020 1.0%
3,040 3.0%
10,276 10.3%
2/19 1972
6,075 13.8%
103 .2%
3,295 7.5%
206 .5%
103 .2%
7,928 18.0%
2,780 6.3%
103 .2%
1,544 3.5%
4,015 9.1%
3/11 1972
154 .9%
1,287 7.9%
154 .9%
51 .. 3%
1,493 9.2%
1,184 7.3%
1,184 7.3%
167
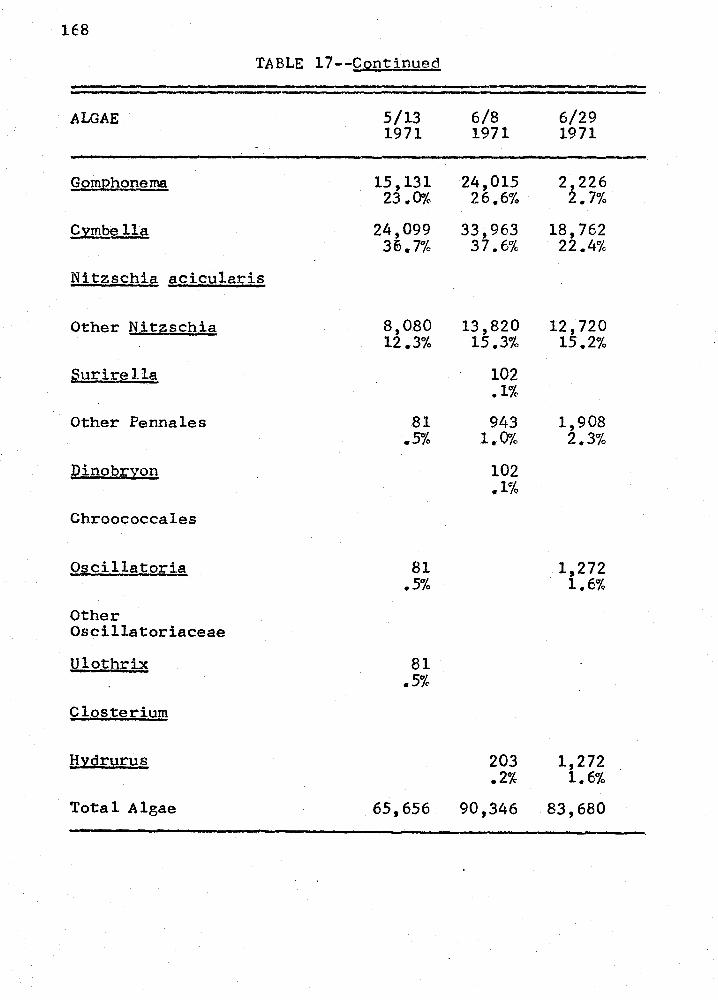
1E8
TABLE 17--Continued
ALGAE 5/13 6/8 6/29 1971 1971 1971
GpmJ2honerna. 15,131 24,015 2,226 23.0% 26.6% 2.7%
Cymbtl.!s! 24,099 33,963 18,762 36.7% 37 .6% 22.4%
Nitzschia acicularis
Other Nitzschia 8,080 13,820 12,720 12.3% 15.3% 15.2%
Surirella 102 .1%
Other Pennales 81 943 1,908 .5% 1.0% 2.3%
Dinobryon 102 .1%
Chroococcales
g.s,cillatoria 81 1,272 .5% 1.6%
Other Oscillatoriaceae
Ulothrix 81 .5%
Closterium
Hidruru.§. 203 1,272 .2% 1.6%
Total Algae 65,656 90,346 83,680
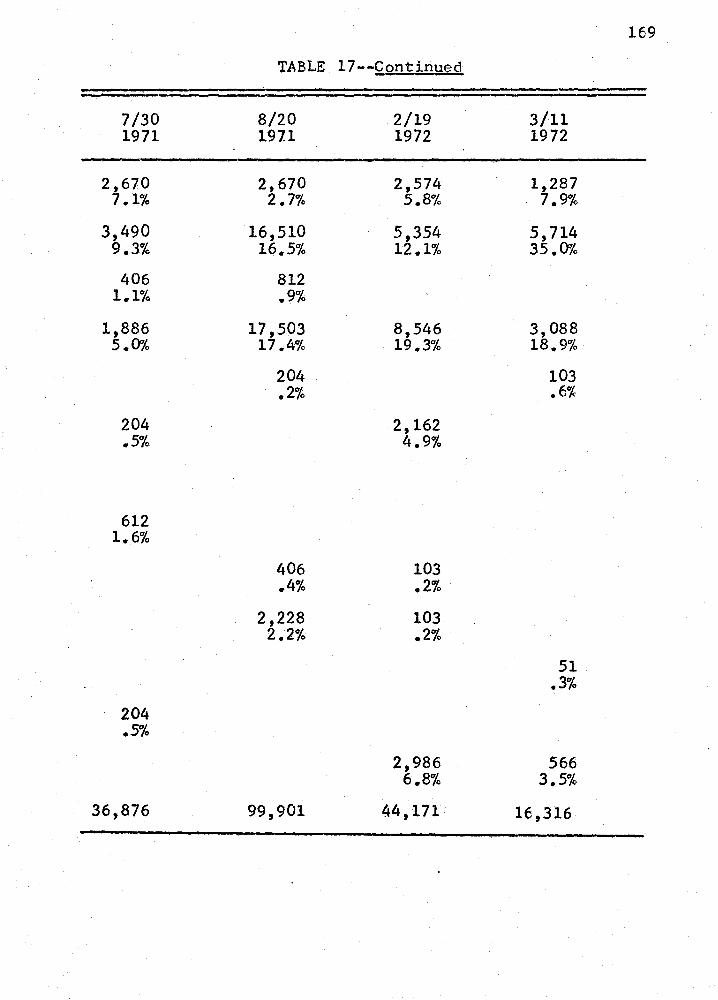
169
TABLE 17--Q.ontinued
7/30 8/20 2/19 3/11 1971 1911 1972 1972
2,670 2,670 2,574 1,287 7 .1% 2. 7% 5.8% 7.9%
3,490 16,510 5,354 5,714 9.3% 16.5% 12.1% 35.0% 406 812
1.1% .9%
1,886 17,503 8,546 3,088 5.0% 17.4% 19.3% 18.9%
204 103 .2% .6%
204 2,162 .5% 4.9%
612 1.6%
406 103 .4% .2%
2,228 103 2.2% .2%
51 .3%
204 .5%
2,986 566 6.8% 3.5%
36,876 99,901 44,171 16,316
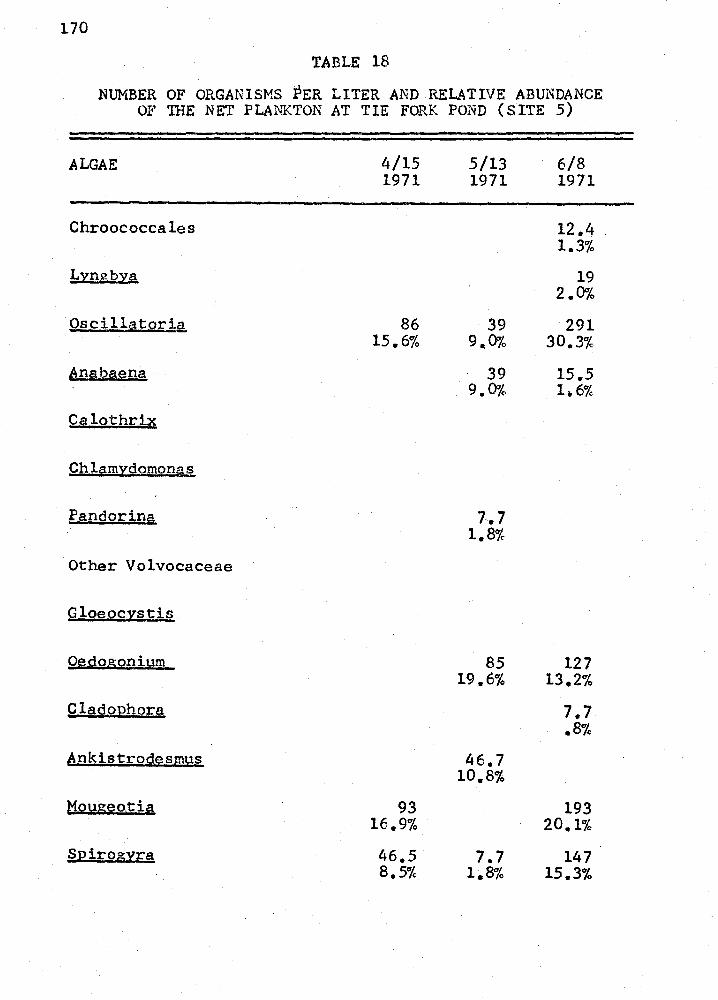
170
TABLE 18
NUMBER OF ORGANISMS PER LITER AND REUTIVE ABUNDANCE OF THE NET PLANKTON AT TIE FORK POND (SITE 5)
ALGAE 4/15 5/13 6/8 1971 1971 1971
Chroococcales 12.4 1.3%
Lyngbya 19 2. 0%
Oscillstoria 86 39 291 15.6% 9.0% 30.3%
/mabaena 39 15.5 9.0% 1.6%
Ca lothri;is
Chlamydomona~
fflndorina 7.7 1.8%
Other Volvocaceae
Gloeocystis
Oegogonium 85 127 19.6% 13.2%
Cladophora 7.7 .8%
Ankistrodesmus 46.7 10.8%
f:1ougeo.ti{I; 93 193 16.9% 20.1%
Spirogyra 46.5 7.7 147 8.5% 1.8% 15.3%
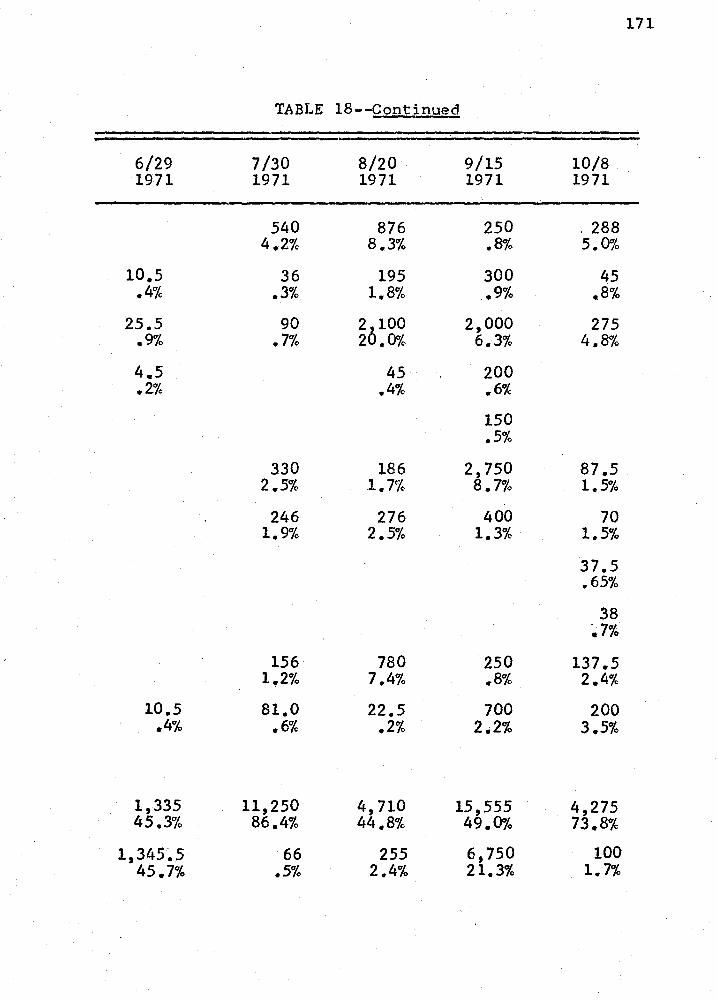
6/29 1971
10.s .4%
25.5 .9%
4.5 .2%
10.5 .4%
1,335 45.3%
1,345~5 45.7%
TABLE
7 /30 1971
540 4.2%
36 .3% 90
.7%
330 2.5%
246 1.9%
156 1.2% 81.0
.6%
11,250 86.4%
66 .5%
18--Continued
8/20 1971
876 8.3%
195 1.8%
2,100 20.0%
45 .4%
186 1.7%
276 2.5%
780 7.4%
22.5 .2%
4,710 44.8%
255 2.4%
9/15 1971
250 .8%
300 ,.9%
2,000 6.3%
200 .6% 150 .5%
2,750 a. 7%
400 1.3%
250 .8% 700
2.2%
15,555 49.0% 6,750 21.3%
10/8 1971
. 288 5.0%
45 .8% 275
4.8%
87.5 1.5%
70 1.5%
37 .5 .65%
38 ~7%
137.5 2.4%
200 3.5%
4,275 73.8%
100 1.7%
171
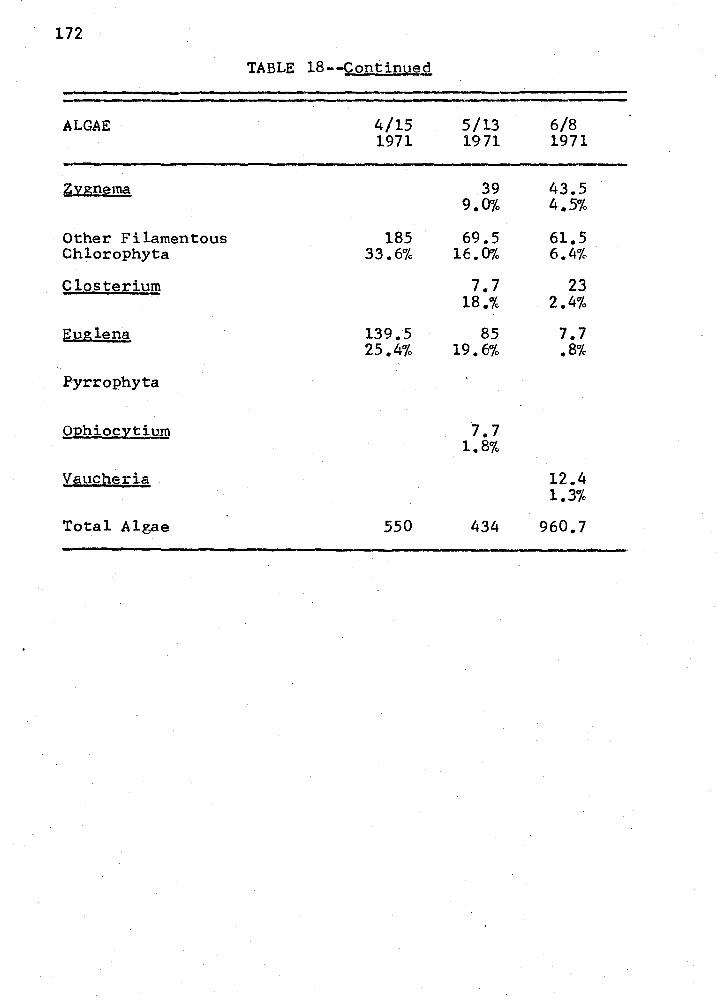
172
TABLE 18--Continµed
ALGAE 4/15 5/13 6/8 1971 1971 1971
Zygnema 39 43.5 9.0% 4.5%
Other Filamentous 185 69.5 61.5 Chlorophyta 33.6% 16.0% 6.4%
Closterium 7.7 23 18.% 2.4%
Euglena 139.S 85 7.7 25.4% 19.6% .8%
Pyrrophyta
Ophio£,Ytium 7.7 1.8%
Vaucheria 12 .. 4 1.3%
Total Algae 550 434 960.7
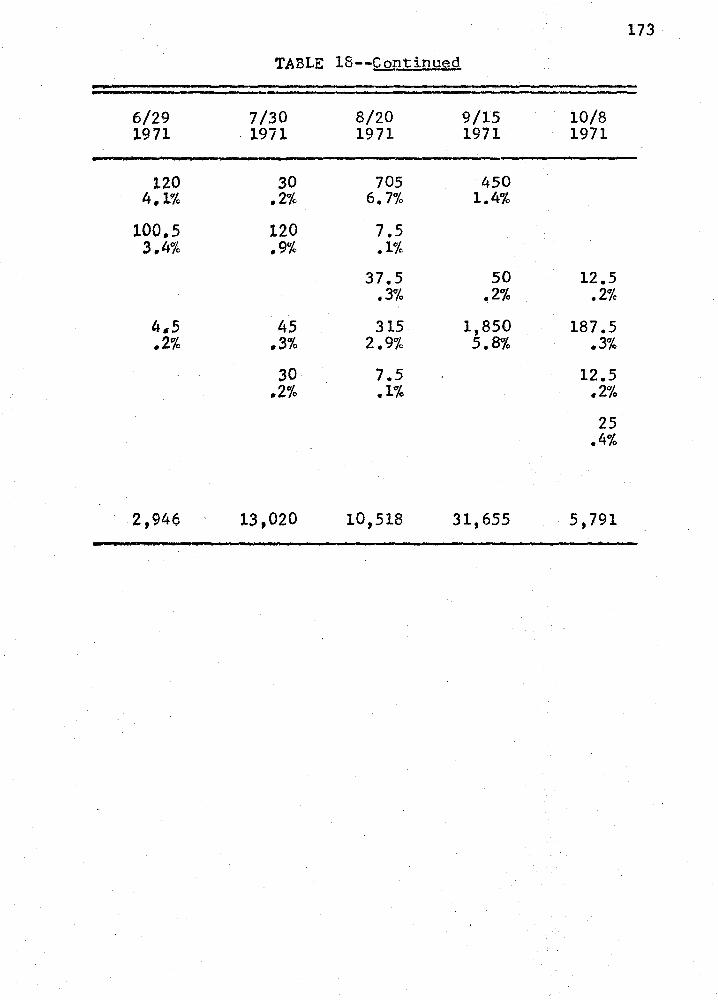
173
TABLE 18--Continued
6/29 7/30 8/20 9/15 10/8 1971 19il 1971 1971 1971
120 30 705 450 4.1% .2% 6.7% 1.4%
100.s 120 7.5 3.4% .9% .1%
37.5 50 12.5 .3% .2% .2%
4-5 45 315 1,850 187.5 .2% .. 3% 2.9% 5.8% .3%
30 7.5 12.5 .2% .1% .2%
25 .4%
2,946 13,020 10,518 31,655 5,791
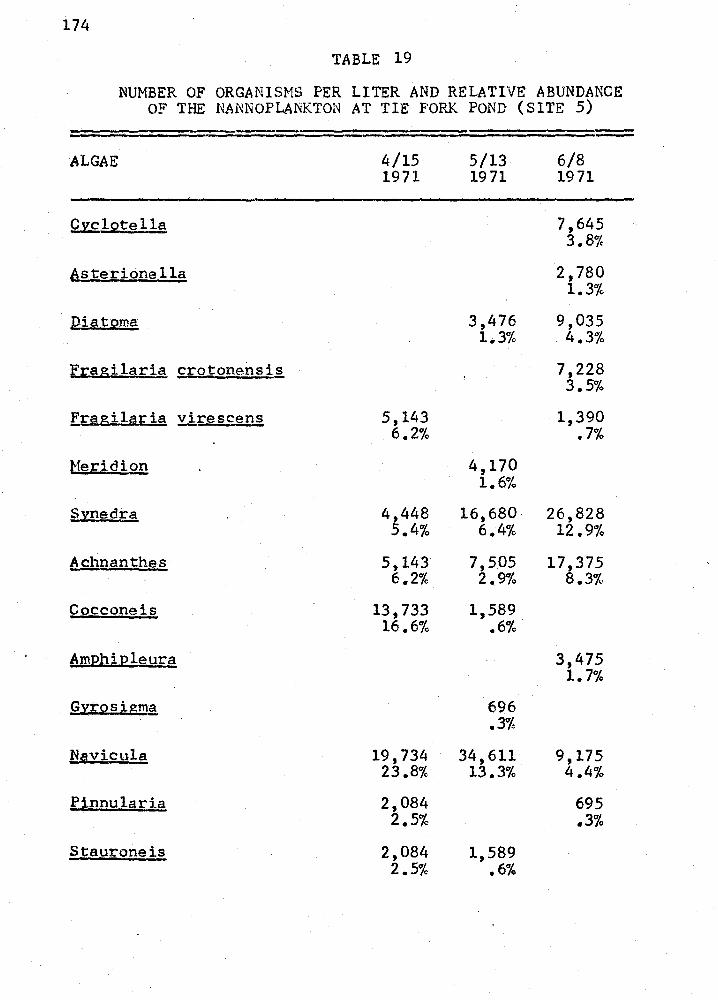
174
TABLE 19
NUMBER OF ORGANISMS PER LITER AND RELATIVE ABUNDANCE OF THE NANNOPLANKTON AT TIE FORK POND (SITE 5)
ALGAE 4/15 5/13 6/8 1971 1971 1971
Cyclotella 7,645 3.8%
Asterionella 2,780 1.3%
Diatoma 3,476 9,035 1.3% 4.3%
ft:agilaria crotonensis 7,228 3.5%
f.ragilaria virescens 5,143 1,390 ____ .,. -6.2% .7%
Metidion 4,170 1.6%
sinedra 4,448 16,680 26,828 5.4% 6.4% 12.9%
Achnanthes 5,143 7,505 17,375 6.2% 2.9% 8.3%
Cocconeis 13,733 1,589 16.6% .6%
AmEhi:eleura 3,475 1.7%
Q:yrosigrna 696 .3%
Navicula 19,734 34,611 9,175 23.8% 13.3% 4.4%
Pinnularj.a 2,084 695 2.5% .3%
S ta.urone is 2,084 1,589 2.5% .6%
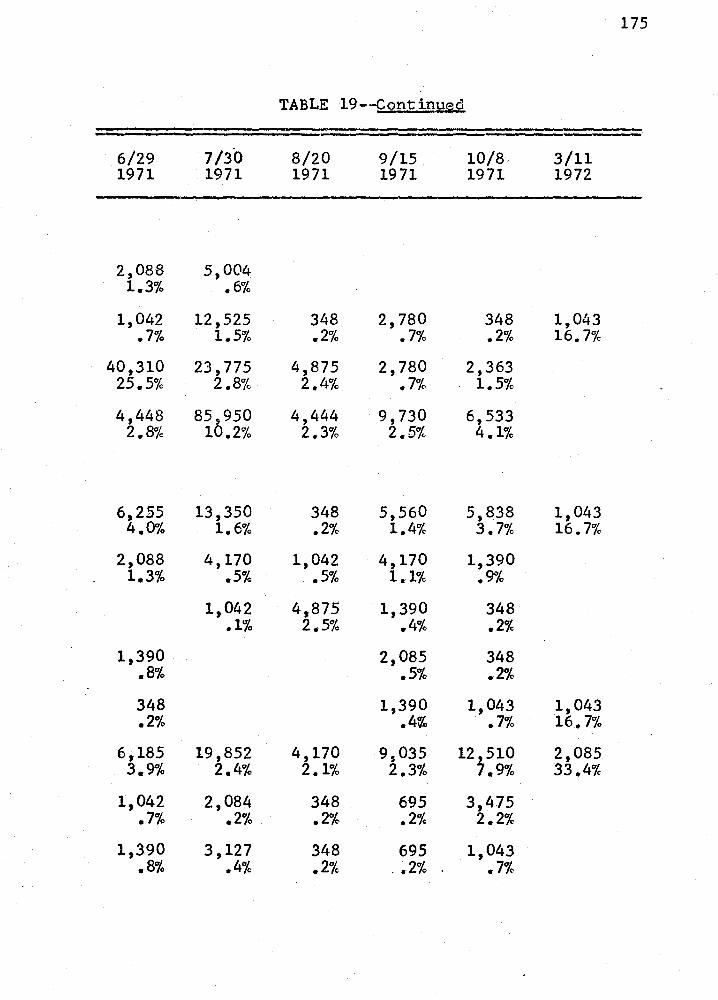
6/29 1971
2,088 1.3%
1,042 .7%
40,310 25.5%
4,448 2.8%
6,255 4.0%
2,088 1.3%
1,390 .8%
348 .2%
6,185 3.9%
1,042 .7%
1,390 .8%
7/30 1971
5,004 .6%
12,525 1.5%
23,775 2.8%
85,950 10.2%
13,350 1.6%
4,170 .5%
1,042 .1%
19,852 2.4%
2,084 .2%
3,127 .4%
TABLE 19--Continu~d
8/20 1971
348 .2%
4,875 2.4%
4,444 2.3%
348 .2%
1,042 .5%
4,875 2.5%
4,170 2.1%
348 .2%
348 .2%
9/15. 1971
2,780 .7%
2,780 .7%
9,730 2.5%
5,560 1.4%
4,170 1.1%
1,390 .4%
2,085 .5%
1,390 .4~
9,035 2.3%
695 .2%
695 .• 2%
10/8 1971
348 .2%
2,363 1.5%
6,533 4.1%
5,838 3.7%
1,390 .9%
348 .2%
348 .2%
1,043 .7%
12,510 7.9%
3,475 2.2%
1,043 .7%
3/11 1972
1,043 16.7%
1,043 16.7%
1,043 16.7%
2,085 33.4%
175
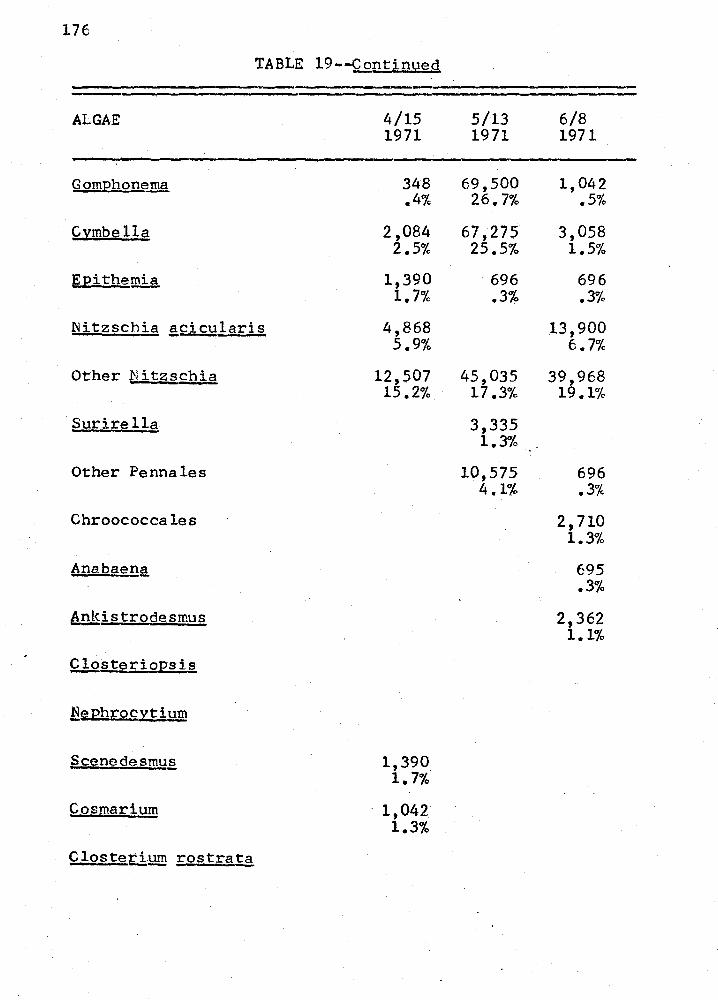
176
TABLE 19--Continued
ALGAE 4/15 1971
Gom:ehonema 348 .4%
Cymbella 2,084 2.5%
E_Eithemi.a 1,390 1.7%
Nitzscbia ~£1£1!laris 4,868
Other N itzschia
Surirella
Other Penna les
Chroococcales
Anabaena
~i.§.trodesmus
£1.Qsteriopsis
!iephrocytiHffi
Scenedesmus
Cosmarium
Closteti!:!m rostrata
5.9%
12,507 15.2%
1,390 1.7%
1,042 1.3%
5/13 6/8 1971 1971
69,500 1,042 26.7% .5%
67,275 3,058 25.5% 1.5%
696 696 .3% .3%
13,900 6.7%
45,035 39,968 17.3% 19.1%
3,335 1.3%
10,575 696 4.1% .3%
2,710 1.3%
695 .3%
2,362 1.1%
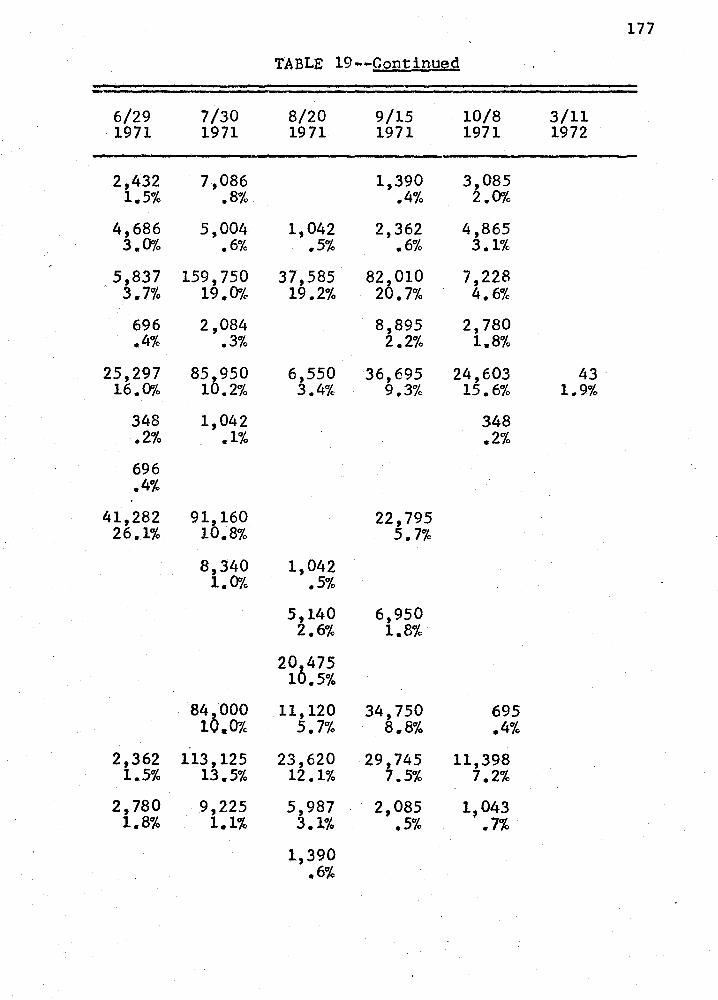
177
TABLE 19--Continu~d
6/29 7/30 8/20 9/15 10/8 3/11 1971 1971 1971 1971 1971 1972
2,432 7,086 1,390 3,085 1.5% .8% .4% 2.0%
4,686 5,004 1,042 2,362 4,865 3.0% .6% .5% .6% 3.1%
5,837 159,750 37,585 820010 7,228 3.7% 19. CF/4, 19.2% 2 .7% 4.6%
696 2,084 8,895 2,780 .4% .3% 2.2% 1.8%
25,297 85,950 6,550 36,695 24,603 43 16.0% 10.2% 3.4% 9.3% 15.6% 1.9%
348 1,042 348 .2% .1% .2% 696 .4%
41,282 91,160 22,795 26.1% 10.8% 5. 7%
8,340 1,042 l.Oo/., .5%
5,140 6,950 2.6% 1.8%
20,475 10.5%
840000 11,120 34,750 695 l .0% 5.7% 8.8% .4%
2,362 113,125 23,620 29,745 11,398 1.5% 13.5% 12.1% 7.5% 7.2%
2,780 9,225 5,987 2,085 1,043 1.8% 1.1% 3.1% .5% .7%
1,390 .6%
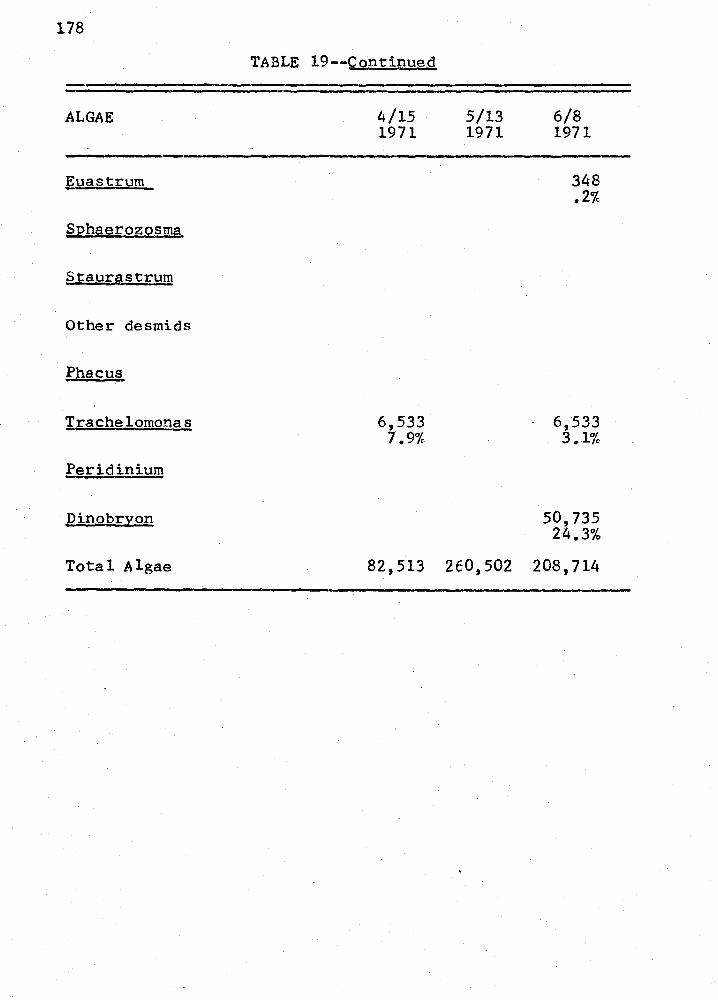
178
TABLE 19--Continued
ALGAE 4/15 5/13 6/8 1971 1971 1971
Euastrum 348 .2%
Sphaerozosma
Staurastrum
Other desmids
Phacus
Trachelomonas 6,533 6,533 7.9% 3.1%
Peridinium
Dinobrion 50,735 24.3%
Total Algae 82,513 260,502 208,714
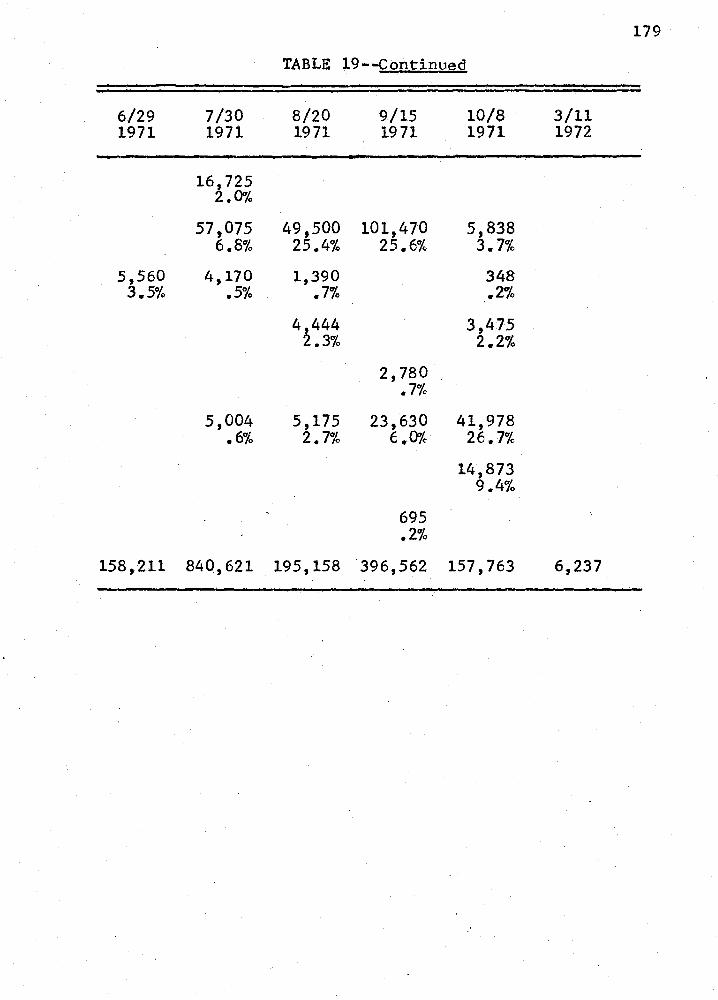
179
TABLE 19--Continu~d
6/29 7/30 8/20 9/15 10/8 3/11 1971 1971 1971 1971 1971 1972
16,725 2.0%
57,075 49,500 101,470 5,838 6.8% 25.4% 25.6% 3.7%
5,560 4,170 1,390 348 3.5% .5% .7% .2%
4,444 3,475 2.3% 2.2%
2,780 .7%
5,004 5,175 23,630 41,978 .6% 2.7% 6.0% 26.7%
14,873 9.4%
695 .2%
158,211 840,621 195,158 396,562 157,763 6,237 -
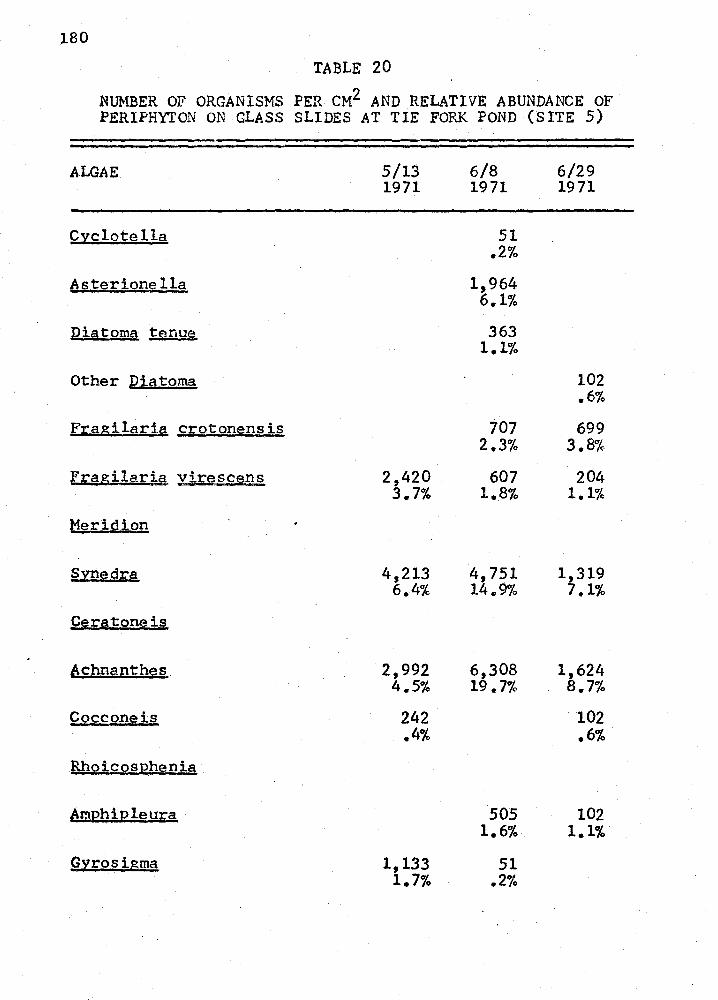
180 TABLE 20
NUMBER OF ORGANISMS PER CM2 AND RELATIVE ABUNDANCE OF PERIPHYTON ON GLASS SLIDES AT TIE FORK POND (SITE 5)
ALGAE 5/13 6/8 6/29 1971 1971 1971
C:2:clotella 51 .2%
asterione lla 1,964 6.1%
Diatoma tenue 363 1.1%
Other Diatoma. 102 .6%
F;r,:agilaris! crot onens is 707 699 2.3% 3.8%
F.:agilaria viresc~I.l§_ 2,420 607 204 3.7% 1.8% 1.1%
M~ridion
2Inedra 4,213 4,751 1,319 6.4% 14.9% 7.1%
Cera tone is
6Chn~nthes 2,992 6,308 1,624 4.5% 19.7% 8.7%
Cocconeis 242 102 .4% .6%
Rhoicosphenia
arnEhi:t2leura 505 102 1.6% 1.1%
Girosigrna 1,133 51 1.7% .2%
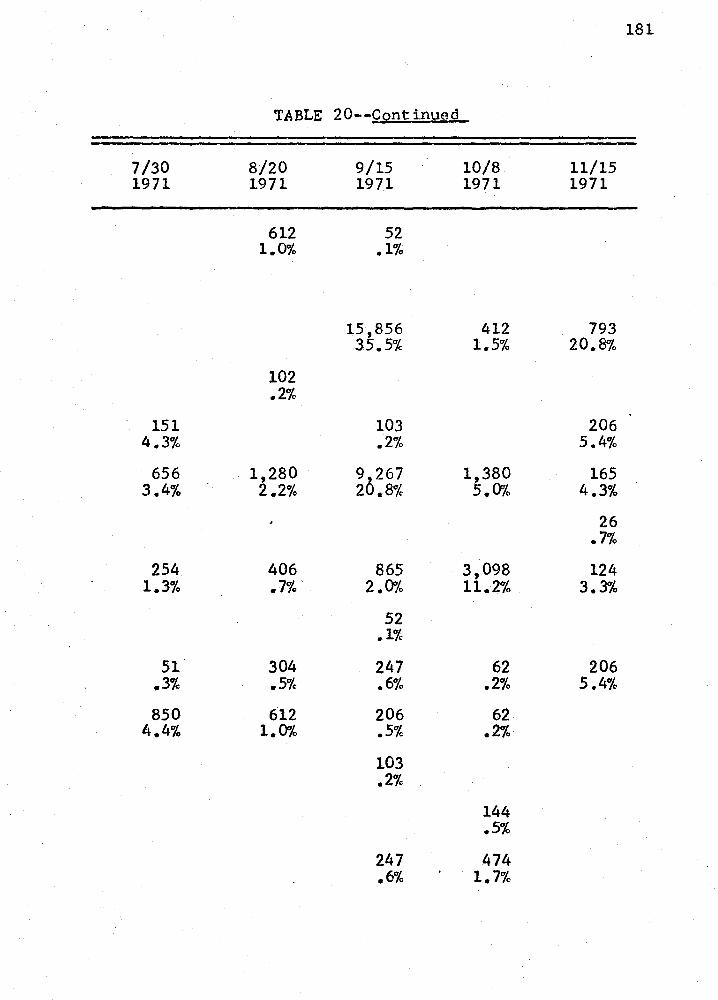
7/30 1971
151 4.3%
656 3.4%
254 1.3%
51 .3% 850
4.4%
TABLE 20--Continued
8/20 1971
9/15 1971
612 52 1.0% .1%
15,856 35.5%
102 .2%
103 .2%
1,280 9 267 2.2% 20.8%
406 865 .7% 2 .0"/4
52 .1%
304 247 .5% .6%
612 206 1.0% .5%
103 .2%
247 .6%
10/8 1971
412 1.5%
1,380 5.0%
3,098 11.2%
62 .2%
62 .2%
144 .5%
474 1.7%
11/15 1971
793 20.8%
206 5.4%
165 4.3%
26 .7%
124 3.3%
206 5.4%
181
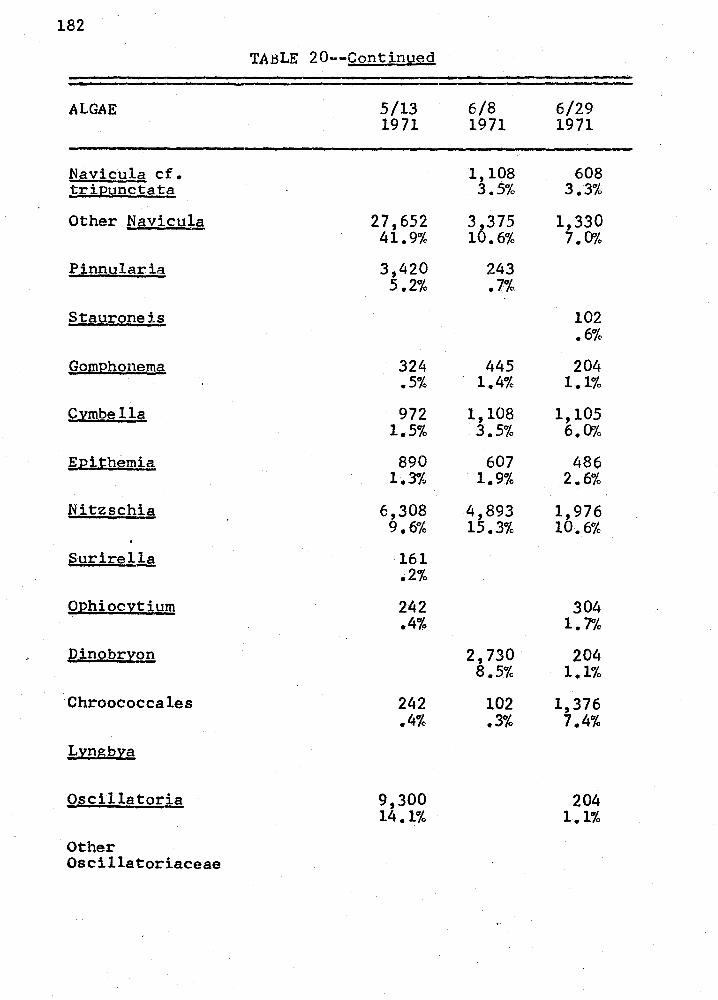
182
TABLE 20--Continued
ALGAE 5/13 6/8 6/29 1971 1971 1971
Navicula cf. 1,108 608 tripunctata 3.5% 3.3%
Other Navicula 27,652 3 375 1,330 41.9% 10.6% 7.fl¾
Pinnularia 3,420 243 5.2% • 7%
Stauroneis 102 .6%
Qomphonerna 324 445 204 .5% 1.4% 1.1%
Cymbe 11§. 972 1,108 1,105 1.5% 3.5% 6.0%
Epithemia 890 607 486 1.3% 1.9% 2.6%
Nitzschia 6,308 4,893 1,976 9.6% 15.3% 10.6%
Surirella - 161 .2%
Ophiocytium 242 304 .4% 1. 7%
J2inobryon 2,730 204 8.5% 1.1%
Chroococcales 242 102 1,376 .4% .3% 7.4%
Lyngbya
Oscillatoria 9,300 204 14.1% 1.1%
Other Oscillatoriaceae
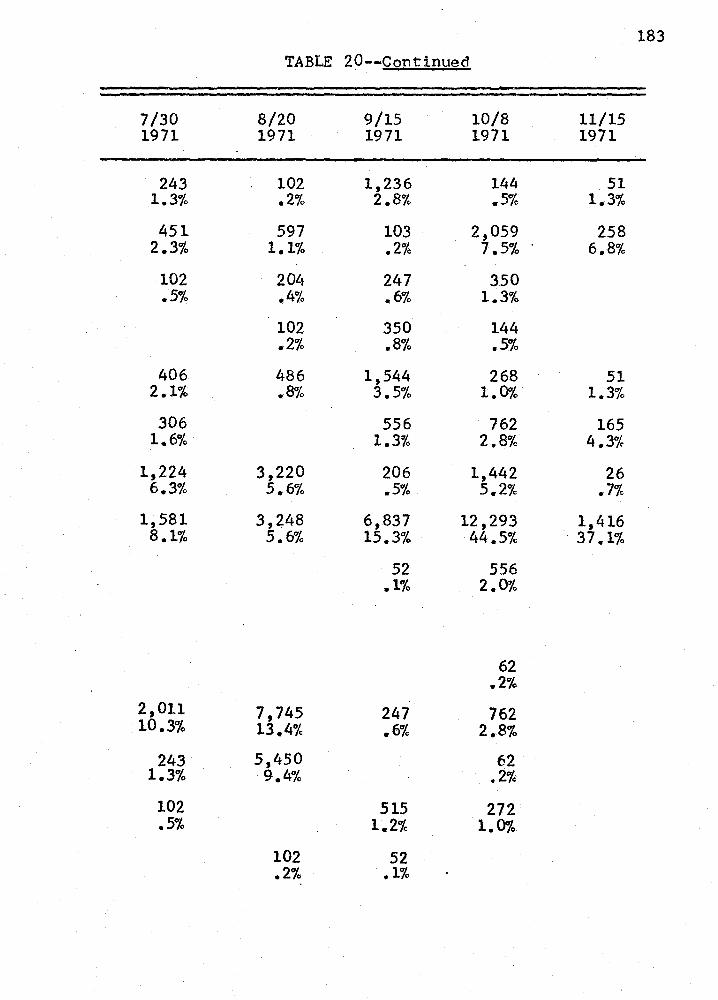
183 TABLE 20--Continued
7/30 8/20 9/15 10/8 11/15 1971 1971 1971 1971 1971
243 102 1,236 144 51 1.3% .2% 2.8% .5% 1.3%
451 597 103 2,059 258 2.3% 1.1% .2% 7.5% 6.8%
102 204 247 350 .5% .4% .6% 1.3%
102 350 144 .2% .. 8% .5%
406 486 1,544 268 51 2.1% .8% 3.5% 1.0% 1.3% 306 556 762 165
1.6% 1.3% 2.8% 4.3% 1,224 3,220 206 1,442 26
6.3% 5.6% .5% 5.2% .7% 1,581 3,248 6,837 12,293 1,416
8.1% 5.6% 15.3% 44.5% 37 .1%
52 556 .1% 2.0%
62 .2%
2,011 7,745 247 762 10.3% 13.4% .6% 2.8% 243 5,450 62
1.3% 9.4% .2% 102 515 272 .5% 1.2% 1.0%
102 52 .2% .1%
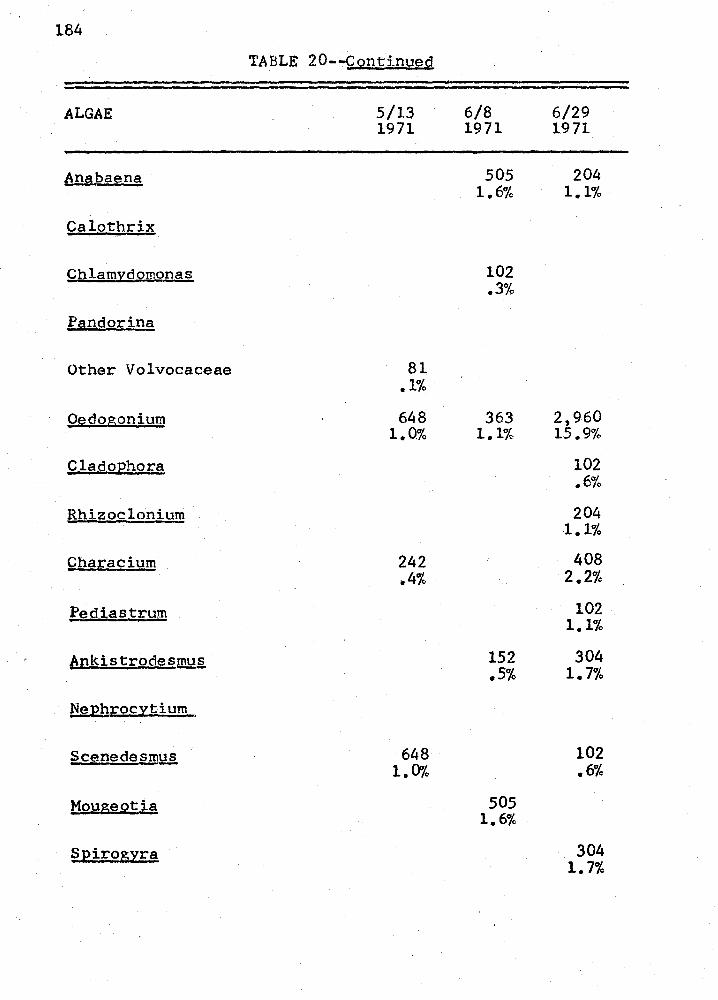
184
TABLE 20--Continued
ALGAE 5/13 6/8 6/29 1971 1971 1971
Anabaena 505 204 1.6% 1.1%
Calothrix
CJllamydo:monas 102 .3%
Pandorina
Other Volvocaceae 81 .1%
O~dogonium 648 363 2,960 1.0% 1.1% 15.9%
f,.la,9 Q.Ehora 102 .6%
Rhizoclonium 204 1.1%
Characiurn 242 408 .4% ·2.2%
Pediastrum 102 1.1%
AnkistrodesID.!ds 152 304 .5% 1.7%
NeJ?hrocytium
Scenede~ 648 102 1.0% .6%
Moµgeotig 505 1.6%
Spirogyra 304 1.7%
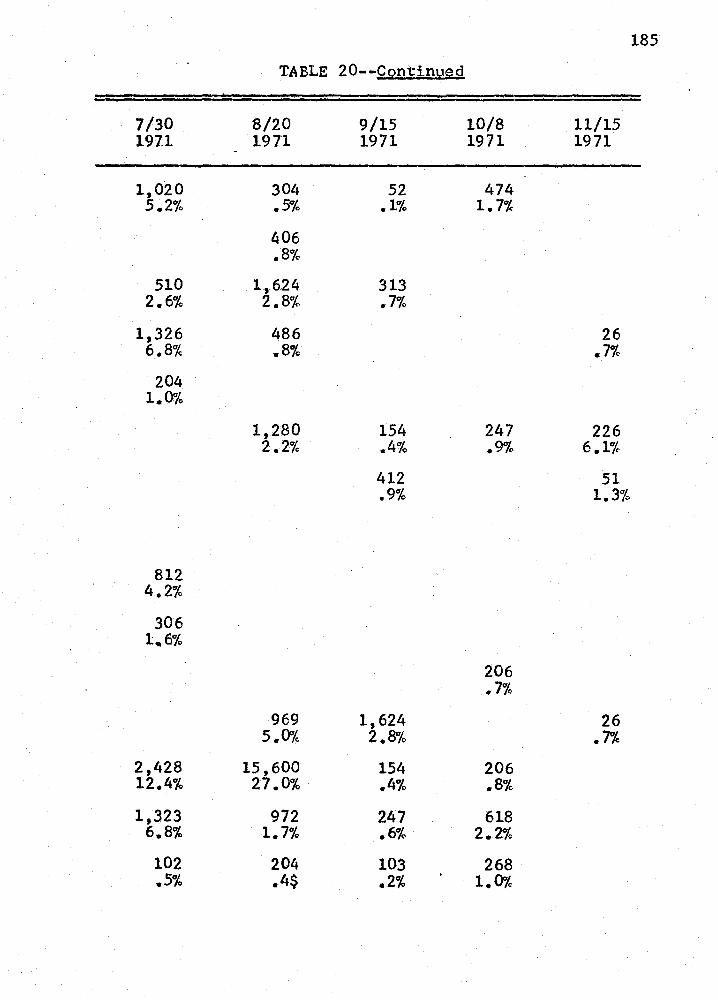
185
TABLE 20--Continued
7/30 8/20 9/15 10/8 11/15 197.1 1971 1971 1971 1971
1,020 304 52 474 5.2% .5% .1% 1.7%
406 .8%
510 1,62.4 313 2.6% 2.8% .7%
1,326 486 26 6.8% .8% .7%
204 1.0%
1,280 154 247 226 2.2% .4% .9% 6.1%
412 51 .9% 1.3%
812 4.2%
306 1.6%
206 .7%
969 1,624 26 5.0% 2. 8'7/o • 7%
2,428 15,600 154 206 12.4% 27.0% .4% .8%
1,323 972 247 618 6.8% 1.7% .6% 2.2% 102 204 103 268 .5% .4$ .2% 1.0%
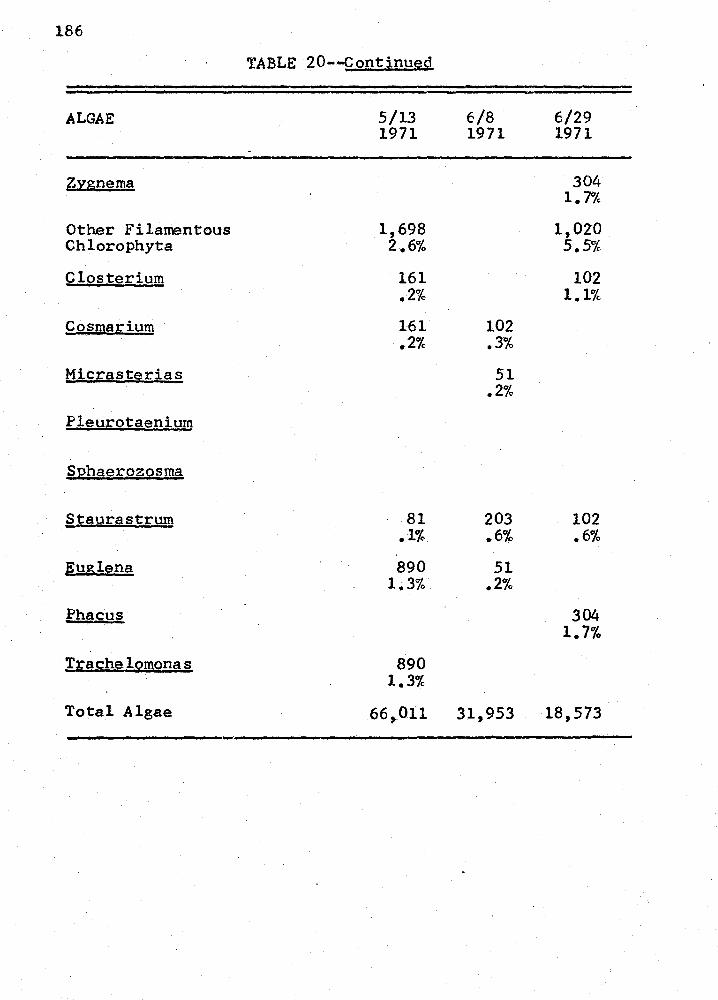
186
TABLE 20--Continu~d
ALGAE 5/13 6/8 6/29 1971 1971 1971
Zygnema 304 l. 7%
Other Filamentous 1,698 1,020 Chlorophyta 2.6% 5.5%
Closterium 161 102 .2% 1.1%
Cosmarium 161 102 .2% .3%
t!ici;.:asterias 51 .2%
Pleurotaenium
Sphaerozosma
.§.!.,a!,!ra strum 81 203 102 .1% .6% .6%
Euglena 890 51 1~3% .2%
Phacus 304 1.7%
I,rache ls;imona s 890 1.3%
Total Algae 66,011 31,953 18,573 -
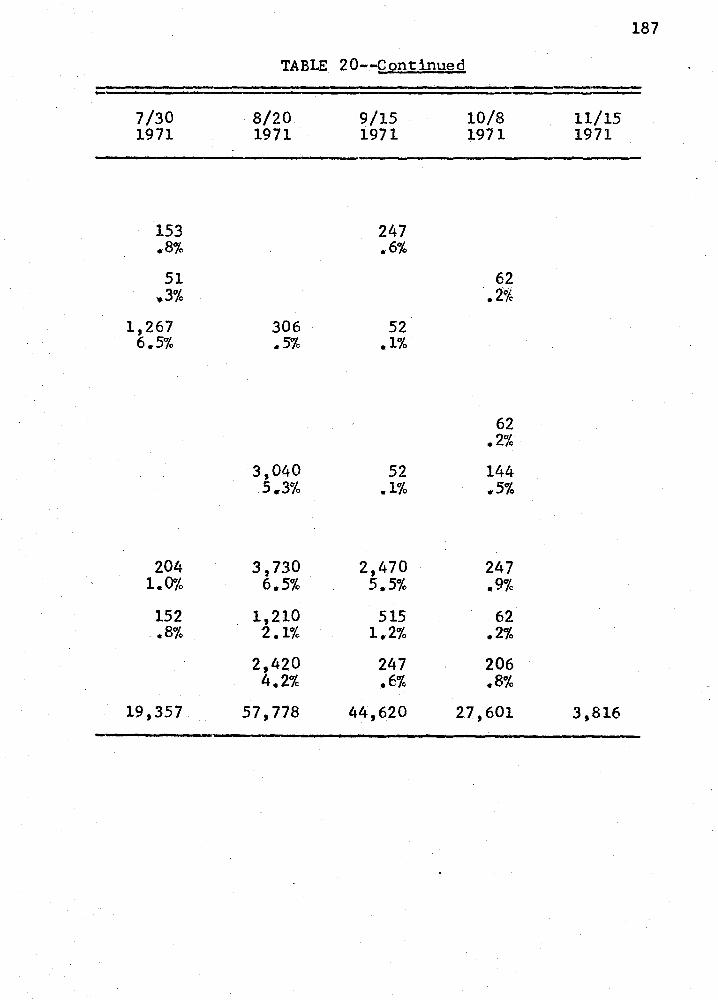
7/30 1971
153 .8%
51 .3%
1,267 6.5%
204 1.0% 152 .8%
19,357
TABLE 20--Continued
8/20 1971
306 .5%
3,040 .5.3%
3,730 6.5%
1,210 2.1%
2,420 4.2%
57,778
9/15 1971
247 .6%
52 .1%
52 .1%
2,470 5.5%
515 1.2%
247 .6%
44,620
10/8 1971
62 .2%
62 .2% 144 .5%
247 .9%
62 .2% 206 .8%
27,601
11/15 1971
3,816
187
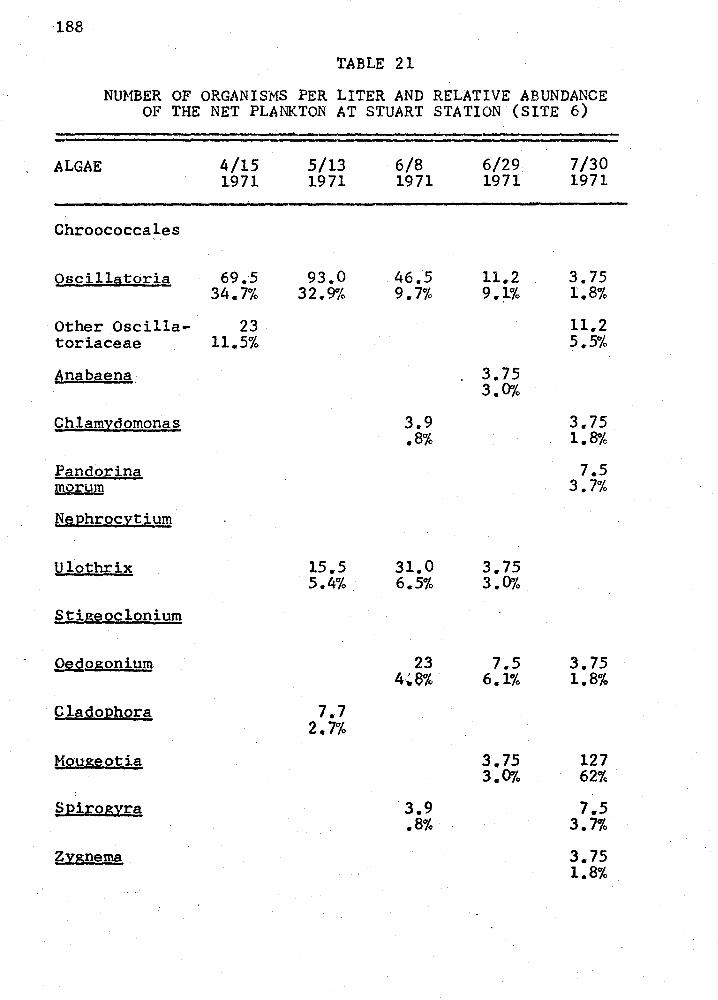
188
TABLE 21
NUMBER OF ORGANISMS PER LITER AND RELATIVE ABUNDANCE OF THE NET PLANKTON AT STUART STATION (SITE 6)
ALGAE 4/15 5/13 6/8 6/29 7/30 1971 1971 1971 1971 1971
Chroococcales
Oscillatoria 69.5 93.0 46.5 11.2 3.75 34.7% 32.9% 9.7% 9.1% 1.8%
Other Oscilla- 23 11.2 toriaceae 11.5% 5.5%
Anabaena 3.75 3.0%
9hlamydomonas 3.9 3.75 .8% 1.8%
Pandorina 7.5 morum 3.7%
Nephrocytium
Ulothrix 15.5 31.0 3.75 5.4% 6.5% 3. 0'/4
§.tigeoclonium
0~.9.ogonium 23 7.5 3.75 4,8%. 6.1% 1.8%
9lago]2hora 7.7 2.7%
Moug~otia 3.75 127 3.0% 62%
S:eirog~a 3.9 7.5 .8% 3. 7%
Zygnema 3.75 1.8%
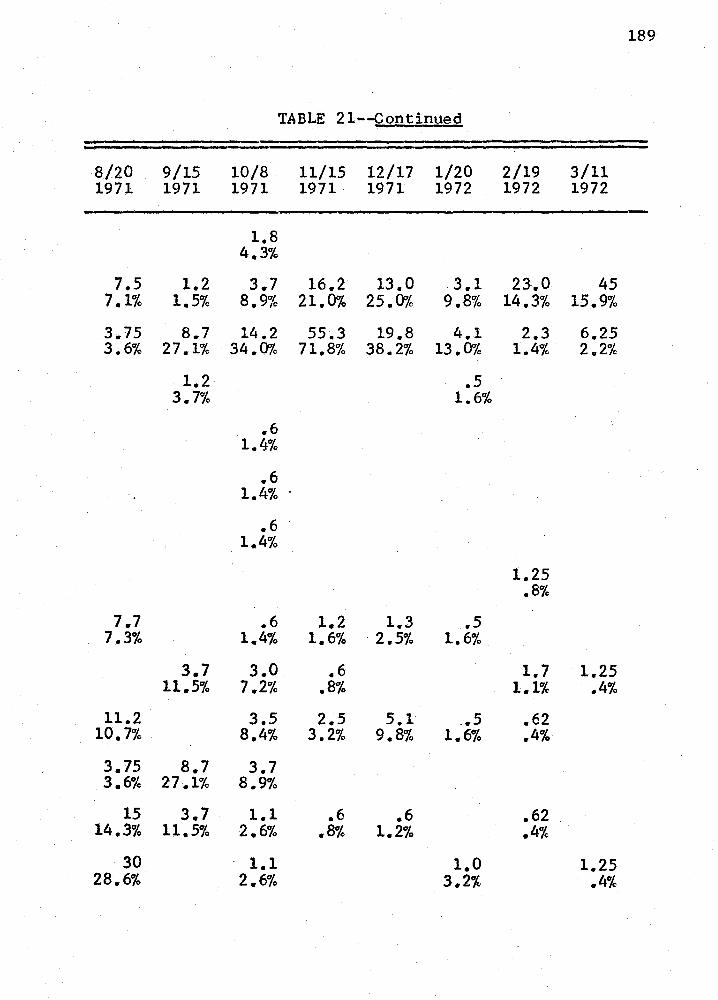
189
TABLE 21--Continued
8/20 9/15 10/8 11/15 12/17 1/20 2/19 3/11 1971 1971 1971 1971 1971 1972 1972 1972
1.8 4.3%
7.5 1.2 3.7 16.2 13.0 3.1 23.0 45 7 .1% 1.5% 8.9% 21.0% 25.0% 9.8% 14.3% 15.9%
3.75 8.7 14.2 55.3 19.8 4.1 2.3 6.25 3.6% 27 .1% 34.0% 71.8% 38.2% 13.0% 1.4% 2.2%
1.2 .5 3.7% 1.6%
.6 1.4%
.6 l.li% ·
.6 . 1.4%
1.25 .8%
7.7 .6 1.2 1.3 .5 7.3% 1.4% 1.6% · 2.5% 1.6%
3.7 3.0 .6 1.7 1.25 11.5% 7.2% .8% 1.1% .4%
11.2 3.5 2.5 5.1 .• 5 .62 10.7% 8.4% 3.2% 9.8% 1.6% .4%
3.75 8.7 3.7 3.6% 27.1% 8.9%
15 3.7 1.1 .6 .6 .62 14.3% 11.5% 2.6% .8% 1.2% .4%
30 1.1 1.0 1.25 28.6% 2.6% 3.2% .4%
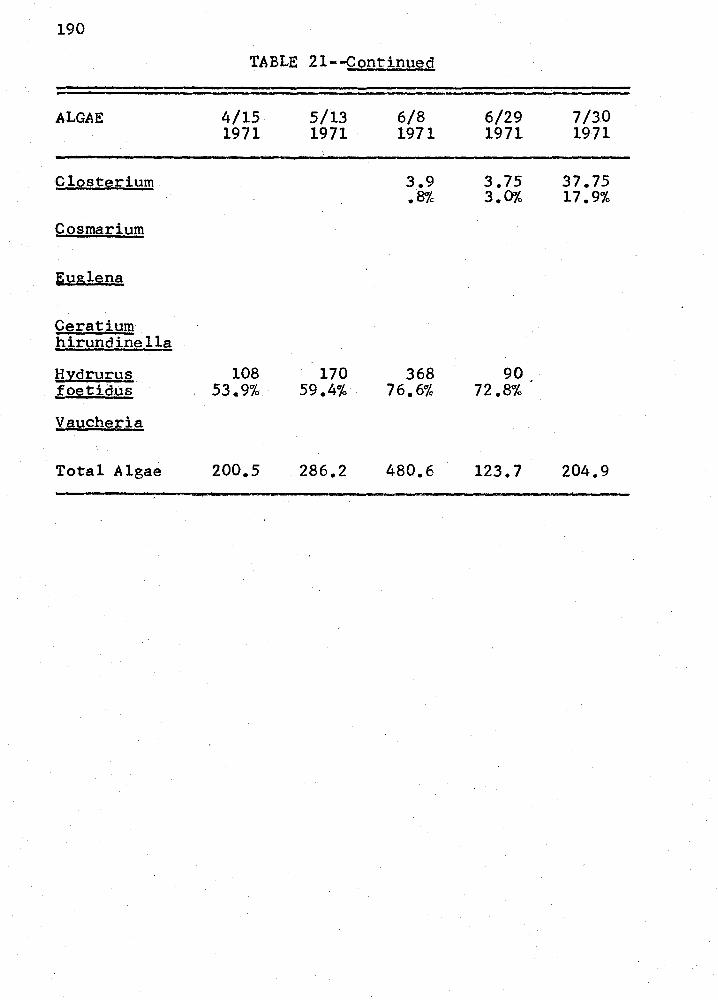
190
TABLE 21--Continued
ALGAE 4/15 5/13 6/8 6/29 7/30 1971 1971 1971 1971 1971
Clost~rium 3.9 3.75 37.75 .8% 3. 0'/4 17.9%
Cosmarium
Euglena
Ceratium hirundinella
!!~druru~ 108 170 368 90 foetidus 53.9% 59.4% 76.6% 72.8%
Vaucheria
Total Algae 200.5 . 286.2 480.6 123.7 204.9
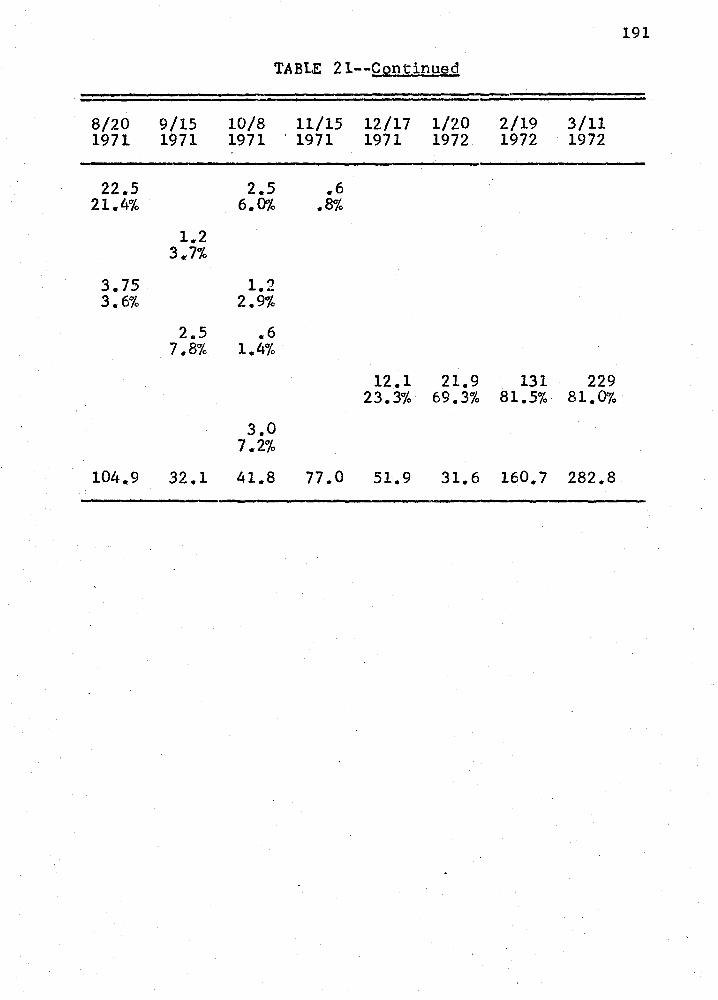
191
TABLE 2 l--9Qntinuep
8/20 9/15 10/8 11/15 12/17 1/20 2/19 3/11 1971 1971 1971 . 1971 1971 1972 1972 1972
22.5 2.5 .. 6 21.4% 6.0% .8%
1.2 3 .. 7%
3.75 l.2 3.6% 2.9%
2.5 .6 7.8% 1.4%
12.1 21.9 131 229 23.3% 69.3% 81.5% 81.0%
3.0 7.2%
104.9 32.1 41.8 77.0 51.9 31.6 160.7 282.8
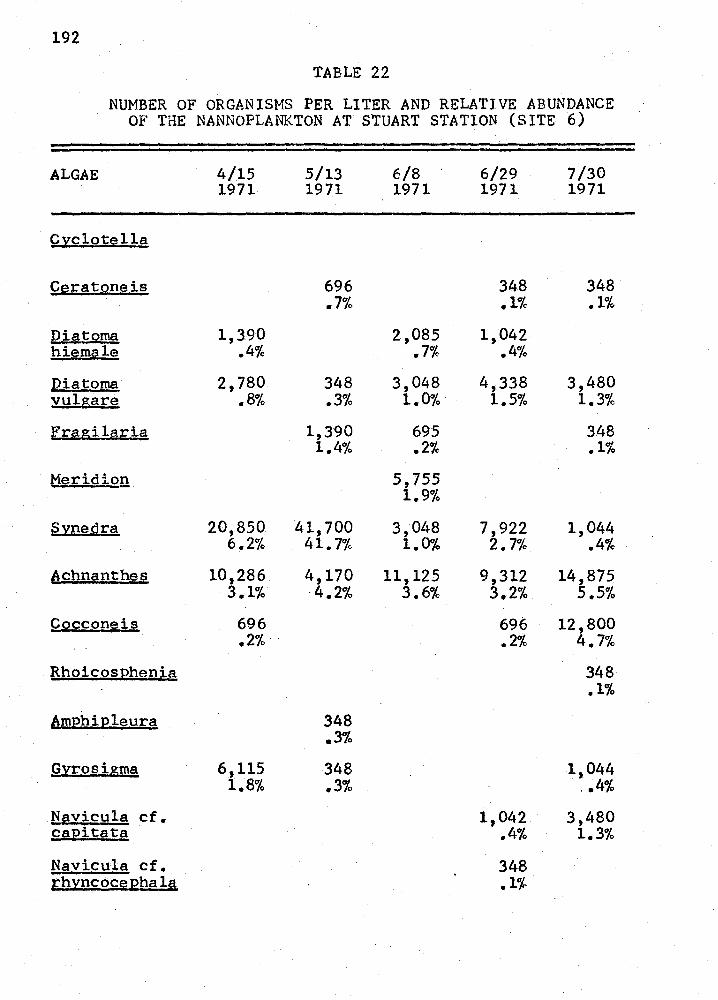
192
TABLE 22
NUMBER OF ORGANISMS PER LITER AND RELATIVE ABUNDANCE OF THE NANNOPLANKTON AT STUART STATION (SITE 6)
ALGAE 4/15 5/13 6/8 6/29 7/30 1971 1971 1971 1971 1971
C)!clotella
Cera tone is 696 348 348 .7% .1% .1%
Diatoma 1,390 2,085 1,042 hiemale .4% .7% .4%
12iatoma 2,780 348 3,048 4,338 3,480 vulgare .8% .3% 1.0% 1.5% 1.3%
Fragilarj..s, 1,390 695 348 1.4% .2% .1%
Meridion 5,755 1.9%
S2negra 20,850 41,700 3,048 7,922 1,044 6.2% 41. 7% 1.0% 2. 7% .4%
Achnanthes 10,286 4,170 11,125 9,312 14,875 3.1% -4.2% 3.6% 3.2% 5.5%
CQcconeis 696 696 12,800 .2% .2% 4.7%
Rhoicos)2heni~ 348 .1%
6mEhi]2leura 348 .3%
G}!rosigma 6,115 348 1,044 1.8% .3% .• 4%
Navicula cf. 1,042 3,480 ca)2itat,a .4% 1.3%
Navicula cf. 348 rhincoce12hal§; .1%
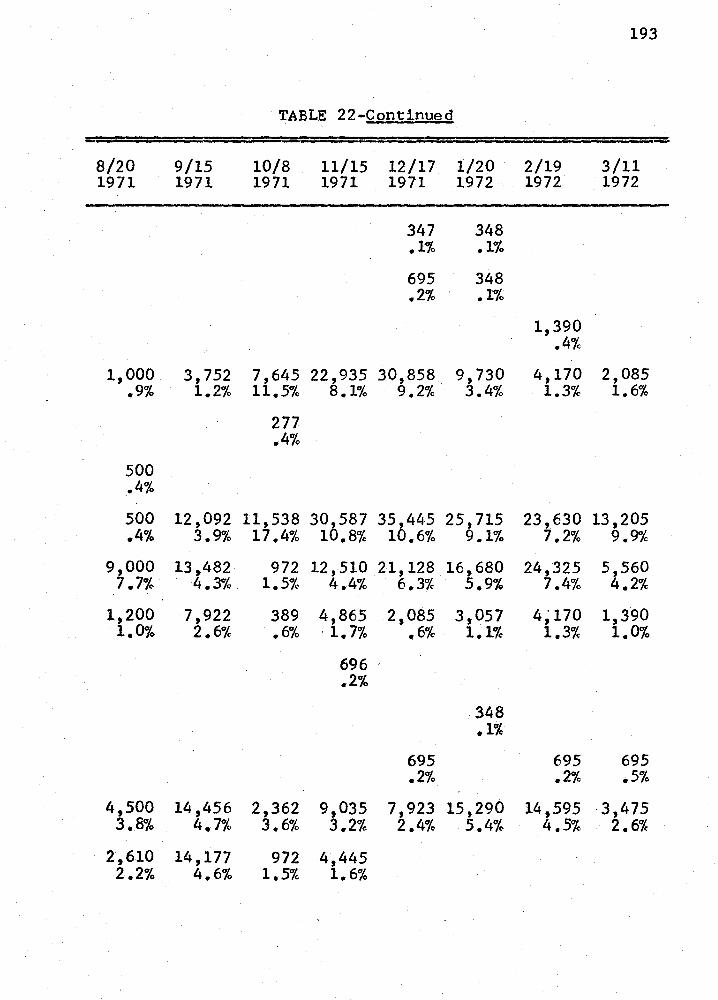
193
TABLE 22-Continued
8/20 9/15 10/8 11/15 12/17 1/20 2/19 3/11 1971 1971 1971 1971 1971 1972 1972 1972
347 348 .1% .1%
695 348 .2% .1%
1,390 .4%
1,000 3,752 7,645 22,935 30,858 9,730 4,170 2,085 .9% 1.2% 11.5% 8.1% 9.2% 3.4% 1.3% 1.6%
277 .4%
500 .4%
500 12,092 11,538 30,587 35,445 25,715 23,630 13,205 .4% 3.9% 17.4% 10.8% 10.6% 9.1% 7.2% 9.9%
9,000 13,482 972 12,510 21,128 16,680 24,325 5,560 7.7% 4.3% 1.5% 4.4% 6.3% 5.9% 7.4% 4.2%
1,200 7,922 389 4,865 2,085 3,057 4~170 1,390 1.0% 2.6% .6% · 1. 7% .6% 1.1% 1.3% 1.0%
696 .2%
348 .1%
695 695 695 .2% .2% .5%
4,500 14,456 2,362 9,035 7,923 15,290 14,595 ·3,475 3.8% 4. 7% 3.6% 3.2% 2.4% 5.4% 4.5% 2.6%
2,610 14,177 972 4,445 2.2% 4.6% 1.5% 1.6%
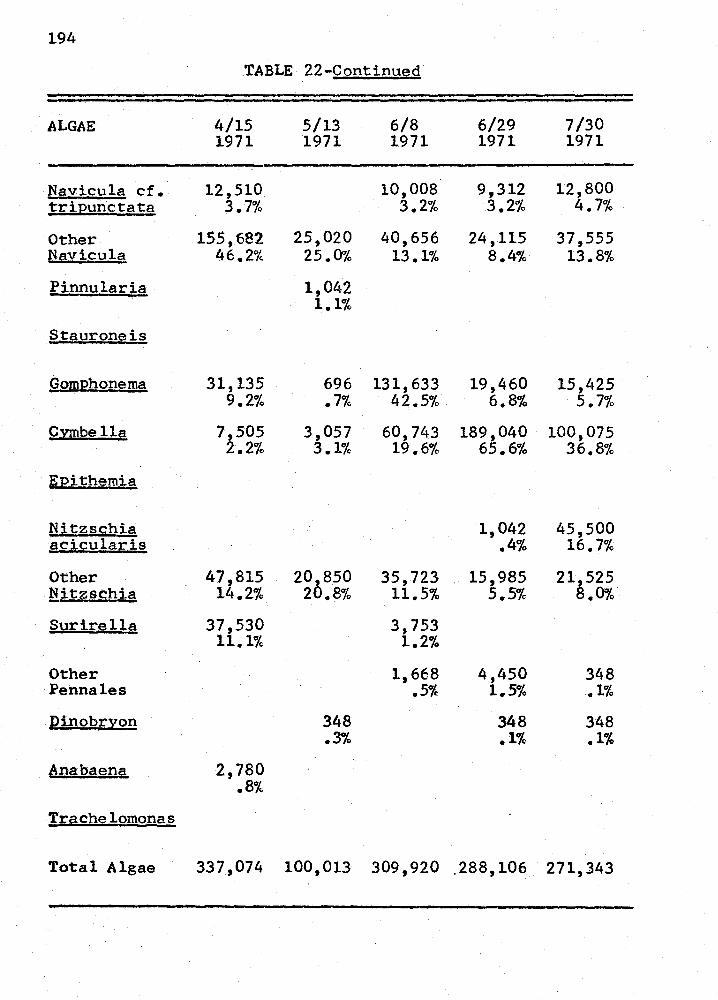
194
TABLE 22-Continued
ALGAE 4/15 5/13 6/8 6/29 7/30 1971 1971 1971 1971 1971
Navicula cf. 12,510 10,008 9,312 12,800 tri12unctata 3. 7% 3.2% 3.2% 4. 7%
Other 155,682 25,020 40,656 24,115 37,555 Navicula 46.2% 25.0% 13.1% 8.4% 13.8%
Pinnularia 1,042 1.1%
Stauroneis
9om12honema 31,135 696 131,633 19,460 15,425 9.2% .7% 42.5% 6.8% 5.7%
Cmbella 7,505 3,057 60,743 189,040 100,075 2.2% 3.1% 19.6% 65.6% 36.8%
Epithemia
Ni.tzschia 1,042 45,500 acicularis .4% 16.7%
Other 47,815 200850 35,723 15,985 21,525 Nitzschia 14.2% 2 .8% 11.5% 5.5% 8.0%
Surirella 37,530 3,753 11.1% 1.2%
Other 1,668 4,450 348 Pennales .5% 1.5% .1%
J2inobr2on 348 348 348 .3% .1% .1%
~nabaena 2,780 .8%
Trachelomonas
Total Algae 337,074 100,013 309,920 .288,106 271,343
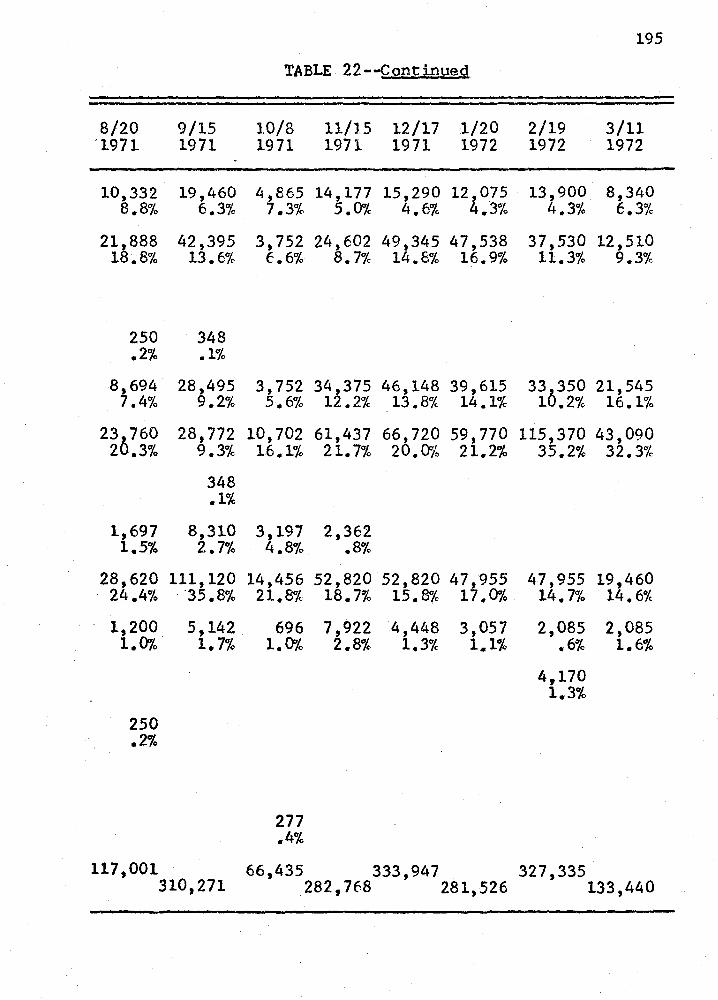
195
TABLE 22--Continued
8/20 9/15 1.0/8 11/15 12/17 1/20 2/19 3/11 '1971 1971 1971 1971 1971 1972 1972 1972
10,332 19,460 4,865 14,177 15,290 12,075 13,900 8,340 8.8% 6.3% 7.3% 5.0% 4.6% 4.3% 4.3% 6.3%
21,888 42,395 3,752 24,602 49,345 47,538 37,530 12,510 18.8% 13.6% 6.6% 8.7% 14.8% 16.9% 11.3% 9.3%
250 348 .2% .1%
8,694 28,495 3,752 34,375 46,148 39,615 33 350 21,545 7. 4% 9. 2% 5. 6% 12 • 2% 13. 8% 14. 1% 10. 2% 16. 1%
23,760 28,772 10,702 61,437 66,720 59,770 115,370 43,090 20.3% 9.3% 16.1% 21.7% 20.(}'/4 21.2% 35.2% 32.3%
348 .1%
1,697 8,310 3,197 2,362 1.5% 2.7% 4.8% .8%
28,620 24.4%
1,200 1.0%
250 .2%
111,120 35.8%
s, 142 1.7%
14,456 21.8%
696 1.0%
277 .4%
52,820 52,820 47,955 18.7% 15.8% 17.0%
7,922 4,448 3,057 2.8% 1.3% 1.1%
47,955 19,460 14. 7% 14.6%
2,085 2,085 .6% 1.6%
4,170 1.3%
117,001 66,435 333,947 327,335 310,271 _282,768 281,526 133,440
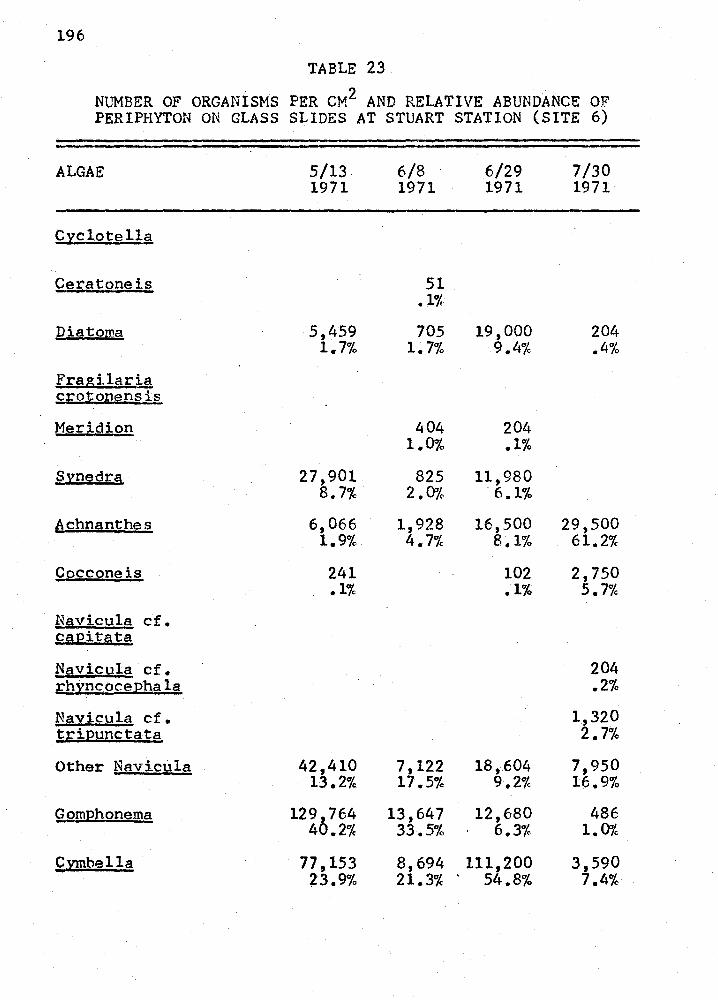
196
'!'ABLE 23
NUMBER OF ORGANISMS PER CM2 AND RELATIVE ABUNDANCE OF PERIPHYTON ON GLASS SLIDES AT STUART STATION (SITE 6)
ALGAE 5/13 6/8 6/29 7/30 1971 1971 1971 1971
Cyclotella
Cera tone is 51 . • 1%
Diatoma 5,459 705 19,000 204 1.7% 1~7% 9.4% .4%
Fragilari_g £_rotonensis
Meridion 404 204 1.0% .1%
Sl!nedra 27,901 825 11,980 8.7% 2.0% 6.1%
Achnanthes 6,066 1,928 16,500 29,500 1.9% 4.7% 8.1% 61.2%
Ci2cconeis 241 102 2,750 .1% .1% 5.7%
Navicula cf. capitata
Nc1vicu.la cf. 204 rhyncoce]2hala .2%
Navicula cf. 1,320 ~ripunctata 2.7%
Other Navicula 42,410 7,122 18,604 7,950 13.2% 17.5% 9.2% 16.9%
Gornphonema 129 0764 13,647 12,680 486 4 .2% 33.5% 6.3% 1.0%
Cmbella 77,153 8,694 111,200 3,590 23.9% 21.3% 54.8% 7.4%
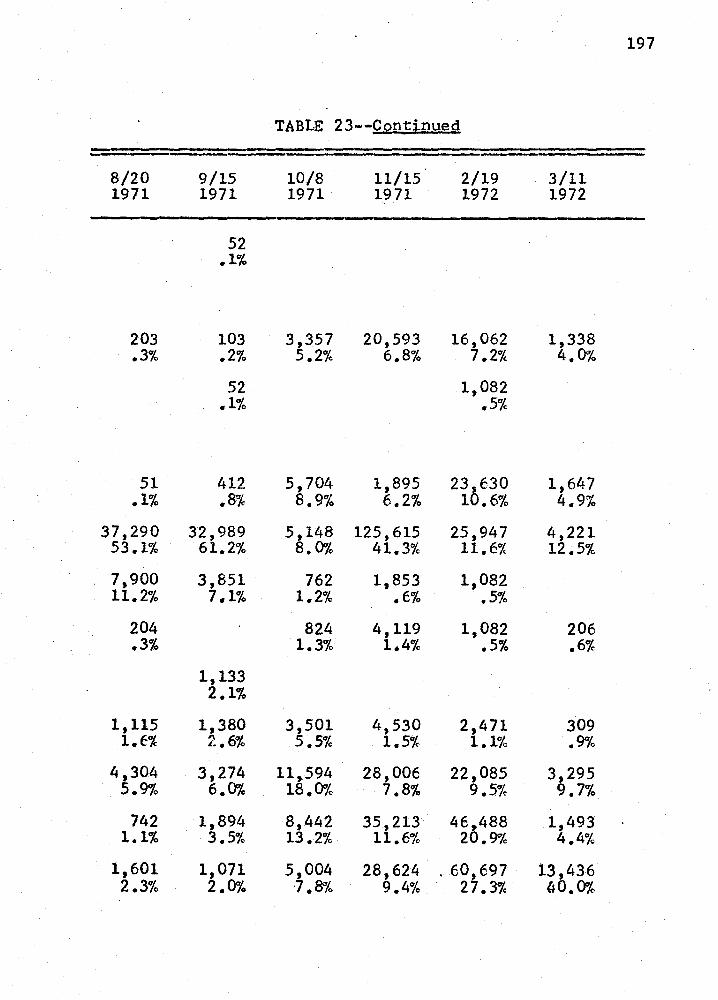
8/20 1971
203 .3%
51 .1%
37,290 53.1%
7,900 11.2%
204 .3%
1,115 1.6%
4,304 5.9%
742 1.1%
1,601 2.3%
9/15 1971
52 .1%
103 .2%
52 .1%
412 .8%
32,989 61.2%
3,851 7.1%
1,133 2.1%
1,380 2.6%
3,274 6.0%
1,894 3.5%
1,071 2.0%
TABLE 23--Contirtued
10/8 1971
11/15· 1971
2/19 1972
3,357 20,593 16,062 5.2% 6.8% 7.2%
5,704 1,895 8.9% 6.2%
5,148 125,615 8. 0% 41.3%
762 1,853 1.2% .6%
824 4,119 1.3% 1.4%
3,501 4,530 5.5% 1.5%
11,594 28,006 18.0% 7.8%
8,442 35,213 13.2% 11.6%
5,004 28,624 -7. 8°'/4 9.4%
1,082 .5%
23,630 10.6%
25,947 ll.E%
1,082 .5%
1,082 .5%
2,471 1.1%
22,085 9.5%
46,488 20.9%
. 60,697 27.3%
3/11 1972
1,338 4.0%
1,647 4.9%
4,221 12.5%
206 .6%
309 .9%
3,295 9.7%
1,493 4.4%
13,436 {J0.0%
197
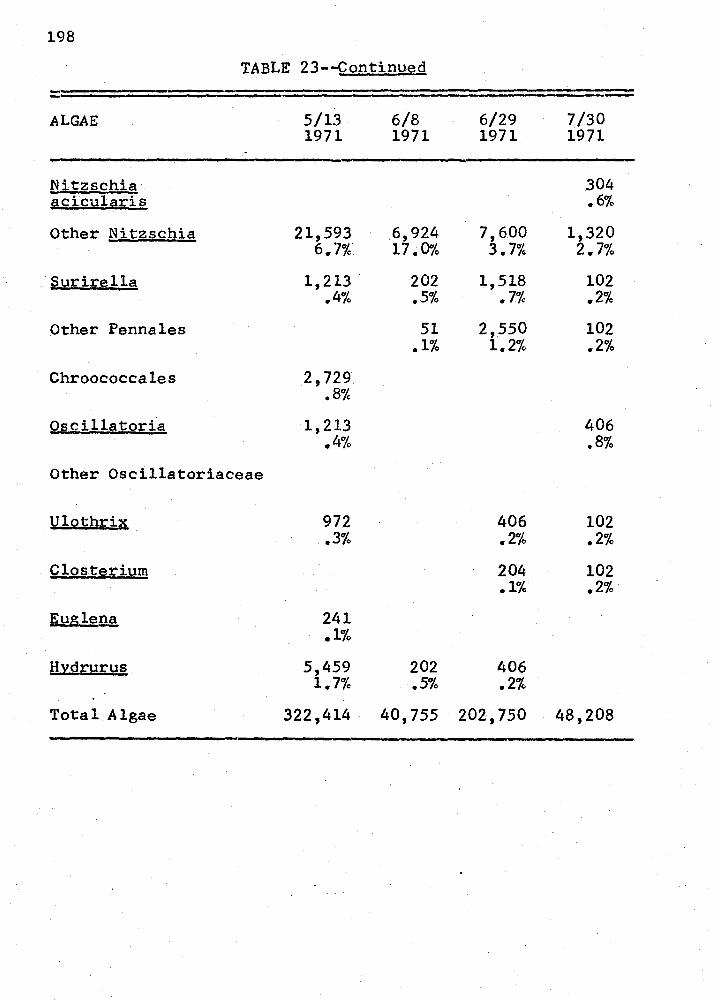
198
TABLE 23--Continued
ALGAE 5/13 6/8 6/29 7/30 1971 1971 1971 1971
Nitzschia 304 acicµl 2ris .6%
Other Nitzschia 21,593 6,924 7,600 1,320 6.7% 17.0% 3.7% 2. 7%
Surirella 1,213 202 1,518 102 .4% .5% • 7% .2%
Other Pennales 51 2,550 102 .1% 1.2% .2%
Chroococcales 2,729 .8%
Oscillatori'a 1,213 406 .4% .8%
Other Oscillatoriaceae
tJlothrix 972 406 102 .3% .2% .2%
Closteriurn 204 102 .1% .2%
Euglena 241 .1%
Hydrurus 5,459 202 406 1.7% .5% .2%
Total Algae 322,414 40,755 202,750 48,208
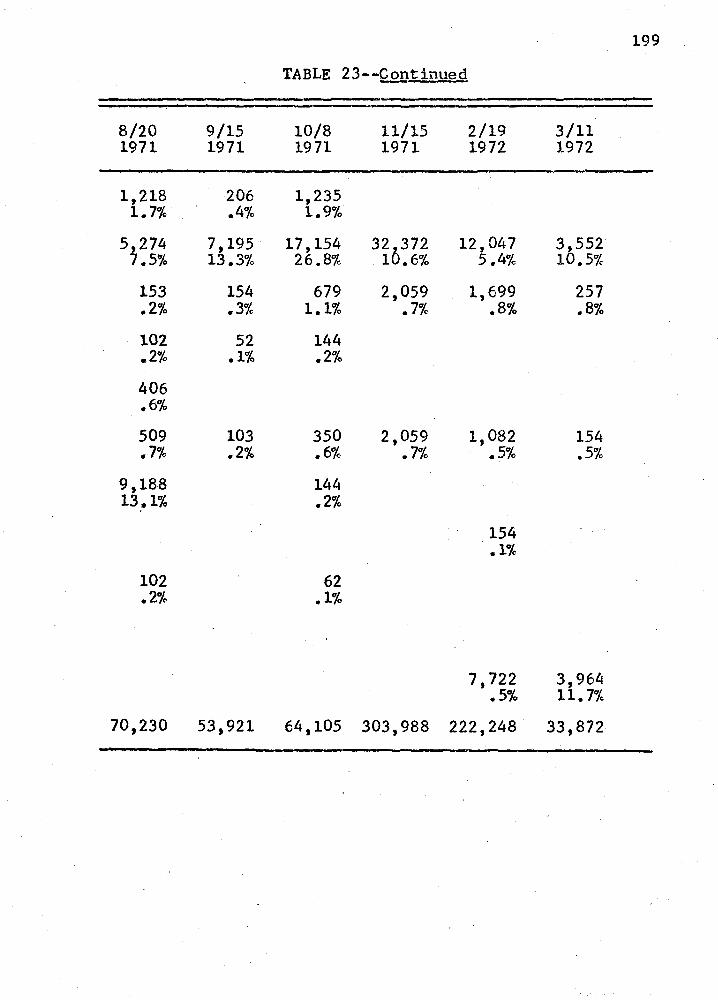
8/20 9/15 1971 1971
1,218 206 1.7% .4%
5,274 7,195 7.5% 13.3%
153 154 .2% .3%
102 52 .2% .1%
406 .6%
509 103 .7% .2%
9,188 13.1%
102 .2%
TABLE 23--Q.Qntinued
10/8 1971
1,235 1.9%
17,154 26.8%
679 1.1%
144 .2%
350 .6%
144 .2%
62 .1%
11/15 1971
320372 1 .6%
2,059 • 7%
2,059 .7%
2/19 1972
12,047 5 .4%
1,699 .8%
1,082 .5%
154 .1%
7,722 .5%
3/11 1972
3,552 10.5%
257 .8%
154 .5%
3,964 11.7%
70,230 53,921 64,105 303,988 222,248 33,872
199
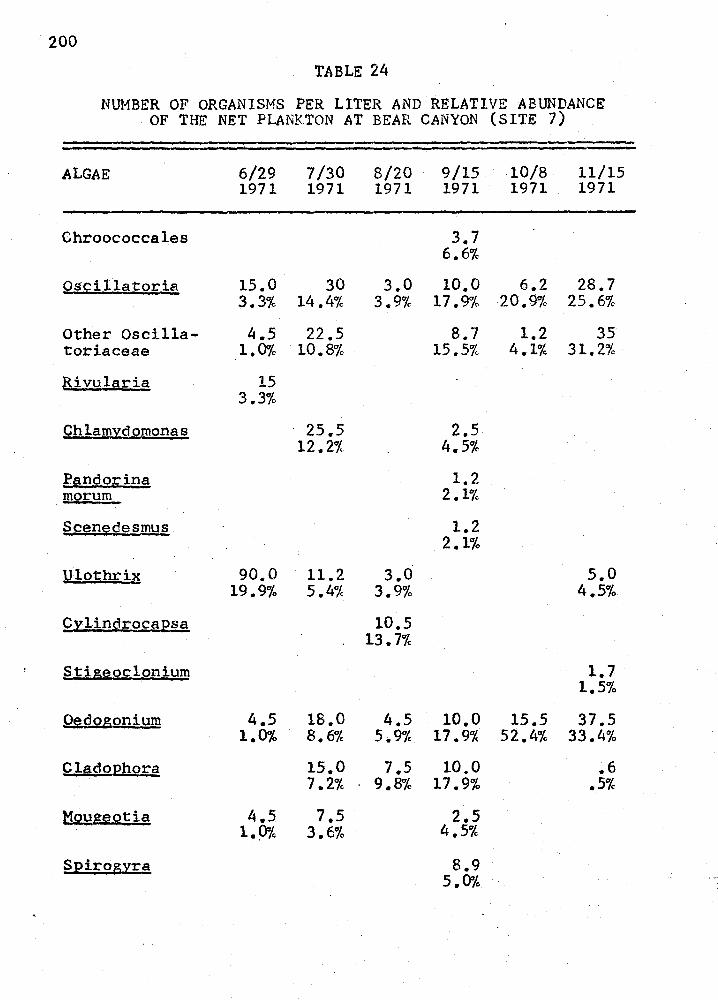
200 TABLE 24
NUMBER OF ORGANISMS PER LITER AND RELATIVE ABUNDANCE OF THE NET PLANKTON AT BEAR CANYON (SITE 7)
ALGAE 6/29 7/30 8/20 9/15 10/8 11/15 1971 1971 1971 1971 1971 1971
Chroococcales 3.7 6.6%
Oscillatoria 15.0 30 3.0 10.0 6.2 28.7 3.3% 14.4% 3.9% 17.9% 20.9% 25.6%
Other Oscilla- 4.5 22.5 8.7 1.2 35 toriaceae 1.0% 10.8% 15.5% 4.1% 31.2%
Bivularia 15 3.3%
Ch lamid ornona s 25.5 2.5 12.2% 4.5%
Pandorina 1.2 morurn 2.1%
Scen~desmus 1.2 2.1%
Ulothrix 90.0 11.2 3.0 5.0 19.9% 5.4% 3.9% 4.5%
CI:lindro£aEsa 10.5 13. 7%
~tig~oclonium 1.7 1.5%
~dQgonium 4.5 18.0 4.5 10.0 15.5 37.5 1.0% 8.6% 5.9% 17.9% 52.4% 33.4%
C lttdoEhora 15.0 7.5 10.0 ~6 7.2% 9.8% 17.9% .5%
ttoug~otia 4.5 7.5 2.5 1. 0'/4 3.6% 4.5%
SEirogl'.'.ra 8.9 5.0%
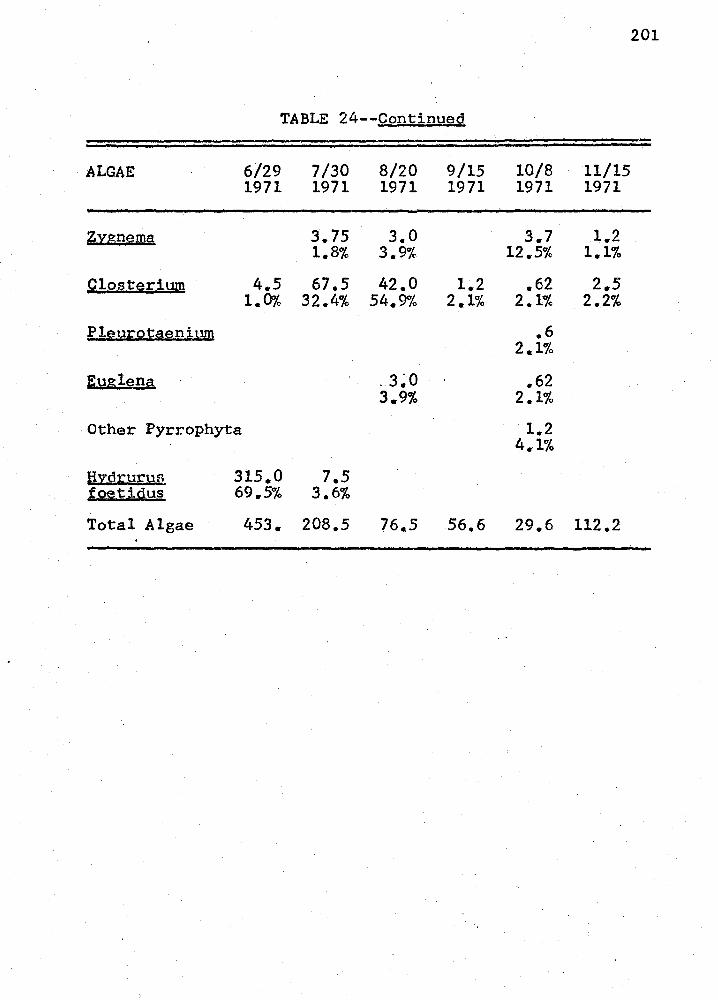
201
TABLE 24--Continued
ALGAE 6/29 7/30 8/20 9/15 10/8 11/15 1971 1971 1971 1971 1971 1971
~2:a;n~ma 3.75 3.0 3.7 1 .. 2 1.8% 3.9% 12.5% 1.1%
plo§t~riYm 4.5 67.5 42.0 1.2 .62 2.5 1.0% 32.4% 54.9% 2.1% 2.1% 2.2%
Pley~Ot'1~nium .6 2.1%
ll:!J&len5! . 3~0 .62 3.9% 2.1%
Other Pyrrophyta 1.2 4.1%
li:Yg.:u~yn 315.0 7.5 toetidus 69.5% 3.6%
Total Algae 453. 208.5 76.5 56.6 29.6 112.2
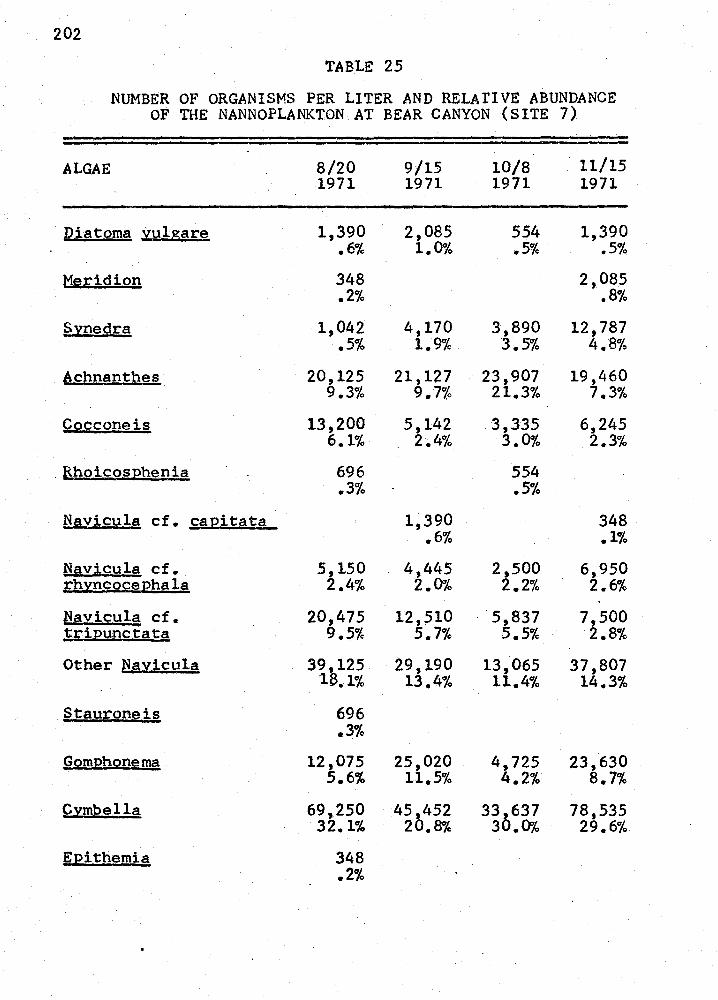
202
TABLE 25
NUMBER OF ORGANISMS PER LITER AND RELATIVE ABUNDANCE OF THE NANNOPLANKTON AT BEAR CANYON (SITE 7)
ALGAE 8/20 9/15 10/8 11/15 1971 1971 1971 1971
~iatQma vylgare 1,390 2,085 554 1,390 .6% 1.0% .5% .5%
t!~;&;:idion 348 2,085 .2% .8%
Synedra 1,042 4,170 3,890 12,787 .5% 1. 9°'/4 3.5% 4.8%
6.£.hnanthes · 20,125 21,127 23,907 19,460 9.3% 9.7% 21.3% 7.3%
CQCCOneis 13,200 5,142 3,335 6,245 6.1% 2.4% 3.0% 2.3%
. B,hoicosehenia 696 554 .3% .5%
Navicula cf. .sapitata 1,390 348 .6% .1%
Navicula cf. 5,150 4,445 2,500 6,950 rhyncoceehala 2.4% 2.0% 2.2% 2.6%
N§vicula cf. 20,475 12,510 · . 5,837 7,500 trieunctata 9.5% 5.7% 5.5% 2.8% Other Navicula 39,125 29,190 13,065 37,807
18 •. 1% 13.4% 11.4% 14.3%
Stauroneis 696 .3%
~omehone ma 12,075 25,020 4,725 23,630 5.6% 11.5% 4.2% 8.7%
C;nubella 69,250 45,452 330637 78,535 32.1% 20.8% 3 .0% 29.6%
EEithemia 348 .2%
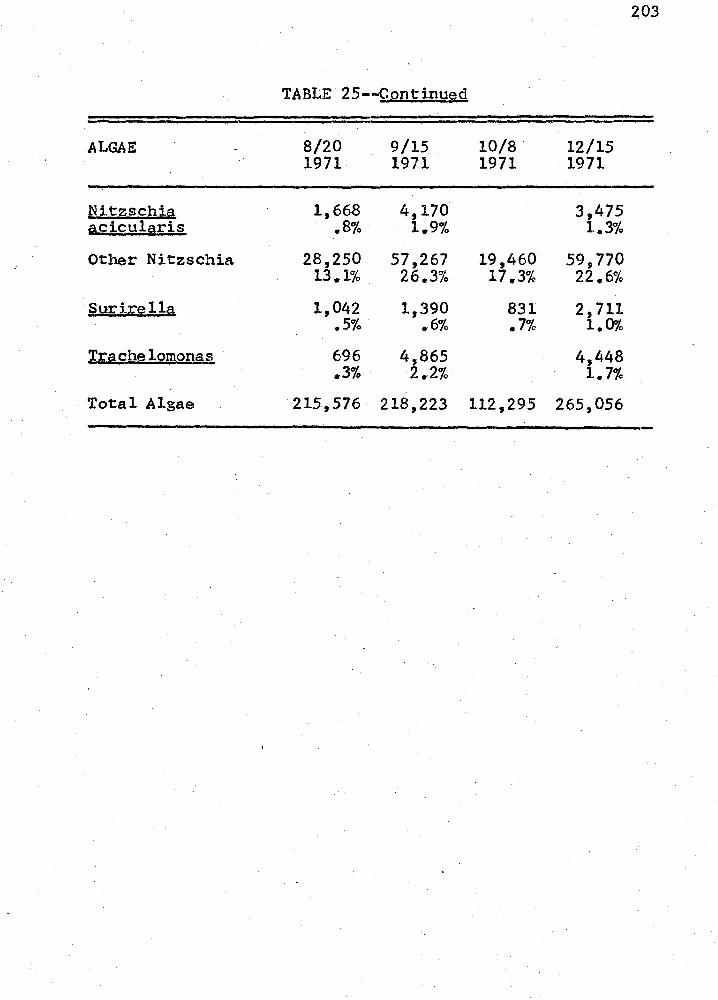
203
TABLE 25--C on t inued
ALGAE 8/20 9/15 10/8. 12/15 1971 1971 1971 . 1971
fH.tzschis;1, 1,668 4,170 3,475 acicularis .8% 1.9% 1.3%
Other Nitzschia 28,250 57,267 19,460 59,770 13.1% 26.3% 17.3% 22.6%
Suri.:e lla 1,042 1,390 831 2,711 .5% .6% .7% 1.0%
T;g;:~che lomona~ 696 4,865 4,448 .3% 2.2% 1.7%
Total Algae 215,576 218,223 112,295 265,056
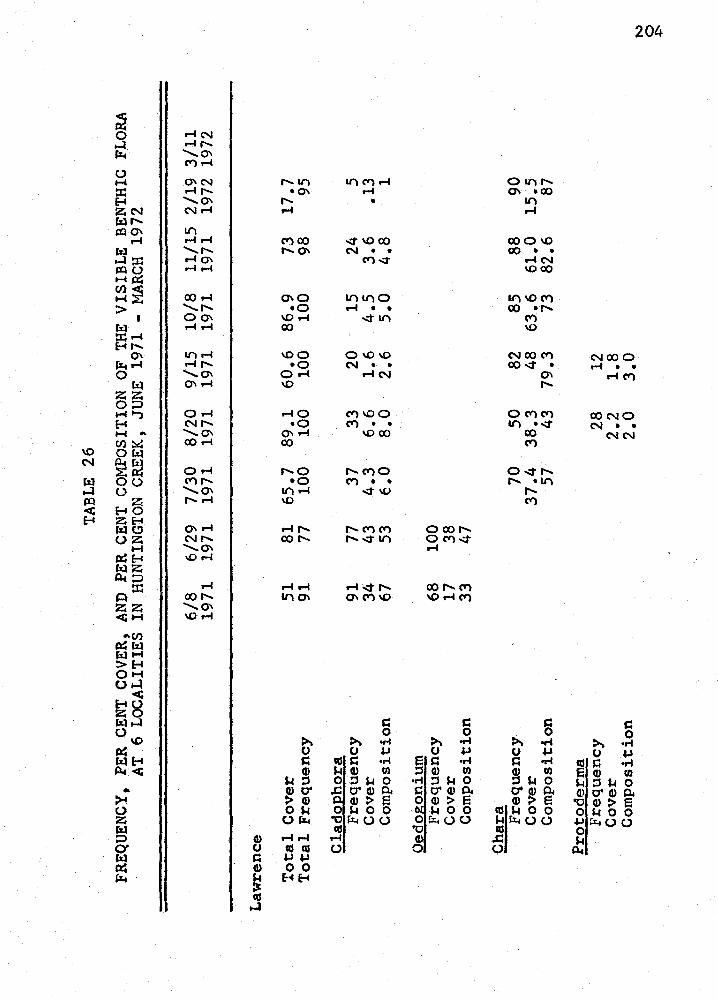
TAB
LE 26
FREQ
UEN
CY
, PER
CEN
T CO
VER
, AN
D PE
R C
ENT C
OM
POSI
TIO
N OF
THE
VIS
IBLE
BEN
THIC
FLO
RA
A
T 6
LOC
ALI
TIES
IN H
UN
TIN
GTO
N
CR
EEK
, JU
NE
1971
-M
AR
CH
1972
6/8
6/29
7/
30
8/20
9/
15
10/8
11
/15
2/19
3/
11
1971
19
71
1971
19
71
1971
19
71
1971
19
72 1
972
Law
renc
e
Tota
l C
over
51
81
65
.7
89.1
60
.6
86.9
73
17
.7
Tota
l Fr
eque
ncy
91
77
100
100
100
100
98
95
Cla
doph
ora
Freq
uenc
y 91
77
37
33
20
15
24
5
Cov
er
34
43
4.3
6.6
1.6
4.5
3.6
.13
Com
posi
tion
67
53
6.0
8.0
2.6
s.o
4.8
1
Oed
ogon
ium
J?
requ
ency
68
10
0 C
over
17
38
C
ompo
sitio
n 33
47
Cha
u Freq
uenc
y 70
50
82
85
88
90
C
over
37
.4
38.3
48
63
.6
61.0
15
.5
Com
posi
tion
57
43
79.3
73
82
.6
87
Prot
oder
ma
Freq
uenc
y 28
12
C
over
2.
2 1.
8 C
ompo
sitio
n 2.
0 3.
0 N
0
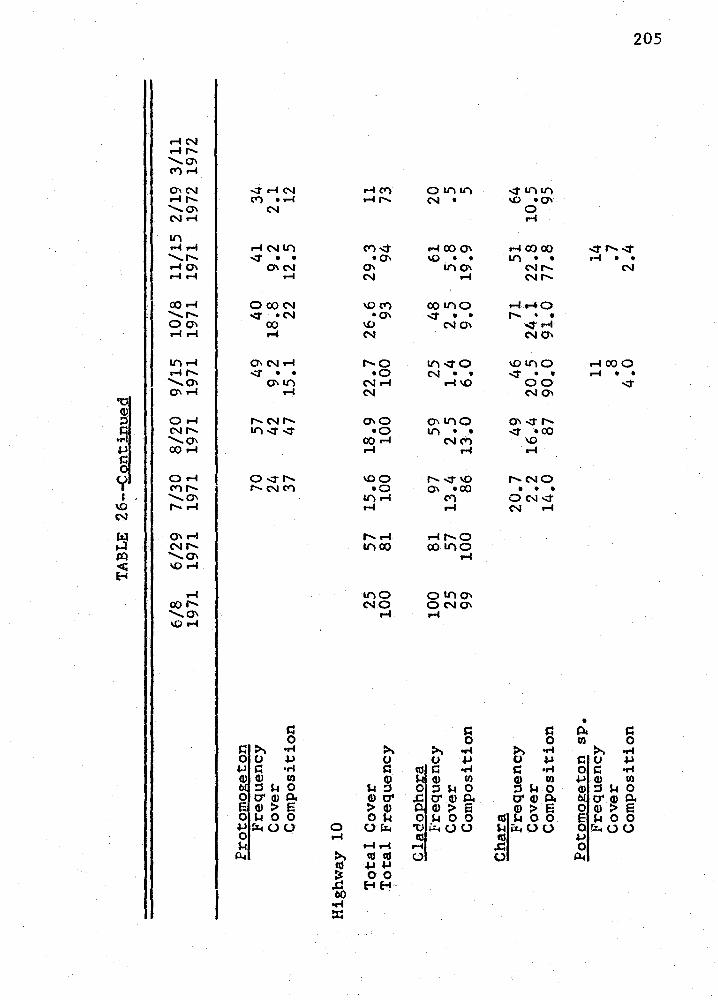
TAB
LE 26
--C
ontin
ued
6/8
6/29
7/
30
8/20
9/
15
10/8
11
/15
2/19
3/
11
1971
19
71
1971
19
71
1971
19
71
1971
19
72 1
972
?rot
otno
geto
n Fr
eque
ncy
70
57
49
40
41
34
Cov
er
24
42
9.2
18.8
9.
2 2.
1 C
ompo
sitio
n 37
47
15
.1
22
12 .5
12
Hig
hway
10
Tota
l C
over
25
57
15
.6
18.9
22
.7
26.6
29
.3
11
1'ot
al
Freq
uenc
y 10
0 81
10
0 10
0 10
0 93
94
73
Cl,s
idop
ho1;
;a
Freq
uenc
y 10
0 81
97
59
25
48
61
20
C
over
25
57
13
.4
2.5
1.4
2.5
5.8
.5
Com
posi
tion
99
100
86
13.0
6.
0 9.
0 19
.9
5
Cha
ra
F're
quen
cy
20.7
49
46
71
51
64
C
over
2.
2 16
.4
20.5
24
.l 22
.8
10.5
C
ompo
sitio
n 14
.0
87
90.0
91
.0
77.8
95
Poto
mog
eton
sp
. Fr
eque
ncy
11
14
Cov
er
.8
.7
Com
posi
tion
4.0
2.4
N 0 V'I
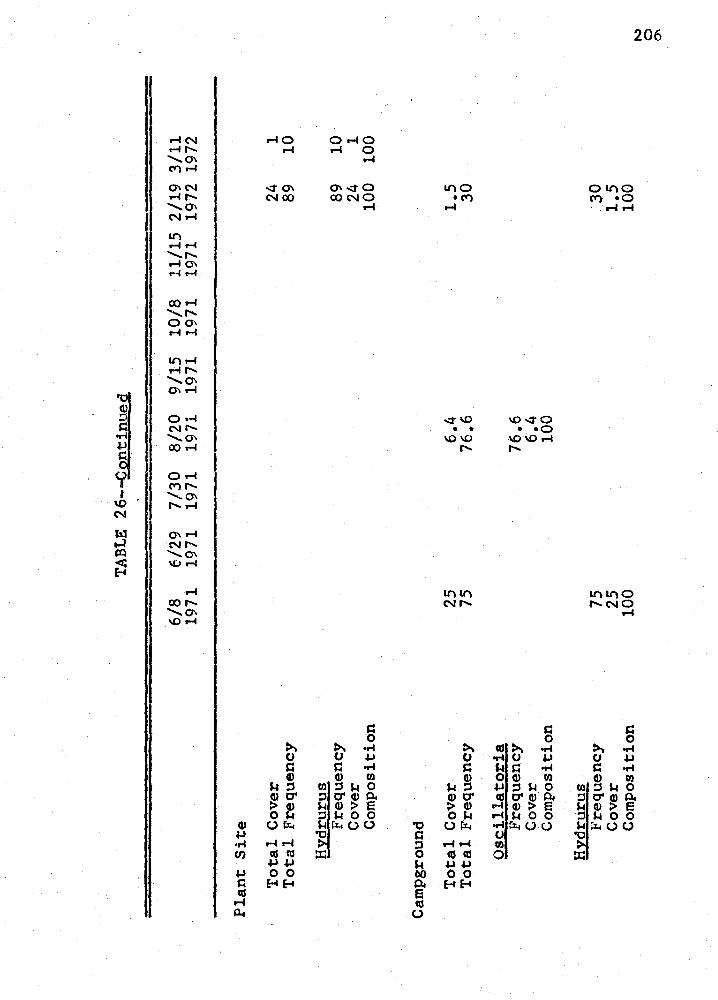
TAB
LE 26
--C
ontin
µeg
-6/
8 6/
29
7/30
8/
20
9/15
10
/8
11/1
5 2/
19
3/11
19
71
1971
19
71
1971
19
71
1971
19
71
1972
19
72
Plan
t Si
te
Tota
l C
over
24
1
Tota
l Fr
eque
ncy
89
10
!Jyd
ruru
s Fr
eque
ncy
89
10
Cov
er
24
1 C
ompo
sitio
n 10
0 10
0
Cam
pgro
und
Tota
l C
over
25
6.
4 1.
5 To
tal
Freq
uenc
y 75
76
.6
30
Qsc
illat
oria
Fr
eque
ncy
76.6
C
over
6.
4 C
ompo
sitio
n 10
0
Hyd
ruru
s Fr
eque
ncy
75
.-30
Cov
er
25
1.5
Com
posi
tion
100
100
N 0 °'
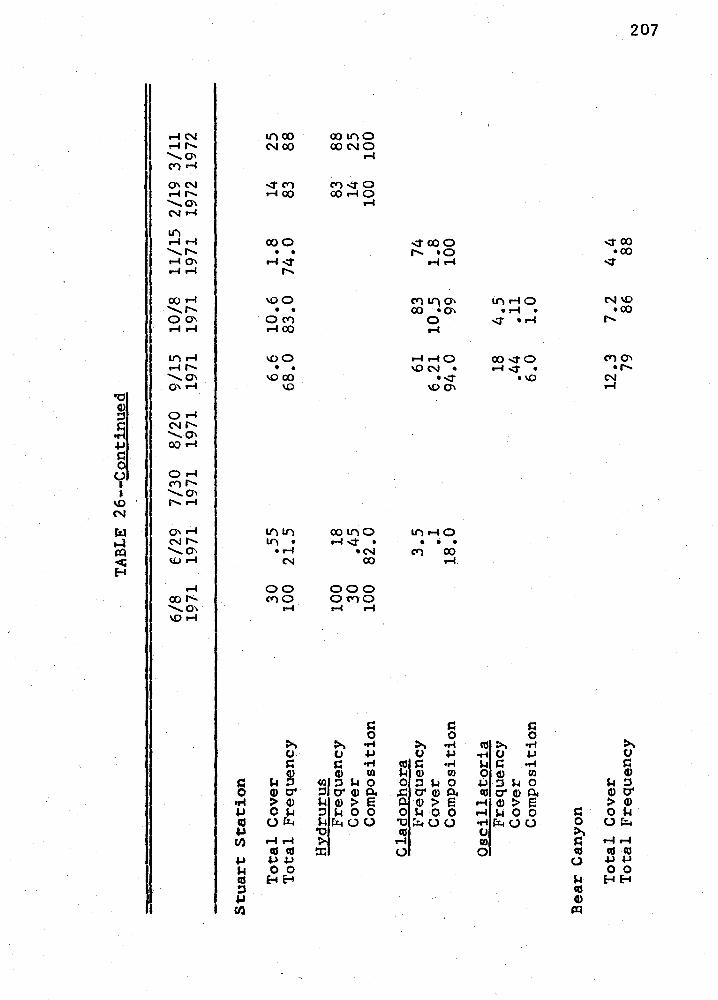
TAB
LE 26
--C
Qnt
inu~
d
-6/
8 6/
29
7/30
8/
20
9/15
10
/8
11/1
5 2/
19
3/11
19
71
1971
19
71
1971
19
71
1971
19
71
1972
197
2
Stua
rt St
atio
n
Tota
l C
over
30
.5
5 6.
6 10
.6
1.8
14
25
Tota
l Fr
eque
ncy
100
21.5
68
.0
83.0
74
.0
83
88
Hxd
rurY
! Fr
eque
ncy
100
18
83
88
Cov
er
30
.45
14
25
Com
posi
tion
100
82.0
10
0 10
0
C la
doph
or!!
Fr
eque
ncy
3.5
61
83
74
Cov
er
.1
. 6.2
1 10
.5
1.8
Com
posi
tion
~8.0
94
.0
99 ·
10
0
Osc
illat
oria
Fr
eque
ncy
18
4.5
Cov
er
.44
.11
Com
posi
tion
6.0
1.0
Bea
r C
anyo
n
Tota
l C
over
12
.3
7.2
4.4
Tota
l Fr
eque
ncy
79
86
88
N 0 .....
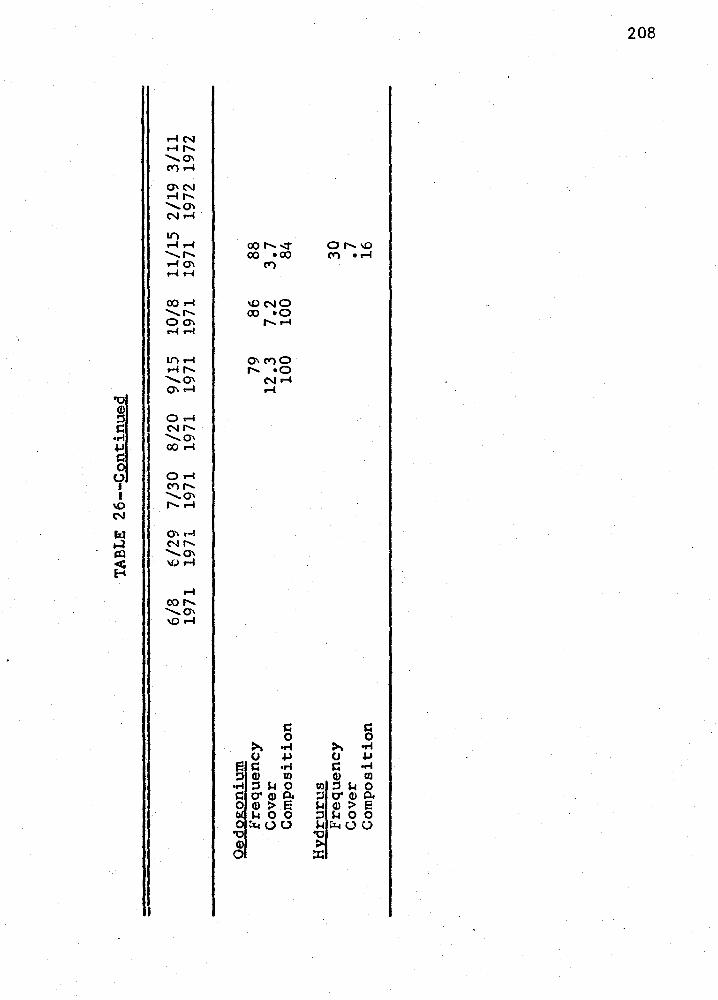
Qed
ogon
ium
Fr
eque
ncy
Cov
er
Com
posi
tion
Hyd
ruru
s Fr
eque
ncy
Cov
er
Com
posi
tion
TABL
E 26
--C
ontin
ued
6/8
6/29
7/
30
8/20
9/
15
10/8
11
/15
2/19
3/
11
1971
19
71
1971
19
71
1971
19
71
1971
19
72
1972
79
86
88
12.3
7.
2 3.
7 10
0 10
0 84
30
.7
16
N 0 CX>
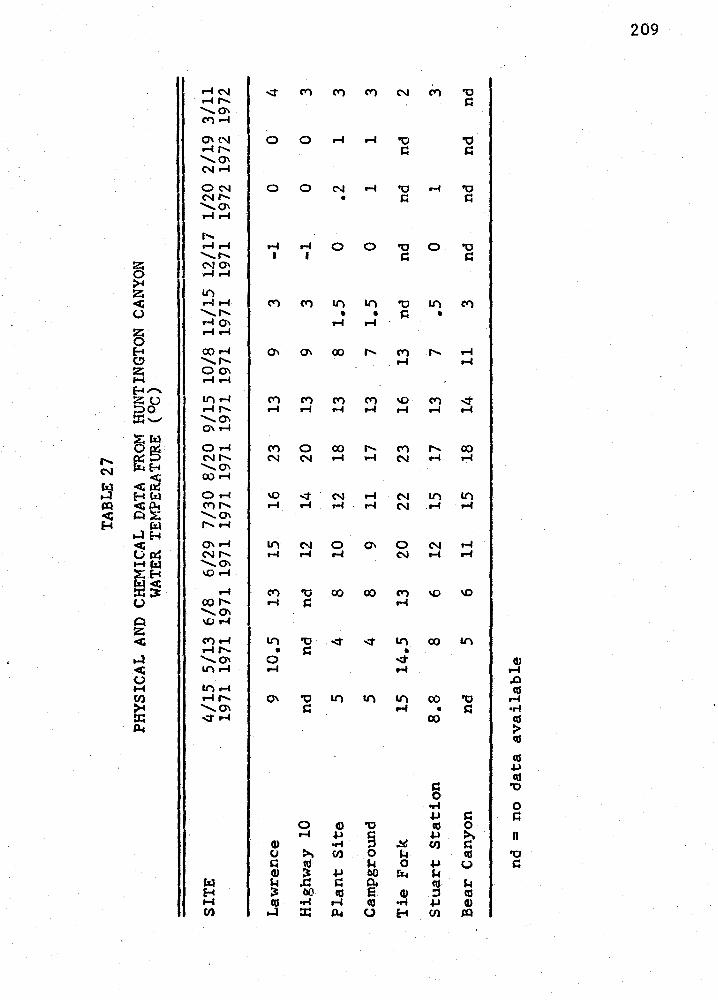
TAB
LE 27
PHY
SIC
AL A
ND
CH
EMIC
AL D
ATA
FRO
M HU
NTI
NG
TON
C
AN
YO
N
WA
TER
TEM
PER
ATU
RE (0
c)
SITE
4/
15
5/13
6/
8 6/
29
7/30
8/
20
9/15
10
/8
11/1
5 12
/17
1/20
2/
19
3/11
19
71
1971
197
1 19
71 1
971
1971
197
1 19
71 1
971
1971
19
72 1
972
1972
Law
renc
e 9
10.5
13
15
16
23
13
9
3 -1
0
0 4
Hig
hway
10
nd
nd
nd
12
14
20
13
9
3 -1
0
0 3
Plan
t Si
te
5 4
8 10
12
18
13
8
1.5
0 .2
l
3 C
ampg
roun
d 5
4 8
9 11
17
13
7
1.5
0 1
1 3
Tie
Fork
15
14
.5
13
20
22
23
16
13
nd
nd
nd
nd
-2
Stua
rt St
atio
n 8.
8 8
6 12
15
17
13
7
.5
0 1
3·
Bea
r C
anyo
n nd
5
6 11
15
18
14
11
3
nd
nd
nd
nd
nd =
no
data
av
aila
ble
I'-) 0 "'
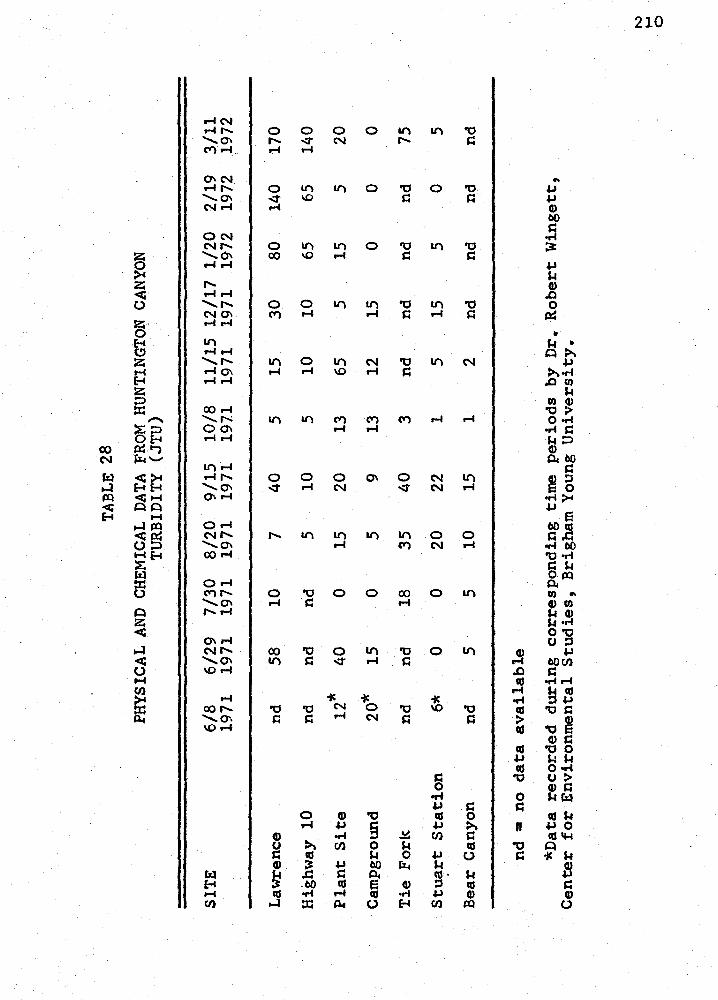
TAB
LE 28
PHY
SIC
AL A
ND
CH
EMIC
AL D
ATA
FRO
M H
UN
TIN
GTO
N
CA
NY
ON
TU
RB
IDIT
Y (J
TU)
SITE
6/
8 6/
29
7/30
8/
20
9/15
10
/8
11/1
5 12
/17
1/20
2/
19
1971
19
71
1971
19
71
1971
19
7-1
1971
19
71
1972
19
72
Law
renc
e nd
58
10
7
40
5 15
30
80
14
0
Hig
hway
10
nd
nd
nd
5
10
5 10
10
65
65
Plan
t Si
te
12*
40
0 15
20
13
65
5
15
5
Cam
pgro
und
20*
15
.o
5 9
13
12
15
0 0
Tie
Forlc
nd
nd
18
35
40
3
nd
nd
nd
nd
Stua
rt St
atio
n 6*
0
0 20
22
l
5 15
5
0
Bea
r C
anyo
n nd
5
5 10
15
1
2 nd
nd
nd
nd =
no
data
av
aila
ble
*Dat
a re
cord
ed
durin
g co
rres
pond
ing
time
perio
ds
by D
r. R
ober
t W
inge
tt,
Cen
ter
for
Envi
ronm
enta
l St
udie
s, B
righa
m
You
ng U
nive
rsity
.
3/11
19
72
, 170
140 20 0 75 5 nd
N) ,..
. 0
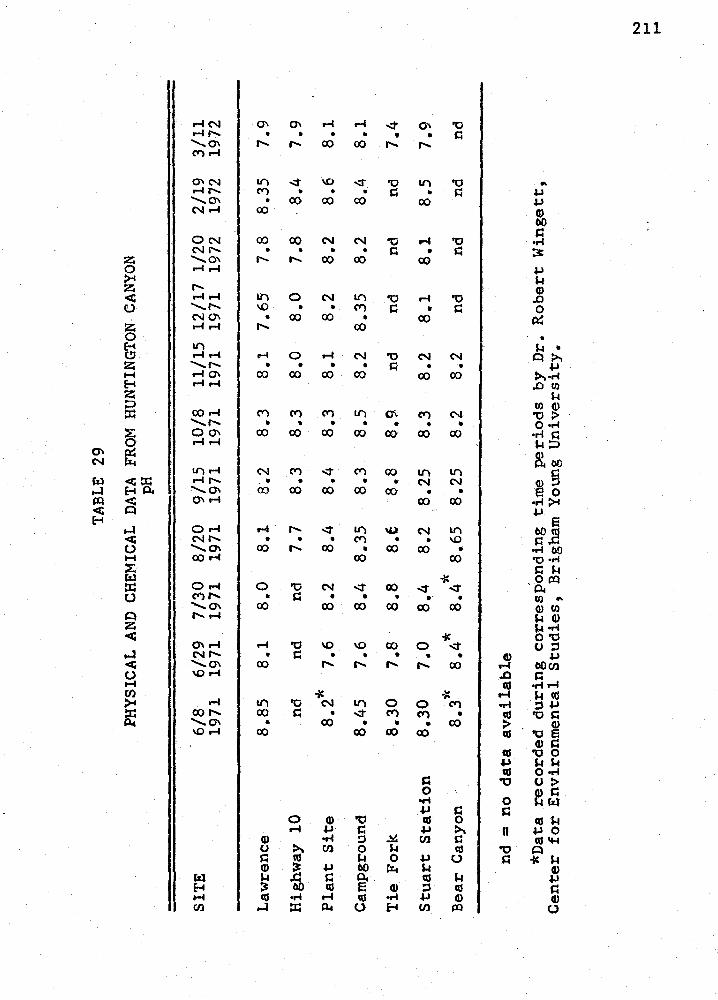
TABL
E 29
PHY
SIC
AL A
ND
CHEM
ICA
L DA
TA FR
OM
HU
NTI
NG
TON
-CA
NY
ON
pH
SITE
6/
8 6/
29
7/30
8/
20
9/15
10
/8
11/1
5 12
/17
1/20
2/
19
1971
19
71
1971
19
71
1971
19
71
1971
19
71
1972
19
72
Law
renc
e 8.
85
8.1
8.0
8.1
8.2
8.3
8.1
7.65
7.
8 8.
35
Hig
hway
10
nd
nd
nd
7.
7 8.
3 8.
3 8.
0 8.
0 7.
8 8.
4
Plan
t Si
te
s.2*
7.6
8.2
8.4
8.4
8.3
8.1
8.2
8.2
8.6
Cam
pgro
und
8.45
7.
6 8.
4 8.
35
8.3
8.5
8.2
8.35
8.
2 8.
4
Tie
Fork
. 8.
30
7 .a
· 8.
8 8.
f 8.
8 8.
9 nd
nd
nd
nd
Stua
rt St
atio
n 8.
30
7.0
8~4
8.2
8.25
8.
3 8.
2 8.
1 8.
1 8.
5
Bea
r C
anyo
n 8.
3i<
8.4*
*
8.4
8.65
8.
25
8.2
8.2
nd
nd
nd
nd =
no
data
av
aila
ble
*Dat
a re
cord
ed
durin
g co
rres
pond
ing
time
perio
ds
by D
r. R
ober
t W
inge
tt,
Cen
ter
for
Envi
ronm
enta
l St
udie
s, B
righa
m
You
ng U
nive
rsity
.
3/11
19
72
7.9
7.9
8.1
8.1
7.4
7.9 nd
N
I-" ....
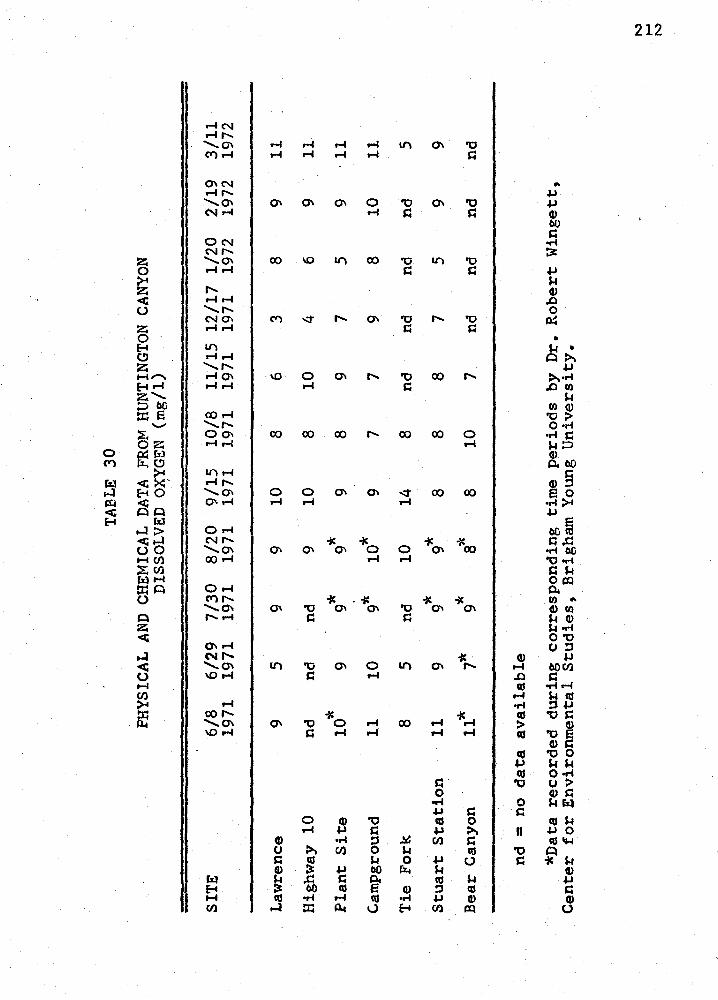
TAB
LE 30
PHY
SIC
AL A
ND
CH
EMIC
AL D
ATA
FRO
M HU
NTI
NG
TON
C
AN
YO
N
DIS
SOLV
ED O
XY
GEN
(mg/
1)
I
- SITE
6/
8 6/
29
7/30
8/
20
9/15
10
/8
11/1
5 12
/17
1/20
2/
19
1971
19
71
1971
19
71
1971
19
71
1971
19
71
1972
19
72
Law
renc
e 9
5 9
9 10
8
6 3
8 9
Hig
hway
10
nd
nd
nd
9
10
8 10
4
6 9
Plan
t Si
te
10*
9 9*
9*
9
8 9
7 5
9
Cam
pgro
und
11
10
9*
10*
9 7
7 9
8 10
Tie
Fork
8
5 nd
10
14
8
nd
nd
nd
nd
Stua
rt St
atio
n 11
9
9 * 9*
8
8 8
7 5
9
11*
7*
* a*
B
ear
Can
yon
9 8
10
7 nd
nd
nd
nd =
no
data
av
aila
ble
*Dat
a re
cord
ed
durin
g co
rres
pond
ing
time
perio
ds
by D
r. R
ober
t W
inge
tt,
Cen
ter
for
Envi
ronm
enta
l St
udie
s, B
righa
m
You
ng U
nive
rsity
.
3/11
19
72
11
11
· 11 11 5 9 nd
N ....
N
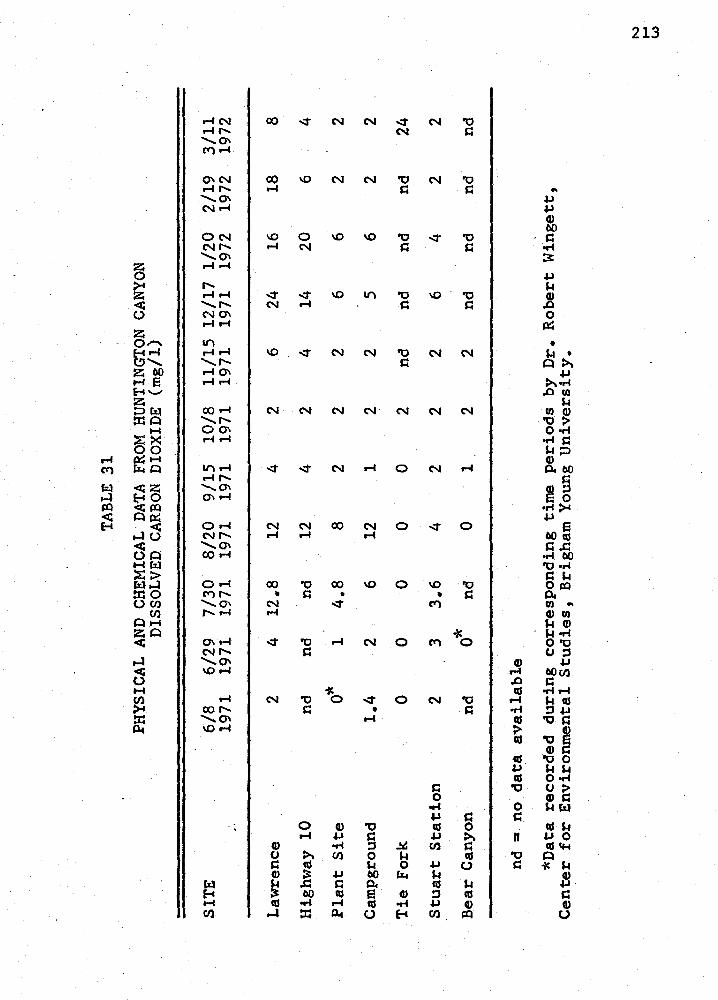
TAB
LE 31
PHY
SIC
AL A
ND
CH
EMIC
AL D
ATA
FRO
M H
UN
TIN
GTO
N
CA
NY
ON
D
ISSO
LVED
CA
RB
ON
DIO
XID
E (m
g/1)
SITE
6/
8 6/
29
7/30
8/
20
9/15
10
/8
11/1
5 12
/17
1/20
2/
19
1971
19
71
1971
19
71
1971
19
71
1971
19
71
1972
19
72
Law
renc
e 2
4 12
.8
12
4 2
6 24
16
18
Hig
hway
10
nd
nd
nd
12
4
2 4
14
20
6
Plan
t Si
te
o*
l 4.
8 8
2 2
2 6
6 2
Cam
pgro
und
1.4
2 6
12
l 2
2 5
6 2
Tie
Fork
0
0 0
0 0
2 nd
nd
nd
nd
Stua
rt St
atio
n 2
3 3.
6 4
2 2
2 6
4 2
Bea
r C
anyo
n nd
o*
nd
0
l_
2 2
nd
nd
nd
nd =
no
data
av
aila
ble
*Dat
a re
cord
ed
durin
g co
rres
pond
ing
time
perio
ds
by D
r. R
ober
t W
inge
tt,
Cen
ter
for
Envi
ronm
enta
l St
udie
s, B
righa
m
You
ng U
nive
rsity
.
3/11
19
72 8 4 2 2 24 2 nd
N .....
c....
,
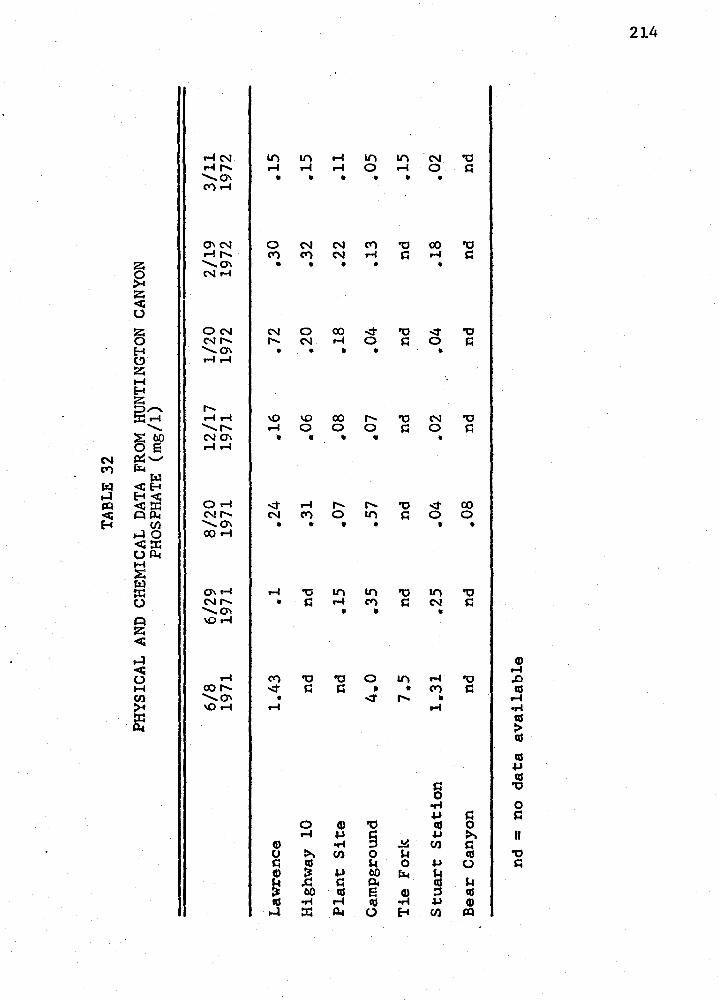
TAB
LE 32
PHY
SIC
AL A
ND
CH
EMIC
AL D
ATA
FRO
M H
UN
TIN
GTO
N
CA
NY
ON
PH
OSP
HA
TE (m
g/1)
6/8
6/29
8/
20
12/1
7 1/
20
2/19
19
71
1971
19
71
1971
19
72
1972
Law
renc
e 1.
43
.1
.24
.16
.72
.30
Hig
hway
10
nd
nd
.31
.06
.20
.32
Plan
t Si
te
nd
.15
•. 07
.oa
.18
.22
Cam
pgro
und
4.0
.35
.57
.01
.04
.13
Tie
Fork
7.
5 nd
nd
nd
nd
nd
Stua
rt St
atio
n 1.
31
.25
.04
.02
.. 04
.18
Bea
r C
anyo
n nd
nd
.0
8 nd
nd
nd
nd =
no
data
av
aila
ble
3/11
19
72
.15
.15
.11
.05
.15
.02 nd
N ....
::-
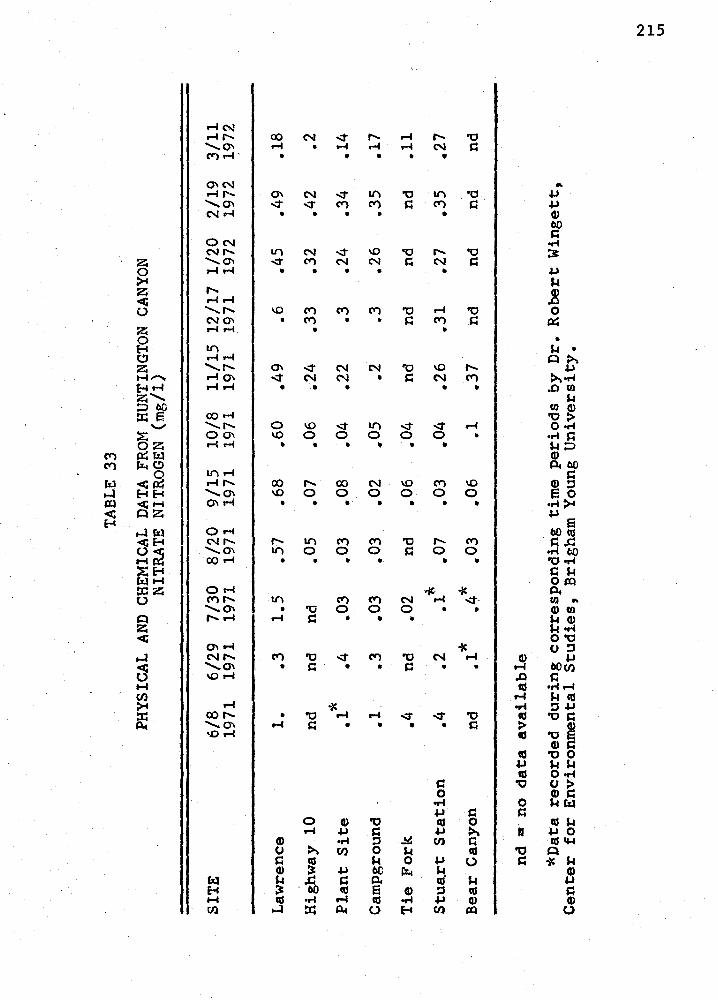
TAB
LE 33
PHY
SIC
AL A
ND
CH
EMIC
.AL D
ATA
FRO
M HU
NTI
NG
TON
C
AN
YO
N
NIT
RA
TE N
ITR
OG
EN (m
g/1)
SITE
6/
8 6/
29
7/30
8/
20
9/15
10
/8
11/1
5 12
/17
1/20
2/
19
1971
19
71
1971
19
71
1971
19
71
1971
19
71
1972
19
72
Law
renc
e 1.
.3
1.
5 .5
7 .6
8 .6
0 .4
9 .6
.4
5 .4
9
Hig
hway
10
nd
nd
nd
.0
5 .0
7 .0
6 .2
4 .3
3 .3
2 .4
2
Plan
t Si
te
• 1*
.4
.03
.03
.,08
.04
.22
.3
.24
.34
Cam
pgro
und
.1.
.3
.03
.03
.02
.05
.2
.3
.26
.35
Tie
Fork
.4
nd
.0
2 nd
.0
6 .0
4 nd
nd
nd
nd
Stua
rt St
atio
n .4
.2
.i~
.0
7 .0
3 .0
4 .2
6 .3
1 .2
7 .3
5
Bea
r C
anyo
n nd
.1
* 4*
.. .0
3 .0
6 .l
.37
nd
nd
nd
nd =
no
data
av
aila
ble
*Dat
a re
cord
ed
durin
g co
rres
pond
ing
time
perio
ds
by D
r. R
ober
t W
inge
tt,
Cen
ter
for
Envi
ronm
enta
l St
udie
s, B
righa
m
You
ng U
nive
rsity
.
3/11
19
72
.18 .2
.1
4
.17
.11
.27 nd
N ....
V1
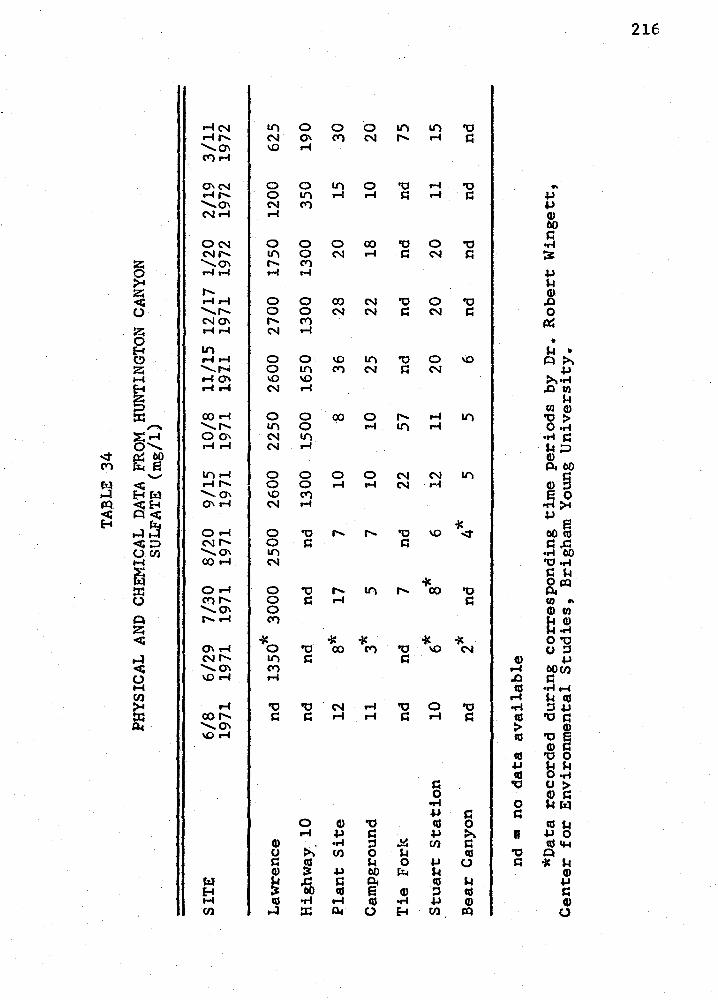
TAB
LE 34
PHY
SIC
AL A
ND
CH
EMIC
AL D
ATA
FRO
M H
UN
TIN
GTO
N
CA
NY
ON
SU
LFA
TE (m
g/1)
SITE
6/
8 6/
29
7/30
8/
20
9/15
10
/8
11/1
5 12
/17
1/20
2/
19
1971
19
71
1971
19
71
1971
19
71
1911
19
71
1972
19
72
Law
renc
e nd
13
50*
3000
25
00
2600
22
50
2600
27
00
1750
12
00
Hig
hway
_ 10
nd
nd
nd
nd
13
00
1500
16
50
1300
13
00
350
Plan
t Si
te
12
8*
17
7 10
-s
36
28
20
15
Cam
pgro
und
11
3*
5 7
10
10
25
22
18
10
Tie
Forlt
nd
nd
7
nd
22
57
nd
nd
nd
nd
Stua
rt St
atio
n 10
6*
s*
6
12
11
20
20
20
11
Bea
r C
anyo
n nd
2*
nd
4*
5
5 6
nd
nd
nd
nd •
no
dat
a av
aila
ble
*Dat
a re
cord
ed
durin
g co
rres
pond
ing
time
perio
ds
by D
r. R
ober
t W
inge
tt,
Cen
ter
for
Envi
ronm
enta
l St
udie
s, B
righa
m
You
ng U
nive
rsity
.
3/11
19
72
625
190 30
20
75
15
nd
.....,
...
. °'
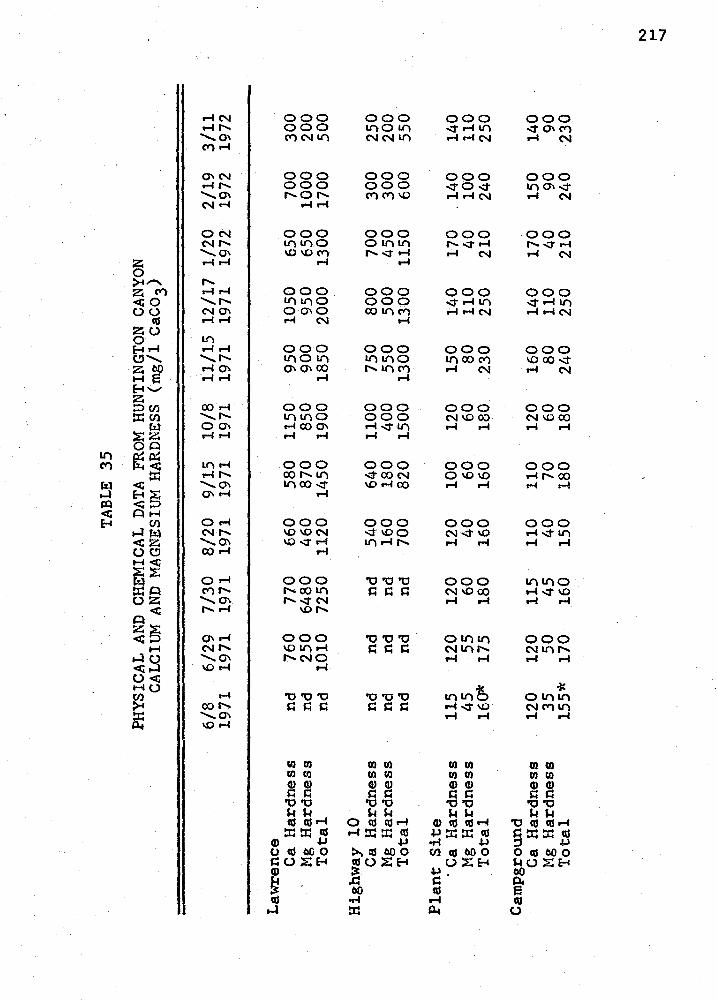
TAB
LE 35
PHY
SIC
AL A
ND
CH
EMIC
AL D
ATA
FRO
M H
UN
TIN
GTO
N
CA
NY
ON
C
ALC
IUM
AN
D M
AG
NES
IUM
H
AR
DN
ESS (m
g/1
Cac
o 3)
6/8
6/29
7/
30
8/20
9/
15
10/8
11
/15
12/1
7 1/
20
1971
19
71
1971
19
71
1971
19
71
1971
19
71
1972
Law
renc
e C
a H
ardn
ess
nd
760
770
660
580
1150
95
0 10
50
650
Mg
Har
dnes
s nd
25
0 64
80
460
870
850
900
950
650
Tota
l nd
10
10
7250
11
20
1450
19
00
1850
20
00
1300
Hig
hway
10
C
a H
ardn
ess
nd
nd
nd
540
640
1100
75
0 80
0 70
0 M
g H
ardn
ess
nd
nd
nd
160
180
400
550
500
450
Tota
l nd
nd
nd
70
0 82
0 15
00
1300
13
00
1150
Plan
t Si
te
· Ca
Har
dnes
s 11
5 12
0 12
0 12
0 10
0 12
0 15
0 14
0 17
0 M
g H
ardn
ess
45
55
60
40
60
60
80
110
40
Tota
l 16
0k
175
180
160
160
180
230
250
210
Cam
pgro
und
Ca
Har
dnes
s 12
0 12
0 11
5 11
0 11
0 12
0 16
0 14
0 17
0 M
g H
ardn
ess
35
50
45
40
70
60
80
110
40
Tota
l 15
5*
170
160
150
180
180
240
250
210
2/19
19
72
700
1000
17
00
300
300
600
. 140
10
0 24
0
150 90
240
3/11
19
72
300
200
500
250
200
550
140
110
250
140 90
230
N ....
.....,
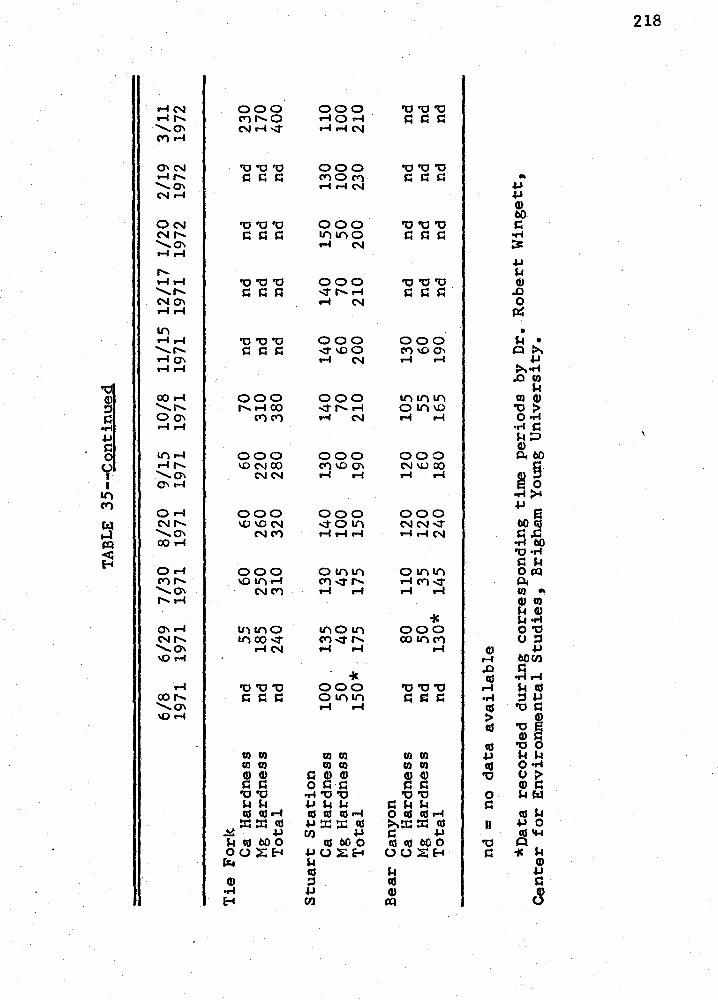
TAB
LE 35
•-C
ontin
ued
6/8
6/29
7/
30
8/20
9/
15
10/8
11
/15
12/1
7 1/
20
2/19
19
71
1971
19
71
1971
19
71
1971
19
71
1971
19
72
1972
Tie
Fork
C
a H
ardn
ess
nd
55
60
60
60
70
nd
nd
nd
nd
Mg
Har
dnes
s nd
18
5 25
0 26
0 22
0 31
0 nd
nd
nd
nd
To
tal
nd
240
310
320
280
380
nd
nd
nd
nd
Stua
rt St
atio
n C
a H
ardn
ess
100
135
130
140
130
140
140
140
150
130
Mg
Har
dnes
s 50
40
45
10
0 60
70
60
70
50
10
0 To
tal
150*
· 1
75
175
150
190
210
200
210
200
230
Bea
r C
anyo
n C
a H
ardn
ess
nd
80
110
120
120
105
130
nd
nd
nd
Mg
Har
dnes
s m
d 50
35
12
0 '€
0 55
60
nd
nd
nd
To
tal
nd
130*
14
5 24
0 18
0 16
5 19
0 nd
nd
nd
nd =
no
data
av
aila
ble
*Dat
a re
cord
ed
durin
g co
rres
pond
ing
time
perio
ds
by D
r. R
ober
t W
inge
tt,
Cen
ter
for
Envi
ronm
enta
l St
udie
s, B
righa
m
You
ng U
nive
rsity
.
3/11
19
72
230
170
400
110
100
210 nd
nd
nd
N ....
00
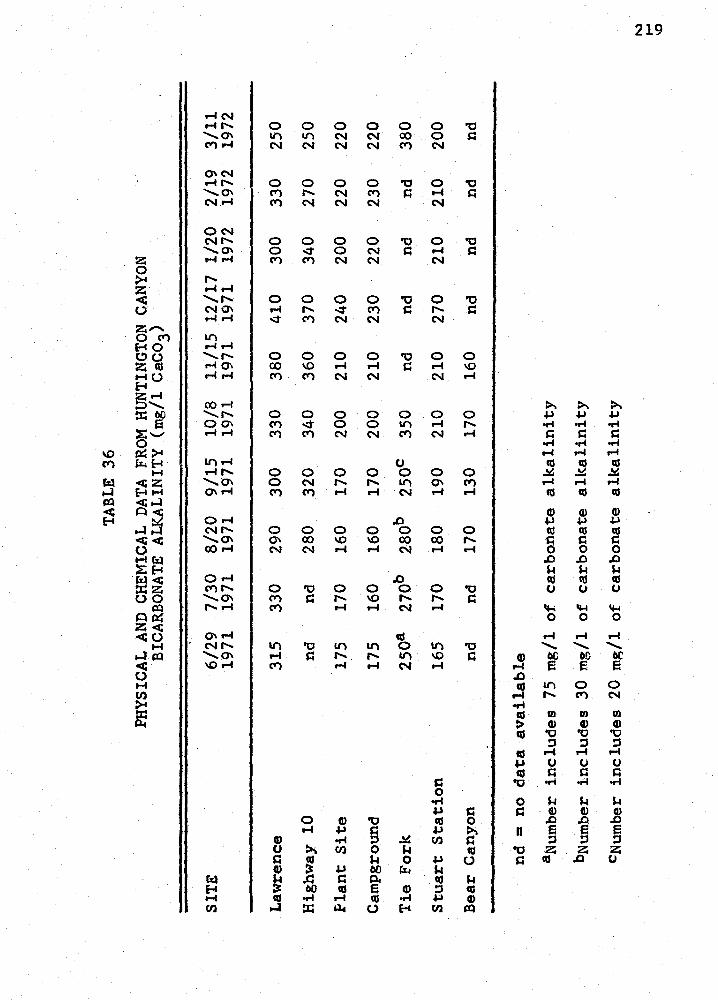
TAB
LE 36
PHY
SIC
AL A
ND
CH
EMIC
AL D
ATA
FRO
M HU
NTI
NG
TON
C
AN
YO
N
BIC
AR
BO
NA
TE
ALK
ALI
NIT
Y (m
g/1
Cac
o 3)
SITE
6/
29
7/30
8/
20
9/15
10
/8
11/1
5 12
/17
1/20
2/
19
3/11
19
71
1971
19
71
1971
19
71
1971
19
71
1972
19
72
1972
Law
renc
e 31
5 33
0 29
0 30
0 33
0 38
0 41
0 30
0 33
0 25
0
Hig
hway
10
nd
nd
28
0 32
0 34
0 36
0 37
0 34
0 27
0 25
0
Plan
t Si
te
175
170
160
170
200
210
240
200
220
220
Cam
pgro
und
175
160
160
170
200
210
230
220
230
220
Tie
Fork
2s
oa
270b
28
0b
250c
35
0 nd
nd
nd
nd
38
0
Stua
rt St
atio
n 16
5 17
0 18
0 19
0 21
0 21
0 27
0 21
0 21
0 20
0
Bea
r C
anyo
n nd
nd
17
0 13
0 17
0 16
0 nd
nd
nd
nd
nd =
no
data
av
aila
ble
aNum
ber
incl
udes
75
mg/
1 of
ca
rbon
ate
alka
linity
bNum
ber
incl
udes
30
mg/
1 of
ca
rbon
ate
alka
linity
CN
umbe
r inc
lude
s 20
mg/
1 of
ca
rbon
ate
alka
linity
N
....
'°
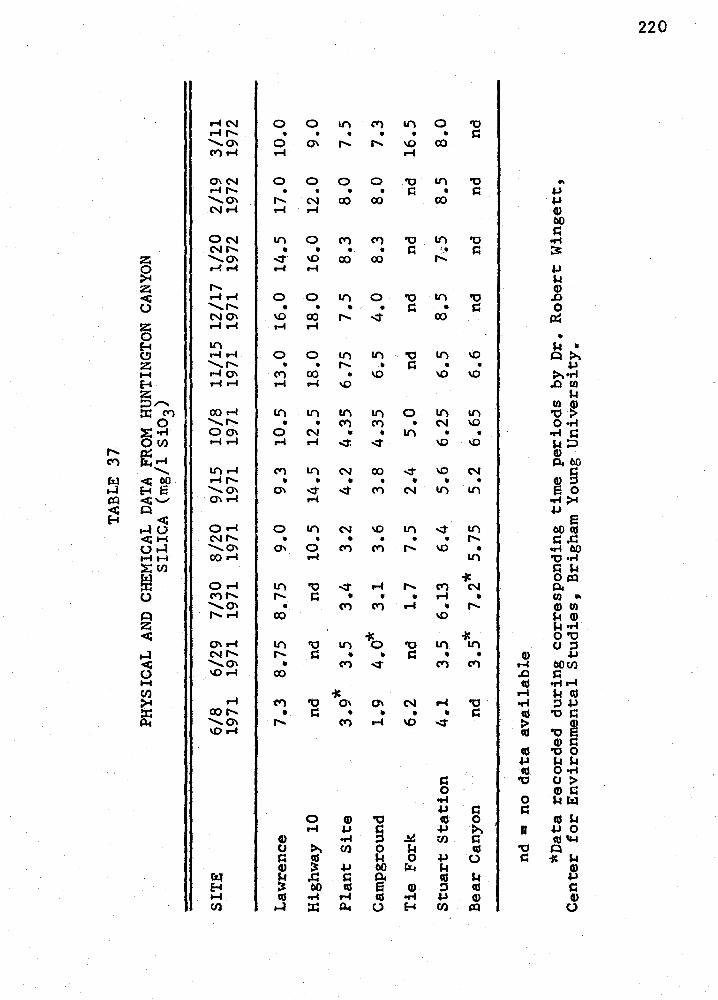
TAB
LE 37
PHY
SIC
AL A
ND
CH
EMIC
AL D
ATA
FRO
M H
UN
TIN
GTO
N
CA
NY
ON
SI
LIC
A (
mg/
1 Si
03)
SITE
6/
8 6/
29
7/30
8/
20
9/15
10
/8
11/1
5 12
/17
1/20
2/
19
1971
19
71
1971
19
71
1971
19
71
1971
19
71
1972
19
72
Law
renc
e 7.
3 8.
75
8.75
9.
0 9.
3 10
.5
13.0
16
.0
14.5
17
.0
Hig
hway
10
nd
nd
nd
10
.5
14.5
12
.5
18.0
18
.0
16.0
12
.0
Plan
t Si
te
3.9*
3.
5 3.
4 3.
2 4.
2 4.
35
6.75
7.
5 8.
3 8.
0
Cam
pgro
und
1.9
4.0*
3.
1 3.
6 3.
8 4.
35
6.5
4.0
8.3
8.0
Tie
Fork
6.
2 nd
1.
7 7.
5 2.
4 5.
0 nd
nd
nd
nd
Stua
rt St
atio
n 4.
1 3.
5 6.
13
6.4
5.6
6.25
6.
5 8.
5 7.
5 8.
5
Bea
r C
anyo
n nd
*
3.5.
*
7.2
5.75
5.
2 6.
65
6.6
nd
nd
nd
nd =
no
data
av
aila
ble
*Dat
a re
cord
ed
durin
g co
rres
pond
ing
time
perio
ds
by D
r. R
ober
t W
inge
tt,
Cen
ter
for
Envi
ronm
enta
l St
udie
s, B
righa
m
You
ng U
nive
rsity
.
3/11
19
72
10.0
9.0
7.5
7.3
16.5
8.0 nd
N
N 0

221
APPENDIX III
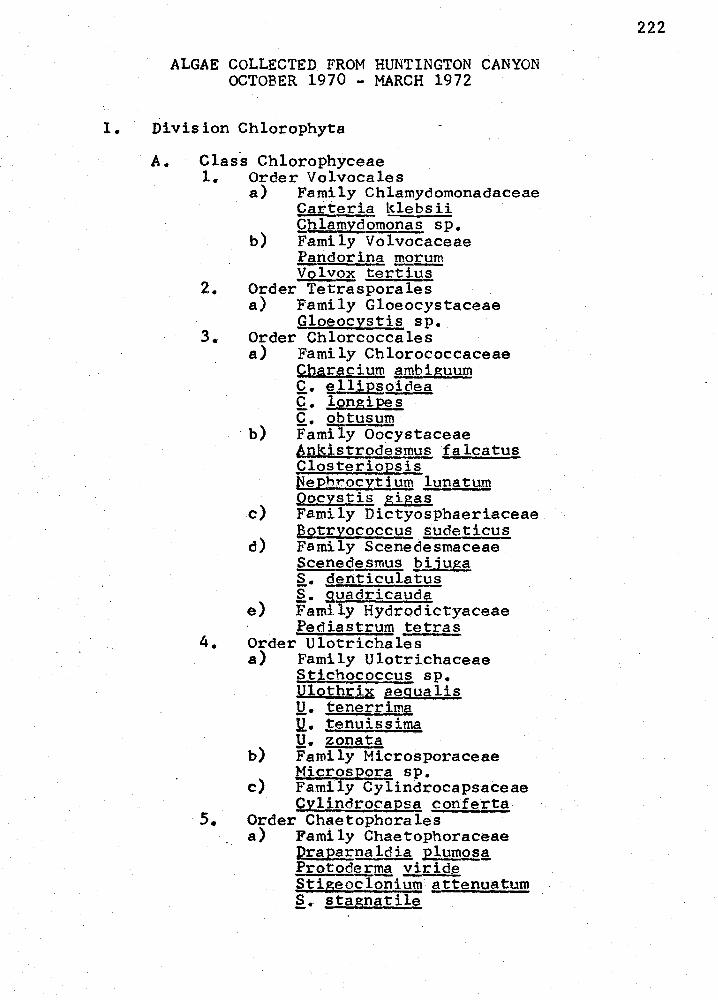
ALGAE COLLECTED FROM HUNTINGTON CANYON OCTOBER 1970 - MARCH 1972
I. Division Chlorophyta
A. Class Chlorophyceae 1. Order Volvocales
a) Family Chlamydomonadaceae Carteria klebsii Qblamydomonas sp.
b) Family Volvocaceae Pandorina morum Volvox tertius
2. Order Tetrasporales a) Family Gloeocystaceae
Gloeocystis sp. 3. Order Chlorcoccales
a) Family Chlorococcaceae Characium ambiguu~ £. ellipsoidea c. longipes c. obtusum
· b) Family Oocystaceae 6nkistrodesmus falcatus Closteriopsis Neph~ocytium lunatum Oocystis _gigas
c) Family Dictyosphaeriaceae Botryococcys sudeticus
d) Family Scenedesmaceae Scenedesrnus pijuga §,. denticulatus §. • .9.gadricauda
e) Family Hydrodictyaceae Pediastrum tetras
4. Order Ulotrichales a) Family Ulotrichaceae
Stichococ~ sp. Ulothrix ~gualis Y,. tenerrima y. tenuissima U. zonata
b) Family Microsporaceae Microspora sp.
c) Family Cylindrocapsaceae Cylindrocapsa conferta
5. Order Chaetophorales a) Family Chaetophoraceae
Draparnaldia plumQ.§_~ Protoderffi!. Y.!,ride Stigeoclonium attenuatum .§.. stagnatil~
222
6.
7.
8.
b) Family Aphanochaetacede Aphanochaete r~pens
c) Family Coleochaetaceae Coleochaete irregularis
Order Oedogoniales a) Family Oedo~oniaceae
Oedogonium sp. Order Clacophorales a) Family Cladophoraceae
CladoPhora fracta £. g!omeratfl Rhizoclonium hierogiyPhicum
Order Zygnematales a) Family Zygnemataceae
ffougeotia capucina t::,1. genuflexa t::,1. parvula Spirogyra ~cimina var. submarina s. dubia §. porticalis §.. spp. iygnema ,ins igne ~- sp.
b) Family Desmidiaceae Q.losteri!!!!! acerosum Q.. dianae Q.. ~hrenb!?rgii Q.. lanceola turn c .. moniliferum Q.. rostratum £. spp. Cosmarium rnargaritatum C. ochthodes £. ovale Q.. guinarium c. tinctum £. spp. . E!i!astrum sp. filcrasteria& sp. Pleurotaenium ~hrenbergi_i !:. sp. 2,phaerozosma sp. Staurastrum gustephanum §.. gracile §,. mutica
B. Class Charophyceae l. Order Charales
a) Family Characeae Q.bara vulgaris
223
II. Division Euhienophyta
1. Order Euglenales a) Family Euglenaceae
&uglena gracilis ~. minuta g_. spp. Eutreptia sp. Phacus E_>yrum P. acuminatus I. sp Trachelomonas sp.
111. Division Pyrrhophyta
A. · Class Dinophyceae 1. Order Peridinales
a) Family Peridiniaceae Peridinium cinctum
b) Family Ceratiaceae Ceratium hirundinella
IV. Division Chrysophyta
A. Class Xanthophyceae 1. Order Mischococcales
a) Family Characiopsidaceae Characiopsis acuta
b) Sciadaceae Ophiocytium
2. Order Tribonematales a) Family Tribonemataceae
Tribonema bombycina 3. Order Vaucheriales
. a) Family Vaucheriaceae Vaucheria geminata y_. sp.
B. Class Chrysophyceae 1. Order Chromulinales
a) Family Hydruraceae Hydrurus foetidus
2. Order Ochromonadales a) Family Dinobryaceae
Dinobryon cylindricum c. Class Bacillariophyceae
1. Order Centrales a) Family Coscinodiscaceae
Cyclotella meneghiniana 2. Order Pennales
a) Family Fragilariaceae
224
b)
c)
d)
Asterionella formosa var. formosa Ceratoneis arcus ~. arc~var. amphioxys ~iatoma anceps var. linearis D. hiemale var. mesodon D. tenue var. elon~atum D. vufgare var. breve ~. yulgare var. v~re ~agilarin construens var. binodus F. construens var. venter F. crotonensis f. leptostauron var. leptostauron [. Einnata var. lancettula F. virescens
225
Meridion circulare var. constrictum S~nedra var:-acus §.. aff inis s. crotonensis s. delicatissima var. delicatissima [. £ul~pefra var. lanceolata ~- £ulchella var. lancettula s. radians s~ ulna var. £XYrhynchus s. uTria var. subegua!:h§. s. ulna var. ulna Tab~ria fenestrata Family Eunotiaceae Eunotia curvata Family Achnantilaceae Achnanthes curvata A. deflexa --A,. dubia A,. hauchiana A• lanceolata var. dubia A,. lanceolata var. haynaldii d• Ianceolata var. lanceolata A· linearis form curta A. minutissima Cocconeis disculus var. disculus £. 2tdiculu~ var. pediculus Q, placentula var. eugl}7E.!!, ~- £lacentula var. lineata Q. 12ugosa Rhoicosphenia Family Naviculaceae ~mpoJEleurg £ellucida var. rulucida Amphiprora alata Caloneis ventricosa Diplonell pseudovalis var. pseudoval.!! Gy;:osigmg acuminatum ,Q. spenceri . Mastogloia smithii var. smithii N§vicula bicephala
e)
f)
g)
h)
N. capitata N. £ryptoC~£hala [. ~usEidata var. ~ajor. N. elgin~nsis VRr. ~l~inensis ff. e!~!nensis var. rostrata !!• ~xigu~ N. lanceolata N. ·minima var. fili!!~ N. odiosa ff. pelliculosa var. pelllculos~ ~- J2eregrina N. pseudoreinhardtii [ • .12!JPula var. ~~liltis.!. N. _Eupu la var. ,E.IEU a [. radiosa var. radiosa N. radiosa var. tenella [. rhyncocepha~ ~- tripunctata var. ~chizonemoides Neidium affine var. longicef:S N. binode var. binode Pinriu'Iaria brebissonii P. viridis var. minor Pleurosigma delicatulum Stauroneis ~!!£~E~ var. ~!!£eEs ~- Ehoenicente.£Q!l var. gracilis
226
~- phoenicenteron var. £hoenicenteron s. smithii var. smithii Family Gomphonemataceae GomEh2nema acuminatum Q. constrictum G. gracil~ G. intricatum Family-Cymbellaceae Amphora ova lis Q.mbella arnphicephala Q.. cuspidata Q.. £Ym_biformis Q.. gracilis Q.. Earva c. ventricosa Family Epithemiaceae J2enticu,la sp. ~Eithe!!!.is. argus K• gibba var. gibba [. turgida var. westermanni Family Nitzschiaceae Nitzschia acicularis li• angularis var. ~ffinis N. communis N. frustulum var. perpusilla !f• hungarica N. linearis E .. J?alel!,
li- sigmoidea N. vermicul.aris
i) Family Surirellaceae Cvmatopleura solea Surirella angustata §,. baileyi §_. ovallis §_. ovata
V. Division Cyanophyta
A. Class Myxophyceae 1. Order Chroococcales
a) Family Chroococcaceae Chroococcus limnetica c. minutus Q. turgida Gloeocapsa sp. Gomphosphaeria sp. Merismopedi~ elegans M• glauca M. tenuissima
2. Order-Chamaesiphonales a) Family Charnaesiphonaceae
£hamaesiphon 3. Order Oscillatoriales
a) Family Oscillatoraceae . ~yngbya aerugineo caerules !:. majpr L. martensiana L. nana 1. SW. Oscillatoria agardhii Q. amphibia° Q. limosa Q. tenuis o. spp. Phormidium sp. Schizothrix fragile Spirulina major §.. Erinceps
4. Order Nostocales a) Family Nostocaceae
~nabaena circinalis A· spp. Nostoc palusosum li• piscinale
b) Family Scytonemataceae TolyEothrix sp.
c) Family Rivulariaceae Calothrix sp.
227
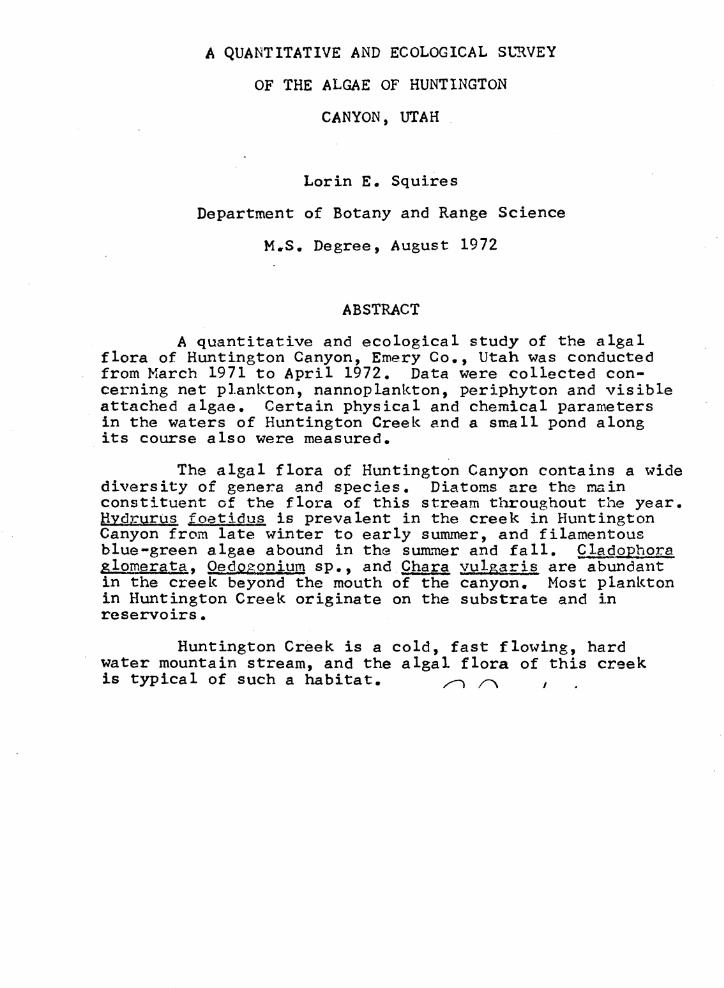
A QUANTITATIVE AND ECOLOGICAL SCRVEY
OF THE ALGAE OF HUNTINGTON
CANYON, UTAH
Lorin E. Squires
Department of Botany and Range Science
M.S. Degree, August 1972
ABSTRACT
A quantitative and ecological study of the algal flora of Huntington Canyon, Emery Co., Utah was conducted from March 1971 to April 1972. Data were collected con-cerning net plankton, nannoplankton, periphyton and visible attached algae. Certain physical and chemical parameters in the waters of Huntington Creek and a small pond along its course also were measured.
The algal flora of Huntington Canyon contains a wide diversity of genera and species. Diatoms nre the main constituent of the flora of this stream throughout the year. Hydrurus foetidus is prevalent in the creek in Huntington Canyon from late winter to early summer, and filamentous blue-green algae abound in the S\.IITh'Tier and fall. ~JagopJ-iora glomerata, Oed,ogonium sp., and Chara vulgaris are abundant in the creek beyond the mouth of the canyon. Most plankton in Huntington Creek originate on the substrate and in reservoirs.
Huntington Creek is a cold, fast flowing, hard water mountain stream, and the algal flora of this creek is typical of such a habitat. /""J /\ ,
Related Documents