1 Large scale production of multi-walled carbon nanotubes by fluidized bed catalytic chemical vapor deposition : a parametric study Aurore Morançais 1,2 , Brigitte Caussat 2* , Yolande Kihn 3 , Philippe Serp 1* , Philippe Kalck 1 , Dominique Plee, 5 Patrice Gaillard 5 , Daniel Bernard 4 1 LCCFP/ENSIACET/INPT, 118 route de Narbonne, 31077 Toulouse Cedex 4, France 2 LGC/ ENSIACET/INPT, UMR CNRS 5503, 5 rue Paulin Talabot, BP1301, 31106 Toulouse Cedex 1, France 3 CEMES, UPR CNRS 8011, 29 rue Jeanne Marvig, 31055 Toulouse, France 4 ARKEMA, 4-8 cours Michelet, La Défense 10, F-92091, Paris La Défense Cedex, France 5 ARKEMA LACQ RESEARCH CENTER, PO Box 34, 64170 Lacq, France * To whom correspondence should be addressed: Phone: +33 562885700; fax: +33 562885600 (P. Serp), Phone: +33 534615252; fax: +33 534615253 (B. Caussat) E-mail addresses: [email protected], [email protected]

Welcome message from author
This document is posted to help you gain knowledge. Please leave a comment to let me know what you think about it! Share it to your friends and learn new things together.
Transcript
1
Large scale production of multi-walled carbon nanotubes by fluidized bed
catalytic chemical vapor deposition : a parametric study
Aurore Morançais1,2, Brigitte Caussat2*, Yolande Kihn3, Philippe Serp1*, Philippe Kalck1,
Dominique Plee,5 Patrice Gaillard5, Daniel Bernard4
1LCCFP/ENSIACET/INPT, 118 route de Narbonne, 31077 Toulouse Cedex 4, France
2LGC/ ENSIACET/INPT, UMR CNRS 5503, 5 rue Paulin Talabot, BP1301, 31106 Toulouse Cedex 1, France
3CEMES, UPR CNRS 8011, 29 rue Jeanne Marvig, 31055 Toulouse, France
4ARKEMA, 4-8 cours Michelet, La Défense 10, F-92091, Paris La Défense Cedex, France
5ARKEMA LACQ RESEARCH CENTER, PO Box 34, 64170 Lacq, France
* To whom correspondence should be addressed: Phone: +33 562885700; fax: +33
562885600 (P. Serp), Phone: +33 534615252; fax: +33 534615253 (B. Caussat)
E-mail addresses: [email protected], [email protected]
2
Abstract
A parametric study investigating the impact of temperature, run duration, total pressure, and
composition of the gaseous phase on the catalytic growth of multi-walled carbon nanotubes
(MWNT) has been performed. MWNT have been produced very selectively on the multi
gram scale by catalytic chemical vapor deposition from ethylene in a fluidized bed reactor.
The kinetics of MWNT growth is fast and, with the catalyst used, no induction period has
been observed. The kinetic law is positive order in ethylene concentration and the process is
limited by internal diffusion in the porosity of the catalyst. The formation of MWNT in the
macroporosity of the catalyst induces an explosion of the catalyst grains. Such a process,
thanks to the absence of temperature gradient and to the efficient mixing of the grains allows
a uniform and selective treatment of the catalyst powder leading to very high selectivity
towards MWNT formation. High purity MWNT have been obtained after catalyst dissolution.
Depending on the temperature of production, the specific surface area of this material ranged
between 95 and 455 m2/g.
Keywords : A. Carbon nanotubes; B. Chemical vapor deposition, Catalyst support; D. Carbon
yield, Surface areas
3
1. Introduction
Multi-walled carbon nanotubes (MWNT) are today expected to bring significant
breakthroughs in different fields such as: i) engineering materials, as additives for polymers or
coatings to enhanced electrical and electrostatic properties or tenacity, ii) energy, as
components of super-capacitors, fuel cells or batteries, iii) electronics, catalysis, …. Besides
the key questions of standardization, safety, impact on environment, which are specific to
each nanomaterial, if we focus on the current worldwide MWNT market status, some hard
points appeared such as high prices (100 to 5000 €/kg) and poor availability (around 100
T/year). Middle term industrial production is realistic provided an efficient production process
exists. The large scale synthesis of this material by catalytic chemical vapor deposition
(CCVD) is the subject of intensive research, and appears to be the most promising route due
to potential cheapness of the MWNT produced and to high yield productivities. Pilot scale
production reactors are already running for graphite nanofibers and the two kinds of CNT,
namely MWNT and single wall carbon (SWNT), and companies such as Arkema [1], Bayer
[2] or Thomas Swan [3] are already present on the CNT market.
The CCVD process for carbon nanotubes (CNT) growth can be performed either under
homogeneous or heterogeneous conditions [4]. In the former case, vapors of an
organometallic catalyst precursor are mixed with reactant gases within the CVD reactor,
leading to CNT growing in the vapor phase from the metallic particles as they are formed.
This method, often called “floating catalyst” presents several drawbacks connected mainly to
the difficulty to prevent particles coalescence. When using heterogeneous catalysts, fixed bed
reactors represent the most common technology. The efficiency of CNT growth in this
process is limited severely by inhomogeneous gas-solid contact and temperature gradients.
Fluidized bed (FB) reactors can also be used for performing this process, and installations
4
have been tested, mainly in France [5], China [6,7] and in the Netherlands [8]. In that case, a
catalytic powder is put into contact with reactant gases in appropriate conditions of flow rate,
pressure, and temperature so as to allow homogeneous and heterogeneous chemical reactions
to occur, leading to the catalytic formation of the desired product. The gas solid contact is
regulated so as to fluidize each particle in the reactive gas, thus ensuring a vigorous mixing of
powders by the gas. The control of the fluidization quality is of major importance to operate
in isothermal conditions and to obtain uniform materials. Although some studies have
appeared in the open literature dealing with the preparation of carbon nanofibers [8,9],
MWNT [5-7,10-13] or even SWNT [14-16] by FB-CCVD, in most of them, no experimental
data confirms the presence of a fluidization regime.
We have successfully adapted a CCVD process to be used in a fluidized bed reactor,
and in a previous paper [5], the main advantages of our FB-CCVD process have been
emphasized : (i) experiments are fully reproducible, (ii) they lead to high carbon conversions,
more often higher than 75% and to an excellent selectivity in MWNT (neither soot nor
encapsulated catalytic particles have been detected), (iii) elutriation is negligible, indicating
that MWNT remain anchored on the catalytic particles in the FB. In this work, we present the
first parametric study associated to the FB-CCVD process for large scale MWNT production.
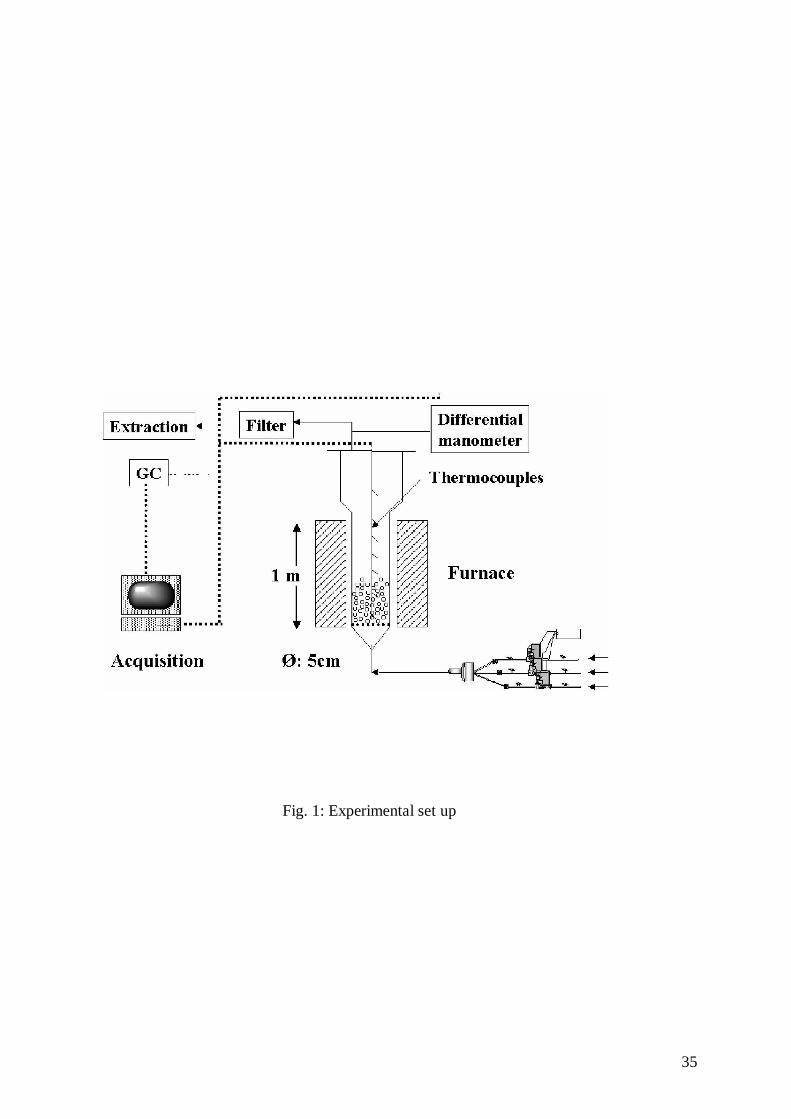
1. Experimental features
Operating conditions tested
The experimental set up employed is schematically presented in Fig. 1.
Figure 1
5
The fluidized bed reactor is entirely constructed from a 304L stainless steel; its
dimensions are 5.3 cm internal diameter and 1 m height. The gas distributor is a stainless steel
perforated plate covered with a stainless steel grid supplied with 50 µm holes, and an electric
furnace allows monitoring of the fluidized bed temperature via two thermocouples, one fixed
on the outer reactor wall and the other placed in the FB, 3 cm above the distributor. Electronic
grade ethylene, hydrogen and nitrogen gases (Air Liquide) are supplied to the bed through a
mass flow meter for the former and by ball rotameters for the two others. A pressure sensor
allows measuring the differential pressure drop between the bottom and the top parts of the
reactor. After its exit out of the reactor, the gaseous effluents flow through a bag filter, to
collect elutriated particles or fines that could be formed during the experiments.
Catalyst supports consist in mesoporous alumina (Al2O3) particles, 110 microns in
mean diameter, previously treated in another reactor, in order to obtain a 2.5%Fe/Al2O3 w/w
catalyst; more details concerning the catalyst preparation are available elsewhere [17].
Concerning the operating procedure, first a mass of 50 g of catalyst is introduced into
the reactor corresponding to an initial fixed bed height of 1.8 cm (we will see later why such a
low value has been employed). A constant flow rate of pure nitrogen and hydrogen fluidizes
the bed during its heating, the initial fluidization ratio U/Umf, (where U is the gas flow
velocity and Umf the minimum fluidization velocity) being most often fixed to about 1. As
soon as the thermal regime is reached, the flow rate of nitrogen is lowered to a pre-calculated
value and simultaneously ethylene is introduced into the bed to maintain constant the total
flow rate. It is worth noting that during the synthesis of CNT, Umf decreases with run
duration, since the grain density sharply decreases; as a consequence, the fluidization ratio
increases with run duration as it will be detailed below. This explains why the initial
fluidization ratio has been fixed to a minimum value.
6
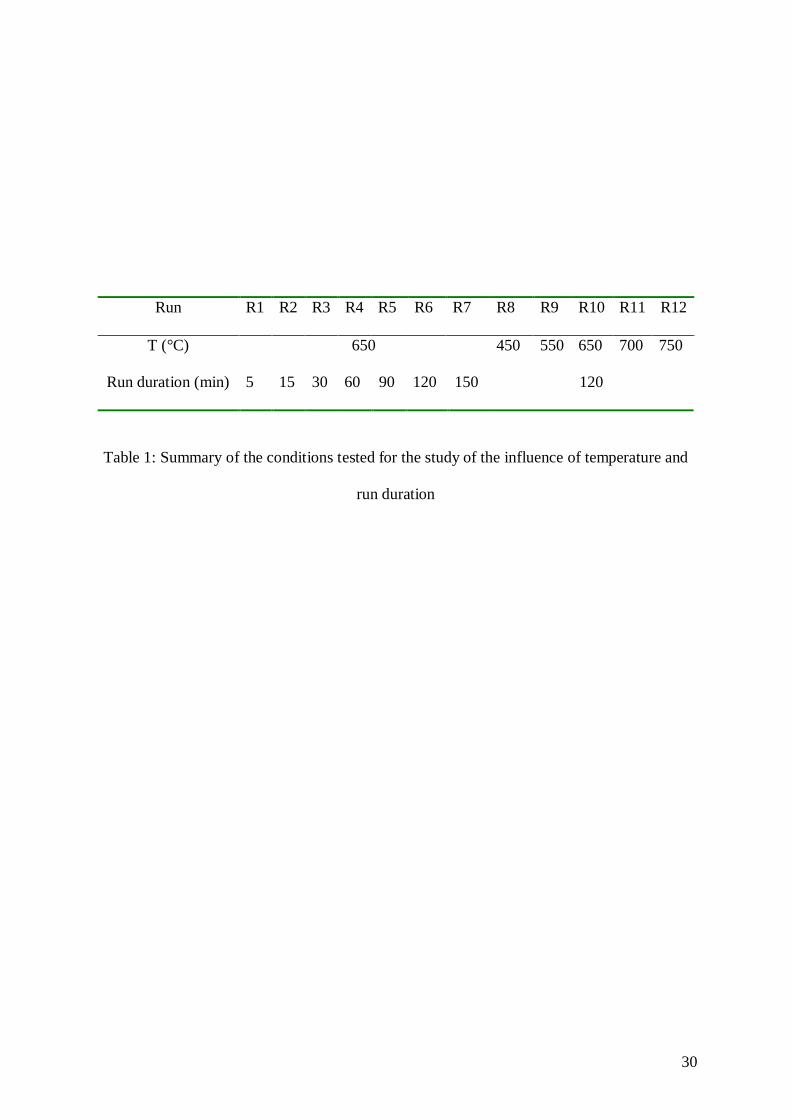
In a first set of experiments, the influence of run duration and temperature has been
analyzed. Run duration was varied between 5 and 150 minutes for a mean bed temperature of
650°C, then bed temperature, measured at 3 cm above the distributor, was varied between
450°C and 750°C for a run duration fixed at 120 minutes. The nitrogen, hydrogen and
ethylene flow rates used during these experiments are respectively equal to 685, 1200 and 405
standard cm3/min (sccm). These values correspond to the nominal gas flow rates leading to an
initial fluidization ratio U/Umf equal to 1. The exact operating conditions tested are given in
Table 1.
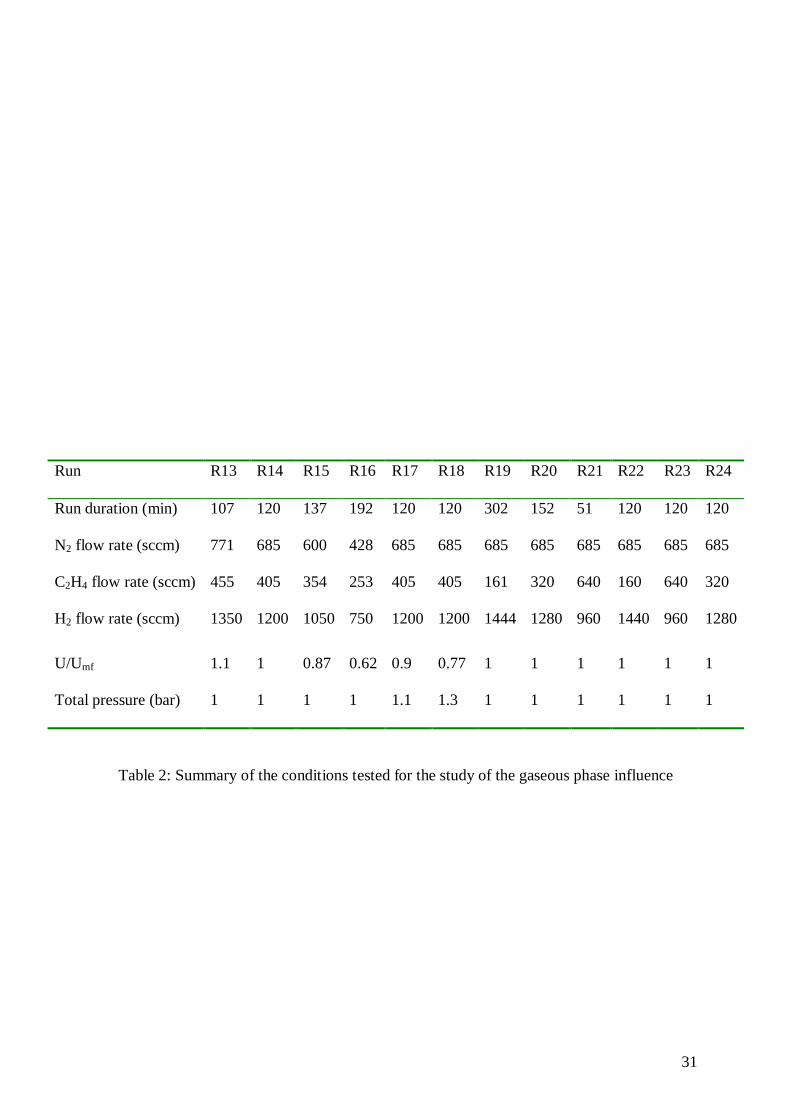
In a second series of runs (see Table 2), the influence of the gaseous phase (total gas flow
rate, total pressure and C2H4/H2 ratio) has been studied. For all these experiments, the mean
bed temperature at 3 cm above the distributor was fixed at 650°C. The initial fluidization ratio
has been varied between 0.6 and 1.1, the total pressure between 1 and 1.3 Bar and the
C2H4/H2 ratio between 0.1 and 0.66. Run R14 is similar to runs R6 and R10 which has
allowed ascertaining the reproducibility of our experiments.
Tables 1 and 2
Process efficiency
The process efficiency was characterized through the following parameters:
(i) the weight of produced material during each run, and the resulting
deposition rate,
(ii) the carbon yield, corresponding to the percentage of deposited carbon in
comparison with the introduced quantity,
(iii) the evolution of bed temperature (3 cm upon the distributor) with time, and
of the mean pressure drop between the bottom and the top parts of the reactor.
7
This latter parameter gives information about the fluidization quality of
catalytic powders and composites (CNT + catalyst) powders.
After each run, the whole bed of composite particles was chemically treated in a
sulfuric acid bath, in order to completely dissolve the alumina and most of the iron catalyst.
SEM observations were done using a field-enhanced electron microscope (Hitachi S-
4500 I) and a LEO 435 microscope; TEM observations were also conducted with a Philips
CM12 microscope (120 kV voltage) in order to detect the possible presence of undesired
products (soot or encapsulated iron nanoparticles).
Thermo gravimetric analyses (TGA) were conducted so as to evaluate the amount of
carbon deposited in each experiment and also the percentage of other forms of carbon. Those
analyses were conducted under air in a Setaram apparatus with a 10°C.min-1 ramp between 25
and 1000°C followed by an isotherm at that temperature for 30 minutes.
Nitrogen adsorption-desorption analyses were performed using a Micromeritics Asap
2010 equipment, so as to obtain the BET specific surface area and information concerning the
porosity of powders before and after CNT formation. The pore size distribution in the
mesoporosity range was determined from the adsorption and desorption branches using the
BJH method. Before each measurement, samples have been kept in an oven at 100°C to limit
adsorption phenomena and a degassing has been performed at 200°C during 2h30min.
The distribution of grain diameters was measured with a Mastersizer Sirocco 2000
laser granulometer.
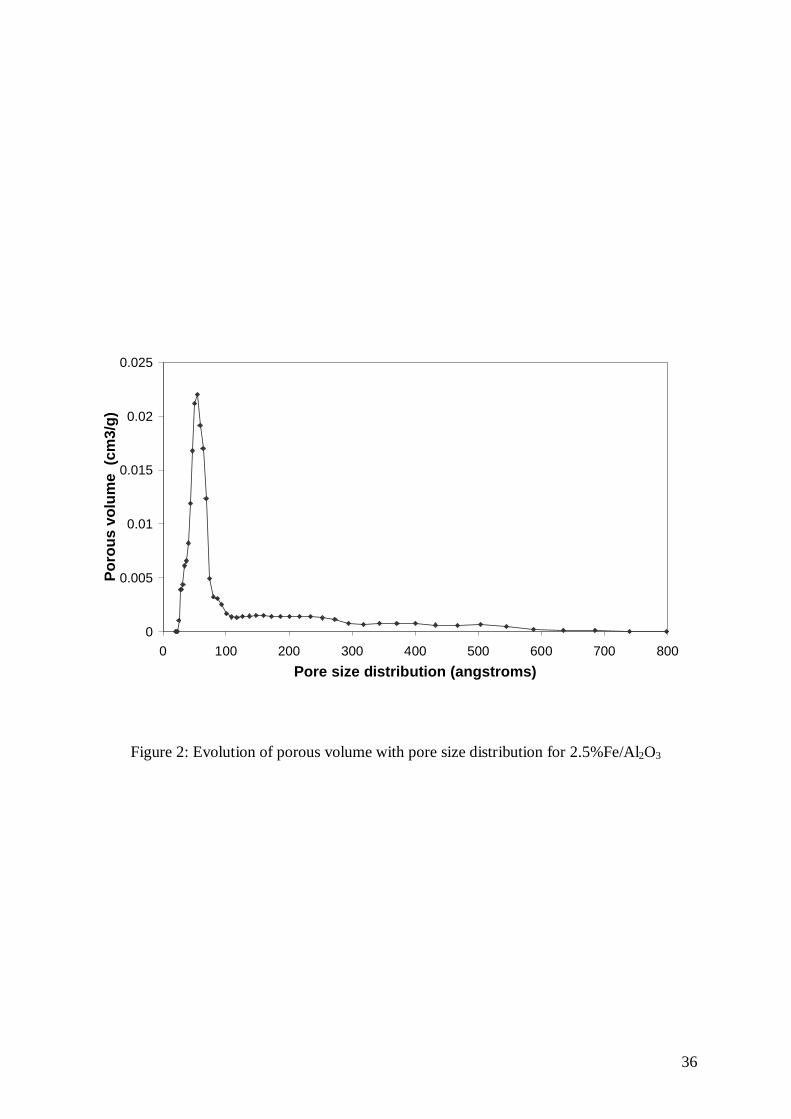
3. Results
The specific surface area of the catalyst particles is 178 m2/g, and the pore size
distribution is given in Fig. 2. These powders present significant meso-porosity, but also some
8
micro-porosity. This information is important in particular concerning the study of the total
pressure influence presented below. The reproducibility of experiments tested through the
nominal conditions of runs R6, R10 and R14 was satisfactory regarding all process
parameters and material features. Elutriation phenomena have been negligible for all
experiments. Similarly, attrition, due to the use of an abrasive support that could produce the
cutting up of MWNT from the support was not observed. This latter result is in contradiction
with observations reported by Hernadi et al. when studying the catalytic growth of MWNT on
Fe/SiO2 catalysts in a low diameter fluidized bed. In this study, the authors mentioned some
drawbacks such as the formation of soot, in addition to the cutting up of the silica support and
to the breaking of the MWNT due to agitation [18].
Figure 2
3.1 Influence of run duration
The operating conditions tested correspond to runs R1 to R7 of Table 1. First,
systematic TGA measurements associated to TEM analysis have confirmed that for these
operating conditions, the selectivity of the process is excellent: neither soot nor encapsulated
particles were detected. The pressure drop monitoring has shown that the bed remains
conveniently fluidized till 120 min of run. Beyond 120 min, fluidization quality decreases, but
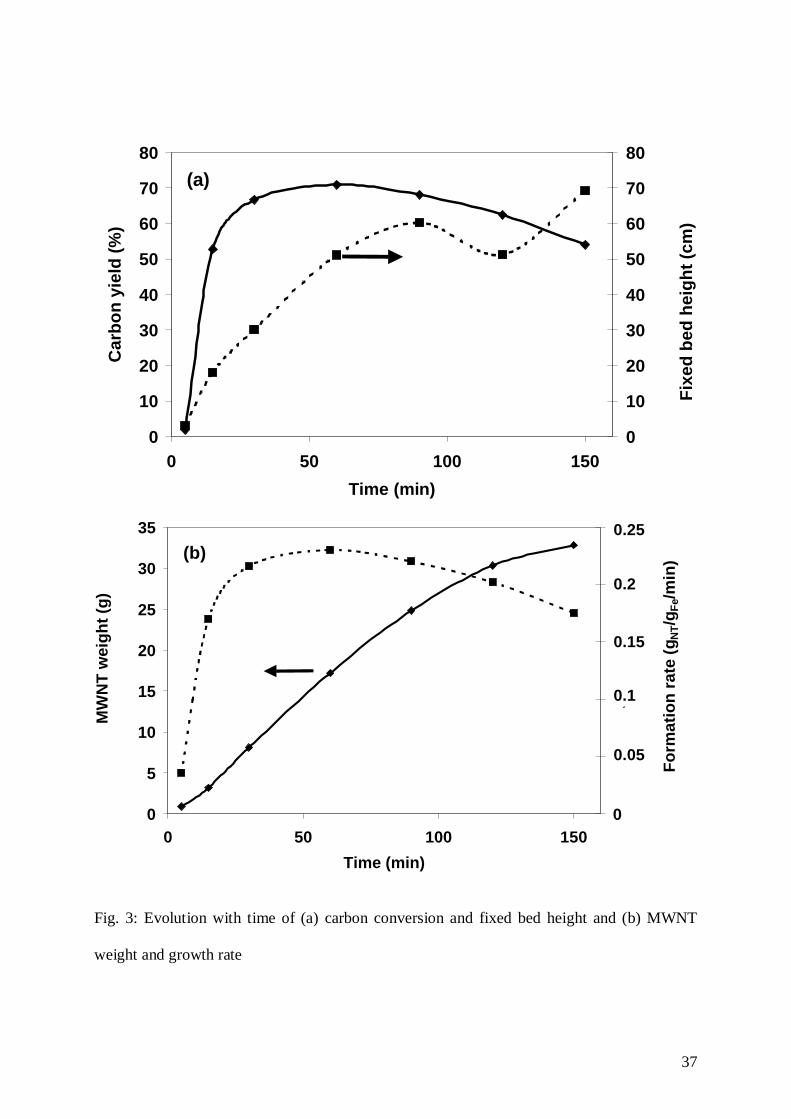
no agglomeration phenomenon has been observed. The evolution of final carbon yield, fixed
bed height, MWNT weight and formation rate with run duration are given in Fig. 3.
Figure 3
9
We do not believe that the fact to observe low reaction rates in the very early stages of
the reaction is connected with catalyst activation period but rather to a short residence time of
the gas in the catalyst bed. After some minutes, the MWNT formation rate reaches a value of
0.2 gNT/gFe/min. The carbon yield and the CNT formation rate reach a maximum between 45
and 75 min. The relatively low values obtained in terms of yield, 71%, and growth rate,
0.23gCNT/gFe/min, in comparison with our previous results [5] can be rationalized by the fact
that the initial bed mass used in the present study is quite low. Indeed, the objective of the
study was not to optimize carbon yields but rather to analyze the evolution with time of
process parameters. The MWNT weight and the fixed bed height are both increasing with
time. It is worth noting that the catalyst still presents a noticeable activity after 150 min of
run.
A peculiar phenomenon linked to the catalytic growth of MWNT is the impressive
evolution of the fixed bed height with time: starting from 1.8 cm, it reaches 18 cm after 15
min and 69 cm after 150 min. This phenomenon is due to the important evolution of the
powder morphology induced by CNT growth. MWNT form three dimensional randomly
oriented hanks in which alumina particles are embedded. The mean particles size increases
from 110 µm for the original catalyst powder to 225 µm for the composite powder obtained
after 120 min. The apparent density of this composite powder is equal to 134 kg/m3 after 15
min of run, 88 kg/m3 after 30 min and 55-60 kg/m3 beyond this run duration. Similar values
have been reported by Qian et al. [7]. Let us recall that the apparent initial not packed density
of alumina particles is around 1500 kg/m3. In terms of fluidization and process controls, this
marked evolution must be carefully considered since the minimum fluidization velocity is
roughly divided by a factor 6 after 120 min of run; this implies that the fluidization ratio
increases with run duration of this same factor. Contrarily to the density, the BET surface
10
areas of the original catalyst (178 m2/g) and of the composite powder (169 m2/g) are very
similar.
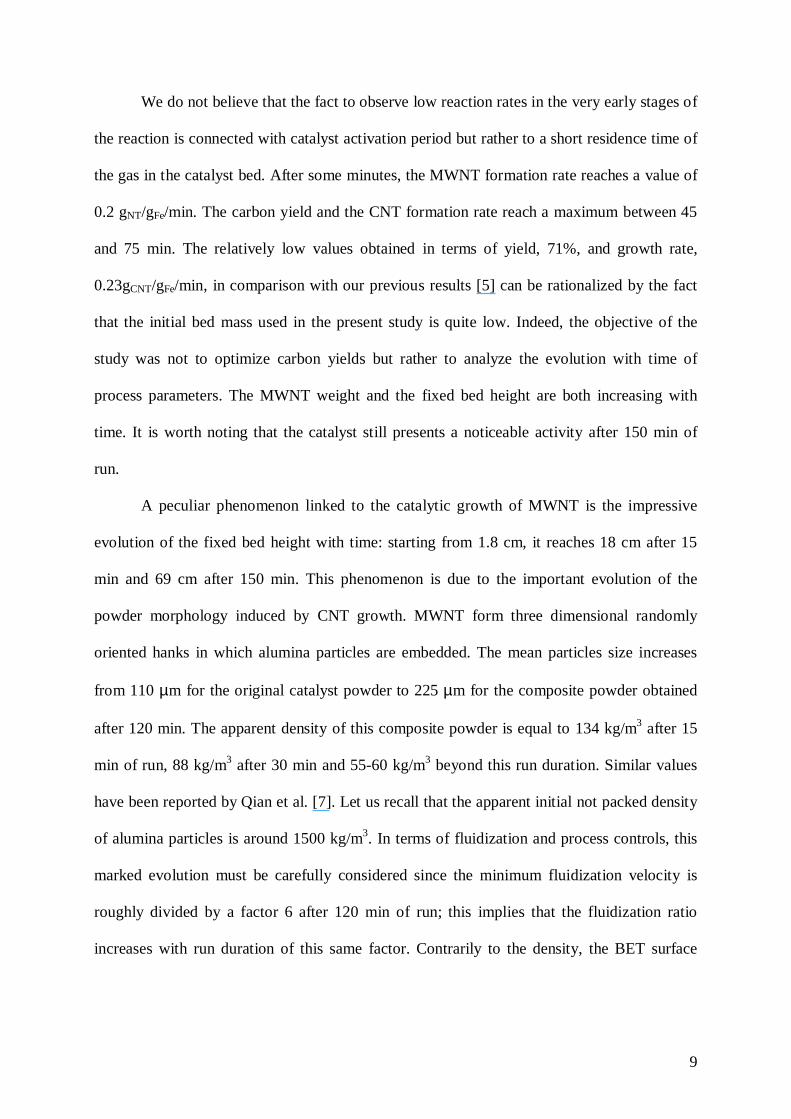
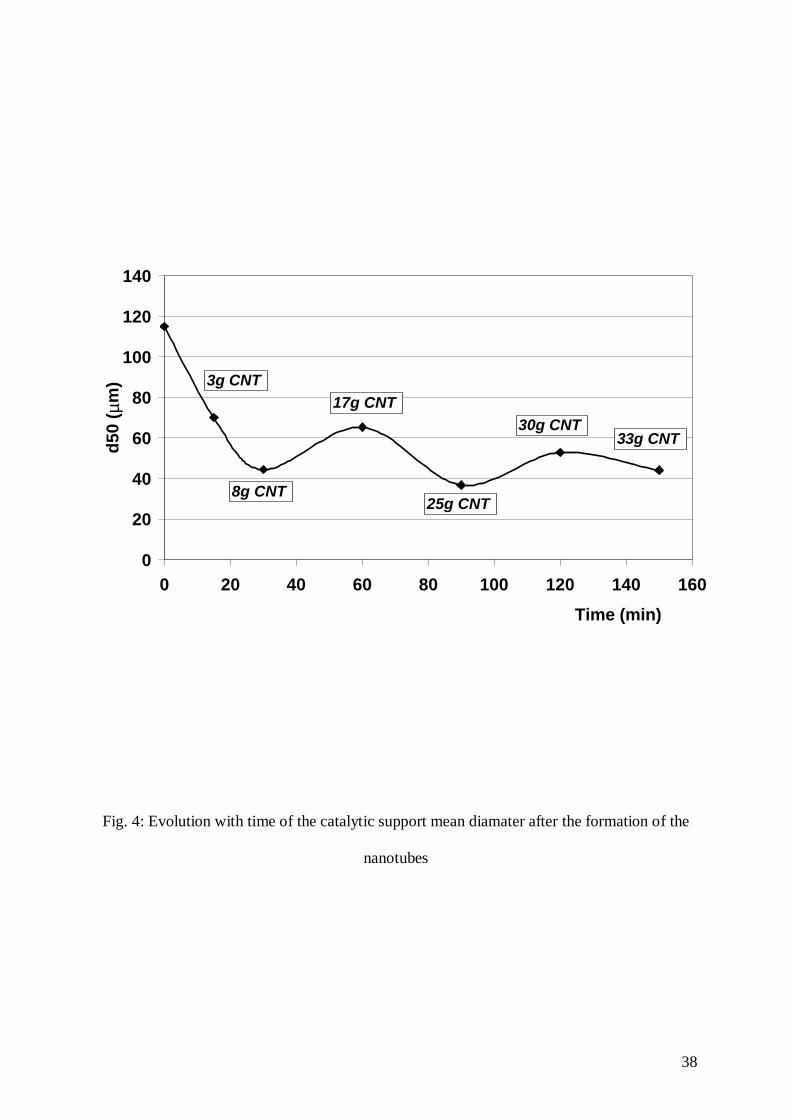
Furthermore, samples corresponding to each of these runs have been heated in air till
800°C so as to burn the MWNT and to collect the support constituted of alumina and
remaining iron. These residues have been analyzed by laser granulometry. The evolution of
the mean particles diameter with run duration is given in Fig. 4. We must add that pure
alumina powder was also heated till 800°C and analyzed by laser granulometry in order to
check that no diameter evolution was produced by this annealing. It can be seen that MWNT
formation leads to a sharp decrease in the alumina mean diameter after 30 min of run, this
diameter remaining stable beyond 30 to 40 min. It can then be deduced that MWNT grow to
some extent into the macro pores of the alumina grains and exert a mechanical pressure
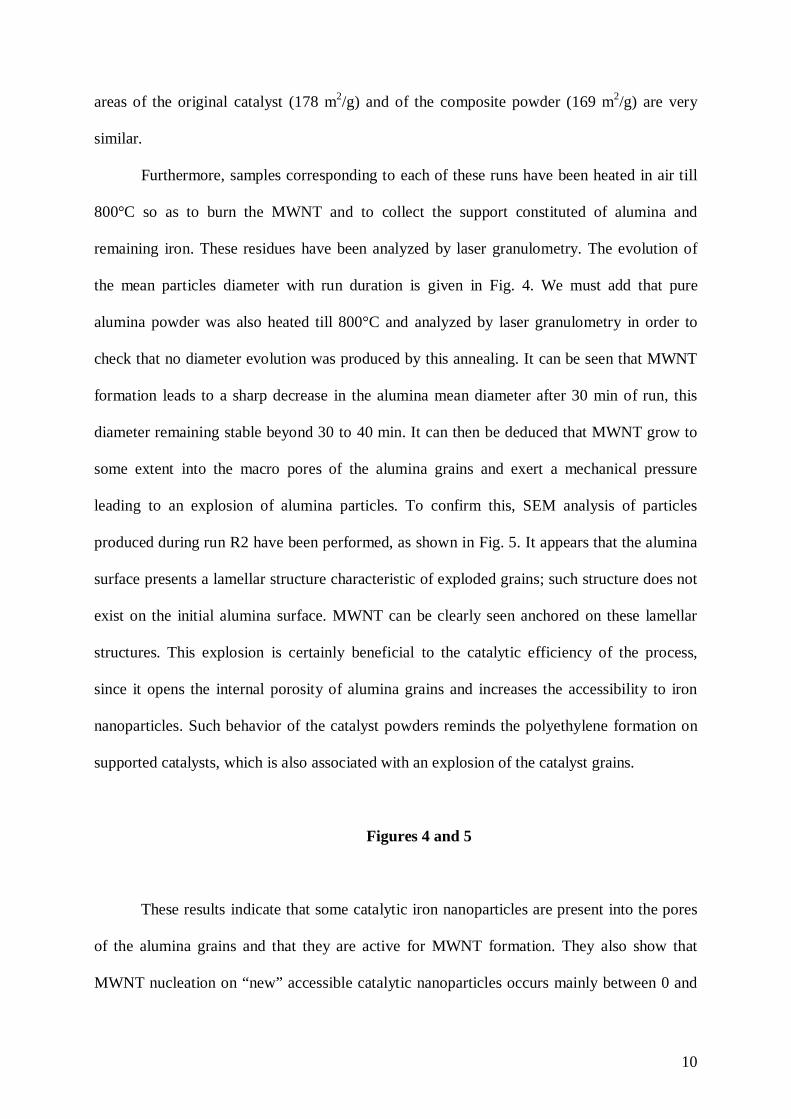
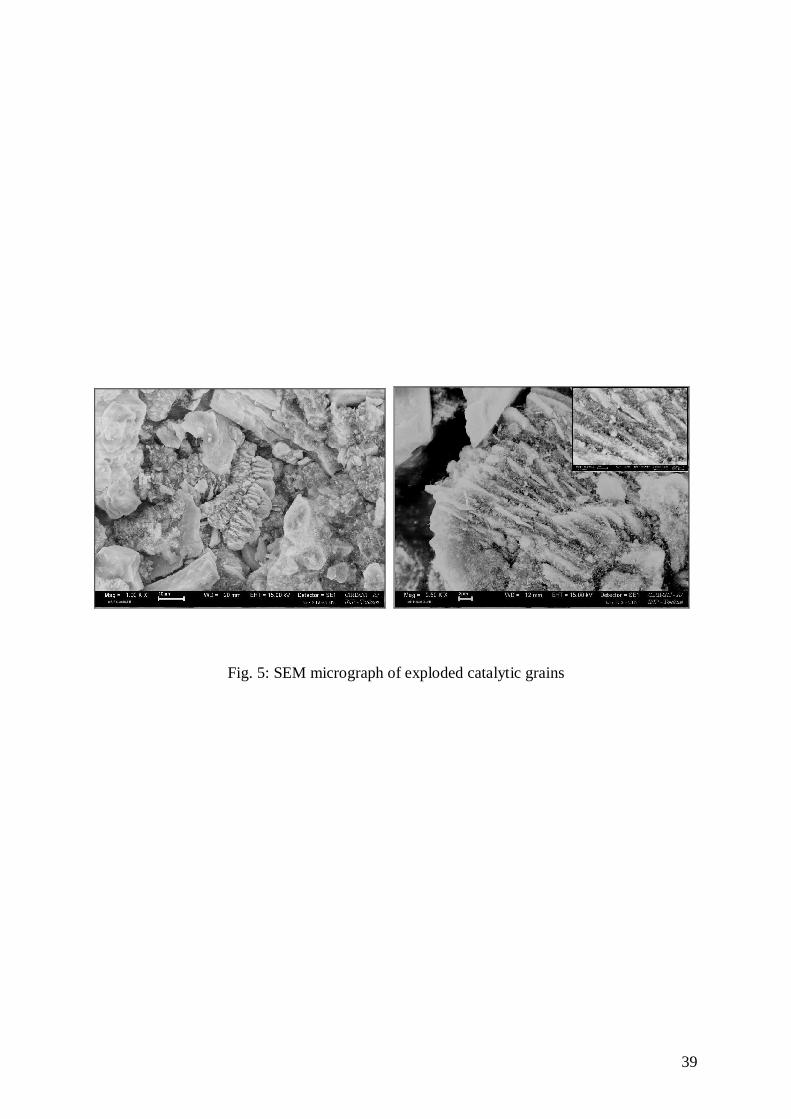
leading to an explosion of alumina particles. To confirm this, SEM analysis of particles
produced during run R2 have been performed, as shown in Fig. 5. It appears that the alumina
surface presents a lamellar structure characteristic of exploded grains; such structure does not
exist on the initial alumina surface. MWNT can be clearly seen anchored on these lamellar
structures. This explosion is certainly beneficial to the catalytic efficiency of the process,
since it opens the internal porosity of alumina grains and increases the accessibility to iron
nanoparticles. Such behavior of the catalyst powders reminds the polyethylene formation on
supported catalysts, which is also associated with an explosion of the catalyst grains.
Figures 4 and 5
These results indicate that some catalytic iron nanoparticles are present into the pores
of the alumina grains and that they are active for MWNT formation. They also show that
MWNT nucleation on “new” accessible catalytic nanoparticles occurs mainly between 0 and
11
30 to 40 min. of run. Beyond this period of time, nucleation becomes more difficult and
growth phenomena prevail. It is likely that the nanoparticles present on the outer surface of
the alumina grains, and then in the macro-pores are the first to be active. A diffusion
limitation should exist that limits the activity of the catalytic sites present into the meso- and
micro-pores. Moreover, the fact that the carbon yield and MWNT formation rate are
maximum between 45 and 75 min means that an intense growth stage of already formed
MWNT occurs during this period. After 75 min, a progressive deactivation of the catalytic
nanoparticles seems to occur, explaining the decrease in carbon yield and MWNT formation
rate.
TEM observations have shown that MWNT of 10-20 nm external diameters and of
micrometric length exist as early as 5 min of run. No induction period was observed for this
process and MWNT nucleation and growth phenomena are very fast. In particular, it can be
deduced from some TEM micrographs that the growing rate of MWNT in the first minutes of
the process could locally reach the value of 10 µm/min. It is worth noting that the Fe/Al2O3
catalyst used in this study is in the reduced state. The amount of MWNT increases with run
duration, forming more and more hanks. Moreover, it seems that the CNT outer diameter does
not change with time, remaining around 17 nm. However, several HREM observations have
been performed which show a decrease in the internal diameter, and hence an increase in the
number of walls from around 5 after 5 min to 15-20 after 150 min. These observation are
consistent with a growth mechanism in which each additional wall (graphene layer) is formed
inside the tube and not on the outer surface. Due to the presence of hanks, the measurement of
MWNT length is very difficult to perform. However, we have estimated that it could range
between 1 µm and several micrometers. Although in the case of aligned nanotubes, a control
of the MWNT length with CVD duration has been reported [19], we were not able to establish
correlation between MWNT length and run duration.
12
3.2 Influence of temperature
The experimental conditions tested correspond to runs R8 to R12 of Table 1. First, no
agglomeration phenomenon has occurred during these runs and pressure drop measurements
have indicated that the bed was always conveniently fluidized.
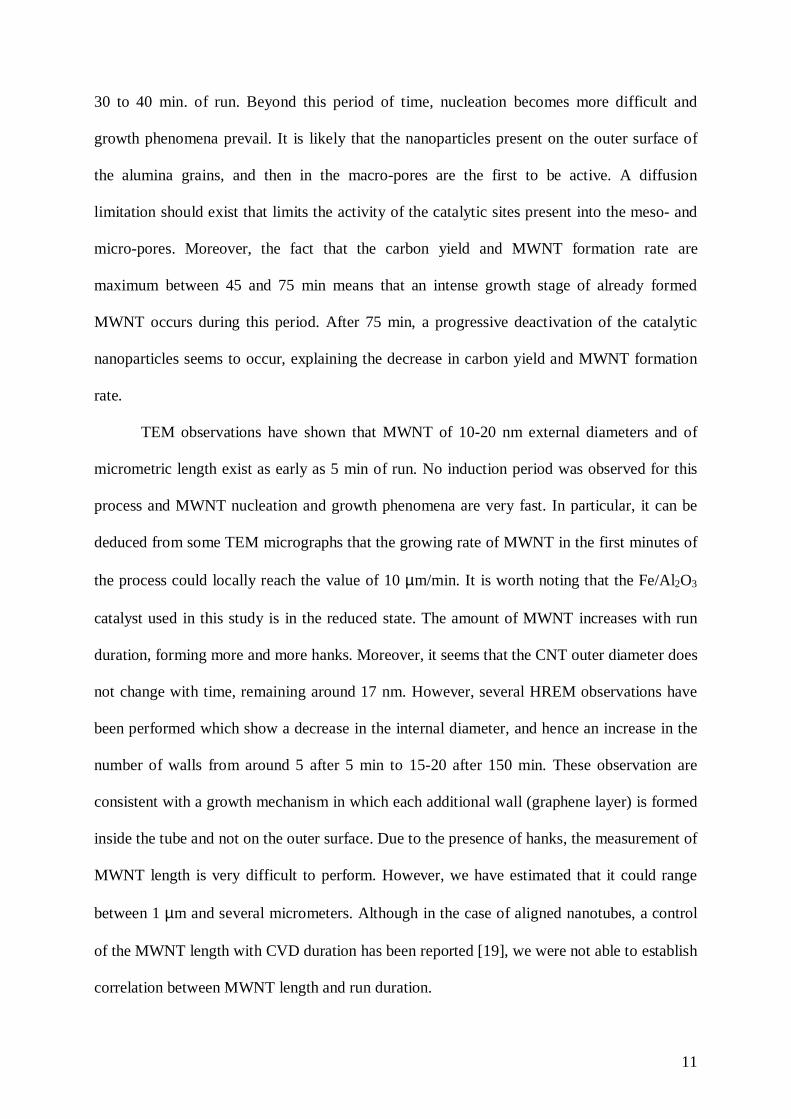
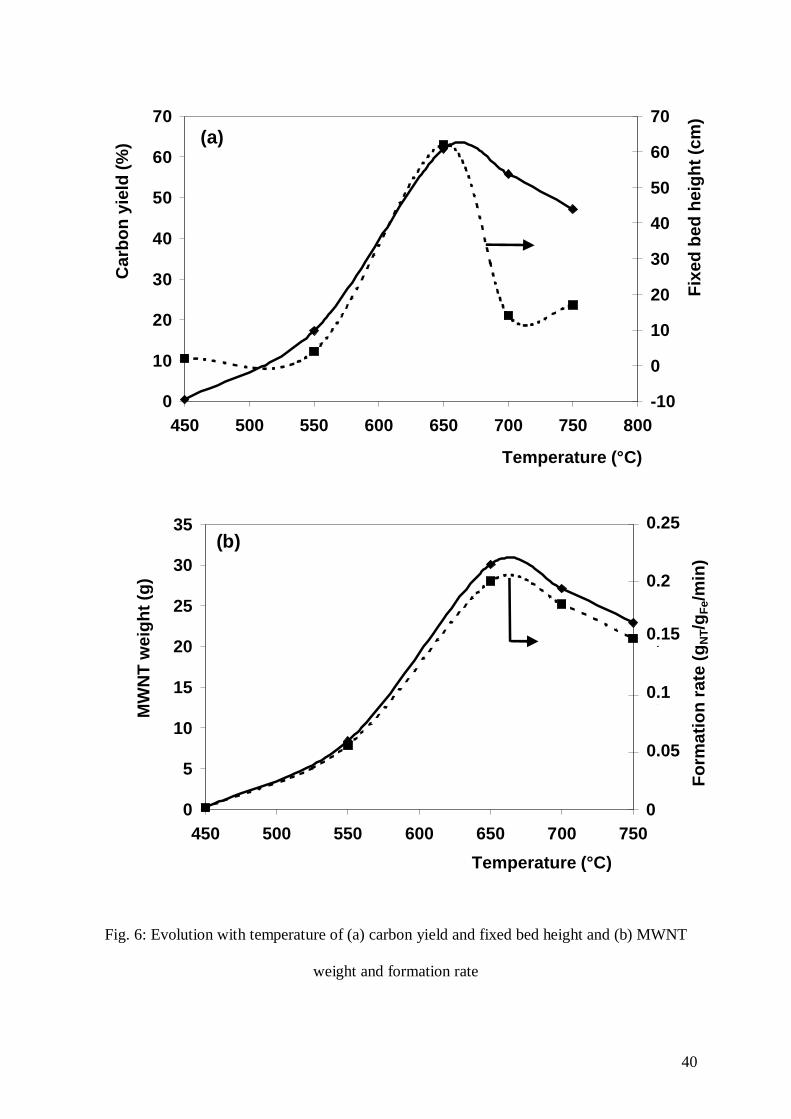
The influence of temperature on carbon yield, final fixed bed height, MWNT weight
and formation rate is presented in Fig. 6. Maximum values of carbon yield, formation rate and
final fixed bed height were reached at 650°C. Below 650°C, the carbon yield is very low,
explaining the very low fixed bed heights and carbon formation rates. Beyond 650°C, some
parasitic phenomena occur, which are responsible for a partial deactivation of the catalyst, as
it will be explained below. The bed apparent density of this composite powder is equal to
1140 kg/m3 at 450°C, 58 kg/m3 at 650°C and 200-250 kg/m3 beyond 650°C. Such a
pronounced evolution of powder morphology with temperature points out the importance of
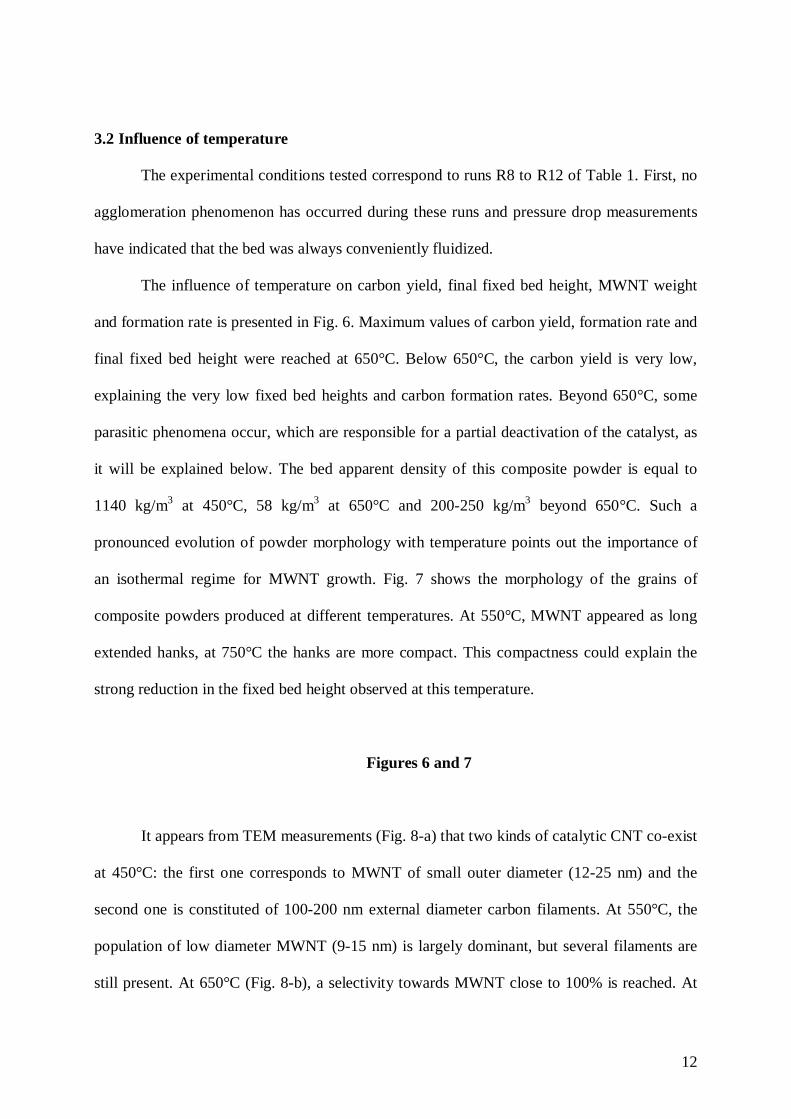
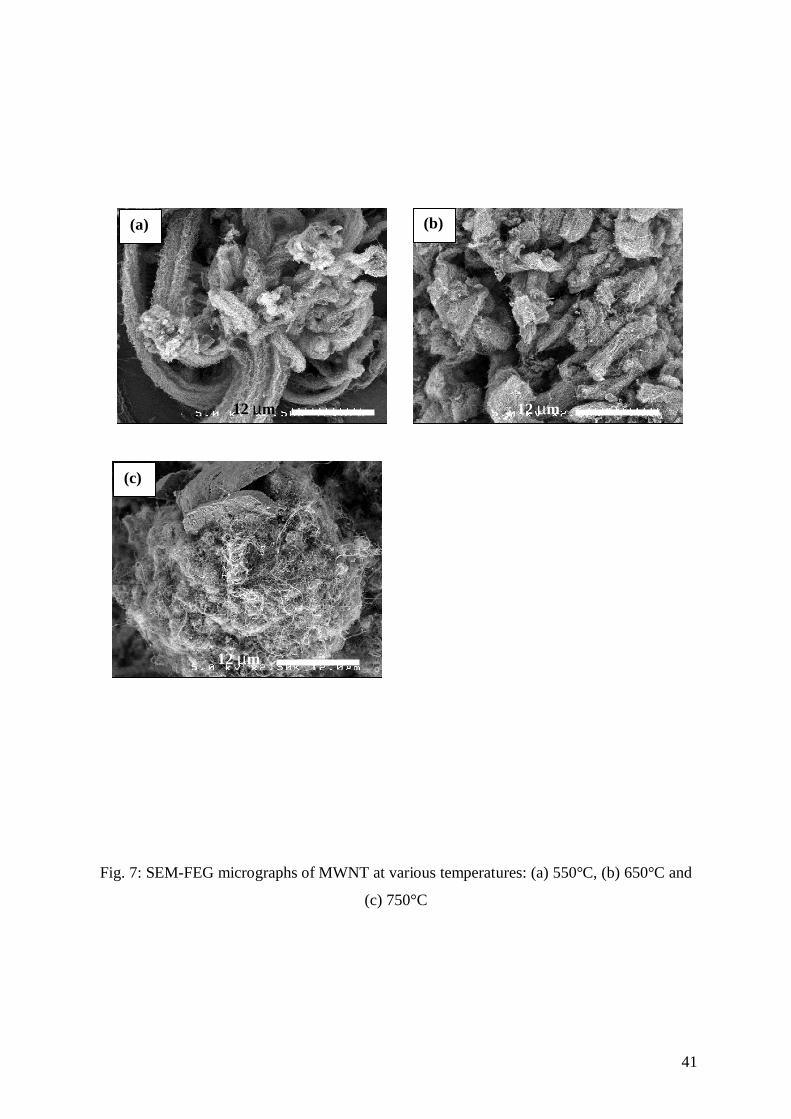
an isothermal regime for MWNT growth. Fig. 7 shows the morphology of the grains of
composite powders produced at different temperatures. At 550°C, MWNT appeared as long
extended hanks, at 750°C the hanks are more compact. This compactness could explain the
strong reduction in the fixed bed height observed at this temperature.
Figures 6 and 7
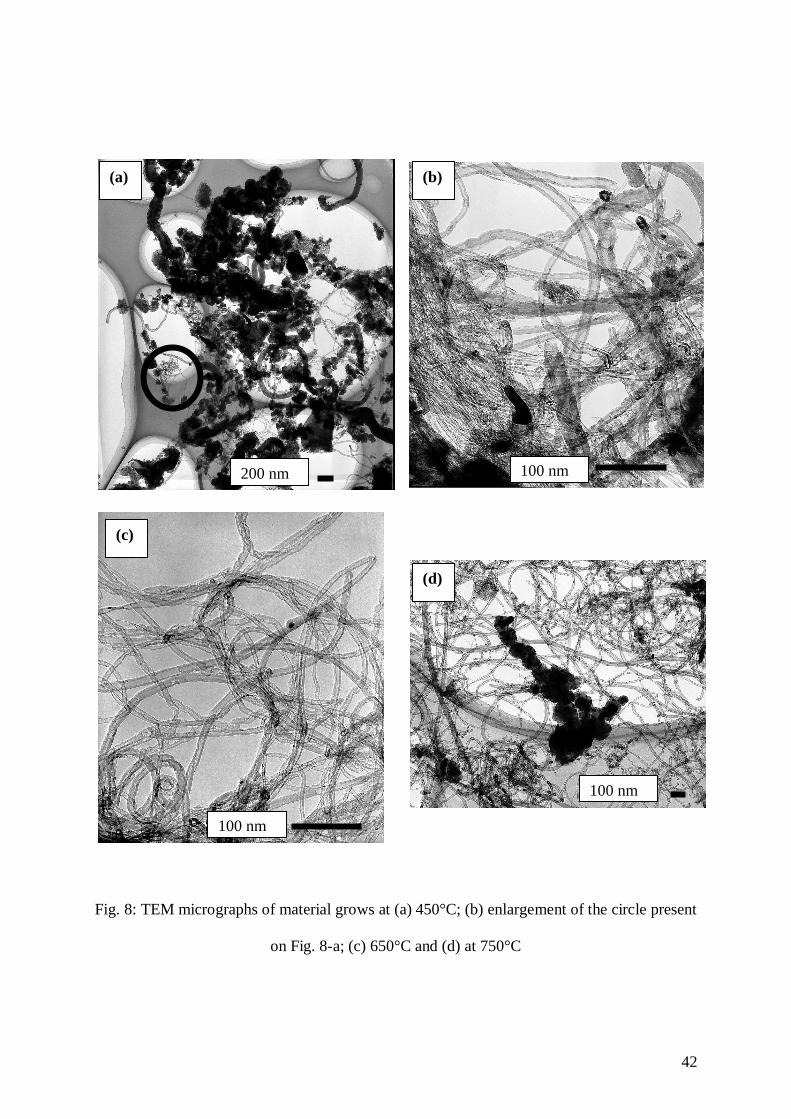
It appears from TEM measurements (Fig. 8-a) that two kinds of catalytic CNT co-exist
at 450°C: the first one corresponds to MWNT of small outer diameter (12-25 nm) and the
second one is constituted of 100-200 nm external diameter carbon filaments. At 550°C, the
population of low diameter MWNT (9-15 nm) is largely dominant, but several filaments are
still present. At 650°C (Fig. 8-b), a selectivity towards MWNT close to 100% is reached. At
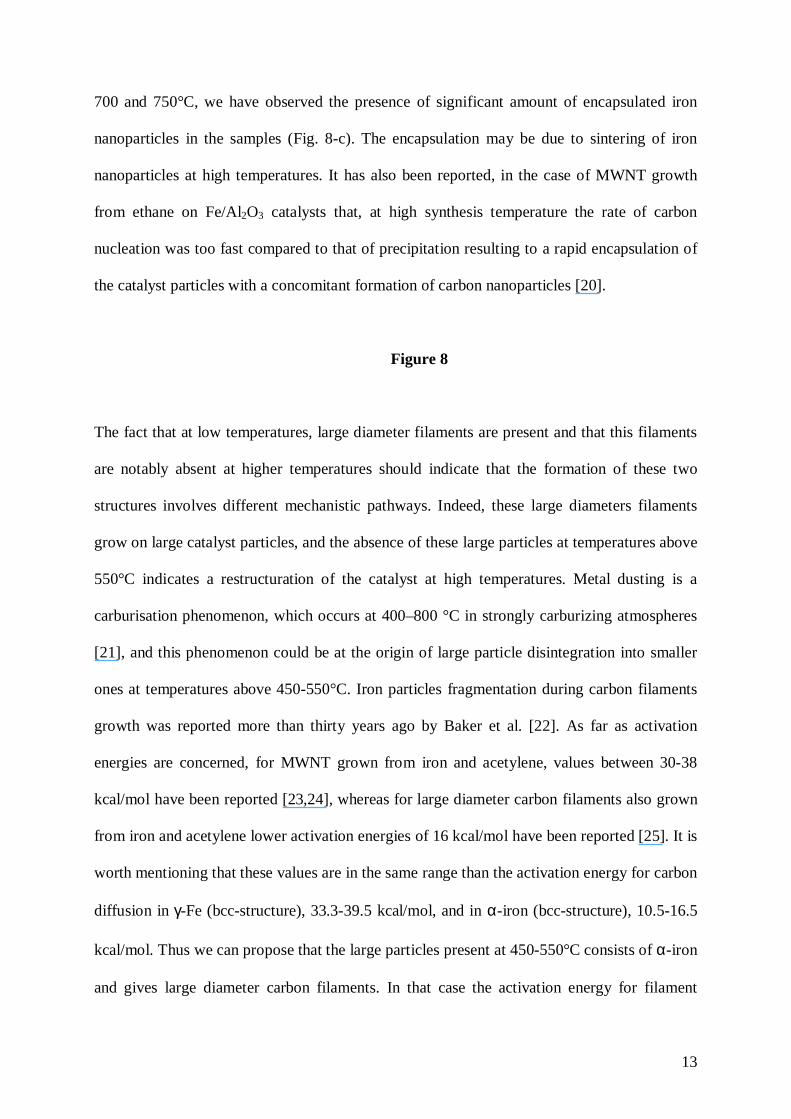
13
700 and 750°C, we have observed the presence of significant amount of encapsulated iron
nanoparticles in the samples (Fig. 8-c). The encapsulation may be due to sintering of iron
nanoparticles at high temperatures. It has also been reported, in the case of MWNT growth
from ethane on Fe/Al2O3 catalysts that, at high synthesis temperature the rate of carbon
nucleation was too fast compared to that of precipitation resulting to a rapid encapsulation of
the catalyst particles with a concomitant formation of carbon nanoparticles [20].
Figure 8
The fact that at low temperatures, large diameter filaments are present and that this filaments
are notably absent at higher temperatures should indicate that the formation of these two
structures involves different mechanistic pathways. Indeed, these large diameters filaments
grow on large catalyst particles, and the absence of these large particles at temperatures above
550°C indicates a restructuration of the catalyst at high temperatures. Metal dusting is a
carburisation phenomenon, which occurs at 400–800 °C in strongly carburizing atmospheres
[21], and this phenomenon could be at the origin of large particle disintegration into smaller
ones at temperatures above 450-550°C. Iron particles fragmentation during carbon filaments
growth was reported more than thirty years ago by Baker et al. [22]. As far as activation
energies are concerned, for MWNT grown from iron and acetylene, values between 30-38
kcal/mol have been reported [23,24], whereas for large diameter carbon filaments also grown
from iron and acetylene lower activation energies of 16 kcal/mol have been reported [25]. It is
worth mentioning that these values are in the same range than the activation energy for carbon
diffusion in γ-Fe (bcc-structure), 33.3-39.5 kcal/mol, and in α-iron (bcc-structure), 10.5-16.5
kcal/mol. Thus we can propose that the large particles present at 450-550°C consists of α-iron
and gives large diameter carbon filaments. In that case the activation energy for filament
14
growth fits well with the activation energy for carbon diffusion in α-iron. For small size
nanoparticles (the diameter of nanoparticles present inside the MWNT ranged between 4 and
8 nm), either present at 450°C or produce by metal dusting at higher temperatures, it is
possible that the transition of α- to γ-iron occurs at lower temperature than in the iron-carbon
system (723°C). On these small size nanoparticles, activation energy for MWNT growth fits
well with the activation energy for carbon diffusion in γ-iron. The presence of γ-iron
nanoparticles in have been recently reported [26-28] and size effects on the properties of
nanomaterials, including size driven phase transition is a subject of growing interest [29,30].
Furthermore, below 550°C the temperature seems insufficient to allow a suitable
decomposition of ethylene.
There also, samples corresponding to each run have been heated in air till 800°C so as
to burn all carbon species, and the mean diameter of the resulting support has been measured
by laser granulometry. The average diameter is equal to 108 µm at 450°C, it reaches 50-55
µm beyond 550°C whereas the average diameter of the catalytic support is of 110 µm. We
confirm that the explosion of alumina grains must be related to the formation of MWNT since
this phenomenon remains very limited at 450°C and presents an equivalent intensity beyond
this value. So at 450°C, only the iron nanoparticles located on the external part of the alumina
grains are active for catalytic carbon deposition.
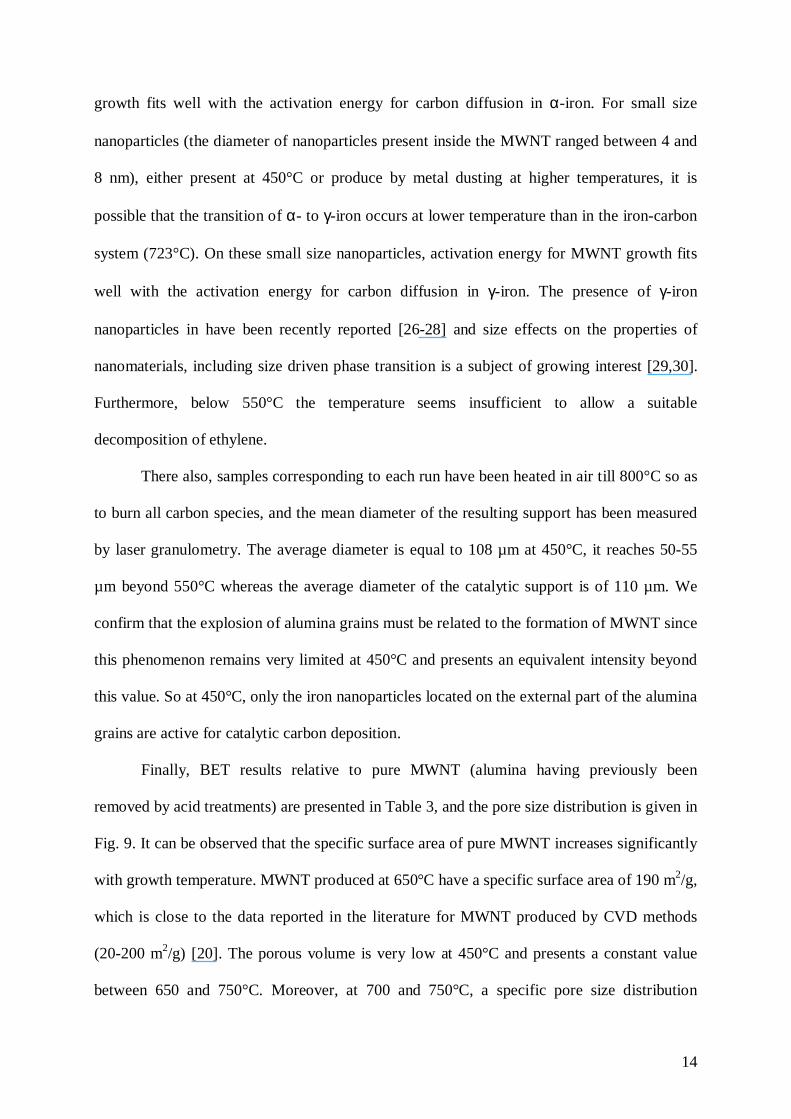
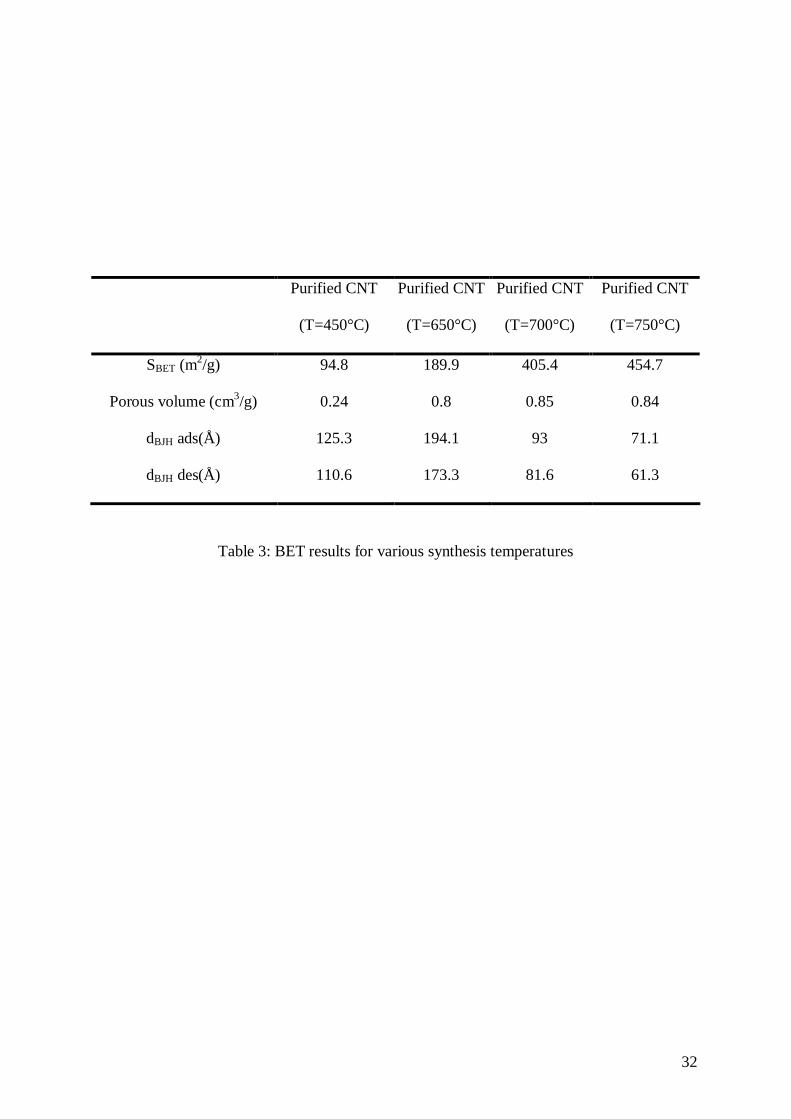
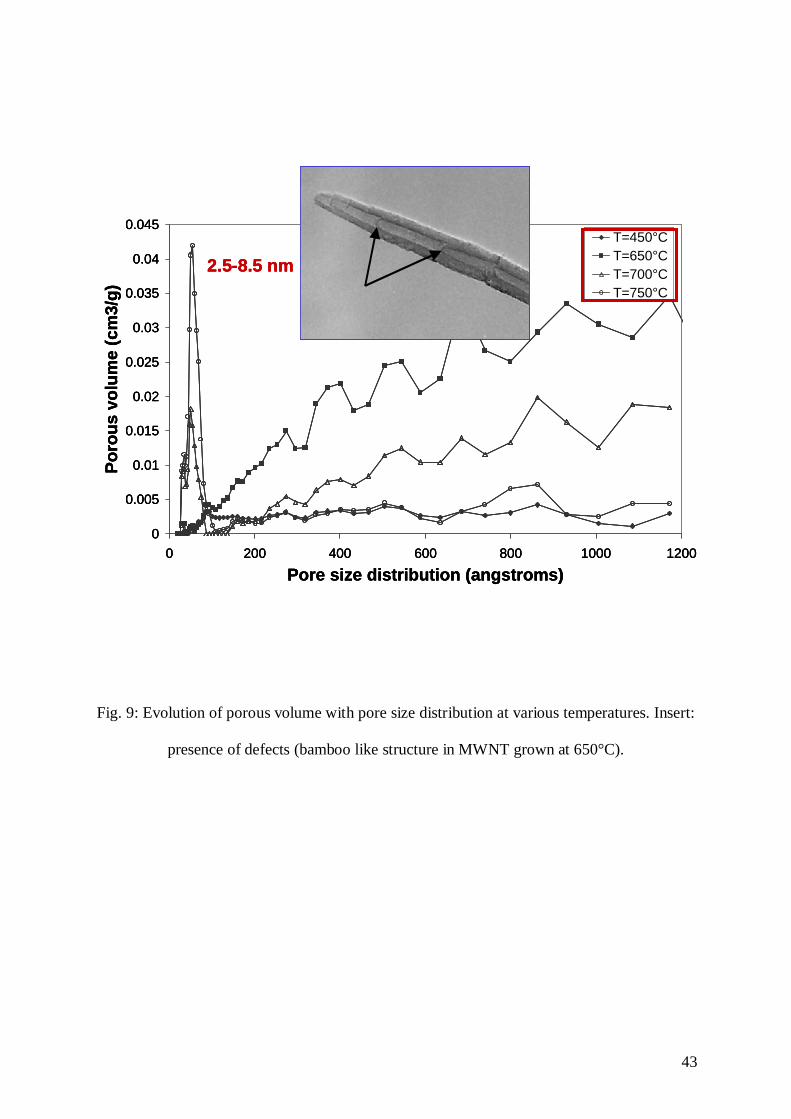
Finally, BET results relative to pure MWNT (alumina having previously been
removed by acid treatments) are presented in Table 3, and the pore size distribution is given in
Fig. 9. It can be observed that the specific surface area of pure MWNT increases significantly
with growth temperature. MWNT produced at 650°C have a specific surface area of 190 m2/g,
which is close to the data reported in the literature for MWNT produced by CVD methods
(20-200 m2/g) [20]. The porous volume is very low at 450°C and presents a constant value
between 650 and 750°C. Moreover, at 700 and 750°C, a specific pore size distribution
15
appears, centered between 2.5 and 8.5 nm, in good agreement with the internal MWNT
diameter. This trend is confirmed regarding the BJH adsorption and desorption diameters.
These results mean that for temperature lower than 700°C, only the external porosity of
MWNT is accessible, that means mainly the aggregated pores formed by the interaction of
isolated MWNT. Recent results concerning benzene adsorption in MWNT have confirmed
that the adsorption between the tubes is a very important effect [31]. Thus, for MWNT
produced at 700 and 750°C, the internal porosity becomes accessible, thus leading to
increased specific surface areas. This could mean that at these temperatures, MWNT present
less structural defects, and in particular less graphene layers perpendicular to the nanotubes
axis (bamboo like structure, see insert in Fig. 9). Various growth model for bamboo-like CNT
(presence of compartments) have been proposed [32-35], based on different physico-chemical
phenomena, including: i) cyclic changes of carbon supersaturation in the catalyst particle, ii)
periodical melting of the catalyst particle or iii) differences in catalyst particle moving rate
inside the MWNT and carbon growth rate. It is reasonably to assume that an increase in
temperature growth may induces differences in the growth mechanism which will result in the
formation of completely hollow structures. It is worth noting that the high surface area (454
m2/g) measured for MWNT grown at 750°C makes this material interesting for several key
applications.
Table 3 and Figure 9
3.3. Influence of the total gas flow rate
The influence of the initial fluidization ratio U/Umf has been studied by modifying in
equivalent proportion the three gas flow rates and run duration, so as to work with a constant
amount of carbon introduced. For all these runs, the H2/C2H4 gaseous ratio has been kept
16
equal to the nominal value 75/25. These experiments, for which the initial fluidization ratio
has been varied between 0.6 and 1.1 and the run duration between 107 and 192 min,
correspond to R13 to R16 of Table 2.
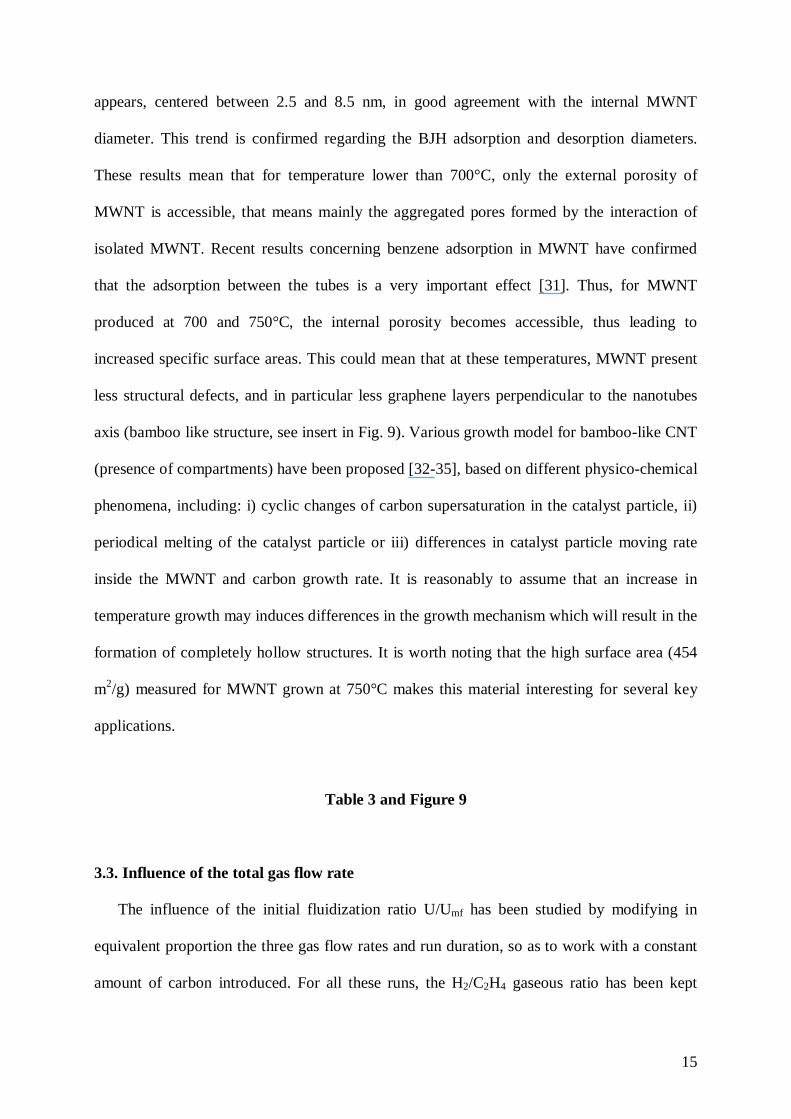
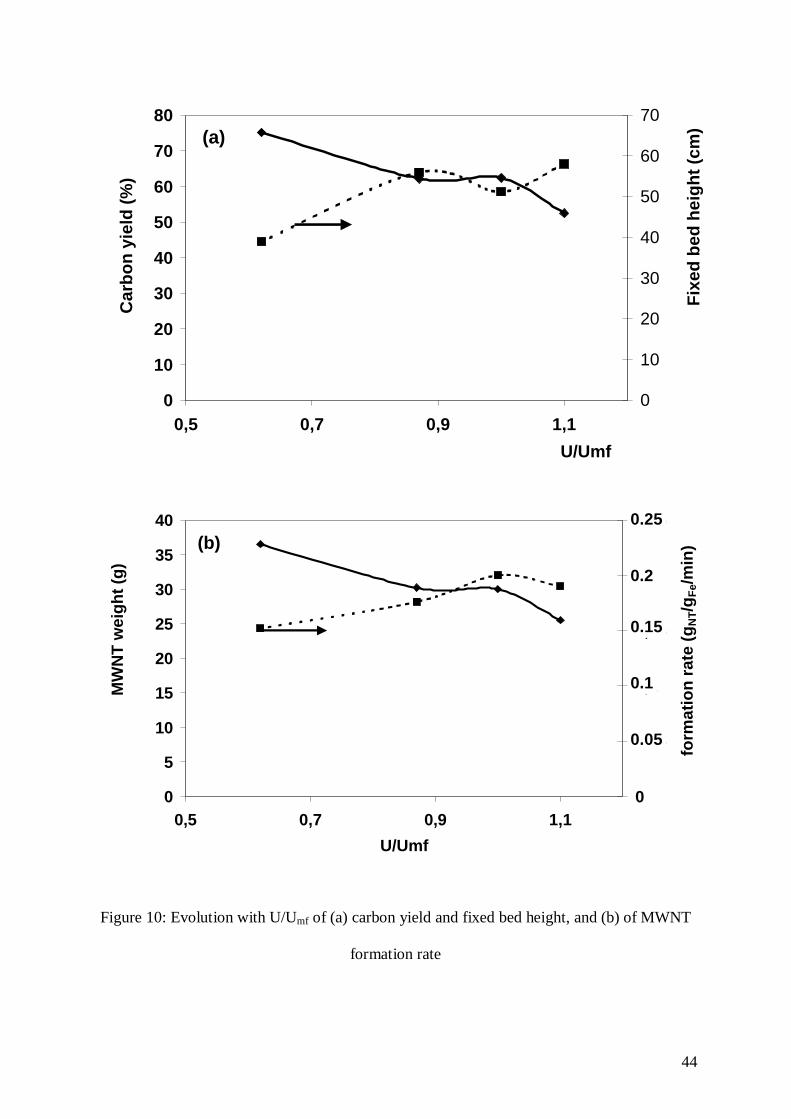
The evolution of carbon yield, fixed bed height and MWNT formation rate with the initial
U/Umf ratio are given in Fig. 10. It appears that the carbon yield tends to increase when the
U/Umf ratio decreases for a similar amount of carbon introduced, certainly due to the fact that
the residence time of the gaseous precursors into the bed increases. The results obtained for
U/Umf = 1 and 0.87 are very similar, indicating that for this range of total gas flow rates, the
process in this 5.3 cm reactor reaches some optimum conditions of run in terms of fluidization
quality as in terms of MWNT formation.
Figure 10
It is worth noting that the fluidized bed was partly agglomerated during run R16, i.e for
U/Umf equal to 0.62, which may have disturbed the results. We have already shown that
MWNT formation produces 3D randomly oriented hanks mostly surrounding alumina
particles. We have also observed that the mean diameter of alumina particles decreases when
MWNT form. These two phenomena produce a bed of light particles whose fluidizability
decreases with the amount of MWNT formed. Consequently, it is obvious that the lower the
fluidization ratio, the less vigorous the mixing of powders due to gas flow will be, and the
more important is the risk of agglomeration due to MWNT formation. Combined with an
increased carbon conversion due to a higher residence time, this initial U/Umf ratio equal to
0.62 seems to be the low limit in terms of total gas flow for the tested operating conditions in
this equipment. Thus, this agglomeration phenomenon has certainly lowered the results
obtained for run R16 in terms of carbon conversion and MWNT formation growth rate. It is
17
likely that in a fluidized bed reactor of higher diameter, with less wall effects, such
agglomeration phenomena would not occur because the intrinsic fluidization quality would be
better.
On the contrary, the MWNT formation rate tends to decrease with the fluidization ratio.
For this series of experiments, the run duration is increased when the fluidization ratio is
decreased. As we have seen that MWNT growth is important between 45 and 75 min of run, it
is logic that longer experiments (here till 192 min) induce lower mean deposition rates.
The apparent densities of the final fixed bed of composite powder remain in the same
order of magnitude than those previously measured, i.e. 60 kg/m3. The density obtained for
run R16 is higher (100 kg/m3), because agglomeration phenomena have occurred during this
run, producing denser blocks of composite powders.
Finally, the granulometry analysis of the catalyst, once the MWNT have been burnt, has
revealed no influence of the fluidization ratio on the final mean diameter of alumina grains.
The values obtained are comprised between 35 and 55 microns. This result confirms that for
run durations greater than 40 min, the explosion of alumina grains due to MWNT formation is
no more occurring and reaches a plateau corresponding to catalysts particles of 40-50
microns. No significant difference in MWNT morphology between the samples was noticed
by TEM.
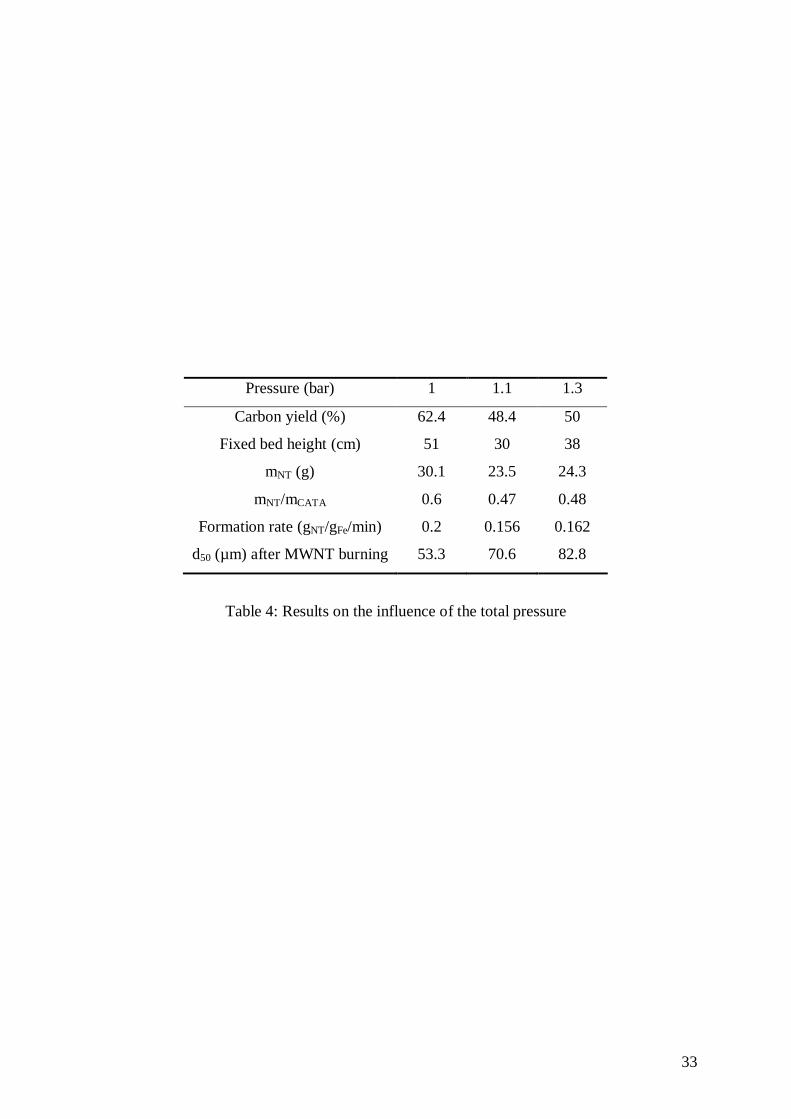
3.4. Influence of the total pressure
This study was performed for the nominal values of gas flow rates of run R14, and for a
run duration of 120 minutes. The total pressure into the reactor was varied between 1 and 1.3
bar. The exact operating conditions tested correspond to runs R14, R17 and R18 of Table 2. It
is worth noting that this increase in total pressure has lead to an enhancement of the gaseous
residence time into the bed since the fluidization ratio has been equal to 0.9 for run R17 and to
18
0.77 for run R18. Additionally, the partial pressure of ethylene has been increased with this
total pressure enhancement. The corresponding experimental results are given in Table 4.
Table 4
It clearly appears that an increase in the total pressure does not bring any advantage: the
carbon yield, MWNT weight and MWNT formation rate are lower when the total pressure is
increased, despite the concomitant enhancements of gas residence time and ethylene partial
pressure. Formation of agglomerates was observed during run R18, certainly due to a too low
fluidization ratio and this may have distorted results. But this negative influence of the total
pressure could be explained by the fact that the limiting step of the process corresponds to
mass diffusion into the meso- and micro-pores of our alumina grains or through the product
nanotube mat that covers the catalyst.
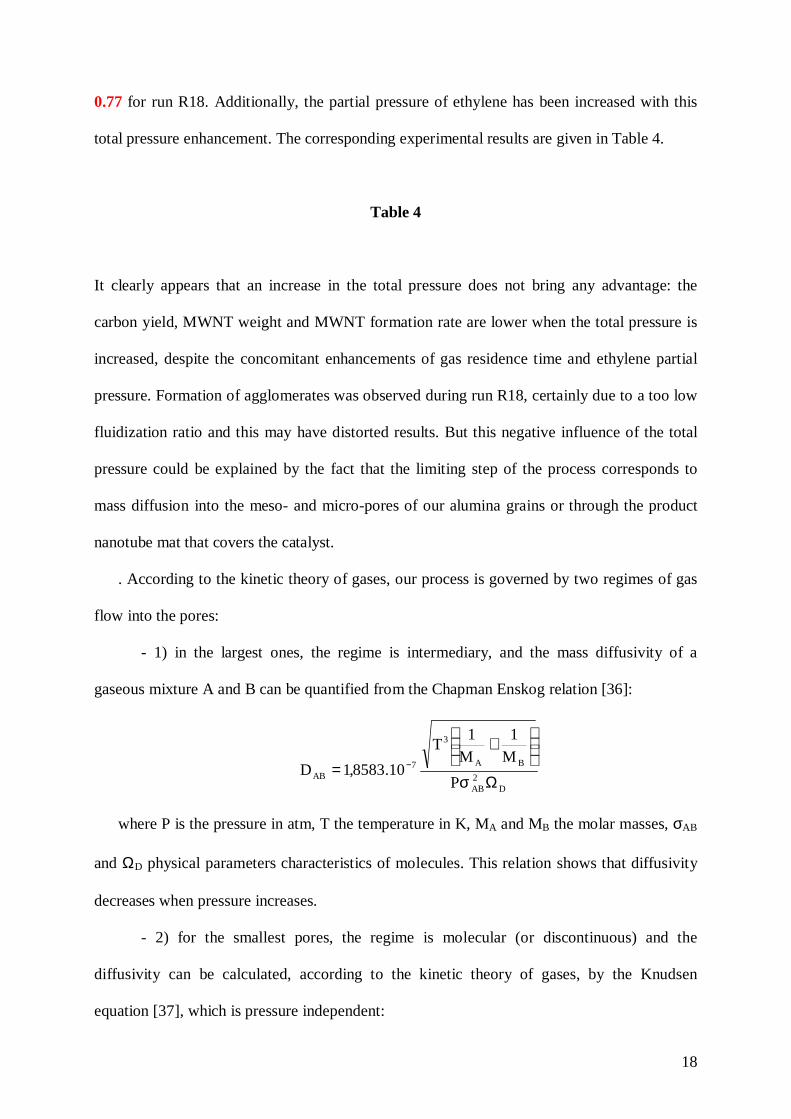
. According to the kinetic theory of gases, our process is governed by two regimes of gas
flow into the pores:
- 1) in the largest ones, the regime is intermediary, and the mass diffusivity of a
gaseous mixture A and B can be quantified from the Chapman Enskog relation [36]:
D2AB
BA
3
7AB P
M1
M1T
10.8583,1DΩ
+
= −
σ
where P is the pressure in atm, T the temperature in K, MA and MB the molar masses, σAB
and ΩD physical parameters characteristics of molecules. This relation shows that diffusivity
decreases when pressure increases.
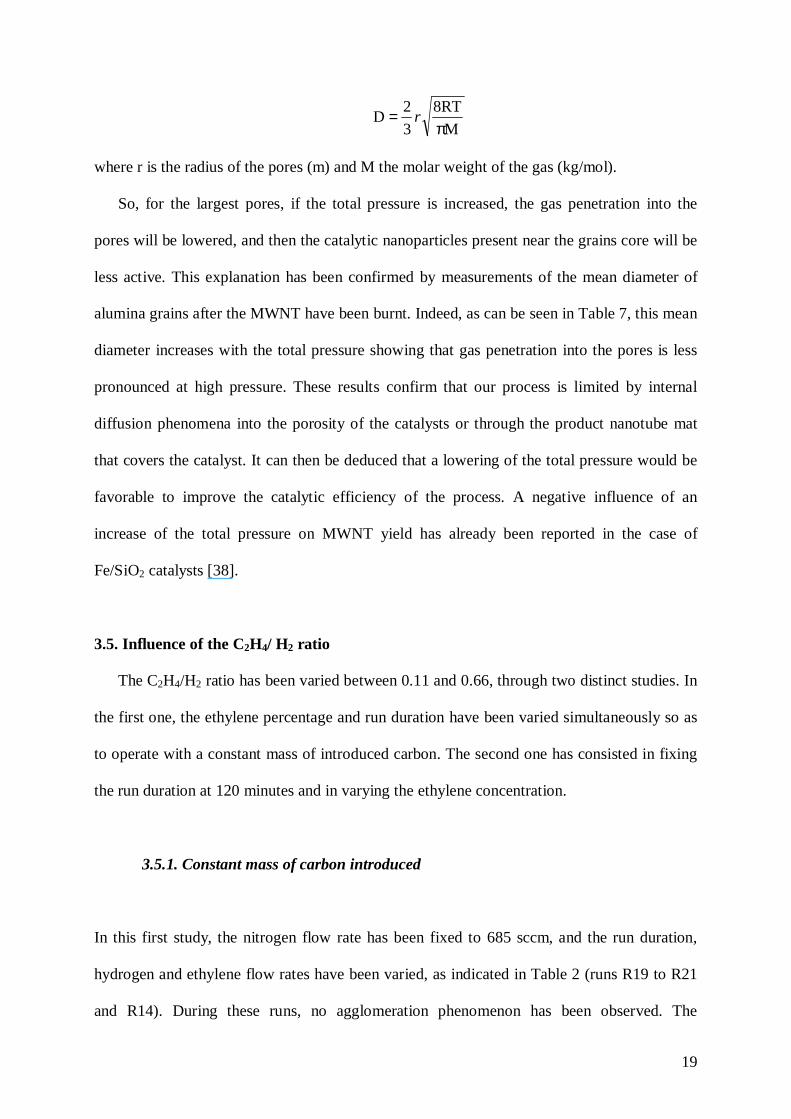
- 2) for the smallest pores, the regime is molecular (or discontinuous) and the
diffusivity can be calculated, according to the kinetic theory of gases, by the Knudsen
equation [37], which is pressure independent:
19
MRT8
32D
πr=
where r is the radius of the pores (m) and M the molar weight of the gas (kg/mol).
So, for the largest pores, if the total pressure is increased, the gas penetration into the
pores will be lowered, and then the catalytic nanoparticles present near the grains core will be
less active. This explanation has been confirmed by measurements of the mean diameter of
alumina grains after the MWNT have been burnt. Indeed, as can be seen in Table 7, this mean
diameter increases with the total pressure showing that gas penetration into the pores is less
pronounced at high pressure. These results confirm that our process is limited by internal
diffusion phenomena into the porosity of the catalysts or through the product nanotube mat
that covers the catalyst. It can then be deduced that a lowering of the total pressure would be
favorable to improve the catalytic efficiency of the process. A negative influence of an
increase of the total pressure on MWNT yield has already been reported in the case of
Fe/SiO2 catalysts [38].
3.5. Influence of the C2H4/ H2 ratio
The C2H4/H2 ratio has been varied between 0.11 and 0.66, through two distinct studies. In
the first one, the ethylene percentage and run duration have been varied simultaneously so as
to operate with a constant mass of introduced carbon. The second one has consisted in fixing
the run duration at 120 minutes and in varying the ethylene concentration.
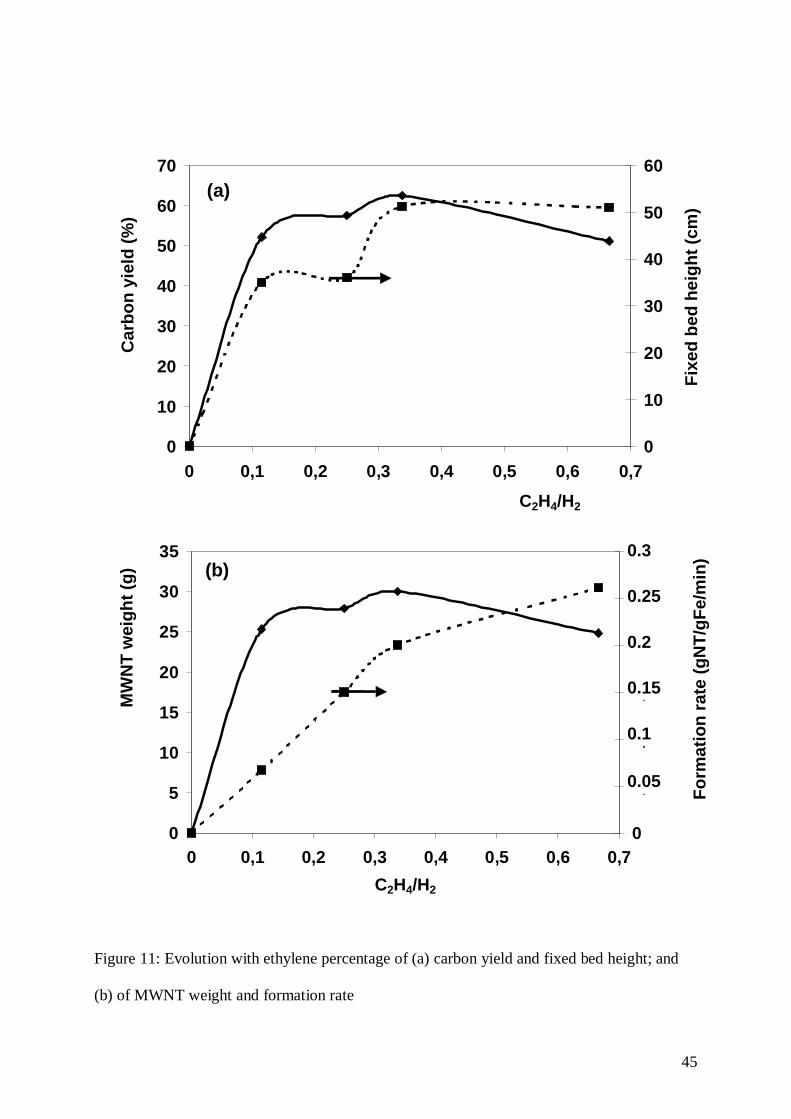
3.5.1. Constant mass of carbon introduced
In this first study, the nitrogen flow rate has been fixed to 685 sccm, and the run duration,
hydrogen and ethylene flow rates have been varied, as indicated in Table 2 (runs R19 to R21
and R14). During these runs, no agglomeration phenomenon has been observed. The
20
evolutions of carbon yield, final fixed bed height, MWNT formation rate and weight with the
ethylene percentage are presented in Fig. 11.
Figure 11
It can be observed that the carbon yield presents an optimum value for 25% of
ethylene, the lowest values being obtained for 11 and 66%. The weight of MWNT increases
with the ethylene percentage till 25% and becomes lower at 66% than at 10%. On the
opposite, the MWNT formation rate linearly increases with ethylene concentration. This
important result indicates that the corresponding kinetic law is positive order dependant of the
ethylene partial pressure. It also shows that an increase in the ethylene partial pressure allows
an enhancement of the MWNT formation rate without deactivation of the catalyst and without
loss in selectivity. The final fixed bed height is around 35 cm at 10 and 20% of ethylene and
exceeds 50 cm at 25 and 66%. These values result in apparent bed densities around 97 kg/m3
at 10-20%, 61 kg/m3 at 25% and 66 kg/m3 at 66%. So the more important the ethylene
percentage is, the slighter is the density of the final bed till 25% of ethylene. The important
value at 66% could explain the poor results obtained in terms of carbon yield and MWNT
weight for run R21: they could be attributed to poor fluidization conditions and even to a
beginning of partial bed agglomeration, induced by the important MWNT formation rate. The
measurement of the granulometry distribution of alumina grains after the burning of MWNT
has conducted to mean diameters close to 35-45 microns whatever the ethylene percentage.
So, the explosion of catalytic grains due to MWNT formation is identical for all the ethylene
percentages tested. Combined with the previous result, this could indicate that the hanks of
MWNT are more numerous or MWNT are longer for the highest percentages of ethylene, i.e.
21
for the highest MWNT formation rates. Systematic TEM measurements have shown no
influence of this parameter on the general morphology of MWNT.
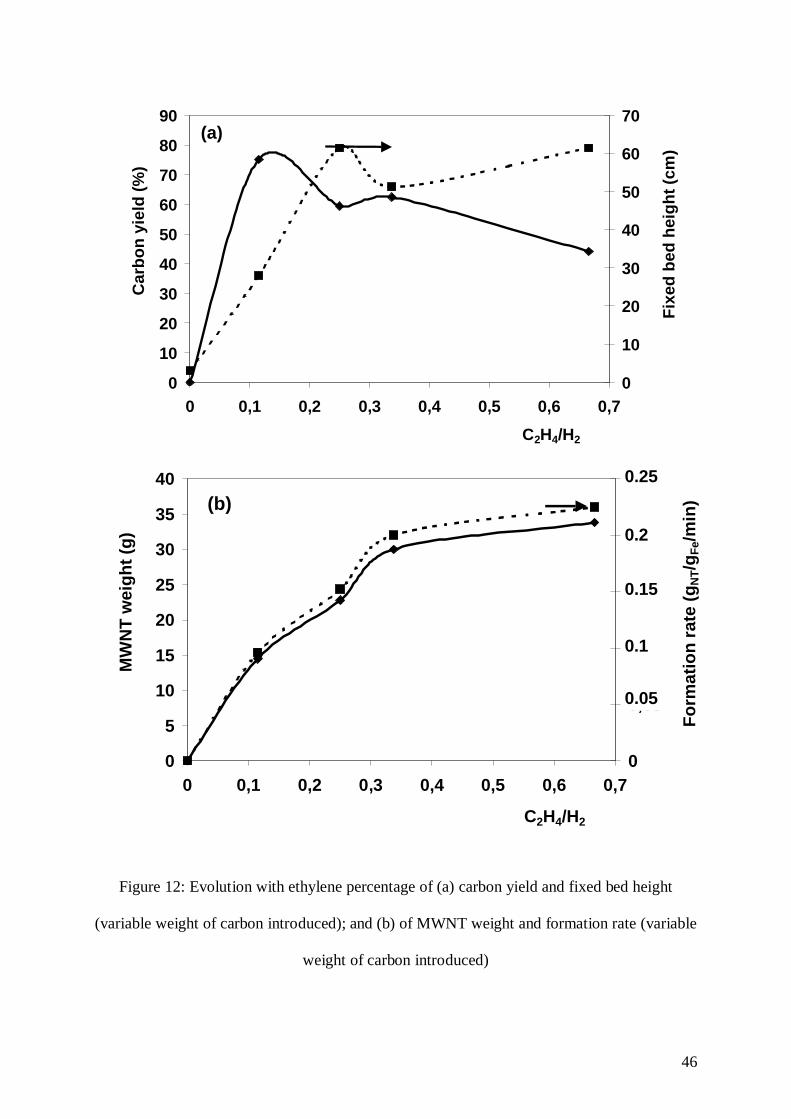
3.5.2. Variable mass of carbon introduced
These experiments correspond to runs R22 to R24 and R14 of table 2. The carbon
yield, the fixed bed height evolution, the MWNT formation rate and weight as a function of
the ethylene percentage are given in Figure 12. It is worth noting that a partial agglomeration
of the bed has occurred during run R23 (66% of ethylene), which may have distorted the
corresponding results.
Figure 12
It appears that carbon yield tends to decrease when ethylene partial pressure increases.
This result seems logical since for an equivalent residence time of precursors into the bed and
similar operating conditions, the carbon conversion will be higher for the lowest ethylene
percentage. On the contrary, MWNT formation rate linearly increases with this ethylene
percentage (except for the peculiar run R23). The CNT final weight logically presents a
similar evolution. These results confirm that the kinetic law governing MWNT formation is
positive order dependant on the ethylene partial pressure.
The final fixed bed height tends to increase with ethylene partial pressure. The bed density
is comprised between 54 and 61 kg/m3 for runs R23, R24 and R14 and is equal to 104 kg/m3
for 11% of ethylene (run R22), due to the lower amount of MWNT formed. The measurement
of granulometry distribution of alumina grains after the burning of MWNT has conducted to
mean diameters close to 40-60 microns whatever the ethylene percentage. So the explosion of
22
catalytic grains due to MWNT formation is identical for all the ethylene percentages tested.
There also, systematic TEM measurements have revealed no influence of the ethylene
percentage on the general morphology of MWNT.
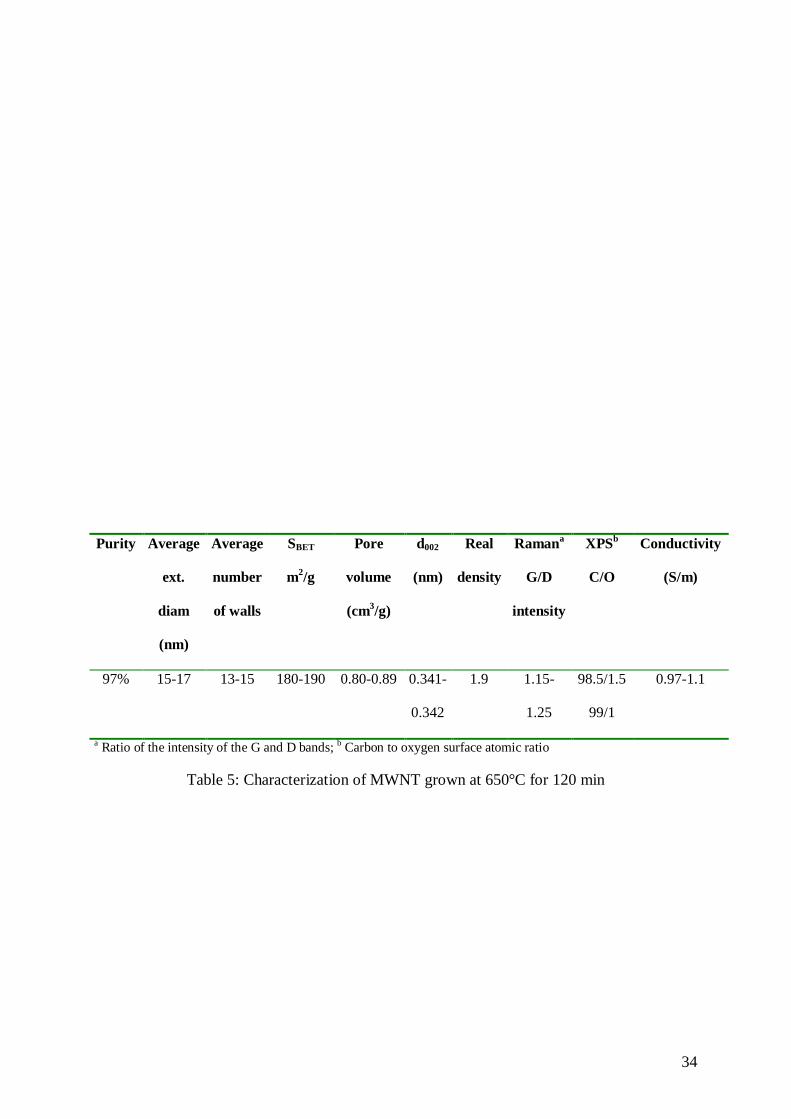
3.6. Product characterization
An important aspect that should be taken into account when producing CNT on a large
scale is the batch to batch reproducibility, and ability to supply consistent quality is becoming
more of a challenge than mere quantity. Thus, we have taken care to characterize MWNT
from three different batches grown at 650°C during 120 min (Table 5). As far as the purity of
the as-produced material is concerned, analyses were performed by coupling TGA and TEM
observations [5]: a selectivity towards MWNT formation close to 100% was measured. It
could also be deducted from TGA analysis coupled with SEM/EDX analysis of the residue
obtained after reacting the composite powders with air at 1000°C, that 3% of metal remains
inside the MWNT produced. We have not measured significant variations in MWNT
morphology or in other characteristics, pointing out the good reliability of our production
process.
Table 5
4. Conclusions
We have developed a selective fluidized bed CCVD process for large scale production
of MWNT. We have studied the influence of run duration, temperature and gaseous phase on
the CNT growth. The main conclusions that can be drawn from the present work are :
23
1. In the first stage of the process, MWNT growth induces an explosion of the catalytic
grains, and the production of a composite powder consisting in MWNT hanks
anchored to the catalyst grains. Then, further growth generates significant increases in
fixed bed height and reductions in apparent density of the composite powders and in
minimum fluidization velocity.
2. The temperature influences significantly the morphology of the CNT hanks as well as
the porosimetry properties of the MWNT. MWNT presenting a large specific surface
area (450 m2/g) have been produced at 750°C. The effect of the other parameters on
MWNT morphology is less pronounced.
3. If the forces exerted by the gas on particles (fluidization ratio or total gas flow rate)
become lower than the interparticles forces, which seem to increase with the amount
of MWNT formed, a partial bed agglomeration occurs.
4. An increase of the total pressure does not brought any interest in terms of process
efficiency for the range of operating conditions tested. A limiting step in this process
is the internal diffusion into the mesopores of alumina.
5. The kinetic law of MWNT formation is positive order dependant of ethylene partial
pressure at ambient pressure.
Acknowledgements : Prof. Jean Pierre Couderc (LGC, Toulouse, France) is gratefully
acknowledged for helpful discussion. Prof. Jean Durand (IEM, Montpellier, France) is
acknowledged for his help with SEM-FEG observations. These investigations have been
supported by ARKEMA, Agence Nationale de Valorisation de la Recherche and Conseil
Régional de Midi-Pyrénées.
24
References
[1]http://www.arkemagroup.com/arkema/GB/comm_presse/d_comm.cfm?ID=622&prov=RL
DRFT&motrech=nanotubes
[2] http://www.research.bayer.com/research-news/nanotubes/page4246.htm
[3] http://www.thomas-swan.co.uk/pages/nano_home.html
[4] Monthioux M, Serp P, Flahaut E, Laurent C, Peigney A, Razafinimanana M, Bacsa W,
Broto JM. Introduction to carbon nanotubes. In “Springer Handbook of Nanotechnology” B.
Bhushan (ed.), Springer-Verlag, Heidelberg, Germany, 2004, pp 39-98.
[5] Corrias M, Caussat B, Ayral A, Durand J, Kihn Y, Kalck P, Serp P. Carbon nanotubes
produced by fluidized bed catalytic CVD: first approach of the process. Chem Eng Sc
2003;58:4475-82.
[6] Wang Y, Wei F, Luo G, Yu H, Gu G. The large-scale production of carbon nanotubes in a
nano-agglomerate fluidized-bed reactor. Chem Phys Lett 2002;364:568-72.
[7] Qian W, Wei F, Wang Z, Liu T, Liu H, Luo G, Xiang L. Production of carbon nanotubes
in a packed bed and a fluidized bed. AIChE J 2003;49(3):619-25
[8] Nijkamp M. Hydrogen storage using physisorption: modified carbon nanofibers and
related materials. Dissertation PhD thesis, Utrecht 2002:23-41.
[9] Qian W, Liu T, Wang Z, Wei F, Li Z, Luo G, Li Y. Production of hydrogen and carbon
nanotubes from methane decomposition in a two-stage fluidized bed reactor. Appl Catal A:
2003;260(2):223-8.
[10] Venegoni D, Serp P, Feurer R, Kihn Y, Vahlas C, Kalck P. Parametric study for the
growth of carbon nanotubes by catalytic chemical vapor deposition in a fluidized bed reactor.
Carbon 2002;40:1799-1807.
25
[11] Pérez-Cabero M, Rodriguez-Ramos I, Guerrero-Ruiz A. Characterization of carbon
nanotubes and carbon nanofibers prepared by decomposition of acetylene in a fluidized bed
reactor. J Catal 2003; 215:305-16.
[12] Wang Y, Wei F, Gu G, Yu H. Agglomerated carbon nanotubes and its mass production
in a fluidized-bed reactor. Physica B 2003;323:327-9.
[13] Mauron P, Emmenegger C, Sudan P, Wenger P, Rentsch S, Züttel A. Fluidized bed CVD
synthesis of carbon nanotubes on Fe2O3/MgO. Diamond Rel Mater 2003;12:780-5.
[14] Bachilo SM, Balzano L, Herrera JE, Pompeo F, Resasco DE, Weisman RB. Narrow
(n,m) distribution of single-walled carbon nanotubes grown using a solid supported catalyst. J
Am Chem Soc 2003;1255:11186-7.
[15] Li YL, Kinloch IA, Shaffer MSP, Geng J, Johnson B, Windle AH. Synthesis of single-
walled carbon nanotubes by a fluidized-bed method. Chem Phys Lett 2004;384:98-102.
[16] Liu QX, Fang Y. New technique of synthesizing single-walled carbon nanotubes from
ethanol using fluidized-bed over Fe-Mo/MgO catalyst. Spectrochimicca Acta A 2006;64:296-
300.
[17] Serp P, Kalck P, Feurer R, Vahlas C. Method for the selctive production of ordered
carbon nanotubes in a fluidised bed. WO 2003/002456.
[18] Hernadi K, Fonseca A, Nagy JB, Bernaerts D, Luca AA. Fe-catalyzed carbon nanotubes
formations. Carbon 1996;34:1249-1257.
[19] Do-Hyung K, Hoon-Sik J, Chang-Duk K, Dong-Soo C, Hee-Dong K, Jong-Gi J,
Hyeong-Rag L. In situ monitoring of carbon nanotube growth. Carbon 2003;41:583-585.
[20] Gulino G, Vieira R, Amadou J, Nguyen P, Ledoux MJ, Galvagno S, Centi G, Pham-Huu
C. C2H6 as an active carbon source for a large scale synthesis of carbon nanotubes by
chemical vapour deposition. Appl. Catal. A 2005;279:89-97.
26
[21] Lin CY, Tsai WT. Nano-sized carbon filament formation during metal dusting of
stainless steel. Mat. Chem. Phys. 2003;82:929-936.
[22] Baker RTK, Harris PS, Thomas RB, Waite RJ. Formation of filamentous carbon from
iron, cobalt and chromium catalyzed decomposition of acetylene. J. Catal. 1973;30:86-95.
[23] Liu K, Jiang K, Feng C, Chen Z, Fan S. A growth mark method for studying growth
mechanism of carbon nanotube arrays. Carbon 2005;43:2850-2856.
[24] Kim KE, Kim K-J, Jung WS, Bae SY, Park J, Choi J, Choo J. Investigation on the
temperature-dependent growth rate of carbon nanotubes using chemical vapor deposition of
ferrocene and acetylene. Chem. Phys. Lett. 2005;401:459-464.
[25] Baker RTK, Chludzinski Jr JJ. Filamentous carbon growth on nickel-iron surfaces: the
effect of various oxide additives. J. Catal. 1980;64:464-478.
[26] Prados C, Crespo P, Gonzalez JM, Hernando A., Marco JF, Gancedo R, Grobert N,
Terrones M, Walton RM, Kroto HW. Hysteresis shift in Fe-filled carbon nanotubes due to g-
Fe. Phys. Rev. B 2002;65:113405.
[27] Kim H, Sigmund W. Iron particles in carbon nanotubes. Carbon 2005 ;43 :1743-1748.
[28] Kim H, Sigmund W. Iron nanoparticles in carbon nanotubes at various temperatures. J.
Cryst. Growth 2005;276:594-605.
[29] Roduner E. Size matters: why nanomaterials are different. Chem. Soc. Rev. 2006
advanced article.
[30] Sun CQ. Size dependence of nanostructures: impact of bond order deficiency. Progress in
Solid State Chem. 2006, in press.
[31] Gauden PA, Terzyk AP, Rychlicki G, Kowalczyk P, Lota K, Raymundo-Pinero E,
Frackowiak E, Béguin F. Thermodynamic properties of benzene adsorbed in activated
carbons and multi-walled carbon nanotubes. Chem. Phys. Lett. 2006;421:409-414.
27
[32] Wang YY, Tang GY, Koeck FAM, Brown B, Garguilo JM, Nemanich RJ. Experimental
studies of the formation process and morphologies of carbon nanotubes with bamboo mode
structures. Diamond Relat. Mater. 2004;13:1287-1291.
[33] Zhang XX, Li ZQ, Wen GH, Fung KK, Chen J, Li Y. Microstructure and growth of
bamboo-shaped carbon nanotubes. Chem. Phys. Lett. 2001;333:509-514.
[34] Lu Y, Zhu Z, Su D, Wang D, Liu Z, Schlögl R. Formation of bamboo-shape carbon
nanotubes by controlled rapid decomposition of picric ac. Carbon 2004;42:3199-3207.
[35] Kuznetsov VL. Mechanism of carbon filaments and nanotubes formation on metal
catalysts. In, Nanoengineered Nanofibrous Materials : Proceedings of the NATO ASI on
Nanoengineered and Nanofibrous Materials. Guceri S, Gogotsi, YG, Kuznetsov V (Eds).
Kluwer Academic Pub. 2004, 19-34.
[36] Bird RB, Stewart WE, Lightfoot EN. Transport phenomena, Wiley Ed., NY, 1960.
[37] Knudsen M. The Kinetic theory of gases. John Wiley and Sons, NY, 1932.
[38] Li WZ, Wen JG, Tu Y, Ren ZF. Effect of gas pressure on the growth and structure of
carbon nanotubes by chemical vapor deposition. Appl. Phys. A 2001;73:259-264.
28
Figure captions
Fig. 1: Experimental set up
Figure 2: Evolution of porous volume with pore size distribution for 2.5%Fe/Al2O3
Fig. 2: Evolution with time of carbon conversion and fixed bed height
Fig. 3: Evolution with time of (a) carbon conversion and fixed bed height and (b) MWNT
weight and growth rate
Fig. 4: Evolution with time of the catalytic support mean diameter after the formation of CNT
Fig. 5: SEM micrograph of exploded catalytic grains
Fig. 6: Evolution with temperature of (a) carbon yield and fixed bed height and (b) MWNT
weight and formation rate
Fig. 7: SEM-FEG micrographs of MWNT formed at various temperatures: (a) 550°C, (b)
650°C, (c) 750°C
Fig. 8: TEM micrographs of material grown at (a) 450°C; (b) enlargement of the circle
present on Fig. 8-a; (c) 650°C and (d) at 750°C
Fig. 9: Evolution of porous volume with pore size distribution at various temperatures
Figure 10: Evolution with U/Umf of (a) carbon yield and fixed bed height, and (b) of MWNT
formation rate
Fig. 11: Evolution with ethylene percentage of (a) carbon yield and fixed bed height; and (b)
of MWNT weight and formation rate
Fig. 12: Evolution with ethylene percentage of (a) carbon yield and fixed bed height (variable
weight of carbon introduced); and (b) of MWNT weight and formation rate (variable weight
of carbon introduced)
29
Table captions
Table 1: Summary of the conditions tested for the study of the influence of temperature and
run duration
Table 2: Summary of the conditions tested for the study of the gaseous phase influence
Table 3: BET results for various synthesis temperatures
Table 4: Results on the influence of the total pressure
Table 5: Characterization of MWNT grown at 650°C for 120 min
30
Table 1: Summary of the conditions tested for the study of the influence of temperature and
run duration
Run R1 R2 R3 R4 R5 R6 R7 R8 R9 R10 R11 R12
T (°C) 650 450 550 650 700 750
Run duration (min) 5 15 30 60 90 120 150 120
31
Run R13 R14 R15 R16 R17 R18 R19 R20 R21 R22 R23 R24
Run duration (min) 107 120 137 192 120 120 302 152 51 120 120 120
N2 flow rate (sccm) 771 685 600 428 685 685 685 685 685 685 685 685
C2H4 flow rate (sccm) 455 405 354 253 405 405 161 320 640 160 640 320
H2 flow rate (sccm) 1350 1200 1050 750 1200 1200 1444 1280 960 1440 960 1280
U/Umf 1.1 1 0.87 0.62 0.9 0.77 1 1 1 1 1 1
Total pressure (bar) 1 1 1 1 1.1 1.3 1 1 1 1 1 1
Table 2: Summary of the conditions tested for the study of the gaseous phase influence
32
Purified CNT
(T=450°C)
Purified CNT
(T=650°C)
Purified CNT
(T=700°C)
Purified CNT
(T=750°C)
SBET (m2/g) 94.8 189.9 405.4 454.7
Porous volume (cm3/g) 0.24 0.8 0.85 0.84
dBJH ads(Å) 125.3 194.1 93 71.1
dBJH des(Å) 110.6 173.3 81.6 61.3
Table 3: BET results for various synthesis temperatures
33
Pressure (bar) 1 1.1 1.3
Carbon yield (%) 62.4 48.4 50
Fixed bed height (cm) 51 30 38
mNT (g) 30.1 23.5 24.3
mNT/mCATA 0.6 0.47 0.48
Formation rate (gNT/gFe/min) 0.2 0.156 0.162
d50 (µm) after MWNT burning 53.3 70.6 82.8
Table 4: Results on the influence of the total pressure
34
Purity Average
ext.
diam
(nm)
Average
number
of walls
SBET
m2/g
Pore
volume
(cm3/g)
d002
(nm)
Real
density
Ramana
G/D
intensity
XPSb
C/O
Conductivity
(S/m)
97% 15-17 13-15 180-190 0.80-0.89 0.341-
0.342
1.9 1.15-
1.25
98.5/1.5
99/1
0.97-1.1
a Ratio of the intensity of the G and D bands; b Carbon to oxygen surface atomic ratio
Table 5: Characterization of MWNT grown at 650°C for 120 min
35
Fig. 1: Experimental set up
36
0
0.005
0.01
0.015
0.02
0.025
0 100 200 300 400 500 600 700 800Pore size distribution (angstroms)
Poro
us v
olum
e (c
m3/
g)
Figure 2: Evolution of porous volume with pore size distribution for 2.5%Fe/Al2O3
37
Fig. 3: Evolution with time of (a) carbon conversion and fixed bed height and (b) MWNT
weight and growth rate
0
10
20
30
40
50
60
70
80
0 50 100 150Time (min)
Car
bon
yiel
d (%
)
0
10
20
30
40
50
60
70
80
Fixe
d be
d he
ight
(cm
)
(a)
0
5
10
15
20
25
30
35
0 50 100 150Time (min)
MW
NT
wei
ght (
g)
0
0,05
0,1
0,15
0,2
0,25
Form
atio
n ra
te (g
NT/
g Fe/m
in)(b)
0.05
0.1
0.15
0.2
0.25
38
Fig. 4: Evolution with time of the catalytic support mean diamater after the formation of the
nanotubes
0
20
40
60
80
100
120
140
0 20 40 60 80 100 120 140 160
Time (min)
d50
( µm
) 3g CNT
8g CNT
17g CNT
25g CNT
30g CNT33g CNT
39
Fig. 5: SEM micrograph of exploded catalytic grains
40
Fig. 6: Evolution with temperature of (a) carbon yield and fixed bed height and (b) MWNT
weight and formation rate
0
10
20
30
40
50
60
70
450 500 550 600 650 700 750 800
Temperature (°C)
Car
bon
yiel
d (%
)
-10
0
10
20
30
40
50
60
70
Fixe
d be
d he
ight
(cm
)
(a)
0
5
10
15
20
25
30
35
450 500 550 600 650 700 750Temperature (°C)
MW
NT
wei
ght (
g)
0
0,05
0,1
0,15
0,2
0,25
Form
atio
n ra
te (g
NT/g
Fe/m
in)
(b)
0.05
0.15
0.25
0.2
0.1
41
Fig. 7: SEM-FEG micrographs of MWNT at various temperatures: (a) 550°C, (b) 650°C and
(c) 750°C
(b)
12 µm
(a)
12 µm
(c)
12 µm
42
Fig. 8: TEM micrographs of material grows at (a) 450°C; (b) enlargement of the circle present
on Fig. 8-a; (c) 650°C and (d) at 750°C
100 nm
(a) (b)
(d)
100 nm
200 nm
100 nm
(c)
43
Fig. 9: Evolution of porous volume with pore size distribution at various temperatures. Insert:
presence of defects (bamboo like structure in MWNT grown at 650°C).
0
0.005
0.01
0.015
0.02
0.025
0.03
0.035
0.04
0.045
0 200 400 600 800 1000 1200
Pore size distribution (angstroms)
Poro
us v
olum
e (c
m3/
g)
T=450°CT=650°CT=700°CT=750°C
2.5-8.5 nm
0
0.005
0.01
0.015
0.02
0.025
0.03
0.035
0.04
0.045
0 200 400 600 800 1000 1200
Pore size distribution (angstroms)
Poro
us v
olum
e (c
m3/
g)
T=450°CT=650°CT=700°CT=750°C
2.5-8.5 nm
0
0.005
0.01
0.015
0.02
0.025
0.03
0.035
0.04
0.045
0 200 400 600 800 1000 1200
Pore size distribution (angstroms)
Poro
us v
olum
e (c
m3/
g)
T=450°CT=650°CT=700°CT=750°C
2.5-8.5 nm
44
Figure 10: Evolution with U/Umf of (a) carbon yield and fixed bed height, and (b) of MWNT
formation rate
0
10
20
30
40
50
60
70
80
0,5 0,7 0,9 1,1U/Umf
Car
bon
yiel
d (%
)
0
10
20
30
40
50
60
70
Fixe
d be
d he
ight
(cm
)(a)
0
5
10
15
20
25
30
35
40
0,5 0,7 0,9 1,1U/Umf
MW
NT
wei
ght (
g)
0
0,05
0,1
0,15
0,2
0,25
form
atio
n ra
te (g
NT/g
Fe/m
in)(b)
0.05
0.15
0.25
0.2
0.1
45
Figure 11: Evolution with ethylene percentage of (a) carbon yield and fixed bed height; and
(b) of MWNT weight and formation rate
0
10
20
30
40
50
60
70
0 0,1 0,2 0,3 0,4 0,5 0,6 0,7C2H4/H2
Car
bon
yiel
d (%
)
0
10
20
30
40
50
60
Fixe
d be
d he
ight
(cm
)
(a)
0
5
10
15
20
25
30
35
0 0,1 0,2 0,3 0,4 0,5 0,6 0,7C2H4/H2
Form
atio
n ra
te (g
NT/
gFe/
min
)
0
0,05
0,1
0,15
0,2
0,25
0,3
MW
NT
wei
ght (
g) (b)
0.05
0.15
0.2
0.1
0.25
0.3
46
Figure 12: Evolution with ethylene percentage of (a) carbon yield and fixed bed height
(variable weight of carbon introduced); and (b) of MWNT weight and formation rate (variable
weight of carbon introduced)
0
10
20
30
40
50
60
70
80
90
0 0,1 0,2 0,3 0,4 0,5 0,6 0,7C2H4/H2
Car
bon
yiel
d (%
)
0
10
20
30
40
50
60
70
Fixe
d be
d he
ight
(cm
)
(a)
0
5
10
15
20
25
30
35
40
0 0,1 0,2 0,3 0,4 0,5 0,6 0,7
C2H4/H2
MW
NT
wei
ght (
g)
0
0,05
0,1
0,15
0,2
0,25
Form
atio
n ra
te (g
NT/g
Fe/m
in)(b)
0.05
0.15
0.2
0.1
0.25
Related Documents