A Novel Hyper-Spectral Imaging System : Application on in-vivo Detection and Grading of Cervical Precancers and of Pigmented Skin Lesions C. Balas 1 , G. Themelis 1 , A. Papadakis 1 , E. Vasgiouraki 1 , A. Argyros 2 , E. Koumantakis 3 , A. Tosca 4 , E. Helidonis 5 1 Institute of Electronic Structure & Laser, FO.R.T.H., Heraklion, Crete, Greece 2 Institute of Computer Science, FO.R.T.H., Heraklion, Crete, Greece 3 Department of Gynaecology, School of Medicine, University of Crete, Heraklion, Crete, Greece 4 Department of Dermatology, School of Medicine, University of Crete, Heraklion, Crete, Greece 5 Department of Otolaryngology, School of Medicine, University of Crete, Heraklion, Crete, ABSTRACT We present a novel Hyper-Spectral Imaging (HySI) System capable of acquiring and real time displaying of 5nm specrtal images, with 2nm tuning step, in the range of 400nm-1000nm. Synchronized spectral scanning and image storing enables the collection of a stack of calibrated spectral images, from which a fully resolved spectrum per image pixel can be calculated and displayed. We also present results from a pilot use of the developed HySI system as a research tool, in an attempt to develop novel, non-invasive diagnostic methods for the detection and grading of cervical precancers and of pigmented skin lesions. In the case of cervical diagnosis we have succeeded to detect in vivo, quantitatively assess and map alterations in tissue structure and functionality, associated with progress of the disease, with high sensitivity and specificity. In the case of pigmented skin areas, near infrared spectral analysis and imaging of melanin-rich spots show that they become transparent at certain imaging wavelengths and that the transparency wavelength increases with the melanin content and the lesion’s depth. This information can be used for the in vivo quantitative assessment of the later, which is considered to be of great diagnostic and predictive value. In Proc. of "Computer Vision Beyond the Visible Spectrum" CVBVS'01 Workshop, Hawaii, USA, Dec. 2001

Welcome message from author
This document is posted to help you gain knowledge. Please leave a comment to let me know what you think about it! Share it to your friends and learn new things together.
Transcript

A Novel Hyper-Spectral Imaging System : Application on in-vivo Detection and Grading of Cervical Precancers and of Pigmented Skin Lesions
C. Balas1, G. Themelis1, A. Papadakis1, E. Vasgiouraki1, A. Argyros2, E. Koumantakis3, A.
Tosca4, E. Helidonis5
1Institute of Electronic Structure & Laser, FO.R.T.H., Heraklion, Crete, Greece 2Institute of Computer Science, FO.R.T.H., Heraklion, Crete, Greece
3Department of Gynaecology, School of Medicine, University of Crete, Heraklion, Crete, Greece 4Department of Dermatology, School of Medicine, University of Crete, Heraklion, Crete, Greece
5Department of Otolaryngology, School of Medicine, University of Crete, Heraklion, Crete,
ABSTRACT
We present a novel Hyper-Spectral Imaging (HySI) System capable of acquiring and real time displaying of 5nm specrtal images, with 2nm tuning step, in the range of 400nm-1000nm. Synchronized spectral scanning and image storing enables the collection of a stack of calibrated spectral images, from which a fully resolved spectrum per image pixel can be calculated and displayed. We also present results from a pilot use of the developed HySI system as a research tool, in an attempt to develop novel, non-invasive diagnostic methods for the detection and grading of cervical precancers and of pigmented skin lesions. In the case of cervical diagnosis we have succeeded to detect in vivo, quantitatively assess and map alterations in tissue structure and functionality, associated with progress of the disease, with high sensitivity and specificity. In the case of pigmented skin areas, near infrared spectral analysis and imaging of melanin-rich spots show that they become transparent at certain imaging wavelengths and that the transparency wavelength increases with the melanin content and the lesion’s depth. This information can be used for the in vivo quantitative assessment of the later, which is considered to be of great diagnostic and predictive value.
In Proc. of "Computer Vision Beyond the Visible Spectrum" CVBVS'01 Workshop, Hawaii, USA, Dec. 2001
A Novel Hyper-Spectral Imaging System : Application on in-vivo Detection
and Grading of Cervical Precancers and of Pigmented Skin Lesions
ABSTRACT
We present a novel Hyper-Spectral Imaging (HySI) System capable of acquiring and real time displaying of 5nm specrtal images, with 2nm tuning step, in the range of 400nm-1000nm. Synchronized spectral scanning and image storing enables the collection of a stack of calibrated spectral images, from which a fully resolved spectrum per image pixel can be calculated and displayed. We also present results from a pilot use of the developed HySI system as a research tool, in an attempt to develop novel, non-invasive diagnostic methods for the detection and grading of cervical precancers and of pigmented skin lesions. In the case of cervical diagnosis we have succeeded to detect in vivo, quantitatively assess and map alterations in tissue structure and functionality, associated with progress of the disease, with high sensitivity and specificity. In the case of pigmented skin areas, near infrared spectral analysis and imaging of melanin-rich spots show that they become transparent at certain imaging wavelengths and that the transparency wavelength increases with the melanin content and the lesion’s depth. This information can be used for the in vivo quantitative assessment of the later, which is considered to be of great diagnostic and predictive value.
In Proc. of "Computer Vision Beyond the Visible Spectrum" CVBVS'01 Workshop, Hawaii, USA, Dec. 2001

1. INTRODUCTION Clinical diagnostics relay on the in
vivo, visual inspection of suspicious tissue areas. In several cases, image sensors attached to microscopes or to endoscopes, are used to acquire images of the area of interest. Typically, the employed sensors are designed to emulate human vision, resulting in a color image of the field of view as seen by the eye. This is accomplished by sensing the light at three wide spectral bands (red, green, and blue) within the visible spectrum (400-700nm). Color electronic imaging has found several applications in biomedicine including medical documentation, telemedicine etc. On the other hand, a variety of color image analysis algorithms have been developed and implemented, dealing with contrast enhancement and segmentation of image features of diagnostic importance, in an attempt to improve the obtained diagnostic information. Nevertheless it has been widely recognized that the three-band sensing mode sets serious limitations in the early detection and identification of tissue abnormalities. The obtained diagnostic information is poor since, in most cases, the metabolic or compositional alterations occurring during the progress of the disease, do not alter significantly and with specificity the color characteristics of the abnormal tissue. Due to the limited diagnostic content, color imaging is used in order to localize suspicious areas from which biopsy samples are obtained and undergone histologic examination. Although histology is considered up to now as the “gold standard” for the tissue diagnostics, it is widely known that it is qualitative, subjective, time consuming, costly, labor intensive and that it suffers from several limitations and drawbacks, such as tissue sampling and reading errors.
In an attempt to overcome the limitations met in the above mentioned diagnostic chain, growing research effort is
directed toward the development of novel, noninvasive methods and technologies for tissue diagnostics, frequently dubbed “Optical Biopsy”. The motivation is the demand for a powerful diagnostic and screening tool, capable of detecting tissue abnormalities at an early stage, avoiding multiple biopsies and allowing faster, more effective diagnosis and treatment.
Several research groups [1,2,3] are investigating the potential of spectroscopic techniques to provide a quantitative grading of dysplasias and malignancies without tissue removal. The main advantage of spectroscopy over color imaging is that the remitted light from the object under analysis is captured in a plurality of narrow spectral bands across the ultraviolet, visible and infrared part of the spectrum. The improved spectral resolution and sensitivity range provide a means for the detection of invisible alterations in tissue functionality and biochemistry, associated with the progress of the disease. It has been widely recognized [4] that spectroscopy has the potential to provide “spectral signatures” for the type and the grade of tissue lesions by simply measuring absorption, fluorescence, or (elastic, non-elastic) scattering spectral signals.
However, tissues are composite and heterogeneous materials and in most cases the spectral profiles are determined from the relative contribution of a great number of molecules. These results in broad spectra, characterized by limited specificity for the biochemical or structural alterations that occur during the progress of the disease. Another important limitation is related to the technology employed from various optical configurations used to measure the spectra. Conventional spectrometers are usually equipped with a light-sensing probe that enables signal detection from only an area point that is determined by the user.
In Proc. of "Computer Vision Beyond the Visible Spectrum" CVBVS'01 Workshop, Hawaii, USA, Dec. 2001
Therefore, probing errors present in invasive biopsy are also possible. On the other hand, point information is obviously inadequate for the global spectral characterization of heterogeneous tissues. Summarizing the above, conventional spectrometers provide a large amount of spectroscopic (analytical) information about one localized tissue site, whereas conventional broadband color imaging provides a modest amount of spectral information, but for a significant area of tissue surface. These limitations can be eliminated by developing spatially resolved spectral-acquisition instruments, known as multi- or hyper- spectral imaging systems, capable of recording light intensity as a function of both wavelength and location.
We have developed a novel Hyper-Spectral Imaging (HySI) system, capable of capturing a plurality of high-resolution narrow band images, while, in the spectroscopy domain, the system is capable of recording a fully resolved spectrum at each individual pixel. The system has been used in selected diagnostic problems related to the early detection and mapping of precancers of cervix and skin. Technical and clinical data are presented and discussed.
2. HYPER SPECTRAL IMAGING
Typically the hardware of (HySI) systems comprise an imaging detector coupled with an imaging monochromator, both interfaced with personal computer and control units. The imaging monochromator is the critical component in any kind of (HySI) system. It operates as a tunable optical filter, enabling the inspection and capturing of multiple narrow band spectral images across its tuning range or, if tuning spectral resolution is high, a full spectrum per image pixel.
The available imaging monochromators have been tailored to comply with the needs of a variety of diverse
applications, ranging from astronomy to microscopy. The monochromators are categorized based on the technology they implement. More specifically, there are three main categories of imaging monochromators: the Acousto-Optic Tunable Filters (AOTF) [5], the Liquid Crystal Tunable Filters (LCTF) [8-10], and the Fourier Transformed Interferometers (FTI) [11-13]. As far as biomedical sciences are concerned, (HySI) systems, based on the above-mentioned monochromators, have found interesting applications, mainly in microscopy. The integration of (HySI) technologies to common optical microscopes led to the development of a valuable diagnostic tool and recent research results have demonstrated the great potential of spectral imaging in microscopy [8, 10]. On the other hand several limitations of these devices have been reported such as limited spectral range (AOTFs, LCTFs), low throughput (AOTFs, LCTFs), image shifting during wavelength tuning (AOTFs), non-real time spectral imaging (FTI), time consuming acquisition (FTI). Moreover the relevant instrumentation is in all cases expensive, delicate and complicated. These technological limitations are in several cases preventing the applicability of these systems in the in vivo, non-destructive analysis of living tissues. In this application field, the requirements for system performance are high, because, on contrary to what happens in microscopy, the illumination-imaging geometry cannot be controlled with high accuracy. Furthermore, micromovements of the area under analysis are in most cases present due to breathing of the examined person etc.
Spectral analysis of living tissues requires the development of advanced imaging monochromators that should combine the following technical features: a) real time spectral imaging for inspection and focussing, b) high spectral resolution and wide spectral range, c) high throughput in
In Proc. of "Computer Vision Beyond the Visible Spectrum" CVBVS'01 Workshop, Hawaii, USA, Dec. 2001

order to avoid long exposure times and intense light excitation, d) fast capturing of image sequences in order minimize the influence of the micromovements in image registration. In an attempt to meet these technical requirements we have developed a Hyper Spectral Imaging system, based on a patent pending, all-optical imaging monochromator. Displacement of the optical elements of the later results in the tuning of the imaging wavelength and it is performed with the aid of mechanical manipulators controlled from the PC via a microcontroller. The system is capable of acquiring spectral images of 5nm Full Width Half Maximum (FWHM), with 3nm tuning step, in the spectral range 400nm-1000nm. The minimum transmittance is 40% across its operational spectral range, which determines the high throughput of the developed monochromator. The tuning spectral range matches the responsivity spectral range of the CCD image sensor but it can be extended for longer wavelengths, up to the mid infrared
range. The output feedback signal of the monochromator carries information regarding the state of the tunable filter, thus enabling its synchronization with the image capturing procedure. The monochromator is interfaced with a black and white, megapixel CCD camera, based on the IEEE-1394 data transferring protocol, capable of acquiring images at a rate of 15 frames/s at full resolution and of more than 30 frames/s at VGA resolution.
Specially developed software is employed for the control of the camera and monochromator as well as for the spectral image analysis. Fig. 1 illustrates graphically the main operational characteristics. The system operates in two modes: the spectroscopy mode and the spectrometry mode. The former enables the random selection and real time visualization of desired spectral images, while the spectrometry mode performs synchronized spectral scanning and image capturing and, finally, calculation of one full spectrum per
Operational Block Diagram ofHyper Spectral Imaging System
System Calibration
Spectroscopy
λ1 λ2 λ3
Random selection and display of spectral images
SpectrometryAutomatic spectral scanning and capturing of narrow bands images
Calculation of a full spectrum per image pixel
Wav
elen
gth
yx
Spectral Cube
Wav
elen
gth
Compensation for wavelength dependence of system’s response
Determination of system’s baseline
Device independent imaging and spectrometry
Fig. 1: Operational block diagram of Hyper Spectral Imaging System
In Proc. of "Computer Vision Beyond the Visible Spectrum" CVBVS'01 Workshop, Hawaii, USA, Dec. 2001
image pixel. In both cases, a special calibration procedure developed by Balas [12], is executed prior to these imaging procedures, in order to compensate for the wavelength dependence of the response of the electro-optical parts of the system, such as CCD, illuminators, etc. A Ba2SO4 white plate with unity reflectance across the 400-1000nm spectral range is used as calibration specimen. The specimen is placed in the field-of-view of the lens and the gray value of the central area of the image is displayed in real time. Then the monochromator scans the total spectral range and in each tuning step the camera shutter and gain is automatically regulated so that the displayed gray value approaches the value of 255. This ensures that the dynamic range of the CCD is fully exploited. The shutter and gain values, used to obtain a 255 gray level, are stored in each wavelength-tuning step, together with the image of the white specimen constituting the calibration data set of the system. These settings are determine the sensitivity level of the camera, which increases as the imaging wavelength is tuned to shorter or to longer wavelengths than the wavelength range at which the maximum light throughput and efficiency of the system is obtained. This makes the system’s response almost independent from the wavelength, thus ensuring a device independent spectral imaging and spectrometry. The stored spectral images of the white specimen are used in order to correct for the uneven of image brightness due to the non-uniform transfer function of the optics (flat field correction).
By running the spectrometry code section, which follows the calibration procedure, the system performs synchronized tuning of the imaging wavelength and image capturing and storing of the area under analysis. In each step, the sensitivity of the camera is automatically regulated according to the stored shutter and gain values. From
the stored stack of spectral images, a spectrum can be calculated and displayed in any user-selected spatial point of the image. The spectra are calculated from the gray values of the selected pixel spectral column. The spatial resolution of the detector determines the number of the spectra that can be collected in one experiment run. With the described configuration, one million spectra can be collected at approximately two minutes scanning time. The system also embodies a fast saving procedure at a lesser (VGA) resolution, which reduces the scanning time of the system to 10 s.
The developed HySIS was used for the remote analysis of precancerous lesions of the cervix of the uterus and of pigmented lesions of skin, in an attempt to develop novel, non-invasive methods for the early detection and quantitative grading of tissue abnormalities. In the case of cervix, dynamic spectral imaging is performed in order to assess the kinetics of acetic acid tissue interaction and to evaluate the diagnostic content of this process. In the case of skin pigmented lesions, near infrared spectral imaging is performed in order to obtain information for the under skin-surface depth of the lesion, in vivo.
3. CLINICAL APPLICATIONS
3.1 Optical biopsy of the cervix of the uterus
The presented method relays on the in vivo quantitative assessment of the spectral, spatial and temporal alterations of the light scattering properties, induced in epithelial dysplasias and malignancies of cervix and other epithelial tissues, after topical application of 3-5% acetic acid solution [12, 13]. The later provokes a progressive and reversible alteration of light scattering properties of the abnormal epithelium selectively, as a result of the existing compositional and/or functional alterations.
In Proc. of "Computer Vision Beyond the Visible Spectrum" CVBVS'01 Workshop, Hawaii, USA, Dec. 2001
Therefore it is reasonable to suggest that the quantitative assessment of the phenomenon kinetics could provide improved diagnostic information for the in vivo early detection and quantitative staging of the lesion.
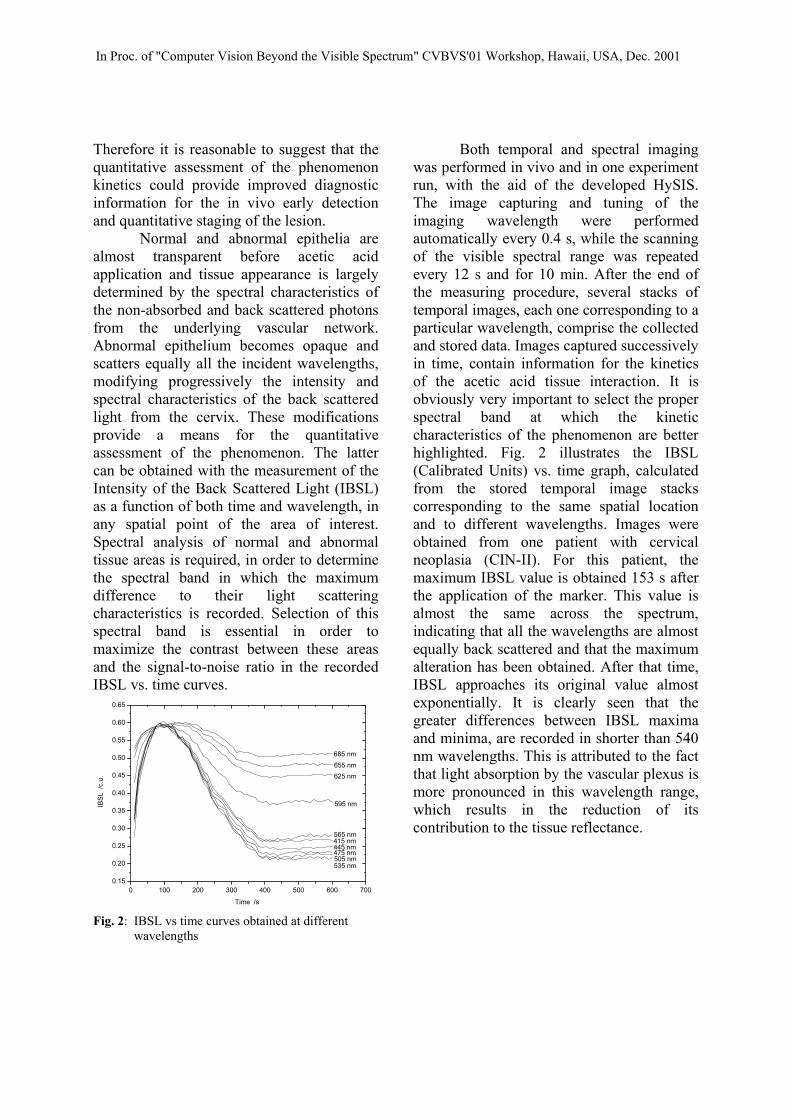
Normal and abnormal epithelia are almost transparent before acetic acid application and tissue appearance is largely determined by the spectral characteristics of the non-absorbed and back scattered photons from the underlying vascular network. Abnormal epithelium becomes opaque and scatters equally all the incident wavelengths, modifying progressively the intensity and spectral characteristics of the back scattered light from the cervix. These modifications provide a means for the quantitative assessment of the phenomenon. The latter can be obtained with the measurement of the Intensity of the Back Scattered Light (IBSL) as a function of both time and wavelength, in any spatial point of the area of interest. Spectral analysis of normal and abnormal tissue areas is required, in order to determine the spectral band in which the maximum difference to their light scattering characteristics is recorded. Selection of this spectral band is essential in order to maximize the contrast between these areas and the signal-to-noise ratio in the recorded IBSL vs. time curves.
0 100 200 300 400 500 600 7000.15
0.20
0.25
0.30
0.35
0.40
0.45
0.50
0.55
0.60
0.65
685 nm655 nm625 nm
595 nm
565 nm
535 nm505 nm475 nm
415 nm445 nm
IBSL
/c.
u.
Time /s Fig. 2: IBSL vs time curves obtained at different
wavelengths
Both temporal and spectral imaging was performed in vivo and in one experiment run, with the aid of the developed HySIS. The image capturing and tuning of the imaging wavelength were performed automatically every 0.4 s, while the scanning of the visible spectral range was repeated every 12 s and for 10 min. After the end of the measuring procedure, several stacks of temporal images, each one corresponding to a particular wavelength, comprise the collected and stored data. Images captured successively in time, contain information for the kinetics of the acetic acid tissue interaction. It is obviously very important to select the proper spectral band at which the kinetic characteristics of the phenomenon are better highlighted. Fig. 2 illustrates the IBSL (Calibrated Units) vs. time graph, calculated from the stored temporal image stacks corresponding to the same spatial location and to different wavelengths. Images were obtained from one patient with cervical neoplasia (CIN-II). For this patient, the maximum IBSL value is obtained 153 s after the application of the marker. This value is almost the same across the spectrum, indicating that all the wavelengths are almost equally back scattered and that the maximum alteration has been obtained. After that time, IBSL approaches its original value almost exponentially. It is clearly seen that the greater differences between IBSL maxima and minima, are recorded in shorter than 540 nm wavelengths. This is attributed to the fact that light absorption by the vascular plexus is more pronounced in this wavelength range, which results in the reduction of its contribution to the tissue reflectance.
In Proc. of "Computer Vision Beyond the Visible Spectrum" CVBVS'01 Workshop, Hawaii, USA, Dec. 2001

0 50 100 150 200 250 300
60
80
100
120
140
160
IBSL
/a.u
.
Time /s
High Grade Low Grade Normal
Fig. 3: IBSL vs time curves corresponding to
neoplasias of different grade
Light reflected from the vascular plexus corresponds to background noise, the reduction of which improves the obtained optical information for the assessment of the phenomenon kinetics. Since the CCD sensitivity is reduced with the wavelength, it is reasonable to select the wavelength range 525±10nm as an optimum imaging spectral band at which the maximum diagnostic information for the detection of incipient lesions is obtained. Fig. 3 illustrates indicative IBSL vs time curves, obtained at 525±10nm, corresponding to neoplasias of different grade as they have been classified with histology. It is clearly seen that differences in tissue pathology are clearly manifested in the IBSL vs. time curves, indicating the great diagnostic content of the latter. The temporal curves were best fitted with the function:
( )( ) ( ) 321 ///
10 11)( τττ ttt eeeAAtIBSL −−− ⋅−⋅−+=
From this function a variety of
parameters can be derived, which could potentially comprise quantitative indices for the neoplasia grade. These indices can be calculated in any spatial point of the area under analysis, leading to the creation of an image that comprises the grade map of the lesion. Fig. 4 illustrates a map of the
relaxation time (τ), calculated from the above function and for one normal tissue (a), one low-grade (b) and one high-grade lesion (c). Relaxation time is defined as the time at which the value IBSL(t)-IBSL(t=0) decays at the 1/e of its peak value. The black areas correspond to normal tissue areas, where no alteration in the tissue light scattering characteristics has occurred (after the application of acetic acid solution). In pathologic tissue areas, different gray levels correspond to different values of the model parameter τ and represent different alteration degrees in the light scattering properties of the tissue, which in turn correspond to different neoplasia grades, even within the same lesion.
(a) N
orm
al(b
) Low
-Gra
de(c
) Hig
h-G
rade
0.0
0.6
0.5
0.4
0.3
0.2
0.1
Fig. 4: Visible image and the corresponding mapping
of the parameter τ for (a) normal, (b) low-grade and (c) high-grade lesion. The recorded differences in the IBSL
vs. time curves, enable the unbiased differentiation between malignant and non-malignant epithelial lesions, as well as between neoplasias of different grade. In vivo detection, quantitative staging and mapping of tissue pathologies at an early stage, is of great clinical value, since it can contribute to the prevention of cancer and to the, evaluation and optimization of the various treatment modalities. Extended clinical trials
In Proc. of "Computer Vision Beyond the Visible Spectrum" CVBVS'01 Workshop, Hawaii, USA, Dec. 2001
are currently underway, in the context of which the described diagnostic method and instrumentation will be evaluated and further improved. 3.2. Spectral Imaging and analysis of pigmented skin lesions
One of the most challenging problems in dermatology is the differential diagnosis of malignant melanoma from benign pigmented skin lesions. Melanomas normally manifest themselves as brown/black pigmented area on the surface of the skin and at the early stages of the disease they may have similar characteristics with moles, freckles etc. Clinicians have adopted the so-called ABCDE (asymmetry, border, color, dimension, evolution) classification system [14], which is based on the assessment of the visually inspected macroscopic features of the lesion. The performance of clinical diagnosis is considered unsatisfactory since the reported diagnostic accuracy approaches only 50% when compared with histology [15]. Until now, histology has been the only confident way to determine whether the lesion is malignant. But for people that have several pigmented areas of skin and especially in cases with atypical mole syndrome (AMS) with hundreds of moles, it is almost impossible to biopsy all suspicious lesions. The existing diagnostic deficiencies have motivated several research groups to concentrate their effort toward the development of diagnostic systems and methodologies capable of assisting clinical diagnosis.
Several approaches have been presented, such as neural network diagnosis based on color images [18,19], optical spectroscopic methods [18], multispectral imaging [19] etc, aiming to the improvement of the diagnostic sensitivity and specificity. The reported encouraging results obtained during the clinical evaluation of these techniques indicate that they can contribute to
the improvement of the accuracy of clinical diagnosis. Nevertheless, the majority of the developed techniques are based on the analysis of the visible characteristics, which are limited to the surface features of the lesion. On the other hand, pathologists are very interested in estimating the thickness of the lesion, which, especially in the case of melanoma, is associated with the infiltration depth of the tissue. The staging of the lesion is mainly based on the later, which is determined with histology of the surgically excised lesion. Depending on their depth, melanomas are characterized as “in situ” or “invasive”, which have different prognosis. It is obvious that the development of a non-invasive method capable of providing quantitative assessment and mapping of the lesion’s subsurface depth will comprise a powerful diagnostic and screening tool.
0 1 2 3 4 5 60
20
40
60
80
100
Tran
smiss
ion
%
Thickness (mm)
410nm 500nm 550nm 700nm 770nm 850nm 900nm 1000nm
Fig. 5: Transmittance of synthetic melanin as a
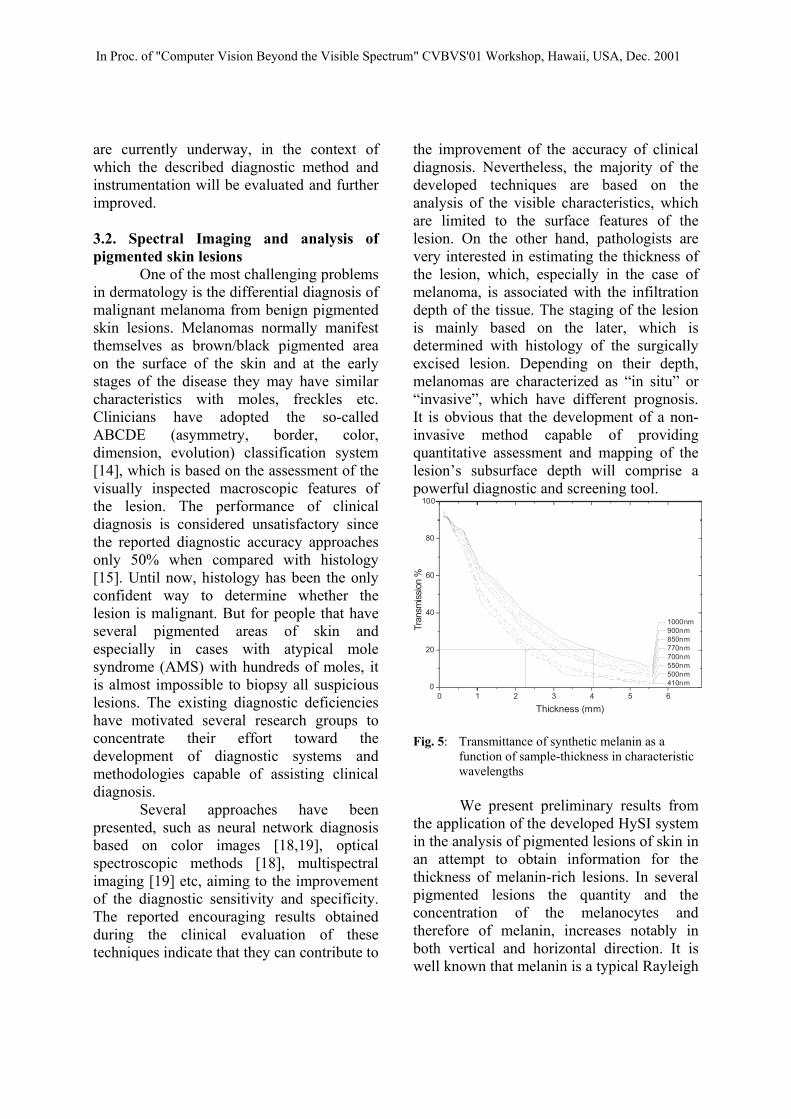
function of sample-thickness in characteristic wavelengths We present preliminary results from
the application of the developed HySI system in the analysis of pigmented lesions of skin in an attempt to obtain information for the thickness of melanin-rich lesions. In several pigmented lesions the quantity and the concentration of the melanocytes and therefore of melanin, increases notably in both vertical and horizontal direction. It is well known that melanin is a typical Rayleigh
In Proc. of "Computer Vision Beyond the Visible Spectrum" CVBVS'01 Workshop, Hawaii, USA, Dec. 2001
scatterer and that its light absorptivity varies with the wavelength [20]. In order to determine the optimal conditions for in-depth imaging of pigmented lesions, we have developed a glass chamber of variable thickness which contains synthetic melanin compound (Sigma Chemical Company, Product Number M8631) diluted in purified water [22]. The thickness of the glass chamber varies as shown at the bottom-right of Fig. 6. Synthetic melanin emulates the optical properties of the native melanin, while the various thickness of the chamber emulates the range of thickness met in pigmented lesions (0.5mm–5mm). Fig. 5 illustrates the transmittance of synthetic melanin as a function of both sample-thickness and wavelength. Note that the transmittance increases with the wavelength, which is more pronounced in the near infrared wavelength range. It is worth noticing that the same transmittance (20%) is recorded if either light at 400nm travel through a sample path-length of 2.3mm or light at 1000nm travels through a 4.1mm sample path-length.
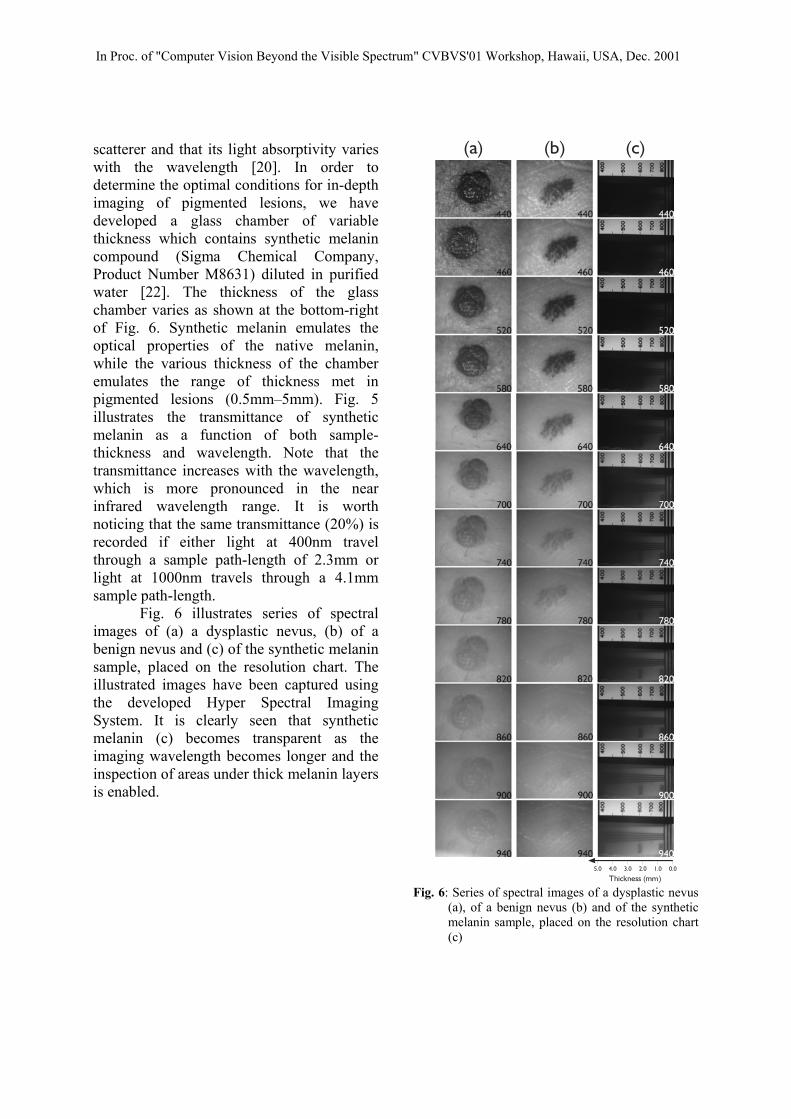
Fig. 6 illustrates series of spectral images of (a) a dysplastic nevus, (b) of a benign nevus and (c) of the synthetic melanin sample, placed on the resolution chart. The illustrated images have been captured using the developed Hyper Spectral Imaging System. It is clearly seen that synthetic melanin (c) becomes transparent as the imaging wavelength becomes longer and the inspection of areas under thick melanin layers is enabled.
(a) (b) (c)
5.0 0.01.02.03.04.0
Thickness (mm) Fig. 6: Series of spectral images of a dysplastic nevus
(a), of a benign nevus (b) and of the synthetic melanin sample, placed on the resolution chart (c)
In Proc. of "Computer Vision Beyond the Visible Spectrum" CVBVS'01 Workshop, Hawaii, USA, Dec. 2001
It can also be seen that imaging of the resolution chart through thick melanin layers enables the depiction of scene details. The preservation of the image contrast can be attributed to the fact that light is mostly forward scattered from melanin at this wavelength range. The same phenomenon is repeated in cases (a) and (b), where both dysplastic and benign nevus become transparent at the near infrared wavelength region. The first consequence from this effect is the ability to inspect skin features of possible diagnostic importance, with high resolution. On the other hand it is clearly seen that benign nevus becomes transparent at shorter wavelengths than the dysplastic nevus. Based on the lesion’s development physiological model this is mainly attributed to the different depth of these lesions. Another important finding is that the lesion’s depth is characterized by high spatial variability. The obtained images enable the accurate detection and localization of deep peaks within the lesion’s area and therefore a more accurate classification.
Research work is currently conducted to our labs towards developing a computational model in order to calculate the lesion’s depth map in absolute values. Depth assessment and mapping will add a new dimension in the differential diagnosis and monitoring of skin pigmented lesions, as well as in the treatment planning.
4. CONCLUSIONS
Improved diagnostic information can be gained by recording the optical information in a wide spectral range, including non-visible spectral bands, and with high spatial and spectral resolution. Both imaging and spectroscopy continue to be impacted by technological innovations that enable faster acquisition of a superior-quality data. The data acquired by HySI contain both spatial and compositional information, allowing living tissues to be
probed, even dynamically, with unprecedented analytical power. The spectral information can potentially serve in the in-vivo identification of tissue lesions based on their particular biochemical and structural features. On the other hand, imaging at spectral bands that correspond to the maximum differentiation between the spectral characteristics of normal and abnormal tissue will result in the maximization of the perceived contrast. This will enable the better localization of the lesion and will improve the accuracy in the determination of the negative borders, which is of essential importance in treatment monitoring and planning. HySI technology constitutes a powerful research tool that enables the analysis of tissues in situ, non-destructively and in their physical environment. Combination of in vivo and in vitro experiments will result in the development and introduction of novel, more efficient diagnostic methods and criteria. Based on obtained research results, specialized imaging systems will be tailored to specific medical specialties, capable of clinical implementation. Expanding the boundaries of knowledge, HySI contributes to the development of novel diagnostic methods and systems, while at the same time opening new directions that need to be explored.
5. REFERENCES
[1] Alfano R R, Tang G C, Pradhan A, Lam W, Choy D S J and Opher E, 1987: “Fluorescence spectra from cancerous and normal breast and lung tissues” IEEE J. Quantum Electron. 23 1806-11.
[2] K.T. Schomacker, J.K. Frisoli, C.C.Compton, T.J. Flotte, J.M. Richter, N.S. Nishioka, T.F. Deutsch, 1992: “Ultraviolet laser-induced fluorescence of colonic tissue: “Basic
In Proc. of "Computer Vision Beyond the Visible Spectrum" CVBVS'01 Workshop, Hawaii, USA, Dec. 2001

biology and diagnostic potential”, Lasers Surg. Med., vol 12, pp.63-78.
[3] N. Ramanujam, M.F. Mitchell, A. Mahadevan-Jansen, S. Thomsen, G. Staerkel, A. Malpica, T. Wright, N. Atkison and R.R. Richards-Kortum, 1996: “Cervical precancer detection using a multivariate statistical algorithm based on laser-induced fluorescence spectra at multiple excitation wavelengths”, Photochem. and Photobiol., vol. 64(4), pp. 720-735.
[4] Bigio and J. Mourant, 1997: “Ultraviolet and visible spectroscopies for tissue diagnostics: fluorescence spectroscopy and elastic-scattering spectroscopy” Phys Med. Biol. 42 pp. 803- 814.
[5] D.Farkas, C.Du, G.Fisher, C.Lau, W.Niu, E.Wachman, R.Levenson, “Non-invasive image acquisition and advanced processing in optical bioimaging,” Computerized Medical Imaging and Graphics, 22, 89-102, (1998)
[6] J.Olson, R.Jungquist, Z.Ninkov, “Tunable multi-spectral imaging system technology for airborn applications,” SPIE, 2480, 268-279, (1995)
[7] R.Levenson, D.Farkas, “Digital spectral imaging for histopathology and Cytopathology”, SPIE, 2983, 123-135, (1997)
[8] R.Ornberg, B.Worner, D.Edwards, “Analysis of stained objects in histological sections by spectral imaging and differential absorption,” J. Histochem. Cytochem., 47, 1307-1313, (1999)
[9] D.Soenksen, G.McNamara, Y.Garini, N.Katzir, “Method of cancer cell
detection,” US Patent: 5,995,645, (1999)
[10] C.Rothmann, I.Bar-Am, Z.Malik, “Spectral imaging for quantitative histology and cytogenetics,” Histology and Histopathology, 13, 921-926, (1998)
[11] D.Cabib,R.Buckwald, Z.Malik, N.Ben-Yosef, “Spectral Bioimaging methods for cell classification,” US Patent: 5,991,028, (1999)
[12] C. Balas: “ A Novel Optical Imaging Method for the Early Detection, Quantitative Grading and Mapping of Cancerous and Precancerous lesions of Cervix”, IEEE-Transactions on Biomedical Engineering, vol. 48, No 1 pp. 96-104, 2001
[13] C. Balas, G. Themelis, E. Prokopakis, I. Orfanudaki, E. Koumandakis, E. Helidonis, “In vivo detection and staging of epithelial dysplasias and malignancies based on the quantitative assessment of acetic acid-tissue interaction kinetics”, J. Photoch. Photob., vol. 53/1-3, pp. 153-157 (1999)
[14] Friedman R. J., D. S. Rigel The clinical features of malignant melanoma Dermatol 3 (1985) 271-283
[15] Curley R K, Cook M G, Fallowfield M E, Marsden R A Accuracy in clinically evaluating pigmented lesions Br. M|ed. J. 299 (1989) 16-18
[16] Gutkowicz-Krusin D, Elbaum M, Szwaykowski P, Kopf AW Can early malignant melanoma be differentiated from atypical melanocytic nevus by in vivo techniques? II. Automatic machine vision classification. Skin Res Technol 3 (1997) 15-22
In Proc. of "Computer Vision Beyond the Visible Spectrum" CVBVS'01 Workshop, Hawaii, USA, Dec. 2001
[17] Ercal F, Chawla A, Stoecker W, Lee HC, Moss R. Neural network diagnosis of malignant melanoma from color images IEEE Trans Biomed Eng 41 (1994) 837-845
[18] V. P. Wallace, D C Crawford, R J Ott, J C Bamber Spectroscopic assessment of pigmented lesions: methods and feature selection for evaluation of diagnostic performance Phys. Med. Biol. 45 (2000) 735-751.
[19] B Farina, C Bartoli, A Bono, A Colombo, M Lualdi, G Trangi, R. Marchesini Multipsectral imaging approach in the diagnosis of cutaneous melanoma: potentiality and limits Phys. Med. Biol. 45 (2000) 1243-1254
[20] N Kollias, A Baqer Absorption mechanisms of human melanin in the visible, 400-720nm J. invest. Dermatol. 89 (1987) 384-388
In Proc. of "Computer Vision Beyond the Visible Spectrum" CVBVS'01 Workshop, Hawaii, USA, Dec. 2001
Related Documents