A NEW VOLTAGE STABILITY INDEX FOR PREDICTING VOLTAGE COLLAPSE IN ELECTRICAL POWER SYSTEM NETWORKS By SAMUEL Isaac Adekunle CUGP070183 M Eng. (Power and Machine) (Kano) JANUARY, 2017

Welcome message from author
This document is posted to help you gain knowledge. Please leave a comment to let me know what you think about it! Share it to your friends and learn new things together.
Transcript
A NEW VOLTAGE STABILITY INDEX FOR PREDICTING
VOLTAGE COLLAPSE IN ELECTRICAL POWER SYSTEM
NETWORKS
By
SAMUEL Isaac Adekunle
CUGP070183
M Eng. (Power and Machine) (Kano)
JANUARY, 2017

ii
A NEW VOLTAGE STABILITY INDEX FOR PREDICTING
VOLTAGE COLLAPSE IN ELECTRICAL POWER SYSTEM
NETWORKS
By
SAMUEL Isaac Adekunle
M Eng. (Power and Machine) (Kano)
Matric No: CUGP070183
A THESIS SUBMITTED TO THE SCHOOL OF POST GRADUATE STUDIES
OF COVENANT UNIVERSITY, OTA, OGUN STATE NIGERIA
IN PARTIAL FULFILMENT OF THE REQUIREMENTS FOR THE AWARD
OF DOCTOR OF PHILOSOPHY (Ph.D) DEGREE IN ELECTRICAL POWER
AND MACHINES, IN THE DEPARTMENT OF ELECTRICAL AND
INFORMATION ENGINEERING, COLLEGE OF ENGINEERING,
COVENANT UNIVERSITY, OTA, NIGERIA.
JANUARY, 2017
iii
ACCEPTANCE
This is to attest that this thesis is accepted in partial fulfilment of the requirement for the
award of the degree of the Doctor of Philosophy (Ph.D) Degree in Electrical Power
and Machine in the Department of Electrical and Information Engineering, College
of Engineering, Covenant University, Ota, Nigeria.
Philip John Ainwkhai ..………………
Secretary, School of Postgraduate Studies Signature & Date
Prof. Samuel Wara ..…………..……
Dean, School of Postgraduate Studies Signature & Date
iv
DECLARATION
I, SAMUEL Isaac Adekunle (CUGP070183) declare that this research was carried out
by me under the supervision of Prof. James Katende of College of Engineering and
Technology, Botswana International University of Engineering and Technology,
Botswana and Prof. C. O. A. Awosope of the Department of Electrical and Information
Engineering, College of Engineering, Covenant University, Ota. I attest that the thesis
has not been presented either wholly or partly for the award of any degree elsewhere.
All sources of data and scholarly information used in this thesis are duly acknowledged.
SAMUEL Isaac Adekunle ..………………
Signature & Date
v
CERTIFICATION
We certify that the thesis titled “A NEW VOLTAGE STABILITY INDEX FOR
PREDICTING VOLTAGE COLLAPSE IN ELECTRICAL POWER SYSTEM
NETWORKS” is an original work carried out by SAMUEL Isaac Adekunle,
(CUGP07018), in the Department of Electrical and Information Engineering, College of
Engineering, Covenant University, Ota, Ogun State, Nigeria, under the supervision of
Prof. James Katende and Prof. C. O. A. Awosope. We have examined and found the
work acceptable for the award of degree of Doctor of Philosophy in Electrical and
Electronics Engineering (Electrical Power and Machines).
Supervisor:
Prof. James Katende …………………..
Signature & Date
Co-Supervisor
Prof. C.O.A Awosope …………………..
Signature & Date
Head of Department
Dr. Victor O. Matthews .………………….
Signature & Date
External Examiner
Prof. Michael O. Omoigui .………………….
Signature & Date
Dean, School of Postgraduate Studies
Prof. Samuel Wara .………………….
Signature & Date

vi
DEDICATION
This project is dedicated to my beloved wife, Comfort O. Samuel and my children,
Israel Oluwatobiloba Samuel, Miss Lois Toluwani Samuel, Timothy Oluwatosin
Samuel and Titus Oluwatimileyin Samuel.
And to the blessed memory of my father, His Royal Highness, Oba Ayodele Samuel
Agunbole, the Olutade of Itedo-Isanlu, my beloved mother, Deaconess Rachel Mini
Agunbole and my Father-in-law, Pa Christopher Babatunde Ogagun. May their souls
continue to rest in peace. Amen.
vii
ACKNOWLEDGEMENTS
Psalms 115.1: “Not to us, LORD, not to us, but to your name be given glory on account
of your gracious love and faithfulness” (ISV). Thanks are due to the Almighty God
through Jesus Christ for His inspiration, guidance, protection and provision for the
successful completion of this Ph.D programme.
I sincerely appreciate the Management of Covenant University under the leadership of
Prof. A.A.A. Atayero, the Vice-Chancellor and Prof. C.K. Ayo, the immediate past
Vice-Chancellor, for providing a highly conducive environment for research and
learning. I am also indebted to the visionally-extraordinaire and Chancellor of Covenant
University, Dr. David Oyedepo.
My profound gratitude goes to my supervisor, Professor James Katende, who gave me
all the necessary assistance to ensure that this thesis is completed successfully. I am also
indebted to him, as well as his wife, Mrs. O. A. James-Katende and their children, for
being a wonderful and delightful host during my research leave at the Botswana
International University of Science and Technology, Palapye, Botswana. Thanks are
due to my co-supervisor, Professor C. O. A. Awosope, a father and great motivator who
accepted to co-supervise this work in the nick of time. His contributions, encouragement
and support throughout this research work are inestimable and highly treasured, thank
you sir. Much appreciation to my point man at the National Control Centre, Osogbo,
Engr. Eric Hampashi for his kind gesture during data acquisition.
I sincerely appreciate the current Head of Department, Dr. Victor O. Matthews for his
support and encouragements. The immediate past Head of Department, Dr. F. Idachaba
for facilitation of my research leave even when it seemed impossible. I also appreciate
all faculty and staff of the Department for their encouragement and moral support. I say
a very big thank you to you all.

viii
Proverbs 18.24 “…there is a friend that sticketh closer than a brother” (KJV), Dr.
Ayokunle Awelewa, thank you for your words of encouragement, moral and spiritual
support and relevant contributions to this work. I specially acknowledge my academic
mother and mentor, Prof. Alaba Simpson-Badejo; my brothers, sister and brother in-law,
Barr. ‘Yomi Omoyele, for all their support. Thanks are due to the Ogaguns, the
Olokodes and the Ogunjimis for their support.
My heartfelt appreciation goes to Pastor Bunmi and Dapo Ajegunmo, and entire set of
ministers at Calvary Life Assembly, Yaba, Lagos for their prayers and support. I am
greatly indebted to Pastor Rupo Awelewa for his uncommon support. Thank you so
much.
May God bless every one that has contributed in one way or the other to the success of
this program in Jesus’name. It’s my sincere prayer for the full expression of Philip. 4.19
in the lives of everyone that God used to bring this dream to reality. Amen.
ix
TABLE OF CONTENTS
Title Page………………………...………………………………….…………...............ii
Acceptance……………………………………………………………………….…...…iii
Declaration…………..……………………………………………….......………….......iv
Certification…………………...………………………………………………………....v
Dedication…………………………….…….........................……………………...……vi
Acknowledgments………………………………. ……….……………………...…….vii
Table of contents...……………………………………………………………………....ix
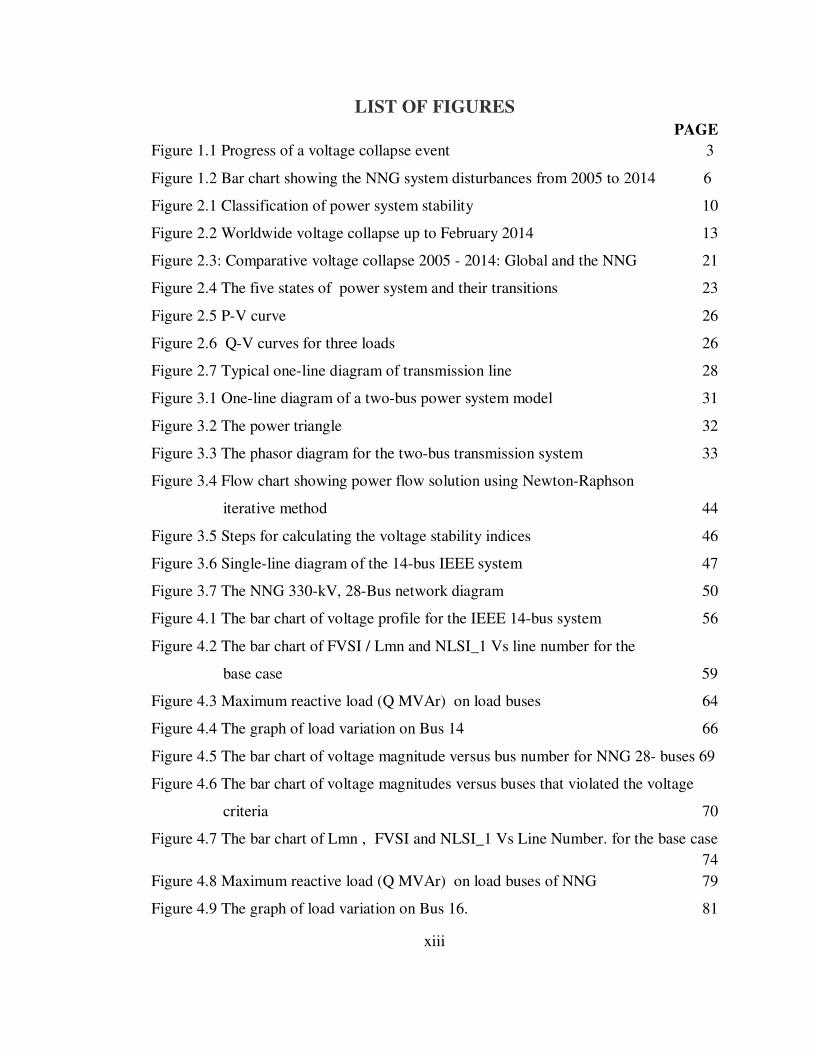
List of Figures…………………………………………………………………...…......xiii
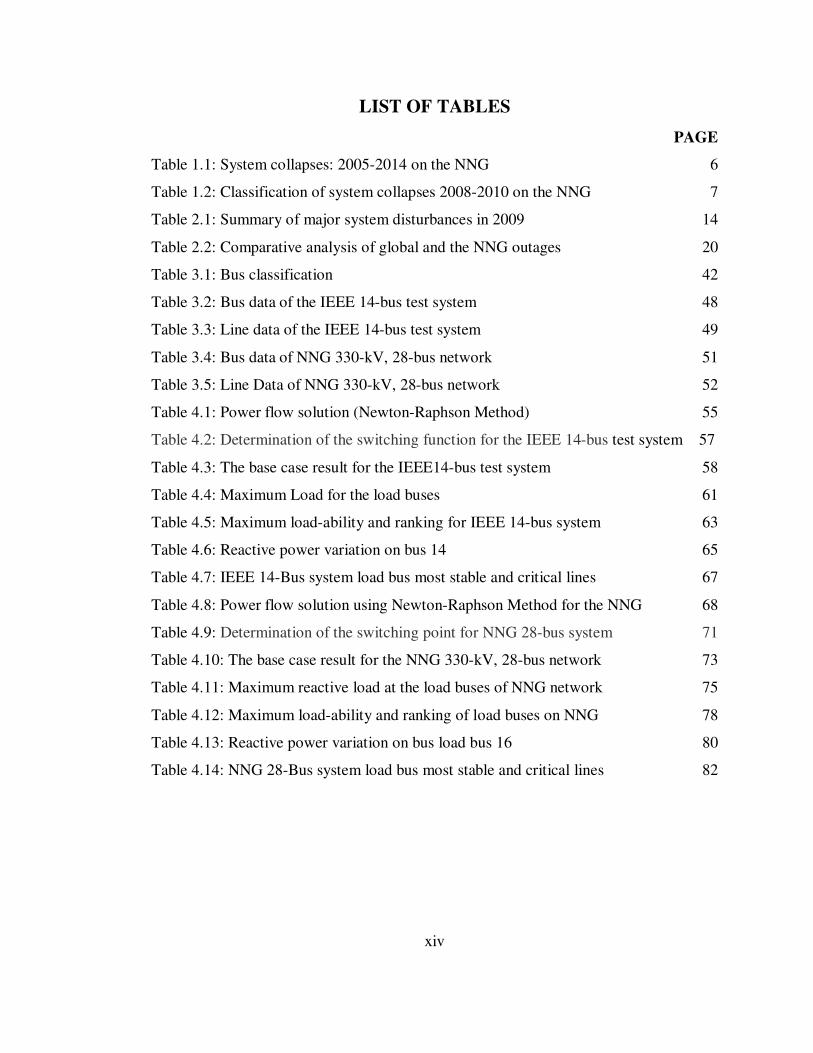
List of Tables………………………………………………………………...…..…….xiv
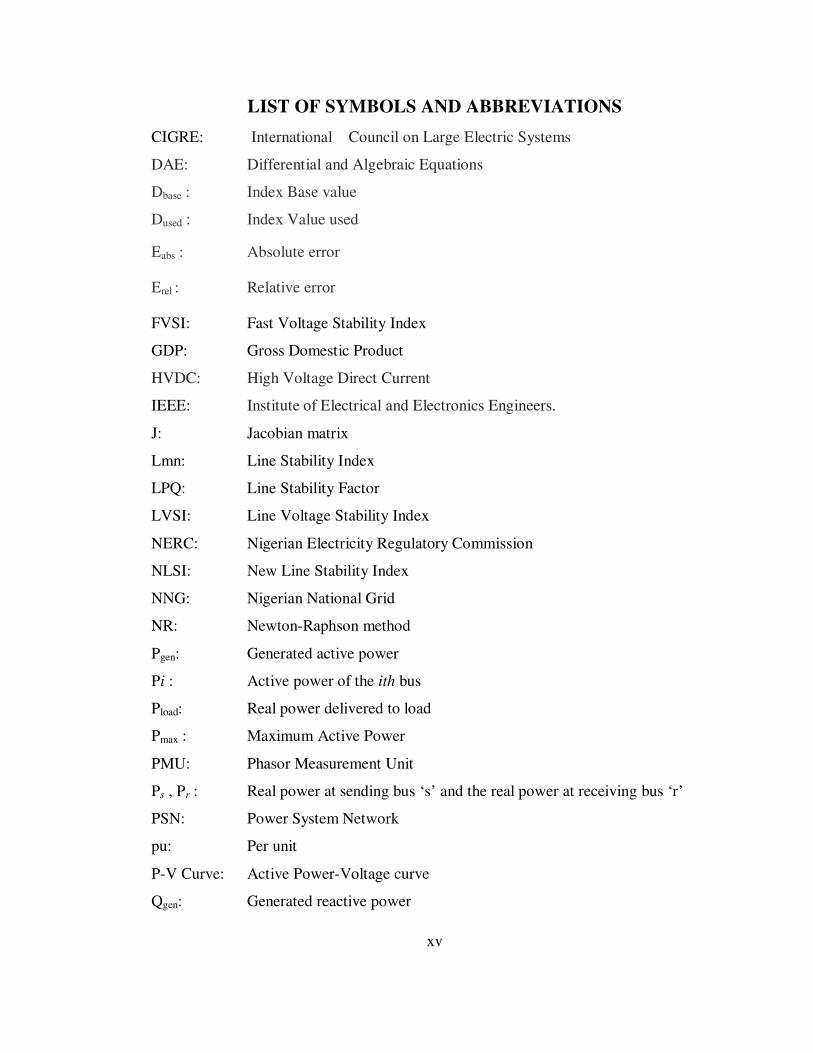
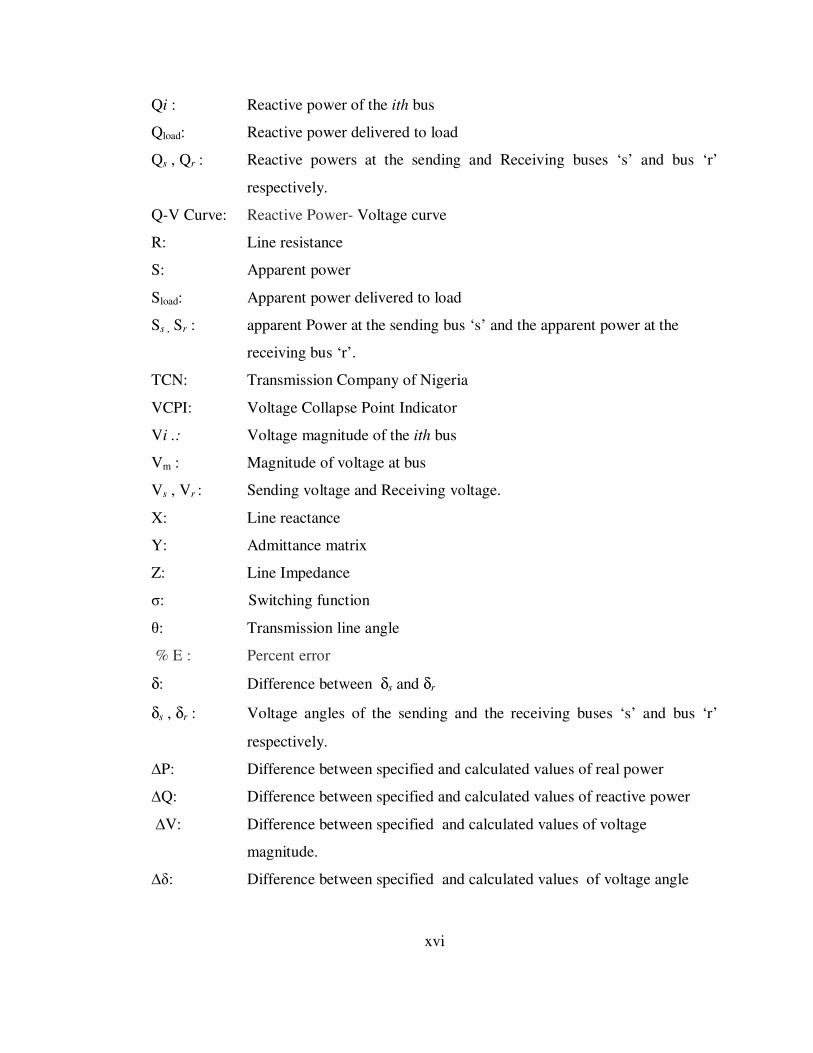
List of Symbols and Abbreviations……………………………………………..……....xv
Abstract………………………………………………..................................................xvii
CHAPTER ONE ………………………………………………………...………….….1
INTRODUCTION………………………………………………………………………1
1.1 Background……………………………………….…….....………...………...…..…1
1.2 Statement of the problem………………………..……………………………….......3
1.3 Aim and objectives.…..……………………...………………...……….....................4
1.4 Justification for the work… …………….…….....………………………………......5
1.5. Scope of the research work………….…….………………...……………....…........8
1.6 Thesis organization……..………………………………………………………....…9
CHAPTER TWO……………………………..…..…………...……...……………….10
LITERATURE REVIEW...…………............……….……...………………………..10
2.1 Introduction………………………………...……………………………....…….....10
2.2 Power system stability ………………………………...…………………….…......10
2.2.1 The basic forms of power system stability………….………………..........……..11
2.2.1.1 Rotor angle stability……….……………….………………..………………….11
2.2.1.2 Frequency stability...............................................................................................11
2.2.1.3 Voltage stability………………...…………………………….………………...12
x
2.3 Difference between angle stability and voltage stability…...….………………......12
2.4 Voltage collapse incidences……………………………….………………………..12
2.5 Voltage stability analysis…………….………………………...…………………...21
2.5.1 Dynamic methods…………………………………………….…..………..……21
2.5.2 Static or steady-state stability methods………………..….…………………...…21
2.6. The operating states of an electric power system ………………...…...…………..22
2.7 Voltage stability indices…………………………………………….………………25
2.7.1 The P-V curve and Q-V curve……………..………………………...………...…25
2.7.2 Modal analysis……………………………………..……………..………………26
2.7.3 L- Index (L) ………………………………………………..…………….…….…27
2.7.4 Line Stability Index (Lmn) ……………………………..………………..........…27
2.7.5 Fast Voltage Stability Index (FVSI).................................................................28
2.7.6 Line Stability Factor, LQP ………………………..………………………......…29
2.7.7 Line Voltage Stability Index, LVSI…………………………..………..…………29
2.7.8 Voltage Collapse Point Indicators (VCPIs)……………..…………………..……30
2.8 Summary…………………………………………………………...…...……......…30
CHAPTER THREE………………………………...……………………………....…31
MATERIALS AND METHODS…………...…….…………………………..………31
3.1 Introduction……………………………………………………………………........31
3.2 The new voltage stability index……………………………………………….……31
3.2.1 New Line Stability Index-1 (NLSI-1)………….…..……………………………..31
3.2.2 Determination of the switching function for the NLSI_1…….……….………….38
3.3 Power flow analysis………………………………………...……………………....39
3.3.1 Classification of power system buses …………...…..…….………..…....41
3.3.2 Power-flow algorithm using Newton Raphson method……..…..…..…....42
3.3.3 Power flow in MATLAB environment ……….………….……..………..43
3.4 Determination of the load-ability and identification of weak bus.............................45
3.5 Description of the case studies………………………..………………………….…46
xi
3.5.1 The IEEE 14-Bus Test System…………………………..……...……………47
3.5.2 The NNG 330-kV, 28-Bus Network…………..……………………………...49
3.6 Summary... ……………………………………………………………...………….53
CHAPTER FOUR …………………………………………………………….………54
RESULTS AND DISCUSSIONS ……………………………………...…...……...…54
4.1 Introduction…………………………………………………………………………54
4.2 Simulations ………………………………………………………………….......…54
4.2.1 Simulation Results of the IEEE 14-bus test system……………...............54
4.2.1.1 Determination of the switching function for IEEE 14-bus System:........56
4.2.1.2 Simulation result for the base case...........................................................58
4.2.1.3 Simulation result for contingency analysis..............................................59
4.2.2 Simulation Results for the NNG 330-kV, 28-Bus Network …………....67
4.2.2.1 Determination of the switching function for 28-bus NNG System:……70
4.2.2.2 Simulation result for the base case..........................................................72
4.2.2.3 Simulation result for contingency analysis……..…………………...….74
4.3 Discussion of the Results………………………………………………...................83
4.3.1 Discussion of the simulation result for the IEEE 14-bus test system………..83
4.3.2 Discussion of the simulation result for the NNG 28-bus system…………….84
4.4 Summary... …………………………………………………………………………85
CHAPTER FIVE ……………………………………………………………………..86
CONCLUSION AND RECOMMENDATIONS …………………………….…..….86
5.1 Summary ……………………………………………………………………….......86
5.2 Achievements and Contribution to Knowledge ……………………………………86
5.3 Recommendations for Future Work …………………………………………..……87
REFERENCE……………………………………….……………………………....…88
APPENDIX A: Program for Power Flow Analysis For IEEE 14-Bus Test System.….95
xii
APPENDIX B: Program for Power Flow Analysis Of The NNG 28-Bus System........98
APPENDIX C: Stability Indices Code For Case Studies…………………..……..….101
APPENDIX D: Published Papers……………………………………...……...…..….104
xiii
LIST OF FIGURES
PAGE
Figure 1.1 Progress of a voltage collapse event 3
Figure 1.2 Bar chart showing the NNG system disturbances from 2005 to 2014 6
Figure 2.1 Classification of power system stability 10
Figure 2.2 Worldwide voltage collapse up to February 2014 13
Figure 2.3: Comparative voltage collapse 2005 - 2014: Global and the NNG 21
Figure 2.4 The five states of power system and their transitions 23
Figure 2.5 P-V curve 26
Figure 2.6 Q-V curves for three loads 26
Figure 2.7 Typical one-line diagram of transmission line 28
Figure 3.1 One-line diagram of a two-bus power system model 31
Figure 3.2 The power triangle 32
Figure 3.3 The phasor diagram for the two-bus transmission system 33
Figure 3.4 Flow chart showing power flow solution using Newton-Raphson
iterative method 44
Figure 3.5 Steps for calculating the voltage stability indices 46
Figure 3.6 Single-line diagram of the 14-bus IEEE system 47
Figure 3.7 The NNG 330-kV, 28-Bus network diagram 50
Figure 4.1 The bar chart of voltage profile for the IEEE 14-bus system 56
Figure 4.2 The bar chart of FVSI / Lmn and NLSI_1 Vs line number for the
base case 59
Figure 4.3 Maximum reactive load (Q MVAr) on load buses 64
Figure 4.4 The graph of load variation on Bus 14 66
Figure 4.5 The bar chart of voltage magnitude versus bus number for NNG 28- buses 69
Figure 4.6 The bar chart of voltage magnitudes versus buses that violated the voltage
criteria 70
Figure 4.7 The bar chart of Lmn , FVSI and NLSI_1 Vs Line Number. for the base case
74
Figure 4.8 Maximum reactive load (Q MVAr) on load buses of NNG 79
Figure 4.9 The graph of load variation on Bus 16. 81
xiv
LIST OF TABLES
PAGE
Table 1.1: System collapses: 2005-2014 on the NNG 6
Table 1.2: Classification of system collapses 2008-2010 on the NNG 7
Table 2.1: Summary of major system disturbances in 2009 14
Table 2.2: Comparative analysis of global and the NNG outages 20
Table 3.1: Bus classification 42
Table 3.2: Bus data of the IEEE 14-bus test system 48
Table 3.3: Line data of the IEEE 14-bus test system 49
Table 3.4: Bus data of NNG 330-kV, 28-bus network 51
Table 3.5: Line Data of NNG 330-kV, 28-bus network 52
Table 4.1: Power flow solution (Newton-Raphson Method) 55
Table 4.2: Determination of the switching function for the IEEE 14-bus test system 57
Table 4.3: The base case result for the IEEE14-bus test system 58
Table 4.4: Maximum Load for the load buses 61
Table 4.5: Maximum load-ability and ranking for IEEE 14-bus system 63
Table 4.6: Reactive power variation on bus 14 65
Table 4.7: IEEE 14-Bus system load bus most stable and critical lines 67
Table 4.8: Power flow solution using Newton-Raphson Method for the NNG 68
Table 4.9: Determination of the switching point for NNG 28-bus system 71
Table 4.10: The base case result for the NNG 330-kV, 28-bus network 73
Table 4.11: Maximum reactive load at the load buses of NNG network 75
Table 4.12: Maximum load-ability and ranking of load buses on NNG 78
Table 4.13: Reactive power variation on bus load bus 16 80
Table 4.14: NNG 28-Bus system load bus most stable and critical lines 82
xv
LIST OF SYMBOLS AND ABBREVIATIONS
CIGRE: International Council on Large Electric Systems
DAE: Differential and Algebraic Equations
Dbase : Index Base value
Dused : Index Value used
Eabs : Absolute error
Erel : Relative error
FVSI: Fast Voltage Stability Index
GDP: Gross Domestic Product
HVDC: High Voltage Direct Current
IEEE: Institute of Electrical and Electronics Engineers.
J: Jacobian matrix
Lmn: Line Stability Index
LPQ: Line Stability Factor
LVSI: Line Voltage Stability Index
NERC: Nigerian Electricity Regulatory Commission
NLSI: New Line Stability Index
NNG: Nigerian National Grid
NR: Newton-Raphson method
Pgen: Generated active power
Pi : Active power of the ith bus
Pload: Real power delivered to load
Pmax : Maximum Active Power
PMU: Phasor Measurement Unit
Ps , Pr : Real power at sending bus ‘s’ and the real power at receiving bus ‘r’
PSN: Power System Network
pu: Per unit
P-V Curve: Active Power-Voltage curve
Qgen: Generated reactive power
xvi
Qi : Reactive power of the ith bus
Qload: Reactive power delivered to load
Qs , Qr : Reactive powers at the sending and Receiving buses ‘s’ and bus ‘r’
respectively.
Q-V Curve: Reactive Power- Voltage curve
R: Line resistance
S: Apparent power
Sload: Apparent power delivered to load
Ss , Sr : apparent Power at the sending bus ‘s’ and the apparent power at the
receiving bus ‘r’.
TCN: Transmission Company of Nigeria
VCPI: Voltage Collapse Point Indicator
Vi .: Voltage magnitude of the ith bus
Vm : Magnitude of voltage at bus
Vs , Vr : Sending voltage and Receiving voltage.
X: Line reactance
Y: Admittance matrix
Z: Line Impedance
σ: Switching function
θ: Transmission line angle
% E : Percent error
δ: Difference between δs and δr
δs , δr : Voltage angles of the sending and the receiving buses ‘s’ and bus ‘r’
respectively.
∆P: Difference between specified and calculated values of real power
∆Q: Difference between specified and calculated values of reactive power
∆V: Difference between specified and calculated values of voltage
magnitude.
∆δ: Difference between specified and calculated values of voltage angle
xvii
ABSTRACT Power system voltage instability often results in voltage collapse and/or system blackout which is a source of concern for power network operators and consumers. This work proposes a new line stability index that is suitable for investigating the voltage stability condition of Power System Networks (PSNs). This index, which is called the New Line Stability Index-1 (NLSI_1), is derived from first principles and shown to incorporate the Line Stability Index (Lmn) and the Fast Voltage Stability Index (FVSI), with an associated switching logic based on the voltage angle difference since it can indicate the incidence of voltage collapse. The NLSI_1 aims at improving the accuracy and speed of identifying the weakest bus associated critical lines with respect to a bus for purposes of optimally placing compensation devices as well as investigating the effect of increasing reactive power loading on the PSN. The developed index (NLSI_1) was tested on the IEEE 14-bus system and the present 28-bus, 330-kV Nigeria National Grid (NNG) using a program coded in the MATLAB environment. The three indices were then simulated for the base case and the contingency – variation of the reactive loads in the network. For the base case, the IEEE 14-bus test system was stable with all the three indices approximately equal and < 1 for all the lines. Contingency simulations were carried out revealing that bus 14 ranks as the weakest bus of the system, with the smallest reactive load of 74.6 MVAr among the load buses. The values of the indices, Lmn, FVSI and NSLI_1 are approximately equal for the IEEE 14-bus system thereby validating the efficacy of the new line stability index-1 (NLSI_1). For the NNG system, the power flow solution showed that the voltage profiles for load buses 9, 13,14,16,19 and 22 (Kano, Gombe, New Haven, Jos, Ayede and Onitsha, respectively) have voltage magnitudes 0.932, 0.905, 0.949, 0.844. 0.93, and 0.818 p.u, respectively against the voltage criterion of 0.95 p.u. These low voltages are indication that the network buses are prone to voltage instability. The base case of the NNG simulation values for all three indices (Lmn, FVSI and NLSI_1) were less than unity (<1) for all the lines. Hence, in the base case, the NNG is stable. It was observed that the three indices’ values are almost equal (the largest difference being 0.004) which further validates the newly derived index, NLSI_1. In the simulation of the contingency scenario, load bus 16 (Gombe) was observed to be the weakest since it has the smallest maximum permissible reactive load of 139.5 MVAr with the stability indices, Lmn=0.95474, FVSI=1.00942 and NLSI_1=1.00942 indicating incipient instability of the bus. The new line stability index-1 (NLSI_1) combines the accuracy of the Lmn index and the fastness of the FVSI index for an improved voltage stability prediction. Keywords: Voltage stability, Voltage collapse, Voltage stability indices, Weakest bus, Power system networks, NNG, MATLAB, Critical line.
1
CHAPTER ONE
INTRODUCTION
1.1 Background
The voltage stability of a power system network (PSN) has, over the past two decades,
become a critical concern with respect to system design, planning, and operation. This is
in view of the fact that globally, PSNs have undergone major developments culminating
in the unbundling of vertically integrated entities to operate under different power utility
companies. Consequently, driven by market forces and profitability, the new power
utility companies operate the power transmission corridors close to voltage stability
limits (Arya, 2006; Samuel et al, 2014). This has led to several violations of overall
system stability limits resulting in PSN voltage collapse incidences around the world
with high cost implications to both utilities and consumers (Goh et al, 2015; Hasani, and
Parniani, 2005). A PSN must therefore be monitored so as to predict and create an alert
of possible occurrence of voltage collapse incidences.
In recent years, following the unbundling and privatization of power system networks,
their management has become increasingly more challenging in the face of systems
being operated close to their security limits; with restricted expansion due to economic
and environmental constraints and increasingly longer transmission lines. Privatization
has also meant a reduction in manpower available for system supervision and operation.
The number of system blackouts in the past decade attests to the fact that work still
needs to be done to tackle the problem of voltage instability and the resultant voltage
collapse.
The function of a PSN is to generate and transmit power to load centres at specified
voltage and frequency levels. Statutory limits exist for system voltage and frequency
variations about base levels (Samuel et al., 2014 (a)). Today’s PSNs are said to be weak,
heavily loaded and highly prone to voltage instability. This is due to increasing load
demand resulting from population growth and industrialization, as well as
environmental and economic factors. These hamper the construction of new
2
transmission lines and generating stations to cater for increasing demand (Reddy and
Manohar, 2012 ; Hasani and Parniani, 2005).
Voltage stability as defined by P. Kundur is “the ability of a power system to maintain
steady and acceptable voltages at all buses in the system at normal operating conditions
and after being subjected to a disturbance” (Kundur, 1994). It is desired that the power
system remains in an equilibrium state under normal conditions and it is expected to
react to restore the status of the system to acceptable conditions after a disturbance, i.e.
the voltage after a disturbance is restored to a value close to the pre-disturbance
situation.
A PSN is said to enter a state of voltage instability when a disturbance causes a gradual
and uncontrollable decline in voltage (Sarat et al., 2012). The causes of voltage
instability are contingencies (line or generator outage due to faults), sudden increase in
load, external factors, or improper operation of voltage control devices. More
importantly, voltage instability can surface where there is a mismatch between supply
and demand of reactive power, that is, inability of the system to meet the reactive power
requirements. Unmitigated voltage instability caused by excessive load on a PSN leads
to a decline in system voltage and ultimately a voltage collapse resulting in a partial or
total system blackout. This has severe consequence on system security and it jeopardizes
the essential service of delivering uninterrupted and reliable power supply to customers
(Veleba and Nestorovic, 2013).
In real-time PSN operation, it is very important that voltage stability analysis is
performed and a stability index used to monitor the voltage stability proximity to
collapse and to predict the imminent danger of collapse early enough. This is with a
view to alerting system operators to take neccessary action to avert a voltage collapse
thereby, making the PSN more secure and reliable. Figure 1.1, shows the progress of a
voltage collapse phenomenon.
3
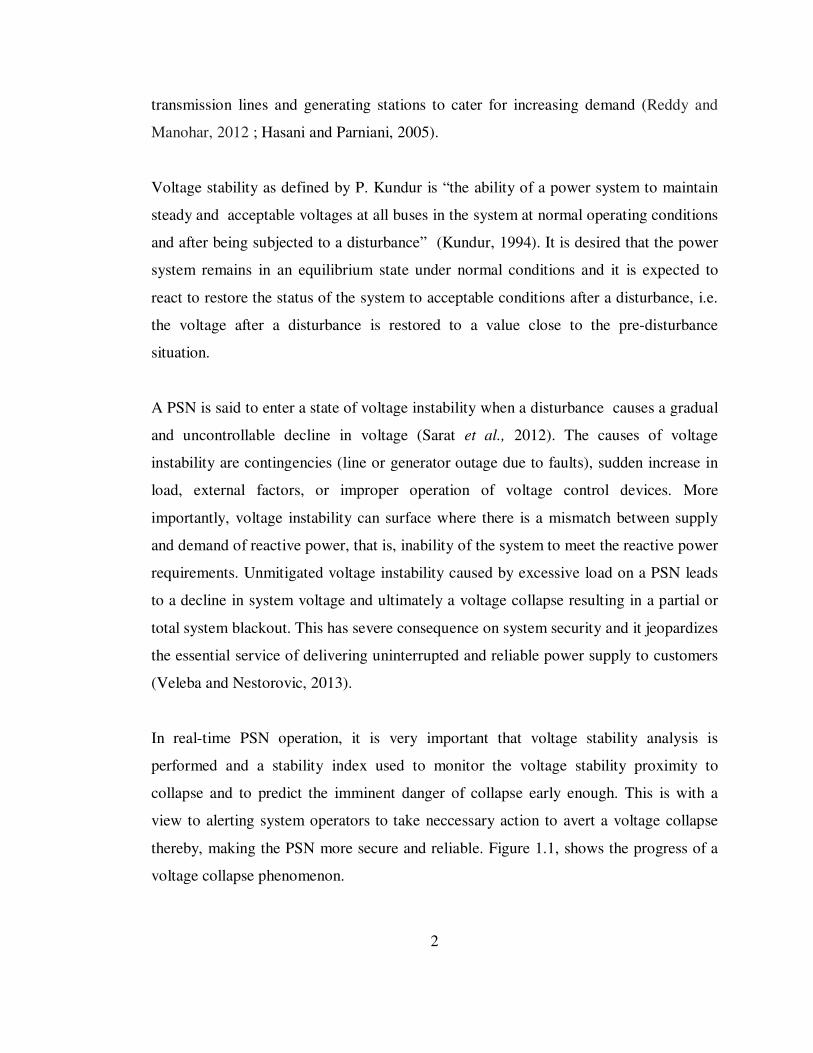
Figure 1.1: Progress of a voltage collapse event (Samuel et al., 2014 (a))
The system voltage decreases slowly as the demand increases until a critical point is
reached. At this point, any slight increase in demand will give rise to a large decrease in
voltage, until the demand can no longer be met, and eventually leads to voltage collapse
on the system (Samuel et al, 2014 (a)). Consequently this experience on PSN creates a
need to develop and derive reliable voltage stability indices for PSN assessment.
1.2 Statement of the Problem
Voltage collapse in a PSN is an undesirable phenomenon that occurs due to voltage
instability. Its occurrence is not frequent in developed countries despite their large and
complex networks (though it still poses a threat to continuity of supply to consumers)
but it occurs more frequently on the power networks of most developing countries
including Nigeria.
Voltage collapses are highly catastrophic anytime they occur. Some instances of power
system collapse experienced in recent times across the world have been reported in
Kundur, (1994), Taylor, (1994), Kundur et al., (2004), Ali, (2005), Anyanwu, (2005),
and Sunday, (2009).
In a developing country like Nigeria, the national grid experiences high rate of voltage
collapse leading to either partial or total system collapse (blackout), which greatly
4
impairs socio-economic development and industrialization. This high rate of system
collapse is attributed to the fact that the Nigerian National Grid (NNG) is weak and
highly stressed, with long and radial transmission lines, hence lacking flexibility (Ali,
2005; Anyanwu, 2005; Amoda, 2007; Sunday, 2009 and Samuel, et al., 2014 (a)). When
a voltage collapse occurs, restoration of power may take a long time.
The present study seeks to develop a voltage stability index suitable for PSN monitoring
for purposes of predicting incipient system voltage instability and the possibility of a
voltage collapse event. The study will also identify the weak bus and critical lines with
respect to a bus in order to determine the optimum deployment of the compensation
devices and voltage collapse relays within the PSN.
1.3 Aim and Objectives of the Study
The primary aim of this study is to assess and predict voltage collapse in power system
networks.
The objectives to achieve the aim are as follows:
(i) Develop a new voltage stability index suitable for predicting voltage collapse of
power system networks.
(ii) Investigating the proposed voltage stability index in MATLAB environment and
its application to the simulation of:
a) the IEEE 14-bus network and comparing it with the existing stability
indices for validation of the proposed voltage stability index.
b) a practical system: the NNG 28-bus system and comparing it with
the existing stability indices with a view to determining closeness to
voltage collapse, maximum loadability, the critical line, and the
ranking of vulnerable buses.
5
(iii) Apply Newton-Raphson method of power-flow analysis to analyze the IEEE 14-
bus power system and the NNG 28-bus, 330-kV power system in order to
generate the data required to calculate the voltage stability indices.
(iv) Simulate the voltage stability using MATLAB, R2012a (7.14.0739) 32-bit
(win32) environment for the base case and contingencies using the data
generated from the power flow solution.
1.4 Justification for the Research
Today’s power system networks are being operated closer to their transmission capacity
limits due to economic and environmental constraints (Ali, 2014). The major blackouts
or voltage collapse incidences have been linked to voltage instability which places
limitation to system operations. The inconveniences and economic cost which the
voltage collapse incidences inflict on customers (both domestic and industrial) are
enormous and unpleasant. In Nigeria, the resultant power outages are estimated to cost
the nation the sum of $1 billion per year, i.e. 2.5% the gross domestic product (Amoda,
2007). Inadequate electricity supply has led to the closure of several industries in
Nigeria. Small businesses and manufacturers are also affected by the poor performance
of the utility companies (Samuel et al., 2014(a)). The World Bank reported the loss of
$100b in one year due to daily blackouts experienced in Nigeria (Channels TV, 2015). It
further stated that these daily power outages have made investors weary of investing in
the Nigerian economy (Ogbonna, 2015).
Research on voltage collapse of the Nigerian National Grid (NNG) is scanty at the
moment and the available statistics shows that the rate of voltage collapse on the NNG
is very high. Table1.1 shows the statistical data of both partial (p/c) and total (t/c)
collapses on the NNG from January 2005 to December 2014 (Samuel et al., 2014 (a)).
6
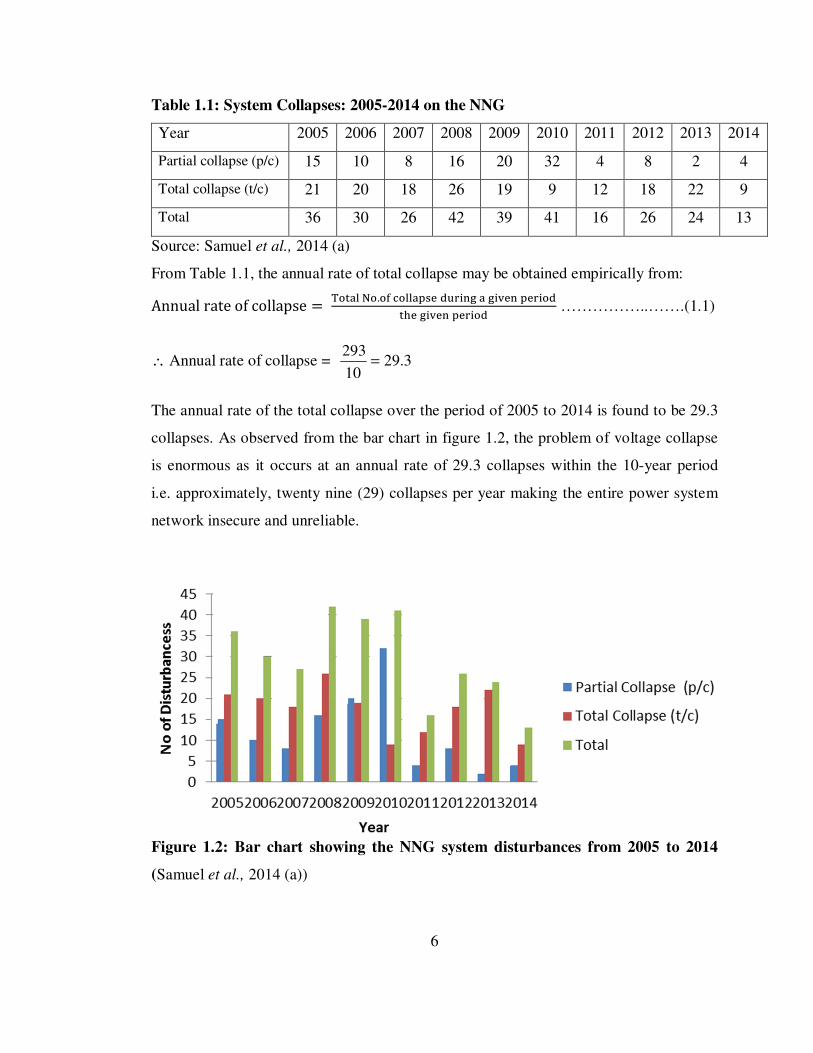
Table 1.1: System Collapses: 2005-2014 on the NNG
Year 2005 2006 2007 2008 2009 2010 2011 2012 2013 2014
Partial collapse (p/c) 15 10 8 16 20 32 4 8 2 4
Total collapse (t/c) 21 20 18 26 19 9 12 18 22 9
Total 36 30 26 42 39 41 16 26 24 13
Source: Samuel et al., 2014 (a)
From Table 1.1, the annual rate of total collapse may be obtained empirically from:
Annualrateofcollapse � �������.�������������� !�!�"� �������#�!�"� ������ ……………..…….(1.1)
∴ Annual rate of collapse = 3.2910
293=
The annual rate of the total collapse over the period of 2005 to 2014 is found to be 29.3
collapses. As observed from the bar chart in figure 1.2, the problem of voltage collapse
is enormous as it occurs at an annual rate of 29.3 collapses within the 10-year period
i.e. approximately, twenty nine (29) collapses per year making the entire power system
network insecure and unreliable.
Figure 1.2: Bar chart showing the NNG system disturbances from 2005 to 2014
(Samuel et al., 2014 (a))
7
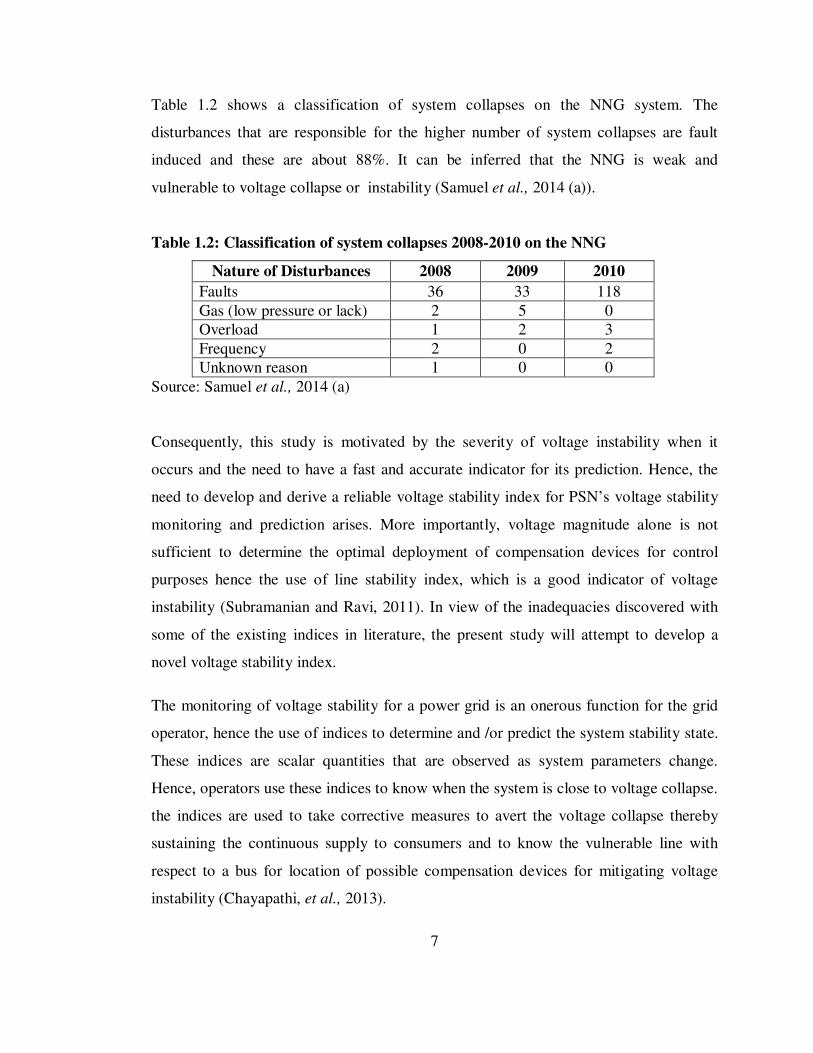
Table 1.2 shows a classification of system collapses on the NNG system. The
disturbances that are responsible for the higher number of system collapses are fault
induced and these are about 88%. It can be inferred that the NNG is weak and
vulnerable to voltage collapse or instability (Samuel et al., 2014 (a)).
Table 1.2: Classification of system collapses 2008-2010 on the NNG
Nature of Disturbances 2008 2009 2010
Faults 36 33 118
Gas (low pressure or lack) 2 5 0 Overload 1 2 3
Frequency 2 0 2 Unknown reason 1 0 0
Source: Samuel et al., 2014 (a)
Consequently, this study is motivated by the severity of voltage instability when it
occurs and the need to have a fast and accurate indicator for its prediction. Hence, the
need to develop and derive a reliable voltage stability index for PSN’s voltage stability
monitoring and prediction arises. More importantly, voltage magnitude alone is not
sufficient to determine the optimal deployment of compensation devices for control
purposes hence the use of line stability index, which is a good indicator of voltage
instability (Subramanian and Ravi, 2011). In view of the inadequacies discovered with
some of the existing indices in literature, the present study will attempt to develop a
novel voltage stability index.
The monitoring of voltage stability for a power grid is an onerous function for the grid
operator, hence the use of indices to determine and /or predict the system stability state.
These indices are scalar quantities that are observed as system parameters change.
Hence, operators use these indices to know when the system is close to voltage collapse.
the indices are used to take corrective measures to avert the voltage collapse thereby
sustaining the continuous supply to consumers and to know the vulnerable line with
respect to a bus for location of possible compensation devices for mitigating voltage
instability (Chayapathi, et al., 2013).
8
1.5 Scope of Research Work
The scope of this research work is limited to the study of voltage stability and prediction
of voltage collapse on PSNs with line stability indices.
This research work focuses on the prediction of voltage collapse on PSN using a
developed voltage stability line index. The study helps to identify the weak bus, critical
lines with respect to a bus in order to determine the optimum placement of
compensation devices and voltage collapse relay on the PSN and to investigate the
effect of increasing reactive power loading on the power system network. The
developed index is tested on simulated model of IEEE 14-bus system for validation of
the index and then investigated on the simulated model of the present 28-bus, 330-kV
NNG. The simulations were carried out in the MATLAB, R2012a (7.14.0739) 32-bit
(win32) environment.
1.6 Thesis Organization
The rest of the thesis is organized as follows:
Chapter two presents an overview of power system stability and a review of voltage
stability indices. Chapter three focuses on derivation of the novel voltage stability index
being proposed for voltage collapse prediction. Chapter four validates the newly
proposed line stability index and presents simulation results and discussions while
Chapter five presents the conclusions drawn from the study and proffers suggestions for
further work.
9
CHAPTER TWO
LITERATURE REVIEW
2.1 Introduction
This chapter provides an overview of the relevant technical literature related to the
present study. It begins by defining power system stability and its classification. The
major voltage collapse incidences across the world are reviewed. Differentiation is made
between rotor angle and voltage stabilities. The five states of a PSN are reviewed
together with the existing line stability indices for predicting voltage instability.
2.2 Power System Stability
A power system is a complex dynamic system made up of linear and nonlinear
subsystems and constantly subjected to internal and external disturbances. Power system
stability can be defined as the ability of the power system to remain in state of
equilibrium under normal operating conditions and to regain an acceptable state of
equilibrium after being subjected to a disturbance (Kundur, 1994).
According to the IEEE/CIGRE, joint task force (in Kundur et al., 2004), “Power system
stability is the ability of an electric power system, for a given initial operating condition,
to regain a state of operating equilibrium after being subjected to a physical disturbance,
with most system variables bounded so that practically the entire system remains intact.”
Figure 2.1 shows the classification of power system stability according to the
IEEE/CIGRE joint task force.
10
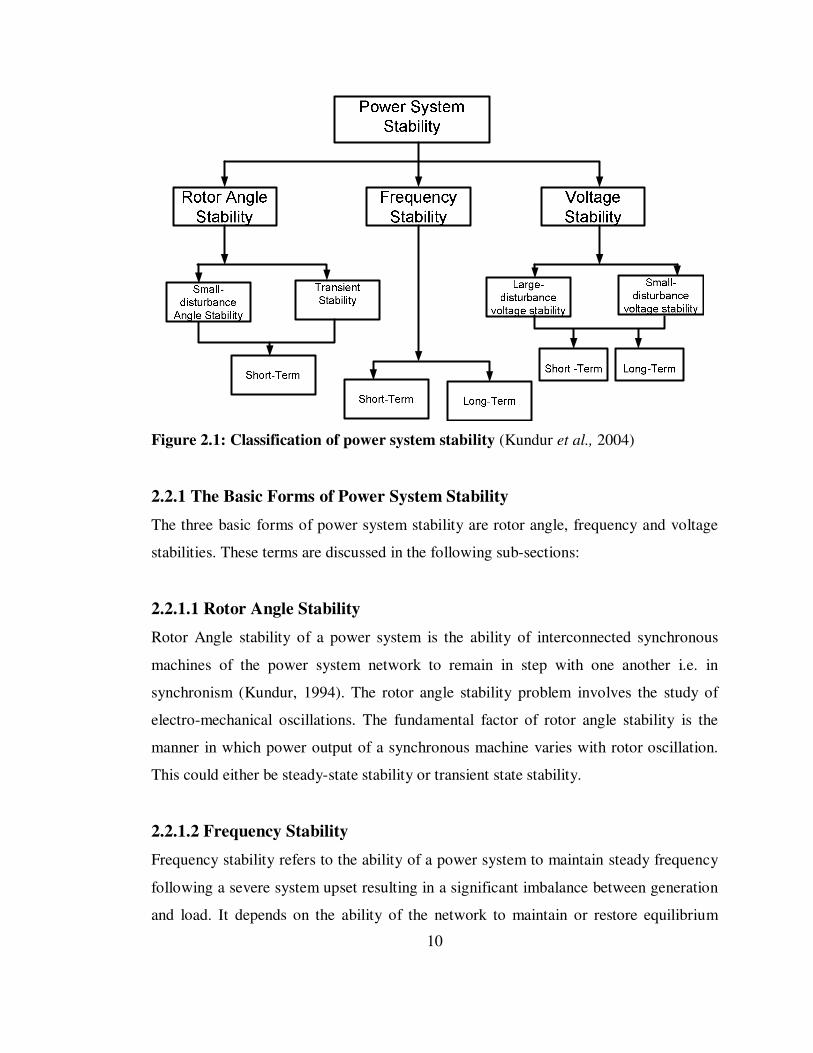
Figure 2.1: Classification of power system stability (Kundur et al., 2004)
2.2.1 The Basic Forms of Power System Stability
The three basic forms of power system stability are rotor angle, frequency and voltage
stabilities. These terms are discussed in the following sub-sections:
2.2.1.1 Rotor Angle Stability
Rotor Angle stability of a power system is the ability of interconnected synchronous
machines of the power system network to remain in step with one another i.e. in
synchronism (Kundur, 1994). The rotor angle stability problem involves the study of
electro-mechanical oscillations. The fundamental factor of rotor angle stability is the
manner in which power output of a synchronous machine varies with rotor oscillation.
This could either be steady-state stability or transient state stability.
2.2.1.2 Frequency Stability
Frequency stability refers to the ability of a power system to maintain steady frequency
following a severe system upset resulting in a significant imbalance between generation
and load. It depends on the ability of the network to maintain or restore equilibrium
11
between system generation and load, with minimum unintentional loss of load.
Generally, frequency stability problems are associated with inadequacies in equipment
responses, poor coordination of control and protection equipment, or insufficient
generation reserve (Kundur, 1994 and Kundur, et al., 2004). Frequency stability could
be short-term (which ranges from a fraction of a second) or a long-term phenomenon as
shown in figure 2.1.
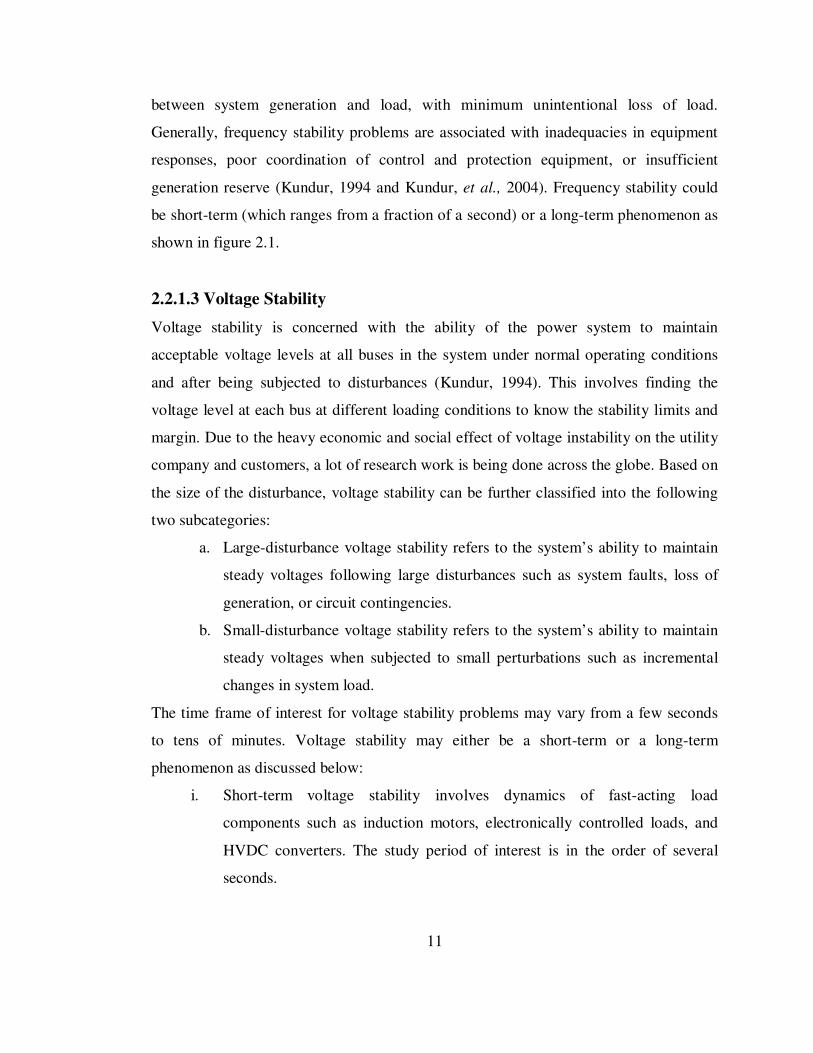
2.2.1.3 Voltage Stability
Voltage stability is concerned with the ability of the power system to maintain
acceptable voltage levels at all buses in the system under normal operating conditions
and after being subjected to disturbances (Kundur, 1994). This involves finding the
voltage level at each bus at different loading conditions to know the stability limits and
margin. Due to the heavy economic and social effect of voltage instability on the utility
company and customers, a lot of research work is being done across the globe. Based on
the size of the disturbance, voltage stability can be further classified into the following
two subcategories:
a. Large-disturbance voltage stability refers to the system’s ability to maintain
steady voltages following large disturbances such as system faults, loss of
generation, or circuit contingencies.
b. Small-disturbance voltage stability refers to the system’s ability to maintain
steady voltages when subjected to small perturbations such as incremental
changes in system load.
The time frame of interest for voltage stability problems may vary from a few seconds
to tens of minutes. Voltage stability may either be a short-term or a long-term
phenomenon as discussed below:
i. Short-term voltage stability involves dynamics of fast-acting load
components such as induction motors, electronically controlled loads, and
HVDC converters. The study period of interest is in the order of several
seconds.
12
ii. Long-term voltage stability involves slower-acting equipment such as
tapchanging transformers, thermostatically controlled loads, and generator
current limiters. The study period of interest may extend to several or many
minutes. Note that long-term simulations are required for analysis of system
dynamic performance (Kundur et al., 2004; Ajjarapu and Meliopoulos,
2008).
2.3 Difference between Angle Stability and Voltage Stability
Traditionally, the power system stability issue has been the rotor angle stability, i.e.
maintaining synchronous operation in the PSN. Instability in PSN may also occur
without loss of synchronism in the PSN. The rotor angle stability problem involves the
study of electro-mechanical oscillations (Bhaladhare et al.,2013). A power system is
voltage stable if its bus voltages after a disturbance are close to voltages at normal
operating conditions and it becomes unstable when voltages uncontrollably decrease due
to outage of equipment or increment of load. Voltage stability and rotor angle stability
are interrelated. Meanwhile, the rotor angle stability as well as voltage stability are
affected by reactive power control. Voltage stability is basically load dependent and
rotor angle stability is basically generation dependent. It can be said that angle stability
related issues are encountered when the balance between real power generation and the
load is not zero. On the other hand, voltage stability related problem is encountered in
the system when the balance between the reactive power generation and load is not zero.
2.4 Voltage Collapse Incidences
Voltage collapse may be the resultant effect of voltage instability in a PSN. Voltage
instability is the process by which voltage falls to a very low value as a result of series
of events. The world has witnessed several voltage collapse incidences in the last
decades – prominent incidents that attracted much attention happened in Belgium
(August, 1982), Sweden (December, 1983), Tokyo (July, 1987), Tennessee (August,
1987) and Hydro Quebec (March, 1989), Andersson et al., (2005), Pourbeik et al.,
2006). Many major blackouts caused by voltage instability have illustrated the
13
importance of this phenomenon (Kundur, et al., 2004) and (Taylor, 1994). In view of the
present deregulation of the electrical power industry worldwide, power systems have
evolved through continuing growth in interconnections resulting in more complexity,
use of new control technologies, and in the increased operation in highly stressed
conditions. This has given rise to different forms of system instability.
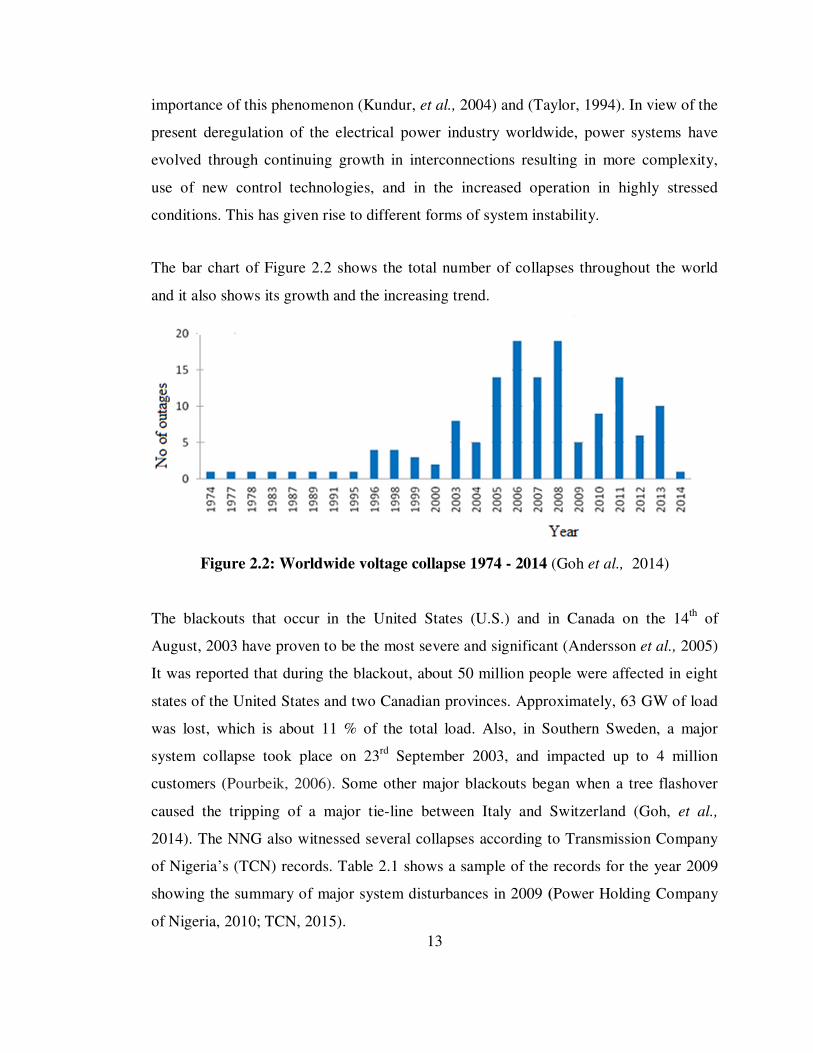
The bar chart of Figure 2.2 shows the total number of collapses throughout the world
and it also shows its growth and the increasing trend.
Figure 2.2: Worldwide voltage collapse 1974 - 2014 (Goh et al., 2014)
The blackouts that occur in the United States (U.S.) and in Canada on the 14th of
August, 2003 have proven to be the most severe and significant (Andersson et al., 2005)
It was reported that during the blackout, about 50 million people were affected in eight
states of the United States and two Canadian provinces. Approximately, 63 GW of load
was lost, which is about 11 % of the total load. Also, in Southern Sweden, a major
system collapse took place on 23rd September 2003, and impacted up to 4 million
customers (Pourbeik, 2006). Some other major blackouts began when a tree flashover
caused the tripping of a major tie-line between Italy and Switzerland (Goh, et al.,
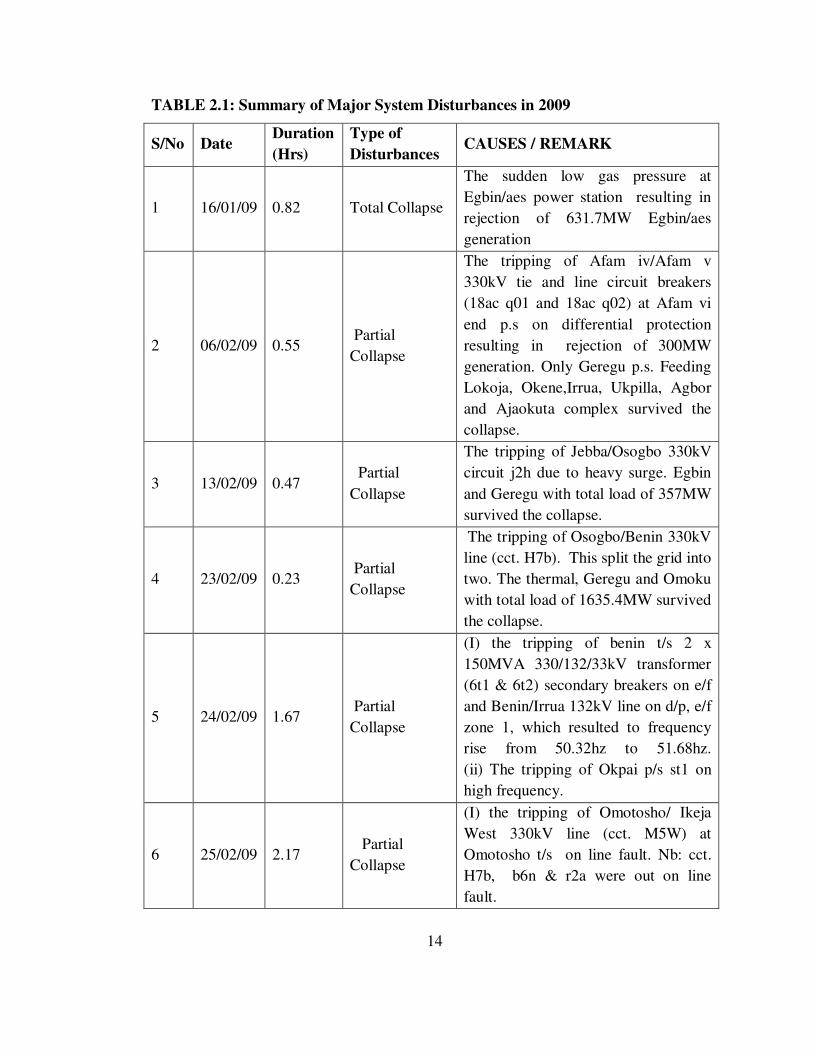
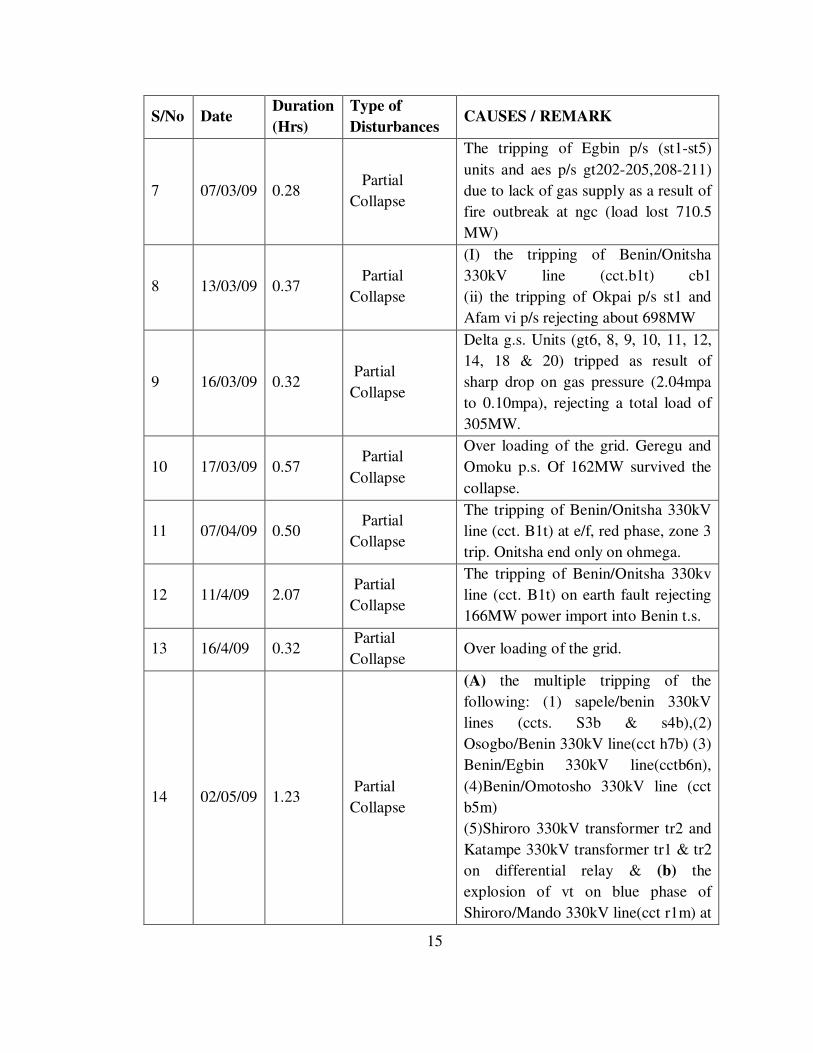
2014). The NNG also witnessed several collapses according to Transmission Company
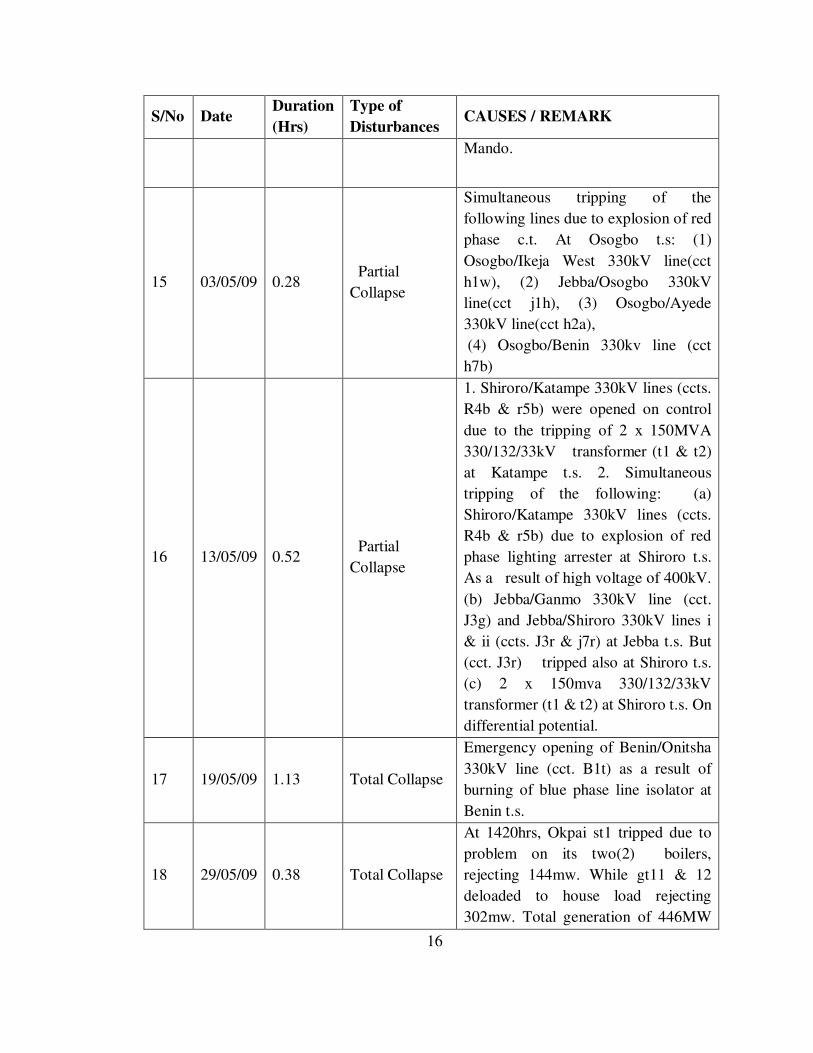
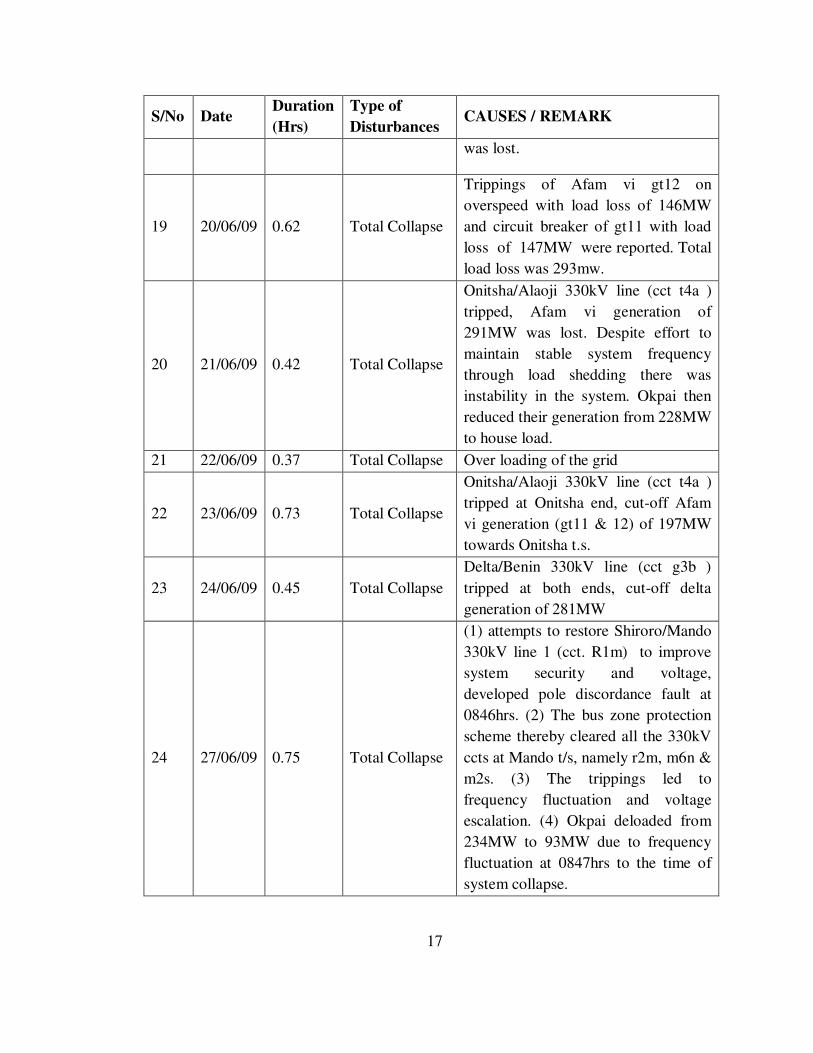
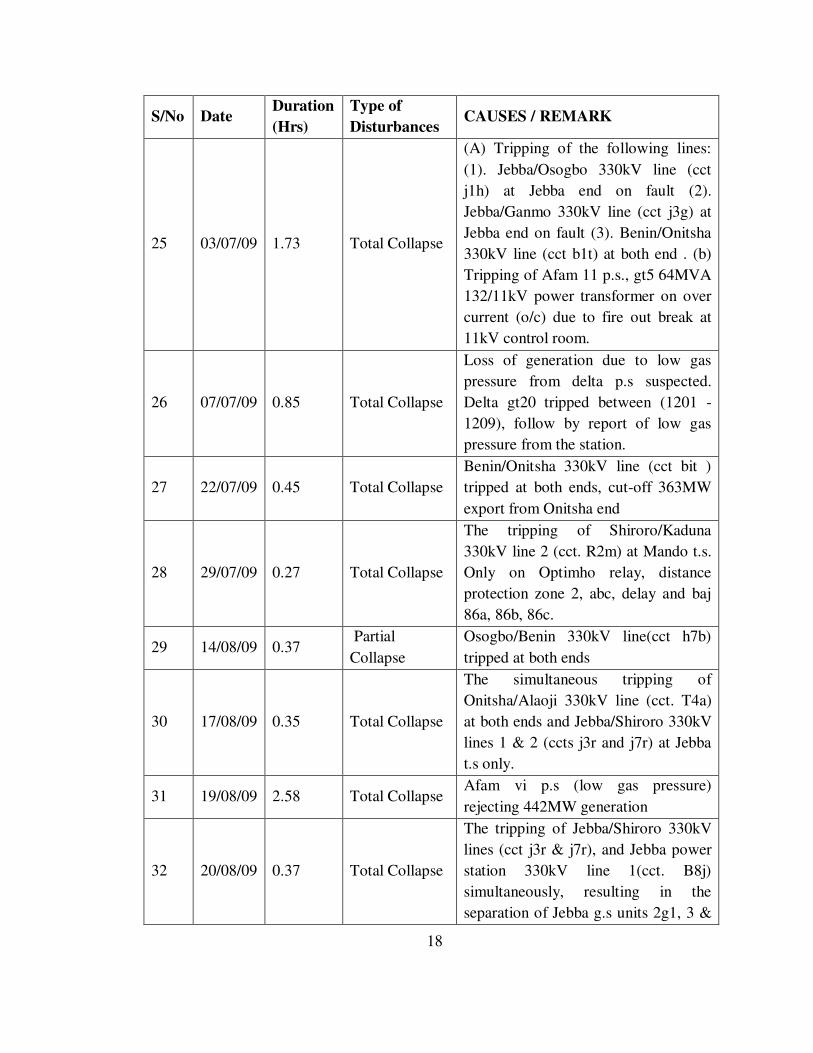
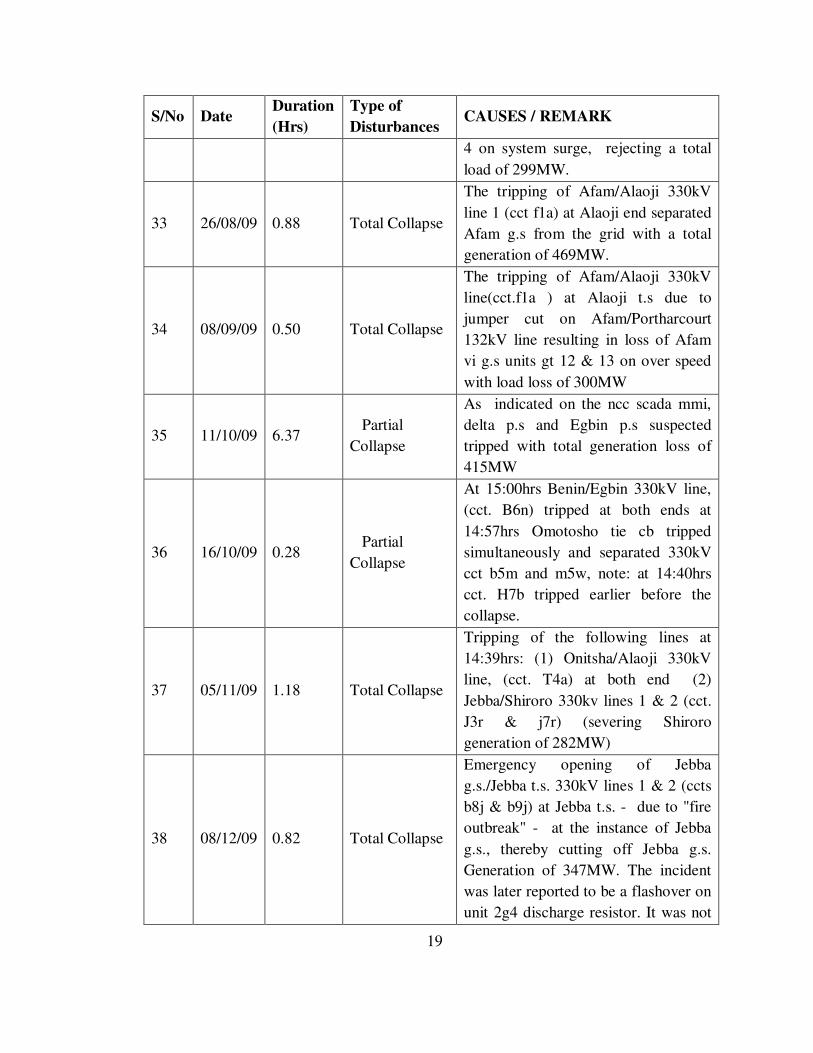
of Nigeria’s (TCN) records. Table 2.1 shows a sample of the records for the year 2009
showing the summary of major system disturbances in 2009 (Power Holding Company
of Nigeria, 2010; TCN, 2015).
14
TABLE 2.1: Summary of Major System Disturbances in 2009
S/No Date Duration
(Hrs)
Type of
Disturbances CAUSES / REMARK
1 16/01/09 0.82 Total Collapse
The sudden low gas pressure at
Egbin/aes power station resulting in
rejection of 631.7MW Egbin/aes
generation
2 06/02/09 0.55 Partial
Collapse
The tripping of Afam iv/Afam v
330kV tie and line circuit breakers
(18ac q01 and 18ac q02) at Afam vi
end p.s on differential protection
resulting in rejection of 300MW
generation. Only Geregu p.s. Feeding
Lokoja, Okene,Irrua, Ukpilla, Agbor
and Ajaokuta complex survived the
collapse.
3 13/02/09 0.47 Partial
Collapse
The tripping of Jebba/Osogbo 330kV
circuit j2h due to heavy surge. Egbin
and Geregu with total load of 357MW
survived the collapse.
4 23/02/09 0.23 Partial
Collapse
The tripping of Osogbo/Benin 330kV
line (cct. H7b). This split the grid into
two. The thermal, Geregu and Omoku
with total load of 1635.4MW survived
the collapse.
5 24/02/09 1.67 Partial
Collapse
(I) the tripping of benin t/s 2 x
150MVA 330/132/33kV transformer
(6t1 & 6t2) secondary breakers on e/f
and Benin/Irrua 132kV line on d/p, e/f
zone 1, which resulted to frequency
rise from 50.32hz to 51.68hz.
(ii) The tripping of Okpai p/s st1 on
high frequency.
6 25/02/09 2.17 Partial
Collapse
(I) the tripping of Omotosho/ Ikeja
West 330kV line (cct. M5W) at
Omotosho t/s on line fault. Nb: cct.
H7b, b6n & r2a were out on line
fault.
15
S/No Date Duration
(Hrs)
Type of
Disturbances CAUSES / REMARK
7 07/03/09 0.28 Partial
Collapse
The tripping of Egbin p/s (st1-st5)
units and aes p/s gt202-205,208-211)
due to lack of gas supply as a result of
fire outbreak at ngc (load lost 710.5
MW)
8 13/03/09 0.37 Partial
Collapse
(I) the tripping of Benin/Onitsha
330kV line (cct.b1t) cb1
(ii) the tripping of Okpai p/s st1 and
Afam vi p/s rejecting about 698MW
9 16/03/09 0.32 Partial
Collapse
Delta g.s. Units (gt6, 8, 9, 10, 11, 12,
14, 18 & 20) tripped as result of
sharp drop on gas pressure (2.04mpa
to 0.10mpa), rejecting a total load of
305MW.
10 17/03/09 0.57 Partial
Collapse
Over loading of the grid. Geregu and
Omoku p.s. Of 162MW survived the
collapse.
11 07/04/09 0.50 Partial
Collapse
The tripping of Benin/Onitsha 330kV
line (cct. B1t) at e/f, red phase, zone 3
trip. Onitsha end only on ohmega.
12 11/4/09 2.07 Partial
Collapse
The tripping of Benin/Onitsha 330kv
line (cct. B1t) on earth fault rejecting
166MW power import into Benin t.s.
13 16/4/09 0.32 Partial
Collapse Over loading of the grid.
14 02/05/09 1.23 Partial
Collapse
(A) the multiple tripping of the
following: (1) sapele/benin 330kV
lines (ccts. S3b & s4b),(2)
Osogbo/Benin 330kV line(cct h7b) (3)
Benin/Egbin 330kV line(cctb6n),
(4)Benin/Omotosho 330kV line (cct
b5m)
(5)Shiroro 330kV transformer tr2 and
Katampe 330kV transformer tr1 & tr2
on differential relay & (b) the
explosion of vt on blue phase of
Shiroro/Mando 330kV line(cct r1m) at
16
S/No Date Duration
(Hrs)
Type of
Disturbances CAUSES / REMARK
Mando.
15 03/05/09 0.28 Partial
Collapse
Simultaneous tripping of the
following lines due to explosion of red
phase c.t. At Osogbo t.s: (1)
Osogbo/Ikeja West 330kV line(cct
h1w), (2) Jebba/Osogbo 330kV
line(cct j1h), (3) Osogbo/Ayede
330kV line(cct h2a),
(4) Osogbo/Benin 330kv line (cct
h7b)
16 13/05/09 0.52 Partial
Collapse
1. Shiroro/Katampe 330kV lines (ccts.
R4b & r5b) were opened on control
due to the tripping of 2 x 150MVA
330/132/33kV transformer (t1 & t2)
at Katampe t.s. 2. Simultaneous
tripping of the following: (a)
Shiroro/Katampe 330kV lines (ccts.
R4b & r5b) due to explosion of red
phase lighting arrester at Shiroro t.s.
As a result of high voltage of 400kV.
(b) Jebba/Ganmo 330kV line (cct.
J3g) and Jebba/Shiroro 330kV lines i
& ii (ccts. J3r & j7r) at Jebba t.s. But
(cct. J3r) tripped also at Shiroro t.s.
(c) 2 x 150mva 330/132/33kV
transformer (t1 & t2) at Shiroro t.s. On
differential potential.
17 19/05/09 1.13 Total Collapse
Emergency opening of Benin/Onitsha
330kV line (cct. B1t) as a result of
burning of blue phase line isolator at
Benin t.s.
18 29/05/09 0.38 Total Collapse
At 1420hrs, Okpai st1 tripped due to
problem on its two(2) boilers,
rejecting 144mw. While gt11 & 12
deloaded to house load rejecting
302mw. Total generation of 446MW
17
S/No Date Duration
(Hrs)
Type of
Disturbances CAUSES / REMARK
was lost.
19 20/06/09 0.62 Total Collapse
Trippings of Afam vi gt12 on
overspeed with load loss of 146MW
and circuit breaker of gt11 with load
loss of 147MW were reported. Total
load loss was 293mw.
20 21/06/09 0.42 Total Collapse
Onitsha/Alaoji 330kV line (cct t4a )
tripped, Afam vi generation of
291MW was lost. Despite effort to
maintain stable system frequency
through load shedding there was
instability in the system. Okpai then
reduced their generation from 228MW
to house load.
21 22/06/09 0.37 Total Collapse Over loading of the grid
22 23/06/09 0.73 Total Collapse
Onitsha/Alaoji 330kV line (cct t4a )
tripped at Onitsha end, cut-off Afam
vi generation (gt11 & 12) of 197MW
towards Onitsha t.s.
23 24/06/09 0.45 Total Collapse
Delta/Benin 330kV line (cct g3b )
tripped at both ends, cut-off delta
generation of 281MW
24 27/06/09 0.75 Total Collapse
(1) attempts to restore Shiroro/Mando
330kV line 1 (cct. R1m) to improve
system security and voltage,
developed pole discordance fault at
0846hrs. (2) The bus zone protection
scheme thereby cleared all the 330kV
ccts at Mando t/s, namely r2m, m6n &
m2s. (3) The trippings led to
frequency fluctuation and voltage
escalation. (4) Okpai deloaded from
234MW to 93MW due to frequency
fluctuation at 0847hrs to the time of
system collapse.
18
S/No Date Duration
(Hrs)
Type of
Disturbances CAUSES / REMARK
25 03/07/09 1.73 Total Collapse
(A) Tripping of the following lines:
(1). Jebba/Osogbo 330kV line (cct
j1h) at Jebba end on fault (2).
Jebba/Ganmo 330kV line (cct j3g) at
Jebba end on fault (3). Benin/Onitsha
330kV line (cct b1t) at both end . (b)
Tripping of Afam 11 p.s., gt5 64MVA
132/11kV power transformer on over
current (o/c) due to fire out break at
11kV control room.
26 07/07/09 0.85 Total Collapse
Loss of generation due to low gas
pressure from delta p.s suspected.
Delta gt20 tripped between (1201 -
1209), follow by report of low gas
pressure from the station.
27 22/07/09 0.45 Total Collapse
Benin/Onitsha 330kV line (cct bit )
tripped at both ends, cut-off 363MW
export from Onitsha end
28 29/07/09 0.27 Total Collapse
The tripping of Shiroro/Kaduna
330kV line 2 (cct. R2m) at Mando t.s.
Only on Optimho relay, distance
protection zone 2, abc, delay and baj
86a, 86b, 86c.
29 14/08/09 0.37 Partial
Collapse
Osogbo/Benin 330kV line(cct h7b)
tripped at both ends
30 17/08/09 0.35 Total Collapse
The simultaneous tripping of
Onitsha/Alaoji 330kV line (cct. T4a)
at both ends and Jebba/Shiroro 330kV
lines 1 & 2 (ccts j3r and j7r) at Jebba
t.s only.
31 19/08/09 2.58 Total Collapse Afam vi p.s (low gas pressure)
rejecting 442MW generation
32 20/08/09 0.37 Total Collapse
The tripping of Jebba/Shiroro 330kV
lines (cct j3r & j7r), and Jebba power
station 330kV line 1(cct. B8j)
simultaneously, resulting in the
separation of Jebba g.s units 2g1, 3 &
19
S/No Date Duration
(Hrs)
Type of
Disturbances CAUSES / REMARK
4 on system surge, rejecting a total
load of 299MW.
33 26/08/09 0.88 Total Collapse
The tripping of Afam/Alaoji 330kV
line 1 (cct f1a) at Alaoji end separated
Afam g.s from the grid with a total
generation of 469MW.
34 08/09/09 0.50 Total Collapse
The tripping of Afam/Alaoji 330kV
line(cct.f1a ) at Alaoji t.s due to
jumper cut on Afam/Portharcourt
132kV line resulting in loss of Afam
vi g.s units gt 12 & 13 on over speed
with load loss of 300MW
35 11/10/09 6.37 Partial
Collapse
As indicated on the ncc scada mmi,
delta p.s and Egbin p.s suspected
tripped with total generation loss of
415MW
36 16/10/09 0.28 Partial
Collapse
At 15:00hrs Benin/Egbin 330kV line,
(cct. B6n) tripped at both ends at
14:57hrs Omotosho tie cb tripped
simultaneously and separated 330kV
cct b5m and m5w, note: at 14:40hrs
cct. H7b tripped earlier before the
collapse.
37 05/11/09 1.18 Total Collapse
Tripping of the following lines at
14:39hrs: (1) Onitsha/Alaoji 330kV
line, (cct. T4a) at both end (2)
Jebba/Shiroro 330kv lines 1 & 2 (cct.
J3r & j7r) (severing Shiroro
generation of 282MW)
38 08/12/09 0.82 Total Collapse
Emergency opening of Jebba
g.s./Jebba t.s. 330kV lines 1 & 2 (ccts
b8j & b9j) at Jebba t.s. - due to "fire
outbreak" - at the instance of Jebba
g.s., thereby cutting off Jebba g.s.
Generation of 347MW. The incident
was later reported to be a flashover on
unit 2g4 discharge resistor. It was not
20
S/No Date Duration
(Hrs)
Type of
Disturbances CAUSES / REMARK
a fire outbreak.
39 24/12/09 1.22 Partial
Collapse
The tripping of Benin/Omotosho
330kV line (cct. B6n) at Benin t.s.
Ends, thereby separating the grid into
2 islands.
Source: Power Holding Company of Nigeria 2010; TCN, 2015
Voltage collapses have attracted special attentions to maintain the stability of the
transmission networks in order to avoid recurrence of major blackouts as experienced by
the above mentioned countries. Hence, research work in this area is aimed at predicting
voltage collapse with a view to reducing its occurrence on PSNs.
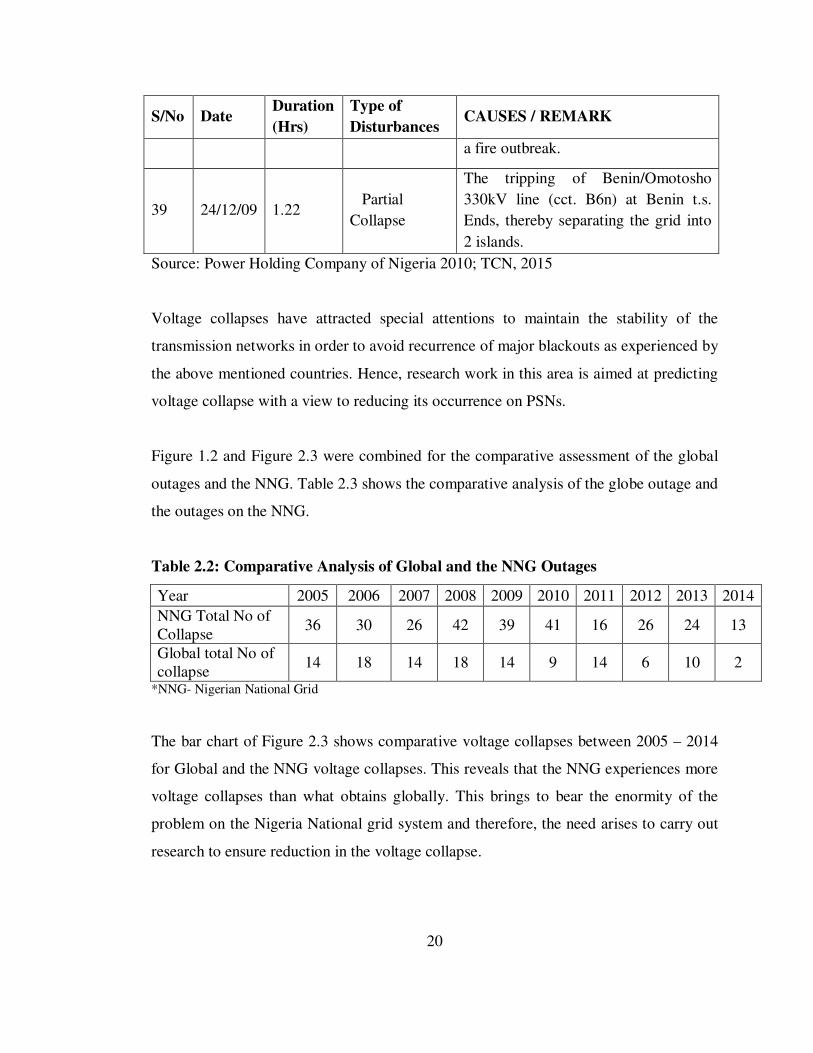
Figure 1.2 and Figure 2.3 were combined for the comparative assessment of the global
outages and the NNG. Table 2.3 shows the comparative analysis of the globe outage and
the outages on the NNG.
Table 2.2: Comparative Analysis of Global and the NNG Outages
Year 2005 2006 2007 2008 2009 2010 2011 2012 2013 2014
NNG Total No of Collapse
36 30 26 42 39 41 16 26 24 13
Global total No of collapse
14 18 14 18 14 9 14 6 10 2
*NNG- Nigerian National Grid
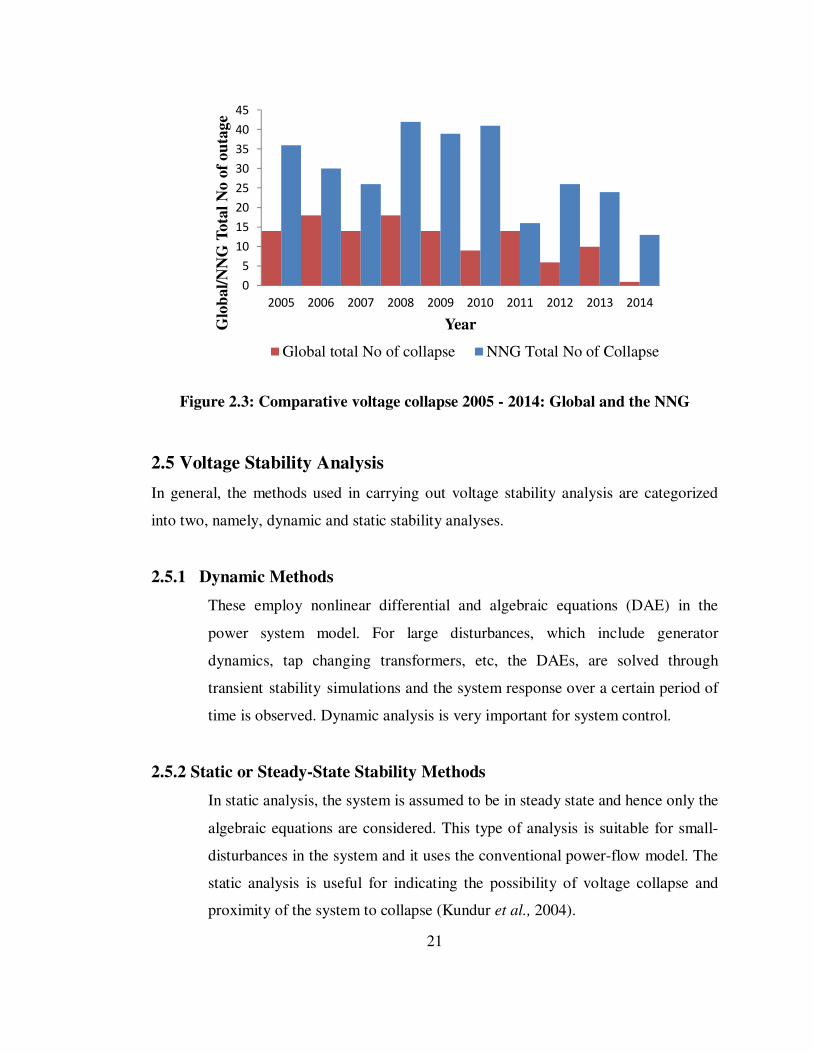
The bar chart of Figure 2.3 shows comparative voltage collapses between 2005 – 2014
for Global and the NNG voltage collapses. This reveals that the NNG experiences more
voltage collapses than what obtains globally. This brings to bear the enormity of the
problem on the Nigeria National grid system and therefore, the need arises to carry out
research to ensure reduction in the voltage collapse.
21
Figure 2.3: Comparative voltage collapse 2005 - 2014: Global and the NNG
2.5 Voltage Stability Analysis
In general, the methods used in carrying out voltage stability analysis are categorized
into two, namely, dynamic and static stability analyses.
2.5.1 Dynamic Methods
These employ nonlinear differential and algebraic equations (DAE) in the
power system model. For large disturbances, which include generator
dynamics, tap changing transformers, etc, the DAEs, are solved through
transient stability simulations and the system response over a certain period of
time is observed. Dynamic analysis is very important for system control.
2.5.2 Static or Steady-State Stability Methods
In static analysis, the system is assumed to be in steady state and hence only the
algebraic equations are considered. This type of analysis is suitable for small-
disturbances in the system and it uses the conventional power-flow model. The
static analysis is useful for indicating the possibility of voltage collapse and
proximity of the system to collapse (Kundur et al., 2004).
0
5
10
15
20
25
30
35
40
45
2005 2006 2007 2008 2009 2010 2011 2012 2013 2014
Glo
bal/
NN
G T
ota
l N
o o
f ou
tage
Year
Global total No of collapse NNG Total No of Collapse
22
Static analysis is required when there are fluctuations in load. This includes the
normal slow random load fluctuation. In this case, the equilibrium point of the
system moves slowly and makes it possible to approximate voltage profile
changes by a discrete sequence of steady states rather than using a dynamic
model (Nizam et al., 2007).
In the static analysis of voltage stability, the snapshots of the entire system at
different instants are considered and at each instant, the system is assumed to be
in steady state and that the rates of changes of the dynamic variables are zero.
Hence, instead of considering all the differential algebraic equations, only the
algebraic power balance equations are considered assuming that the system is in
steady state. At each instant whether the system is voltage stable or not, how far
the system is from instability can be assessed (Morison, et al., 1993; Vadivelu
and Marutheswar, 2014). Although stability studies in general require a
dynamic model of the power system, static analysis techniques have been found
to be widely used for voltage stability analysis (Quintela and Castro, 2002). In
this research work, t he static analysis model has been used.
2.6 The Operating States of an Electric Power System
In the wake of the 1965 Northeast blackout in the US, the electric power system
community engaged in research and development aimed at modernizing the monitoring,
protection and control of the electric power generation, transmission and distribution
subsystems. This endeavor resulted in much methodological and technological
advancement, which include the following:
(i) The provision of the control centers with mainframes and, later on, distributed
computers.
(ii) The initiation of a theoretical framework along with an ensemble of computer-
aided functions to partially automatize the operation of the transmission system.
(iii) The development of fast algorithms based on sparse matrix techniques for
modeling the steady-state and the dynamic operating conditions of the system.
23
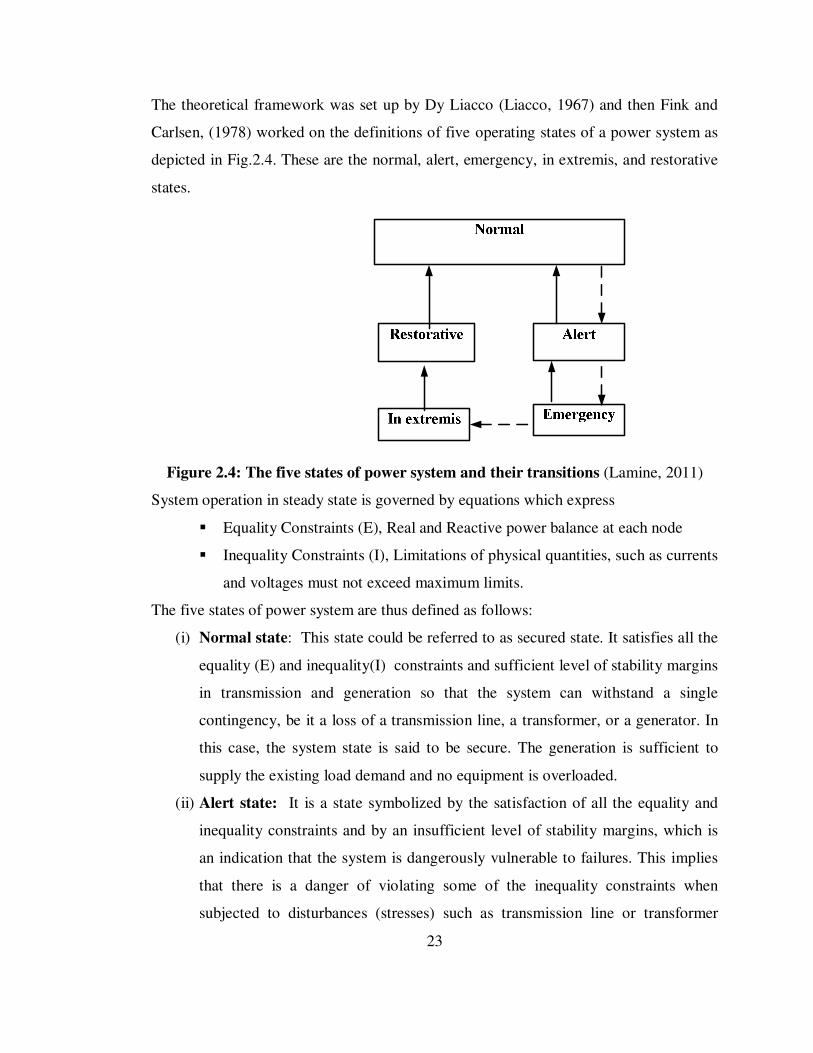
The theoretical framework was set up by Dy Liacco (Liacco, 1967) and then Fink and
Carlsen, (1978) worked on the definitions of five operating states of a power system as
depicted in Fig.2.4. These are the normal, alert, emergency, in extremis, and restorative
states.
Figure 2.4: The five states of power system and their transitions (Lamine, 2011)
System operation in steady state is governed by equations which express
� Equality Constraints (E), Real and Reactive power balance at each node
� Inequality Constraints (I), Limitations of physical quantities, such as currents
and voltages must not exceed maximum limits.
The five states of power system are thus defined as follows:
(i) Normal state: This state could be referred to as secured state. It satisfies all the
equality (E) and inequality(I) constraints and sufficient level of stability margins
in transmission and generation so that the system can withstand a single
contingency, be it a loss of a transmission line, a transformer, or a generator. In
this case, the system state is said to be secure. The generation is sufficient to
supply the existing load demand and no equipment is overloaded.
(ii) Alert state: It is a state symbolized by the satisfaction of all the equality and
inequality constraints and by an insufficient level of stability margins, which is
an indication that the system is dangerously vulnerable to failures. This implies
that there is a danger of violating some of the inequality constraints when
subjected to disturbances (stresses) such as transmission line or transformer
24
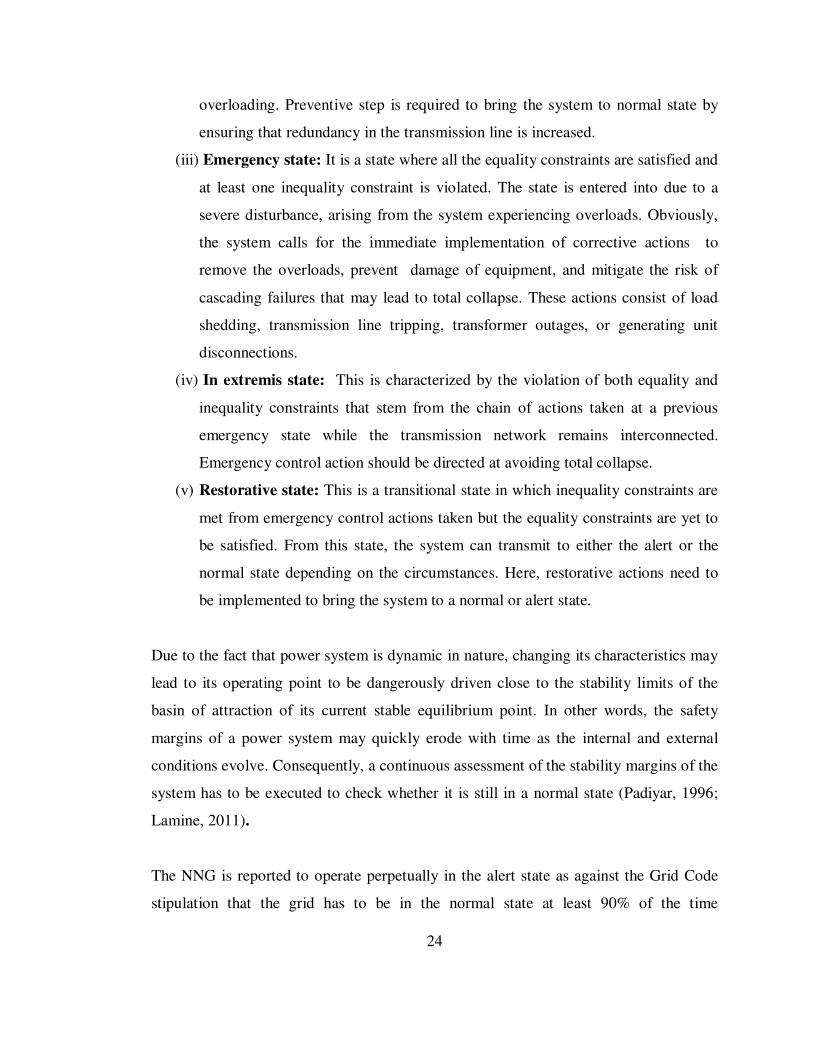
overloading. Preventive step is required to bring the system to normal state by
ensuring that redundancy in the transmission line is increased.
(iii) Emergency state: It is a state where all the equality constraints are satisfied and
at least one inequality constraint is violated. The state is entered into due to a
severe disturbance, arising from the system experiencing overloads. Obviously,
the system calls for the immediate implementation of corrective actions to
remove the overloads, prevent damage of equipment, and mitigate the risk of
cascading failures that may lead to total collapse. These actions consist of load
shedding, transmission line tripping, transformer outages, or generating unit
disconnections.
(iv) In extremis state: This is characterized by the violation of both equality and
inequality constraints that stem from the chain of actions taken at a previous
emergency state while the transmission network remains interconnected.
Emergency control action should be directed at avoiding total collapse.
(v) Restorative state: This is a transitional state in which inequality constraints are
met from emergency control actions taken but the equality constraints are yet to
be satisfied. From this state, the system can transmit to either the alert or the
normal state depending on the circumstances. Here, restorative actions need to
be implemented to bring the system to a normal or alert state.
Due to the fact that power system is dynamic in nature, changing its characteristics may
lead to its operating point to be dangerously driven close to the stability limits of the
basin of attraction of its current stable equilibrium point. In other words, the safety
margins of a power system may quickly erode with time as the internal and external
conditions evolve. Consequently, a continuous assessment of the stability margins of the
system has to be executed to check whether it is still in a normal state (Padiyar, 1996;
Lamine, 2011).
The NNG is reported to operate perpetually in the alert state as against the Grid Code
stipulation that the grid has to be in the normal state at least 90% of the time
25
(Ndiagwalukwe, 2012) and had remain at this level to date as most transmission line
project are still under construction. Hence, it becomes important to continuously
monitor the PSN to ensure that voltage stability is not violated.
2.7 Voltage Stability Indices
There are varieties of tools for assessing whether a system is voltage stable or not and
how close the system is to instability. These tools are called voltage stability indices.
These indices help the system planner and operators to know the condition of voltage
stability in a power system. They indicate how close the system is to voltage collapse or
instability. The indices should be simple, easy to implement and computationally
inexpensive. The indices expose the critical bus of a power system a n d t he stability
c o n d i t i o n of each line connected between two buses in an interconnected network
(Kumarswamy and Ramanareddy, 2011; Mathew et al., 2015). In general, the analysis
of the voltage stability problem of a given PSN should:
� determine the system’s proximity to collapse.
� establish when the voltage instability could occur.
� identify the weak buses in the PSN
� identify the areas involved.
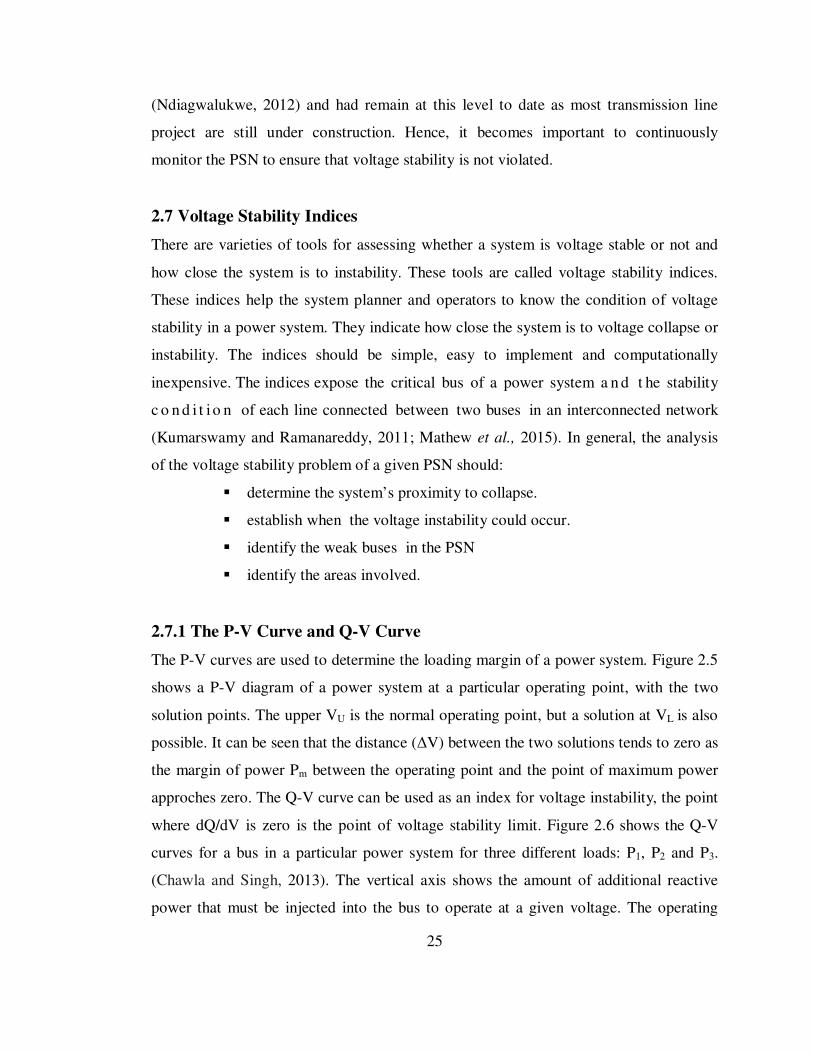
2.7.1 The P-V Curve and Q-V Curve
The P-V curves are used to determine the loading margin of a power system. Figure 2.5
shows a P-V diagram of a power system at a particular operating point, with the two
solution points. The upper VU is the normal operating point, but a solution at VL is also
possible. It can be seen that the distance (∆V) between the two solutions tends to zero as
the margin of power Pm between the operating point and the point of maximum power
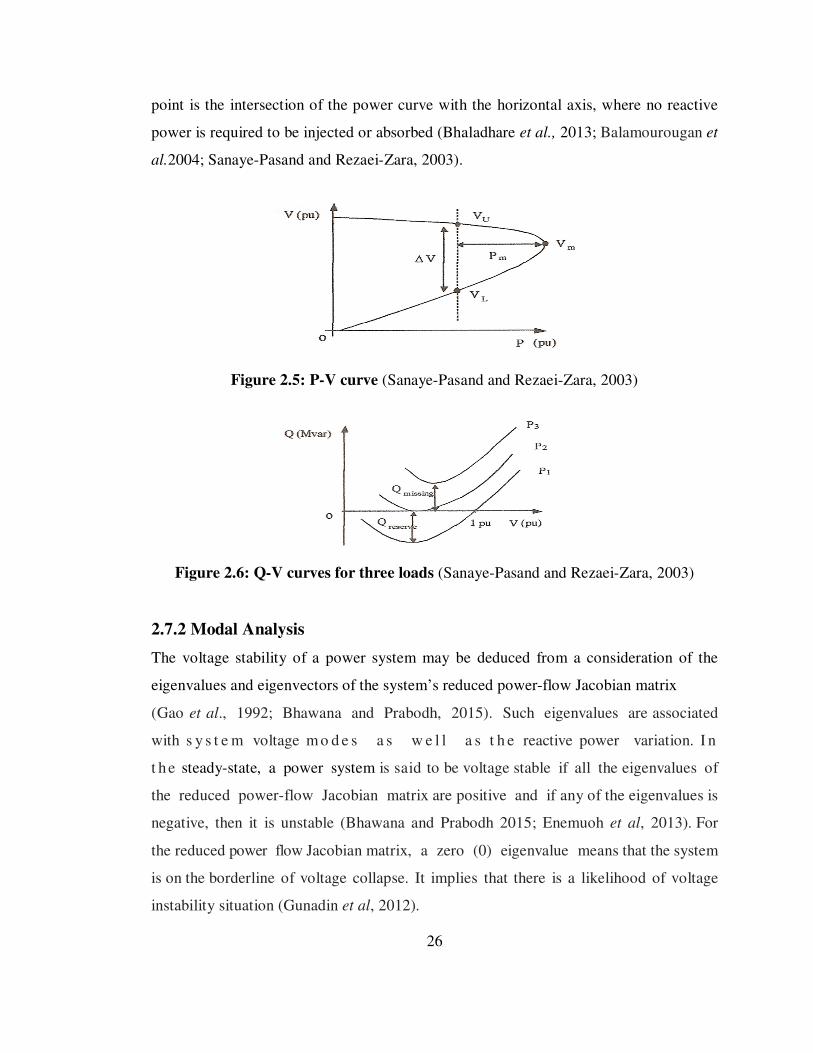
approches zero. The Q-V curve can be used as an index for voltage instability, the point
where dQ/dV is zero is the point of voltage stability limit. Figure 2.6 shows the Q-V
curves for a bus in a particular power system for three different loads: P1, P2 and P3.
(Chawla and Singh, 2013). The vertical axis shows the amount of additional reactive
power that must be injected into the bus to operate at a given voltage. The operating
26
point is the intersection of the power curve with the horizontal axis, where no reactive
power is required to be injected or absorbed (Bhaladhare et al., 2013; Balamourougan et
al.2004; Sanaye-Pasand and Rezaei-Zara, 2003).
Figure 2.5: P-V curve (Sanaye-Pasand and Rezaei-Zara, 2003)
Figure 2.6: Q-V curves for three loads (Sanaye-Pasand and Rezaei-Zara, 2003)
2.7.2 Modal Analysis
The voltage stability of a power system may be deduced from a consideration of the
eigenvalues and eigenvectors of the system’s reduced power-flow Jacobian matrix
(Gao et al., 1992; Bhawana and Prabodh, 2015). Such eigenvalues are associated
with s y s t e m voltage m o d e s a s w e l l a s t h e reactive power variation. I n
t h e steady-state, a power system is said to be voltage stable if all the eigenvalues of
the reduced power-flow Jacobian matrix are positive and if any of the eigenvalues is
negative, then it is unstable (Bhawana and Prabodh 2015; Enemuoh et al, 2013). For
the reduced power flow Jacobian matrix, a zero (0) eigenvalue means that the system
is on the borderline of voltage collapse. It implies that there is a likelihood of voltage
instability situation (Gunadin et al, 2012).
27
The PV and QV, the modal analysis and energy-based methods as proposed by Hasani,
& Parniani (2005) and Nizam et al, (2007) are computationally tedious, rigorous and
time consuming whereas time is of essence when dealing with voltage collapse
prediction. So, the use of less tedious, computational fast and easy-to-use voltage
stability indices for online and offline prediction of voltage collapse are preferred.
2.7.3 L- Index (L)
Kessel and Glavitsch, (1986) developed L-index based on the power flow solutions. It
measures the proximity to voltage instability and it is appropriate for constant power
load type. Its value ranges from zero (0) – no load to unity (1) collapse point
(Suganyadevia and Babulalb, 2009). L-index is given as
{ }
jijiji
j
i iji
LjLj
FF
V
VFLjL G
θ
α
αα
∠=
∗
−==∑ ∈
∈∈1maxmax
(2.1)
where L is the set of consumer nodes and G is the set of generator nodes, Lj is a local
indicator that determines the busbars from where collapse may originate ( Kessel and
Glavitsch, 1986). The [F] is computed using [ ] [ ] [ ]LGLL YYF1−
= , where [ ]LLY and [ ]LGY
are sub-matrices of the Y-bus matrix. the voltages Vi and Vj are voltages at buses i and j
respectively (Tiwari et al., 2012 and Vadivelu and Marutheswar, 2014).
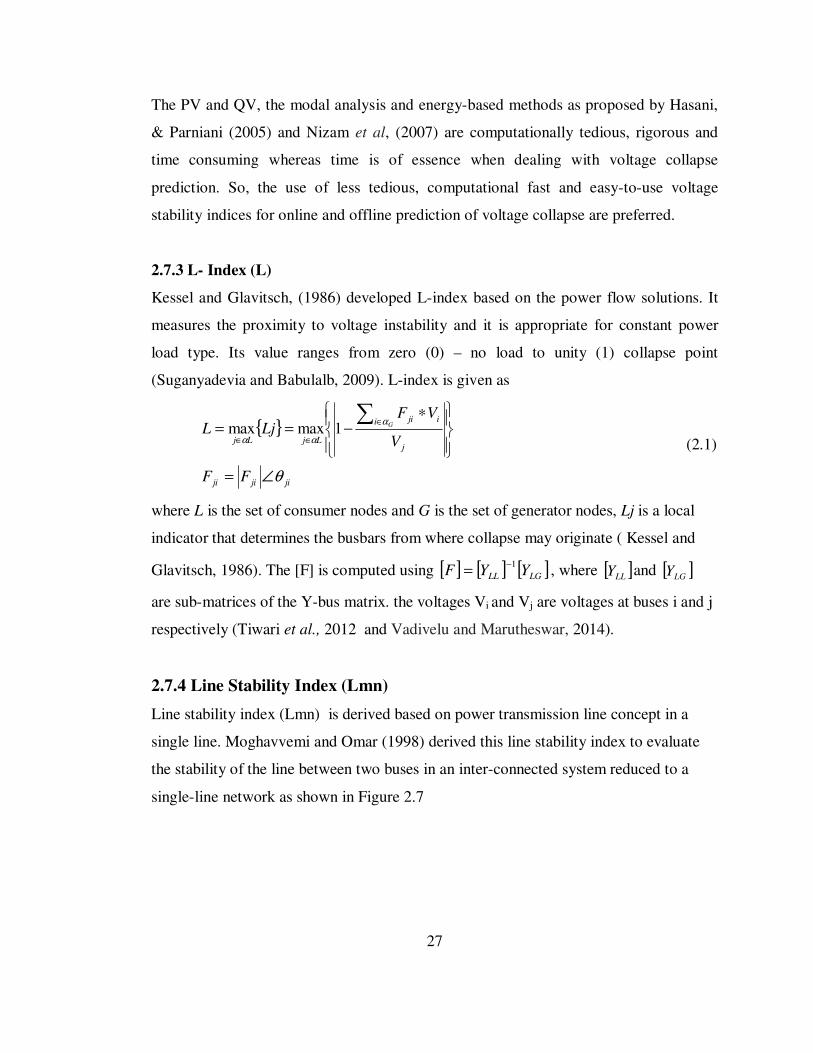
2.7.4 Line Stability Index (Lmn)
Line stability index (Lmn) is derived based on power transmission line concept in a
single line. Moghavvemi and Omar (1998) derived this line stability index to evaluate
the stability of the line between two buses in an inter-connected system reduced to a
single-line network as shown in Figure 2.7
28
2δ∠rV1δ∠sV
sss jQPS +=rrr jQPS +=
12I
2δ∠rV1δ∠sV
sss jQPS +=rrr jQPS +=
12I1 2
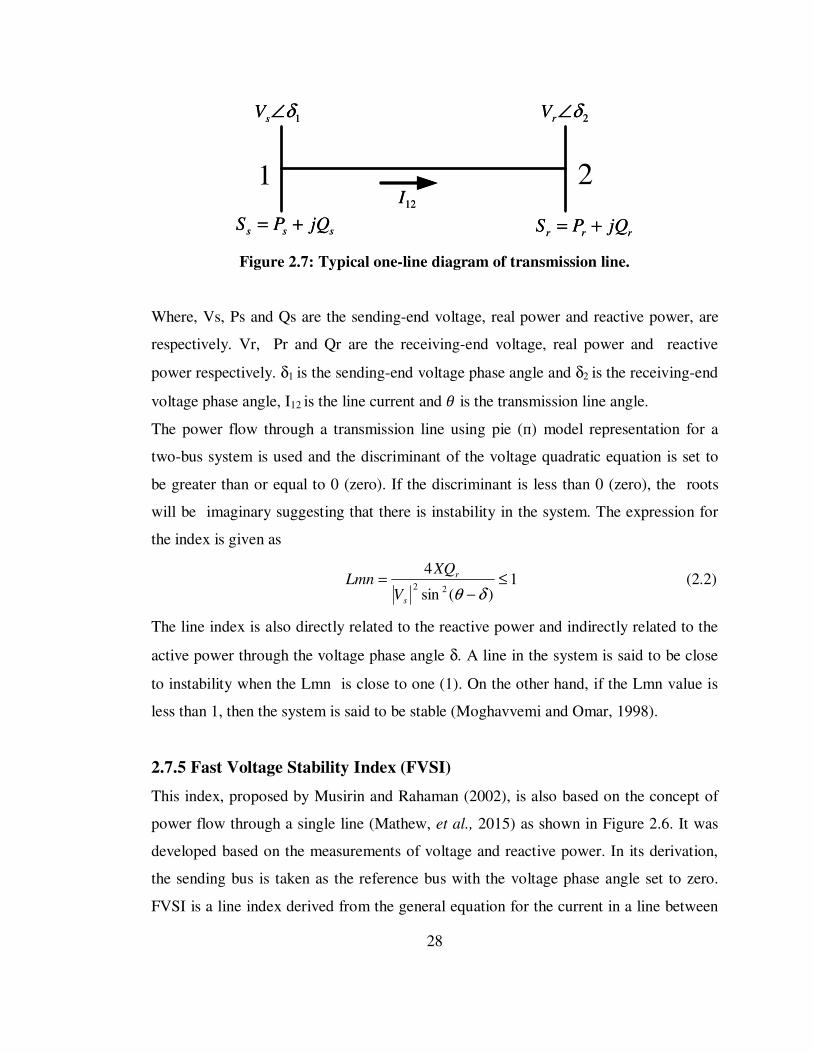
Figure 2.7: Typical one-line diagram of transmission line.
Where, Vs, Ps and Qs are the sending-end voltage, real power and reactive power, are
respectively. Vr, Pr and Qr are the receiving-end voltage, real power and reactive
power respectively. δ1 is the sending-end voltage phase angle and δ2 is the receiving-end
voltage phase angle, I12 is the line current and $ is the transmission line angle.
The power flow through a transmission line using pie (п) model representation for a
two-bus system is used and the discriminant of the voltage quadratic equation is set to
be greater than or equal to 0 (zero). If the discriminant is less than 0 (zero), the roots
will be imaginary suggesting that there is instability in the system. The expression for
the index is given as
1)(sin
422
≤−
=δθs
r
V
XQLmn (2.2)
The line index is also directly related to the reactive power and indirectly related to the
active power through the voltage phase angle δ. A line in the system is said to be close
to instability when the Lmn is close to one (1). On the other hand, if the Lmn value is
less than 1, then the system is said to be stable (Moghavvemi and Omar, 1998).
2.7.5 Fast Voltage Stability Index (FVSI)
This index, proposed by Musirin and Rahaman (2002), is also based on the concept of
power flow through a single line (Mathew, et al., 2015) as shown in Figure 2.6. It was
developed based on the measurements of voltage and reactive power. In its derivation,
the sending bus is taken as the reference bus with the voltage phase angle set to zero.
FVSI is a line index derived from the general equation for the current in a line between
29
two buses, labeled ‘s’ and ‘r’. Its mathematical expression is given as
14
2
2
≤=XV
QZFVSI
s
r (2.3)
where Z is the line impedance, X is the line reactance, Qr is the reactive power
flow to the receiving end and Vs is the sending-end voltage. The line whose stability
index value is closest to unity (1) will be the most critical line of the bus and may
lead to the whole system instability (Verayiahah and Marutheswar, 2013). The
evaluated FVSI also helps to determine the weakest bus in the system. The most
critical bus in the system is the bus with smallest permissible load (Moghavvemi and
Omar.1998).
2.7.6 Line Stability Factor (LQP)
The LQP index derived by Mohamed, et al, (1989) is obtained using the same concept
as in Moghavvemi and Omar, (1998) and Musirin and Rahman, (2002) in which the
discriminant of the power quadratic equation is set to be greater than or equal to zero.
Figure 2.6 illustrates a single line of a power transmission concept used in the
formation of the index. The line stability factor for this model is reproduced as
+
= rs
ss
QpV
X
V
XLQP
224 (2.4)
where X is the line reactance, Qr is the reactive power flow to the receiving bus, Vs is
the voltage at the sending bus and Ps is the active power flow from the sending bus.
For stable system, the value of LQP index should be maintained at less than 1,
otherwise, collapse is imminent (Mohamed et al, 1989).
2.7.7 Line Voltage Stability Index (LVSI)
This index is a line voltage stability index that brings to bear the relationship between
line real power and the bus voltage (Suganyadevi and Babalal, 2009). The index fails if
the resistance of the transmission line is very close to zero. The index is formulated as
1cos
4≤
−=
δθs
r
V
RPLVSI (2.5)
30
where
R
X1tan −=θ is the transmission line angle and R is line resistance
LVSI is more sensitive to δ since cos(θ-δ) is faster than sin(θ-δ) around 900 and a
healthy line could be identified as a critical line (Haruna, 2015).
2.7.8 Voltage Collapse Point Indicator (VCPI)
The VCPI uses maximum power transfer concept to investigate the stability of each
line of the PSN. The expressions for the indices are stated as follows:
( )max
)(R
R
P
PpowerVCPI =
(2.6)
(max)
)(Losses
Losses
P
PLossesVCPI = (2.7)
where PR is the power at the receiving end and Plosses is the power loss.
As the transmission line experiences increase in power flow transfer, the value of each
of the indices in equations (2.6) and (2.7) increases gradually and if it reaches 1, the
voltage collapse occurs and if the index of any line in the PSN reaches that value, it is
possible to predict the voltage collapse. The VCPI indices vary from zero (0) no-load
condition to one (1), which is voltage collapse (Goh, et al., 2015).
2.9 Summary
Power system stability i.e. the rotor angle, frequency and voltage stability were
reviewed. Rotor angle and voltage stability interrelationship were briefly discussed.
Existing voltage stability indices in the literature as well as the power system
operational security states were outlined.
31
CHAPTER THREE
MATERIALS AND METHODS
3.1 Introduction
In this chapter, a new line stability index, NLSI-1 is proposed for PSN voltage collapse
prediction. This chapter presents the mathematical formulation for the proposed index.
The methods and materials for the study are also presented.
3.2 The New Voltage Collapse Prediction Index
Voltage stability, to a very large extent, has to do with system load and transmission line
parameters, indices that reveal how close each transmission line is to voltage instability
have increasingly become essential tools for voltage stability assessment and monitoring
by power system operators. These indices may be used for online or offline monitoring
of the PSN in order to predict proximity to voltage instability or collapse.
3.2.1 New Line Stability Index-1 (NLSI-1)
To derive the New Line Stability Index-1 (NLSI-1) we first consider the Line Stability
Index (Lmn) proposed by Moghavvemi and Umar, (1998) and the Fast Voltage Stability
Index (FVSI) proposed by Musrin and Rahman, (2002). We then showed that the FVSI
is an approximation of the Lmn and proceed to derive the NLSI-1 for improved
accuracy and speed.
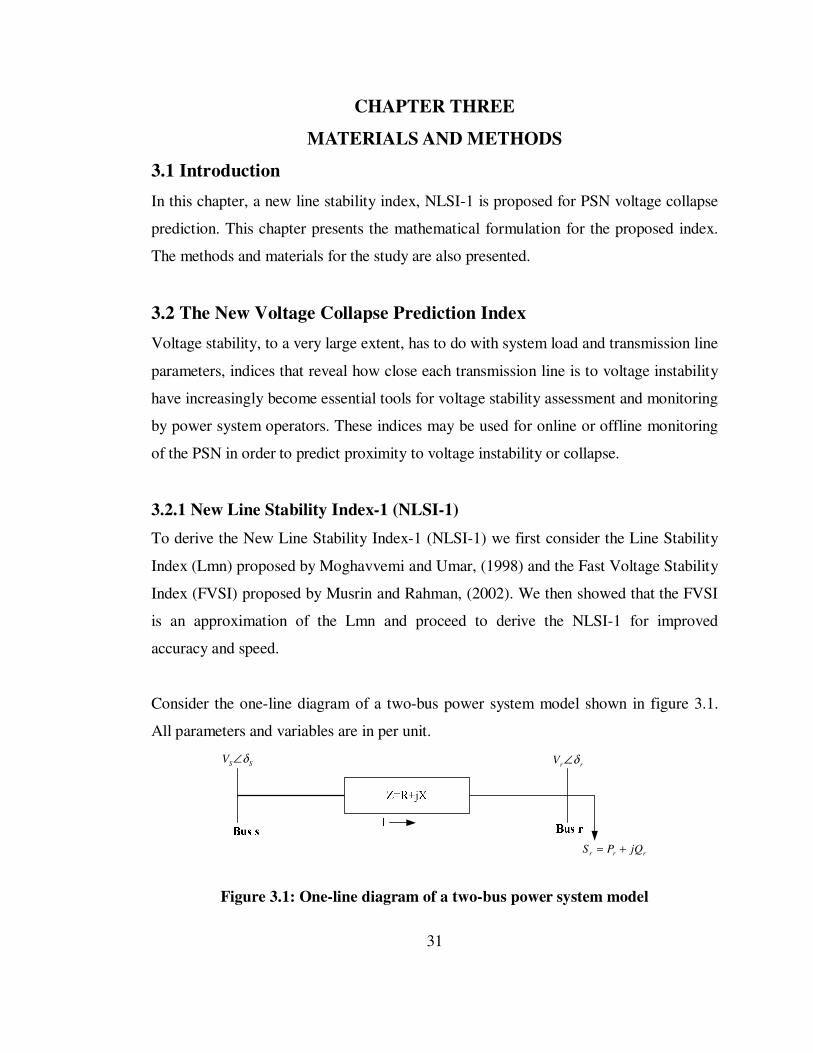
Consider the one-line diagram of a two-bus power system model shown in figure 3.1.
All parameters and variables are in per unit.
SSV δ∠
rrV δ∠
rrr jQPS +=
Figure 3.1: One-line diagram of a two-bus power system model
32
In Figure 3.1, bus ‘s’ is the sending-end bus and is chosen to be the reference bus while
bus ‘r’ is the receiving-end bus. The variables and parameters are defined as follows:
Sr is the apparent power at the receiving bus ‘r’.
Pr is the real power at the receiving bus ‘r’
Vs , Vr are respectively the sending-end voltage and the receiving-end voltage.
Qr is the reactive power at the receiving bus ‘r’.
δs , δr are respectively the voltage angles of the sending-end and the receiving-
end buses.
δ is the difference between δs and δr
$ � %&'() *+ is the transmission line angle
, � - + /0 is transmission line impedance
where
R is the line resistance
X is the line reactance
Using the concept of power flow in the line and analyzing the 1-model representation,
the power flow at the receiving end of the PSN shown in Figure 3.1 is expressed as
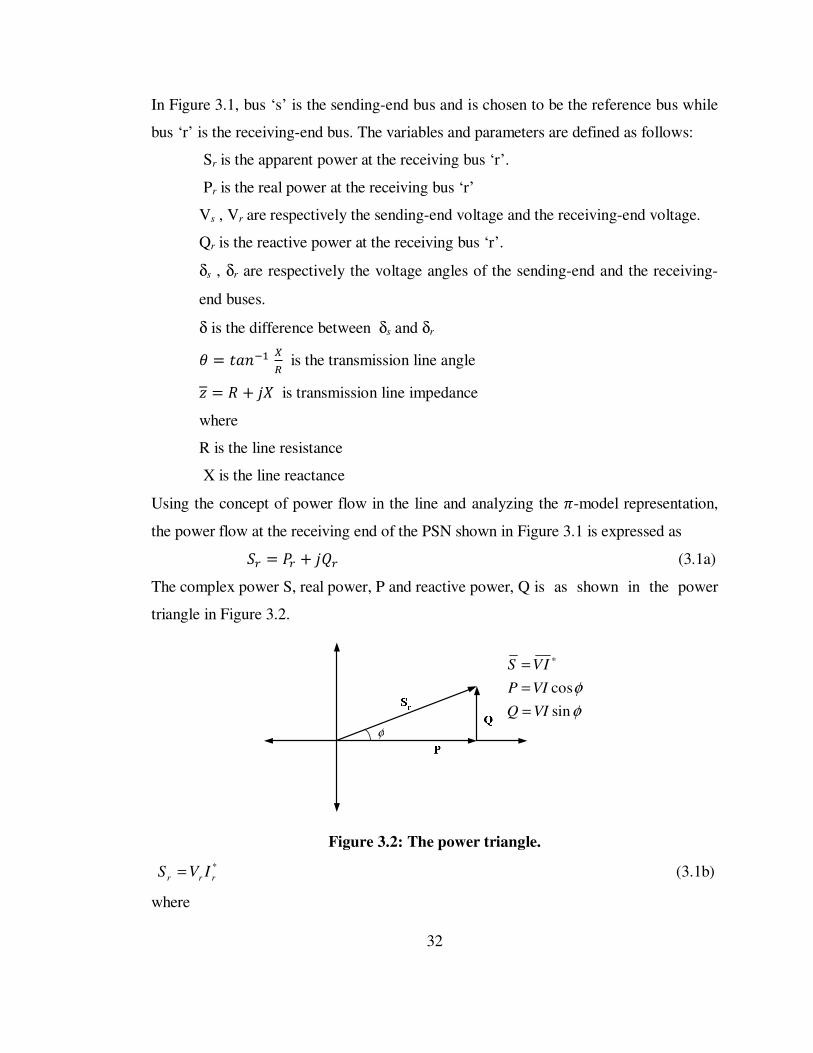
23 � 43 + /53 (3.1a)
The complex power S, real power, P and reactive power, Q is as shown in the power
triangle in Figure 3.2.
φ
φ
φ
sin
cos
VIQ
VIP
IVS
=
=
= ∗
Figure 3.2: The power triangle.
*
rrr IVS = (3.1b)
where
33
63 � 78 � 79∠δ9(7:∠δ:8∠; (3.1c)
with tan $ � *+ in an impedance triangle.
Using equation (3.1c) in (3.1b) gives
23 � <3∠=3 >79∠(δ9(7:∠(δ:8∠(; ? � <@<3∠Aδ3 − δ@C − <3DE∠− $
� 797:∠A;Fδ:(δ9C8 −7:G∠;8
23 � |79||7:||8| ∠A$ + =3 − =@C − |7:|G|8| ∠$ (3.2)
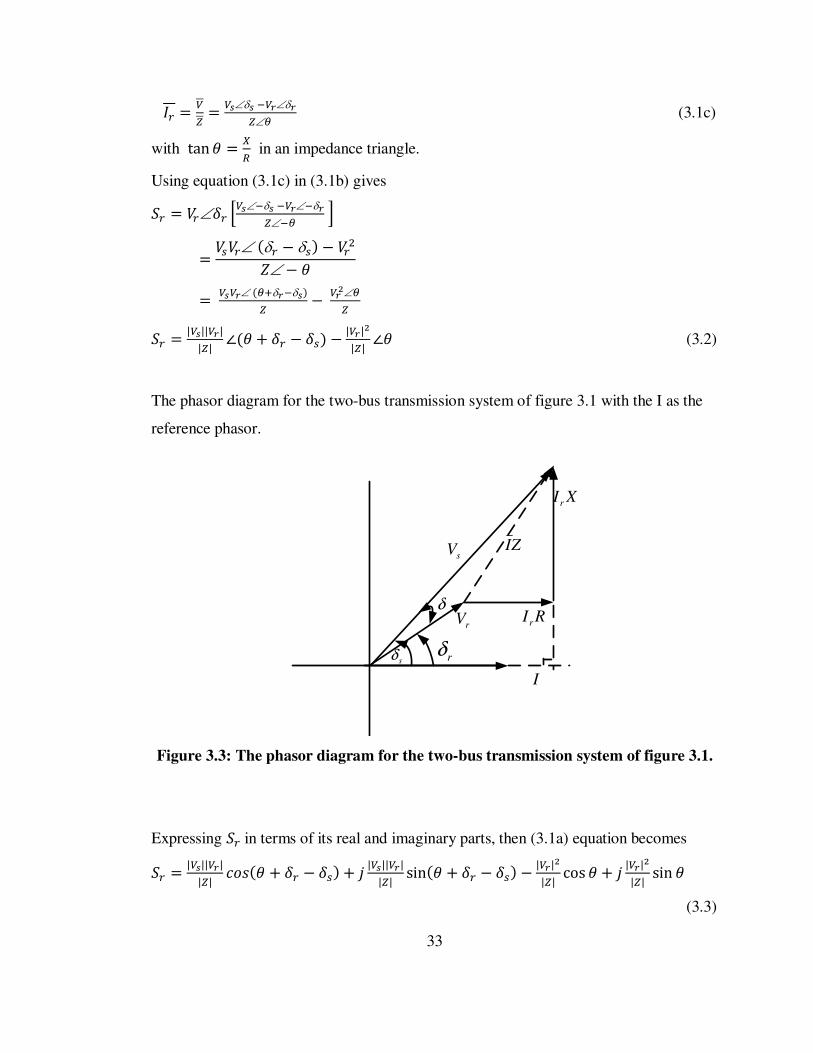
The phasor diagram for the two-bus transmission system of figure 3.1 with the I as the
reference phasor.
rV
I
sδ rδ
δ
ZI
XI r
sV
RI r
Figure 3.3: The phasor diagram for the two-bus transmission system of figure 3.1.
Expressing 23 in terms of its real and imaginary parts, then (3.1a) equation becomes
23 � |79||7:||8| JKLA$ + =3 − =@C + / |79||7:||8| sinA$ + =3 − =@C − |7:|G|8| cos $ + / |7:|G|8| sin $ (3.3)
34
Rearranging equation (3.3) gives
23 � |79||7:||8| JKLA$ + =3 − =@C − |7:|G|8| cos$ + / N|79||7:||8| sinA$ + =3 − =@C − |7:|G|8| sin $O
(3.4)
But
23 � 43 + /53
Then equating real and imaginary parts on both sides, gives
43 � |79||7:||8| JKLA$ − =@ + =3C − |7:|G|8| cos$ (3.5)
53 � |79||7:||8| sinA$ − =@ + =3C − |7:|G|8| sin $ (3.6)
Substituting = � =3 − =@ and finding a quadratic equation in terms of 53 in (3.6) gives
|7:|G|8| sin $ − |79||7:||8| sinA$ − =C + 53 � 0 (3.7)
Therefore, the voltage quadratic equation is given as
�� ;|8| <3D − |<3| |79| �� A;(QC|8| +53 � 0 (3.8)
Equation (3.8) is a quadratic equation
Therefore, solving for Vr gives
<3 �|R9| STUAVWXC|Y| ±[NA|R9| STUAVWXCC|Y| OG(\STUV|Y| ]:
DSTU V|Y| (3.9)
For stability, the discriminant of equation (3.9) should be greater than or equal to zero
i.e.
^|79|G �� GA;(QC_|8|G − 4 �� ;|8| 53 ≥ 0 (3.10)
Multiplying both sides with |E|D, we have
0sin4)(sin 22≥−− rs QZV θδθ (3.11)
But the reactance,0 from the relevance impedance triangle is given as
0 � |E|Lb'$
Substituting 0 into equation (3.11), then
<@DLb'DA$ − =C − 4053 ≥ 0 (3.12)
Dividing both sides by |<@|DLb'DA$ − δC, then equation (3.12) becomes
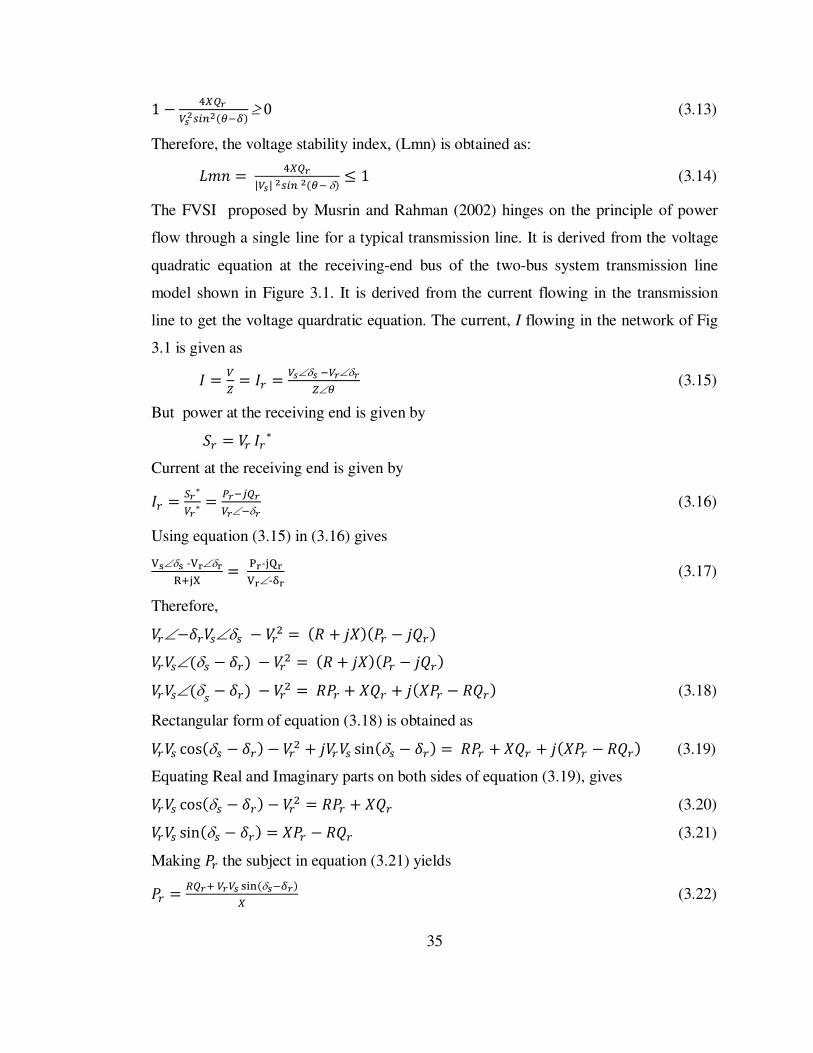
35
1 − \*]:79G@deGA;(QC ≥0 (3.13)
Therefore, the voltage stability index, (Lmn) is obtained as:
fg' � \*]:|79|G@deGA;(δC ≤ 1 (3.14)
The FVSI proposed by Musrin and Rahman (2002) hinges on the principle of power
flow through a single line for a typical transmission line. It is derived from the voltage
quadratic equation at the receiving-end bus of the two-bus system transmission line
model shown in Figure 3.1. It is derived from the current flowing in the transmission
line to get the voltage quardratic equation. The current, I flowing in the network of Fig
3.1 is given as
6 � 78 � 63 � 79∠δ9(7:∠δ:8∠; (3.15)
But power at the receiving end is given by
23 � <363∗ Current at the receiving end is given by
63 � j:∗7:∗ � k:(l]:7:∠(δ: (3.16)
Using equation (3.15) in (3.16) gives
mS∠δS -mo∠δopFqr � so-qtomo∠-uo (3.17)
Therefore,
<3∠−=3<@∠δ@ − <3D � A- + /0CA43 − /53C <3<@∠Aδ@ − =3C − <3D � A- + /0CA43 − /53C
<3<@∠Aδ@ − =3C − <3D � -43 + 053 + /A043 − -53C (3.18)
Rectangular form of equation (3.18) is obtained as
<3<@ cosAδ@ − =3C − <3D + /<3<@ sinAδ@ − =3C � -43 + 053 + /A043 − -53C (3.19)
Equating Real and Imaginary parts on both sides of equation (3.19), gives
<3<@ cosAδ@ − =3C − <3D � -43 + 053 (3.20)
<3<@ sinAδ@ − =3C � 043 − -53 (3.21)
Making 43 the subject in equation (3.21) yields
43 � +]:F7:79 �� Aδ9(Q:C* (3.22)
36
Substituting equation (3.22) into equation (3.20) and re-arranging yields
<3<@ cosAδ@ − =3C − <3D � +* v-53 +<3<@ sinAδ@ − =3Cw + 053 (3.23)
� +G]:* +7:79+ �� Aδ9(Q:C* + 053
<3D + <3 >79+ �� Aδ9(Q:C* − <@ cosAδ@ − =3C? + +G]:* + 053 � 0
Therefore,
<3D + <3 >79+ �� Aδ9(Q:C* − <@ cosAδ@ − =3C? + 53 N+G* + 0O � 0 (3.24)
Now, solving the quadratic equation (3.24) in <3 gives
<3 � 79 ���Aδ9(Q:C(R9xSTUAδ9WX:Cy ±[>R9xSTUAδ9WX:Cy (79 ���Aδ9(Q:C?G(\]:zxGy F*{D
(3.25)
For the value of <3 to be real and positive, then the discriminant of equation (3.25) must
be greater than or equal to zero. Thus:
N79+ �� Aδ9(Q:C* − <@ cosAδ@ − =3COD − 453 N+G* + 0O ≥0 (3.26)
A79+ �� Aδ9(Q:C(*79 ���Aδ9(Q:CCG*G − 453 N+G* + 0O ≥0 (3.27)
A<@- sinAδ@ − =3C − 0<@ cosAδ@ − =3CCD − 40D53 ^+GF*G_* ≥0 (3.28)
Substitute for ED � -D + 0D in equation (3.28)
A<@- sinAδ@ − =3C − 0<@ cosAδ@ − =3CCD − 4053AEDC≥0 (3.29)
4053AEDC ≤ A<@- sinAδ@ − =3C − 0<@ cosAδ@ − =3CCD (3.30)
Dividing both sides of equation (3.30) by ^V�R sin^δ�-δ�_ -XV� cos^δ�-δ�__D, gives
\*]:^8G_A79+ �� Aδ9(Q:C(*79 ���Aδ9(Q:CCG ≤ 1 (3.31)
Letting δ = δs - δr , then
\*]:^8G_A79+ �� Q(*79 ��� δCG ≤ 1 (3.32)
Assuming the angle difference = is very small i.e. If δ →0 then sin δ→0 and cos δ→1,
hence,
37
\*]:8G*G79G ≤ 1 (3.33)
Therefore the Fast Voltage Stability Index (FVSI), is given as
�<26 � \]:8G*79G ≤ 1 (3.34)
The FVSI can be explicitly derived from Lmn when the voltage angle difference ‘δ’,
(the difference between the voltage angles of the sending and receiving ends) is assumed
to be very small.
From the expression of the Lmn index in equation (3.14), when δ ≈ 0, it can be inferred
that:
fg' � \*]:|79|G@deGA;(�C ≤ 1
1)(sin
422
≤=θs
r
V
XQ (3.35)
Recall from the impedance triangle that
0 � |E|Lb'$
which implies
Lb'$ � *|8|. (3.36)
Substituting equation (3.36) into equation (3.35) and simplifying yields
\]:A|8|CG|79|G* ≤ 1 (3.37)
which is equivalent to the expression of FVSI given in equation (3.34).
We therefore propose to combine equations (3.14) and (3.37) into a single equation to
compute the proximity to voltage collapse according to a switching function, σ, as
shown in equation (3.38). Each value of δ computed from the load-flow program is
tested against a threshold value, =� , in order to determine whether σ is 1 or 0.
The corollary is combining equations (3.14) and (3.37) into one equation to yield a new
stability index that gain fastness and accuracy with improved stability. This is given as:
�f26_1 � \]:|79|G >A|8|CG* σ − *�� GA;(QC Aσ − 1C? ≤ 1σ � � 10 = < =�= ≥ =� (3.38)
Note that δ is used here as a modifier.
38
where ‘σ’ is a switching function whose value depends on whether the angle difference,
δ, is very small or not. A large voltage angle difference between two load buses
indicates a heavily loaded power system network with large power flows or increased
impedance between the load buses. Dobson et al., (2010) reported that in a simulation of
the grid carried out before the August 2003, Northeastern blackout showed increasing
angle differences between Cleveland and West Michigan, revealing that large angle
differences could be a risk signal to the occurrence of blackout or system collapse
(Dobson et al., 2010). Therefore, the voltage angle difference, delta ‘δδδδ’ cannot be totally
ignored as done in the mathematical formulation of FVSI. When NLSI_1 is less than 1,
the system is stable. The closer its value approaches one (1), then system is unstable and
near voltage collapsed.
3.2.2 Determination of the Switching Function for the NLSI_1
The switching function σ, is dependent on the voltage angle difference, δ. Therefore, to
determine the point at which switching will take place, a study of the error percentage of
the voltage stability indices with reference to the voltage angle difference, δ is
considered. The base case results of the Lmn and FVSI are used. Error can be defined as
the mathematical difference between the true value of a mathematical quantity and a
calculated or measured value. The error percentage is considered using the two
techniques of specifying errors i.e. the absolute error of an approximation and the
relative error of the approximation. The absolute error gives how large the error is, and
the relative error gives how large the error is relative to the correct value (Donna, 2012).
The absolute error, relative error, and percent error are mathematically represented as
Absolute error, Eabs = | Dbase - Dused| (3.39)
Relative error, Erel= | (Dbase - Dused)/ Dbase | (for Dbase ≠ 0) (3.40)
Percent error, % E = | (Dbase - Dused)/ Dbase | x 100 (for Dbase ≠ 0) (3.41)
where
Dbase is the base value,
39
Dused is the value used
The Lmn is taken as the base value, i.e. Dbase. More so that it is considered to be the true
representation of the voltage stability index and the most accurate among them all while
the FVSI is an approximation of Lmn and it is the value used, Dused. It is important to
note that the switching point is unique to individual power system networks.
3.3 Power Flow Analysis
Power-flow studies are carried out to generate the data used for the calculation of the
voltage stability indices for both the base case and the contingency analysis of the two
selected case studies in this thesis using a power flow code in MATLAB environment.
Power flow analysis plays a very important role in power system planning, control and
operation to ensure that power systems are operated efficiently (Kundur, 1994). It is
very crucial for all calculations relating to the network since it concerns the network
performance in its steady-state operating conditions. Since load-flow is a non-linear
problem, it must be solved iteratively hence the use of any of the following methods:
the Gauss-Siedel, Newton-Raphson, and fast decoupled methods (Saadat, 2004).
The Newton-Raphson method (NR) is used in this research work because of its faster
convergence that makes it to find its relevance in large power systems. The number of
iterations required to obtain a solution is not dependent on the size of the network. In
addition, the Newton-Raphson method is well suited for software computations. Simply
stated, it has a very high convergence speed compared to other iterative solution
methods and its convergence criteria are specified to ensure convergence for bus real
power and reactive power mismatches which give direct control of the accuracy
specified for the load flow solution (Saadat, 2004; Afolabi et al., 2015). The power flow
equation is formulated in polar form due to the fact that in the power flow problem, real
power and voltage magnitude are specified for the voltage-controlled buses (Samuel et
al., 2014 (b); Adebayo et al., 2014 ).
The system nodal (n-bus) equations are given as
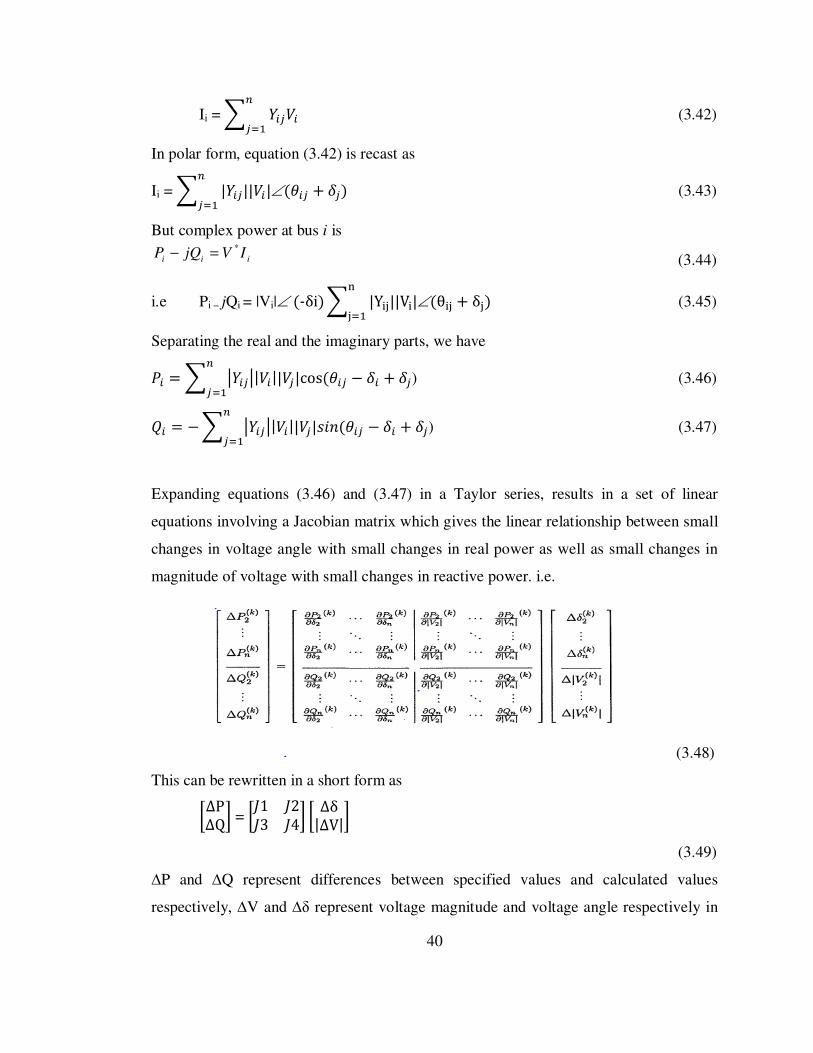
40
Ii = � �dl<del�) (3.42)
In polar form, equation (3.42) is recast as
Ii = � |�dl||<d|∠A$dl + =lel�) C (3.43)
But complex power at bus i is
iiiIVjQP
*=− (3.44)
i.e Pi – jQi = |Vi|∠A-δiC� |Y�q||V�|∠Aθ�q + δqC q�) (3.45)
Separating the real and the imaginary parts, we have
4d �� ��dl�|<d||<l|cosA$dl − =d + =lel�) ) (3.46)
5d � −� ��dl�|<d||<l|Lb'A$dl − =d + =lel�) ) (3.47)
Expanding equations (3.46) and (3.47) in a Taylor series, results in a set of linear
equations involving a Jacobian matrix which gives the linear relationship between small
changes in voltage angle with small changes in real power as well as small changes in
magnitude of voltage with small changes in reactive power. i.e.
(3.48)
This can be rewritten in a short form as
�∆P∆Q� = ��1 �2�3 �4� � ∆δ|∆V|�
(3.49)
∆P and ∆Q represent differences between specified values and calculated values
respectively, ∆V and ∆δ represent voltage magnitude and voltage angle respectively in
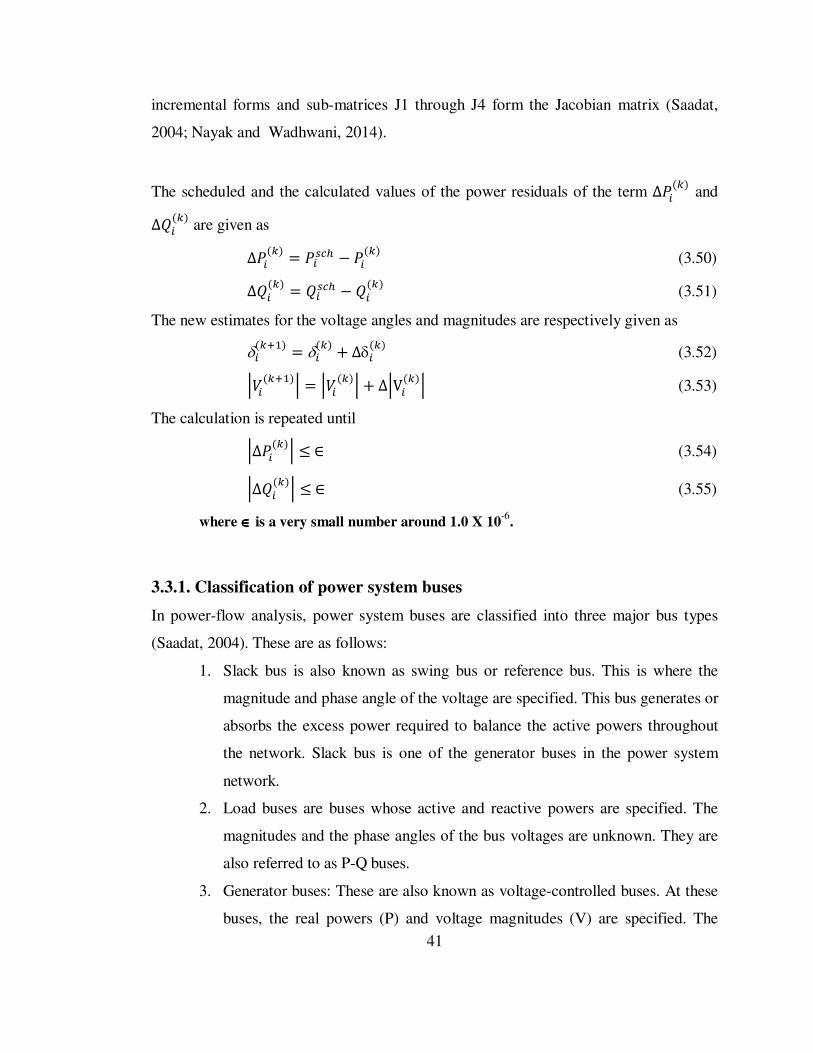
41
incremental forms and sub-matrices J1 through J4 form the Jacobian matrix (Saadat,
2004; Nayak and Wadhwani, 2014).
The scheduled and the calculated values of the power residuals of the term ∆4dA�C and
∆5dA�C are given as
∆4dA�C � 4d@�� − 4dA�C (3.50)
∆5dA�C � 5d@�� −5dA�C (3.51)
The new estimates for the voltage angles and magnitudes are respectively given as
δdA�F)C � δdA�C + ∆δdA�C (3.52)
�<dA�F)C� � �<dA�C� + ∆�VdA�C� (3.53)
The calculation is repeated until
�∆4dA�C� ≤∈ (3.54)
�∆5dA�C� ≤∈ (3.55)
where ∈∈∈∈ is a very small number around 1.0 X 10⁻⁶
.
3.3.1. Classification of power system buses
In power-flow analysis, power system buses are classified into three major bus types
(Saadat, 2004). These are as follows:
1. Slack bus is also known as swing bus or reference bus. This is where the
magnitude and phase angle of the voltage are specified. This bus generates or
absorbs the excess power required to balance the active powers throughout
the network. Slack bus is one of the generator buses in the power system
network.
2. Load buses are buses whose active and reactive powers are specified. The
magnitudes and the phase angles of the bus voltages are unknown. They are
also referred to as P-Q buses.
3. Generator buses: These are also known as voltage-controlled buses. At these
buses, the real powers (P) and voltage magnitudes (V) are specified. The
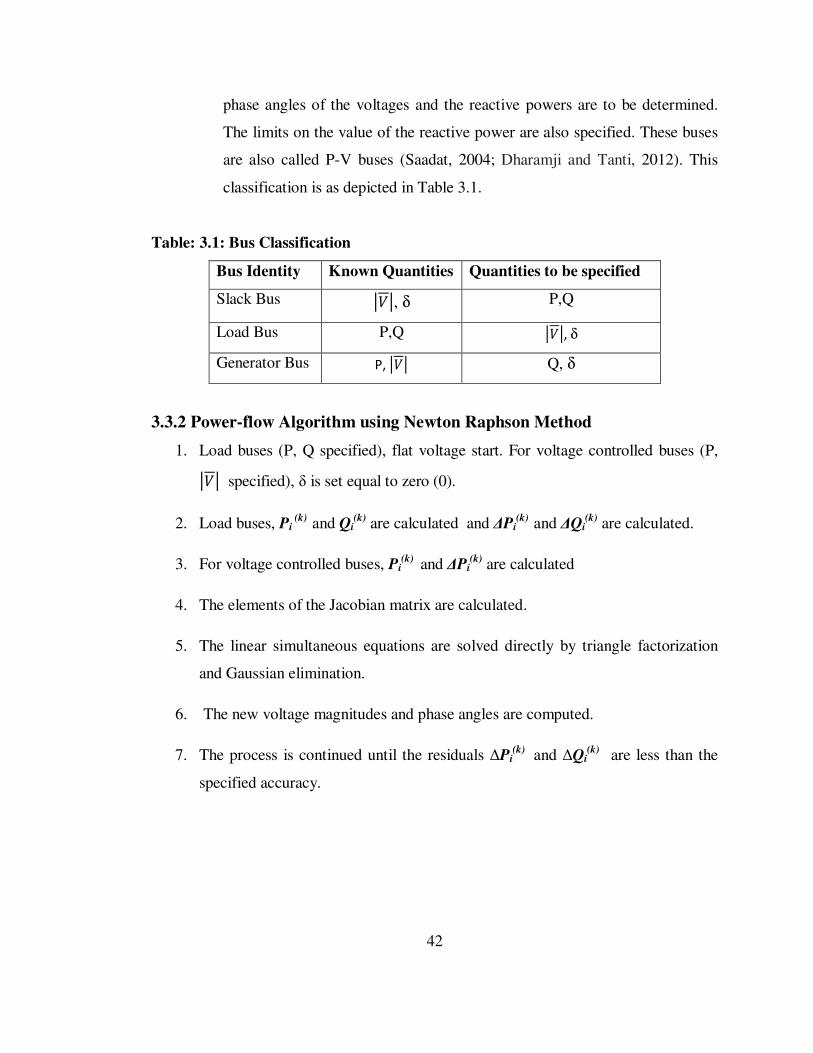
42
phase angles of the voltages and the reactive powers are to be determined.
The limits on the value of the reactive power are also specified. These buses
are also called P-V buses (Saadat, 2004; Dharamji and Tanti, 2012). This
classification is as depicted in Table 3.1.
Table: 3.1: Bus Classification
Bus Identity Known Quantities Quantities to be specified
Slack Bus �<�, δ P,Q
Load Bus P,Q �<�, δ
Generator Bus P, �<� Q, δ
3.3.2 Power-flow Algorithm using Newton Raphson Method
1. Load buses (P, Q specified), flat voltage start. For voltage controlled buses (P,
�<� specified), δ is set equal to zero (0).
2. Load buses, Pi (k) and Qi
(k) are calculated and ∆Pi(k) and ∆Qi
(k) are calculated.
3. For voltage controlled buses, Pi(k) and ∆Pi
(k) are calculated
4. The elements of the Jacobian matrix are calculated.
5. The linear simultaneous equations are solved directly by triangle factorization
and Gaussian elimination.
6. The new voltage magnitudes and phase angles are computed.
7. The process is continued until the residuals ∆Pi(k) and ∆Qi
(k) are less than the
specified accuracy.
43
3.3.3 Power flow in MATLAB environment
In order to carry out the power flow analysis for the case studies using the
Newton-Raphson method in the MATLAB environment, the following variables
are normally specified:
a) power system base MVA- The value used is Base MVA = 100
b) power mismatch accuracy
c) acceleration factor: The value used = 0.001
d) maximum number of iterations. The value used is maxiter = 100
e) Bus classified as one (1) for slack bus, zero (0) for load buses and two (2) for
generator bus.
The power flow simulation was done using the MATLAB R2012a software. The
MATLAB programme of the Newton-Raphson method of power flow solution that has
been developed for the practical system (Saadat, 2002) is used based on the following
developed files:
a) bus data file
b) line data file
c) ifybus
d) newtonrap
e) busout
f) lineflow
This program was further extended to cater for the extraction of data from the above
mentioned files to calculate the voltage stability indices for analysis and prediction.
These file are
g) Fvsi_index_1
h) Lmn_index_1
i) NLSI_1_index_IEEE14
j) NLSI_1_index_NNG28
Flow chart for power flow study using the Newton-Raphson iterative method and
voltage stability indices calculation is as shown in Figure 3.4
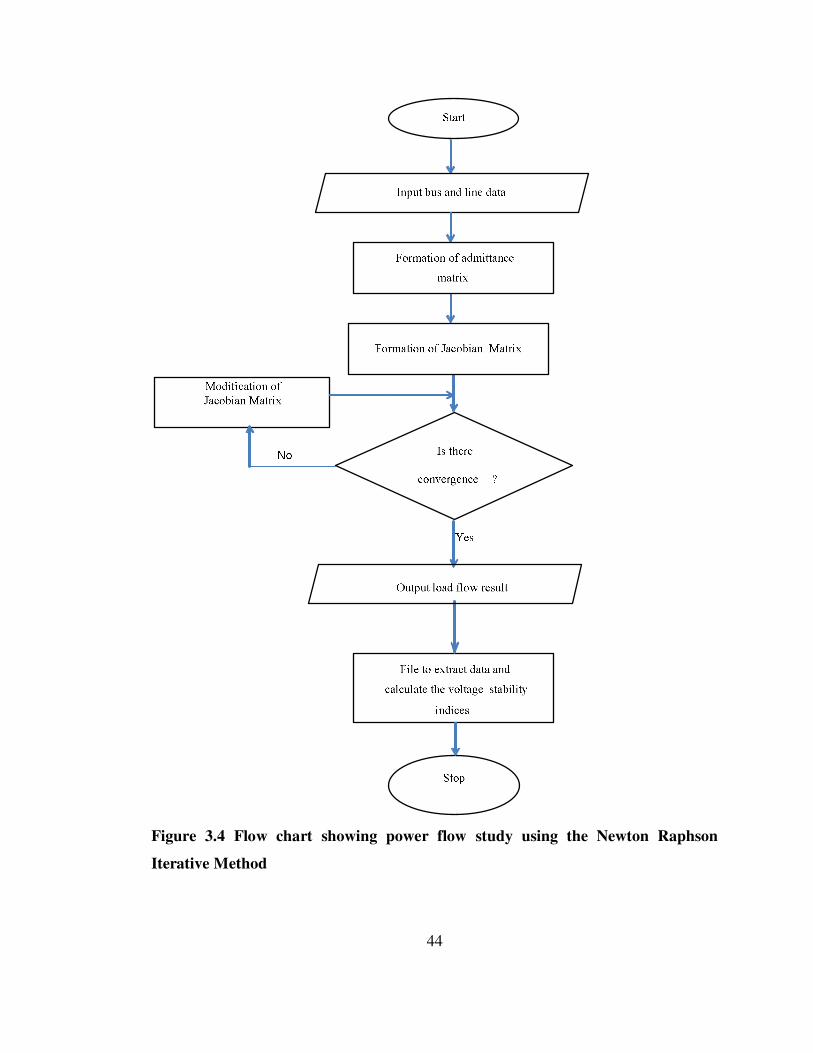
44
Figure 3.4 Flow chart showing power flow study using the Newton Raphson
Iterative Method
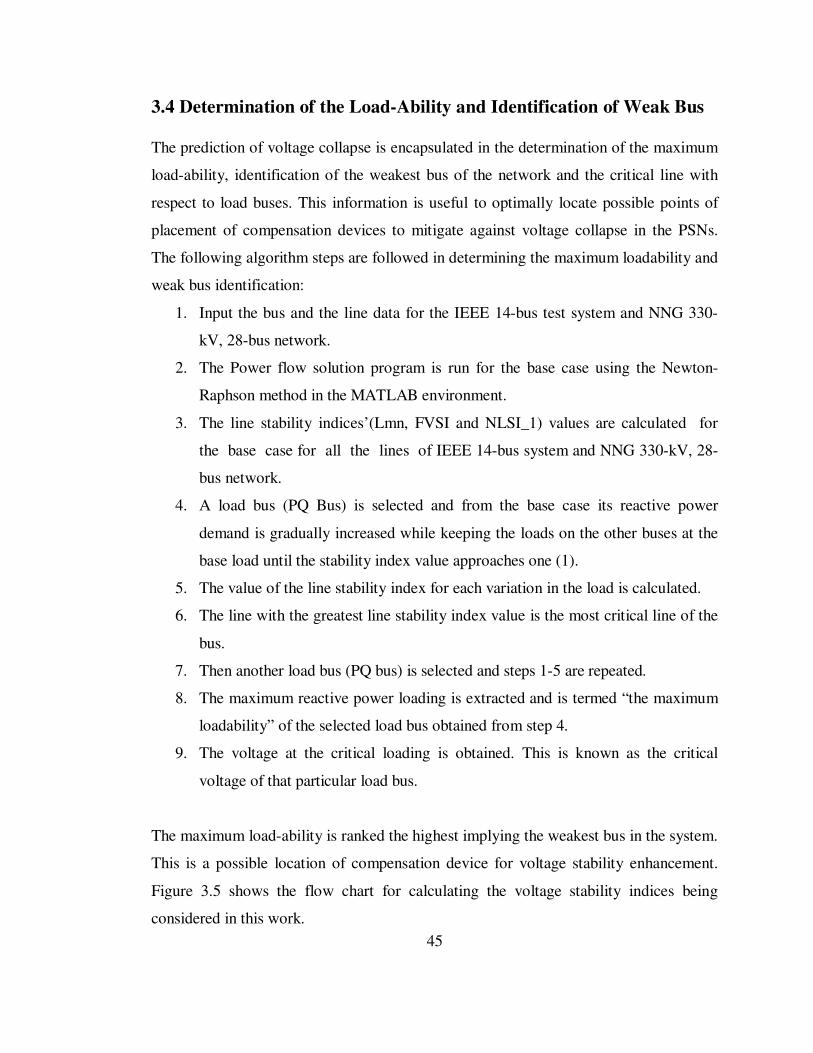
45
3.4 Determination of the Load-Ability and Identification of Weak Bus
The prediction of voltage collapse is encapsulated in the determination of the maximum
load-ability, identification of the weakest bus of the network and the critical line with
respect to load buses. This information is useful to optimally locate possible points of
placement of compensation devices to mitigate against voltage collapse in the PSNs.
The following algorithm steps are followed in determining the maximum loadability and
weak bus identification:
1. Input the bus and the line data for the IEEE 14-bus test system and NNG 330-
kV, 28-bus network.
2. The Power flow solution program is run for the base case using the Newton-
Raphson method in the MATLAB environment.
3. The line stability indices’(Lmn, FVSI and NLSI_1) values are calculated for
the base case for all the lines of IEEE 14-bus system and NNG 330-kV, 28-
bus network.
4. A load bus (PQ Bus) is selected and from the base case its reactive power
demand is gradually increased while keeping the loads on the other buses at the
base load until the stability index value approaches one (1).
5. The value of the line stability index for each variation in the load is calculated.
6. The line with the greatest line stability index value is the most critical line of the
bus.
7. Then another load bus (PQ bus) is selected and steps 1-5 are repeated.
8. The maximum reactive power loading is extracted and is termed “the maximum
loadability” of the selected load bus obtained from step 4.
9. The voltage at the critical loading is obtained. This is known as the critical
voltage of that particular load bus.
The maximum load-ability is ranked the highest implying the weakest bus in the system.
This is a possible location of compensation device for voltage stability enhancement.
Figure 3.5 shows the flow chart for calculating the voltage stability indices being
considered in this work.
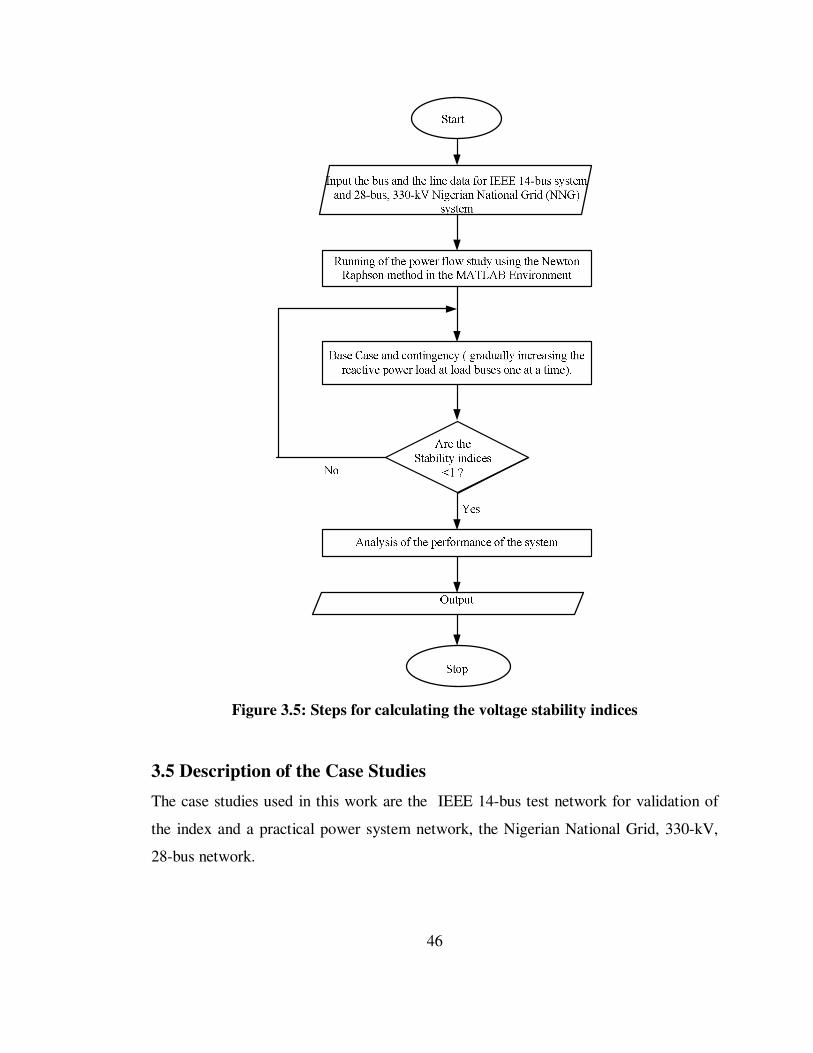
46
Figure 3.5: Steps for calculating the voltage stability indices
3.5 Description of the Case Studies
The case studies used in this work are the IEEE 14-bus test network for validation of
the index and a practical power system network, the Nigerian National Grid, 330-kV,
28-bus network.
47
3.5.1 The IEEE 14-Bus Test System
The IEEE 14-bus test system has 5 generator buses (PV), 9 load buses (PQ) and 20
interconnected lines or branches. Out of the generator buses, bus 1 is selected as the
slack bus. Figure 3.6 shows the single-line diagram of the system. The bus and line data
used for the power flow analysis are as presented.
Figure 3.6: Single-line diagram of the 14-Bus IEEE System (Kodsi and Canizares,
2003)
The bus and line data used are as presented in Tables 3.2 and 3.3, respectively. The bus
codes identification used in the MATLAB simulation are: 0 (zero) for load bus, 1 for
slack bus and 2 for voltage bus.
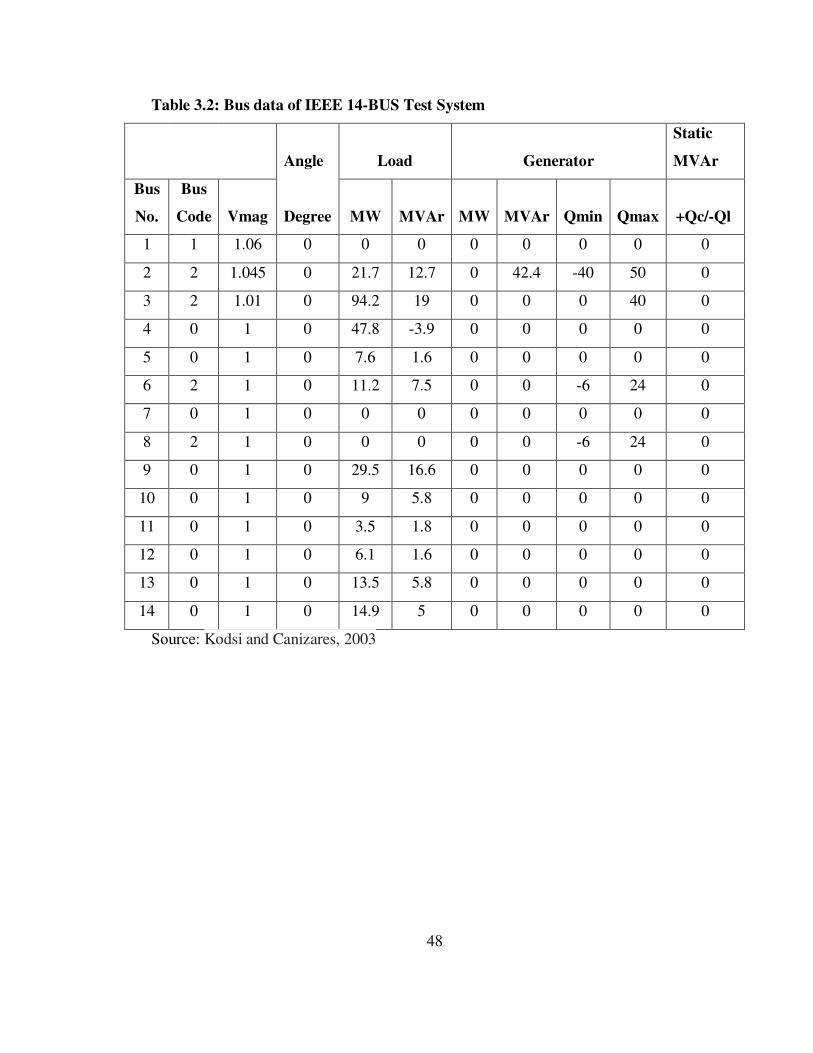
48
Table 3.2: Bus data of IEEE 14-BUS Test System
Angle Load Generator
Static
MVAr
Bus
No.
Bus
Code Vmag Degree MW MVAr MW MVAr Qmin Qmax +Qc/-Ql
1 1 1.06 0 0 0 0 0 0 0 0
2 2 1.045 0 21.7 12.7 0 42.4 -40 50 0
3 2 1.01 0 94.2 19 0 0 0 40 0
4 0 1 0 47.8 -3.9 0 0 0 0 0
5 0 1 0 7.6 1.6 0 0 0 0 0
6 2 1 0 11.2 7.5 0 0 -6 24 0
7 0 1 0 0 0 0 0 0 0 0
8 2 1 0 0 0 0 0 -6 24 0
9 0 1 0 29.5 16.6 0 0 0 0 0
10 0 1 0 9 5.8 0 0 0 0 0
11 0 1 0 3.5 1.8 0 0 0 0 0
12 0 1 0 6.1 1.6 0 0 0 0 0
13 0 1 0 13.5 5.8 0 0 0 0 0
14 0 1 0 14.9 5 0 0 0 0 0
Source: Kodsi and Canizares, 2003
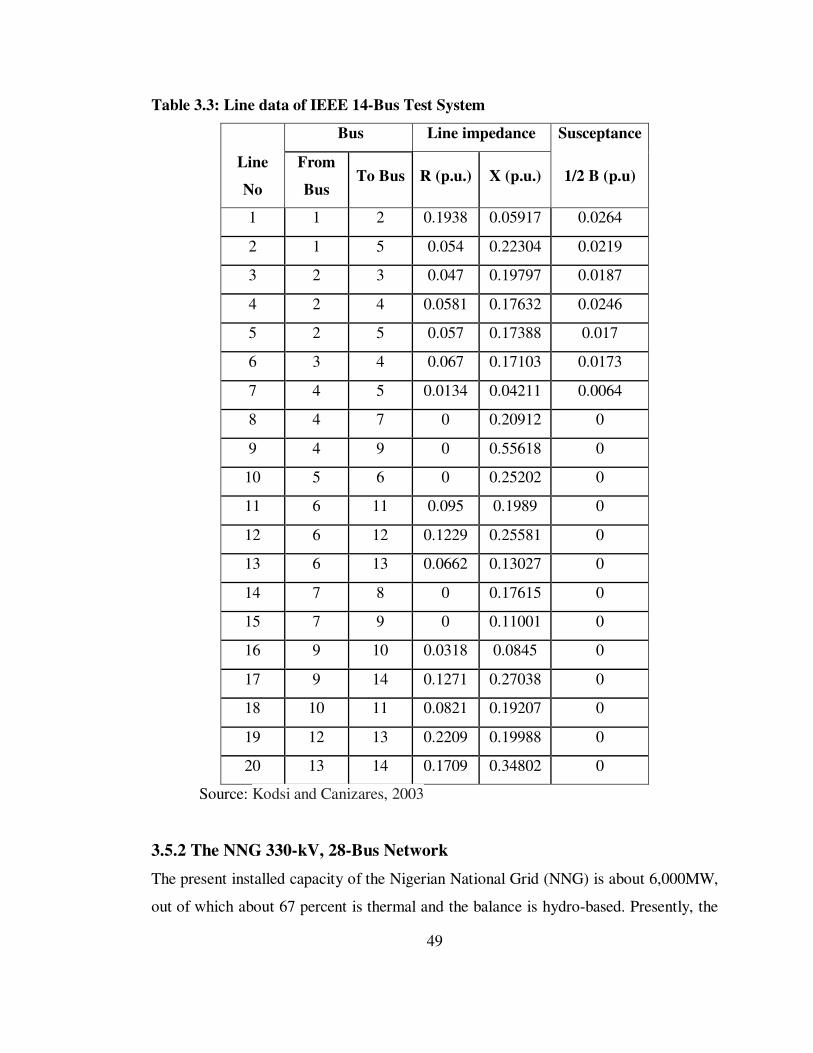
49
Table 3.3: Line data of IEEE 14-Bus Test System
Bus Line impedance Susceptance
Line
No
From
Bus To Bus R (p.u.) X (p.u.) 1/2 B (p.u)
1 1 2 0.1938 0.05917 0.0264
2 1 5 0.054 0.22304 0.0219
3 2 3 0.047 0.19797 0.0187
4 2 4 0.0581 0.17632 0.0246
5 2 5 0.057 0.17388 0.017
6 3 4 0.067 0.17103 0.0173
7 4 5 0.0134 0.04211 0.0064
8 4 7 0 0.20912 0
9 4 9 0 0.55618 0
10 5 6 0 0.25202 0
11 6 11 0.095 0.1989 0
12 6 12 0.1229 0.25581 0
13 6 13 0.0662 0.13027 0
14 7 8 0 0.17615 0
15 7 9 0 0.11001 0
16 9 10 0.0318 0.0845 0
17 9 14 0.1271 0.27038 0
18 10 11 0.0821 0.19207 0
19 12 13 0.2209 0.19988 0
20 13 14 0.1709 0.34802 0
Source: Kodsi and Canizares, 2003
3.5.2 The NNG 330-kV, 28-Bus Network
The present installed capacity of the Nigerian National Grid (NNG) is about 6,000MW,
out of which about 67 percent is thermal and the balance is hydro-based. Presently, the
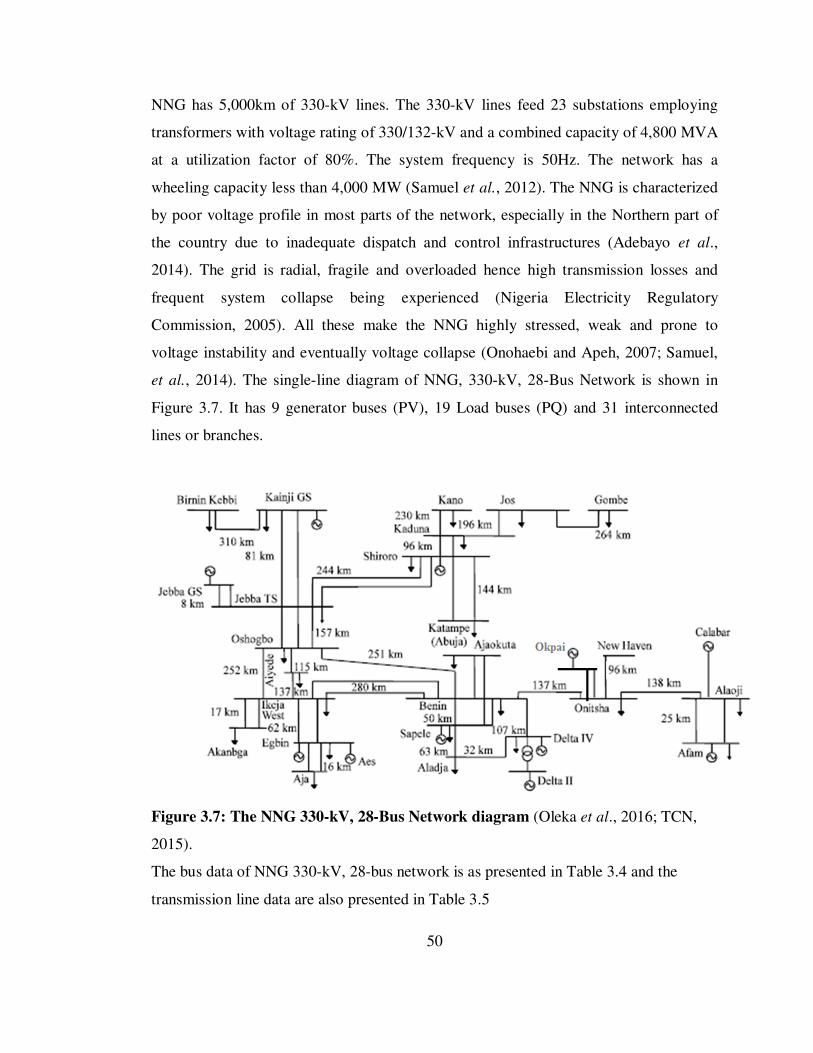
50
NNG has 5,000km of 330-kV lines. The 330-kV lines feed 23 substations employing
transformers with voltage rating of 330/132-kV and a combined capacity of 4,800 MVA
at a utilization factor of 80%. The system frequency is 50Hz. The network has a
wheeling capacity less than 4,000 MW (Samuel et al., 2012). The NNG is characterized
by poor voltage profile in most parts of the network, especially in the Northern part of
the country due to inadequate dispatch and control infrastructures (Adebayo et al.,
2014). The grid is radial, fragile and overloaded hence high transmission losses and
frequent system collapse being experienced (Nigeria Electricity Regulatory
Commission, 2005). All these make the NNG highly stressed, weak and prone to
voltage instability and eventually voltage collapse (Onohaebi and Apeh, 2007; Samuel,
et al., 2014). The single-line diagram of NNG, 330-kV, 28-Bus Network is shown in
Figure 3.7. It has 9 generator buses (PV), 19 Load buses (PQ) and 31 interconnected
lines or branches.
Figure 3.7: The NNG 330-kV, 28-Bus Network diagram (Oleka et al., 2016; TCN,
2015).
The bus data of NNG 330-kV, 28-bus network is as presented in Table 3.4 and the
transmission line data are also presented in Table 3.5

51
Table 3.4: Bus Data of NNG 330-kV, 28-Bus Network
Bus. Bus Bus Voltage Angle Load Generation
No. Name Code
Mag.
Pu Degree MW MVAr MW MVAr
1 Egbin 1 1.05 0 68.9 51.7 251.538 641.299
2 Delta 2 1.05 15.424 0 0 670 82.628
3 Aja 0 1.04 -0.57 274.4 205.8 0 0
4 Akangba 0 0.97 0.482 344.7 258.5 0 0
5 Ikeja West 0 0.986 1.408 633.2 474.9 0 0
6 Ajaokuta 0 1.026 8.739 13.8 10.3 0 0
7 Aladja 0 1.046 14.04 96.5 72.4 0 0
8 Benin 0 1.011 9.306 383.4 287.5 0 0
9 Ayede 0 0.932 2.335 275.8 206.8 0 0
10 Osogbo 0 0.966 8.642 201.2 150.9 0 0
11 Afam 2 1.05 13.273 52.5 39.4 431 590.551
12 Alaoji 0 1.007 12.057 427 320.2 0 0
13 New Haven 0 0.905 3.322 177.9 133.4 0 0
14 Onitsha 0 0.949 6.268 184.6 138.4 0 0
15 Birnin-Kebbi
0 1.01 26.299 114.5 85.9 0 0
16 Gombe 0 0.844 4.905 130.6 97.9 0 0
17 Jebba 0 1.046 25.523 11 8.2 0 0
18 Jebba-GS 2 1.05 26.022 0 0 495 159.231
19 Jos 0 0.93 12.901 70.3 52.7 0 0
20 Kaduna 0 0.951 8.791 193 144.7 0 0
21 Kainji 2 1.05 31.819 7.5 5.2 624.7 -65.319
22 Kano 0 0.818 -1.562 220.6 142.9 0 0
23 Shiroro 2 1.05 13.479 70.3 36.1 388.9 508.034
24 Sapele 2 1.05 12.015 20.6 15.4 190.3 283.405
25 Calabar 0 0.951 21.703 110 89 0 0
26 Katampe 0 1 9.242 290.1 145 0 0
27 Okpai 2 1.05 46.869 0 0 750 193.093
28 AES-GS 2 1.05 5.871 0 0 750 488.128
Source: TCN, 2015
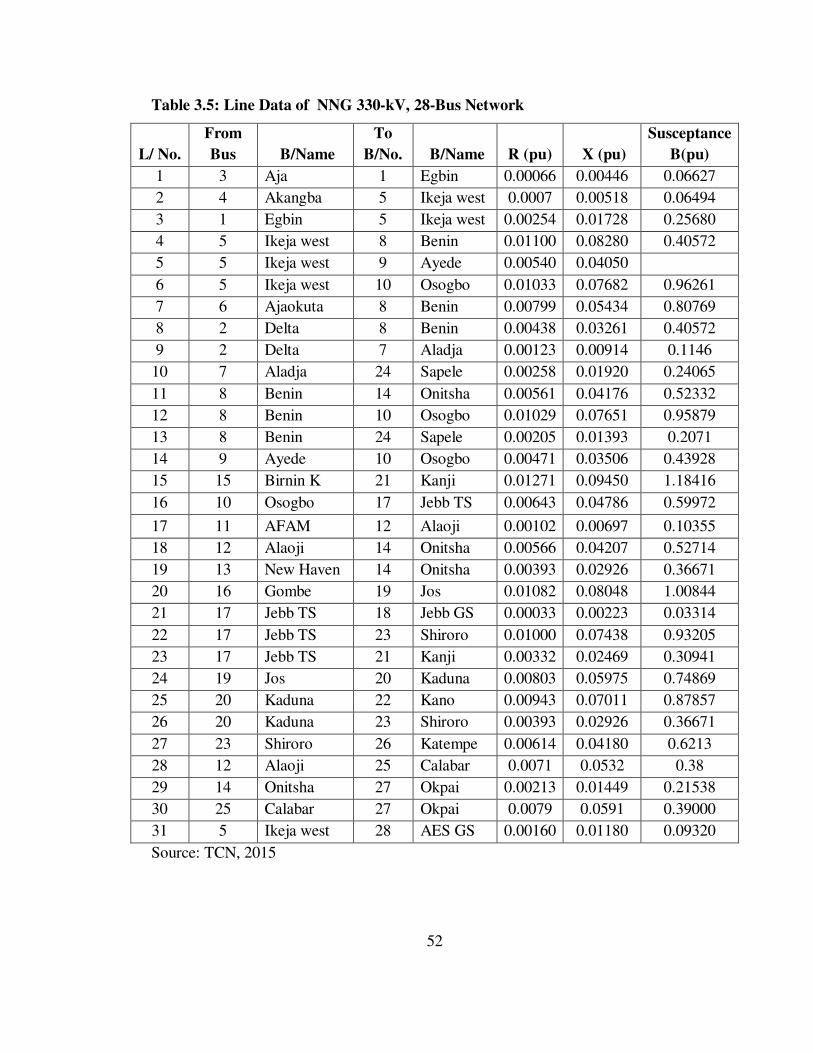
52
Table 3.5: Line Data of NNG 330-kV, 28-Bus Network
L/ No.
From
Bus B/Name
To
B/No. B/Name R (pu) X (pu)
Susceptance
B(pu)
1 3 Aja 1 Egbin 0.00066 0.00446 0.06627
2 4 Akangba 5 Ikeja west 0.0007 0.00518 0.06494
3 1 Egbin 5 Ikeja west 0.00254 0.01728 0.25680
4 5 Ikeja west 8 Benin 0.01100 0.08280 0.40572
5 5 Ikeja west 9 Ayede 0.00540 0.04050
6 5 Ikeja west 10 Osogbo 0.01033 0.07682 0.96261
7 6 Ajaokuta 8 Benin 0.00799 0.05434 0.80769
8 2 Delta 8 Benin 0.00438 0.03261 0.40572
9 2 Delta 7 Aladja 0.00123 0.00914 0.1146
10 7 Aladja 24 Sapele 0.00258 0.01920 0.24065
11 8 Benin 14 Onitsha 0.00561 0.04176 0.52332
12 8 Benin 10 Osogbo 0.01029 0.07651 0.95879
13 8 Benin 24 Sapele 0.00205 0.01393 0.2071
14 9 Ayede 10 Osogbo 0.00471 0.03506 0.43928
15 15 Birnin K 21 Kanji 0.01271 0.09450 1.18416
16 10 Osogbo 17 Jebb TS 0.00643 0.04786 0.59972
17 11 AFAM 12 Alaoji 0.00102 0.00697 0.10355
18 12 Alaoji 14 Onitsha 0.00566 0.04207 0.52714
19 13 New Haven 14 Onitsha 0.00393 0.02926 0.36671
20 16 Gombe 19 Jos 0.01082 0.08048 1.00844
21 17 Jebb TS 18 Jebb GS 0.00033 0.00223 0.03314
22 17 Jebb TS 23 Shiroro 0.01000 0.07438 0.93205
23 17 Jebb TS 21 Kanji 0.00332 0.02469 0.30941
24 19 Jos 20 Kaduna 0.00803 0.05975 0.74869
25 20 Kaduna 22 Kano 0.00943 0.07011 0.87857
26 20 Kaduna 23 Shiroro 0.00393 0.02926 0.36671
27 23 Shiroro 26 Katempe 0.00614 0.04180 0.6213
28 12 Alaoji 25 Calabar 0.0071 0.0532 0.38
29 14 Onitsha 27 Okpai 0.00213 0.01449 0.21538
30 25 Calabar 27 Okpai 0.0079 0.0591 0.39000
31 5 Ikeja west 28 AES GS 0.00160 0.01180 0.09320
Source: TCN, 2015
53
3.6 Summary
This chapter presented the derivation of the proposed new line stability index (NLSI_1).
The transmission line whose stability index is one (1) is said to be unstable and when it
is one (1), it simply means there will be voltage collapse. The stability indices are able
to reveal the weakest line and they can test for maximum load-ability which brings out
the weakest bus in the PSN. The indices were calculated based on data from Newton-
Raphson power-flow solution to predict proximity to voltage collapse in a given PSN.
The determination of the switching function is also presented. As a background review
of methods, power flow analysis is presented in section 3.4. The PSNs data for
simulations of the power flow solution required to generate data for the base case and
contingencies simulations were also presented.
54
CHAPTER FOUR
RESULTS AND DISCUSSIONS
4.1 Introduction
In chapter three material and methods were presented and the new line stability index,
NLSI_1 for predicting voltage collapse situations in a power system was derived. This
chapter presents case study comparisons of the new index to the existing indices Lmn
and FVSI so as to validate the new index, NLSI_1. The simulations are carried out for
the two PSNs used as case studies and the results are discussed.
4.2 Simulations
Simulations are carried out based on the following two scenarios:
i. The base case: This is the normal operational mode.
ii. The contingency: This is the variation of the reactive power for load buses
from the base case one at a time.
These two scenarios are carried out on two case studies: the IEEE 14-bus test system
and the NNG 330-kV, 28-bus network.
4.2.1 Simulation Results of the IEEE 14-bus test system
The power flow simulation was performed on the IEEE 14-bus test system network for
the base case and the stability indices were calculated for validation of voltage stability
indices (as shown in Appendix A). The power flow solution using the Newton-Raphson
method is as shown in Table 4.1. Figure 4.2 shows the graph of voltage magnitude
versus bus number (voltage profile).
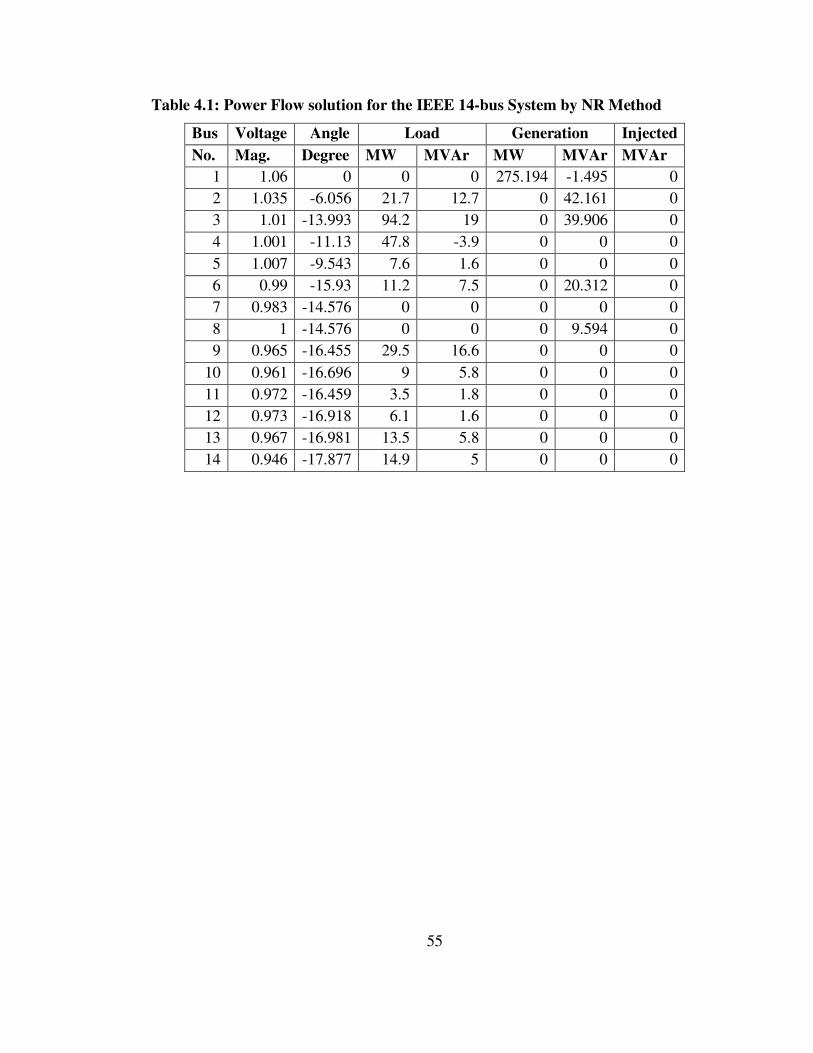
55
Table 4.1: Power Flow solution for the IEEE 14-bus System by NR Method
Bus Voltage Angle Load Generation Injected
No. Mag. Degree MW MVAr MW MVAr MVAr
1 1.06 0 0 0 275.194 -1.495 0
2 1.035 -6.056 21.7 12.7 0 42.161 0
3 1.01 -13.993 94.2 19 0 39.906 0
4 1.001 -11.13 47.8 -3.9 0 0 0
5 1.007 -9.543 7.6 1.6 0 0 0
6 0.99 -15.93 11.2 7.5 0 20.312 0
7 0.983 -14.576 0 0 0 0 0
8 1 -14.576 0 0 0 9.594 0
9 0.965 -16.455 29.5 16.6 0 0 0
10 0.961 -16.696 9 5.8 0 0 0
11 0.972 -16.459 3.5 1.8 0 0 0
12 0.973 -16.918 6.1 1.6 0 0 0
13 0.967 -16.981 13.5 5.8 0 0 0
14 0.946 -17.877 14.9 5 0 0 0
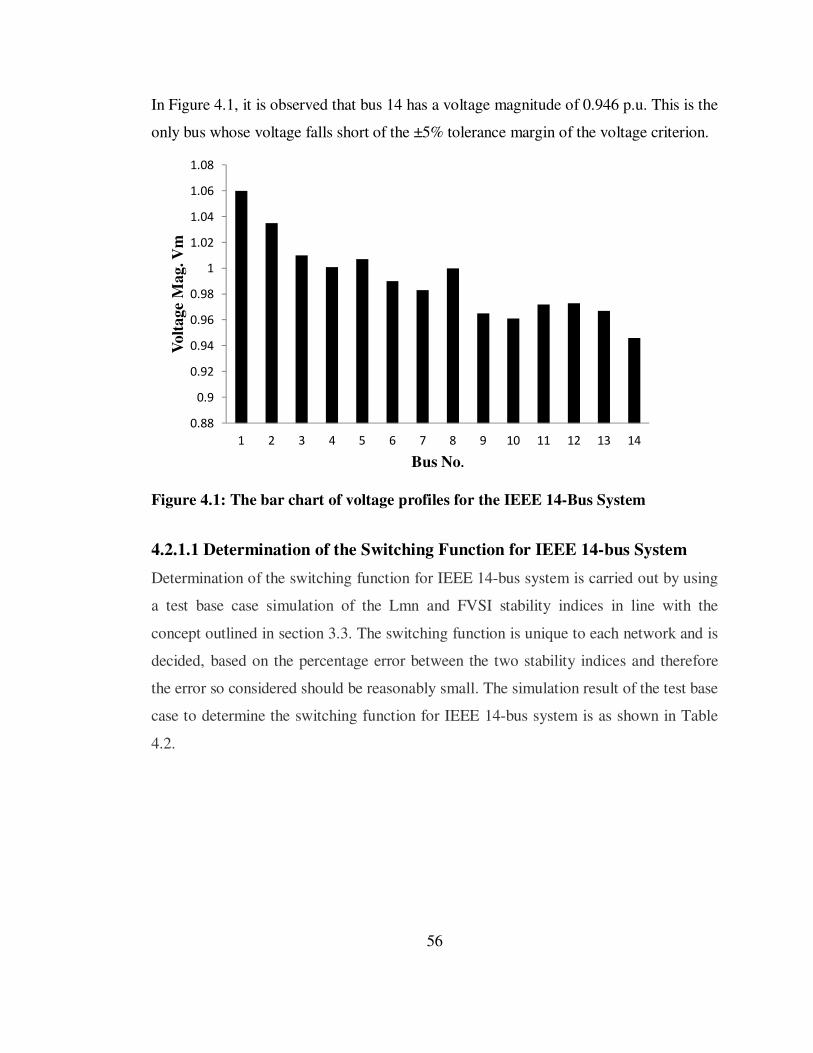
56
In Figure 4.1, it is observed that bus 14 has a voltage magnitude of 0.946 p.u. This is the
only bus whose voltage falls short of the ±5% tolerance margin of the voltage criterion.
Figure 4.1: The bar chart of voltage profiles for the IEEE 14-Bus System
4.2.1.1 Determination of the Switching Function for IEEE 14-bus System
Determination of the switching function for IEEE 14-bus system is carried out by using
a test base case simulation of the Lmn and FVSI stability indices in line with the
concept outlined in section 3.3. The switching function is unique to each network and is
decided, based on the percentage error between the two stability indices and therefore
the error so considered should be reasonably small. The simulation result of the test base
case to determine the switching function for IEEE 14-bus system is as shown in Table
4.2.
0.88
0.9
0.92
0.94
0.96
0.98
1
1.02
1.04
1.06
1.08
1 2 3 4 5 6 7 8 9 10 11 12 13 14
Volt
ag
e M
ag. V
m
Bus No.
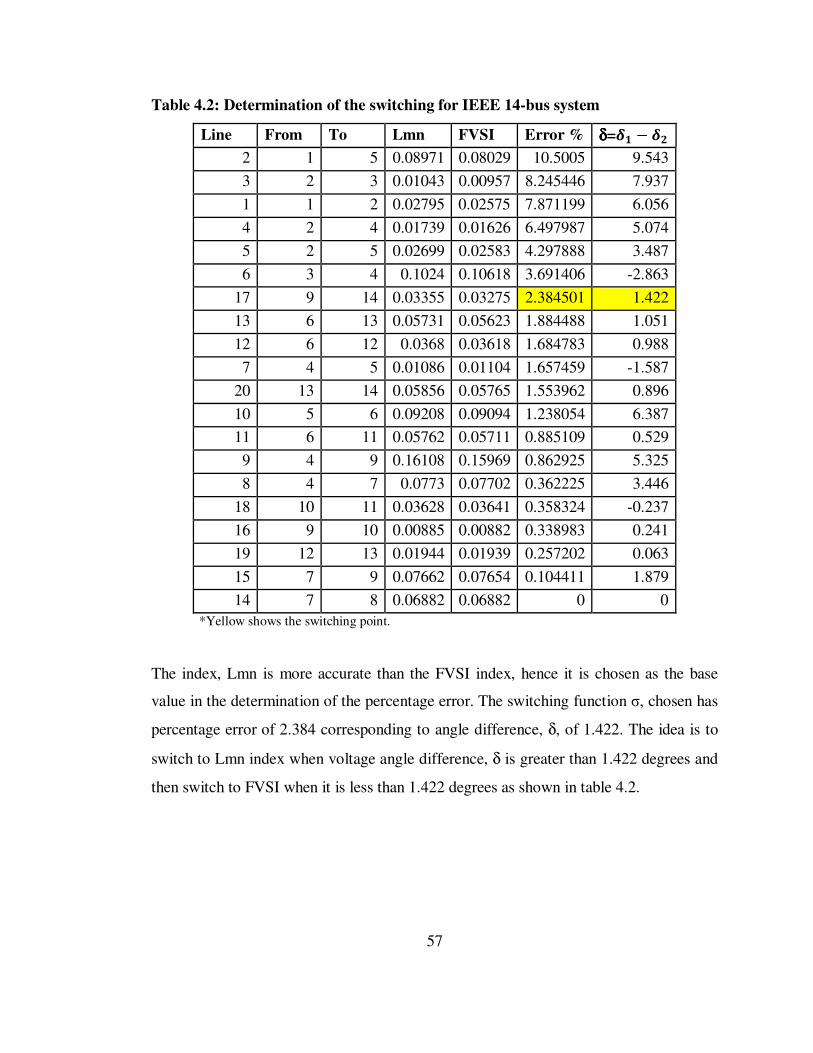
57
Table 4.2: Determination of the switching for IEEE 14-bus system
Line From To Lmn FVSI Error % δδδδ=�� − ��
2 1 5 0.08971 0.08029 10.5005 9.543
3 2 3 0.01043 0.00957 8.245446 7.937
1 1 2 0.02795 0.02575 7.871199 6.056
4 2 4 0.01739 0.01626 6.497987 5.074
5 2 5 0.02699 0.02583 4.297888 3.487
6 3 4 0.1024 0.10618 3.691406 -2.863
17 9 14 0.03355 0.03275 2.384501 1.422
13 6 13 0.05731 0.05623 1.884488 1.051
12 6 12 0.0368 0.03618 1.684783 0.988
7 4 5 0.01086 0.01104 1.657459 -1.587
20 13 14 0.05856 0.05765 1.553962 0.896
10 5 6 0.09208 0.09094 1.238054 6.387
11 6 11 0.05762 0.05711 0.885109 0.529
9 4 9 0.16108 0.15969 0.862925 5.325
8 4 7 0.0773 0.07702 0.362225 3.446
18 10 11 0.03628 0.03641 0.358324 -0.237
16 9 10 0.00885 0.00882 0.338983 0.241
19 12 13 0.01944 0.01939 0.257202 0.063
15 7 9 0.07662 0.07654 0.104411 1.879
14 7 8 0.06882 0.06882 0 0
*Yellow shows the switching point.
The index, Lmn is more accurate than the FVSI index, hence it is chosen as the base
value in the determination of the percentage error. The switching function σ, chosen has
percentage error of 2.384 corresponding to angle difference, δ, of 1.422. The idea is to
switch to Lmn index when voltage angle difference, δ is greater than 1.422 degrees and
then switch to FVSI when it is less than 1.422 degrees as shown in table 4.2.
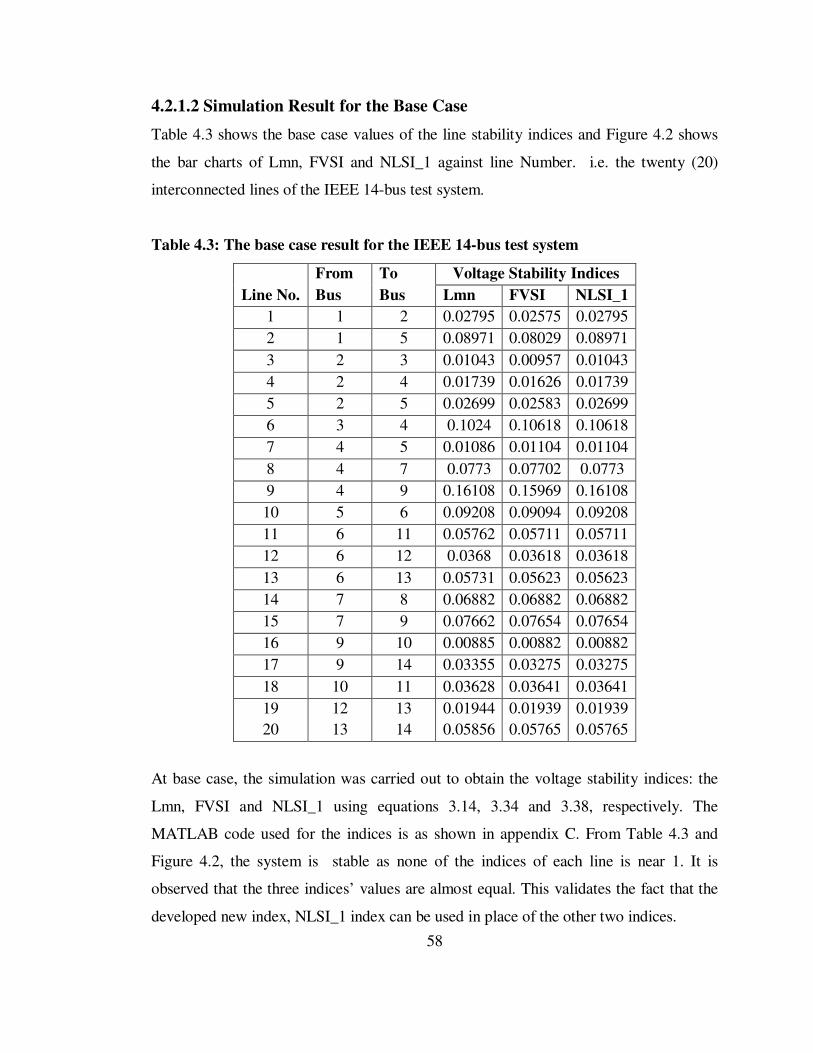
58
4.2.1.2 Simulation Result for the Base Case
Table 4.3 shows the base case values of the line stability indices and Figure 4.2 shows
the bar charts of Lmn, FVSI and NLSI_1 against line Number. i.e. the twenty (20)
interconnected lines of the IEEE 14-bus test system.
Table 4.3: The base case result for the IEEE 14-bus test system
From To Voltage Stability Indices
Line No. Bus Bus Lmn FVSI NLSI_1
1 1 2 0.02795 0.02575 0.02795
2 1 5 0.08971 0.08029 0.08971
3 2 3 0.01043 0.00957 0.01043
4 2 4 0.01739 0.01626 0.01739
5 2 5 0.02699 0.02583 0.02699
6 3 4 0.1024 0.10618 0.10618
7 4 5 0.01086 0.01104 0.01104
8 4 7 0.0773 0.07702 0.0773
9 4 9 0.16108 0.15969 0.16108
10 5 6 0.09208 0.09094 0.09208
11 6 11 0.05762 0.05711 0.05711
12 6 12 0.0368 0.03618 0.03618
13 6 13 0.05731 0.05623 0.05623
14 7 8 0.06882 0.06882 0.06882
15 7 9 0.07662 0.07654 0.07654
16 9 10 0.00885 0.00882 0.00882
17 9 14 0.03355 0.03275 0.03275
18 10 11 0.03628 0.03641 0.03641
19 12 13 0.01944 0.01939 0.01939
20 13 14 0.05856 0.05765 0.05765
At base case, the simulation was carried out to obtain the voltage stability indices: the
Lmn, FVSI and NLSI_1 using equations 3.14, 3.34 and 3.38, respectively. The
MATLAB code used for the indices is as shown in appendix C. From Table 4.3 and
Figure 4.2, the system is stable as none of the indices of each line is near 1. It is
observed that the three indices’ values are almost equal. This validates the fact that the
developed new index, NLSI_1 index can be used in place of the other two indices.
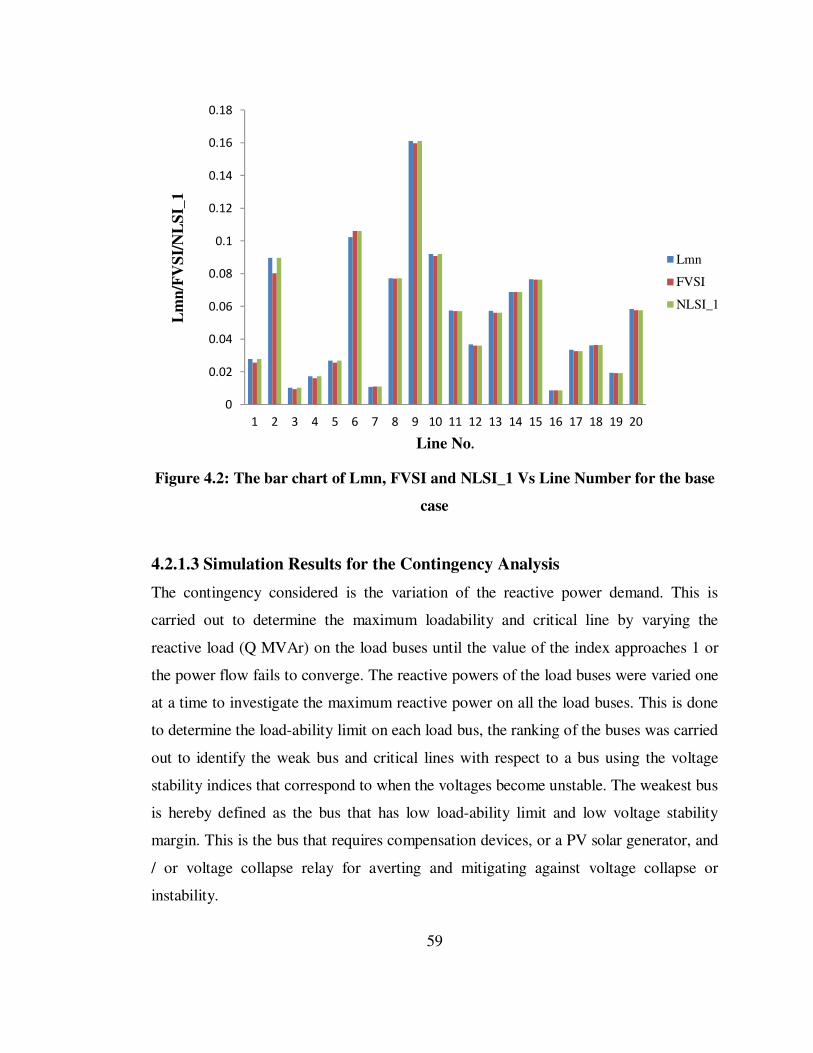
59
Figure 4.2: The bar chart of Lmn, FVSI and NLSI_1 Vs Line Number for the base
case
4.2.1.3 Simulation Results for the Contingency Analysis
The contingency considered is the variation of the reactive power demand. This is
carried out to determine the maximum loadability and critical line by varying the
reactive load (Q MVAr) on the load buses until the value of the index approaches 1 or
the power flow fails to converge. The reactive powers of the load buses were varied one
at a time to investigate the maximum reactive power on all the load buses. This is done
to determine the load-ability limit on each load bus, the ranking of the buses was carried
out to identify the weak bus and critical lines with respect to a bus using the voltage
stability indices that correspond to when the voltages become unstable. The weakest bus
is hereby defined as the bus that has low load-ability limit and low voltage stability
margin. This is the bus that requires compensation devices, or a PV solar generator, and
/ or voltage collapse relay for averting and mitigating against voltage collapse or
instability.
0
0.02
0.04
0.06
0.08
0.1
0.12
0.14
0.16
0.18
1 2 3 4 5 6 7 8 9 10 11 12 13 14 15 16 17 18 19 20
Lm
n/F
VS
I/N
LS
I_1
Line No.
Lmn
FVSI
NLSI_1
60
The simulation result tabulated in Table 4.4 is for the determination of the maximum
reactive load for all the load buses on the IEEE 14-bus system. Figure 4.3 shows the
graph of the maximum reactive load (MVAr) against bus number. The maximum load-
ability of each bus, the most critical line and most stable line with respect to a particular
load bus are identified and tabulated as shown in Table 4.4. It is observed from Table
4.4, that the load buses with more interconnected lines accommodate higher reactive
loads, which means that they are the most stable and reliable in the system, hence radial
network is not desirable in power system networks. These load buses are 4 and 5 with
maximum reactive loads of 361 and 352.5 MVAr respectively.
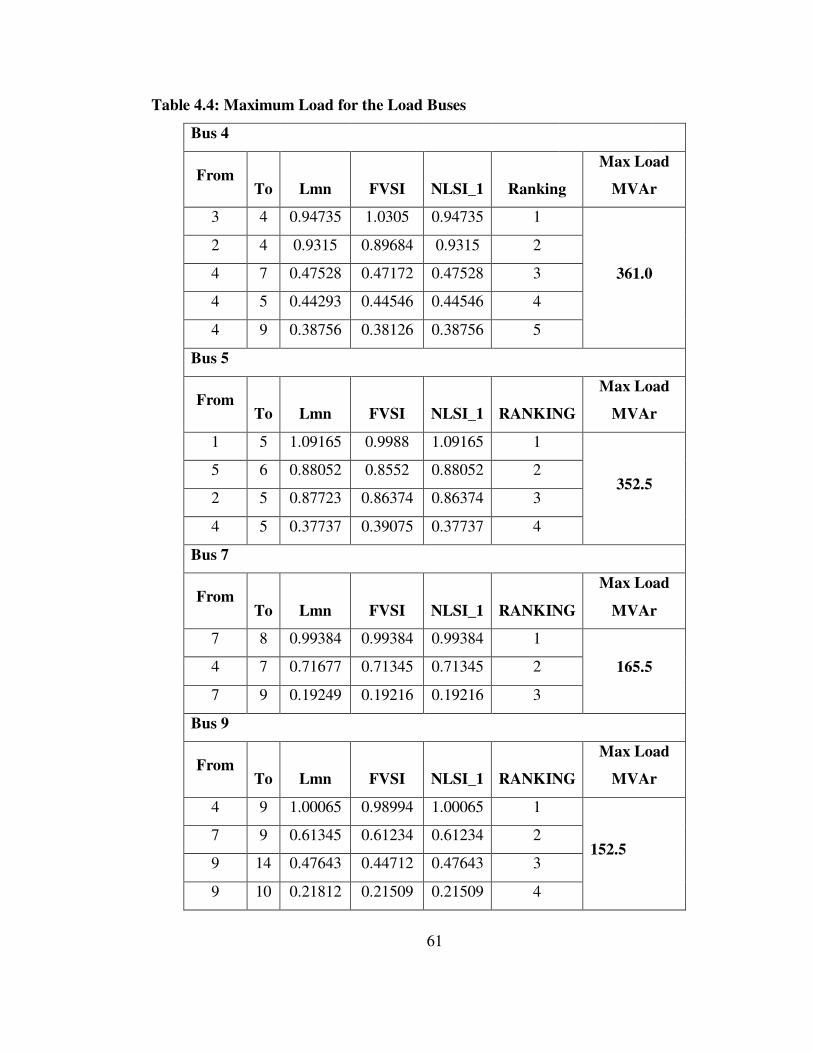
61
Table 4.4: Maximum Load for the Load Buses
Bus 4
From To Lmn FVSI NLSI_1 Ranking
Max Load
MVAr
3 4 0.94735 1.0305 0.94735 1
361.0
2 4 0.9315 0.89684 0.9315 2
4 7 0.47528 0.47172 0.47528 3
4 5 0.44293 0.44546 0.44546 4
4 9 0.38756 0.38126 0.38756 5
Bus 5
From To Lmn FVSI NLSI_1 RANKING
Max Load
MVAr
1 5 1.09165 0.9988 1.09165 1
352.5 5 6 0.88052 0.8552 0.88052 2
2 5 0.87723 0.86374 0.86374 3
4 5 0.37737 0.39075 0.37737 4
Bus 7
From To Lmn FVSI NLSI_1 RANKING
Max Load
MVAr
7 8 0.99384 0.99384 0.99384 1
165.5 4 7 0.71677 0.71345 0.71345 2
7 9 0.19249 0.19216 0.19216 3
Bus 9
From To Lmn FVSI NLSI_1 RANKING
Max Load
MVAr
4 9 1.00065 0.98994 1.00065 1
152.5 7 9 0.61345 0.61234 0.61234 2
9 14 0.47643 0.44712 0.47643 3
9 10 0.21812 0.21509 0.21509 4
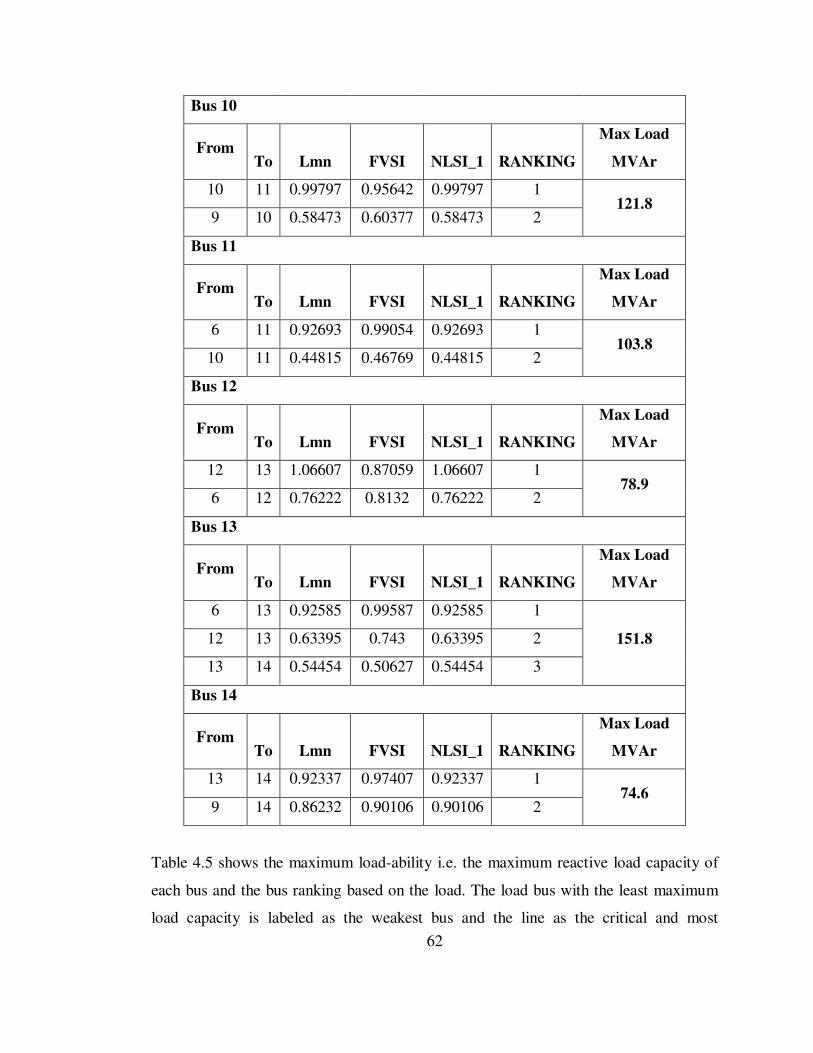
62
Bus 10
From To Lmn FVSI NLSI_1 RANKING
Max Load
MVAr
10 11 0.99797 0.95642 0.99797 1 121.8
9 10 0.58473 0.60377 0.58473 2
Bus 11
From To Lmn FVSI NLSI_1 RANKING
Max Load
MVAr
6 11 0.92693 0.99054 0.92693 1 103.8
10 11 0.44815 0.46769 0.44815 2
Bus 12
From To Lmn FVSI NLSI_1 RANKING
Max Load
MVAr
12 13 1.06607 0.87059 1.06607 1 78.9
6 12 0.76222 0.8132 0.76222 2
Bus 13
From To Lmn FVSI NLSI_1 RANKING
Max Load
MVAr
6 13 0.92585 0.99587 0.92585 1
151.8 12 13 0.63395 0.743 0.63395 2
13 14 0.54454 0.50627 0.54454 3
Bus 14
From To Lmn FVSI NLSI_1 RANKING
Max Load
MVAr
13 14 0.92337 0.97407 0.92337 1 74.6
9 14 0.86232 0.90106 0.90106 2
Table 4.5 shows the maximum load-ability i.e. the maximum reactive load capacity of
each bus and the bus ranking based on the load. The load bus with the least maximum
load capacity is labeled as the weakest bus and the line as the critical and most
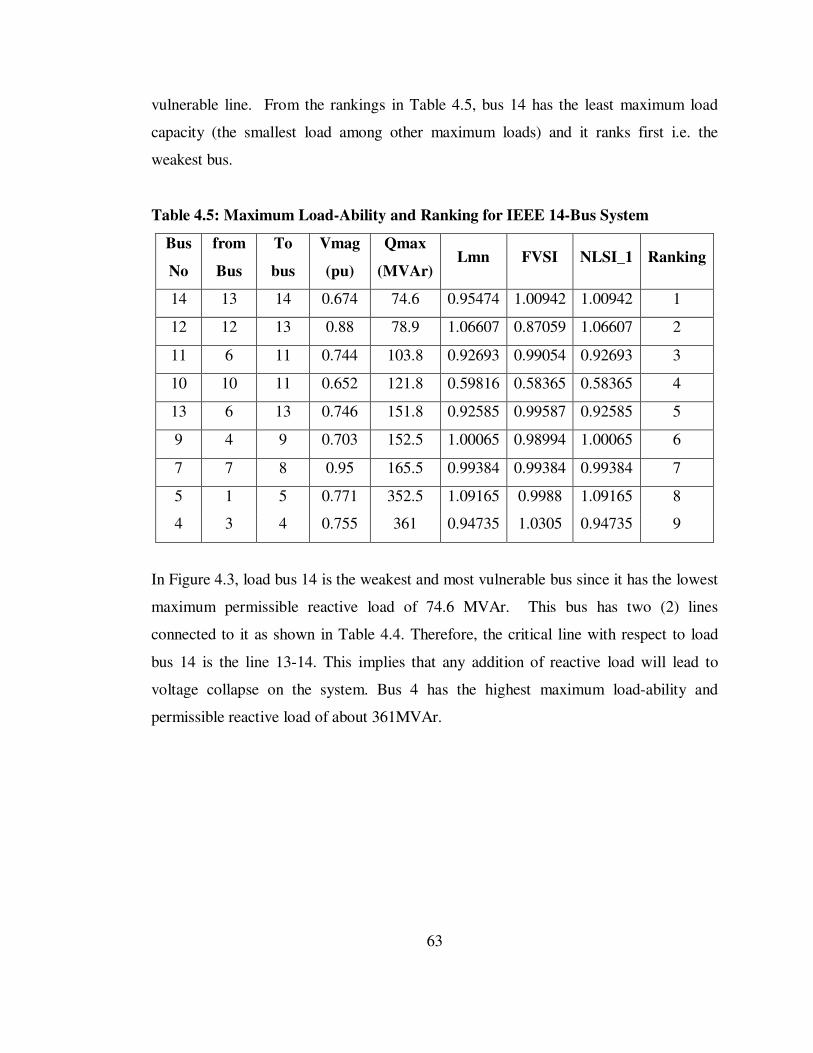
63
vulnerable line. From the rankings in Table 4.5, bus 14 has the least maximum load
capacity (the smallest load among other maximum loads) and it ranks first i.e. the
weakest bus.
Table 4.5: Maximum Load-Ability and Ranking for IEEE 14-Bus System
Bus
No
from
Bus
To
bus
Vmag
(pu)
Qmax
(MVAr) Lmn FVSI NLSI_1 Ranking
14 13 14 0.674 74.6 0.95474 1.00942 1.00942 1
12 12 13 0.88 78.9 1.06607 0.87059 1.06607 2
11 6 11 0.744 103.8 0.92693 0.99054 0.92693 3
10 10 11 0.652 121.8 0.59816 0.58365 0.58365 4
13 6 13 0.746 151.8 0.92585 0.99587 0.92585 5
9 4 9 0.703 152.5 1.00065 0.98994 1.00065 6
7 7 8 0.95 165.5 0.99384 0.99384 0.99384 7
5 1 5 0.771 352.5 1.09165 0.9988 1.09165 8
4 3 4 0.755 361 0.94735 1.0305 0.94735 9
In Figure 4.3, load bus 14 is the weakest and most vulnerable bus since it has the lowest
maximum permissible reactive load of 74.6 MVAr. This bus has two (2) lines
connected to it as shown in Table 4.4. Therefore, the critical line with respect to load
bus 14 is the line 13-14. This implies that any addition of reactive load will lead to
voltage collapse on the system. Bus 4 has the highest maximum load-ability and
permissible reactive load of about 361MVAr.
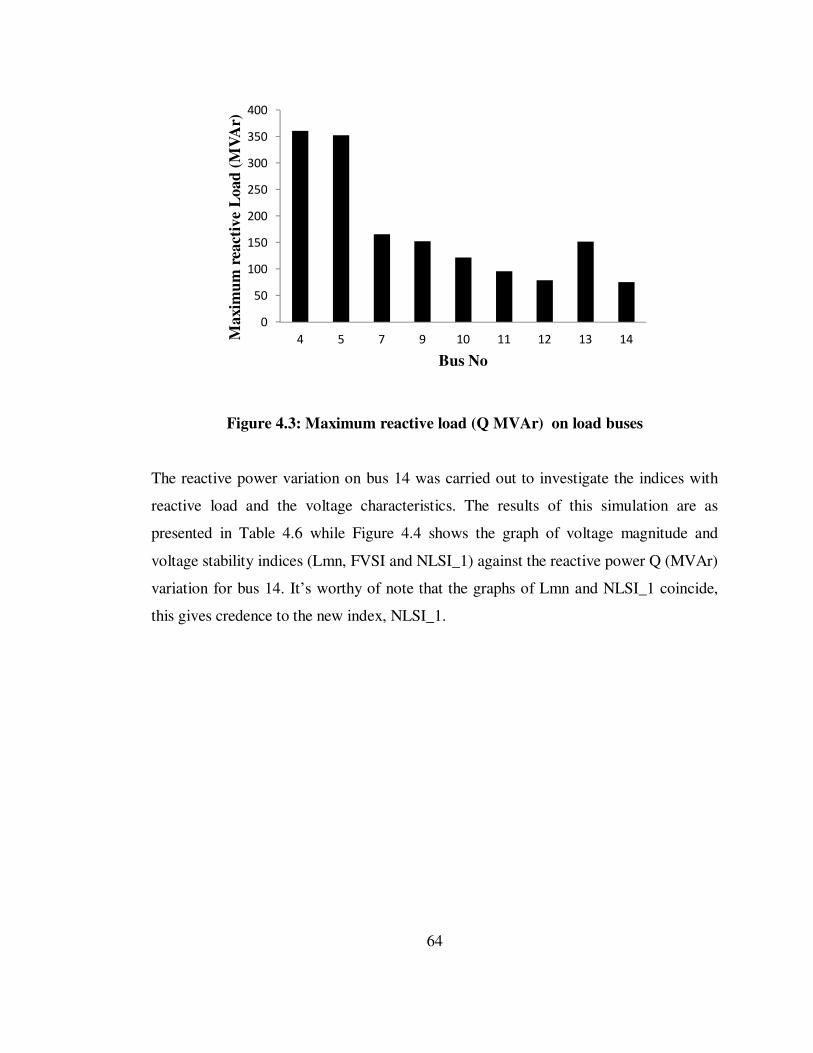
64
Figure 4.3: Maximum reactive load (Q MVAr) on load buses
The reactive power variation on bus 14 was carried out to investigate the indices with
reactive load and the voltage characteristics. The results of this simulation are as
presented in Table 4.6 while Figure 4.4 shows the graph of voltage magnitude and
voltage stability indices (Lmn, FVSI and NLSI_1) against the reactive power Q (MVAr)
variation for bus 14. It’s worthy of note that the graphs of Lmn and NLSI_1 coincide,
this gives credence to the new index, NLSI_1.
0
50
100
150
200
250
300
350
400
4 5 7 9 10 11 12 13 14Maxim
um
rea
ctiv
e L
oad
(M
VA
r)
Bus No
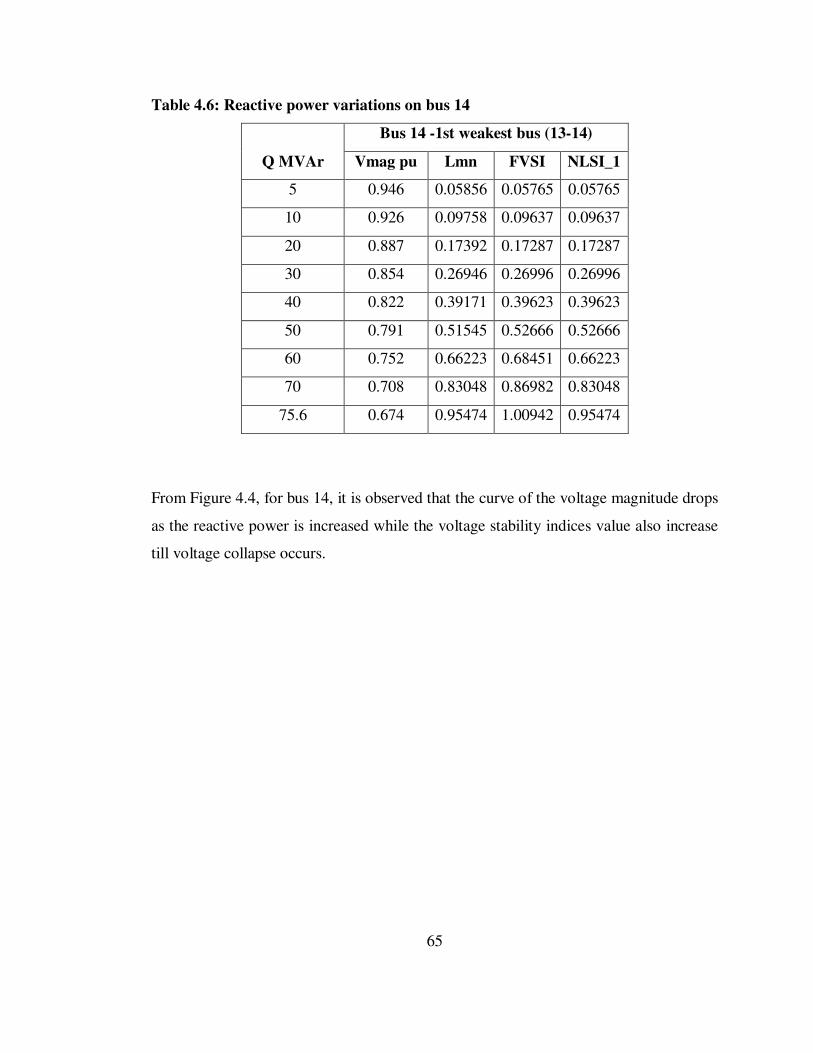
65
Table 4.6: Reactive power variations on bus 14
Bus 14 -1st weakest bus (13-14)
Q MVAr Vmag pu Lmn FVSI NLSI_1
5 0.946 0.05856 0.05765 0.05765
10 0.926 0.09758 0.09637 0.09637
20 0.887 0.17392 0.17287 0.17287
30 0.854 0.26946 0.26996 0.26996
40 0.822 0.39171 0.39623 0.39623
50 0.791 0.51545 0.52666 0.52666
60 0.752 0.66223 0.68451 0.66223
70 0.708 0.83048 0.86982 0.83048
75.6 0.674 0.95474 1.00942 0.95474
From Figure 4.4, for bus 14, it is observed that the curve of the voltage magnitude drops
as the reactive power is increased while the voltage stability indices value also increase
till voltage collapse occurs.
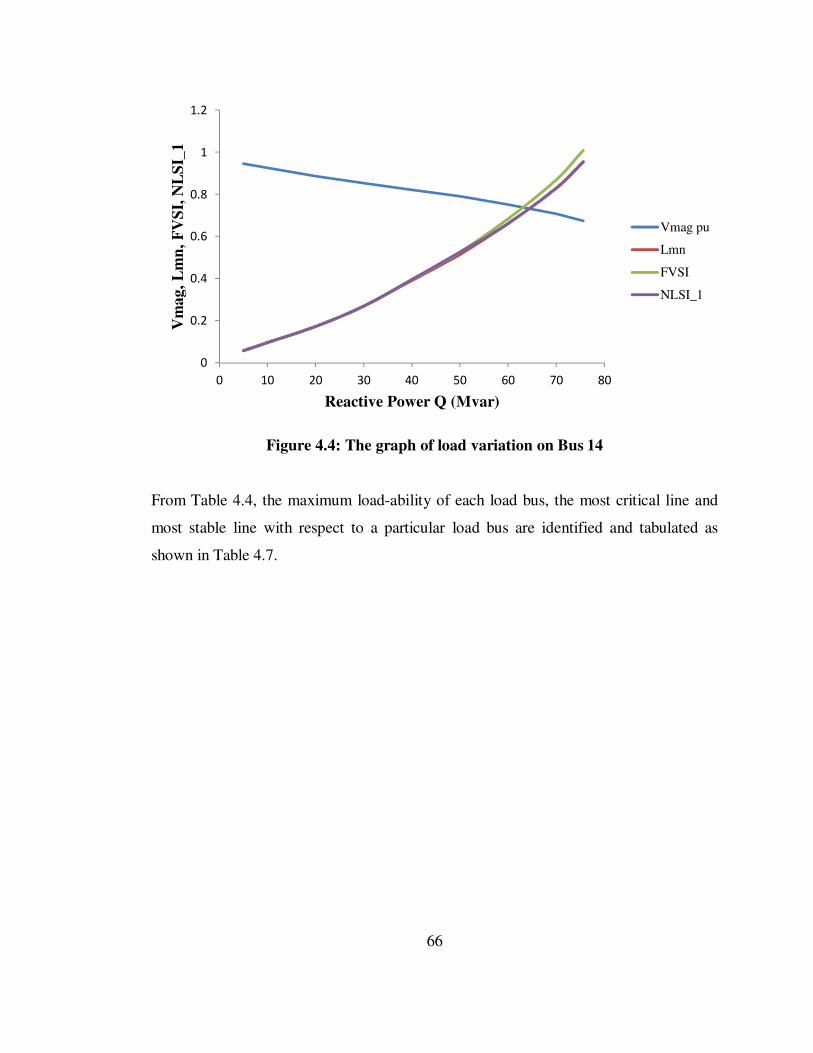
66
Figure 4.4: The graph of load variation on Bus 14
From Table 4.4, the maximum load-ability of each load bus, the most critical line and
most stable line with respect to a particular load bus are identified and tabulated as
shown in Table 4.7.
0
0.2
0.4
0.6
0.8
1
1.2
0 10 20 30 40 50 60 70 80
Vm
ag,
Lm
n,
FV
SI,
NL
SI_
1
Reactive Power Q (Mvar)
Vmag pu
Lmn
FVSI
NLSI_1
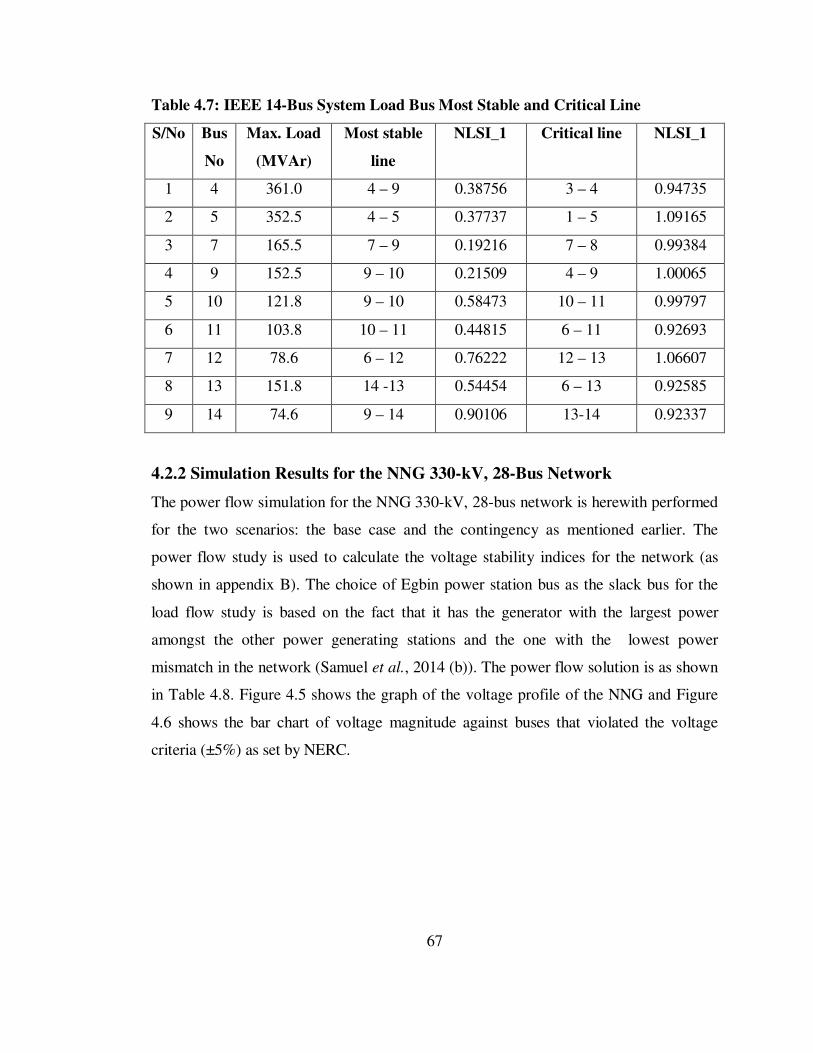
67
Table 4.7: IEEE 14-Bus System Load Bus Most Stable and Critical Line
S/No Bus
No
Max. Load
(MVAr)
Most stable
line
NLSI_1 Critical line NLSI_1
1 4 361.0 4 – 9 0.38756 3 – 4 0.94735
2 5 352.5 4 – 5 0.37737 1 – 5 1.09165
3 7 165.5 7 – 9 0.19216 7 – 8 0.99384
4 9 152.5 9 – 10 0.21509 4 – 9 1.00065
5 10 121.8 9 – 10 0.58473 10 – 11 0.99797
6 11 103.8 10 – 11 0.44815 6 – 11 0.92693
7 12 78.6 6 – 12 0.76222 12 – 13 1.06607
8 13 151.8 14 -13 0.54454 6 – 13 0.92585
9 14 74.6 9 – 14 0.90106 13-14 0.92337
4.2.2 Simulation Results for the NNG 330-kV, 28-Bus Network
The power flow simulation for the NNG 330-kV, 28-bus network is herewith performed
for the two scenarios: the base case and the contingency as mentioned earlier. The
power flow study is used to calculate the voltage stability indices for the network (as
shown in appendix B). The choice of Egbin power station bus as the slack bus for the
load flow study is based on the fact that it has the generator with the largest power
amongst the other power generating stations and the one with the lowest power
mismatch in the network (Samuel et al., 2014 (b)). The power flow solution is as shown
in Table 4.8. Figure 4.5 shows the graph of the voltage profile of the NNG and Figure
4.6 shows the bar chart of voltage magnitude against buses that violated the voltage
criteria (±5%) as set by NERC.
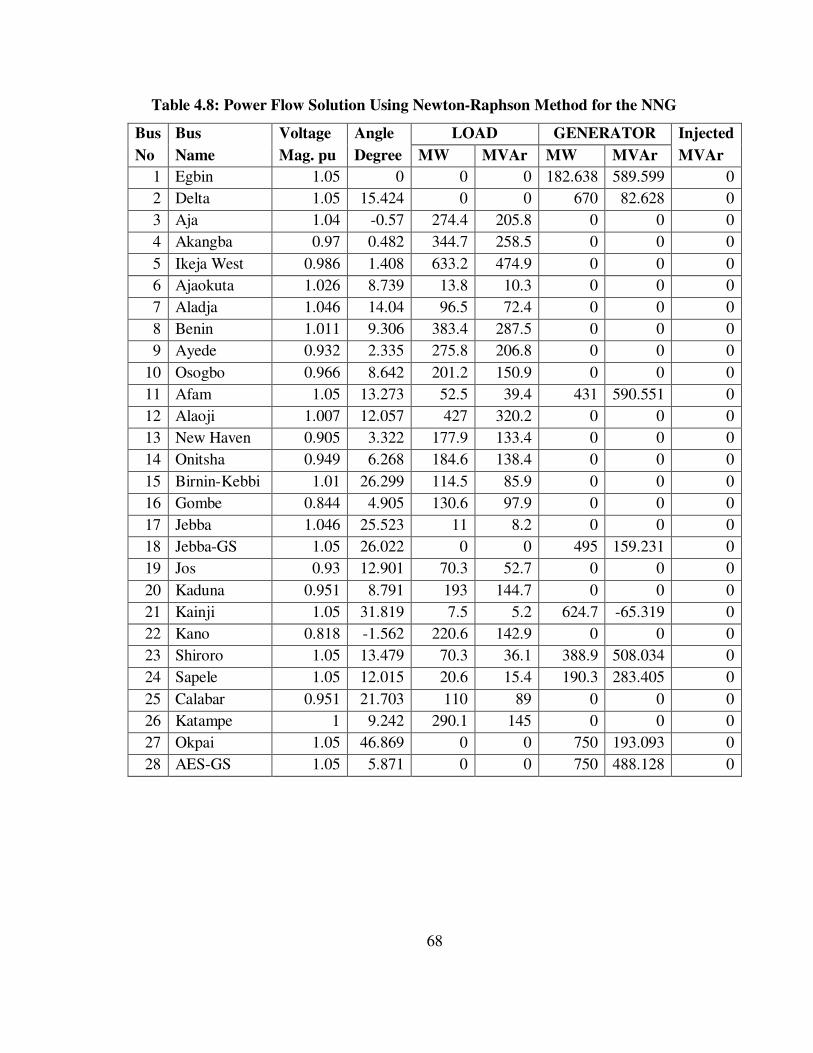
68
Table 4.8: Power Flow Solution Using Newton-Raphson Method for the NNG
Bus Bus Voltage Angle LOAD GENERATOR Injected
No Name Mag. pu Degree MW MVAr MW MVAr MVAr
1 Egbin 1.05 0 0 0 182.638 589.599 0
2 Delta 1.05 15.424 0 0 670 82.628 0
3 Aja 1.04 -0.57 274.4 205.8 0 0 0
4 Akangba 0.97 0.482 344.7 258.5 0 0 0
5 Ikeja West 0.986 1.408 633.2 474.9 0 0 0
6 Ajaokuta 1.026 8.739 13.8 10.3 0 0 0
7 Aladja 1.046 14.04 96.5 72.4 0 0 0
8 Benin 1.011 9.306 383.4 287.5 0 0 0
9 Ayede 0.932 2.335 275.8 206.8 0 0 0
10 Osogbo 0.966 8.642 201.2 150.9 0 0 0
11 Afam 1.05 13.273 52.5 39.4 431 590.551 0
12 Alaoji 1.007 12.057 427 320.2 0 0 0
13 New Haven 0.905 3.322 177.9 133.4 0 0 0
14 Onitsha 0.949 6.268 184.6 138.4 0 0 0
15 Birnin-Kebbi 1.01 26.299 114.5 85.9 0 0 0
16 Gombe 0.844 4.905 130.6 97.9 0 0 0
17 Jebba 1.046 25.523 11 8.2 0 0 0
18 Jebba-GS 1.05 26.022 0 0 495 159.231 0
19 Jos 0.93 12.901 70.3 52.7 0 0 0
20 Kaduna 0.951 8.791 193 144.7 0 0 0
21 Kainji 1.05 31.819 7.5 5.2 624.7 -65.319 0
22 Kano 0.818 -1.562 220.6 142.9 0 0 0
23 Shiroro 1.05 13.479 70.3 36.1 388.9 508.034 0
24 Sapele 1.05 12.015 20.6 15.4 190.3 283.405 0
25 Calabar 0.951 21.703 110 89 0 0 0
26 Katampe 1 9.242 290.1 145 0 0 0
27 Okpai 1.05 46.869 0 0 750 193.093 0
28 AES-GS 1.05 5.871 0 0 750 488.128 0
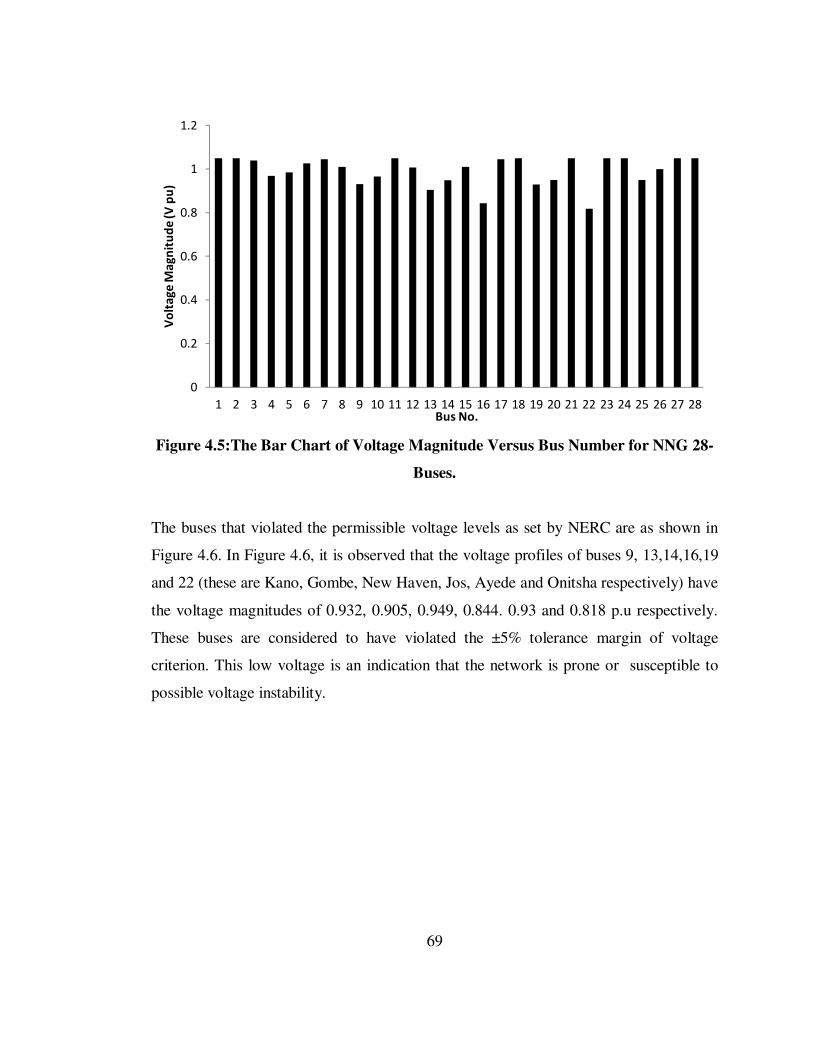
69
Figure 4.5:The Bar Chart of Voltage Magnitude Versus Bus Number for NNG 28-
Buses.
The buses that violated the permissible voltage levels as set by NERC are as shown in
Figure 4.6. In Figure 4.6, it is observed that the voltage profiles of buses 9, 13,14,16,19
and 22 (these are Kano, Gombe, New Haven, Jos, Ayede and Onitsha respectively) have
the voltage magnitudes of 0.932, 0.905, 0.949, 0.844. 0.93 and 0.818 p.u respectively.
These buses are considered to have violated the ±5% tolerance margin of voltage
criterion. This low voltage is an indication that the network is prone or susceptible to
possible voltage instability.
0
0.2
0.4
0.6
0.8
1
1.2
1 2 3 4 5 6 7 8 9 10 11 12 13 14 15 16 17 18 19 20 21 22 23 24 25 26 27 28
Vo
lta
ge
Ma
gn
itu
de
(V
pu
)
Bus No.
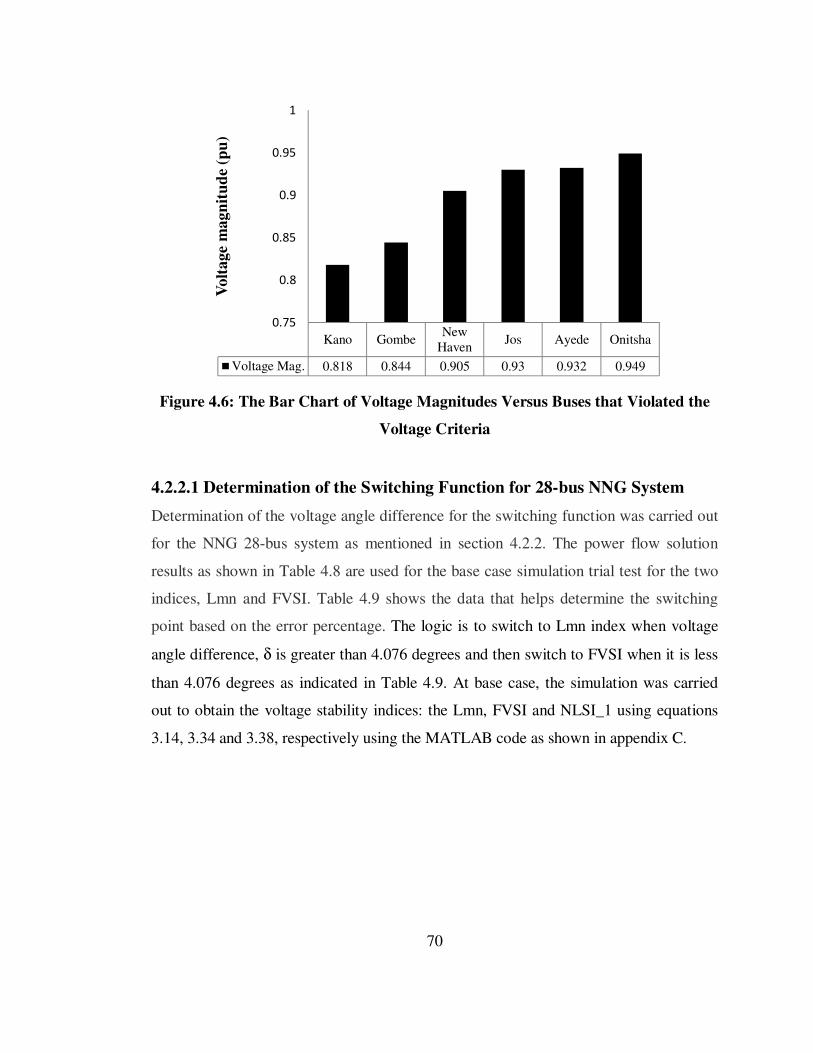
70
Figure 4.6: The Bar Chart of Voltage Magnitudes Versus Buses that Violated the
Voltage Criteria
4.2.2.1 Determination of the Switching Function for 28-bus NNG System
Determination of the voltage angle difference for the switching function was carried out
for the NNG 28-bus system as mentioned in section 4.2.2. The power flow solution
results as shown in Table 4.8 are used for the base case simulation trial test for the two
indices, Lmn and FVSI. Table 4.9 shows the data that helps determine the switching
point based on the error percentage. The logic is to switch to Lmn index when voltage
angle difference, δ is greater than 4.076 degrees and then switch to FVSI when it is less
than 4.076 degrees as indicated in Table 4.9. At base case, the simulation was carried
out to obtain the voltage stability indices: the Lmn, FVSI and NLSI_1 using equations
3.14, 3.34 and 3.38, respectively using the MATLAB code as shown in appendix C.
Kano GombeNew
HavenJos Ayede Onitsha
Voltage Mag. 0.818 0.844 0.905 0.93 0.932 0.949
0.75
0.8
0.85
0.9
0.95
1
Volt
age
magn
itu
de
(pu
)
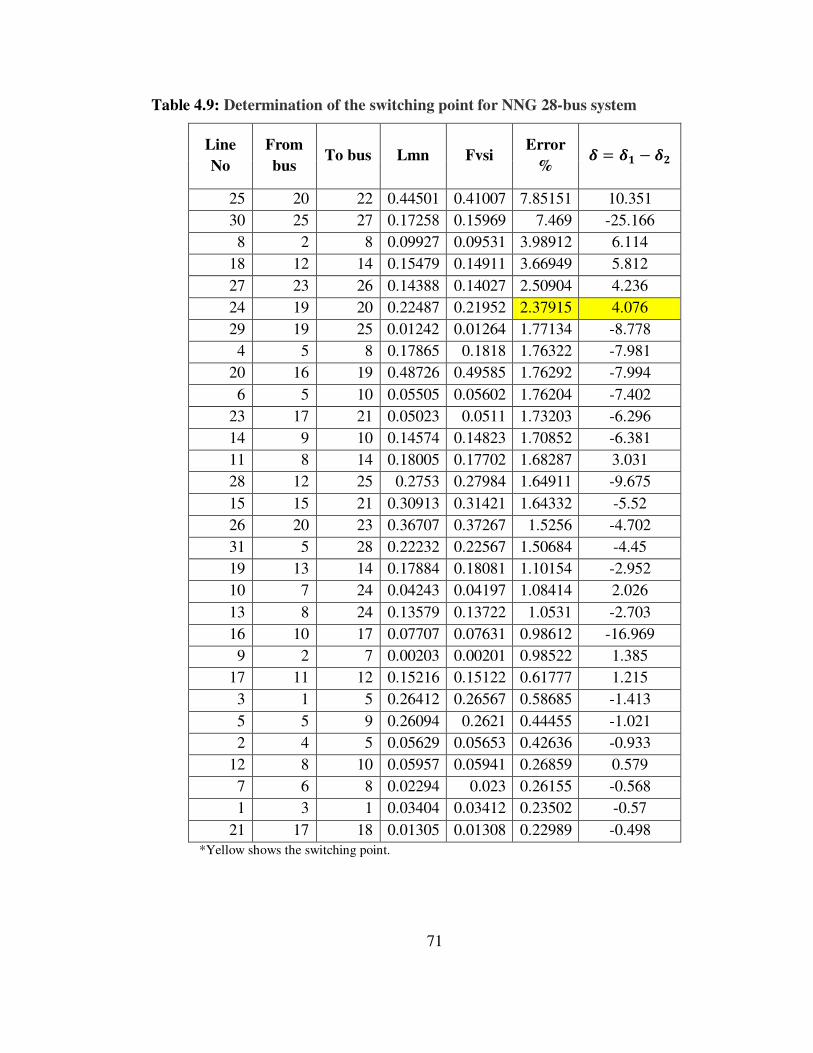
71
Table 4.9: Determination of the switching point for NNG 28-bus system
Line
No
From
bus To bus Lmn Fvsi
Error
% � � �� − ��
25 20 22 0.44501 0.41007 7.85151 10.351
30 25 27 0.17258 0.15969 7.469 -25.166
8 2 8 0.09927 0.09531 3.98912 6.114
18 12 14 0.15479 0.14911 3.66949 5.812
27 23 26 0.14388 0.14027 2.50904 4.236
24 19 20 0.22487 0.21952 2.37915 4.076
29 19 25 0.01242 0.01264 1.77134 -8.778
4 5 8 0.17865 0.1818 1.76322 -7.981
20 16 19 0.48726 0.49585 1.76292 -7.994
6 5 10 0.05505 0.05602 1.76204 -7.402
23 17 21 0.05023 0.0511 1.73203 -6.296
14 9 10 0.14574 0.14823 1.70852 -6.381
11 8 14 0.18005 0.17702 1.68287 3.031
28 12 25 0.2753 0.27984 1.64911 -9.675
15 15 21 0.30913 0.31421 1.64332 -5.52
26 20 23 0.36707 0.37267 1.5256 -4.702
31 5 28 0.22232 0.22567 1.50684 -4.45
19 13 14 0.17884 0.18081 1.10154 -2.952
10 7 24 0.04243 0.04197 1.08414 2.026
13 8 24 0.13579 0.13722 1.0531 -2.703
16 10 17 0.07707 0.07631 0.98612 -16.969
9 2 7 0.00203 0.00201 0.98522 1.385
17 11 12 0.15216 0.15122 0.61777 1.215
3 1 5 0.26412 0.26567 0.58685 -1.413
5 5 9 0.26094 0.2621 0.44455 -1.021
2 4 5 0.05629 0.05653 0.42636 -0.933
12 8 10 0.05957 0.05941 0.26859 0.579
7 6 8 0.02294 0.023 0.26155 -0.568
1 3 1 0.03404 0.03412 0.23502 -0.57
21 17 18 0.01305 0.01308 0.22989 -0.498
*Yellow shows the switching point.
72
4.2.2.2 Simulation Result for the Base Case
Table 4.10 shows the base case values of the line stability indices and Figure 4.7 shows
the graph of Lmn, FVSI and NLSI_1 against line Number of the 31 interconnected lines
of the NNG 330-kV, 28-bus network.
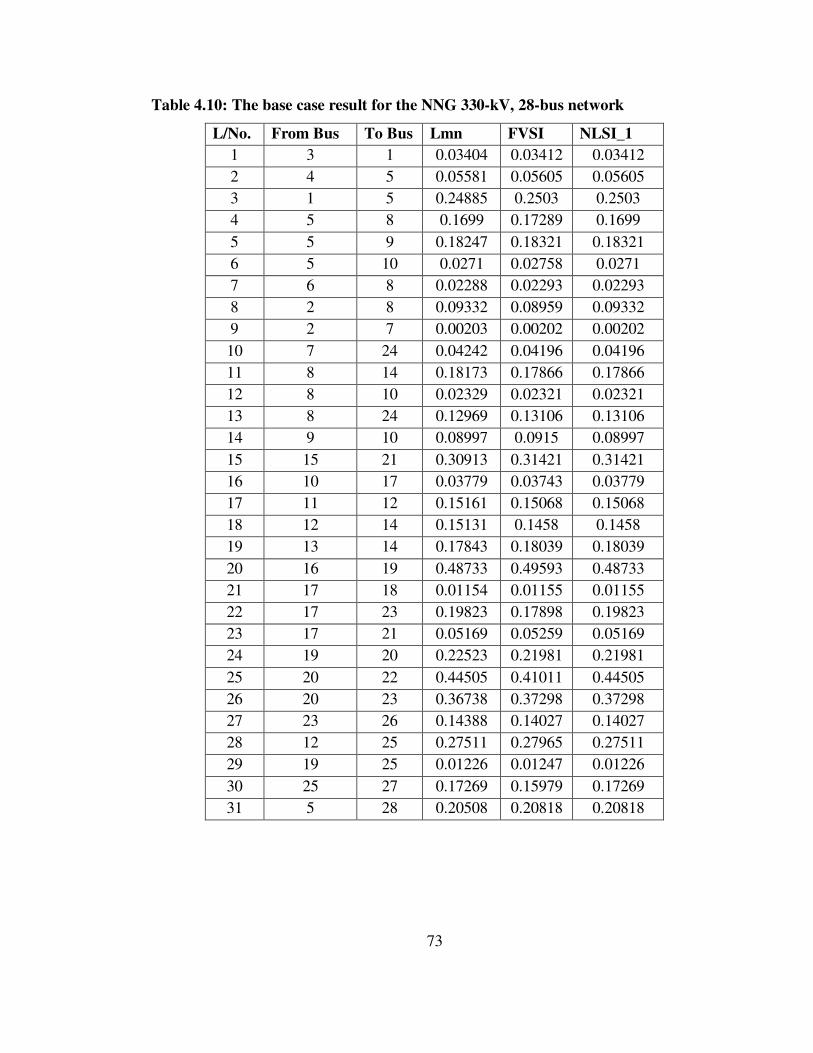
73
Table 4.10: The base case result for the NNG 330-kV, 28-bus network
L/No. From Bus To Bus Lmn FVSI NLSI_1
1 3 1 0.03404 0.03412 0.03412
2 4 5 0.05581 0.05605 0.05605
3 1 5 0.24885 0.2503 0.2503
4 5 8 0.1699 0.17289 0.1699
5 5 9 0.18247 0.18321 0.18321
6 5 10 0.0271 0.02758 0.0271
7 6 8 0.02288 0.02293 0.02293
8 2 8 0.09332 0.08959 0.09332
9 2 7 0.00203 0.00202 0.00202
10 7 24 0.04242 0.04196 0.04196
11 8 14 0.18173 0.17866 0.17866
12 8 10 0.02329 0.02321 0.02321
13 8 24 0.12969 0.13106 0.13106
14 9 10 0.08997 0.0915 0.08997
15 15 21 0.30913 0.31421 0.31421
16 10 17 0.03779 0.03743 0.03779
17 11 12 0.15161 0.15068 0.15068
18 12 14 0.15131 0.1458 0.1458
19 13 14 0.17843 0.18039 0.18039
20 16 19 0.48733 0.49593 0.48733
21 17 18 0.01154 0.01155 0.01155
22 17 23 0.19823 0.17898 0.19823
23 17 21 0.05169 0.05259 0.05169
24 19 20 0.22523 0.21981 0.21981
25 20 22 0.44505 0.41011 0.44505
26 20 23 0.36738 0.37298 0.37298
27 23 26 0.14388 0.14027 0.14027
28 12 25 0.27511 0.27965 0.27511
29 19 25 0.01226 0.01247 0.01226
30 25 27 0.17269 0.15979 0.17269
31 5 28 0.20508 0.20818 0.20818
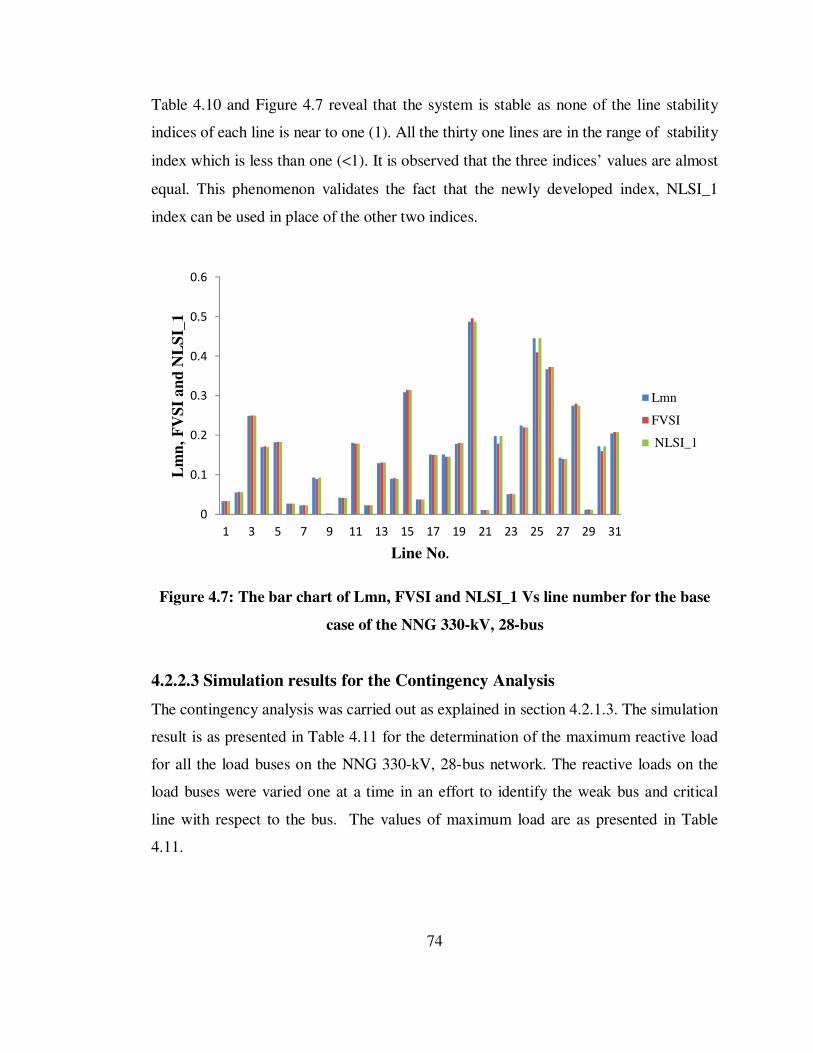
74
Table 4.10 and Figure 4.7 reveal that the system is stable as none of the line stability
indices of each line is near to one (1). All the thirty one lines are in the range of stability
index which is less than one (<1). It is observed that the three indices’ values are almost
equal. This phenomenon validates the fact that the newly developed index, NLSI_1
index can be used in place of the other two indices.
Figure 4.7: The bar chart of Lmn, FVSI and NLSI_1 Vs line number for the base
case of the NNG 330-kV, 28-bus
4.2.2.3 Simulation results for the Contingency Analysis
The contingency analysis was carried out as explained in section 4.2.1.3. The simulation
result is as presented in Table 4.11 for the determination of the maximum reactive load
for all the load buses on the NNG 330-kV, 28-bus network. The reactive loads on the
load buses were varied one at a time in an effort to identify the weak bus and critical
line with respect to the bus. The values of maximum load are as presented in Table
4.11.
0
0.1
0.2
0.3
0.4
0.5
0.6
1 3 5 7 9 11 13 15 17 19 21 23 25 27 29 31
Lm
n,
FV
SI
an
d N
LS
I_1
Line No.
Lmn
FVSI
NLSI_1
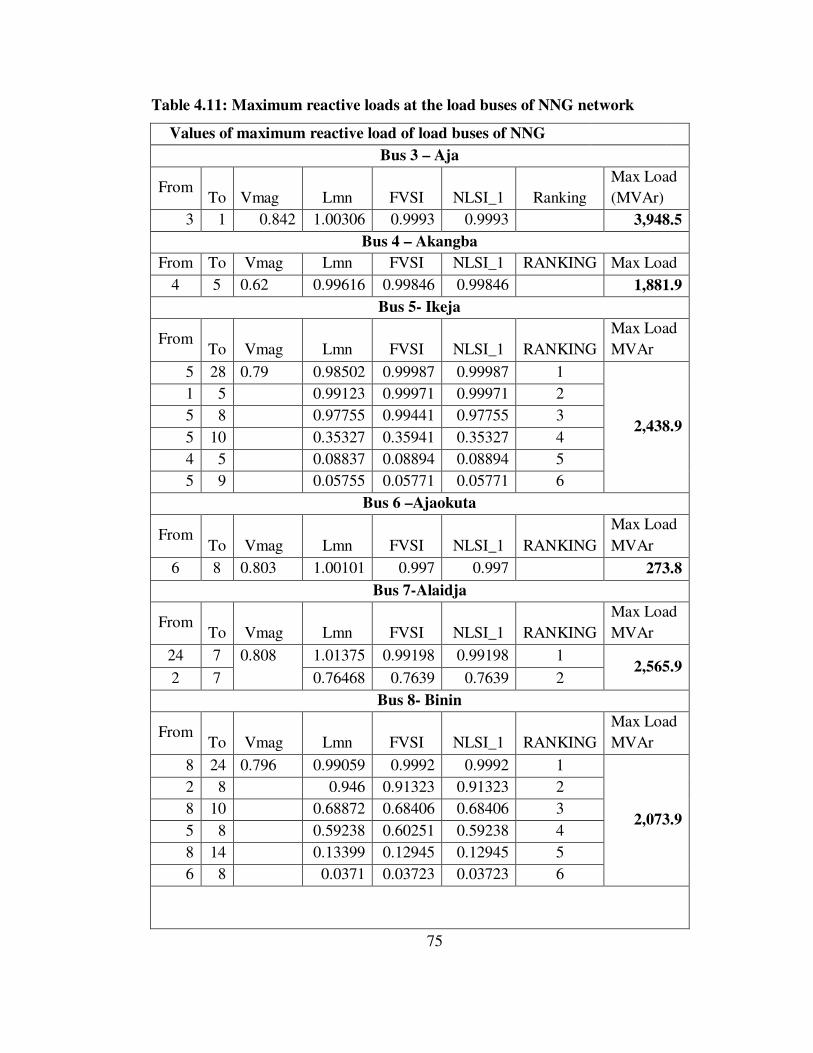
75
Table 4.11: Maximum reactive loads at the load buses of NNG network
Values of maximum reactive load of load buses of NNG
Bus 3 – Aja
From To Vmag Lmn FVSI NLSI_1 Ranking
Max Load
(MVAr)
3 1 0.842 1.00306 0.9993 0.9993 3,948.5
Bus 4 – Akangba
From To Vmag Lmn FVSI NLSI_1 RANKING Max Load
4 5 0.62 0.99616 0.99846 0.99846 1,881.9
Bus 5- Ikeja
From To Vmag Lmn FVSI NLSI_1 RANKING
Max Load
MVAr
5 28 0.79 0.98502 0.99987 0.99987 1
2,438.9
1 5 0.99123 0.99971 0.99971 2
5 8 0.97755 0.99441 0.97755 3
5 10 0.35327 0.35941 0.35327 4
4 5 0.08837 0.08894 0.08894 5
5 9 0.05755 0.05771 0.05771 6
Bus 6 –Ajaokuta
From To Vmag Lmn FVSI NLSI_1 RANKING
Max Load
MVAr
6 8 0.803 1.00101 0.997 0.997 273.8
Bus 7-Alaidja
From To Vmag Lmn FVSI NLSI_1 RANKING
Max Load
MVAr
24 7 0.808 1.01375 0.99198 0.99198 1 2,565.9
2 7 0.76468 0.7639 0.7639 2
Bus 8- Binin
From To Vmag Lmn FVSI NLSI_1 RANKING
Max Load
MVAr
8 24 0.796 0.99059 0.9992 0.9992 1
2,073.9
2 8 0.946 0.91323 0.91323 2
8 10 0.68872 0.68406 0.68406 3
5 8 0.59238 0.60251 0.59238 4
8 14 0.13399 0.12945 0.12945 5
6 8 0.0371 0.03723 0.03723 6
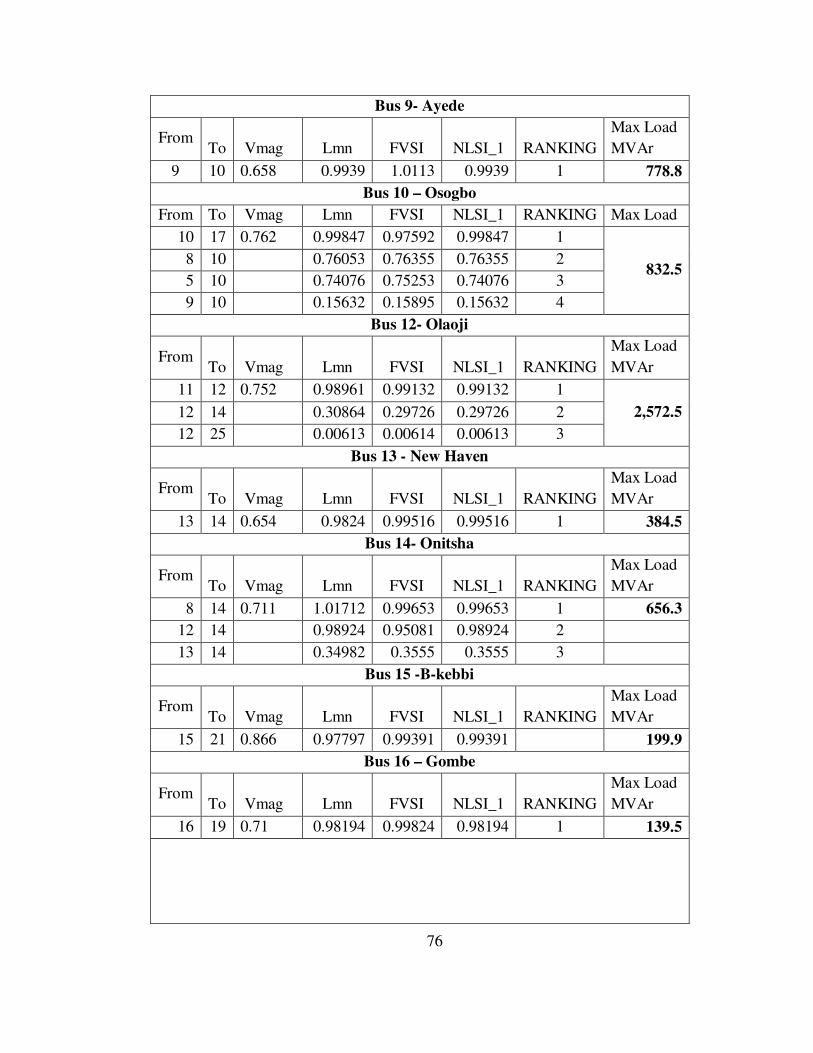
76
Bus 9- Ayede
From To Vmag Lmn FVSI NLSI_1 RANKING
Max Load
MVAr
9 10 0.658 0.9939 1.0113 0.9939 1 778.8
Bus 10 – Osogbo
From To Vmag Lmn FVSI NLSI_1 RANKING Max Load
10 17 0.762 0.99847 0.97592 0.99847 1
832.5 8 10 0.76053 0.76355 0.76355 2
5 10 0.74076 0.75253 0.74076 3
9 10 0.15632 0.15895 0.15632 4
Bus 12- Olaoji
From To Vmag Lmn FVSI NLSI_1 RANKING
Max Load
MVAr
11 12 0.752 0.98961 0.99132 0.99132 1
2,572.5 12 14 0.30864 0.29726 0.29726 2
12 25 0.00613 0.00614 0.00613 3
Bus 13 - New Haven
From To Vmag Lmn FVSI NLSI_1 RANKING
Max Load
MVAr
13 14 0.654 0.9824 0.99516 0.99516 1 384.5
Bus 14- Onitsha
From To Vmag Lmn FVSI NLSI_1 RANKING
Max Load
MVAr
8 14 0.711 1.01712 0.99653 0.99653 1 656.3
12 14 0.98924 0.95081 0.98924 2
13 14 0.34982 0.3555 0.3555 3
Bus 15 -B-kebbi
From To Vmag Lmn FVSI NLSI_1 RANKING
Max Load
MVAr
15 21 0.866 0.97797 0.99391 0.99391 199.9
Bus 16 – Gombe
From To Vmag Lmn FVSI NLSI_1 RANKING
Max Load
MVAr
16 19 0.71 0.98194 0.99824 0.98194 1 139.5
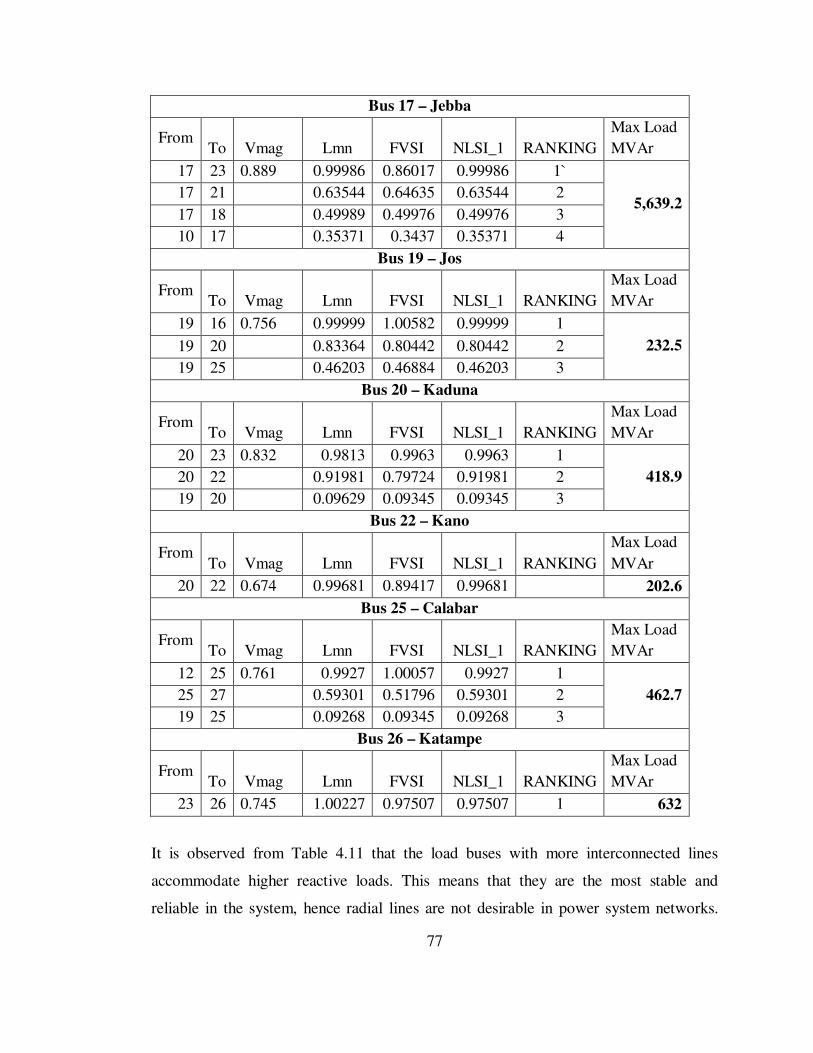
77
Bus 17 – Jebba
From To Vmag Lmn FVSI NLSI_1 RANKING
Max Load
MVAr
17 23 0.889 0.99986 0.86017 0.99986 1`
5,639.2 17 21 0.63544 0.64635 0.63544 2
17 18 0.49989 0.49976 0.49976 3
10 17 0.35371 0.3437 0.35371 4
Bus 19 – Jos
From To Vmag Lmn FVSI NLSI_1 RANKING
Max Load
MVAr
19 16 0.756 0.99999 1.00582 0.99999 1
232.5 19 20 0.83364 0.80442 0.80442 2
19 25 0.46203 0.46884 0.46203 3
Bus 20 – Kaduna
From To Vmag Lmn FVSI NLSI_1 RANKING
Max Load
MVAr
20 23 0.832 0.9813 0.9963 0.9963 1
418.9 20 22 0.91981 0.79724 0.91981 2
19 20 0.09629 0.09345 0.09345 3
Bus 22 – Kano
From To Vmag Lmn FVSI NLSI_1 RANKING
Max Load
MVAr
20 22 0.674 0.99681 0.89417 0.99681 202.6
Bus 25 – Calabar
From To Vmag Lmn FVSI NLSI_1 RANKING
Max Load
MVAr
12 25 0.761 0.9927 1.00057 0.9927 1
462.7 25 27 0.59301 0.51796 0.59301 2
19 25 0.09268 0.09345 0.09268 3
Bus 26 – Katampe
From To Vmag Lmn FVSI NLSI_1 RANKING
Max Load
MVAr
23 26 0.745 1.00227 0.97507 0.97507 1 632
It is observed from Table 4.11 that the load buses with more interconnected lines
accommodate higher reactive loads. This means that they are the most stable and
reliable in the system, hence radial lines are not desirable in power system networks.
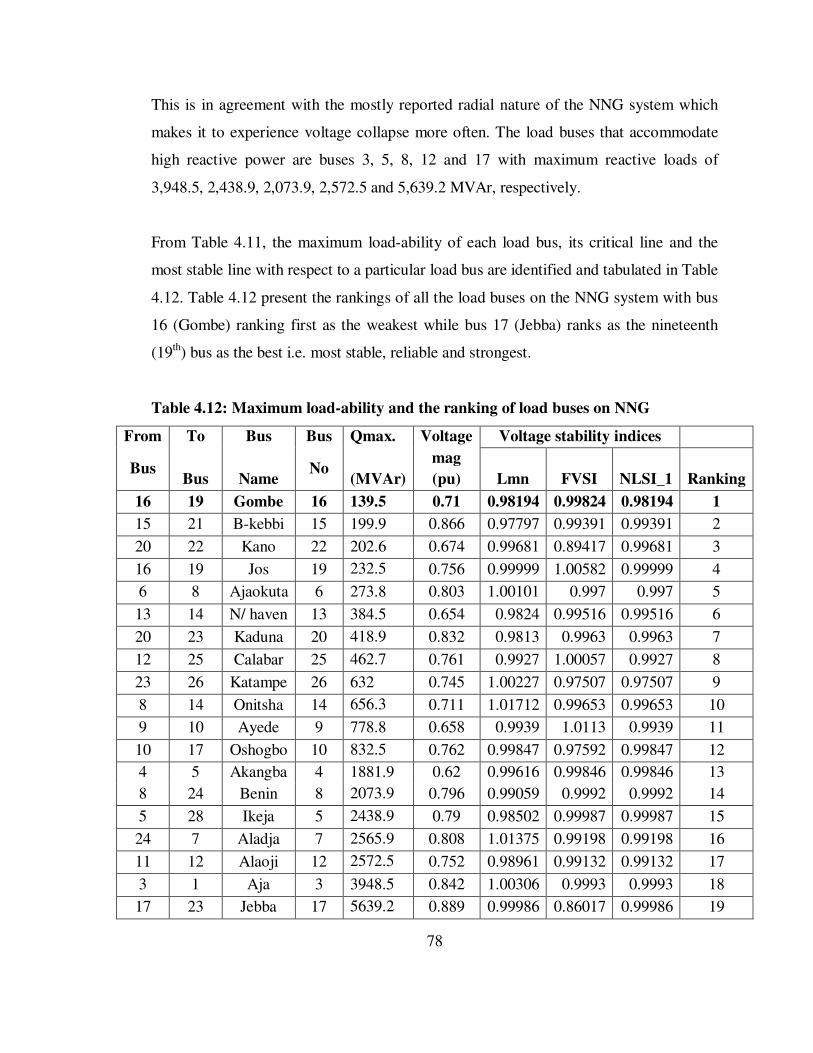
78
This is in agreement with the mostly reported radial nature of the NNG system which
makes it to experience voltage collapse more often. The load buses that accommodate
high reactive power are buses 3, 5, 8, 12 and 17 with maximum reactive loads of
3,948.5, 2,438.9, 2,073.9, 2,572.5 and 5,639.2 MVAr, respectively.
From Table 4.11, the maximum load-ability of each load bus, its critical line and the
most stable line with respect to a particular load bus are identified and tabulated in Table
4.12. Table 4.12 present the rankings of all the load buses on the NNG system with bus
16 (Gombe) ranking first as the weakest while bus 17 (Jebba) ranks as the nineteenth
(19th) bus as the best i.e. most stable, reliable and strongest.
Table 4.12: Maximum load-ability and the ranking of load buses on NNG
From To Bus Bus Qmax. Voltage Voltage stability indices
Bus Bus Name
No (MVAr)
mag
(pu) Lmn FVSI NLSI_1 Ranking
16 19 Gombe 16 139.5 0.71 0.98194 0.99824 0.98194 1
15 21 B-kebbi 15 199.9 0.866 0.97797 0.99391 0.99391 2
20 22 Kano 22 202.6 0.674 0.99681 0.89417 0.99681 3
16 19 Jos 19 232.5 0.756 0.99999 1.00582 0.99999 4
6 8 Ajaokuta 6 273.8 0.803 1.00101 0.997 0.997 5
13 14 N/ haven 13 384.5 0.654 0.9824 0.99516 0.99516 6
20 23 Kaduna 20 418.9 0.832 0.9813 0.9963 0.9963 7
12 25 Calabar 25 462.7 0.761 0.9927 1.00057 0.9927 8
23 26 Katampe 26 632 0.745 1.00227 0.97507 0.97507 9
8 14 Onitsha 14 656.3 0.711 1.01712 0.99653 0.99653 10
9 10 Ayede 9 778.8 0.658 0.9939 1.0113 0.9939 11
10 17 Oshogbo 10 832.5 0.762 0.99847 0.97592 0.99847 12
4 5 Akangba 4 1881.9 0.62 0.99616 0.99846 0.99846 13
8 24 Benin 8 2073.9 0.796 0.99059 0.9992 0.9992 14
5 28 Ikeja 5 2438.9 0.79 0.98502 0.99987 0.99987 15
24 7 Aladja 7 2565.9 0.808 1.01375 0.99198 0.99198 16
11 12 Alaoji 12 2572.5 0.752 0.98961 0.99132 0.99132 17
3 1 Aja 3 3948.5 0.842 1.00306 0.9993 0.9993 18
17 23 Jebba 17 5639.2 0.889 0.99986 0.86017 0.99986 19
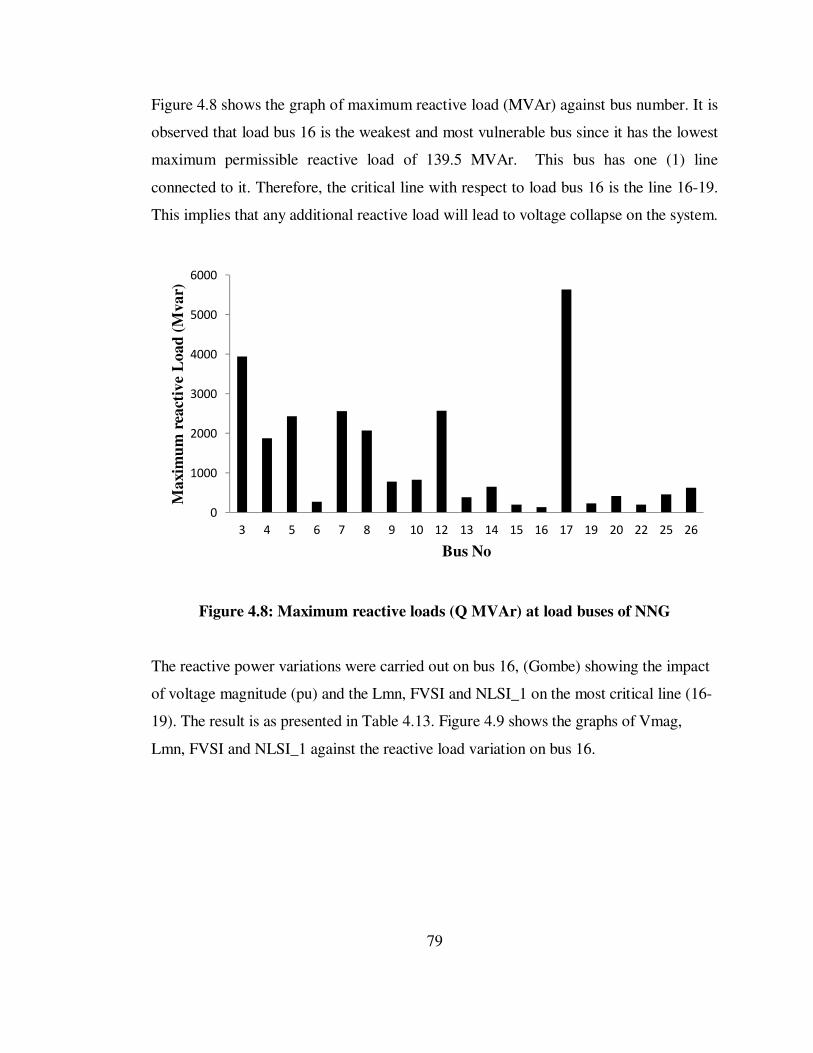
79
Figure 4.8 shows the graph of maximum reactive load (MVAr) against bus number. It is
observed that load bus 16 is the weakest and most vulnerable bus since it has the lowest
maximum permissible reactive load of 139.5 MVAr. This bus has one (1) line
connected to it. Therefore, the critical line with respect to load bus 16 is the line 16-19.
This implies that any additional reactive load will lead to voltage collapse on the system.
Figure 4.8: Maximum reactive loads (Q MVAr) at load buses of NNG
The reactive power variations were carried out on bus 16, (Gombe) showing the impact
of voltage magnitude (pu) and the Lmn, FVSI and NLSI_1 on the most critical line (16-
19). The result is as presented in Table 4.13. Figure 4.9 shows the graphs of Vmag,
Lmn, FVSI and NLSI_1 against the reactive load variation on bus 16.
0
1000
2000
3000
4000
5000
6000
3 4 5 6 7 8 9 10 12 13 14 15 16 17 19 20 22 25 26
Maxim
um
rea
ctiv
e L
oad
(M
var)
Bus No
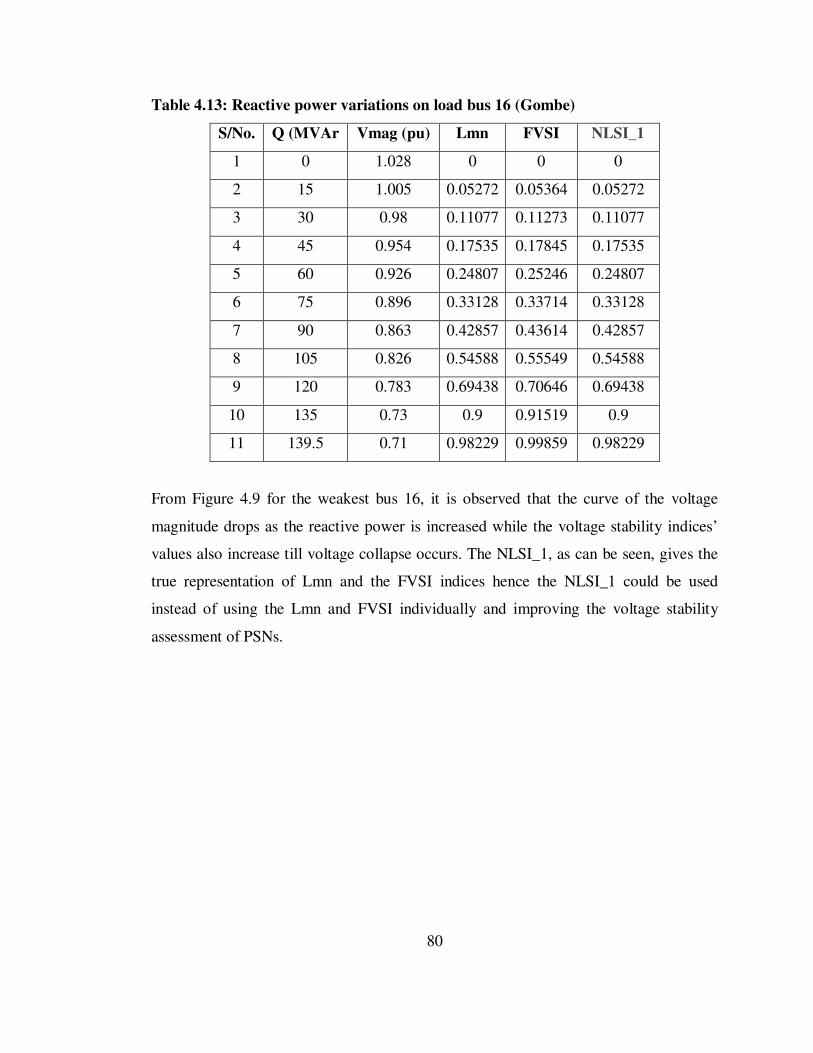
80
Table 4.13: Reactive power variations on load bus 16 (Gombe)
S/No. Q (MVAr Vmag (pu) Lmn FVSI NLSI_1
1 0 1.028 0 0 0
2 15 1.005 0.05272 0.05364 0.05272
3 30 0.98 0.11077 0.11273 0.11077
4 45 0.954 0.17535 0.17845 0.17535
5 60 0.926 0.24807 0.25246 0.24807
6 75 0.896 0.33128 0.33714 0.33128
7 90 0.863 0.42857 0.43614 0.42857
8 105 0.826 0.54588 0.55549 0.54588
9 120 0.783 0.69438 0.70646 0.69438
10 135 0.73 0.9 0.91519 0.9
11 139.5 0.71 0.98229 0.99859 0.98229
From Figure 4.9 for the weakest bus 16, it is observed that the curve of the voltage
magnitude drops as the reactive power is increased while the voltage stability indices’
values also increase till voltage collapse occurs. The NLSI_1, as can be seen, gives the
true representation of Lmn and the FVSI indices hence the NLSI_1 could be used
instead of using the Lmn and FVSI individually and improving the voltage stability
assessment of PSNs.
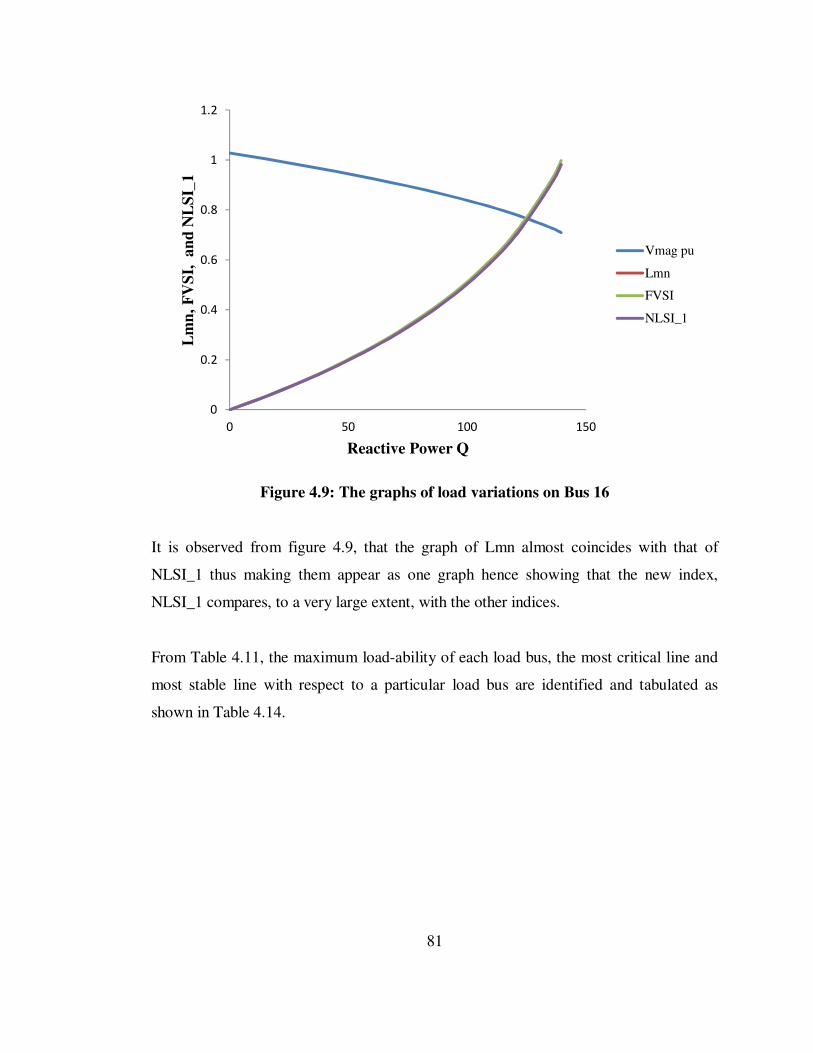
81
Figure 4.9: The graphs of load variations on Bus 16
It is observed from figure 4.9, that the graph of Lmn almost coincides with that of
NLSI_1 thus making them appear as one graph hence showing that the new index,
NLSI_1 compares, to a very large extent, with the other indices.
From Table 4.11, the maximum load-ability of each load bus, the most critical line and
most stable line with respect to a particular load bus are identified and tabulated as
shown in Table 4.14.
0
0.2
0.4
0.6
0.8
1
1.2
0 50 100 150
Lm
n,
FV
SI,
an
d N
LS
I_1
Reactive Power Q
Vmag pu
Lmn
FVSI
NLSI_1
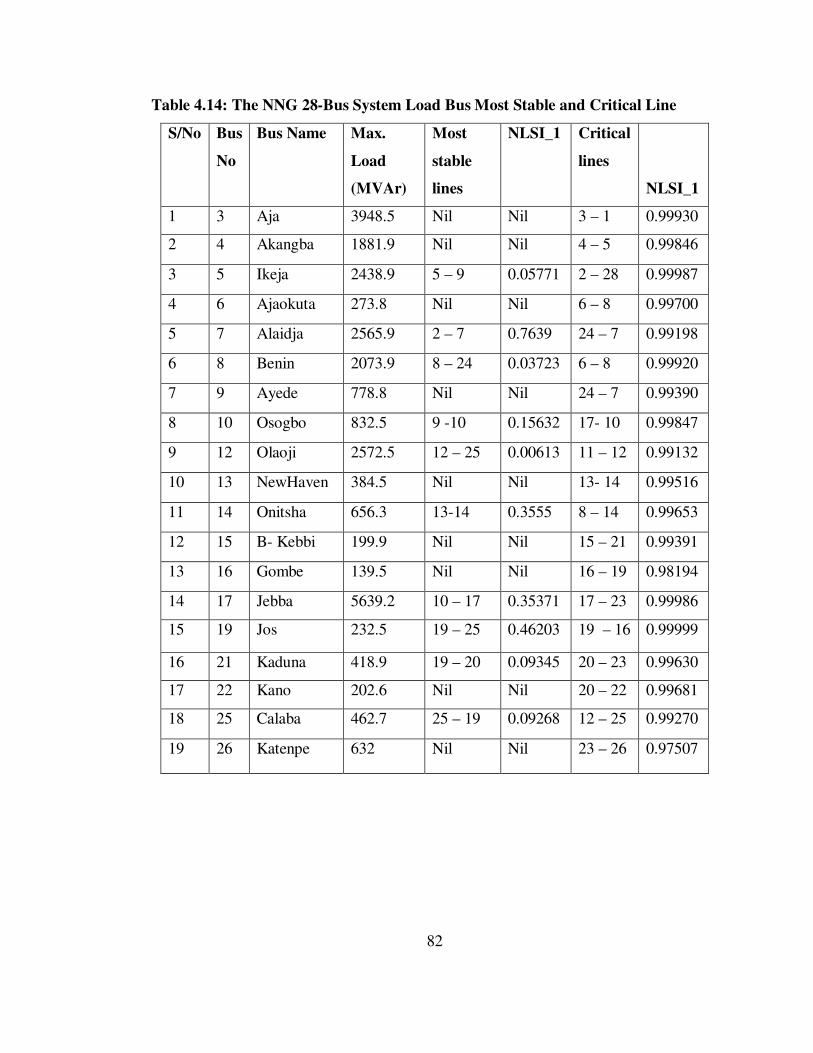
82
Table 4.14: The NNG 28-Bus System Load Bus Most Stable and Critical Line
S/No Bus
No
Bus Name Max.
Load
(MVAr)
Most
stable
lines
NLSI_1 Critical
lines
NLSI_1
1 3 Aja 3948.5 Nil Nil 3 – 1 0.99930
2 4 Akangba 1881.9 Nil Nil 4 – 5 0.99846
3 5 Ikeja 2438.9 5 – 9 0.05771 2 – 28 0.99987
4 6 Ajaokuta 273.8 Nil Nil 6 – 8 0.99700
5 7 Alaidja 2565.9 2 – 7 0.7639 24 – 7 0.99198
6 8 Benin 2073.9 8 – 24 0.03723 6 – 8 0.99920
7 9 Ayede 778.8 Nil Nil 24 – 7 0.99390
8 10 Osogbo 832.5 9 -10 0.15632 17- 10 0.99847
9 12 Olaoji 2572.5 12 – 25 0.00613 11 – 12 0.99132
10 13 NewHaven 384.5 Nil Nil 13- 14 0.99516
11 14 Onitsha 656.3 13-14 0.3555 8 – 14 0.99653
12 15 B- Kebbi 199.9 Nil Nil 15 – 21 0.99391
13 16 Gombe 139.5 Nil Nil 16 – 19 0.98194
14 17 Jebba 5639.2 10 – 17 0.35371 17 – 23 0.99986
15 19 Jos 232.5 19 – 25 0.46203 19 – 16 0.99999
16 21 Kaduna 418.9 19 – 20 0.09345 20 – 23 0.99630
17 22 Kano 202.6 Nil Nil 20 – 22 0.99681
18 25 Calaba 462.7 25 – 19 0.09268 12 – 25 0.99270
19 26 Katenpe 632 Nil Nil 23 – 26 0.97507
83
4.3 Discussion of the Results
The newly developed voltage stability index, NLSI_1, has a switching logic that
depends on the voltage angle difference since FVSI fails when the angle difference is
large. Therefore, it has the advantage of fastness and its accuracy when voltage angle
difference is small. Large voltage angle different is a precursor to voltage collapse
(Dobson et al.,2010). The Lmn has the advantage of being accurate since the phasor part
is included in its expression, so the newly developed index uses these advantages for
improved voltage stability indice. The new line stability index-1 (NLSI_1) developed in
the research was simulated and compared with the Lmn and FVSI indices on the IEEE
14-bus test system for its validation and subsequently, on the NNG 28-bus practical
system to enable these indices to be evaluated for the first time. The results are hereby
discussed.
4.3.1 Discussion of the simulation results for the IEEE 14-bus test system
The simulation results for the IEEE 14-bus test system, for the base case, show that the
system is stable because the three indices’ values are approximately equal and they are
less than one (<1). For the contingency case, bus 14 was revealed to be the weakest bus
as the indices’ values are very close to one (∼1). This implies proximity to voltage
collapse and it has the smallest maximum permissible reactive loading of 74.6MVAr.
This means that bus 14 is the optimal location for the placement of a possible
compensating device for improving the voltage profile at the bus as a measure against
voltage collapse (Reis et al., 2009; Telang and Khampariya, 2015; Tilwani and Choube,
2015). A comparative assessment of some voltage collapse indices (PV curve, QV
curve, modal analysis, L-Index) was carried out on the IEEE 14-bus testing system.
They gave virtually the same results as the newly developed NLSI_1 of this thesis. The
simulations indicate that the bus 14 of IEEE 14-bus system is the weakest in the system
as NLSI_1 also revealed. The voltage at which the bus is on maximum permissible load
is referred to as the critical voltage for bus 14 is 0.674 p.u.
84
Subramani et al., (2012) using the line stability index, Lmn, also gave bus 14 as the
weakest bus with permissible load of 73MVar and Line 13-14 as the critical line while
the newly developed index of this thesis i.e. NLSI_1 has 74.6 MVAr as its maximum
permissible reactive load and the Line 13 - 14 as the critical line of the system. As can
be seen, the results are relatively comparable.
Sinha and Chauhan, (2014). Uses the FVSI, and have bus 14 as its weakest bus with
maximum permissible load of 74 MAVr as against 74.6 MAVr for the NLSI_1 which is
also very close. The critical line is also line 13-14. These results show that the new line
index developed is valid and accurate since the results compares favourably well with
those obtained for the IEEE 14-bus test system in the technical literatures.
4.3.2 Discussion of the Simulation Results for the NNG 28-Bus test System
The new line stability index of this thesis was also applied to the current 28-bus, 330-kV
Nigerian National Grid. Bus 16 (Gombe) was found to be the weakest load bus in the
system with the maximum permissible reactive power load of 139.5 MVAr and the
critical voltage is 0.71 p.u. This means that any increase in the reactive power load
beyond the quoted figure will probably lead to voltage collapse. Bus 16 is then the
optimal location for a possible compensating device. The weakest line here is the line
16-19. This newly developed line stability index-1 (NLSI_1) in this work is accurate
and fairly comparable with the other indices. It can be used as a single voltage stability
index instead of using the Lmn and FVSI separately because it combines the accuracy of
Lmn and the fastness of FVSI.
Conventionally, voltage magnitude is used as an indication of a possible voltage
instability but that is not generally true as an indication of proximity to voltage collapse
and location for optimal placement of compensating device as revealed by the voltage
profile of the buses that violated the 0.95 p.u criterion (Abdulkareem et al., 2016). Foe
example, Kano has the least voltage magnitude with 0.818 p.u as against Gombe with
voltage magnitude of 0.844 p.u. If the criterion is based on voltage magnitude, Kano
85
will be erroneously picked as the weakest bus but the use of the of the index criterion,
Gombe with a higher voltage magnitude is the actual weakest bus because of its superior
index value.
The most stable lines are lines with the least voltage stability indices while the critical
lines are the lines with the highest values of the voltage stability indices with respect to
individual load buses. It can be seen that the line connected to individual load bus with
the lowest stability index value is the most stable line while the line with the highest
stability index value is the critical lines with respect to that particular load bus as shown
in Tables 4.7. and 4.14.
4.4 Summary
Simulations were carried out based on two scenarios. The two scenarios are the base
case and the contingency in this chapter. The results and discussions were presented. It
can be said that the NLSI_1 can be used in its present form instead of using the other
two indices for the prediction of voltage collapse and identification of both the weakest
bus and critical lines in a system for the reasons advanced earlier on.
86
CHAPTER FIVE
CONCLUSIONS AND RECOMMENDATIONS
5.1 Summary
In this research work, a new line stability index-1 (NLSI_1) has been developed for the
prediction of voltage collapse in power system networks. It is a powerful tool for
identifying the weakest bus in the network, the critical and most vulnerable line with
respect to a particular load bus. This will eventually help to locate the area for load
shedding and also for determining the maximum load-ability of the load buses. This will
consequently guide the operator to take quick action to avert the voltage collapse when a
particular bus is being overloaded and where to place compensation devices will be so
revealed.
5.2 Achievements and Contribution to Knowledge
The main contributions of this study are summarized as follows:
1) A new line voltage stability index suitable for the prediction of voltage collapse
of power system networks was developed in this research and this contribute to
the present body of knowledge in voltage stability studies.
2) An associated software programme (based on this new index) for simulation
and implementation of voltage stability indices was successfully developed and
implemented in the MATLAB environment. This will provide a toolkit for
researchers in the study domain.
3) The results of this research engender accurate identification of critical lines and
weak areas, vulnerable or weak load bus on the 28-bus, 330kV, NNG for
optimum placement of compensating devices and load shedding relays on the
network to avert voltage collapse.
87
4) The development of the new stability index in its present form can be applied to
any power system for stability analysis and voltage collapse prediction in
Nigeria and other parts of the world.
5.3 Recommendations for Future Work
a) Incorporating modeling and analysis of compensating devices such as
generators and compensating devices using the developed novel line
stability index to improve voltage stability of power system networks can
be a good extension of the work reported in this thesis.
b) For ease of gathering data for future work of this nature, it is
recommended that operators of the transmission networks in Nigeria,
TCN, should install phasor measurement units (PMUs) on the national
grid in order to facilitate real time analysis and accurate data gathering.
88
REFERENCES
Abdulkareem, A., Awosope, C. O. A., Samuel, I. A., & Agbetuyi, A. F. (2016). Contingency Analysis for Assessing Line Losses in Nigeria 330-kV Power lines. International Journal of Engineering and Advanced Technology, 5(3), 66-78.
Adebayo, A. G., Jimoh, A., Yusuff, A., & Adeyemi, (2014). A. Effects Of Phase
Shifting Transformers on Weak and Ill-Conditioned Network: Nigerian 330kV Grid System. power, 13, International Conference of power and Energy Systems
(Africa PSE 2014). Gaboroune, Botswana. p. 14. Afolabi, O. A., Ali, W. H., Cofie, P., Fuller, J., Obiomon, P., & Kolawole, E. S. (2015).
Analysis of the Load Flow Problem in Power System Planning Studies. Energy
and Power Engineering, 7(10), 509.-523. Ajjarapu, V., & Meliopoulos, A. S. (2008). Preventing voltage collapse with protection
systems that incorporate optimal reactive power control. PSERC Publication, 08-20.
Ali, N. A. (2005). An Overview of system collapses on the Nigerian Grid Network.
In Proceedings of the International Conference on Power Systems Operations
and Plaing-VI (ICPSOP) (pp. 67-70). Amoda, O. (2007). Deregulation in Nigeria: History Overview, Motivation, Status and
Recommendation. The Nigerian village Square. Andersson, G., Donalek, P., Farmer, R., Hatziargyriou, N., Kamwa, I., Kundur, P., ... &
Schulz, R. (2005). Causes of the 2003 major grid blackouts in North America and Europe, and recommended means to improve system dynamic performance. IEEE transactions on Power Systems, 20(4), 1922-1928.
Anyanwu, C. A. (2005). State of Power System Operation and Planning the Nigerian
Power System. In Proceedings of the International Conference on Power
Systems Operations and Planning-VI (ICPSOP) (pp. 103-108). Arya, L. D., & Shrivastava, M. (2006). Voltage stability evaluation using line voltage
stability index. IE (I) Journal-El, 87. Balamourougan, V., Sidhu, T. S. and Sachdev, M. S. (2004). Technique for online
prediction of voltage collapse. IEE Proceedings-Generation, Transmission and
Distribution, 151(4), 453-460.
89
Bhaladhare, S., Telang, A. and Bedekar, P. (2013). PV, QV Curve–A Novel Approach for Voltage Stability Analysis. International Journal of Computer
Applications®(IJCA). Telang B. and Khampariya P. (2015). Voltage Stability Evaluation Using Modal
Analysis. International Journal of Scientific Research Engineering &
Technology (IJSRET), 4(4), 408-411. Channelstv. (2015). Channels. Retrieved June 08, 2016, from
http://www.channelstv.com/: http://www.channelstv.com/2015/09/13/nigeria-loses-100-billion-to-daily-blackout/
Chawla, P., & Singh B., (2013) Voltage Stability Assessment and Enhancement Using
STATCOM-A Case Study. World Academy of Science, Engineering and Technology. International Journal of Electrical, Computer, Energetic, Electronic and Communication Engineering Vol:7, No:12, pp1269-1274.
Chayapathi, V., Sharath, B., & Anitha, G. S.(2013) Voltage Collapse Mitigation By
Reactive Power Compensation At The Load Side. International Journal of Research in Engineering and Technology. 2(9).
Dharamjit, & Tanti D. K. (2012). Load Flow Analysis on IEEE 30 bus
System. International Journal of Scientific and Research Publications, 2(11). pp 1-6.
Dobson, I., Parashar, M., & Carter, C. (2010). Combining phasor measurements to
monitor cutset angles. In System Sciences (HICSS), 2010 43rd Hawaii
International Conference on (pp. 1-9). IEEE. Donna R. (2012). Algebra lesson page. Retrieved Febrary 12, 2016, from Error in
Measurement: http://www.regentsprep.org/regents/math/algebra/am3/LError.htm Enemuoh, F. O., Onuegbu, J. C., & Anazia, E. A. (2013). Modal based analysis and
evaluation of voltage stability of bulk power system. International Journal of
Engineering Research and Development, 6(12), 71-79. Fink, L. & Carlsen, K. (1978). Operating under stress and strain. IEEE
Spectrum;(United States), 15(3). Gao, B., Morison, G. K. & Kundur, P. (1992). Voltage stability evaluation using modal
analysis. IEEE Transactions on Power Systems, 7(4), 1529-1542.
90
Goh, H. H., Chua, Q. S., Lee, S. W., Kok, B. C., Goh, K. C. & Teo, K. T. K. (2014). Line voltage stability indices based on precautionary measure approximation in smart grid. Proceedings of the 11th International Conference on Innovation &
Management (pp. 1507-1518). Finland, the University of Vaasa. Goh, H. H., Chua, Q. S., Lee, S. W., Kok, B. C., Goh, K. C. & Teo, K. T. K. (2015).
Comparative study of line voltage stability indices for voltage collapse forecasting in power transmission system. Rio de Janeiro Brazil, 13(2), 270-275.
Gunadin, I. C., Soeprijanto A. & Penangsang O. (2012). Steady State Stability
Assessment Using Extreme Learning Machine Based on Modal Analysis. (Vol. 7). International Review of Electrical Engineering (I.R.E.E.), pp 1-6 http://repository.unhas.ac.id/bitstream/handle/123456789/7095/Indar_IREE%20Journal_ID_8173.pdf?sequence=1
Haruna, M. (2015). An Overview on Voltage Stability Indices as Indicators of Voltage
Stability for Networks with Distributed Generations Penetration. International
Journal of Science, Technology and Society. (3)4, pp. 214-219. Hasani, M. and Parniani, M. (2005). Method of combined static and dynamic analysis of
voltage collapse in voltage stability assessment. In 2005 IEEE/PES Transmission
& Distribution Conference & Exposition: Asia and Pacific (pp. 1-6). IEEE. Kessel, P., & Glavitsch, H. (1986). Estimating the voltage stability of a power
system. IEEE Transactions on Power Delivery, 1(3), 346-354. Kodsi, S. M. and Canizares, C. A. (2003). Modeling and simulation of IEEE 14 bus
system with facts controllers. University of Waterloo, Canada, Tech. Rep. Kumarswamy, I., and Ramanareddy, P. (2011). Analysis of Voltage Stability Using L-
Index Method. international Journal of Electrical Engineering, 4(4), 483-498. Kundur, P. (1994). Power System Stability and Control, McGrew-Hill. Kundur, P., Paserba, J., Ajjarapu, V., Andersson, G., Bose, A., Canizares, C., ... and
Van Cutsem, T. (2004). Definition and classification of power system stability IEEE/CIGRE joint task force on stability terms and definitions. IEEE
transactions on Power Systems, 19(3), 1387-1401. Lamine, M. (2011). Taxonomy of the Characteristics of Power System Operating States
Northern Virginia Center, Virginia Tech, Bradley Department of Electrical and Computer Engineering. Virginia Tech: Retrieved May 12, 2016 www.nvc.vt.edu/lmili/.../RESIN_Workshop_2011-White_Paper-Mili.pdf.
91
Liacco, T. D. (1967). The adaptive reliability control system. IEEE Transactions on
Power Apparatus and Systems, 5(PAS-86), 517-531. Mathew, M., Babu, D. S., Venkataramu, P. S., & Nagaraj, M. S. (2015). Effect of TCSC
on Line Voltage Stability Indices under Single Line Outage Condition. International Journal Of Innovative Research in Electrical, Electronics, Instrumentation and Control Engineering, 3(8), 101-105.
Moghavvemi, M., & Omar, F. M. (1998). Technique for contingency monitoring and
voltage collapse prediction. IEE Proceedings-Generation, Transmission and
Distribution, 145(6), 634-640. Mohamed, A., Jasmon, G. B., & Yusoff, S. (1989). A static voltage collapse indicator
using line stability factors. Journal of industrial technology, 7(1), 73-85. Morison, G. K., Gao, B., & Kundur, P. (1993). Voltage stability analysis using static
and dynamic approaches. IEEE Transactions on Power Systems, 8(3), 1159-1171.
Musirin, I., & Rahman, T. A. (2002). Novel fast voltage stability index (FVSI) for
voltage stability analysis in power transmission system. In Research and
Development, 2002. SCOReD 2002. Student Conference on (pp. 265-268). IEEE. Nayak, N., & Wadhwani, A. K. (2014). Performance of Newton-Raphson Techniques in
Load Flow Analysis using MATLAB. International Journal of Engineering and
Technical Research ISSN: 2321-0869, pp, 177-180. Ndiagwalukwe, J. U. (2012, May, 2012 11th -12th). Strategies For Mitigating
Incidence Of System Collapse. Retrieved August 14, 2015, from http://slideplayer.com/slide/3179976/
Nigeria Electricity Regulatory Commission, (2005). The Grid Code for the Nigeria
Electricity Transmission System. Electrical power sector reform Act, version 01.2005.
Nizam, M., Mohamed, A., & Hussain, A. (2007). Voltage collapse prediction
incorporating both static and dynamics analyses. European Journal of Scientific
Research, 16(1), 10-25. Ogbonna, A. (2015). Nigeria loses $100b to daily power outage. vanguard, p. 1. Onahaebe, O., & Apeh, S. (2007). Voltage Instability in Electrical Network: A case
study of Nigerian 330kV Transmission Grid. Research Journal of Applied
Sciences, 2(8), 865-874.
92
Oleka, E. U., Ndubisi, S. N., & Ijemaru, G. K. (2016). Electric Power Transmission Enhancement: A Case of Nigerian Electric Power Grid. American Journal of
Electrical and Electronic Engineering, 4(1), 33-39. Padiyar, K. (1996). Power System Dynamics - Stability and Control. Interline
Publishing Pvt. Ltd.
Power Holding Company of Nigeria (2010) Generation and Transmission Grid Operations 2009. National Control Centre, Osogbo Annual Technical Report.
Pourbeik, P., Kundur, P. S., & Taylor, C. W. (2006). The anatomy of a power grid
blackout. IEEE Power and Energy Magazine, 4(5), 22-29. Quintela, A. S., & Castro, C. A. (2002). Improved branch-based voltage stability
proximity indices. II. Application in security analysis. In Power Engineering
2002 Large Engineering Systems Conference on, LESCOPE 02(pp. 115-119). IEEE.
Rajabi, A. R., Rashnoei, S., Hakimzadeh, M., & Habibi, A. (2014). Coordination
between SC and SVC for Voltage Stability Improvement. World Academy of
Science, Engineering and Technology, International Journal of Electrical,
Computer, Energetic, Electronic and Communication Engineering, 8(9), 1443-1446.
Reddy, R. S. S., & Manohar, T. G. (2012). Literature Review on Voltage stability
phenomenon and Importance of FACTS Controllers In power system Environment. GJRE-F: Electrical and Electronic Engineering, 12(3), 25-29
Saadat, H. (2004). Power System Analysis (Second ed.). Singapore: Mc Graw Hill. Samuel, I. A., Katende, J., Daramola, S. A., & Awelewa, A. A. (2014), (a). Review of
System Collapse Incidences on the 330-kV Nigerian National Grid. International Journal of Engineering Science Invention, 3, 55-59
Samuel, I. A., Okwechime, N. M., & Abdulkareem, A. (2014), (b). Investigating The
Selection Of A Suitable Slack Bus: A Case Study Of The Multi-Generating Stations Of The Nigerian 330-kV Power System Network. International Journal
of Electrical Electronic Engineering Studies, 2(1), 1-12. Sanaye-Pasand, M., & Rezaei-Zare, A. (2003). Review and Simulation of Static Indices
in Detection of Proximity to Voltage Collapse. In Australian Universities Power
Engineering Conference. Sarat K. S., Suresh S. R. & Jayaram Kumar S.V. (2012). New Voltage Stability Index
(NVSI) for Voltage Stability Analysis in Power System. International Journal of
Electrical and Electronics Engineering Research (IJEEER), 2(4), 13-20.
93
Sinha, R.K. and Chauhan, S.(2014) Fast Contingency Analysis and Ranking for Power System Security Assessment. Proceedings of Thirteenth IRF International Conference, Chennai, India, ISBN: 978-93-84209-51-3. Pp116-121.
Subramani, C., Dash, S. S., Kumar, V., & Kiran, H. (2012). Implementation of line stability index for contingency analysis and screening in power systems. Journal
of Computer Science, 8(4), 585-590. Subramanian, A. & Ravi, G. (2011). Voltage collapse enhancement and loss reduction
by reactive power. International Journal of ComputerApplications, 12(12), 32-42.
Suganyadevia, M. V., & Babulalb, C. K. (2009). Estimating of loadability margin of a
power system by comparing Voltage Stability Indices. In Control, Automation,
Communication and Energy Conservation, 2009. INCACEC 2009. 2009
International Conference on (pp. 1-4). IEEE. Sunday, O. O. (2009). Power outages in the Nigeria transmission grid. Research Journal
of Applied Sciences, 4(1), 1-9. Taylor, C. W. (1994). Power System Voltage Stability. New York: McGraw-Hill. TCN, (2015). Daily Operational Report. Osogbo: Transmission Company of Nigeria
(TCN). Unpublished. Tilwani, M., & Choube, S. C. (2015) Prediction of Voltage Collapse in Power System
using Different Indices. International Journal of Science and Research (IJSR). Volume 4 Issue 6, pp1199-1203.
Tiwari, R., Niazi, K. R., & Gupta, V. (2012). Line collapse proximity index for
prediction of voltage collapse in power systems. International Journal of
Electrical Power & Energy Systems, 41(1), 105-111. Vadivelu, K. R., & Marutheswar, D. G. (2014). Maximum Load-ability Estimation for
Weak Bus Identification Using Fast Voltage Stability Index in a Power Transmission System by Real-Time Approach. International Journal of
Electrical and Electronics Engineering &Telecommunications, ISSN, 2319-2518: 84-91.
Veleba, J., & Nestorovic, T. (2013). Performance of Static Voltage Stability Analysis in
MATLAB Environment with Further Applications. International journal of
education and information technologies, 4(7).133-145
94
Verayiah, R., Mohamed, A., Shareef, H., & Abidin, I. H. Z. (2013). Performance comparison of voltage stability indices for weak bus identification in power systems. In IOP Conference Series: Earth and Environmental Science (Vol. 16, No. 1) . 012022): 1-4. Available from: http://iopscience.iop.org/article/10.1088/1755-1315/16/1/012022/pdfIOP Publishing: doi:10.1088/1755-1315/16/1/012022
Yahia, E. Z., Elsherif, M. A., & Zaggout, M. N. (2015). Detection of Proximity to
Voltage Collapse by Using L–Index. International Journal of Innovative
Research in Science Engineering and Technology, 4(3), 1755-1765.
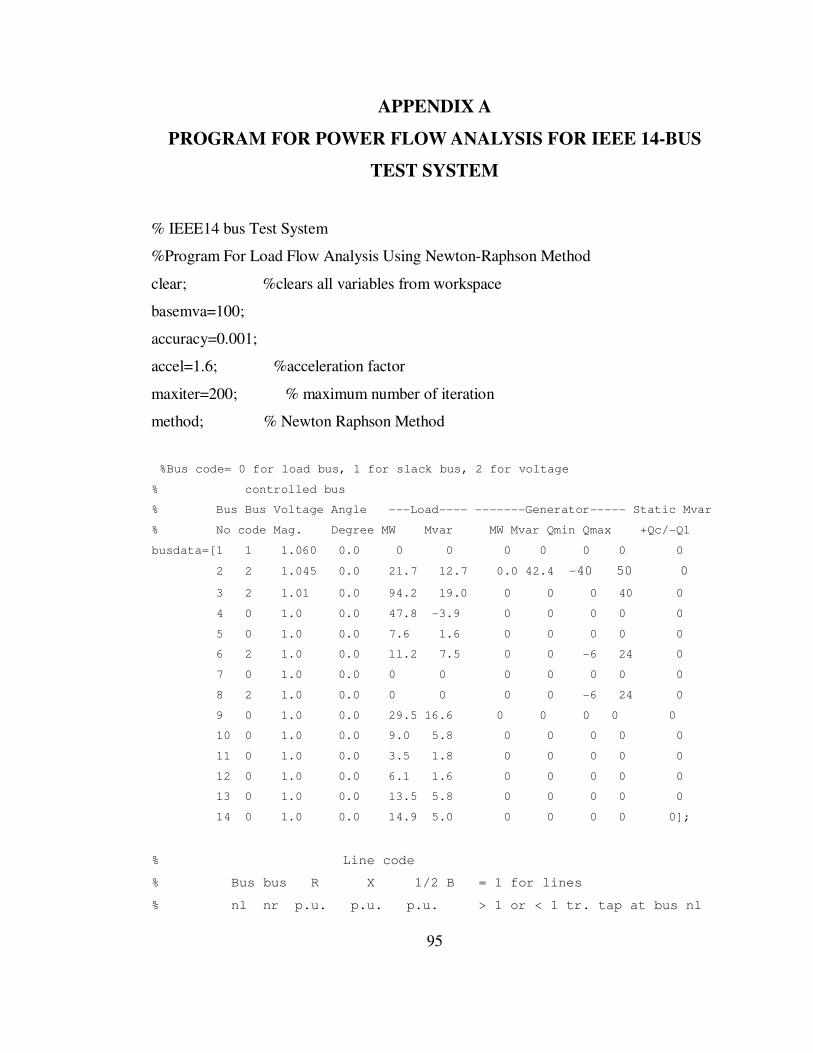
95
APPENDIX A
PROGRAM FOR POWER FLOW ANALYSIS FOR IEEE 14-BUS
TEST SYSTEM
% IEEE14 bus Test System
%Program For Load Flow Analysis Using Newton-Raphson Method
clear; %clears all variables from workspace
basemva=100;
accuracy=0.001;
accel=1.6; %acceleration factor
maxiter=200; % maximum number of iteration
method; % Newton Raphson Method
%Bus code= 0 for load bus, 1 for slack bus, 2 for voltage
% controlled bus
% Bus Bus Voltage Angle ---Load---- -------Generator----- Static Mvar
% No code Mag. Degree MW Mvar MW Mvar Qmin Qmax +Qc/-Ql
busdata=[1 1 1.060 0.0 0 0 0 0 0 0 0
2 2 1.045 0.0 21.7 12.7 0.0 42.4 -40 50 0
3 2 1.01 0.0 94.2 19.0 0 0 0 40 0
4 0 1.0 0.0 47.8 -3.9 0 0 0 0 0
5 0 1.0 0.0 7.6 1.6 0 0 0 0 0
6 2 1.0 0.0 11.2 7.5 0 0 -6 24 0
7 0 1.0 0.0 0 0 0 0 0 0 0
8 2 1.0 0.0 0 0 0 0 -6 24 0
9 0 1.0 0.0 29.5 16.6 0 0 0 0 0
10 0 1.0 0.0 9.0 5.8 0 0 0 0 0
11 0 1.0 0.0 3.5 1.8 0 0 0 0 0
12 0 1.0 0.0 6.1 1.6 0 0 0 0 0
13 0 1.0 0.0 13.5 5.8 0 0 0 0 0
14 0 1.0 0.0 14.9 5.0 0 0 0 0 0];
% Line code
% Bus bus R X 1/2 B = 1 for lines
% nl nr p.u. p.u. p.u. > 1 or < 1 tr. tap at bus nl
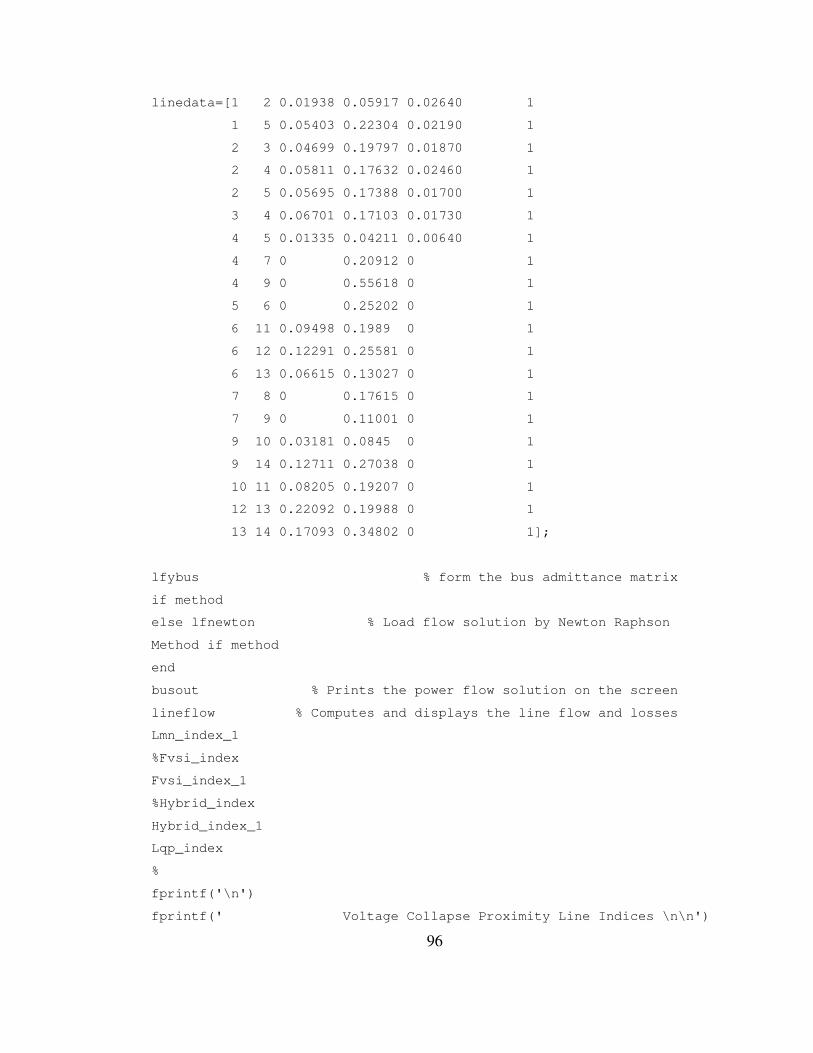
96
linedata=[1 2 0.01938 0.05917 0.02640 1
1 5 0.05403 0.22304 0.02190 1
2 3 0.04699 0.19797 0.01870 1
2 4 0.05811 0.17632 0.02460 1
2 5 0.05695 0.17388 0.01700 1
3 4 0.06701 0.17103 0.01730 1
4 5 0.01335 0.04211 0.00640 1
4 7 0 0.20912 0 1
4 9 0 0.55618 0 1
5 6 0 0.25202 0 1
6 11 0.09498 0.1989 0 1
6 12 0.12291 0.25581 0 1
6 13 0.06615 0.13027 0 1
7 8 0 0.17615 0 1
7 9 0 0.11001 0 1
9 10 0.03181 0.0845 0 1
9 14 0.12711 0.27038 0 1
10 11 0.08205 0.19207 0 1
12 13 0.22092 0.19988 0 1
13 14 0.17093 0.34802 0 1];
lfybus % form the bus admittance matrix
if method
else lfnewton % Load flow solution by Newton Raphson
Method if method
end
busout % Prints the power flow solution on the screen
lineflow % Computes and displays the line flow and losses
Lmn_index_1
%Fvsi_index
Fvsi_index_1
%Hybrid_index
Hybrid_index_1
Lqp_index
%
fprintf('\n')
fprintf(' Voltage Collapse Proximity Line Indices \n\n')
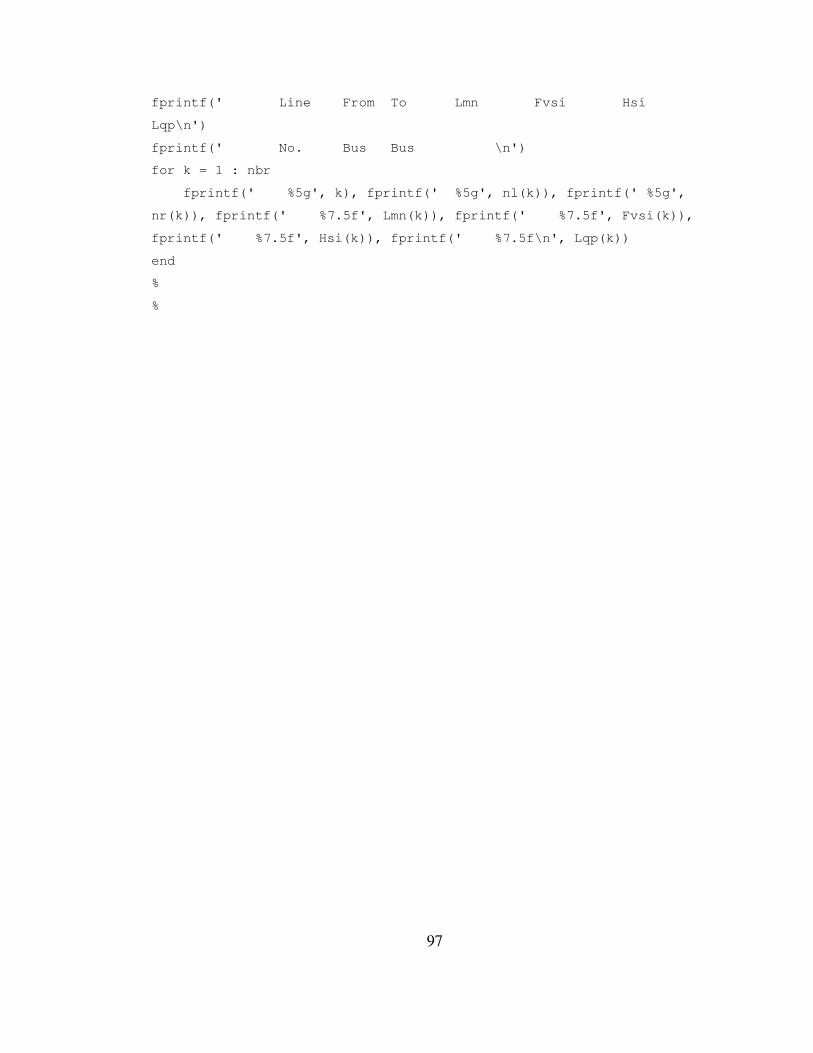
97
fprintf(' Line From To Lmn Fvsi Hsi
Lqp\n')
fprintf(' No. Bus Bus \n')
for k = 1 : nbr
fprintf(' %5g', k), fprintf(' %5g', nl(k)), fprintf(' %5g',
nr(k)), fprintf(' %7.5f', Lmn(k)), fprintf(' %7.5f', Fvsi(k)),
fprintf(' %7.5f', Hsi(k)), fprintf(' %7.5f\n', Lqp(k))
end
%
%
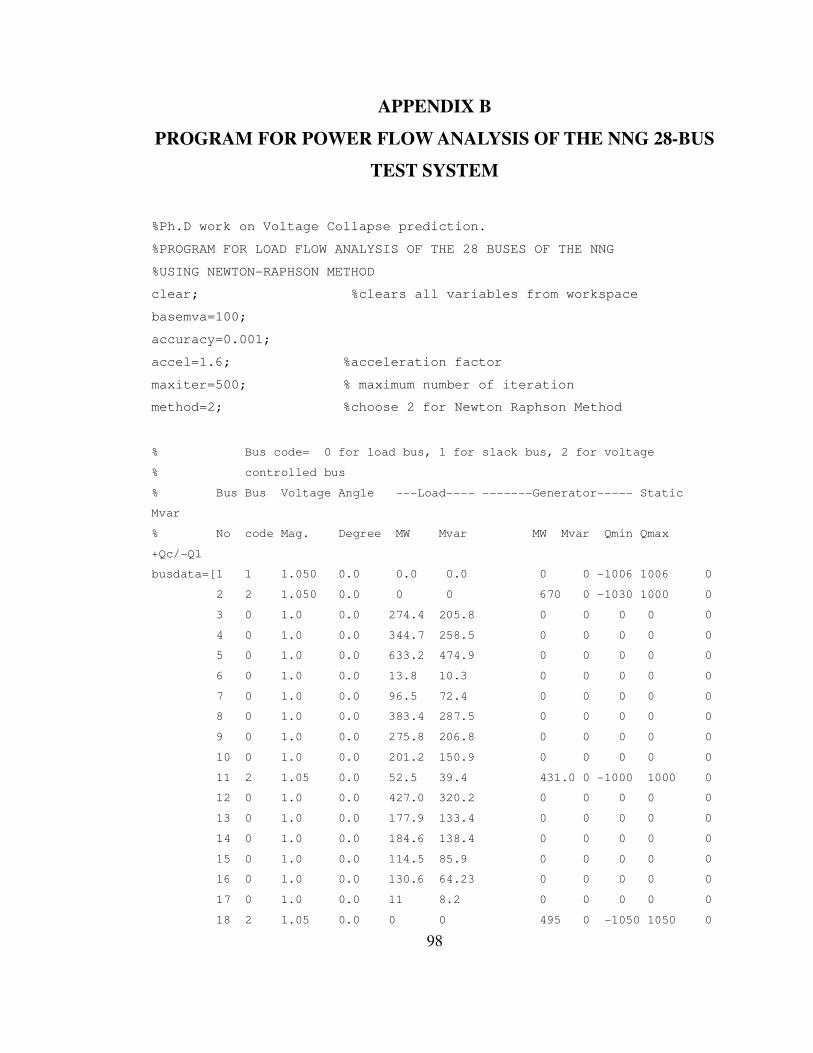
98
APPENDIX B
PROGRAM FOR POWER FLOW ANALYSIS OF THE NNG 28-BUS
TEST SYSTEM
%Ph.D work on Voltage Collapse prediction.
%PROGRAM FOR LOAD FLOW ANALYSIS OF THE 28 BUSES OF THE NNG
%USING NEWTON-RAPHSON METHOD
clear; %clears all variables from workspace
basemva=100;
accuracy=0.001;
accel=1.6; %acceleration factor
maxiter=500; % maximum number of iteration
method=2; %choose 2 for Newton Raphson Method
% Bus code= 0 for load bus, 1 for slack bus, 2 for voltage
% controlled bus
% Bus Bus Voltage Angle ---Load---- -------Generator----- Static
Mvar
% No code Mag. Degree MW Mvar MW Mvar Qmin Qmax
+Qc/-Ql
busdata=[1 1 1.050 0.0 0.0 0.0 0 0 -1006 1006 0
2 2 1.050 0.0 0 0 670 0 -1030 1000 0
3 0 1.0 0.0 274.4 205.8 0 0 0 0 0
4 0 1.0 0.0 344.7 258.5 0 0 0 0 0
5 0 1.0 0.0 633.2 474.9 0 0 0 0 0
6 0 1.0 0.0 13.8 10.3 0 0 0 0 0
7 0 1.0 0.0 96.5 72.4 0 0 0 0 0
8 0 1.0 0.0 383.4 287.5 0 0 0 0 0
9 0 1.0 0.0 275.8 206.8 0 0 0 0 0
10 0 1.0 0.0 201.2 150.9 0 0 0 0 0
11 2 1.05 0.0 52.5 39.4 431.0 0 -1000 1000 0
12 0 1.0 0.0 427.0 320.2 0 0 0 0 0
13 0 1.0 0.0 177.9 133.4 0 0 0 0 0
14 0 1.0 0.0 184.6 138.4 0 0 0 0 0
15 0 1.0 0.0 114.5 85.9 0 0 0 0 0
16 0 1.0 0.0 130.6 64.23 0 0 0 0 0
17 0 1.0 0.0 11 8.2 0 0 0 0 0
18 2 1.05 0.0 0 0 495 0 -1050 1050 0
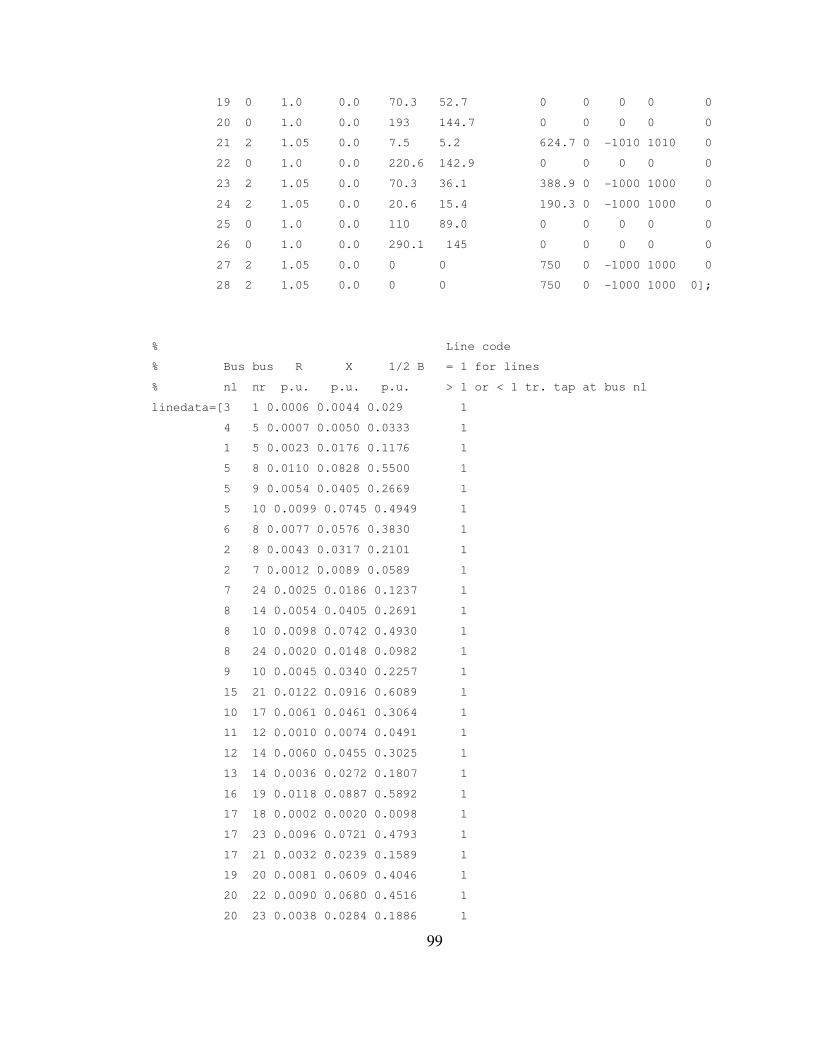
99
19 0 1.0 0.0 70.3 52.7 0 0 0 0 0
20 0 1.0 0.0 193 144.7 0 0 0 0 0
21 2 1.05 0.0 7.5 5.2 624.7 0 -1010 1010 0
22 0 1.0 0.0 220.6 142.9 0 0 0 0 0
23 2 1.05 0.0 70.3 36.1 388.9 0 -1000 1000 0
24 2 1.05 0.0 20.6 15.4 190.3 0 -1000 1000 0
25 0 1.0 0.0 110 89.0 0 0 0 0 0
26 0 1.0 0.0 290.1 145 0 0 0 0 0
27 2 1.05 0.0 0 0 750 0 -1000 1000 0
28 2 1.05 0.0 0 0 750 0 -1000 1000 0];
% Line code
% Bus bus R X 1/2 B = 1 for lines
% nl nr p.u. p.u. p.u. > 1 or < 1 tr. tap at bus nl
linedata=[3 1 0.0006 0.0044 0.029 1
4 5 0.0007 0.0050 0.0333 1
1 5 0.0023 0.0176 0.1176 1
5 8 0.0110 0.0828 0.5500 1
5 9 0.0054 0.0405 0.2669 1
5 10 0.0099 0.0745 0.4949 1
6 8 0.0077 0.0576 0.3830 1
2 8 0.0043 0.0317 0.2101 1
2 7 0.0012 0.0089 0.0589 1
7 24 0.0025 0.0186 0.1237 1
8 14 0.0054 0.0405 0.2691 1
8 10 0.0098 0.0742 0.4930 1
8 24 0.0020 0.0148 0.0982 1
9 10 0.0045 0.0340 0.2257 1
15 21 0.0122 0.0916 0.6089 1
10 17 0.0061 0.0461 0.3064 1
11 12 0.0010 0.0074 0.0491 1
12 14 0.0060 0.0455 0.3025 1
13 14 0.0036 0.0272 0.1807 1
16 19 0.0118 0.0887 0.5892 1
17 18 0.0002 0.0020 0.0098 1
17 23 0.0096 0.0721 0.4793 1
17 21 0.0032 0.0239 0.1589 1
19 20 0.0081 0.0609 0.4046 1
20 22 0.0090 0.0680 0.4516 1
20 23 0.0038 0.0284 0.1886 1
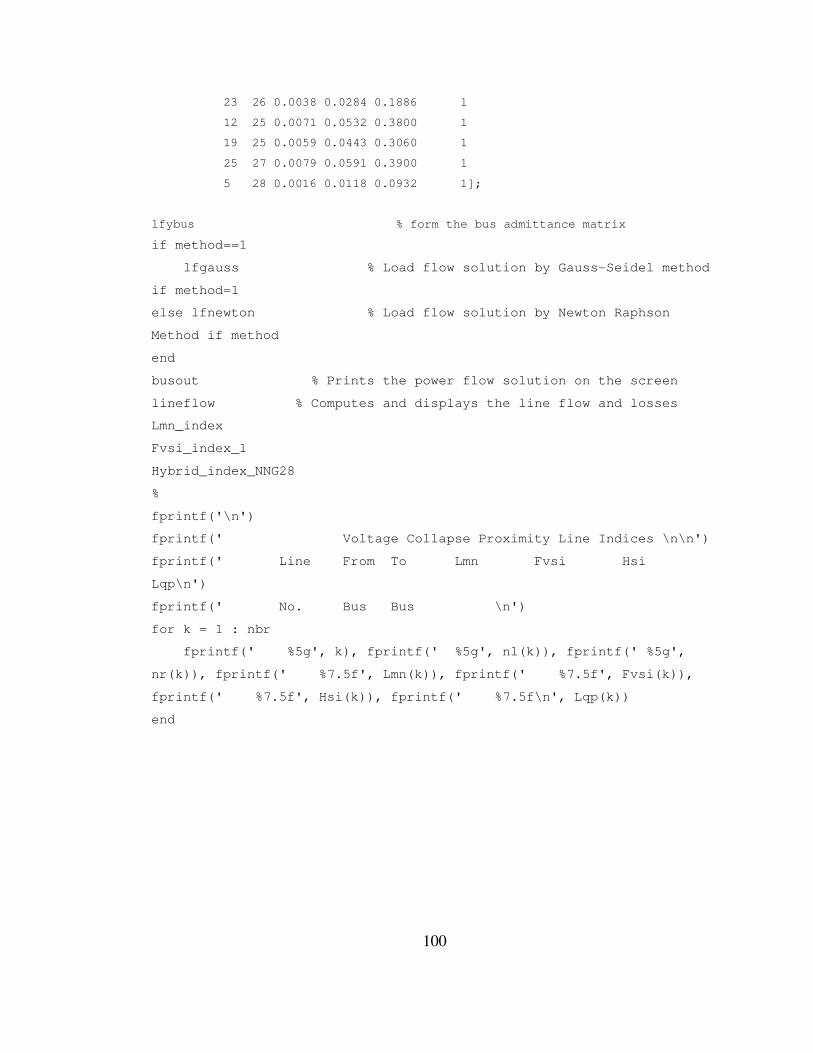
100
23 26 0.0038 0.0284 0.1886 1
12 25 0.0071 0.0532 0.3800 1
19 25 0.0059 0.0443 0.3060 1
25 27 0.0079 0.0591 0.3900 1
5 28 0.0016 0.0118 0.0932 1];
lfybus % form the bus admittance matrix
if method==1
lfgauss % Load flow solution by Gauss-Seidel method
if method=1
else lfnewton % Load flow solution by Newton Raphson
Method if method
end
busout % Prints the power flow solution on the screen
lineflow % Computes and displays the line flow and losses
Lmn_index
Fvsi_index_1
Hybrid_index_NNG28
%
fprintf('\n')
fprintf(' Voltage Collapse Proximity Line Indices \n\n')
fprintf(' Line From To Lmn Fvsi Hsi
Lqp\n')
fprintf(' No. Bus Bus \n')
for k = 1 : nbr
fprintf(' %5g', k), fprintf(' %5g', nl(k)), fprintf(' %5g',
nr(k)), fprintf(' %7.5f', Lmn(k)), fprintf(' %7.5f', Fvsi(k)),
fprintf(' %7.5f', Hsi(k)), fprintf(' %7.5f\n', Lqp(k))
end
101
APPENDIX C
STABILITY INDICES CODE FOR CASE STUDIES
%Stability indices code for case studies
% Lmn_index computes the Lmn voltage stability line index
fprintf('\n')
fprintf(' Voltage Collapse Proximity Line Index \n\n')
fprintf(' Line From To Lmn \n')
fprintf(' No. Bus Bus \n')
del = 0; theta=0; den=0; Lmn=0; Qj=0;
for k = 1 : nbr
theta(k) = atand(X(k)/R(k));
del(k) = (deltad(nl(k)) - deltad(nr(k)));
den(k) = (V(nl(k))*sind(theta(k) - del(k)))^2;
Qj(k) = imag(Spq(k))/basemva;
Lmn(k) = abs(4*X(k)*Qj(k)/den(k));
fprintf(' %5g', k), fprintf(' %5g', nl(k)), fprintf('
%5g', nr(k)), fprintf(' %7.5f\n', Lmn(k))
end
% Fvsi_index computes the FVSI voltage stability index
fprintf('\n')
fprintf(' Voltage Collapse Proximity Line Index \n\n')
fprintf(' Line From To FVSI \n')
fprintf(' No. Bus Bus \n')
del = 0; theta=0; den=0; Fvsi=0; Qj=0;
for k = 1 : nbr
denf(k) = V(nl(k))^2*X(k);
Qj(k) = imag(Spq(k(k>0)))/basemva;
Fvsi(k) =abs(4*(Z(k)^2)*Qj(k(k>0))/denf(k));
fprintf(' %5g', k), fprintf(' %5g', nl(k)), fprintf('
%5g', nr(k)), fprintf(' %7.5f\n', Fvsi(k))
end
102
% Hybrid line stability index IEEE 14 bus system
fprintf('\n')
fprintf(' Voltage Collapse Proximity Line Index
\n\n')
fprintf(' Line From To Hsi \n')
fprintf(' No. Bus Bus \n')
del = 0; theta=0; denh=0; Hsi=0; Qj=0; s=0;
for k = 1 : nbr
Qj(k) = imag(Spq(k))/basemva;
del(k) = (deltad(nl(k)) - deltad(nr(k)));
theta(k) = atand(X(k)/R(k));
if abs(del(k)) >= 1.422, s = 0; else s = 1; end
A=4*Qj(k)/abs(V(nl(k)))^2;
B=abs(Z(k)^2)*s/X(k);
C=X(k)*(s-1)/sind(theta(k) - del(k))^2;
Hsi(k)= abs(A*(B-C));
fprintf(' %5g', k), fprintf(' %5g', nl(k)), fprintf('
%5g', nr(k)), fprintf(' %7.5f\n', Hsi(k))
end
% Hybrid line stability index NNG bus 28
fprintf('\n')
fprintf(' Voltage Collapse Proximity Line Index
\n\n')
fprintf(' Line From To Hsi \n')
fprintf(' No. Bus Bus \n')
del = 0; theta=0; denh=0; Hsi=0; Qj=0; s=0;
for k = 1 : nbr
Qj(k) = imag(Spq(k))/basemva;
del(k) = (deltad(nl(k)) - deltad(nr(k)));
theta(k) = atand(X(k)/R(k));
if abs(del(k)) >= 4.076, s = 0; else s = 1; end
103
A=4*Qj(k)/abs(V(nl(k)))^2;
B=abs(Z(k)^2)*s/X(k);
C=X(k)*(s-1)/sind(theta(k) - del(k))^2;
Hsi(k)= abs(A*(B-C));
fprintf(' %5g', k), fprintf(' %5g', nl(k)), fprintf('
%5g', nr(k)), fprintf(' %7.5f\n', Hsi(k))
end
104
APPENDIX D
PUBLICATIONS
� Isaac A. Samuel, James Katende, Claudius O. A. Awosope and Ayokunle A.
Awelewa. “Prediction of Voltage Collapse in Electrical Power System Networks
using a New Voltage Stability Index.” International Journal of Applied Engineering
Research ISSN 0973-4562 Volume 12, Number 2 (2017) pp. 190-199.
http://www.ripublication.com
� Isaac Samuel, James Katende, S. Adebayo Daramola and Ayokunle Awelewa
“Review of System Collapse Incidences on the 330-kV Nigerian National Grid”
International Journal of Engineering Science Invention ISSN (Online): 2319 – 6734,
ISSN (Print): 2319 – 6726 Volume 3Issue 4 ǁ April 2014 ǁ PP.55-59.
� Isaac A. Samuel, Okwechime Ngozi Marian, and Ademola Abudulkareem
“investigating the selection of a suitable slack bus: a case study of the multi-
generating stations of the nigerian 330-kv power system network.” International
Journal of Electrical Electronic Engineering Studies Vol.2, No.1, pp.1-12,
September 2014.
� Isaac Samuel, James Katende and Frank Ibikunle “Voltage Collapse and the
Nigerian National Grid.” Presented at the EIE 2nd International Conference on
Computing, Energy, Networking, Robotics and Control and Telecommunications.
November, 21st – 23rd 2012 (Presented Paper)
Related Documents