Acta Tropica 89 (2004) 215–225 A malaria risk analysis in an irrigated area in Sri Lanka Eveline Klinkenberg ∗ , Wim van der Hoek, Felix P. Amerasinghe International Water Management Institute (IWMI), P.O. Box 2075, Colombo, Sri Lanka Abstract Malaria in Sri Lanka is unstable and epidemic, with large spatial and temporal differences in transmission dynamics. The disease is of great public health significance and identification of underlying risk factors is important in order to use the limited resources in a cost-effective way. The International Water Management Institute (IWMI) recently launched a project of GIS-based malaria risk mapping in Sri Lanka, to investigate whether this tool could be used for epidemic forecasting and for the planning of malaria control activities. This paper presents results for the Uda Walawe region in southern Sri Lanka, an irrigated agricultural area where malaria cases were mapped at the smallest administrative level for each month over a 10-year period. Malaria incidence rates were related to land- and water-use patterns, socio-economic features, and data on malaria control interventions in a multivariate analysis. Areas of high malaria risk were characterized by: (i) higher than average rainfall, (ii) greater forest coverage; (iii) slash and burn cultivation as a predominant agricultural activity; (iv) presence of many abandoned irrigation reservoirs; and (v) poor socio-economic status. Irrigated rice cultivation areas had a lower risk of malaria than non-irrigated areas. This difference could be due to socio-economic factors related to irrigation development and/or transmission dynamics related to vector density or species composition. Our findings call for malaria control strategies that are readily adapted to different ecological and epidemiological settings. Malaria risk maps are a convenient tool for discussing targeted and cost-effective interventions with disease control personnel. © 2003 Elsevier B.V. All rights reserved. Keywords: Irrigation; Malaria risk map; Sri Lanka; Spatial analysis; Risk factors; GIS 1. Introduction Traditionally, malaria has been associated with ir- rigation development and many have emphasized the necessity to include health and environmental assess- ments in irrigation development planning to prevent adverse health effects (Tiffen, 1991; Birley, 1991; Oomen et al., 1990; Jobin, 1999). Nevertheless, while ∗ Corresponding author. Present address: International Water Management Institute (IWMI), PMB CT 112 Cantonments, Accra, Ghana. Tel.: +233-21-784753; fax: +233-21-784752. E-mail address: [email protected] (E. Klinkenberg). health issues are sometimes addressed in the planning or assessment phase, they are often ignored during fi- nal design and implementation, usually for economic reasons (Service, 1997). Rice irrigation in particular has been associated with breeding of malaria vec- tors due to the permanently submerged rice fields. However, although rice irrigation often leads to in- creased breeding of vectors, epidemiological studies have shown that this does not necessarily lead to an increased malaria incidence. For an overview of this so-called “paddies paradox” we refer to the review by Ijumba and Lindsay (2001). They conclude that irrigation can lead to an increase in malaria in areas 0001-706X/$ – see front matter © 2003 Elsevier B.V. All rights reserved. doi:10.1016/j.actatropica.2003.08.007

Welcome message from author
This document is posted to help you gain knowledge. Please leave a comment to let me know what you think about it! Share it to your friends and learn new things together.
Transcript
Acta Tropica 89 (2004) 215–225
A malaria risk analysis in an irrigated area in Sri Lanka
Eveline Klinkenberg∗, Wim van der Hoek, Felix P. Amerasinghe
International Water Management Institute (IWMI), P.O. Box 2075, Colombo, Sri Lanka
Abstract
Malaria in Sri Lanka is unstable and epidemic, with large spatial and temporal differences in transmission dynamics. The diseaseis of great public health significance and identification of underlying risk factors is important in order to use the limited resourcesin a cost-effective way. The International Water Management Institute (IWMI) recently launched a project of GIS-based malariarisk mapping in Sri Lanka, to investigate whether this tool could be used for epidemic forecasting and for the planning of malariacontrol activities. This paper presents results for the Uda Walawe region in southern Sri Lanka, an irrigated agricultural area wheremalaria cases were mapped at the smallest administrative level for each month over a 10-year period. Malaria incidence rateswere related to land- and water-use patterns, socio-economic features, and data on malaria control interventions in a multivariateanalysis. Areas of high malaria risk were characterized by: (i) higher than average rainfall, (ii) greater forest coverage; (iii)slash and burn cultivation as a predominant agricultural activity; (iv) presence of many abandoned irrigation reservoirs; and (v)poor socio-economic status. Irrigated rice cultivation areas had a lower risk of malaria than non-irrigated areas. This differencecould be due to socio-economic factors related to irrigation development and/or transmission dynamics related to vector densityor species composition. Our findings call for malaria control strategies that are readily adapted to different ecological andepidemiological settings. Malaria risk maps are a convenient tool for discussing targeted and cost-effective interventions withdisease control personnel.© 2003 Elsevier B.V. All rights reserved.
Keywords: Irrigation; Malaria risk map; Sri Lanka; Spatial analysis; Risk factors; GIS
1. Introduction
Traditionally, malaria has been associated with ir-rigation development and many have emphasized thenecessity to include health and environmental assess-ments in irrigation development planning to preventadverse health effects (Tiffen, 1991; Birley, 1991;Oomen et al., 1990; Jobin, 1999). Nevertheless, while
∗ Corresponding author. Present address: International WaterManagement Institute (IWMI), PMB CT 112 Cantonments, Accra,Ghana. Tel.:+233-21-784753; fax:+233-21-784752.
E-mail address: [email protected] (E. Klinkenberg).
health issues are sometimes addressed in the planningor assessment phase, they are often ignored during fi-nal design and implementation, usually for economicreasons (Service, 1997). Rice irrigation in particularhas been associated with breeding of malaria vec-tors due to the permanently submerged rice fields.However, although rice irrigation often leads to in-creased breeding of vectors, epidemiological studieshave shown that this does not necessarily lead to anincreased malaria incidence. For an overview of thisso-called “paddies paradox” we refer to the reviewby Ijumba and Lindsay (2001). They conclude thatirrigation can lead to an increase in malaria in areas
0001-706X/$ – see front matter © 2003 Elsevier B.V. All rights reserved.doi:10.1016/j.actatropica.2003.08.007
216 E. Klinkenberg et al. / Acta Tropica 89 (2004) 215–225
of unstable transmission, but not in areas of stabletransmission. In Sri Lanka, malaria is unstable andrice is the major crop, especially in irrigated areas.Several studies were done during the large-scale irri-gation development under the Mahaweli Project in SriLanka and these have shown an association betweenirrigation development and malaria (Amerasingheand Indrajith, 1994; Ramasamy et al., 1992;Amerasinghe and Ariyasena, 1990; Amerasingheet al., 1991, 1992). While the main vectorAnophelesculicifacies decreased, potential secondary vectors,like A. annularis (Ramasamy et al., 1992) and A.subpictus (Amerasinghe et al., 1992) increased. Themajor vector of malaria in Sri Lanka,A. culicifacies,does not breed in rice fields but breeding sites canbe found in irrigation-associated surface water, otherthan rice fields. Many irrigation systems in Sri Lankaare cascade systems originally built in ancient times,and consist of a series of connected reservoirs (knownas tanks orwewas). These small irrigation tanks canbe sources of malaria vector breeding in Sri Lanka(Amerasinghe et al., 2001). The studies cited aboveclearly show increases in malaria incidence concomi-tant with irrigation development but do not clarifythe long term impacts of irrigation development onmalaria. This makes it difficult for the agriculture andmalaria control community to take informed decisionswith respect to land use planning and agriculturalpractices.
With the unstable and epidemic malaria patternprevailing in Sri Lanka, it is important to targetscarce resources at the time and place where it isneeded. Several risk factors have been suggested thatcould help in defining high- and low-risk areas andtimes. A. culicifacies mainly breeds in clear waterpools that have formed in drying riverbeds. There-fore, rainfall and river flow velocities have an impacton breeding habitats. Other malaria risk factors thathave been identified in Sri Lanka are, age and gender(Mendis, 1990; van der Hoek et al., 1998), humanmigration (Klinkenberg, 2001), type and location ofhousing (Gamage-Mendis et al., 1991; Gunawardenaet al., 1998; Konradsen et al., 2003), and the typeand extent of personal protection measures (van derHoek et al., 1998). Although risk factors for malariahave been identified at micro (i.e., household/village)scale, there has been no attempt at spatial and tempo-ral analysis at macro (i.e., regional) level to identify
high-risk areas and factors underlying the malariapattern. Such an approach could be a valuable tool toassist the national Anti-Malaria Campaign (AMC) inmaking better use of resources. Therefore, the Interna-tional Water Management Institute (IWMI) launcheda risk-mapping project to investigate the malaria pat-tern over time and space, correlate this with potentialrisk factors within land use, socio-economic, andmeteorological parameters, and explore whether anepidemic forecasting system could be developed. Theproject started with a study in the Uda Walawe regionlocated in southern Sri Lanka. This paper presents themain findings of the study. A more detailed accountof data and results is provided inKlinkenberg et al.(2003).
2. Material and methods
2.1. Study area
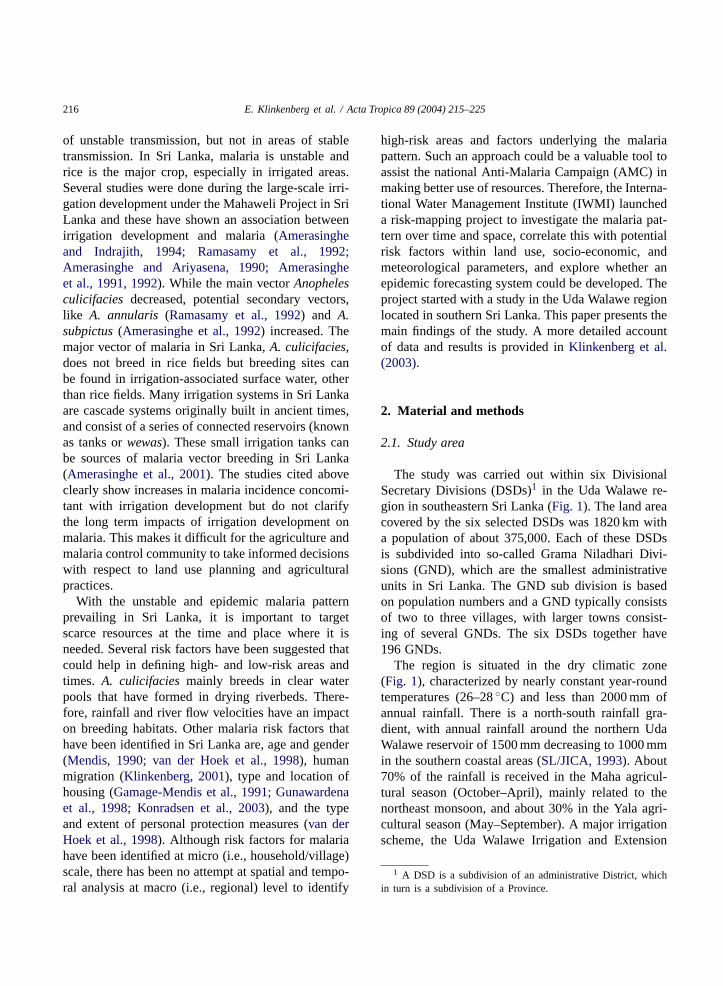
The study was carried out within six DivisionalSecretary Divisions (DSDs)1 in the Uda Walawe re-gion in southeastern Sri Lanka (Fig. 1). The land areacovered by the six selected DSDs was 1820 km witha population of about 375,000. Each of these DSDsis subdivided into so-called Grama Niladhari Divi-sions (GND), which are the smallest administrativeunits in Sri Lanka. The GND sub division is basedon population numbers and a GND typically consistsof two to three villages, with larger towns consist-ing of several GNDs. The six DSDs together have196 GNDs.
The region is situated in the dry climatic zone(Fig. 1), characterized by nearly constant year-roundtemperatures (26–28◦C) and less than 2000 mm ofannual rainfall. There is a north-south rainfall gra-dient, with annual rainfall around the northern UdaWalawe reservoir of 1500 mm decreasing to 1000 mmin the southern coastal areas (SL/JICA, 1993). About70% of the rainfall is received in the Maha agricul-tural season (October–April), mainly related to thenortheast monsoon, and about 30% in the Yala agri-cultural season (May–September). A major irrigationscheme, the Uda Walawe Irrigation and Extension
1 A DSD is a subdivision of an administrative District, whichin turn is a subdivision of a Province.
E. Klinkenberg et al. / Acta Tropica 89 (2004) 215–225 217
Fig. 1. Study area and the three climatic zones of Sri Lanka. Note: Int. is intermediate zone.
Project (Fig. 1), was developed in the Walawe Riverbasin from 1967 onwards (SAPI, 2000). In 1993, theRight Bank command area was about 12,000 ha ofmainly irrigated paddy, but the cultivation of bananaand other field crops such as vegetables and pulseshas expanded within this area over the past decade.The left bank command area was about 5000 ha, di-vided into 2000 ha of sugar cane around Sevenegala(Fig. 1) and 3000 ha of paddy. The Uda Walawe irri-gation system presently has several reservoirs (tanksor wewas) that are interconnected. The main reservoiris the Uda Walawe tank with a capacity of 268 mil-lion cubic meters. The irrigated area is fed throughtwo main canals on the left and right banks of theWalawe Ganga (river). These canals flow throughseveral smaller tanks that contribute to the project’soverall water resources (SAPI, 2000). Currently, ir-rigation development is about to start in the lowerpart of the left bank extension area (Fig. 1). Manysmall tanks with command areas ranging from 10 to
70 ha are located in this extension area; some of themwill be upgraded and the area will be developed asa small tank cascade system, in contrast to the al-ready developed area which is based on a few largetanks.
In addition to irrigated agriculture, people havehome gardens planted with coconut palms and otherfruit trees. Outside of the Uda Walawe irrigationscheme, the main activities arechena (slash and burn)cultivation, mainly in the northeastern part of the area(Thanamalvilla DSD, seeFig. 1) and in the areas bor-dering the irrigation scheme. Within Thanamalvilladivision there are also several remote, difficult to ac-cess areas where illegalGanja (cannabis) cultivationtakes place. The northern part of the Embilipitiyadivision is more mountainous with small tea plan-tations but also small rice paddies in the valleys.In the Sooriyawewa and Embilipitya DSDs at someplaces gem mining takes place and the gem pits areabandoned after use.
218 E. Klinkenberg et al. / Acta Tropica 89 (2004) 215–225
2.2. Data collection and processing
The GND level was used for data analysis follow-ing Abeysekera et al. (1997)who argued that this isthe most appropriate level to use for malaria data anal-ysis in Sri Lanka, and all data were transformed tothe GND level with the aid of a GIS system. Depend-ing on the level at which the data were available for aparticular variable, this was done by either aggregat-ing village-level data to GND level or disaggregatinghigher level data by overlaying GND boundaries. Fora detailed description of the GIS procedures, data col-lection and data processing considerations we refer toKlinkenberg et al. (2003).
Malaria case data were collected from the recordsof all 14 government health facilities located in thestudy area. The records contain the place of residenceof patients and, therefore, each new malaria case couldbe assigned to a particular GND. The number of newcases and the population figure was then used to calcu-late malaria incidence (number of cases per 1000 pop-ulation) for each GND. All the case data collected referto laboratory confirmed cases of malaria. In Sri Lanka,in contrast to Africa and much of Asia, the hospitalrecorded cases are considered a good representation ofthe actual malaria incidence as people in general pre-fer Western-type diagnosis and treatment for malaria(Konradsen et al., 1997, 2000a,b). Malaria data fromprivate clinics were not available, as private clinics donot systematically record the data, and could there-fore not be included. Data from mobile clinics2 wereincluded when available. Basic geographic features(e.g. roads and streams) and land and water use pat-terns for the study area were obtained from 1:50,000scale maps of the Survey Department of Sri Lanka,with permission from the Ministry of Defence. Asthe main malaria vector in Sri Lanka prefers to breedin pools in riverbeds and slow moving streams, thelength of natural waterways (hereafter referred to asstreams for convenience) per km2 in each GND was in-cluded as a covariate. Proximity of houses to a river orstream has been suggested as a risk factor for malaria(Gunawardena et al., 1998; van der Hoek et al., 2003).Using GIS techniques a buffer layer was created forthe area within 250 m of a stream. The percentage of
2 Village-level clinics conducted periodically by the AMC, es-pecially in the remote areas.
buffer area of the total area of the GND was used as acovariate representing proximity to streams. A distinc-tion was made between natural streams and irrigationcanals and these were included as two separate co-variates. Socio-economic data at GND level consistedof number of houses, number of families, number offamilies receiving food subsidies, number of landlessfamilies, number of families having electricity, andnumber of livestock per family, and these were ob-tained from the Department of Census and Statistics(1993 data). Data on indoor insecticide spraying ac-tivities for malaria control in the area were obtainedfrom the Anti-Malaria Campaign. For the purpose ofour analysis, each GND was categorized as sprayed orunsprayed because the limited data available did notallow for a more detailed categorization. Rainfall andsoil moisture data were available on a monthly basisby GND for the period June 1999 to May 2000 froma previous IWMI, Meteorological Department of SriLanka project.
Except for the meteorological covariates, all co-variates were only available on annual basis andtherefore the annual malaria incidence was used asoutcome measure in the data analysis. Annual dataanalysis was run for the years 1991–1999. For theyear 2000, data were only available for January tillAugust, therefore this year was excluded from theannual analysis. For all covariates except land use,there were data only for 1 year. We assumed thatthe malaria case data were independent between theyears and that the geographic variation in the covari-ates did not change substantially between the years.Therefore, the same covariate dataset was related toeach year’s malaria incidence data.
2.3. Statistical analysis
The annual dataset consisted of data for 196 GNDsduring the period 1991–1999. Malaria incidence ratesand incidence rate ratios were calculated for “high”and “low” values of each covariate. The values of eachcovariate measured on a continuous scale were codedas 1 and 0 with the median value as cut-off point torepresent a high or low value of that covariate. Themedian value was used in the absence of a better justi-fication for placing the cut-off at any other value. Thevalue 1 was assigned to the category that was expectedto pose the highest risk for malaria. For example,
E. Klinkenberg et al. / Acta Tropica 89 (2004) 215–225 219
GNDs with more than median land area covered bypaddy were assigned the value 1, whereas GNDs withless than median paddy area were assigned the value0, based on the expectation that more paddy in aGND would be associated with a higher malaria riskin that GND. Confidence intervals for the incidencerate ratios were calculated afterRothman (1986). Onthe same dataset, after categorizing the incidence lev-els, logistic regression analysis was carried out, withSPSS software package (version 8.0), to investigatethe association between the outcome variable—themalaria score—and the categorized covariates at theGND level. The outcome variable was derived by re-coding case count data as 1 or 0 based on a cut-offvalue of annual parasite incidence (API). Three cut-offvalues were investigated to represent low, moderateand high-risk scenarios. In Sri Lanka, the AMC con-siders malaria under control if the API is lower than 10cases per 1000 inhabitants per annum. This value wasadopted for the low-risk scenario. An API of 30 wasutilized as cut-off value for the moderate-risk scenarioand an API of 100 for the high-risk scenario. In the lo-gistic regression analysis, the malaria score was codedas 1 for values above the cut-off and 0 for values below.
3. Results
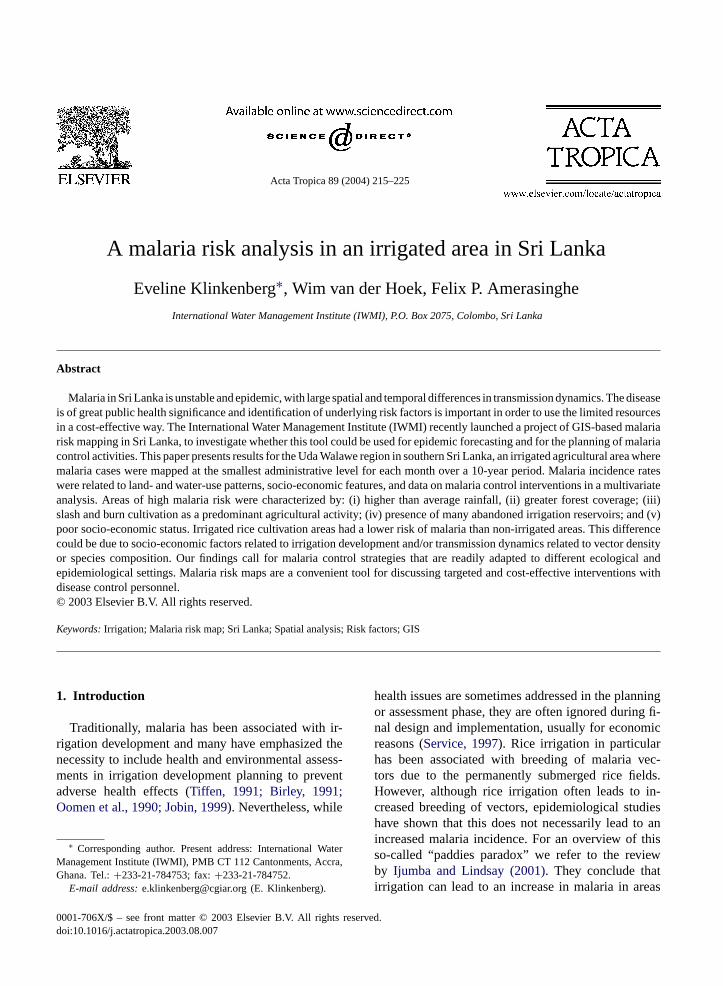
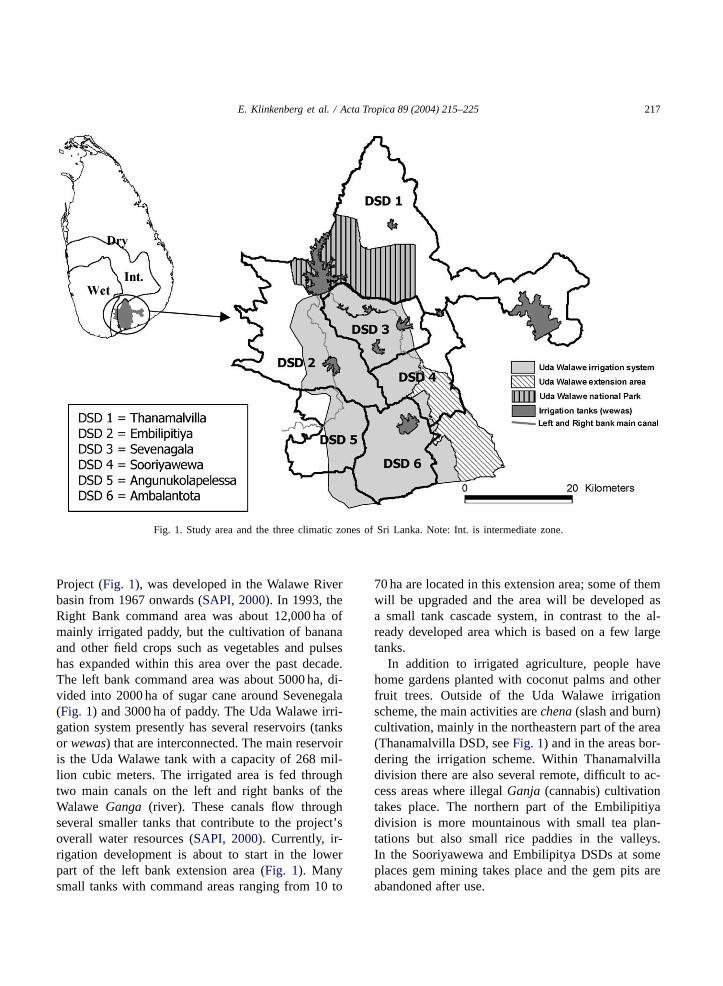
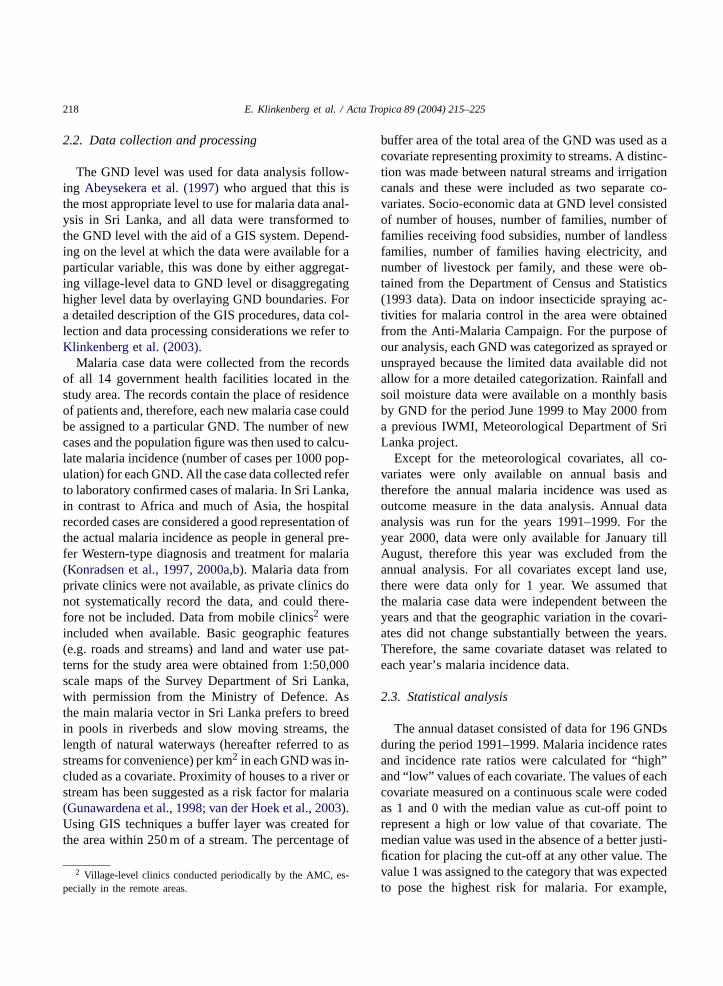
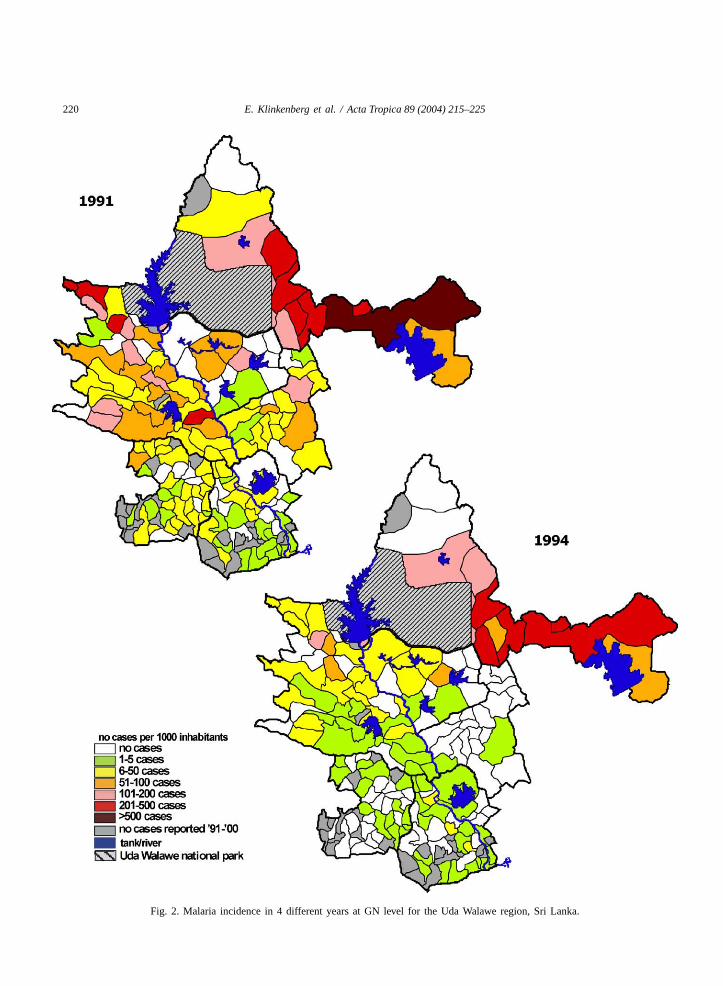
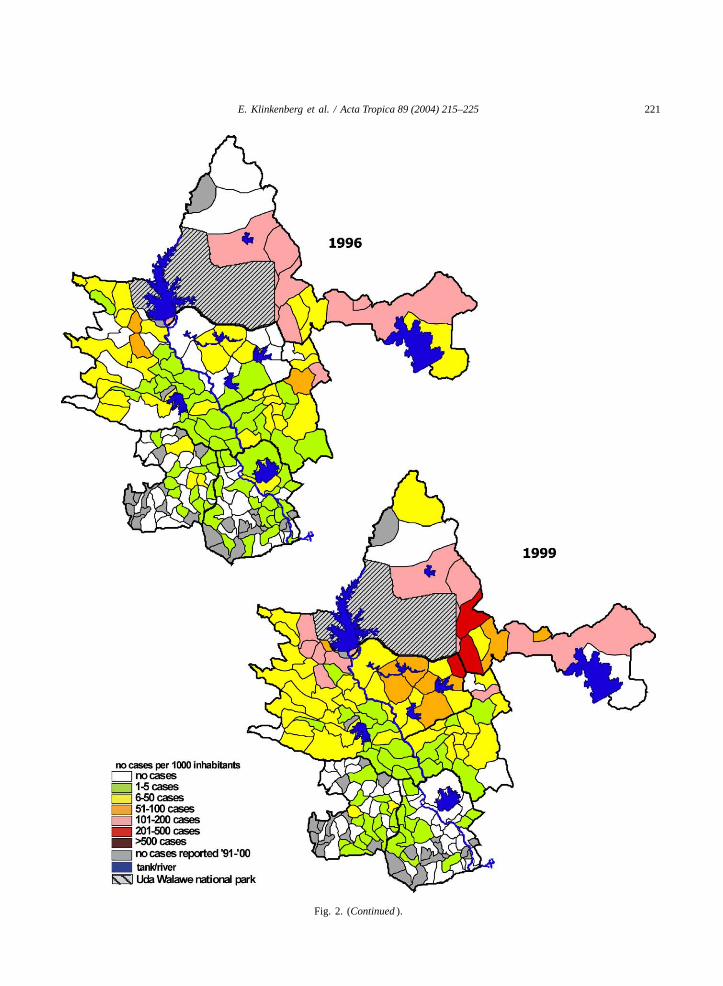
The 10-year (1991–2000) dataset showed thatmalaria incidence was consistently higher in theThanamalvilla area than in other areas. InFig. 2, asan example, the distribution of malaria incidence isshown for 4 different years. The data showed a slightoverall decrease in malaria incidence over the 10-yearperiod. In the lower incidence areas the decrease onaverage was from 10–50 to<10 cases per 1000 inhab-itants per year and in the Thanamalvilla area the inci-dence decreased from more than 500 cases per 1000inhabitants per year to between 200 and 500 cases per1000 inhabitants per year. Even at the lower incidencelevel, Thanamalvilla would be considered a high-riskarea according to national guidelines of the Anti-Malaria Campaign, that classify high-risk areas on thebasis of an annual parasite incidence (API) of 100 ormore cases per 1000 population and low risk on thebasis of an API below 10 cases per 1000 population.
Overlaying the malaria data with the land use datarevealed that the high incidence area consisted mainly
of non-irrigated land (compareFigs. 1 and 2), whichwas mostly covered by forest and wherechena (slashand burn) cultivation was practiced. Malaria incidencewas much lower in the irrigated rice cultivation areas,which would largely be classified as low risk (API<
10). Another salient land use feature of the high-riskarea was the presence of so-called “abandoned tanks”.These are tanks that were formerly part of an ancientirrigation system but were classified on land use mapsas “abandoned”. However, a field survey in the area(Klinkenberg, 2001) revealed that these tanks were infact often used by local communities for small-scaleagriculture and other water uses.
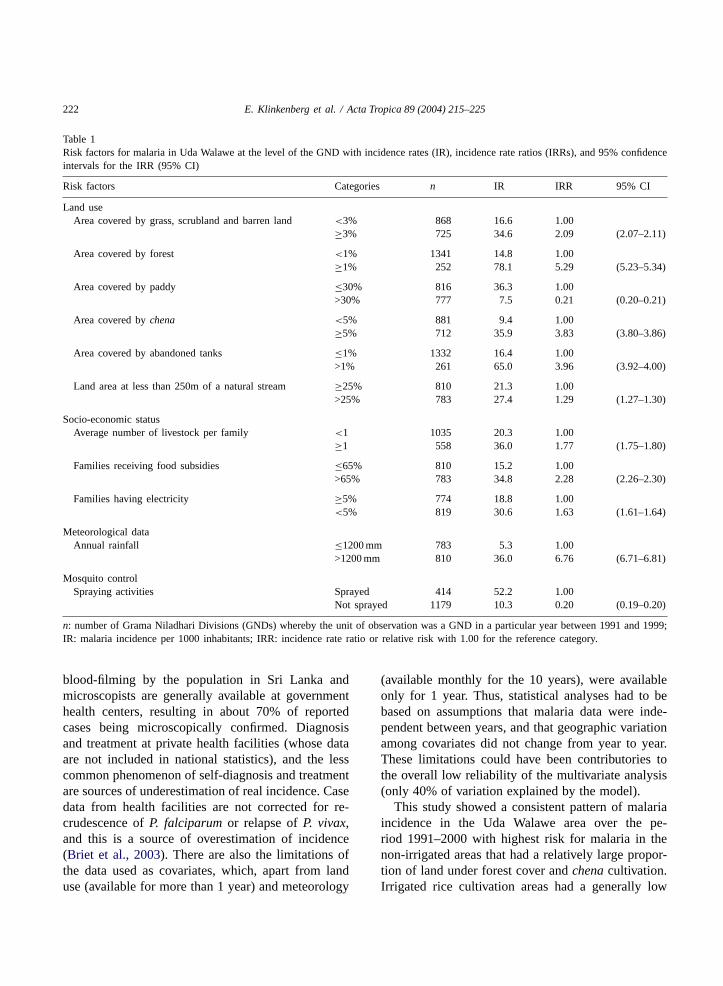
The visual spatial pattern was confirmed by thestatistical analysis. A higher malaria incidence wasassociated with morechena and less paddy cultiva-tion, higher forest coverage, more families receivingfood subsidies, a larger area covered by abandonedtanks, and more than median rainfall (Table 1). Fur-thermore, high incidence was associated with areaswhere residual insecticide spraying by the AMCtook place. As pointed out previously only limitedspray data were available (GNDs were categorized assprayed or not-sprayed, and details of frequency andextent of coverage within a GND were not available),and no conclusions regarding the effectiveness of thestrategy can be drawn from the statistical analysis.
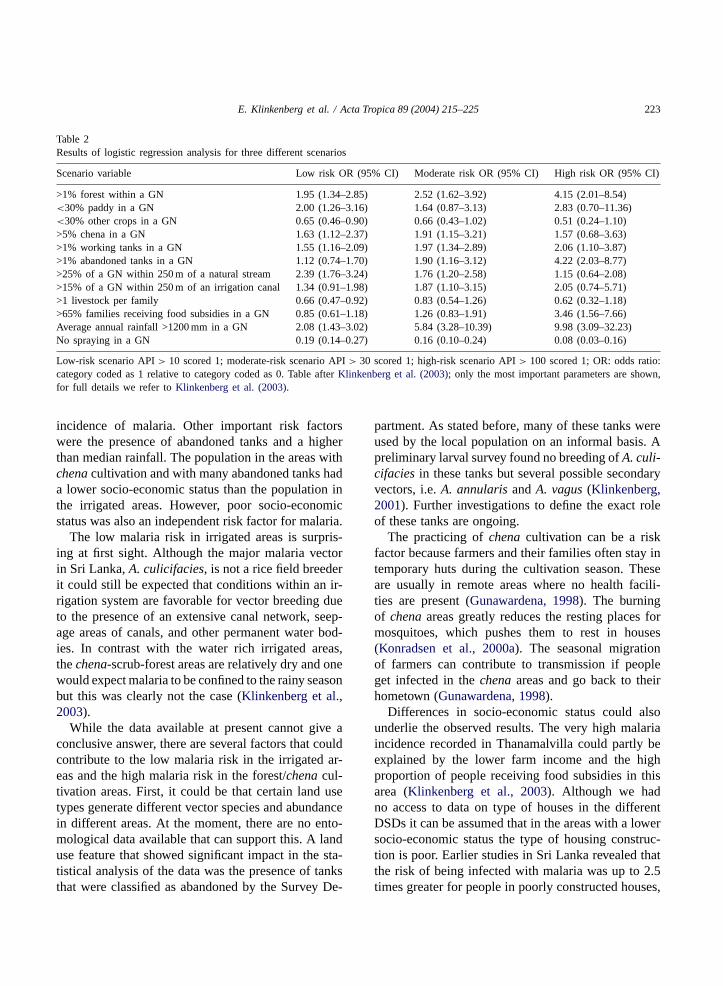
The variables entered in the logistic regressionmodel explained about 40% of the variation in malariaincidence at the GND level. Therefore, these vari-ables were insufficient to build a predictive model, asa large part of the variation in malaria incidence ratesremained unexplained. Different parameters becamemore or less important with the scenario changingfrom low to high risk. Average rainfall of >1200 mmand >1% forest coverage were the most important pa-rameters that were significant at all levels (low, mod-erate and high) of malaria risk (Table 2). Abandonedtanks were clearly more important in the high-riskscenario, as was the percentage of families receivingfood subsidies.
4. Discussion
One of the major concerns in a study of this na-ture is the quality of the malaria data recorded atgovernment facilities. There is a high acceptance of
220 E. Klinkenberg et al. / Acta Tropica 89 (2004) 215–225
Fig. 2. Malaria incidence in 4 different years at GN level for the Uda Walawe region, Sri Lanka.
E. Klinkenberg et al. / Acta Tropica 89 (2004) 215–225 221
Fig. 2. (Continued ).
222 E. Klinkenberg et al. / Acta Tropica 89 (2004) 215–225
Table 1Risk factors for malaria in Uda Walawe at the level of the GND with incidence rates (IR), incidence rate ratios (IRRs), and 95% confidenceintervals for the IRR (95% CI)
Risk factors Categories n IR IRR 95% CI
Land useArea covered by grass, scrubland and barren land <3% 868 16.6 1.00
≥3% 725 34.6 2.09 (2.07–2.11)
Area covered by forest <1% 1341 14.8 1.00≥1% 252 78.1 5.29 (5.23–5.34)
Area covered by paddy ≤30% 816 36.3 1.00>30% 777 7.5 0.21 (0.20–0.21)
Area covered bychena <5% 881 9.4 1.00≥5% 712 35.9 3.83 (3.80–3.86)
Area covered by abandoned tanks ≤1% 1332 16.4 1.00>1% 261 65.0 3.96 (3.92–4.00)
Land area at less than 250m of a natural stream ≥25% 810 21.3 1.00>25% 783 27.4 1.29 (1.27–1.30)
Socio-economic statusAverage number of livestock per family <1 1035 20.3 1.00
≥1 558 36.0 1.77 (1.75–1.80)
Families receiving food subsidies ≤65% 810 15.2 1.00>65% 783 34.8 2.28 (2.26–2.30)
Families having electricity ≥5% 774 18.8 1.00<5% 819 30.6 1.63 (1.61–1.64)
Meteorological dataAnnual rainfall ≤1200 mm 783 5.3 1.00
>1200 mm 810 36.0 6.76 (6.71–6.81)
Mosquito controlSpraying activities Sprayed 414 52.2 1.00
Not sprayed 1179 10.3 0.20 (0.19–0.20)
n: number of Grama Niladhari Divisions (GNDs) whereby the unit of observation was a GND in a particular year between 1991 and 1999;IR: malaria incidence per 1000 inhabitants; IRR: incidence rate ratio or relative risk with 1.00 for the reference category.
blood-filming by the population in Sri Lanka andmicroscopists are generally available at governmenthealth centers, resulting in about 70% of reportedcases being microscopically confirmed. Diagnosisand treatment at private health facilities (whose dataare not included in national statistics), and the lesscommon phenomenon of self-diagnosis and treatmentare sources of underestimation of real incidence. Casedata from health facilities are not corrected for re-crudescence ofP. falciparum or relapse ofP. vivax,and this is a source of overestimation of incidence(Briet et al., 2003). There are also the limitations ofthe data used as covariates, which, apart from landuse (available for more than 1 year) and meteorology
(available monthly for the 10 years), were availableonly for 1 year. Thus, statistical analyses had to bebased on assumptions that malaria data were inde-pendent between years, and that geographic variationamong covariates did not change from year to year.These limitations could have been contributories tothe overall low reliability of the multivariate analysis(only 40% of variation explained by the model).
This study showed a consistent pattern of malariaincidence in the Uda Walawe area over the pe-riod 1991–2000 with highest risk for malaria in thenon-irrigated areas that had a relatively large propor-tion of land under forest cover andchena cultivation.Irrigated rice cultivation areas had a generally low
E. Klinkenberg et al. / Acta Tropica 89 (2004) 215–225 223
Table 2Results of logistic regression analysis for three different scenarios
Scenario variable Low risk OR (95% CI) Moderate risk OR (95% CI) High risk OR (95% CI)
>1% forest within a GN 1.95 (1.34–2.85) 2.52 (1.62–3.92) 4.15 (2.01–8.54)<30% paddy in a GN 2.00 (1.26–3.16) 1.64 (0.87–3.13) 2.83 (0.70–11.36)<30% other crops in a GN 0.65 (0.46–0.90) 0.66 (0.43–1.02) 0.51 (0.24–1.10)>5% chena in a GN 1.63 (1.12–2.37) 1.91 (1.15–3.21) 1.57 (0.68–3.63)>1% working tanks in a GN 1.55 (1.16–2.09) 1.97 (1.34–2.89) 2.06 (1.10–3.87)>1% abandoned tanks in a GN 1.12 (0.74–1.70) 1.90 (1.16–3.12) 4.22 (2.03–8.77)>25% of a GN within 250 m of a natural stream 2.39 (1.76–3.24) 1.76 (1.20–2.58) 1.15 (0.64–2.08)>15% of a GN within 250 m of an irrigation canal 1.34 (0.91–1.98) 1.87 (1.10–3.15) 2.05 (0.74–5.71)>1 livestock per family 0.66 (0.47–0.92) 0.83 (0.54–1.26) 0.62 (0.32–1.18)>65% families receiving food subsidies in a GN 0.85 (0.61–1.18) 1.26 (0.83–1.91) 3.46 (1.56–7.66)Average annual rainfall >1200 mm in a GN 2.08 (1.43–3.02) 5.84 (3.28–10.39) 9.98 (3.09–32.23)No spraying in a GN 0.19 (0.14–0.27) 0.16 (0.10–0.24) 0.08 (0.03–0.16)
Low-risk scenario API> 10 scored 1; moderate-risk scenario API> 30 scored 1; high-risk scenario API> 100 scored 1; OR: odds ratio:category coded as 1 relative to category coded as 0. Table afterKlinkenberg et al. (2003); only the most important parameters are shown,for full details we refer toKlinkenberg et al. (2003).
incidence of malaria. Other important risk factorswere the presence of abandoned tanks and a higherthan median rainfall. The population in the areas withchena cultivation and with many abandoned tanks hada lower socio-economic status than the population inthe irrigated areas. However, poor socio-economicstatus was also an independent risk factor for malaria.
The low malaria risk in irrigated areas is surpris-ing at first sight. Although the major malaria vectorin Sri Lanka,A. culicifacies, is not a rice field breederit could still be expected that conditions within an ir-rigation system are favorable for vector breeding dueto the presence of an extensive canal network, seep-age areas of canals, and other permanent water bod-ies. In contrast with the water rich irrigated areas,thechena-scrub-forest areas are relatively dry and onewould expect malaria to be confined to the rainy seasonbut this was clearly not the case (Klinkenberg et al.,2003).
While the data available at present cannot give aconclusive answer, there are several factors that couldcontribute to the low malaria risk in the irrigated ar-eas and the high malaria risk in the forest/chena cul-tivation areas. First, it could be that certain land usetypes generate different vector species and abundancein different areas. At the moment, there are no ento-mological data available that can support this. A landuse feature that showed significant impact in the sta-tistical analysis of the data was the presence of tanksthat were classified as abandoned by the Survey De-
partment. As stated before, many of these tanks wereused by the local population on an informal basis. Apreliminary larval survey found no breeding ofA. culi-cifacies in these tanks but several possible secondaryvectors, i.e.A. annularis andA. vagus (Klinkenberg,2001). Further investigations to define the exact roleof these tanks are ongoing.
The practicing ofchena cultivation can be a riskfactor because farmers and their families often stay intemporary huts during the cultivation season. Theseare usually in remote areas where no health facili-ties are present (Gunawardena, 1998). The burningof chena areas greatly reduces the resting places formosquitoes, which pushes them to rest in houses(Konradsen et al., 2000a). The seasonal migrationof farmers can contribute to transmission if peopleget infected in thechena areas and go back to theirhometown (Gunawardena, 1998).
Differences in socio-economic status could alsounderlie the observed results. The very high malariaincidence recorded in Thanamalvilla could partly beexplained by the lower farm income and the highproportion of people receiving food subsidies in thisarea (Klinkenberg et al., 2003). Although we hadno access to data on type of houses in the differentDSDs it can be assumed that in the areas with a lowersocio-economic status the type of housing construc-tion is poor. Earlier studies in Sri Lanka revealed thatthe risk of being infected with malaria was up to 2.5times greater for people in poorly constructed houses,
224 E. Klinkenberg et al. / Acta Tropica 89 (2004) 215–225
with thatched roofs and mud walls than for peoplein better constructed houses (Gamage-Mendis et al.,1991; Gunawardena et al., 1998; Konradsen et al.,2000a, 2003). The importance of socio-economicstatus in malaria transmission in Sri Lanka was alsostressed by other authors (Pinikahana, 1992; van derHoek et al., 1998). The importance of socio-economicstatus and housing in determining malaria risk con-firms, once again, that with the economic develop-ment of an area the malaria situation and the healthstatus in general also would improve.
The observed risk factors and differences in malariapatterns can have important implications for the cur-rent control strategy. If secondary vectors likeA. va-gus and A. annularis are confirmed to be importantfrom an epidemiological point of view, then the in-door residual spraying would not be very effectivebecause these are outdoor biting and resting species.At present, there is some circumstantial evidence thatA. vagus may be an epidemiologically important vec-tor in southern Sri Lanka (Pathinayake, 1997). Thisstudy, therefore, highlights the importance of collect-ing entomological data on a regular basis to explainthe malaria pattern and thus assist in control.
The analysis of malaria data in the Uda Walawe areashowed a consistent spatial pattern over 10 years ofobservation with high risk in non-irrigated areas thatwere dominated by forest and slash and burn cultiva-tion, and a much lower risk in irrigated paddy culti-vation areas. Additionally, the data showed an over-all temporal pattern of a small but steady decline inmalaria incidence during the 10 year study period.Briet et al. (2003)have shown that the island-widetrend during the 1995–2002 period was an increase inincidence upto 2000 and a sharp decrease thereafter.The island-wide increase during 1995–2000 was notreflected in the Uda Walawe area. At present, it is onlypossible to speculate that the decreased incidence atUda Walawe may have been due to local vector trans-mission dynamics, more effective malaria control, orimproved socio-economic condition, or a combinationof all of these.
Acknowledgements
The authors wish to thank Gayathri Jayasinghe, LalMuthuwatta and Dissanayake M. Gunawardena for
their contribution to the study. The assistance in thefield of Ravi Kurunarathne, Indrajith Gamage, SarathLionalratne and Chandini Deepika was indispensableas through their persistence most villages could be lo-cated. The maps were digitized by Sarath Gunasingheand A.D. Ranjith. Database management and sup-port services were provided by Mala Ranawake andSepali Goonaratne. We appreciate the help with thedifferent coordinate systems of Mr. Perakum Shantaof the Survey Department. We further acknowledgethe importance of discussions that were held with Mr.Jayasinghe, director of the Land Use Policy PlanningDivision, Ms. Priyanthi of the Mapping Division,Ms. Chandra Liyanage, land use officer of RatnapuraDistrict, Ms. Ruchira Wickremaratne, land use officerof Hambantota District, and Mr. Dayaratna, land useofficer of Moneragala District.
References
Abeysekera, T., Wickremasinghe, A.R., Gunawardena, D.M.,Mendis, K.N., 1997. Optimizing the malaria data recordingsystem through a study of case detection and treatment in SriLanka. Trop. Med. Int. Health 2, 1057–1067.
Amerasinghe, F.P., Ariyasena, T.G., 1990. Larval survey of surfacewater-breeding mosquitoes during irrigation development in theMahaweli project, Sri Lanka. J. Med. Entomol. 27, 789–802.
Amerasinghe, F.P., Amerasinghe, P.H., Peiris, J.S.M., Wirtz, R.,1991. Anopheline ecology and malaria infection during theirrigation development of an area of the Mahaweli project, SriLanka. Am. J. Trop. Med. Hyg. 45, 226–235.
Amerasinghe, F.P., Amerasinghe, P.H., Wirtz, R., Indrajith,N.G., Somapala, W., Pereira, L.R., Rathnayake, A.M.S.,1992. Malaria transmission by Anopheles subpictus (Diptera:Culicidae) in a new irrigation project in Sri Lanka. J. Med.Entomol. 29, 577–581.
Amerasinghe, F.P., Indrajith, N.G., 1994. Postirrigation breedingpatterns of surface water mosquitoes in the Mahaweli project,Sri Lanka, and comparisons with preceding developmentalphases. J. Med. Entomol. 31, 516–523.
Amerasinghe, F.P., Konradsen, F., van der Hoek, W., Amerasinghe,P.H., Gunawardena, J.P.W., Fonseka, K.T., Jayasinghe, G.,2001. Small Irrigation Tanks as a Source of Malaria MosquitoVectors: A Study in North-Central Sri Lanka. Research Report57. International Water Management Institute, Colombo, SriLanka.
Birley, M.H., 1991. Guidelines for Forecasting the Vector-BorneDisease Implications of Water Resources Development. PEEMGuidelines Series no. 2, World Health Organization, Geneva.
Briet, O.T.J., Gunawardena, D.M., van der Hoek, W., Amerasinghe,F.P., 2003. Sri Lanka malaria maps. Malaria J. 2, 22 (22 July2003, available fromhttp://www.malariajournal.com).

E. Klinkenberg et al. / Acta Tropica 89 (2004) 215–225 225
Gamage-Mendis, A.C., Carter, R., Mendis, C., De Zoysa, A.P.K.,Herath, P.R.J., Mendis, K.N., 1991. Clustering of malariainfection within an endemic population: risk of malariaassociated with the type of housing construction. Am. J.Trop. Med. Hyg. 45, 77–85.
Gunawardena, D.M.A., 1998. microepidemiological study ofmalaria in southern Sri Lanka, including aspects of clinicaldisease and immunity. PhD thesis, University of Colombo, SriLanka.
Gunawardena, D.M., Wickremasinghe, A.R., Muthuwatta, L.,Weerasingha, S., Rajakaruna, J., Senanayaka, T., Kotta, P.K.,Attanyaka, N., Carter, R., Mendis, K.N., 1998. Malaria riskfactors in an endemic region of Sri Lanka, and the impactand cost implications of risk-factor based interventions. Am.J. Trop. Med. Hyg. 58, 533–542.
Ijumba, J.N., Lindsay, S.W., 2001. Impact of irrigation on malariain Africa: paddies paradox. Med. Vet. Entomol. 15, 1–11.
Jobin, W., 1999. Dams and Disease: Ecological Design and HealthImpacts of Large Dams, Canals and Irrigation Systems. E&FNSpon, London, New York.
Klinkenberg, E. (Ed.), 2001. Malaria risk mapping in SriLanka—results from the Uda Walawe area. In: Proceedings ofa Workshop held in Embilipitiya, Sri Lanka, 29 March 2001.IWMI Working Paper 21. International Water ManagementInstitute, Colombo, Sri Lanka.
Klinkenberg, E., van der Hoek, W., Amerasinghe, F.P., Jayasinghe,G., Muthuwatta, L., Gunawardena, D.M., 2003. Malariaand Agriculture, a Spatial and Temporal Risk Analysis inSouthern Sri Lanka. Research Report 68, International WaterManagement Institute, Colombo, Sri Lanka.
Konradsen, F., van der Hoek, W., Amerasinghe, P.H., Amerasinghe,F.P., Fonseka, K.T., 1997. Household responses to malaria andtheir costs: a study from rural Sri Lanka. Trans. R. Soc. Trop.Med. Hyg. 91, 127–130.
Konradsen, F., Amerasinghe, F.P., van der Hoek, W., Amerasinghe,P.H., 2000a. Malaria in Sri Lanka: Current Knowledge onTransmission and Control. International Water ManagementInstitute, Colombo, Sri Lanka.
Konradsen, F., Amerasinghe, P.H., Perera, D., van der Hoek,W., Amerasinghe, F.P., 2000b. A village treatment center formalaria: community response in Sri Lanka. Soc. Sci. Med. 50,879–889.
Konradsen, F., Amerasinghe, P.H., van der Hoek, W., Amerasinghe,F.P., Perera, D., Piyaratne, M., 2003. Strong association
between house characteristics and malaria vectors in Sri Lanka.Am. J. Trop. Med. Hyg. 68, 177–181.
Mendis, C., 1990. Characteristics of malaria transmission inKataragama, Sri Lanka: a focus for immuno-epidemiologicalstudies. Am. J. Trop. Med. Hyg. 42, 298–308.
Oomen, J.M.V., Wolf, J. de, Jobin, W.R., 1990. Health andIrrigation. Publication 45, International Institute for LandReclamation and Improvement, Wageningen, The Netherlands.
Pathinayake, S.W., 1997. Investigation in to the malaria epidemicof Pasgoda DDHS area. J. Ruhunu Clin. Soc. 4, 14–18.
Pinikahana, J., 1992. Socio-cultural factors associated with malariatransmission: a review. Indian J. Malariol. 29, 121–126.
Ramasamy, R., De Alwis, R., Wijesundere, A., Ramasamy, M.S.,1992. Malaria transmission at a new irrigation project in SriLanka: the emergence ofAnopheles annularis as a major vector.Am. J. Trop. Med. Hyg. 47, 547–553.
Rothman, K.J., 1986. Modern Epidemiology. Little Brown, USA,358 p.
SAPI, 2000. Special Assistance for Project Implementation (SAPI)for Walawe Left Bank Irrigation Upgrading and ExtensionProject: Water Balance Study Report. Report Prepared by SAPITeam for Japanese Bank for International Cooperation (JBIC),70 p.
Service, M.W., 1997. An overview of vector-borne diseasesassociated with irrigation. In: Konradsen, F., van der Hoek, W.(Eds.), Health and Irrigation: Proceedings of the CopenhagenWorkshop on Health and Irrigation. International IrrigationManagement Institute, Danish Bilharziasis Laboratory.
SL/JICA, 1993. Feasibility Study on Walawe Irrigation Upgradingand Extension Project, Volume II. Agriculture and Irrigation.January 1993. Democratic Socialist Republic of Sri Lanka,Ministry of Lands, Irrigation and Mahaweli Development,Japan International Cooperation Agency.
Tiffen, M., 1991. Guidelines for the Incorporation of HealthSafeguards into Irrigation Projects through IntersectoralCooperation. PEEM Guidelines Series no. 1, WHO, Geneva.
van der Hoek, W., Konradsen, F., Dijkstra, D.S., Amerasinghe,P.H., Amerasinghe, F.P., 1998. Risk factors for malaria: amicroepidemiological study in a village in Sri Lanka. Trans.R.. Soc. Trop. Med. Hyg. 92, 265–269.
van der Hoek, W., Konradsen, F., Amerasinghe, P.H., Perera, D.,Piyaratne, M.K., Amerasinghe, F.P., 2003. Towards a risk mapof malaria for Sri Lanka: the importance of house locationrelative to vector breeding sites. Int. J. Epidemiol. 32, 280–285.
Related Documents