APOS Trends in Orthodontics | January 2013 | Vol 3 | Issue 1 23 Address for correspondence: Dr. Naveen Rayapudi, Department of Orthodontics, Mamata Dental College, Giriprasad Nagar, Khammam, Andhra Pradesh, India. E‑mail: [email protected] A comparative study of linear measurements of facial skeleton using computed tomography and traditional cephalometry Naveen Rayapudi, Padmalatha Challa, Chandra Sekhar Gandikota, Yudhistar P. V. 1 , Saritha Tircoveluri Department of Orthodontics, Mamata Dental College, Khammam, 1 Department of Orthodontics, Panineeya Dental College, Hyderabad, Andhra Pradesh, India Abstract Background: Radiographic imaging is an important adjunct in the assessment of skeletal and dental relationships for the orthodontic patient. Imaging is one of the most ubiquitous tools used by orthodontists to measure and record the size and form of craniofacial structures. Materials and Methods: The objectives of the study were to compare the measurements from human skulls and their images from cephalometric radiographs and computed tomography (CT) scanograms in order to gauge the potential use of CT in routine clinical practice. Based on the specific criteria including stable occlusion and condyles fitting stably in glenoid fossa, 15 dry human skulls were selected. Lateral, posteroanterior cephalograms, and CT scout views were taken of each skull by standardized methods. Linear measurements were made on all three records. Intraclass correlation coefficients, Pearson’s correlation coefficient and regression constant were calculated to assess the records. Results: The linear measurements of the cephalometric record are greater than CT measurements on scout images. In vertical plane, the CT projections are more coinciding with the direct skull measurements. In sagittal and transverse planes, the cephalometric measurements were more correlating with the direct skull measurements. Conclusions: The cephalograms and CT scanograms differed in accuracy of linear measurements, because of variation in the location and size of an object, within the imaged 3D structure of both records. Key words: CT scan, cephalograms, skull measurements, scanograms Access this article online Quick Response Code: Website: www.apospublications.com DOI: 10.4103/2321‑1407.111140 INTRODUCTION Radiographic imaging is an important adjunct in the assessment of skeletal and dental relationships for the orthodontic patient. Imaging is one of the most ubiquitous tools used by orthodontists to measure and record the size and form of craniofacial structures. Imaging has been used to record the status quo of limited or grouped anatomic structures. Despite the diverse image acquisition technologies currently available, standards have been adopted in an effort to balance the anticipated benefits with associated costs and risks. The erroneous assumptions inherent in traditional 2D cephalometry questioned the method for deriving clinical information as a basis for planning treatment. [1‑3] The most significant is that a conventional head film is a 2D representation of and horizontally in proportion to their distances from the film or recording plane. [4] Despite these limitations, many cephalometric analyses have been developed to help diagnose skeletal malocclusions and dentofacial deformities. The scientific value of these analyses was questioned by Han et al. [5] Vig [6] doubted the lack of validity that Original Article [Downloaded free from http://www.apospublications.com on Saturday, June 15, 2013, IP: 117.213.170.100] || Click here to download free Android application fo journal

Welcome message from author
This document is posted to help you gain knowledge. Please leave a comment to let me know what you think about it! Share it to your friends and learn new things together.
Transcript
APOS Trends in Orthodontics | January 2013 | Vol 3 | Issue 1 23
Address for correspondence: Dr. Naveen Rayapudi, Department of Orthodontics, Mamata Dental College, Giriprasad Nagar, Khammam, Andhra Pradesh, India. E‑mail: [email protected]
A comparative study of linear measurements of facial skeleton using computed tomography and traditional cephalometry
Naveen Rayapudi, Padmalatha Challa,
Chandra Sekhar Gandikota, Yudhistar P. V.1,
Saritha Tircoveluri
Department of Orthodontics, Mamata Dental College, Khammam,
1Department of Orthodontics, Panineeya Dental College,
Hyderabad, Andhra Pradesh, India
AbstractBackground: Radiographic imaging is an important adjunct in the assessment of skeletal and dental relationships for the orthodontic patient. Imaging is one of the most ubiquitous tools used by orthodontists to measure and record the size and form of craniofacial structures. Materials and Methods: The objectives of the study were to compare the measurements from human skulls and their images from cephalometric radiographs and computed tomography (CT) scanograms in order to gauge the potential use of CT in routine clinical practice. Based on the specific criteria including stable occlusion and condyles fitting stably in glenoid fossa, 15 dry human skulls were selected. Lateral, posteroanterior cephalograms, and CT scout views were taken of each skull by standardized methods. Linear measurements were made on all three records. Intraclass correlation coefficients, Pearson’s correlation coefficient and regression constant were calculated to assess the records. Results: The linear measurements of the cephalometric record are greater than CT measurements on scout images. In vertical plane, the CT projections are more coinciding with the direct skull measurements. In sagittal and transverse planes, the cephalometric measurements were more correlating with the direct skull measurements. Conclusions: The cephalograms and CT scanograms differed in accuracy of linear measurements, because of variation in the location and size of an object, within the imaged 3D structure of both records.
Key words: CT scan, cephalograms, skull measurements, scanograms
Access this article onlineQuick Response Code:
Website:
www.apospublications.com
DOI:
10.4103/2321‑1407.111140
INTRODUCTION
Radiographic imaging is an important adjunct in the assessment of skeletal and dental relationships for the orthodontic patient. Imaging is one of the most ubiquitous tools used by orthodontists to measure and record the size and form of craniofacial structures.
Imaging has been used to record the status quo of limited or grouped anatomic structures. Despite the diverse image acquisition technologies currently available, standards have been adopted in an effort to balance the anticipated benefits with associated costs and risks. The erroneous assumptions inherent in traditional 2D cephalometry questioned the method for deriving clinical information as a basis for planning treatment.[1‑3]
The most significant is that a conventional head film is a 2D representation of and horizontally in proportion to their distances from the film or recording plane. [4] Despite these limitations, many cephalometric analyses have been developed to help diagnose skeletal malocclusions and dentofacial deformities. The scientific value of these analyses was questioned by Han et al.[5] Vig[6] doubted the lack of validity that
Original Article
[Downloaded free from http://www.apospublications.com on Saturday, June 15, 2013, IP: 117.213.170.100] || Click here to download free Android application for thisjournal
Naveen, et al.: CT Scanogram vs cephalogram
APOS Trends in Orthodontics | January 2013 | Vol 3 | Issue 124
cephalometric radiographs as a diagnostic instrument, and demonstrated that conclusions drawn on the basis of the same cephalograms may vary significantly depending on the analyses used. The cumulative errors associated with traditional 2D cephalometry have been significant enough to affect diagnosis and treatment planning.[7]
Objectives of the study• To compare the accuracy of linear measurements
made from the topographic images of the computed tomography to direct skull measurements.
• To compare the accuracy of linear measurements made from the lateral cephalogram and posteroanterior cephalograms to direct skull measurements.
MATERIALS AND METHODS
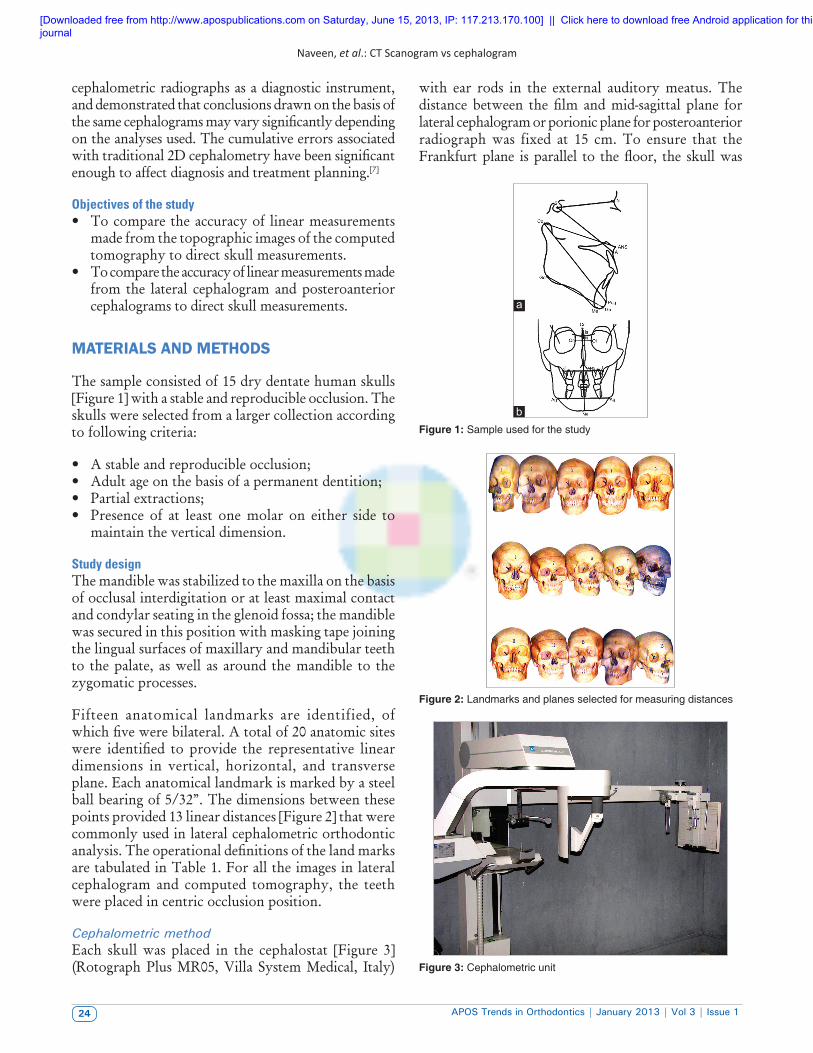
The sample consisted of 15 dry dentate human skulls [Figure 1] with a stable and reproducible occlusion. The skulls were selected from a larger collection according to following criteria:
• A stable and reproducible occlusion;• Adult age on the basis of a permanent dentition; • Partial extractions;• Presence of at least one molar on either side to
maintain the vertical dimension.
Study designThe mandible was stabilized to the maxilla on the basis of occlusal interdigitation or at least maximal contact and condylar seating in the glenoid fossa; the mandible was secured in this position with masking tape joining the lingual surfaces of maxillary and mandibular teeth to the palate, as well as around the mandible to the zygomatic processes.
Fifteen anatomical landmarks are identified, of which five were bilateral. A total of 20 anatomic sites were identified to provide the representative linear dimensions in vertical, horizontal, and transverse plane. Each anatomical landmark is marked by a steel ball bearing of 5/32”. The dimensions between these points provided 13 linear distances [Figure 2] that were commonly used in lateral cephalometric orthodontic analysis. The operational definitions of the land marks are tabulated in Table 1. For all the images in lateral cephalogram and computed tomography, the teeth were placed in centric occlusion position.
Cephalometric methodEach skull was placed in the cephalostat [Figure 3] (Rotograph Plus MR05, Villa System Medical, Italy)
with ear rods in the external auditory meatus. The distance between the film and mid‑sagittal plane for lateral cephalogram or porionic plane for posteroanterior radiograph was fixed at 15 cm. To ensure that the Frankfurt plane is parallel to the floor, the skull was
Figure 2: Landmarks and planes selected for measuring distances
Figure 3: Cephalometric unit
Figure 1: Sample used for the study
a
b
[Downloaded free from http://www.apospublications.com on Saturday, June 15, 2013, IP: 117.213.170.100] || Click here to download free Android application for thisjournal
Naveen, et al.: CT Scanogram vs cephalogram
APOS Trends in Orthodontics | January 2013 | Vol 3 | Issue 1 25
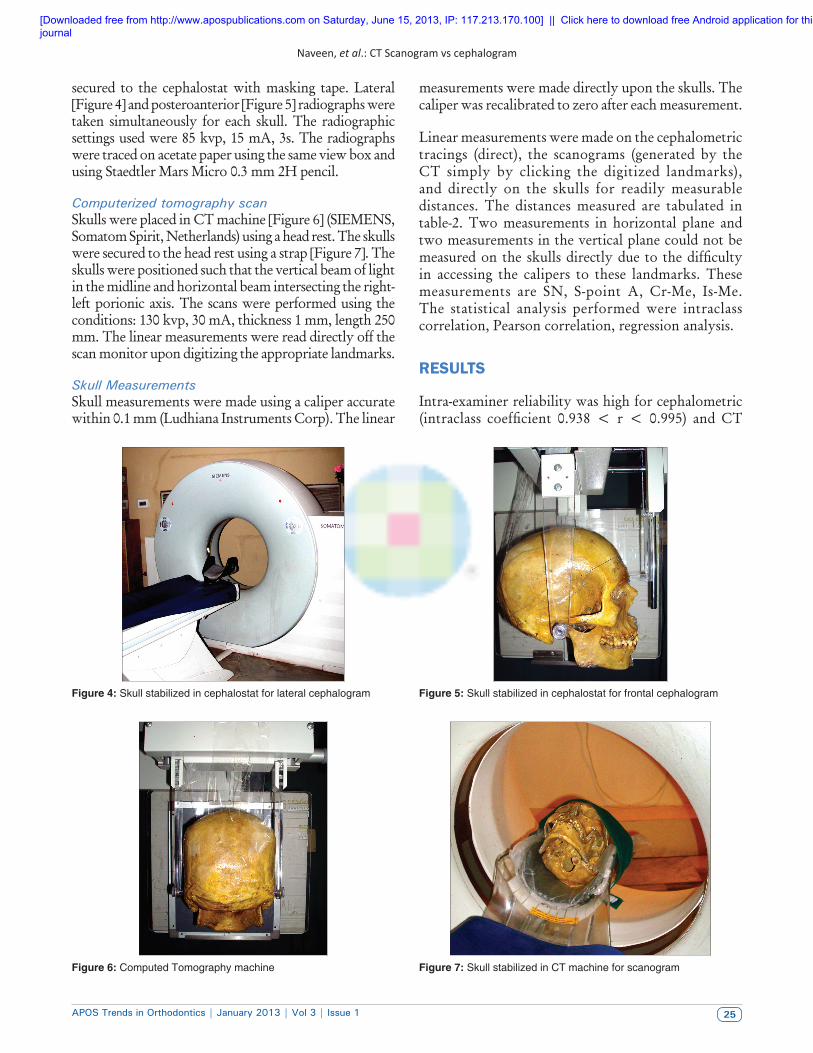
secured to the cephalostat with masking tape. Lateral [Figure 4] and posteroanterior [Figure 5] radiographs were taken simultaneously for each skull. The radiographic settings used were 85 kvp, 15 mA, 3s. The radiographs were traced on acetate paper using the same view box and using Staedtler Mars Micro 0.3 mm 2H pencil.
Computerized tomography scanSkulls were placed in CT machine [Figure 6] (SIEMENS, Somatom Spirit, Netherlands) using a head rest. The skulls were secured to the head rest using a strap [Figure 7]. The skulls were positioned such that the vertical beam of light in the midline and horizontal beam intersecting the right‑left porionic axis. The scans were performed using the conditions: 130 kvp, 30 mA, thickness 1 mm, length 250 mm. The linear measurements were read directly off the scan monitor upon digitizing the appropriate landmarks.
Skull MeasurementsSkull measurements were made using a caliper accurate within 0.1 mm (Ludhiana Instruments Corp). The linear
measurements were made directly upon the skulls. The caliper was recalibrated to zero after each measurement.
Linear measurements were made on the cephalometric tracings (direct), the scanograms (generated by the CT simply by clicking the digitized landmarks), and directly on the skulls for readily measurable distances. The distances measured are tabulated in table‑2. Two measurements in horizontal plane and two measurements in the vertical plane could not be measured on the skulls directly due to the difficulty in accessing the calipers to these landmarks. These measurements are SN, S‑point A, Cr‑Me, Is‑Me. The statistical analysis performed were intraclass correlation, Pearson correlation, regression analysis.
RESULTS
Intra‑examiner reliability was high for cephalometric (intraclass coefficient 0.938 < r < 0.995) and CT
Figure 4: Skull stabilized in cephalostat for lateral cephalogram Figure 5: Skull stabilized in cephalostat for frontal cephalogram
Figure 6: Computed Tomography machine Figure 7: Skull stabilized in CT machine for scanogram
[Downloaded free from http://www.apospublications.com on Saturday, June 15, 2013, IP: 117.213.170.100] || Click here to download free Android application for thisjournal
Naveen, et al.: CT Scanogram vs cephalogram
APOS Trends in Orthodontics | January 2013 | Vol 3 | Issue 126
scan (intraclass coefficient 0.921 < r < 0.997) linear measurements.
Analysis of measurements revealed highest intraclass correlations were observed for several midline (0.991 <
r < 0.995) and transverse (0.921 < r < 0.998) distances between CT and direct skull measurements with the greatest for N‑Me [Table 3] among vertical measurements.
For sagittal distances, the highest intraclass correlation was between the direct skull measure of Co‑Pog and
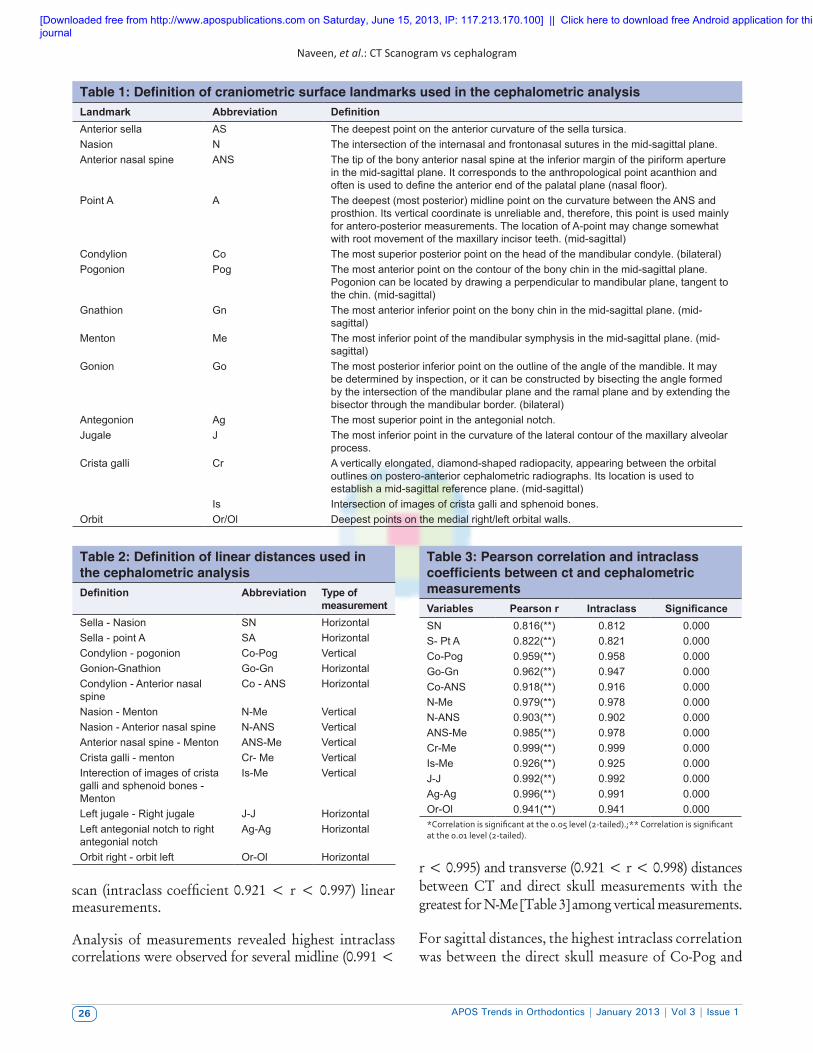
Table 1: Definition of craniometric surface landmarks used in the cephalometric analysisLandmark Abbreviation Definition Anterior sella AS The deepest point on the anterior curvature of the sella tursica.Nasion N The intersection of the internasal and frontonasal sutures in the mid‑sagittal plane.Anterior nasal spine ANS The tip of the bony anterior nasal spine at the inferior margin of the piriform aperture
in the mid‑sagittal plane. It corresponds to the anthropological point acanthion and often is used to define the anterior end of the palatal plane (nasal floor).
Point A A The deepest (most posterior) midline point on the curvature between the ANS and prosthion. Its vertical coordinate is unreliable and, therefore, this point is used mainly for antero‑posterior measurements. The location of A‑point may change somewhat with root movement of the maxillary incisor teeth. (mid‑sagittal)
Condylion Co The most superior posterior point on the head of the mandibular condyle. (bilateral)Pogonion Pog The most anterior point on the contour of the bony chin in the mid‑sagittal plane.
Pogonion can be located by drawing a perpendicular to mandibular plane, tangent to the chin. (mid‑sagittal)
Gnathion Gn The most anterior inferior point on the bony chin in the mid‑sagittal plane. (mid‑sagittal)
Menton Me The most inferior point of the mandibular symphysis in the mid‑sagittal plane. (mid‑sagittal)
Gonion Go The most posterior inferior point on the outline of the angle of the mandible. It may be determined by inspection, or it can be constructed by bisecting the angle formed by the intersection of the mandibular plane and the ramal plane and by extending the bisector through the mandibular border. (bilateral)
Antegonion Ag The most superior point in the antegonial notch.Jugale J The most inferior point in the curvature of the lateral contour of the maxillary alveolar
process.Crista galli Cr A vertically elongated, diamond‑shaped radiopacity, appearing between the orbital
outlines on postero‑anterior cephalometric radiographs. Its location is used to establish a mid‑sagittal reference plane. (mid‑sagittal)
Is Intersection of images of crista galli and sphenoid bones. Orbit Or/Ol Deepest points on the medial right/left orbital walls.
Table 2: Definition of linear distances used in the cephalometric analysisDefinition Abbreviation Type of
measurementSella ‑ Nasion SN HorizontalSella ‑ point A SA HorizontalCondylion ‑ pogonion Co‑Pog Vertical Gonion‑Gnathion Go‑Gn HorizontalCondylion ‑ Anterior nasal spine
Co ‑ ANS Horizontal
Nasion ‑ Menton N‑Me VerticalNasion ‑ Anterior nasal spine N‑ANS VerticalAnterior nasal spine ‑ Menton ANS‑Me VerticalCrista galli ‑ menton Cr‑ Me VerticalInterection of images of crista galli and sphenoid bones ‑ Menton
Is‑Me Vertical
Left jugale ‑ Right jugale J‑J HorizontalLeft antegonial notch to right antegonial notch
Ag‑Ag Horizontal
Orbit right ‑ orbit left Or‑Ol Horizontal
Table 3: Pearson correlation and intraclass coefficients between ct and cephalometric measurementsVariables Pearson r Intraclass SignificanceSN 0.816(**) 0.812 0.000S‑ Pt A 0.822(**) 0.821 0.000Co‑Pog 0.959(**) 0.958 0.000Go‑Gn 0.962(**) 0.947 0.000Co‑ANS 0.918(**) 0.916 0.000N‑Me 0.979(**) 0.978 0.000N‑ANS 0.903(**) 0.902 0.000ANS‑Me 0.985(**) 0.978 0.000Cr‑Me 0.999(**) 0.999 0.000Is‑Me 0.926(**) 0.925 0.000J‑J 0.992(**) 0.992 0.000Ag‑Ag 0.996(**) 0.991 0.000Or‑Ol 0.941(**) 0.941 0.000*Correlation is significant at the 0.05 level (2-tailed).;** Correlation is significant at the 0.01 level (2-tailed).
[Downloaded free from http://www.apospublications.com on Saturday, June 15, 2013, IP: 117.213.170.100] || Click here to download free Android application for thisjournal
Naveen, et al.: CT Scanogram vs cephalogram
APOS Trends in Orthodontics | January 2013 | Vol 3 | Issue 1 27
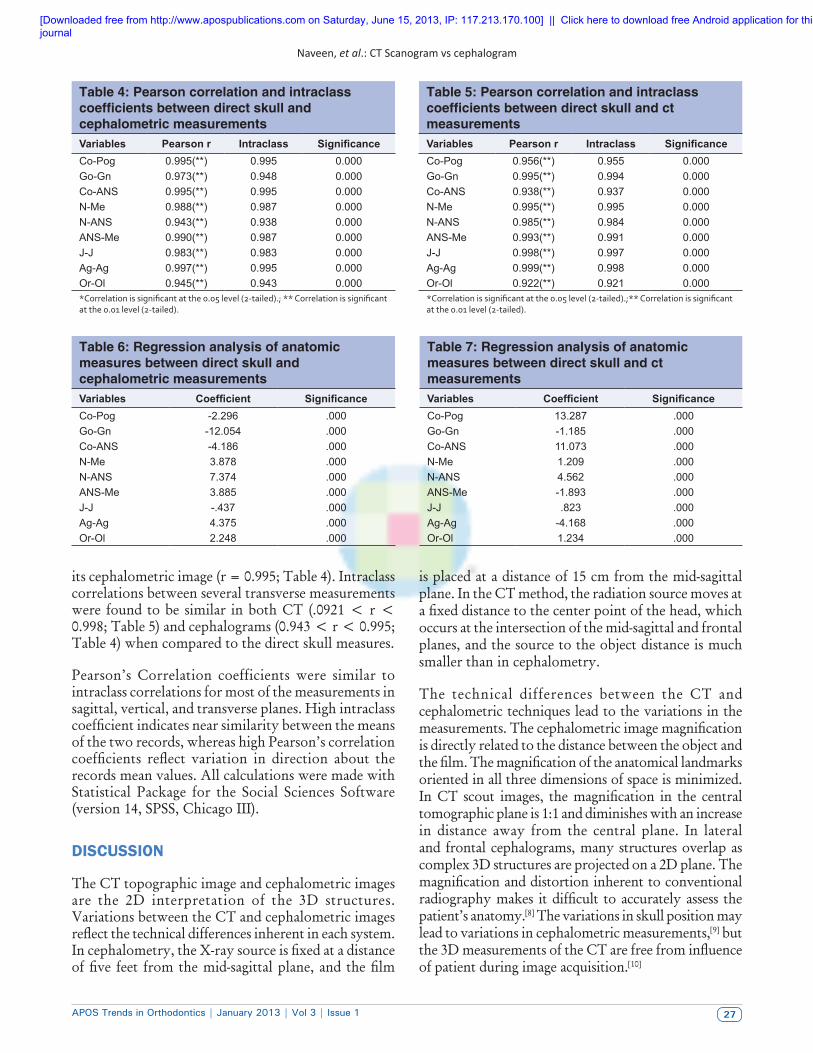
its cephalometric image (r = 0.995; Table 4). Intraclass correlations between several transverse measurements were found to be similar in both CT (.0921 < r < 0.998; Table 5) and cephalograms (0.943 < r < 0.995; Table 4) when compared to the direct skull measures.
Pearson’s Correlation coefficients were similar to intraclass correlations for most of the measurements in sagittal, vertical, and transverse planes. High intraclass coefficient indicates near similarity between the means of the two records, whereas high Pearson’s correlation coefficients reflect variation in direction about the records mean values. All calculations were made with Statistical Package for the Social Sciences Software (version 14, SPSS, Chicago III).
DISCUSSION
The CT topographic image and cephalometric images are the 2D interpretation of the 3D structures. Variations between the CT and cephalometric images reflect the technical differences inherent in each system. In cephalometry, the X‑ray source is fixed at a distance of five feet from the mid‑sagittal plane, and the film
is placed at a distance of 15 cm from the mid‑sagittal plane. In the CT method, the radiation source moves at a fixed distance to the center point of the head, which occurs at the intersection of the mid‑sagittal and frontal planes, and the source to the object distance is much smaller than in cephalometry.
The technical differences between the CT and cephalometric techniques lead to the variations in the measurements. The cephalometric image magnification is directly related to the distance between the object and the film. The magnification of the anatomical landmarks oriented in all three dimensions of space is minimized. In CT scout images, the magnification in the central tomographic plane is 1:1 and diminishes with an increase in distance away from the central plane. In lateral and frontal cephalograms, many structures overlap as complex 3D structures are projected on a 2D plane. The magnification and distortion inherent to conventional radiography makes it difficult to accurately assess the patient’s anatomy.[8] The variations in skull position may lead to variations in cephalometric measurements,[9] but the 3D measurements of the CT are free from influence of patient during image acquisition.[10]
Table 4: Pearson correlation and intraclass coefficients between direct skull and cephalometric measurementsVariables Pearson r Intraclass SignificanceCo‑Pog 0.995(**) 0.995 0.000Go‑Gn 0.973(**) 0.948 0.000Co‑ANS 0.995(**) 0.995 0.000N‑Me 0.988(**) 0.987 0.000N‑ANS 0.943(**) 0.938 0.000ANS‑Me 0.990(**) 0.987 0.000J‑J 0.983(**) 0.983 0.000Ag‑Ag 0.997(**) 0.995 0.000Or‑Ol 0.945(**) 0.943 0.000*Correlation is significant at the 0.05 level (2-tailed).; ** Correlation is significant at the 0.01 level (2-tailed).
Table 5: Pearson correlation and intraclass coefficients between direct skull and ct measurementsVariables Pearson r Intraclass SignificanceCo‑Pog 0.956(**) 0.955 0.000Go‑Gn 0.995(**) 0.994 0.000Co‑ANS 0.938(**) 0.937 0.000N‑Me 0.995(**) 0.995 0.000N‑ANS 0.985(**) 0.984 0.000ANS‑Me 0.993(**) 0.991 0.000J‑J 0.998(**) 0.997 0.000Ag‑Ag 0.999(**) 0.998 0.000Or‑Ol 0.922(**) 0.921 0.000*Correlation is significant at the 0.05 level (2-tailed).;** Correlation is significant at the 0.01 level (2-tailed).
Table 6: Regression analysis of anatomic measures between direct skull and cephalometric measurementsVariables Coefficient SignificanceCo‑Pog ‑2.296 .000Go‑Gn ‑12.054 .000Co‑ANS ‑4.186 .000N‑Me 3.878 .000N‑ANS 7.374 .000ANS‑Me 3.885 .000J‑J ‑.437 .000Ag‑Ag 4.375 .000Or‑Ol 2.248 .000
Table 7: Regression analysis of anatomic measures between direct skull and ct measurementsVariables Coefficient SignificanceCo‑Pog 13.287 .000Go‑Gn ‑1.185 .000Co‑ANS 11.073 .000N‑Me 1.209 .000N‑ANS 4.562 .000ANS‑Me ‑1.893 .000J‑J .823 .000Ag‑Ag ‑4.168 .000Or‑Ol 1.234 .000
[Downloaded free from http://www.apospublications.com on Saturday, June 15, 2013, IP: 117.213.170.100] || Click here to download free Android application for thisjournal
Naveen, et al.: CT Scanogram vs cephalogram
APOS Trends in Orthodontics | January 2013 | Vol 3 | Issue 128
In the present study, the linear measurements of the cephalometric record were greater than the corresponding CT measurements on scout images. In vertical plane, the CT projections are more coinciding as the distortion of CT in mid‑sagittal is 1:1. This findings correlates with the conclusions of Tng et al[11] that the distance between the N‑Me was invalid. The present data of increased vertical dimensions on lateral cephalograms is similar to the study presented by Chidac,[12] in which there was an increase of 8.5%. Recent study performed by Brown[13] showed similar increase of the vertical dimension of CT projections.
In sagittal plane, the cephalometric measurements were correlating more with the direct skull measurements in most of the planes. The Co‑Pog and Co‑ANS, which are in midline, represented the measurements in the mid‑sagittal plane of one right and one left image, yet the regression constant for these both planes are ‑2.296 and ‑4.186 [Table 6] indicating the amount of correction to be employed for these planes to get the actual skull measurements. The results obtained in Go‑Gn plane are different from Co‑Pog plane where the cephalometric measurement is larger than scout view; the skull measurement is larger than the both. This can be shown from the regression constant of ‑12.054 (table ‑ 6) for the cephalometric measures. The Go‑Gn values of the present study are very similar to the 3D volumetric rendering images of the study performed by Periago.[14] The SN plane and S‑Pt A in both CT and lateral cephalogram showed a good correlation [Table 3]. Periago[14] compared the accuracy of linear measurements using 3D volumetric rendering images. The mid‑sagittal plane measurement SN showed high correlation similar to the present study [Table 3]. Theoretically, the magnification and distortion of perspective projection should not affect the mid‑sagittal measurements. This was not the case for the current study. The possible reason was that the pattern of superimposing anatomy.
On posteroanterior records, the level of cephalometric distortion decreased for the structures closer to the film, which was placed 15 cm anterior to the porionic plane that is the frontal plane intersecting the external auditory meati. On CT scanograms, the level of distortion decreased as the structures approached the porionic plane. In both the techniques, the distortion levels differed with different planes. In a previous study, performed by Stefano cortello,[15] a uniform magnification factor was proposed for all the transverse measurements in spite of its relation to the reference planes. Ghafari[16] showed a uniform magnification factor and adopted fixed distance of 13 cm from mid‑
sagittal plane to film as a standard for posteroanterior cephalograms. The present study showed that the highest correlation among the transverse planes on CT scanograms was with Ag‑Ag (Table ‑ 5) as it is nearest to the porionic plane. The CT measurements in Or‑Ol plane is greater than the skull measurements [Table 5], whereas the cephalometric measurement is closer to the direct skull measurements [Table 4]. The increased Or‑Ol measurement in CT measurements is in correlation with the Mo‑Mo (medial orbital ‑ medial orbital) value of the study performed by Brown.[13] Hassan[17] performed a study to assess the accuracy of linear measurements on 3D surface rendered images generated from CT and also assessed the effect of head rotation on the linear measurements. The increase in the Or‑Ol measurement in present study is similar to the orbital left ‑ orbital right measurement in 2D tomographic slices of the study performed by Hassan,[17] though it is not statistically significant. Hutchinson[18] evaluated molar dimensional width correlation on CT scanograms and found correlation only on one side of arch only. The possible explanation was improper head positioning in the head holder of the panoramic unit. When this occurs, midline of patient is slightly turned to one side, resulting in magnification on that side.
The CT image underestimated the real distances in many of the measurements in a study conducted by Lascala,[19] Baumgaertel,[20] and Hilgers,[21] which are in accordance with the present study [Table 7]. Pinsky[22] investigated the accuracy of CT measurement in linear measurements of bone defects and concluded that CT can be accurate diagnostic tool for small osseous defects. This was in agreement with Periago[14] and the present study.
One potential explanation is that this error might have been introduced by the measurement software. Although the calliper measured the distance between the two anatomic points marked by steel balls, the software could have measured the distance between the most mesial and distal voxels of the volumetric image of the tooth. Because a voxel is a volume, the software defined the center of the volume from which to measure. In other words, the software might actually have measured the distance between the midpoints of the voxels.[20]
An alternate theory could also explain the decrease in the CT measurements. The partial volume effect, a common artifact in CT, can introduce imprecision to the digital image.[23,24] According to this theory, the measured values would be a function of the threshold settings in the software. A voxel can only show 1˚ of density. If a voxel lies completely within an object, it would reflect that object’s density. However, if a voxel
[Downloaded free from http://www.apospublications.com on Saturday, June 15, 2013, IP: 117.213.170.100] || Click here to download free Android application for thisjournal
Naveen, et al.: CT Scanogram vs cephalogram
APOS Trends in Orthodontics | January 2013 | Vol 3 | Issue 1 29
is at the junction of two objects of different densities—e.g., tooth and surrounding air—the voxel reflects an average value somewhere between the true values for enamel and air.[25] How dense it appears depends on the ratio of enamel to air in the voxel. Such a “hybrid voxel” can be interpreted as part of the tooth or part of the surrounding air depending on the threshold value. High threshold values, therefore, create smaller than actual objects and vice versa.
The magnif icat ion factor for conventional cephalograms is calculated by the distance between the source and the mid‑sagittal plane of the cephalostat (5 feet or 152.4 cm); the distance between the receptor and the mid‑sagittal distance (15 cm). [9] By this equation, the magnification factor for the cephalometric machine is 9.84%. The difference between the CT measurements and direct skull measurements was stated as follows, • Measurement error = CT measurements ‑ Direct
skull measurements; • Percentage error = (CT measurements ‑ Direct
skull measurements) / Direct skull measurement x 100(%).[26]
Conventional cephalometrics is a 2D representation of a 3D structure. This has disadvantages. It is possible to make 3D models of the skull and to perform 3D cephalometric analysis. In such an analysis, the actual anatomical structures can be identified instead of a 2D projection. In 2D anterior posterior radiology, positioning of the patient seems to give major difficulties. As long as a 2D projection of 3D scans is used for analysis, positioning the patient remains an important factor.[27]
The technical differences between the CT and cephalometric techniques lead to the variations in the measurements. The main advantage of CT over conventional cephalogram is enhanced sharpness, contrast, and reduced overlapping of the structures. The overall findings of our study favor the use of cephalograms for routine clinical purpose considering the logistic and economic considerations. The use of advanced technology like obtaining CT is stressed along with cephalogram to reduce the errors in image characteristics in cases requiring comprehensive orthodontic treatment plan.
CONCLUSION
The findings from the study can be concluded as:• There was a difference in the linear measurements of
facial skeleton measured on traditional cephalograms and CT scanograms.
• The technical differences between the CT and cephalometric techniques lead to the variations in the measurements.
• The cephalometric image magnification is directly related to the distance between the object and the film.
• The amount of distortion is not equal in all the anatomic planes and in both lateral cephalogram and posteroanterior cephalogram.
• The linear measurements of the cephalometric record are greater than the corresponding CT measurements on scout images.
• In vertical plane, the CT projections are more coinciding as the distortion of CT in mid‑sagittal is 1:1.
• In sagittal plane, the cephalometric measurements were more correlating with the direct skull measurements.
• The transverse measurements of cephalogram are more correlating to the direct skull measurements.
Scope for Further ResearchThe present study was performed comparing the cephalograms and CT scout views; further research has to be performed comparing the traditional cephalometry with 3 dimensional surface renderings of the 3D CT and also with Cone beam CT.
REFERENCES
1. BooksteinF.Thegeometryofcraniofacial invariants.AmJOrthod1983;83:221‑34.
2. Hixon E. The norm concept in cephalometrics. Am J Orthod1956;42:898‑906.
3. Moyers R, Bookstein F. The inappropriateness of conventionalcephalometrics.AmJOrthod1979;75:599‑617.
4. AthanasiouA. Orthodontic Cephalometry. London:Mosby‑Wolfe;1997.
5. Han U, Vig K, Weintraub J, Vig P, Kowalski C. Consistency oforthodontictreatmentdecisionsrelativetodiagnosticrecords.AmJOrthodDentofacialOrthop1991;100:212‑9.
6. Vig P. Orthodontic contraversies: Their origins, consequencesand resolution In: Melsen B, editor. Current Contraversies inOrthodontics.Chicago:QuintessencePublishing;1991.p.269‑310.
7. Gron P. A geometric evaluation of image size in dental radiography. JDentRes1960;39:289‑301.
8. Grayson B, Cutting C, Bookstein F, Kim H, McCarthy J. Thethreedimensional cephalogram: theory, technique, and clinical application.AmJOrthodDentofacialOrthop1988;94:327‑37.
9. KumarV,LudlowJ,MolA,CevidanesL.Comparisonofconventionaland cone beam CT synthesized cephalograms. DentomaxillofacRadiol2007;36:263‑9.
10. LasterW,LudlowJ,BaileyL,HersheyH.Accuracyofmeasurementsof mandibular anatomy and prediction of asymmetry in panoramic radiographicimages.DentomaxillofacRadiol2005;34:343‑9.
11. TT Tng, Chan T, Hagg U, Cooke M. Validity of cephalometriclandmarks.AnexperimentalstudyEuroJOrthod1994;16:110‑20.
12. ChidiacJ,ShoferF,Al‑KutoubiA,LasterL,GhafariJ.Comparison
[Downloaded free from http://www.apospublications.com on Saturday, June 15, 2013, IP: 117.213.170.100] || Click here to download free Android application for thisjournal

Naveen, et al.: CT Scanogram vs cephalogram
APOS Trends in Orthodontics | January 2013 | Vol 3 | Issue 130
of CT scanograms and cephalometric radiographs in craniofacial imaging.OrthodCraniofacialRes2002;5:104‑13.
13. BrownAA,ScarfeWC,ScheetzJP,SilveriaAM,FarmanAG.LinearAccuracyofConeBeamCTDerived3DImagesAngleOrthodontist2009;79:150‑7.
14. PeriagoDR,ScarfeWC,MoshiricM,ScheetzJP,SilveiraAM,FarmanAG. Linear accuracy and reliability of cone beam CT derived 3‑dimensional images constructed using an orthodontic volumetric renderingprogram.AngleOrthod2008;78:387‑95.
15. CortellaS,ShoferFS,GhafariJ.Transversedevelopmentofthejaws:Normsfortheposteroanteriorcephalometricanalysis.AmJOrthod1997;112:519‑22.
16. Ghafari, Cater, Shofer. Standardizing film‑object distance oncephalometricmeasurementsAmJOrthod1995;108:30‑7.
17. Hassan B, Stelt PV, Sanderink G. Accuracy of three‑dimensionalmeasurements obtained from cone beam computed tomography surface‑rendered images for cephalometric analysis: influence ofpatientscanningposition.EurJOrthod2008;31:129‑34.
18. Hutchinson S. Cone bean conputed tomography panoramic images vs. traditional panoramic radiographs Am J Orthod DentofacialOrthop2005;128:550.
19. LascalaC,PanellaJ,MarquesM.Analysisoftheaccuracyoflinearmeasurements obtained by cone beam computed tomography (CBCT‑NewTom).DentomaxillofacRadiol2004;33:291‑4.
20. Baumgaertel S,Palomo JM,PalomoL,HansdMG.Reliability andaccuracy of cone‑beam computed tomography dental measurements. AmJOrthodDentofacialOrthop2009;136:19‑28.
21. Hilgers M, Scarfe W, Scheetz J, Farman A. Accuracy of lineartemporomandibularjointmeasurementswithconebeamcomputed
tomography and digital cephalometric radiography.Am JOrthodDentofacialOrthop2005;128:803‑11.
22. PinskyH,DydaS,PinskyR,MischK,SarmentD.Accuracyofthree‑dimensional measurements using cone‑beam. DentomaxillofacRadiol2006;35:410‑6.
23. Schultz E, Felix R. Phantom measurements of spatial resolutionand the partial‑volume‑effect in computer tomography. RoFo1978;129:673‑8.
24. Glover G, Pelc N. Nonlinear partial volume artefacts in x‑raycomputedtomography.MedPhys1980;7:238‑48.
25. Schultz E, Felix R, Lackner K, Bergeder H, Thurn P. Imagecharacteristicsofthecomputertomograph.RoFo1979;130:479‑86.
26. BercoM,PaulH.RigaliJ,MinerRM,DeLucaS,AndersonNK,et al. Accuracy and reliability of linear cephalometric measurements from cone‑beamcomputedtomographyscansofadryhumanskull.AmJOrthodDentofacialOrthop2009;136:17.e1‑17.e9.
27. VlijmenOJCv,BergeSJ,BronkhorstEM,SwennenGR,KatsarosC,Kuijpers‑JagtmanAM.Acomparisonoffrontalradiographsobtainedfrom cone beam CT scans and conventional frontal radiographs of humanskulls.IntJOralMaxillofacSurg2009;38:773‑8.
How to cite this article: Rayapudi N, Challa P, Gandikota CS, Yudhistar PV, Tircoveluri S. A comparative study of linear measurements of facial skeleton using computed tomography and traditional cephalometry. APOS Trends Orthod 2013;3:23‑30.
Source of Support: Nil. Conflict of Interest: None declared.
Author Help: Reference checking facility
The manuscript system (www.journalonweb.com) allows the authors to check and verify the accuracy and style of references. The tool checks the references with PubMed as per a predefined style. Authors are encouraged to use this facility, before submitting articles to the journal.
• The style as well as bibliographic elements should be 100% accurate, to help get the references verified from the system. Even a single spelling error or addition of issue number/month of publication will lead to an error when verifying the reference.
• Example of a correct style Sheahan P, O’leary G, Lee G, Fitzgibbon J. Cystic cervical metastases: Incidence and diagnosis using fine needle aspiration biopsy.
Otolaryngol Head Neck Surg 2002;127:294-8. • Only the references from journals indexed in PubMed will be checked. • Enter each reference in new line, without a serial number.• Add up to a maximum of 15 references at a time.• If the reference is correct for its bibliographic elements and punctuations, it will be shown as CORRECT and a link to the correct
article in PubMed will be given.• If any of the bibliographic elements are missing, incorrect or extra (such as issue number), it will be shown as INCORRECT and link to
possible articles in PubMed will be given.
[Downloaded free from http://www.apospublications.com on Saturday, June 15, 2013, IP: 117.213.170.100] || Click here to download free Android application for thisjournal
Related Documents