Bank of Canada staff analytical notes are short articles that focus on topical issues relevant to the current economic and financial context, produced independently from the Bank’s Governing Council. This work may support or challenge prevailing policy orthodoxy. Therefore, the views expressed in this note are solely those of the authors and may differ from official Bank of Canada views. No responsibility for them should be attributed to the Bank. www.bank-banque-canada.ca Staff Analytical Note/Note analytique du personnel 2017-24 A Barometer of Canadian Financial System Vulnerabilities by Thibaut Duprey and Tom Roberts Financial Stability Department Bank of Canada Ottawa, Ontario, Canada K1A 0G9 [email protected] [email protected]

Welcome message from author
This document is posted to help you gain knowledge. Please leave a comment to let me know what you think about it! Share it to your friends and learn new things together.
Transcript
Bank of Canada staff analytical notes are short articles that focus on topical issues relevant to the current economic and financial context, produced independently from the Bank’s Governing Council. This work may support or challenge prevailing policy orthodoxy. Therefore, the views expressed in this note are solely those of the authors and may differ from official Bank of Canada views. No responsibility for them should be attributed to the Bank.
www.bank-banque-canada.ca
Staff Analytical Note/Note analytique du personnel 2017-24
A Barometer of Canadian Financial System Vulnerabilities
by Thibaut Duprey and Tom Roberts
Financial Stability Department Bank of Canada Ottawa, Ontario, Canada K1A 0G9 [email protected] [email protected]
ISSN 2369-9639 © 2017 Bank of Canada
Acknowledgements
We would like to thank Ian Christensen, Brad Howell, Fuchun Li, Gurnain Pasricha and Keith Stewart, whose previous contributions made this note possible. We would also like to thank Marc-André Gosselin for lending support to this idea, as well as colleagues from the Financial Stability Department, among whom Brian Peterson, Virginie Traclet and Alexandre Ruest provided valuable comments.
ii
Abstract
This note presents a composite indicator of Canadian financial system vulnerabilities—the Vulnerabilities Barometer. It aims to complement the Bank of Canada’s vulnerabilities assessment by adding a quantitative and synthesized perspective to the more granular (distributional) analysis presented in the Financial System Review.
• The Vulnerabilities Barometer for Canada is above the level reached in 2007. The current state is driven by housing market vulnerabilities and elevated household indebtedness. The oil price shock contributed to the recent increase in vulnerabilities, though this risk factor has eased since the end of 2016.
• When assessed across countries, the Vulnerabilities Barometer sends earlier and better signals of future stress episodes than its components taken individually, or than the credit-to-GDP gap. It is also consistent with the narrative of stressful episodes for peer countries.
Bank topics: Econometric and statistical methods; Financial stability; Monetary and financial indicators JEL codes: C14, C40, D14, E32, E66, G01, G15, G21, H63, F01
Résumé
Cette note présente un indicateur composite des vulnérabilités du système financier canadien, le baromètre des vulnérabilités. Il vise à compléter l’évaluation des vulnérabilités de la Banque du Canada en ajoutant un aspect quantitatif et synthétique à l’analyse présentée dans la Revue du système financier, laquelle est plus granulaire et davantage portée sur l’évolution des distributions.
• Le baromètre des vulnérabilités pour le Canada est actuellement au-dessus de son niveau atteint en 2007, porté par les vulnérabilités sur le marché du logement et l’endettement élevé des ménages. Le choc sur le prix du pétrole a contribué à la récente hausse des vulnérabilités, mais ce facteur de risque s’est atténué depuis la fin de 2016.
• Parmi les pays considérés, le baromètre des vulnérabilités signale des épisodes de stress plus tôt, et avec davantage de précision, comparé à ses composants sectoriels pris isolément ou à l’écart du ratio du crédit au PIB. Les résultats sont aussi cohérents avec le déroulé des épisodes de stress dans les autres pays développés.
Sujets : Méthodes économétriques et statistiques; Stabilité financière; Indicateurs monétaires et financiers Codes JEL : C14, C40, D14, E32, E66, G01, G15, G21, H63, F01
A Barometer of Canadian Financial System Vulnerabilities | Page 2
1. Introduction
The Vulnerabilities Barometer represents a step in reinforcing the quantitative dimension of the Bank of Canada’s monitoring of financial system vulnerabilities, as a complement to inputs from market intelligence and other more detailed sectoral analysis. It supports our monitoring of vulnerabilities in several ways.
First, the fear of missing the next crisis could make regulators lean toward making more cautious assess-ments. In the extreme, if vulnerabilities were always assessed as high or were assessed with no consistent methodology, the informativeness of such assessments would be greatly diminished. With the barometer, in contrast, we aggregate different sectors of vulnerabilities together, along with a range of alternative measurements,2 in a consistent way over time.
Second, vulnerabilities should be monitored particularly when they are high. This implies that we need to take a stand on how high an indicator of vulnerability has to be before it triggers a warning signal. To disci-pline this effort, we rely on the early-warning signals literature. We identify warning thresholds above which a vulnerability indicator is more likely to be associated with episodes of severe financial stress. Given that Canada has not experienced a banking crisis in its recent history, we prefer the broader concept of financial stress episodes—periods with heightened financial market volatility and valuation losses across a wide range of assets. Still, given the limited set of stressful episodes in Canada, we benchmark the level of vulner-abilities in Canada against the experiences of other developed economies.3
Third, we should pay particular attention to vulnerabilities that worsen over time. Issuing warning signals sufficiently early is not enough if there is no information on the intensity of the warning signal. Therefore, our barometer tracks the intensity of warning signals. This provides information on the intensity of vulnera-bilities that were already identified. But it is also a way to monitor potential vulnerabilities as they evolve and come closer to their warning thresholds.
Last, our approach also provides a way to succinctly visualize a complex set of indicators. We learned from the 2008 global financial crisis that stress arises from a confluence of vulnerabilities and that averages can hide rising vulnerabilities. Regarding the importance of distributions, authorities have been developing more granular analytical tools, for example, using microdata. But as the dimensionality of the information under scrutiny increases, we also need metrics to discipline the analysis of the bigger picture. In addition, more complex metrics based on distributions are typically available only over a limited time span, making it harder to assess the levels above which vulnerabilities become critical.
The current framework (Christensen et al. 2015, Table 1) for the assessment of vulnerabilities at the Bank relies on four dimensions—leverage, liquidity, pricing of risk and opacity—over four categories—financial and non-financial sectors, shadow banking and asset markets. Each aspect is assessed separately with a combination of judgment and models. However, this effort to rationalize the assessment of vulnerabilities has shortcomings. Some categories are harder to quantify than others. Also, the non-financial sector pools household and corporate debt. Likewise, the housing market is not a separate category.
2 This is because, in part, there is no consensus on how to measure any given vulnerability.
3 It is typical in the literature to rely on cross-country experiences of stress for such empirical analysis. We cover 16 countries: Australia, Belgium, Canada, Denmark, Finland, France, Germany, Italy, Japan, the Netherlands, Norway, Spain, Sweden, Switzerland, the United Kingdom and the United States.
A Barometer of Canadian Financial System Vulnerabilities | Page 3
Of course, others have already grappled with these issues. Drehmann, Borio and Tsatsaronis (2011) and Drehmann and Tsatsaronis (2014) advocate for the use of the deviation of the ratio of credit to gross do-mestic product (GDP) from its long-term trend as a measure of vulnerabilities.4 Aikman et al. (2015) pro-vide a visual representation of vulnerability measures along several dimensions but do not use international benchmarks. Pasricha et al. (2013) estimate warning thresholds using cross-country experiences for individ-ual indicators. Christensen and Li (2014) construct a composite index by combining warning signals that are either on or off, i.e., higher or lower than an estimated warning threshold, but they do not consider the in-tensity of the signal.
2. The Vulnerabilities Barometer
We consider a set of I = 28 indicators (Appendix 1) grouped into four equally weighted sectors S, namely, the household sector, the housing market, the non-financial corporate sector and the banking sector.5 The indi-cators, and the vulnerabilities they aim to capture, are drawn from those investigated in Pasricha et al. (2013); they are mostly indicators of leverage and market prices.6
For each indicator, we consider different transformations, since any given transformation has benefits and limitations, and therefore they complement each other when combined in the barometer:7
• Ratios, such as household debt to GDP, help to capture vulnerability at least to the extent that structural changes do not alter such interpretations.
• Deviations from a filtered trend partly abstract from longer-term structural changes, but this could be counterproductive if a stressful event takes time to materialize, and the long-term trend catches up with the current level.
• Growth rates can provide the direction and the magnitude of the change in vulnerabilities at dif-ferent horizons but do not consider the initial level of vulnerabilities.8 This could be relevant if, for example, a rapid acceleration in credit growth tends to be associated with a deterioration in lending standards.
Standard early-warning models usually estimate a threshold above which an indicator sends a warning sig-nal that tends to be associated with episodes of severe financial market stress, starting within the following two years.9 Following Pasricha et al. (2013) and Christensen and Li (2014), a composite early-warning indi-cator can be defined as the weighted sum of warning signals, i.e., when an indicator is above its warning 4 Under Basel III, the credit-to-GDP gap should be used to guide the buildup of additional bank equity via the countercyclical capital buffer (BCBS
2010). However, national authorities are expected to apply judgment using the best information available to gauge the buildup of system-wide risk, rather than relying mechanistically on a single indicator like the credit-to-GDP gap.
5 We also included 12 additional indicators as a robustness check to capture overall macroeconomic vulnerabilities, by looking at overall domestic debt, broad credit gaps, equity prices and current account positions. A very similar picture is obtained. However, such a broad measure of macro-economic vulnerability is redundant since the aggregation of the various sectors in the Vulnerabilities Barometer will already reflect the broader macroeconomy.
6 Because of constraints on the availability of data, we cannot use measures derived from the analysis of distributions, although this would provide insight in the analysis of vulnerabilities. Historical, cross-country data are typically available at the aggregate level only.
7 While the interactions between the various indicators are not explicitly accounted for, a high level on the barometer would generally occur only if signals emanated from multiple sectors.
8 Thresholds for deviations from trend and growth rates can be made conditional on the level of the indicator. Then even a moderate deviation or growth rate can be associated with stronger vulnerabilities if the level is high enough. For instance, when the thresholds for the deviation from trend and growth of household indebtedness are computed conditional on a high or low level of household debt, the resulting Vulnerabilities Barometer is somewhat higher, although its overall pattern over time is very similar.
9 Li and St-Amant (2010) and Duprey (2017) show that episodes of high financial stress in Canada are associated with more severe reactions of the Canadian economy to negative shocks.
A Barometer of Canadian Financial System Vulnerabilities | Page 4
threshold. Such a composite combines vulnerabilities that are turned on, but it is silent on the intensity of the vulnerabilities. However, as the indicator continues to move above the threshold, one could expect that the probability of facing financial stress, or its severity in the event that it does occur, increases. As the in-tensity of the warning signal goes up, the vulnerability should be considered as becoming more severe. This is what the Vulnerabilities Barometer reflects.
The Vulnerabilities Barometer captures the intensity of the vulnerabilities over time t for a set of indicators i across S sectors with 𝐼𝐼𝑠𝑠 indicators in each sector. It is computed as the sum of the difference between the value of an indicator 𝑣𝑣𝑠𝑠,𝑖𝑖,𝑡𝑡 and the value of the associated warning threshold 𝜏𝜏𝑠𝑠,𝑖𝑖 normalized by the an-nual standard deviation 𝜎𝜎𝑠𝑠,𝑖𝑖 of the indicator.10
Vulnerabilities Barometer𝑡𝑡 = ∑ 𝑚𝑚𝑚𝑚𝑚𝑚 �∑ 𝑚𝑚𝑚𝑚𝑚𝑚 �𝑣𝑣𝑠𝑠,𝑖𝑖,𝑡𝑡−𝜏𝜏𝑠𝑠,𝑖𝑖𝜎𝜎𝑠𝑠,𝑖𝑖
;−1� ∗ 𝜔𝜔𝑠𝑠,𝑖𝑖𝐼𝐼𝑠𝑠𝑖𝑖=1 ; 0�𝑆𝑆
𝑠𝑠=1 (1)
As in Pasricha et al. (2013), the thresholds 𝜏𝜏𝑠𝑠,𝑖𝑖 are computed separately for each indicator by looking for the level of the indicator that best predicts episodes of financial stress across countries in the subsequent two years. The distance to the warning threshold 𝑣𝑣𝑠𝑠,𝑖𝑖,𝑡𝑡 − 𝜏𝜏𝑠𝑠,𝑖𝑖 is weighted by the informational content of the indicator 𝜔𝜔𝑠𝑠,𝑖𝑖 relative to the other indicators for the sector s. We also allow for various indicators of vulnerabilities within a given sector s to balance each other: thus, the assessment of a given vulnerability summarizes a set of warning signals where a very large deviation from a warning threshold becomes harder to ignore, in the absence of other very positive data. Details on the computation of 𝜏𝜏𝑠𝑠,𝑖𝑖 and 𝜔𝜔𝑠𝑠,𝑖𝑖 are dis-cussed in Box 1.
Higher levels of the Vulnerabilities Barometer are associated with a higher likelihood of financial market stress in the subsequent two years. Negative values are not directly included in the Vulnerabilities Barome-ter. However, they also provide valuable information, given the uncertainty surrounding the estimation of the warning thresholds. Looking at the evolution of indicators just below their threshold allows the monitor-ing of emerging sources of vulnerability.
The barometer combines data of monthly and quarterly frequencies, according to availability. As such, it is mainly suitable for quarterly monitoring of vulnerabilities.11
10 The values of an indicator that are more than one standard deviation below the warning threshold are discarded; otherwise, a single indicator at
an extremely depressed level could offset an overall rise in vulnerabilities, giving a false sense of security. This affects the level of the Vulnerabili-ties Barometer, not its interpretation. We could also compute rolling standard deviations. However, we want the computation of the standard deviation to encompass at least one complete cycle, i.e., until 2008, to make the assessment stable throughout the cycle. Otherwise, the volatil-ity would be low in tranquil times, with small levels of vulnerabilities translating into large variations in the profile of vulnerabilities once normal-ized by the standard deviation.
11 Because of the publication lag in several underlying data series, the information used for the Vulnerabilities Barometer can lag for a few months. However, this is unlikely to be an issue for the assessment of key vulnerabilities, as vulnerabilities tend to evolve slowly over time.
A Barometer of Canadian Financial System Vulnerabilities | Page 5
Box 1
Methodology for Computing the Vulnerabilities Barometer Computation of the threshold We compute the warning thresholds associated with international experiences of banking crises (Laeven and Valencia 2013) or high financial stress (Cardarelli, Elekdag and Lall 2009) as in Pasricha et al. (2013). Epi-sodes of high financial stress are defined as events where a financial stress index is two standard deviations above its trailing 10-year moving average. Banking crises are almost always associated with periods of ele-vated financial stress, while the reverse is not true (Duprey, Klaus and Peltonen 2017). Therefore, episodes of high financial stress are more prevalent in our sample than are periods of banking crises. Thresholds are estimated on a panel of developed countries by minimizing the impurity measure,12 which measures the extent to which signals issued by indicators that are above their threshold misclassify stress periods. An im-purity measure of zero would signify that a threshold perfectly classifies periods into stress and non-stress.
Computation of the information weights The information weights 𝜔𝜔𝑚𝑚,𝑖𝑖 rely on the area under the receiver operating curve (AUROC) methodology. It is bounded between 0 and 1, and a value above 0.5 means that the indicator has better predictive abilities than a coin toss.
𝜔𝜔𝑚𝑚,𝑖𝑖 =𝑚𝑚𝑚𝑚𝑚𝑚�𝐴𝐴𝐴𝐴𝐴𝐴𝐴𝐴𝐴𝐴𝑚𝑚,𝑖𝑖 − 0.5; 0�
∑ 𝑚𝑚𝑚𝑚𝑚𝑚�𝐴𝐴𝐴𝐴𝐴𝐴𝐴𝐴𝐴𝐴𝑚𝑚,𝑖𝑖 − 0.5; 0�𝐼𝐼𝑚𝑚𝑖𝑖=1
The AUROC metric is a statistical measure of the quality of a warning signal over a given horizon, for any possible level of the indicator. That is, it does not rely on a specific warning threshold but rather reflects the signalling ability at any intensity of the indicator. Among a set of 37 indicators with different growth rates and deviations, only 28 have a predictive power with AUROC greater than 0.5. The other indicators with AU-ROC less than 0.5 are left out of the sample.
The AUROC methodology is more in line with the intent of the Vulnerabilities Barometer, which is to cap-ture the intensity of vulnerabilities, than are the binary signals from exceeding a threshold. For this reason, it is preferred to the signal-to-noise ratio 𝜔𝜔𝑖𝑖, which measures signal quality for a given threshold, used in the early-warning composite.
3. The Vulnerabilities Barometer Is Above its 2007 High, Driven by Housing Market Vulnerabilities
The Vulnerabilities Barometer is above the peak observed at the end of 2007, suggesting the persistence and worsening of certain vulnerabilities (Chart 1). The Vulnerabilities Barometer reveals that the Canadian economy was more vulnerable in late 2014, before the oil shock, than in the early 2000s. Toward the end of 2016, the Vulnerabilities Barometer was at historical highs, suggesting levels of vulnerabilities that are asso-ciated with an increased likelihood of stress.13 While it could seem dramatic that the current level of the
12 This concept is borrowed from the decision tree literature.
13 The aggregate measure of vulnerabilities developed by Lee, Posenau and Stebunovs (2017) also covers Canada and partly overlaps the data used in this note. According to their measure, the level of vulnerabilities in Canada is also above the levels around 2008. However, Lee, Posenau and
A Barometer of Canadian Financial System Vulnerabilities | Page 6
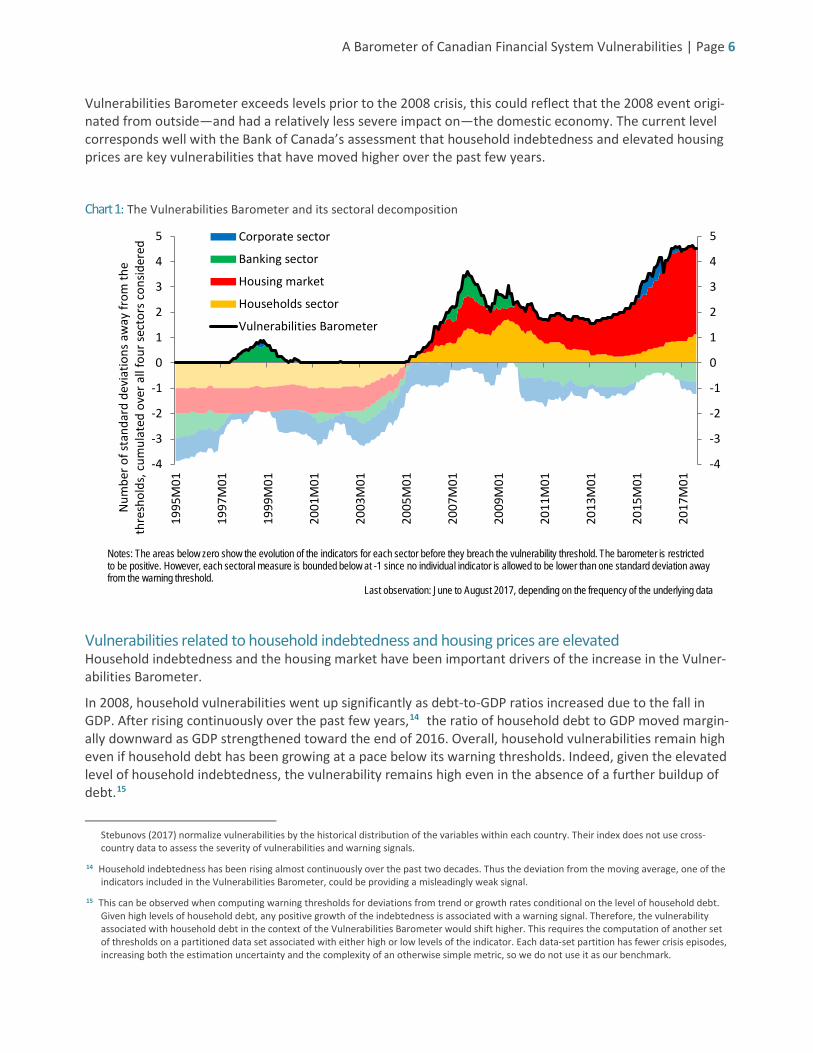
Vulnerabilities Barometer exceeds levels prior to the 2008 crisis, this could reflect that the 2008 event origi-nated from outside—and had a relatively less severe impact on—the domestic economy. The current level corresponds well with the Bank of Canada’s assessment that household indebtedness and elevated housing prices are key vulnerabilities that have moved higher over the past few years.
Chart 1: The Vulnerabilities Barometer and its sectoral decomposition
Vulnerabilities related to household indebtedness and housing prices are elevated Household indebtedness and the housing market have been important drivers of the increase in the Vulner-abilities Barometer.
In 2008, household vulnerabilities went up significantly as debt-to-GDP ratios increased due to the fall in GDP. After rising continuously over the past few years,14 the ratio of household debt to GDP moved margin-ally downward as GDP strengthened toward the end of 2016. Overall, household vulnerabilities remain high even if household debt has been growing at a pace below its warning thresholds. Indeed, given the elevated level of household indebtedness, the vulnerability remains high even in the absence of a further buildup of debt.15
Stebunovs (2017) normalize vulnerabilities by the historical distribution of the variables within each country. Their index does not use cross-country data to assess the severity of vulnerabilities and warning signals.
14 Household indebtedness has been rising almost continuously over the past two decades. Thus the deviation from the moving average, one of the indicators included in the Vulnerabilities Barometer, could be providing a misleadingly weak signal.
15 This can be observed when computing warning thresholds for deviations from trend or growth rates conditional on the level of household debt. Given high levels of household debt, any positive growth of the indebtedness is associated with a warning signal. Therefore, the vulnerability associated with household debt in the context of the Vulnerabilities Barometer would shift higher. This requires the computation of another set of thresholds on a partitioned data set associated with either high or low levels of the indicator. Each data-set partition has fewer crisis episodes, increasing both the estimation uncertainty and the complexity of an otherwise simple metric, so we do not use it as our benchmark.
-4
-3
-2
-1
0
1
2
3
4
5
-4
-3
-2
-1
0
1
2
3
4
5
1995
M01
1997
M01
1999
M01
2001
M01
2003
M01
2005
M01
2007
M01
2009
M01
2011
M01
2013
M01
2015
M01
2017
M01
Num
ber o
f sta
ndar
d de
viat
ions
aw
ay fr
om th
e th
resh
olds
, cum
ulat
ed o
ver a
ll fo
ur se
ctor
s co
nsid
ered
Corporate sector
Banking sector
Housing market
Households sector
Vulnerabilities Barometer
Notes: The areas below zero show the evolution of the indicators for each sector before they breach the vulnerability threshold. The barometer is restricted to be positive. However, each sectoral measure is bounded below at -1 since no individual indicator is allowed to be lower than one standard deviation away from the warning threshold.
Last observation: June to August 2017, depending on the frequency of the underlying data
A Barometer of Canadian Financial System Vulnerabilities | Page 7
The housing market is now the main contributor to the Vulnerabilities Barometer, with housing prices ele-vated relative to income or rents. Measures of affordability for the housing market are all sending strong warning signals. On the other hand, growth rates in real housing prices are just below the threshold as the regional housing markets of Vancouver and Toronto have lost momentum.16
The oil price shock contributed to the recent increase in vulnerabilities, though this risk factor has eased Leverage in the corporate sector has also contributed to the rising Vulnerabilities Barometer since 2014. Un-surprisingly, leverage indicators for the corporate sector have subsided from their 2015 peak, which was mostly driven by a decline in GDP. Indicators such as the deviation from the long-term trend in the ratio of non-financial corporate debt to GDP are now signalling vulnerabilities. However, the deviation from the trend is edging lower, and the ratio of non-financial corporate debt to GDP started from a rather moderate level.
Combined with household indebtedness that was already trending upward, rising credit relative to GDP in the corporate sector was one prominent reason for the recent increase in the broad credit-to-GDP gap. The Bank for International Settlements (2017) estimates that throughout 2016, Canada’s credit-to-GDP gap eas-ily exceeded its 10 per cent warning threshold. However, more recent data suggest a decrease of the gap in early 2017 as GDP growth has picked up.
Finally, vulnerabilities in the banking sector are still low compared with 2008 and are trending lower on av-erage,17 although a few indicators such as equity price growth are closer to their warning thresholds. This is mostly driven by the recovery of banks’ market value after the oil shock.
4. Assessing the Usefulness of the Vulnerabilities Barometer The Vulnerabilities Barometer provides an earlier warning signal than the credit-to-GDP gap The Vulnerabilities Barometer complements the credit-to-GDP gap used by the Bank for International Set-tlements for gauging the stage of the credit cycle. A large credit-to-GDP gap corresponds to a large devia-tion from a filtered trend and tends to be associated with periods of unsustainable credit growth in the economy (Drehmann, Borio and Tsatsaronis 2011; Drehmann and Tsatsaronis 2014).
16 Note that the Vulnerabilities Barometer does not capture regional imbalances in the vulnerabilities. The Toronto or Vancouver markets are not
singled out specifically, which would otherwise add to the overall housing vulnerability for these regions.
17 This is consistent with market-based indicators of banking stress. See MacDonald, van Oordt and Scott (2016). However, purely market-based measures would increase further in 2008–09 as the recession unfolds. Measures that also use balance sheet information like the Vulnerabilities Barometer tend to increase prior to the stress period and decrease once the crisis starts, as financial institutions tend to deleverage.
A Barometer of Canadian Financial System Vulnerabilities | Page 8
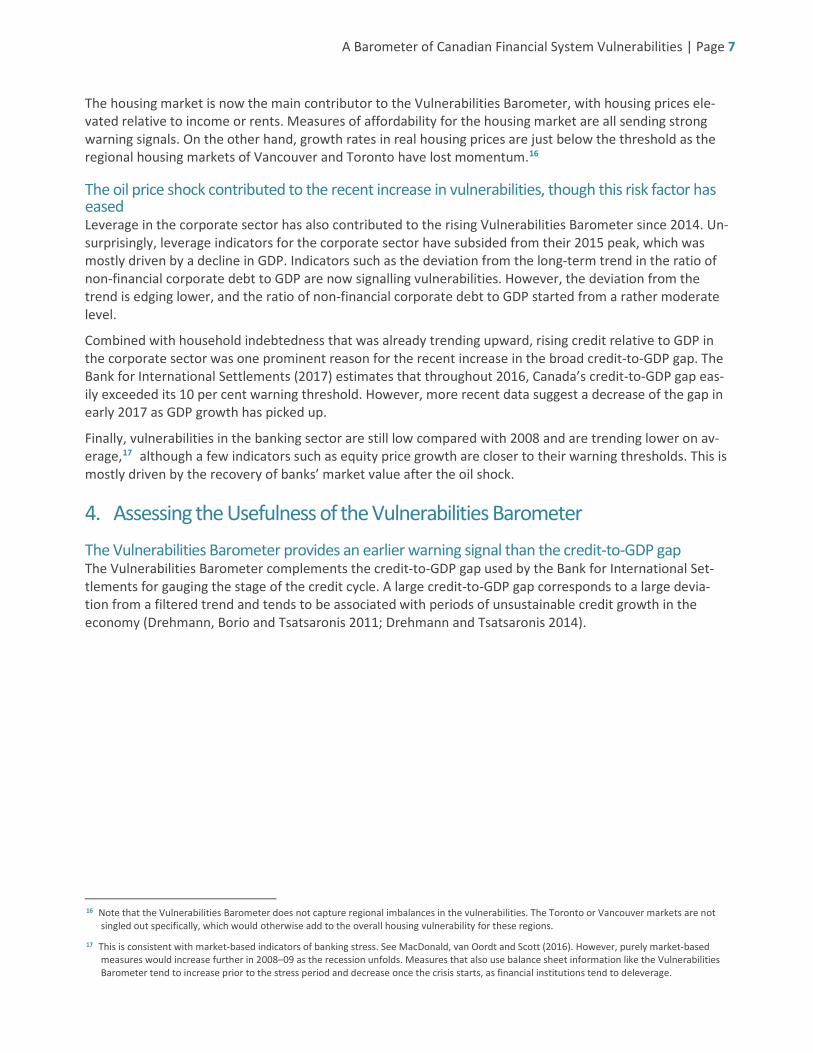
Chart 2: The Vulnerabilities Barometer sends a clearer and earlier signal compared to the credit-to-GDP gap
The Vulnerabilities Barometer displays broadly similar trends compared with the credit-to-GDP gap (Chart 2). But the Vulnerabilities Barometer sends a clearer and earlier signal because it indicates a broader spectrum of rising vulnerabilities across different sectors. Indeed, the credit-to-GDP gap is nothing more than a statis-tical transformation of a single aggregate measure. In addition, the Vulnerabilities Barometer remains ele-vated during the 2011–14 period, in contrast with the sharper decline of the gap measure, which is driven by the rising credit-to-GDP trend.
All indicators that use ratios with respect to GDP are influenced by the business cycle. One should distin-guish between the buildup of vulnerabilities, i.e., until 2007, and the realization of shocks that further in-crease the vulnerabilities over the cycle, i.e., in 2008–09. The analysis of vulnerabilities during a cyclical downturn is less informative as vulnerabilities appear to increase mechanically once GDP contracts. Unsur-prisingly, the credit-to-GDP gap appears to be more cyclical than the Vulnerabilities Barometer in periods of macroeconomic downturn, with sharp, short-lived mechanical increases during recessions (because GDP declines).18
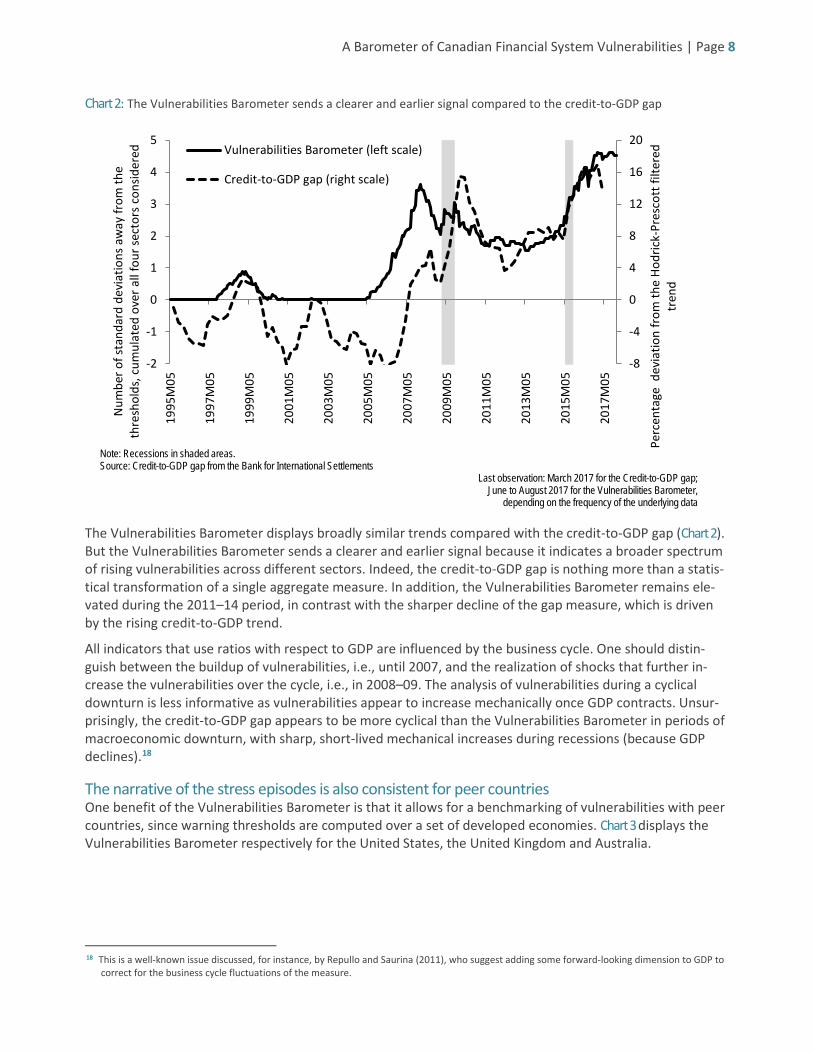
The narrative of the stress episodes is also consistent for peer countries One benefit of the Vulnerabilities Barometer is that it allows for a benchmarking of vulnerabilities with peer countries, since warning thresholds are computed over a set of developed economies. Chart 3 displays the Vulnerabilities Barometer respectively for the United States, the United Kingdom and Australia.
18 This is a well-known issue discussed, for instance, by Repullo and Saurina (2011), who suggest adding some forward-looking dimension to GDP to
correct for the business cycle fluctuations of the measure.
-8
-4
0
4
8
12
16
20
-2
-1
0
1
2
3
4
5
1995
M05
1997
M05
1999
M05
2001
M05
2003
M05
2005
M05
2007
M05
2009
M05
2011
M05
2013
M05
2015
M05
2017
M05
Perc
enta
ge d
evia
tion
from
the
Hodr
ick-
Pres
cott
filte
red
tren
d
Num
ber o
f sta
ndar
d de
viat
ions
aw
ay fr
om th
e th
resh
olds
, cum
ulat
ed o
ver a
ll fo
ur se
ctor
s co
nsid
ered Vulnerabilities Barometer (left scale)
Credit-to-GDP gap (right scale)
Note: Recessions in shaded areas. Source: Credit-to-GDP gap from the Bank for International Settlements
Last observation: March 2017 for the Credit-to-GDP gap; June to August 2017 for the Vulnerabilities Barometer,
depending on the frequency of the underlying data
A Barometer of Canadian Financial System Vulnerabilities | Page 9
Chart 3a: The Vulnerabilities Barometer for the United States
Chart 3b: The Vulnerabilities Barometer for the United Kingdom
Chart 3c : The Vulnerabilities Barometer for Australia
-16
-8
0
8
16
24
32
-4
-2
0
2
4
6
8
1995
M01
1997
M01
1999
M01
2001
M01
2003
M01
2005
M01
2007
M01
2009
M01
2011
M01
2013
M01
2015
M01
2017
M01
Perc
enta
ge d
evia
tion
from
the
Hodr
ick-
Pres
cott
filte
red
tren
d
Num
ber o
f sta
ndar
d de
viat
ions
aw
ay fr
om th
e th
resh
olds
, cu
mul
ated
ove
r all
four
sect
ors
cons
ider
edCorporate sector indebtednessBanking sector fragilityHousing market fragilityHousehold indebtednessVulnerabilities BarometerCredit-to-GDP gap (right scale)
-32
-24
-16
-8
0
8
16
-8
-6
-4
-2
0
2
4
1995
M01
1997
M01
1999
M01
2001
M01
2003
M01
2005
M01
2007
M01
2009
M01
2011
M01
2013
M01
2015
M01
2017
M01 Pe
rcen
tage
dev
iatio
n fr
om th
e Ho
dric
k-Pr
esco
tt fi
ltere
d tr
end
Num
ber o
f sta
ndar
d de
viat
ions
aw
ay fr
om th
e th
resh
olds
, cu
mul
ated
ove
r all
four
sect
ors
cons
ider
ed
-16
-8
0
8
16
24
32
-4
-2
0
2
4
6
8
1995
M01
1997
M01
1999
M01
2001
M01
2003
M01
2005
M01
2007
M01
2009
M01
2011
M01
2013
M01
2015
M01
2017
M01
Perc
enta
ge d
evia
tion
from
the
Hodr
ick-
Pres
cott
filte
red
tren
d
Num
ber o
f sta
ndar
d de
viat
ions
aw
ayfr
om th
e th
resh
olds
, cum
ulat
ed o
ver
all f
our s
ecto
rs c
onsid
ered
Notes: The areas below zero show the evolution of the indicators for each sector before they breach the vulnerability threshold. The barometer is restricted to be positive. However, each sectoral measure is bounded below at -1 since no individual indicator is allowed to be lower than one standard deviation away from the warning threshold. Source: Credit-to-GDP gap from the Bank for International Settlements
Last observation: March 2017 for the Credit-to-GDP gap; June to August 2017 for the Vulnerabilities Barometer,
depending on the frequency of the underlying data
A Barometer of Canadian Financial System Vulnerabilities | Page 10
In the United States, the vulnerability level around 2008 matches the narrative of the financial crisis. The banking system was vulnerable in the late 1990s and early 2000s with a period of accelerating bank equity price growth and above-trend growth in financial debt. The banking system also remained very close to the positive vulnerability level throughout the 2000s, suggesting banking vulnerabilities never completely disap-peared. But from 2002 onwards, the rising indebtedness of households was the main vulnerability, leading to imbalances in the housing market from 2005 onward that eventually brought about vulnerability in the banking sector, seen in the barometer especially over 2006 to 2010. The vulnerabilities diminished at the end of 2009 as the economy deleveraged and adjusted to the post-crisis era. Conversely, leverage of the different sectors has continued to increase in Canada since the 2008 crisis, as it did not originate within Can-ada and was not severe enough to trigger a sharp balance sheet adjustment.
The credit-to-GDP gap does not issue any signal for the United Kingdom, with the credit-to-GDP gap much below zero. However, the picture is quite different over the recent years when looking at the Vulnerabilities Barometer and the decomposition among different sectors. Household indebtedness is also pronounced, although it has subsided since the 2008 crisis. This indebtedness has coincided with concern about housing affordability that has edged higher.19 The British banking system has also remained persistently above threshold since the beginning of the 2000s and amid continued uncertainty surrounding the future of Lon-don as the banking hub of Europe.
In Australia, the pattern is very similar to Canada with persistently high housing market and household vul-nerabilities. The ratios of household debt to GDP and household debt to disposable income are higher than in Canada, although the former is edging lower. The recent period was also characterized by elevated non-financial leverage, driven mainly by the drop in the prices of commodities that account for a large fraction of Australian exports. Here again, the credit-to-GDP gap is not necessarily a good measure of the recent vul-nerabilities. It fails to account for the high level of indebtedness or the elevated level of housing prices.
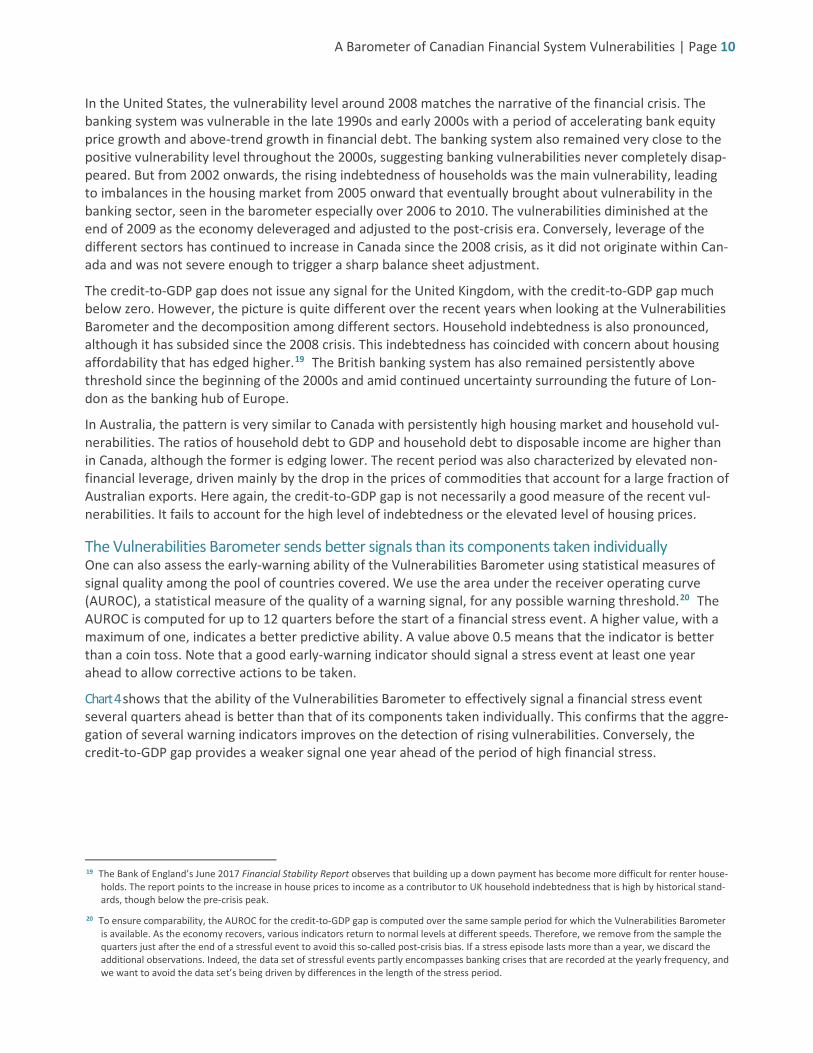
The Vulnerabilities Barometer sends better signals than its components taken individually One can also assess the early-warning ability of the Vulnerabilities Barometer using statistical measures of signal quality among the pool of countries covered. We use the area under the receiver operating curve (AUROC), a statistical measure of the quality of a warning signal, for any possible warning threshold.20 The AUROC is computed for up to 12 quarters before the start of a financial stress event. A higher value, with a maximum of one, indicates a better predictive ability. A value above 0.5 means that the indicator is better than a coin toss. Note that a good early-warning indicator should signal a stress event at least one year ahead to allow corrective actions to be taken.
Chart 4 shows that the ability of the Vulnerabilities Barometer to effectively signal a financial stress event several quarters ahead is better than that of its components taken individually. This confirms that the aggre-gation of several warning indicators improves on the detection of rising vulnerabilities. Conversely, the credit-to-GDP gap provides a weaker signal one year ahead of the period of high financial stress.
19 The Bank of England’s June 2017 Financial Stability Report observes that building up a down payment has become more difficult for renter house-
holds. The report points to the increase in house prices to income as a contributor to UK household indebtedness that is high by historical stand-ards, though below the pre-crisis peak.
20 To ensure comparability, the AUROC for the credit-to-GDP gap is computed over the same sample period for which the Vulnerabilities Barometer is available. As the economy recovers, various indicators return to normal levels at different speeds. Therefore, we remove from the sample the quarters just after the end of a stressful event to avoid this so-called post-crisis bias. If a stress episode lasts more than a year, we discard the additional observations. Indeed, the data set of stressful events partly encompasses banking crises that are recorded at the yearly frequency, and we want to avoid the data set’s being driven by differences in the length of the stress period.
A Barometer of Canadian Financial System Vulnerabilities | Page 11
Chart 4 : The Vulnerabilities Barometer sends a stronger signal as measured by the AUROC statistics
Notes: The AUROC is a statistical metric to assess the quality of a signal issued several quarters prior to the occurrence of a stress event. A higher value, with a maxi-mum of one, indicates a better predictive ability. A value above 0.5 means that the indicator is better than a coin toss. The grey shaded area corresponds to a window of one year before the start of a stress event. A signal issued during this period is usually considered as being late because it does not allow for a timely policy re-sponse.
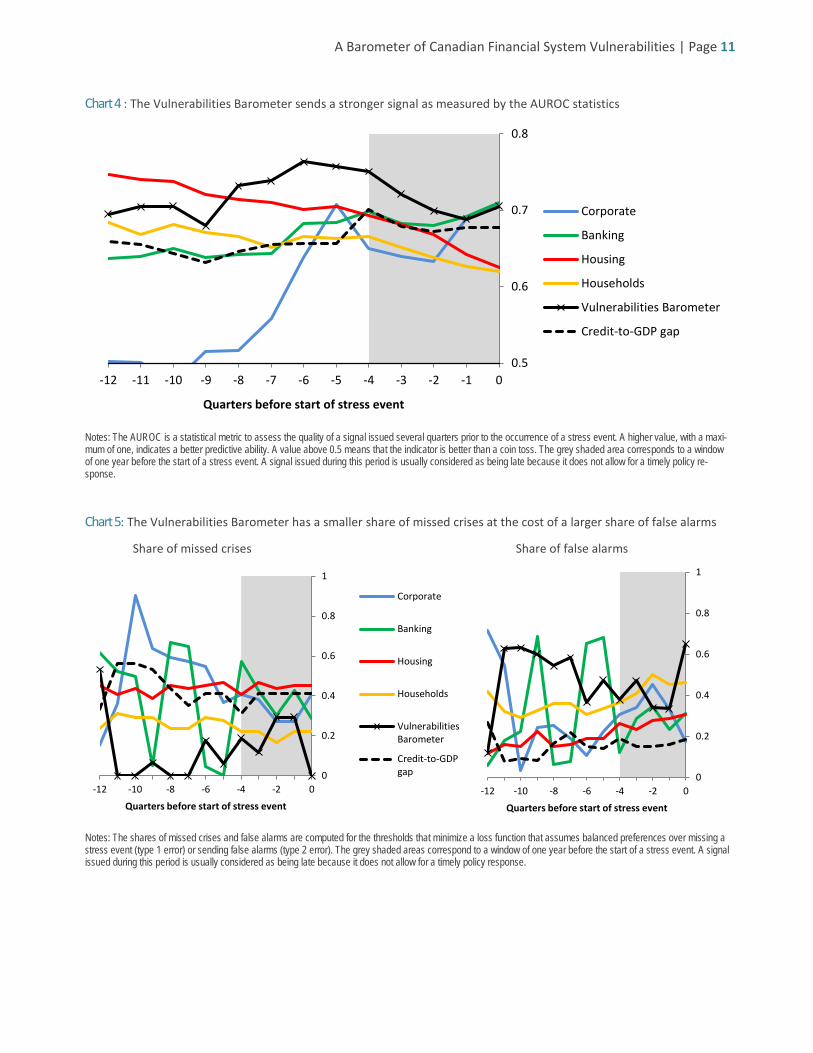
Chart 5: The Vulnerabilities Barometer has a smaller share of missed crises at the cost of a larger share of false alarms
Share of missed crises Share of false alarms
Notes: The shares of missed crises and false alarms are computed for the thresholds that minimize a loss function that assumes balanced preferences over missing a stress event (type 1 error) or sending false alarms (type 2 error). The grey shaded areas correspond to a window of one year before the start of a stress event. A signal issued during this period is usually considered as being late because it does not allow for a timely policy response.
0.5
0.6
0.7
0.8
0-1-2-3-4-5-6-7-8-9-10-11-12
Quarters before start of stress event
Corporate
Banking
Housing
Households
Vulnerabilities Barometer
Credit-to-GDP gap
0
0.2
0.4
0.6
0.8
1
0-2-4-6-8-10-12
Quarters before start of stress event
Corporate
Banking
Housing
Households
VulnerabilitiesBarometer
Credit-to-GDPgap 0
0.2
0.4
0.6
0.8
1
0-2-4-6-8-10-12
Quarters before start of stress event
A Barometer of Canadian Financial System Vulnerabilities | Page 12
Chart 5 shows that the Vulnerabilities Barometer has among the lowest shares of missed stress events, at the cost of more frequent false alarms.21 The reverse is true for the credit-to-GDP gap. However, having a smaller share of missed events may be preferred by the monitoring authority. Still, just like any early-warn-ing indicator, the relatively high share of false alarms suggests that the Vulnerabilities Barometer should not be considered in isolation; rather, it should be part of a broader assessment of vulnerabilities.
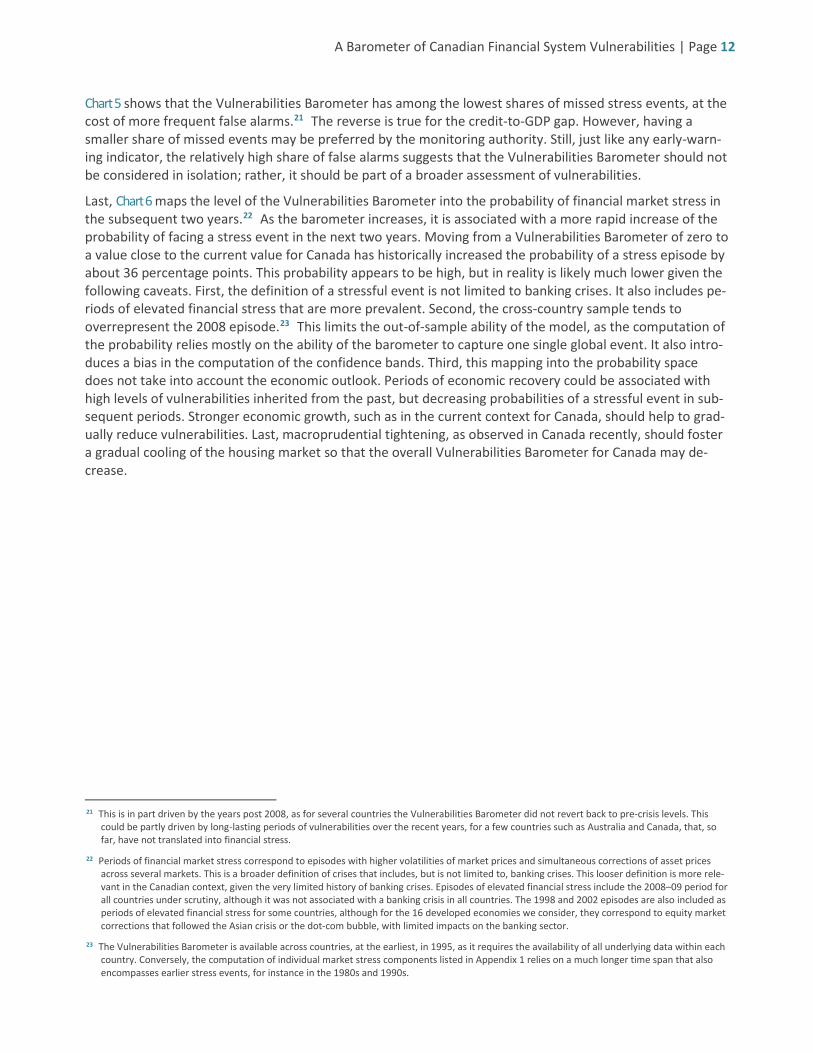
Last, Chart 6 maps the level of the Vulnerabilities Barometer into the probability of financial market stress in the subsequent two years.22 As the barometer increases, it is associated with a more rapid increase of the probability of facing a stress event in the next two years. Moving from a Vulnerabilities Barometer of zero to a value close to the current value for Canada has historically increased the probability of a stress episode by about 36 percentage points. This probability appears to be high, but in reality is likely much lower given the following caveats. First, the definition of a stressful event is not limited to banking crises. It also includes pe-riods of elevated financial stress that are more prevalent. Second, the cross-country sample tends to overrepresent the 2008 episode.23 This limits the out-of-sample ability of the model, as the computation of the probability relies mostly on the ability of the barometer to capture one single global event. It also intro-duces a bias in the computation of the confidence bands. Third, this mapping into the probability space does not take into account the economic outlook. Periods of economic recovery could be associated with high levels of vulnerabilities inherited from the past, but decreasing probabilities of a stressful event in sub-sequent periods. Stronger economic growth, such as in the current context for Canada, should help to grad-ually reduce vulnerabilities. Last, macroprudential tightening, as observed in Canada recently, should foster a gradual cooling of the housing market so that the overall Vulnerabilities Barometer for Canada may de-crease.
21 This is in part driven by the years post 2008, as for several countries the Vulnerabilities Barometer did not revert back to pre-crisis levels. This
could be partly driven by long-lasting periods of vulnerabilities over the recent years, for a few countries such as Australia and Canada, that, so far, have not translated into financial stress.
22 Periods of financial market stress correspond to episodes with higher volatilities of market prices and simultaneous corrections of asset prices across several markets. This is a broader definition of crises that includes, but is not limited to, banking crises. This looser definition is more rele-vant in the Canadian context, given the very limited history of banking crises. Episodes of elevated financial stress include the 2008–09 period for all countries under scrutiny, although it was not associated with a banking crisis in all countries. The 1998 and 2002 episodes are also included as periods of elevated financial stress for some countries, although for the 16 developed economies we consider, they correspond to equity market corrections that followed the Asian crisis or the dot-com bubble, with limited impacts on the banking sector.
23 The Vulnerabilities Barometer is available across countries, at the earliest, in 1995, as it requires the availability of all underlying data within each country. Conversely, the computation of individual market stress components listed in Appendix 1 relies on a much longer time span that also encompasses earlier stress events, for instance in the 1980s and 1990s.
A Barometer of Canadian Financial System Vulnerabilities | Page 13
Chart 6: The Vulnerabilities Barometer is mapped into a probability of stress occurring in the subsequent two years
Notes: The probability is computed by pooling the time and cross-sectional dimensions into a simple logit model where the Vulnerabilities Barometer is the only explan-atory variable, along with a constant. We exclude the data reflecting the evolution of vulnerabilities during and immediately after a stress period, as we want to focus on the probability of entering a stressful period instead of the probability of exiting such an event. We also discard the last two years of data for which we do not know whether a stress event will eventually materialize. The dashed lines display the 68 per cent confidence bands. Note that confidence bands are likely underestimated given the time and cross-sectional correlations of the stress events taken over two years. About 5 per cent of the observations in the sample have a Vulnerabilities Barometer above 5.
5. Conclusion
The Vulnerabilities Barometer provides a summary measure of early-warning signals of financial stress that should be helpful in monitoring the evolution of vulnerabilities in the Canadian financial system. The barom-eter combines several individual measures to provide a robust representation of vulnerabilities across sec-tors. The indicators are benchmarked against the experiences of peer countries. This allows one to assess how high vulnerabilities might have to be before they become a concern for financial stability. But unlike the early-warning literature, the Vulnerabilities Barometer keeps track of the intensity of the warning sig-nals. Overall, the Vulnerabilities Barometer displays better early-warning properties than individual indica-tors like the credit-to GDP gap.
The Vulnerabilities Barometer suggests that the intensity of vulnerabilities remains at elevated levels and that vulnerabilities are now more persistent. The main vulnerabilities are related to the housing market and household indebtedness, and both have edged higher in recent years. Historically, these levels tend to be associated with an increased likelihood of subsequent financial stress.
The Vulnerabilities Barometer aims to reinforce the discipline of vulnerabilities assessment. However, the aggregate picture of Canadian vulnerabilities provided by the Vulnerabilities Barometer still has to be com-plemented with an in-depth analysis, along both quantitative (particularly distributional) and qualitative di-mensions, of each vulnerability and its evolution.
0
10
20
30
40
50
60
70
0 1 2 3 4 5 6
Prob
abili
ty o
f hig
h fin
anci
al s
tres
s oc
curr
ing
in th
e su
bseq
uent
two
year
s
Vulnerabilities Barometer
Current value for Canada
%
A Barometer of Canadian Financial System Vulnerabilities | Page 14
References Aikman, D., M. T. Kiley, S. J. Lee, M. G. Palumbo and M. N. Warusawitharana. 2015. “Mapping Heat in the U.S. Financial System.” Finance and Economics Discussion Series 2015-059. Washington: Board of Governors of the Federal Reserve System. Bank of Canada. 2017. Financial Stability Report (June). Bank of England. 2017. Financial Stability Report (June). Bank for International Settlements. 2017. “International Banking and Financial Market Development.” BIS Quarterly Review (March). Basel Committee on Banking Supervision (BCBS). 2010. “Guidance for National Authorities Operating the Countercyclical Capital Buffer.” December. Cardarelli, R., S. Elekdag and S. Lall. 2009. “Financial Stress, Downturns, and Recoveries.” International Mon-etary Fund Working Paper No. 09/100. Christensen, I., G. Kumar, C. Meh and L. Zorn. 2015. “Assessing Vulnerabilities in the Canadian Financial Sys-tem.” Bank of Canada Financial System Review (June): 37–46. Christensen, I. and F. Li. 2014. “Predicting Financial Stress Events: A Signal Extraction Approach.” Bank of Canada Staff Working Paper No. 2014-37. Drehmann, M., C. Borio and K. Tsatsaronis. 2011. “Anchoring Countercyclical Capital Buffers: The Role of Credit Aggregates.” BIS Working Paper No. 355. Drehmann, M. and K. Tsatsaronis. 2014. “The Credit-to-GDP Gap and Countercyclical Capital Buffers: Ques-tions and Answers.” BIS Quarterly Review (March): 55–73. Duprey, T. 2017. “Canadian Financial Stress and Macroeconomic Conditions.” Bank of Canada mimeo. Duprey, T., B. Klaus and T. Peltonen. 2017. “Dating Systemic Financials Stress Episodes in the EU Countries.” Journal of Financial Stability 32: 30–56. Laeven, L. and F. Valencia. 2013. “Systemic Banking Crises Database.” IMF Economic Review 61 (2): 225–270. Lee, S. J., K. E. Posenau and V. Stebunovs. 2017. “The Anatomy of Financial Vulnerabilities and Crises.” In-ternational Finance Discussion Papers No. 1191. Washington: Board of Governors of the Federal Reserve System. Li, F. and P. St-Amant. 2010. “Financial Stress, Monetary Policy, and Economic Activity.” Bank of Canada Review (Autumn): 9–18. MacDonald, C., M. van Oordt and R. Scott. 2016. “Implementing Market-Based Indicators to Monitor Vul-nerabilities of Financial Institutions.” Bank of Canada Staff Analytical Note No. 2016-5. Pasricha, G., T. Roberts, I. Christensen and B. Howell. 2013. “Assessing Financial System Vulnerabilities: An Early Warning Approach.” Bank of Canada Review (Autumn): 10–19. Repullo, R. and J. Saurina. 2011. “The Countercyclical Capital Buffer of Basel III: A Critical Assessment.” CEMFI mimeo.
A Barometer of Canadian Financial System Vulnerabilities | Page 15
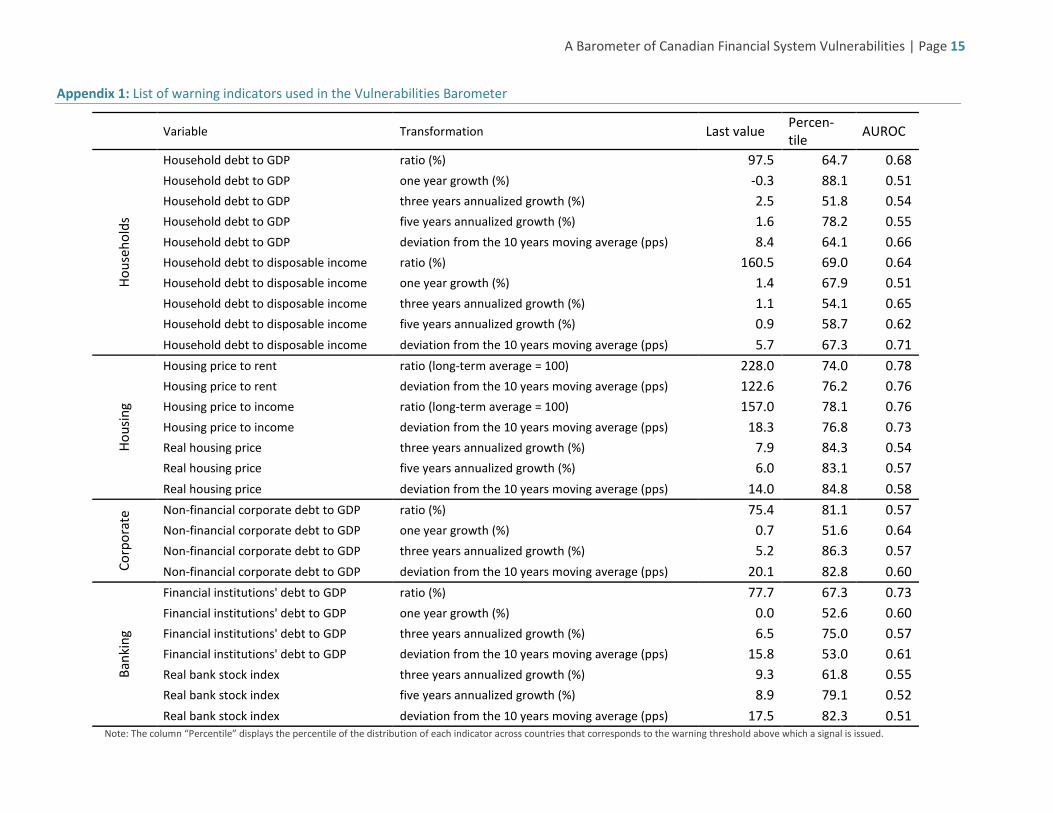
Appendix 1: List of warning indicators used in the Vulnerabilities Barometer
Variable Transformation Last value Percen-tile AUROC
Hous
ehol
ds
Household debt to GDP ratio (%) 97.5 64.7 0.68 Household debt to GDP one year growth (%) -0.3 88.1 0.51 Household debt to GDP three years annualized growth (%) 2.5 51.8 0.54 Household debt to GDP five years annualized growth (%) 1.6 78.2 0.55 Household debt to GDP deviation from the 10 years moving average (pps) 8.4 64.1 0.66 Household debt to disposable income ratio (%) 160.5 69.0 0.64 Household debt to disposable income one year growth (%) 1.4 67.9 0.51 Household debt to disposable income three years annualized growth (%) 1.1 54.1 0.65 Household debt to disposable income five years annualized growth (%) 0.9 58.7 0.62 Household debt to disposable income deviation from the 10 years moving average (pps) 5.7 67.3 0.71
Hous
ing
Housing price to rent ratio (long-term average = 100) 228.0 74.0 0.78 Housing price to rent deviation from the 10 years moving average (pps) 122.6 76.2 0.76 Housing price to income ratio (long-term average = 100) 157.0 78.1 0.76 Housing price to income deviation from the 10 years moving average (pps) 18.3 76.8 0.73 Real housing price three years annualized growth (%) 7.9 84.3 0.54 Real housing price five years annualized growth (%) 6.0 83.1 0.57 Real housing price deviation from the 10 years moving average (pps) 14.0 84.8 0.58
Corp
orat
e Non-financial corporate debt to GDP ratio (%) 75.4 81.1 0.57 Non-financial corporate debt to GDP one year growth (%) 0.7 51.6 0.64 Non-financial corporate debt to GDP three years annualized growth (%) 5.2 86.3 0.57 Non-financial corporate debt to GDP deviation from the 10 years moving average (pps) 20.1 82.8 0.60
Bank
ing
Financial institutions' debt to GDP ratio (%) 77.7 67.3 0.73 Financial institutions' debt to GDP one year growth (%) 0.0 52.6 0.60 Financial institutions' debt to GDP three years annualized growth (%) 6.5 75.0 0.57 Financial institutions' debt to GDP deviation from the 10 years moving average (pps) 15.8 53.0 0.61 Real bank stock index three years annualized growth (%) 9.3 61.8 0.55 Real bank stock index five years annualized growth (%) 8.9 79.1 0.52 Real bank stock index deviation from the 10 years moving average (pps) 17.5 82.3 0.51
Note: The column “Percentile” displays the percentile of the distribution of each indicator across countries that corresponds to the warning threshold above which a signal is issued.
Related Documents