GLOBAL PROJECT FINANCE REVIEW MANAGING UNDERWRITERS MANAGING UNDERWRITERS First Nine Months 2013

Welcome message from author
This document is posted to help you gain knowledge. Please leave a comment to let me know what you think about it! Share it to your friends and learn new things together.
Transcript
GLOBAL PROJECT FINANCE REVIEWMANAGING UNDERWRITERSMANAGING UNDERWRITERS
First Nine Months 2013
]
Project Finance Regional Breakdown Jan 1 - Sep 30
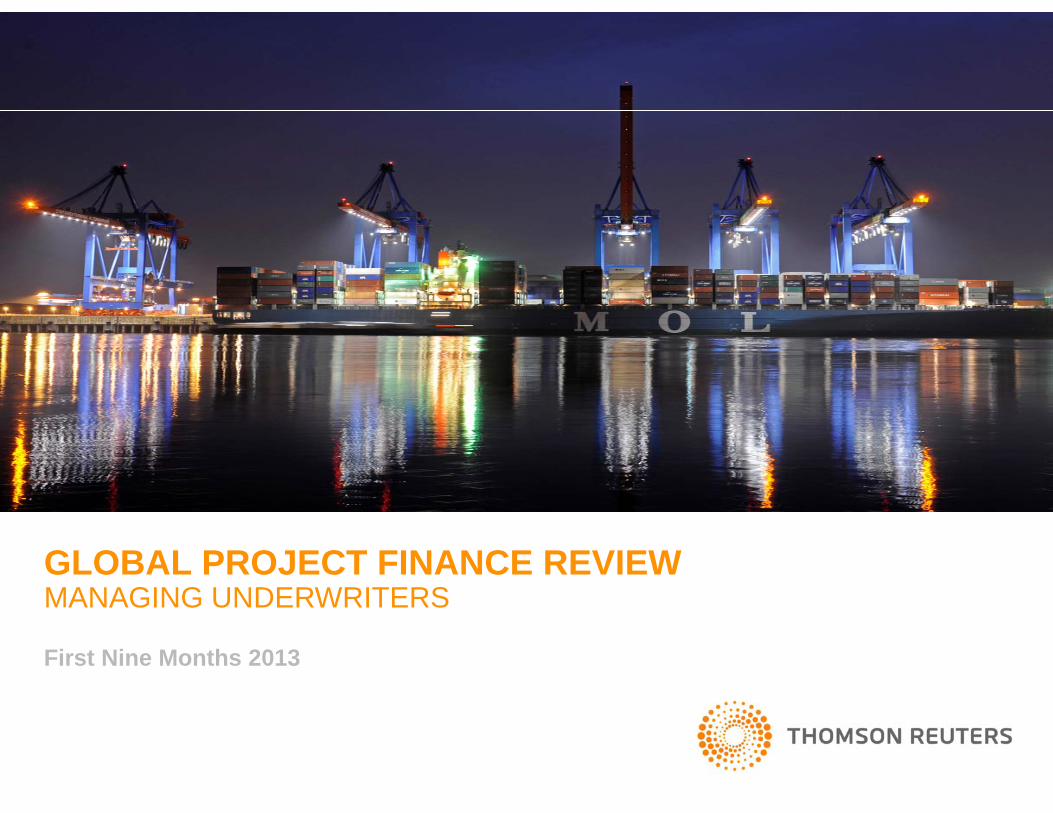
Global Project Finance for the first nine months of 2013 was recorded at US$147.5 billion, showing a slight uptick of 3%from the previous period. EMEA was the busiest market, accounting for 44.9% of global market activity.
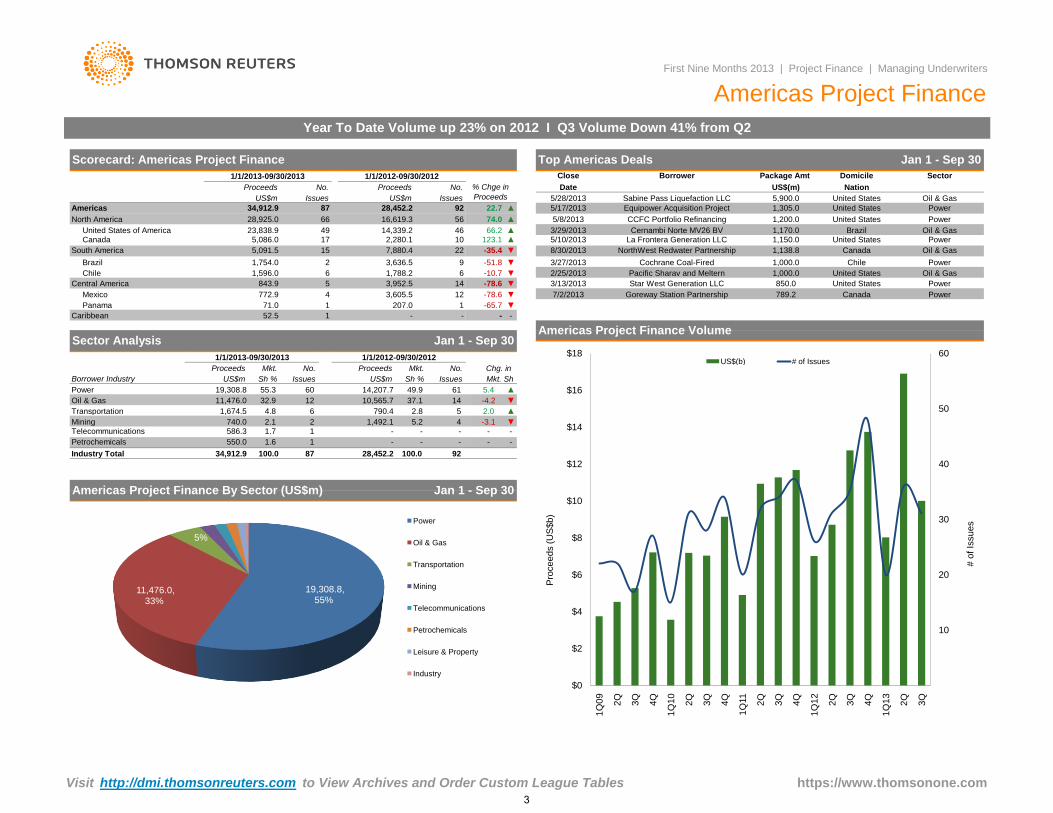
In the third quarter, Americas Project Finance experienced a 40.8% drop in proceeds compared to the second quarter,to just under US$10 billion compared to US$16.9 billion last quarter. Despite the drop off in volume, the strength of thesecond quarter drove Americas volumes in the first nine months up 22.7% compared with the same period last year.
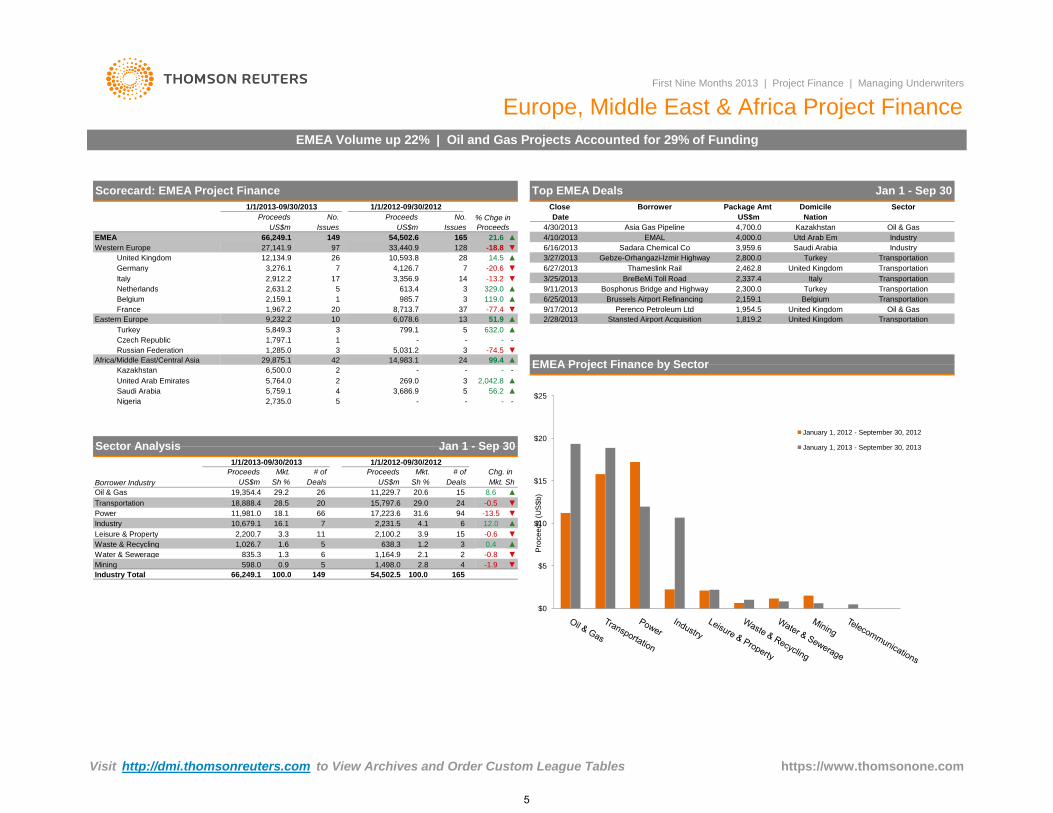
EMEA based projects in the third quarter received just US$16.3 billion of funding split amongst 38 projects, a 33.6%decrease from the US$24.6 billion raised in the second quarter. Year to date EMEA volumes were up 21.6% on thesame time last year, with the Oil & Gas and Transportation sectors accounting for 29.2% and 28.5% of volume,respectively.
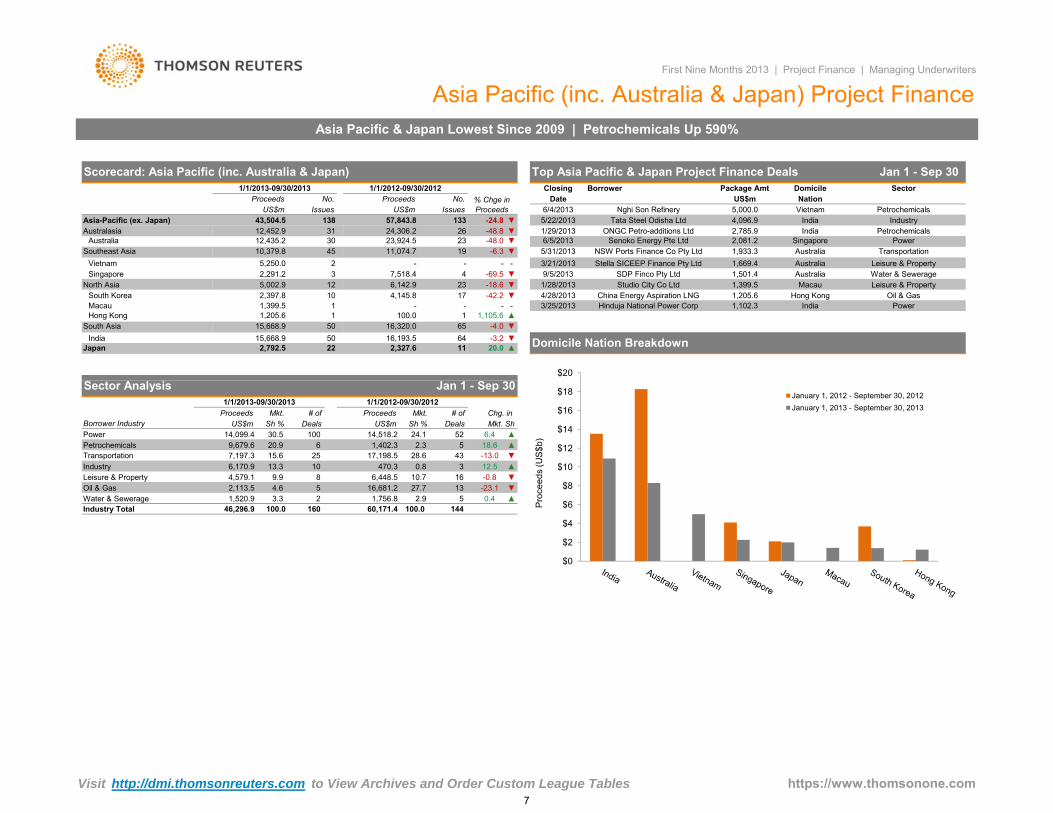
Asia Pacific and Japan volume reached US$46.3 billion in the first nine months, dropping 23.1% from the comparableperiod in 2012. The Petrochemical sector showed a 590.3% year-on-year increase, primarily driven by the US$5 billionNghi Son Refinery project in Vietnam.
First Nine Months 2013
Global Deals Intelligence
Global Project Finance Up 3% I Americas Volume Up 23% I EMEA Volume Up 22%
Global Project Finance ReviewMANAGING UNDERWRITERS
$0$20$40$60$80
$100$120$140$160$180
2009 2010 2011 2012 2013
Proc
eeds
(US$
b)
EMEA Americas Asia-Pacific & Japan
* Tie
▲▲
▲
▲
1
▲
4
-33▼
40
6
2.4
▼-4
▲3.5
2‐
▲
▼1.6 2
1
-91.2 1
-0.4%-45.0%
86,520.4
▲
147,458.9 100.0
▼
Industry Total
3.0%
▲2.00.1▲12.2▲
39683,671.7 56.9
1.01,475.1 2
19
2.02.0-
▲
▲
Credit Suisse
34
5
18
12
16
1059 9
-0.11,769.6
-
▲
4.3▼
▲
11
419
1.6
▲
4
102.1▲
161.9
▲58
2.03.56.3
0.11.21,721.2
1.0 0.51,665.5 1.11,535.9
▼
▲
1
11
10▲▼
5
‐1,467.4
6
11
55.13.5 5
17
21
JP Morgan
Natixis▲
▲ ▲2.8
-1.5
1.2 1.1 116
2.8 -8
1,862.10.3 ▲
20
1.31,818.3 1.2 14
▲
-0.3 ▼0.7
▲ 2.3
206.325
2679
▼
▲
6.6
16
Cassa Depositi e Prestiti
Korea Development BankStandard Chartered PLC
▲
▲
▲4.0
21▲▲
5.6
2-4
0
0.15
13
‐ 5.3
24▲
0.90.3
▼
ING▲▲-0.2
30
13 3.3 4
-1
▲
▼7.65.8
6.6
1,688.3▼
Bank of America Merrill Lynch 14
91019
3.9
1,740.5
1.5
▼ 6.11,767.5
2.1
▲ ▲105.91515
▲2.6
0.31.6 ▲ 9
▼
▲6242,269.9 ▲
-0.12.6
-57.54.8 Sumitomo Mitsui Finl Grp Inc
10.9▲
6 7Societe Generale▲13 7
1,840.5178 ▲
0.7
11
40
2,445.5
▲3.5
1,893.7 2.2
▼2,375.7
2,205.9
▲ 22
Credit Agricole CIB 6
HSBC Holdings PLCBarclays
8
‐
26▼
5,159.843
0.3 ▲
Deutsche Bank 10ING 9
77 64
5 4Mizuho Financial Group
3715
6
2Mitsubishi UFJ Financial Group
Sumitomo Mitsui Finl Grp Inc
2 1China Development Bank 38
4 3 6,471.6
7.5
7,700.05.9
5.6
MarketProceeds11,092.5 2.3 22
34.5
Mandated Arranger1
2012 Rank
State Bank of India ▲
3
-3▼
13.318
0.8 ▲31 5.8 1.2
▲20▲
9.8 -0.9▼ ▲
57.8
▲4.4 16.40.5
8.9▲4,997.4
▲65
748,720.7▲ 33Mitsubishi UFJ Financial Group
18.75.2
-0.1 China Development Bank10,999.5
16
3,188.0Mizuho Financial Group
1
4
State Bank of India 17,700.0 ▲
18 7.111.2▲
▼-23
34
12.7 5.3
3.7
▲▲7.5
54
2▲
13 5.1▼5 2.8Axis Bank Ltd
1.8 190.0
39
12-0.3
9
12.8
5
1.72,541.61.8
3,389.2
▼
3.5
2.12.0 23
▲
National Australia Bank
1321 2,344.111
2,888.12,637.5
15RBC Capital Markets 14
1.5
2,322.9
1819
17
Axis Bank LtdStandard Chartered PLC
1112
Societe Generale
20
NatixisCommonwealth Bank of Australia
BNP Paribas SA
0.4-0.5
1.42,163.0
1.5
1.6
16
51524
32
12
CIBC World Markets Inc
16
8
23
Goldman Sachs & Co 21ANZ Banking Group
124*36
Bank of America Merrill Lynch
2298
14
3,120.9
1.72,445.5
1.62,294.2
1,793.4
2,196.9
-0.2
1.617 0.0
-0.3
Top Twenty Five Total2524JP Morgan
Korea Development Bank
Credit Suisse
23
MarketSh Ch.
# of
1.5
2,159.0 1.5
2.3
ScotiabankRBS 25
National Australia Bank
8
5.1
4 1.0▲
22
20
BNP Paribas SA
272
23UniCredit
15 18
2,152.7
9
13
10Deutsche Bank
8
RBC Capital MarketsCredit Agricole CIB
Goldman Sachs & Co
Barclays
Sh %Proceeds Sh Ch.Change in Market
Deals # of DealsDeals2012 Rank
# of# of Deals
# of Deals per ArrangerChange in 2013
RankMarket
Proceeds per Mandated Arranger (US$m)
Sh % Sh %
# of Deals per BookrunnerMarket2013
Rank Sh %
-1.7 7.5
Bookrunner
Proceeds per Bookrunner (US$m)Market
2.0▲ 9 3.5▲▼
2.771.6 0.5 ▲1.4 1.4 ▲1,249.0 0.4
6▼1.3
1.7 0.41,402.1
13▲
4.3▲ 11
1,204.6 1.4 0.6
5 2.0▲0.11.2
1.2 0.2-4.1
1,028.8
875.0
996.2
26
1,044.81,119.3
22
24
▲1.2
0.7
0.6
1.049 850.2
2042
59,082.4 ▲19.2
0.0-0.1 ▼
-1.01.1963.0
0.8▲ 2
9
255 -1100.0
▼
Jan 1 - Sep 30
▼
68.4▲2.4
Top Twenty Five Total
Industry % Change over Same Period Last Year
33
-38.9%11.6%
-11.5%Industry % Change over Last Quarter
Global - Mandated Arrangers (X2) Global - Bookrunners (X3)Jan 1 - Sep 30
Industry % Change over Last Quarter
Industry Total -5
▲-1.2%-3.0% ▼
▼▼
Industry % Change over Same Period Last Year
https://www.thomsonone.comVisit http://dmi.thomsonreuters.com to View Archives and Order Custom League Tables
1
Industry
Kazakhstan
Utd Arab Em
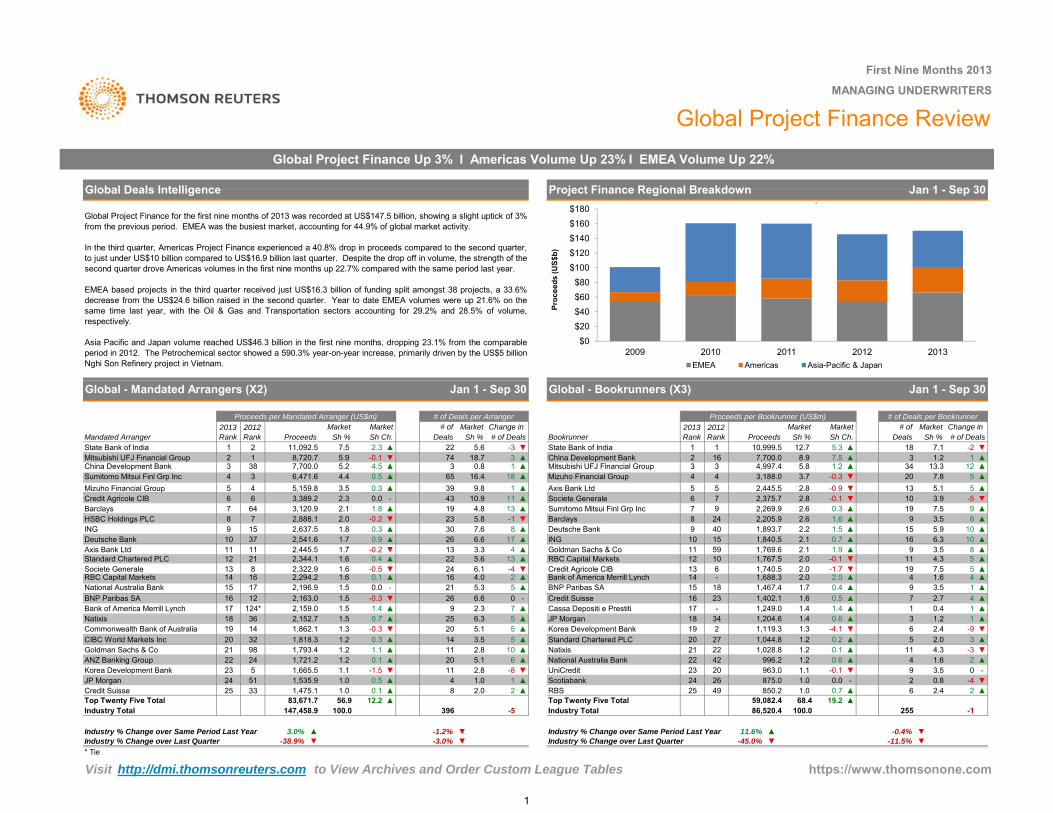
Top Global Project Finance Deals Jan 1 - Sep 30
2,337.4
India
▲
Asia-Pacific
8
1/29/2013Thameslink Rail
-
▼
▼
Italy99.4
3/27/201321.6
-
Global Project Finance By Sector (US$m)
Transportation3/25/2013275.1
3,959.64,000.0
2,462.8BreBeMi Toll Road
74.0 Sadara Chemical CoGebze-Orhangazi-Izmir Highway
2,785.9▲ 6/27/2013
Oil & Gas
TurkeyPetrochemicalsTransportation
Industry
United Kingdom
Saudi Arabia
IndustryIndia
133 -24.8
▲164.2158.7
128
11
-18.8▲
▼
51.9141 -8.0
Eastern EuropeWestern Europe
2,914.0
48 8 ▼12 452 9 24 306 2
-24
27
27,141.9 97 33,440.9
2
57,843.831
6,078.6
138
13
26
5,377.512
Europe
EMEA
North America
36,374.0
Sub-Saharan AfricaMiddle East
-Africa/Middle East/Central Asia
Central Asia
8,262.3
Transportation
First Nine Months | Project Finance | Managing Underwriters
Sector
Scorecard: Global Project Finance
Issues Sabine Pass Liquefaction LLC
▲ 6/16/2013
4/30/20135/22/2013
EMAL▼
Asia Gas PipelineTata Steel Odisha Ltd
Proceeds
5,091.5
2,800.0
Vietnam
66,249.1
873,952.5
34,912.9Nghi Son Refinery
No.
14
165 ONGC Petro-additions Ltd
143,126.1 3.0401
54,502.614,983.1
92
US$mNo.
US$mProceeds
Issues396 Petrochemicals
39,519.5
43,504.5
North Africa
Australasia
13,912.8
4,488.8 3
15843.9
22
Global 147,458.9
3
9,232.1107
149
7,700.0
28,925.0
10
29,875.1
4/10/2013
42
2,202.8
5666 16,619.3
▲-
▲
South AmericaCentral America 5
28,452.2
7,880.4
Americas
Closing
6/4/2013
▼
5,900.0US$m
4,096.9
5/28/2013
4,700.0-78.6
▲22.7
▲
Oil & Gas% Chge in Proceeds
NationPackage Amt
5,000.0
-35.4
United StatesRegion
Borrower DomicileDate
1/1/2013-09/30/2013 1/1/2012-09/30/2012
Global Project Finance
Caribbean 52.5 1 - - -
3% 2%
Note: 2013 League Tables are based on fully syndicated project finance volume.
Mkt.
4.1
▼30.8
-4.8
▼19▼
▼
Mkt. Sh
-4.6
Chg. in
26.9 207 -1.3
72
-18.6
Sector Analysis
-4.0
-6.3
▼
▼
100.0▲▼
4,021.0
5 0.2100.0
▲
▼▲
11 2.2 2.8 7
-1.5
5 0.6 2.2
12 -1.7
9,181.0
9.3
3,190.6▲
3,196.8
-0.634
0.5
▼6.4
7
10
147,458.9Industry Total 401
0.7
396
1 801.5
143,126.1
1,948.0Mining
7,197.1
32,943.8
1.6 1.3
4.9 8
18.8 22.3
45,949.5
1/1/2012-09/30/2012Proceeds
38,476.633,786.5
42 23.6
-48.8 ▼
2,792.5
12,452.9
20.0 ▲
24,306.2
11
US$m
6,142.9
Sh %
4531
22
Project Finance Sector
16,320.0
10,379.8
Sh %
23
32.1
26
No.Issues
No.
2,327.6
US$m
65505,002.9
Oil & Gas
Australasia
10,229.611.5 18
43
Mkt.Proceeds
11,074.7
Water & SewerageTelecommunications
226
23 Leisure & Property
17,010.051
2,356.2
Petrochemicals
27,760.2Industry
6.9
12
1/1/2013-09/30/2013
Japan
Issues
Transportation
45,389.2Power
South AsiaNorth Asia
15,668.9
Southeast Asia
1,338.0 0.9 7 3,750.7 2.6 Waste & Recycling 1,072.2 0.7 6 772.0
45,389.231%
32,943.822%
27,760.219%
17,010.011%
7%
5%
3% 2%
Power
Oil & Gas
Transportation
Industry
Petrochemicals
Leisure & Property
Water & Sewerage
Telecommunications
Mining
https://www.thomsonone.comVisit http://dmi.thomsonreuters.com to View Archives and Order Custom League Tables
2
▼
Panama 71.0 1 207.0 1 -65.7 ▼
Mexico 772.9 4 3,605.5 12 -78.6
550.0 1.6 1 - - - - -
- - -
100.0
5.2
11,476.0
Telecommunications 586.3 1.7 1 - -
Petrochemicals
49.9 14,207.7
Sh %
Jan 1 - Sep 30
2.1 1,492.1
55.3
Sector Analysis
740.0
Americas Project Finance Volume
Proceeds Chg. in
28,452.2
Issues
1/1/2012-09/30/2012
Borrower Industry
19,308.8
87 92
Mkt.
1/1/2013-09/30/2013
4
2.8
61
5
14 37.1
Mkt. Sh
▲
-4.2
5.4
▲
▼
▼
First Nine Months 2013 | Project Finance | Managing Underwriters
No.
Americas Project Finance
2.0
Year To Date Volume up 23% on 2012 I Q3 Volume Down 41% from Q2
6 790.4
2
Power
Oil & Gas
No.
Oil & Gas
Power
Power
Oil & Gas
7/2/2013
2/25/2013 Pacific Sharav and Meltern Oil & Gas
3/13/2013
Industry Total
PowerChile
Canada
United States
NorthWest Redwater Partnership8/30/2013
United States5/8/2013
United States
United States
CCFC Portfolio Refinancing
5/10/2013 La Frontera Generation LLC
Oil & Gas
1,305.0
Cernambi Norte MV26 BV
Cochrane Coal-Fired
https://www.thomsonone.com
Star West Generation LLC
1,000.0 United States
Power
Issues US$m
Transportation 1,674.5 4.8
Power
US$m Sh %
Mkt.Proceeds
-78.6
12
100.0
10,565.7
-3.1
32.9
▼
▼
-51.8 3/27/2013 1,000.0
3/29/2013
1,200.0
Sabine Pass Liquefaction LLC 5,900.0
Domicile
Brazil1,150.0
5/28/2013
Jan 1 - Sep 30Top Americas Deals
Date
5/17/2013 Equipower Acquisition Project
6
850.0 United States
Goreway Station Partnership
Chile 1,596.0 6 -10.7 ▼
▼
Close Borrower Sector
789.2
US$(m)
1,138.8
Canada
Power
Package Amt
Proceeds No. Nation
1,170.0
▲
▲
▲46 66.2
1/1/2012-09/30/2012
▲
-35.4
Americas
Scorecard: Americas Project Finance
1/1/2013-09/30/2013
% Chge in
Proceeds
Proceeds No.
92 22.734,912.9 87 28,452.2
US$m Issues US$m Issues
14,339.2
74.0
17 2,280.1Canada
Brazil 1,754.0 2 3,636.5
56
South America
5,086.0
North America
10 123.1
9
28,925.0 66 16,619.3
49
60
Mining
United States of America 23,838.9
15 7,880.45,091.5 22
1,788.2
Americas Project Finance By Sector (US$m) Jan 1 - Sep 30
Central America 843.9 5 3,952.5 14
34,912.9
Visit http://dmi.thomsonreuters.com to View Archives and Order Custom League Tables
-Caribbean 52.5 1 - - -
10
20
30
40
50
60
$0
$2
$4
$6
$8
$10
$12
$14
$16
$18
1Q
09
2Q
3Q
4Q
1Q
10
2Q
3Q
4Q
1Q
11
2Q
3Q
4Q
1Q
12
2Q
3Q
4Q
1Q
13
2Q
3Q
# o
f Is
su
es
Pro
ceeds (
US
$b)
US$(b) # of Issues
19,308.8,55%
11,476.0,33%
5%
740.0 , 2%
586.3 , 2%
550.0 , 2%417.3 , 1%
160.0 , 0%Power
Oil & Gas
Transportation
Mining
Telecommunications
Petrochemicals
Leisure & Property
Industry
3
* Tie
1.0 ▲- 291.1 1.0
Wells Fargo & Co 24 - 298.3 1.0
- 308.2
Bayerische Landesbank Giro 25
Natixis 23
Nord/LB 21
▲
▲ 2 2.9 2 ▲
4 5.7 4
1.0
1.0 ▲ 4 5.7 4 ▲
▲ 2 2.9 2 ▲
1.0
UBS 22 - 350.8 1.2 1.2
1.2 ▲ 6 8.6 6 ▲
▲ 2 2.9 2 ▲
- 365.9 1.2
1 1.4 1 ▲
Standard Chartered PLC 20 - 367.8 1.2 1.2
5.7 0 -
Grupo Financiero Inbursa SA 19 - 417.4 1.4 1.4 ▲
-2 ▼
BBVA 18 12 421.1 1.4 -1.8 ▼ 4
492.8 1.6 -7.4 ▼ 3 4.3HSBC Holdings PLC 17 2
Credit Agricole CIB 14 3
10
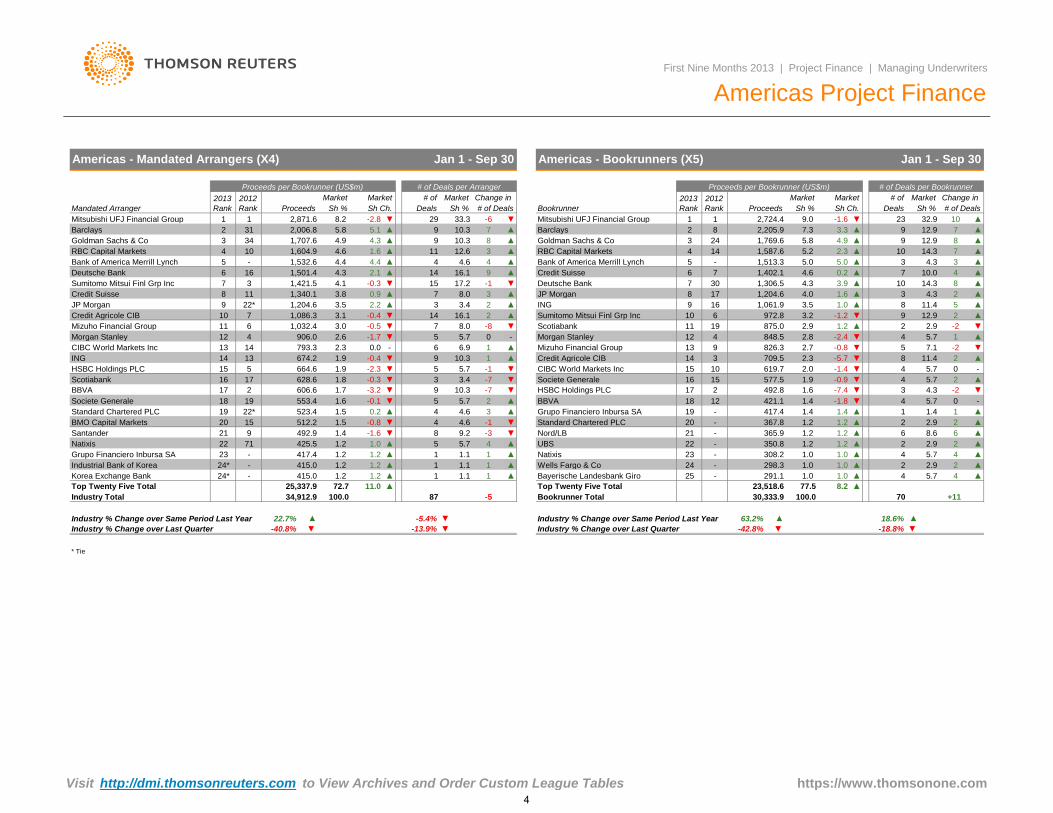
Americas - Mandated Arrangers (X4) Americas - Bookrunners (X5)
30,333.9 70 +11100.0
▼
▲
-18.8%
Top Twenty Five Total 8.277.523,518.6
-42.8% ▼
8734,912.9
18.6%Industry % Change over Same Period Last Year ▼ Industry % Change over Same Period Last Year
Industry Total 100.0
▲
-0.9
-1.4 -
▼
-5.4%
1.9
▼2.0
Industry % Change over Last Quarter
▲
15 577.5
Bookrunner Total
Societe Generale 16 ▲▼ 4 5.7 2
4 5.7 0
709.5
10 619.7CIBC World Markets Inc
-0.8 ▼2.7
2.3 -5.7
15
▲▼
5 7.1 -2 ▼
8 211.4
▼
Morgan Stanley 12 4 848.5
Mizuho Financial Group 13 9 826.3
-2
2.8 -2.4
1.2
6 -1.2
▲▼ 4 5.7 1
2 2.9▲Scotiabank 11 19 875.0
1.0ING 9
3.2
2.9
16
9 12.9
▲
▲
8 11.4
2▼Sumitomo Mitsui Finl Grp Inc
4.0
3.51,061.9
8 17 1,204.6
972.8
JP Morgan ▲▲ 3 4.3 2
5▲
Credit Suisse 6 7 1,402.1
1.6
Deutsche Bank 7 30 1,306.5 4.3
0.24.6
▲10 14.3 83.9 ▲
4.3 3 ▲
▲ 7 10.0 4 ▲
75.2 2.3
▲
▲
▲ 8
▲ 10 14.3
5.0 ▲
9
94.9
1,513.3
1,587.6
35.0
5.8
5 -
2,205.9
Goldman Sachs & Co 3 24 1,769.6
77.3 3.3 ▲ 12.9
12.9
Industry % Change over Last Quarter ▼
▲
▲
RBC Capital Markets
87
25,337.9
1.2
1.2
Top Twenty Five Total
1Mitsubishi UFJ Financial Group 1
2
-6 ▼
4 14
Bank of America Merrill Lynch
▲
415.0
72.7
Korea Exchange Bank 1 ▲1.124*
415.0
1
▲
417.4
1
-
11.0
1.2
23
425.5
Industrial Bank of Korea 24* 1.1 1
1.1 11.2
1.2-
1.2
▲
-1.6
5 5.7
Grupo Financiero Inbursa SA -
Natixis 22 71 1.0
▼ 4 4.6 -1
1.2
▼ 81.4 9.2
Standard Chartered PLC
-0.8
1.5 4.6
Santander 9 492.921
BMO Capital Markets 20 15 512.2
-0.1
▲
▼ 5 5.7 2 ▲
0.2 ▲ 4
Societe Generale 18 19 553.4 1.6
19 22* 523.4
▼ 3 3.4 -7 ▼
▼ 9 10.3 ▼-3.2BBVA
▲
-2.3 ▼ 5
1.7
Scotiabank 16
HSBC Holdings PLC
17 2 606.6
17 628.6 1.8 -0.3
CIBC World Markets Inc - 6
5 664.6
ING 14
13
13 674.2
5.7
14 793.3
2.6
1.9
▼ 9-0.4
2.3
10.3
Morgan Stanley 12 4 906.0
15
6.9
-1.7
1.9
5.7
0.0
11
▼ 14
6
7
▼ 5
16.1
▼ 7 8.0
-0.4
-0.5Mizuho Financial Group
▲
2.2 ▲ 3
3.0
Credit Agricole CIB 10
JP Morgan 22*
▲ 7 8.0
1,032.4
3.4
0.93.8
1,086.3 3.1
3.5
Credit Suisse 8 11 1,340.1
1,204.69
Bank of America Merrill Lynch 5
2.1
-0.37 3 1,421.5Sumitomo Mitsui Finl Grp Inc
Deutsche Bank 6 16 1,501.4
4.1
4.3 ▲ 14
▼ 15
4.4 4.6- 1,532.6 4.4 ▲ 4
▲ 11 12.64.6 1.6
▲4.3 10.34.9
RBC Capital Markets 4 10 1,604.9
3 34 1,707.6
Sh %
29
Goldman Sachs & Co
1
2012
RankBookrunner ProceedsProceeds
Mitsubishi UFJ Financial Group -2.8 ▼
Barclays 2 31
1 10
# of Deals
2,006.8 5.8
2,871.6
9
8.2
Sh Ch.
5.1 ▲
1
-1
▼
▲
0 -
1
▲
-1
2
3
9
3
9 8
# of Change in # of
-1.6
▲
▲
9.0
# of Deals
▲
23 32.9
Jan 1 - Sep 30
Americas Project Finance
MarketMarket Change in 2013
Rank Sh Ch.
2013
Rank
Market
Deals
First Nine Months 2013 | Project Finance | Managing Underwriters
Mandated Arranger
3
-7
▲
Deals Sh %
▲
4 ▲
▲
-3
-8
33.3
▲
Market
Sh %Sh %
10.3
Market
2
Jan 1 - Sep 30
Barclays
# of Deals per Bookrunner
▼
# of Deals per Arranger
▼
Proceeds per Bookrunner (US$m)
▲
▼
2012
Rank
Market
17.2
2,724.4
▲
16.1
4
▼
▼
▲
Proceeds per Bookrunner (US$m)
-13.9%
Visit http://dmi.thomsonreuters.com to View Archives and Order Custom League Tables
22.7%
-40.8%
63.2%
https://www.thomsonone.com
-5
▲
1.5
1
4
54,502.5
Visit http://dmi.thomsonreuters.com to View Archives and Order Custom League Tables
165 100.0
Scorecard: EMEA Project Finance
-1.9
1.2
▼
6
Mining 598.0
▲Waste & Recycling
BreBeMi Toll Road
Oil & Gas
Industry
3
Water & Sewerage 835.3
5
5
100.0
3.3
1.3 -0.8
149
15
▼0.9
1,026.7 1.6
1,498.0
Jan 1 - Sep 30
Package Amt
2
Top EMEA Deals
4,700.0
Industry Total 66,249.1
▼
11 2,100.2 3.9
638.3
-0.6
1,164.9 2.1
0.4
Domicile
4/30/2013
Leisure & Property 2,200.7
1/1/2013-09/30/2013
Sector
Nation
BorrowerClose
Kazakhstan
Industry
Asia Gas Pipeline
US$mDate
Transportation
Saudi Arabia
Bosphorus Bridge and Highway
Brussels Airport Refinancing
Transportation
Oil & Gas
US$m Sh % Mkt. Sh
15 11,229.7
Mkt.
2,231.5 4.1
29.0
31.6
Proceeds
1/1/2012-09/30/2012
Industry 10,679.1 16.1 7 12.0
94
-0.5
US$m
Power
Deals
▼-13.5
▲6
2.8 4
Turkey
United Kingdom
Italy
Perenco Petroleum Ltd
Belgium
https://www.thomsonone.com
▲
EMEA Project Finance by Sector
▲
6/25/2013
2,337.4
1,954.5
Stansted Airport Acquisition United Kingdom2/28/2013
20
Jan 1 - Sep 30
8.6
Transportation 18,888.4
26
3/27/2013
Transportation
9/17/2013
6/27/2013
3/25/2013
Thameslink Rail
9/11/2013
66
Oil & Gas
11,981.0
28.5
29.2
17,223.6
Chg. in
▼
18.1
Turkey
# ofProceeds
Borrower Industry
Sector Analysis
20.6
Deals
19,354.4
Mkt.
Sh %
6/16/2013
EMEA
Gebze-Orhangazi-Izmir Highway
4/10/2013
3,959.6
15,797.6
4,000.0
2,462.8
2,800.0
Sadara Chemical Co
66,249.1
2,159.1
Transportation
First Nine Months 2013 | Project Finance | Managing Underwriters
EMEA Volume up 22% | Oil and Gas Projects Accounted for 29% of Funding
Transportation
Europe, Middle East & Africa Project Finance
EMAL Utd Arab Em
Transportation2,300.0
United Kingdom
1,819.2
24
# of
1/1/2013-09/30/2013
% Chge in
Proceeds
Proceeds No. Proceeds No.
US$m Issues US$m Issues
149 54,502.6 165 21.6 ▲
Western Europe 27,141.9 97 33,440.9 128 ▼
United Kingdom 12,134.9 26 10,593.8 28 14.5
7 4,126.7 7 -20.6
-18.8
▲
▼
Italy 2,912.2 17 3,356.9 14 -13.2
▼France 1,967.2
▼
Germany 3,276.1
119.0 ▲
Netherlands 2,631.2 ▲
Belgium 2,159.1 1 985.7 3
5 613.4 3 329.0
3 799.1 5 632.0
37 -77.420 8,713.7
▼
Eastern Europe 9,232.2 ▲10 6,078.6 13 51.9
Turkey 5,849.3
3 -74.5
1 - - -Czech Republic 1,797.1
24 99.4 ▲
Russian Federation 1,285.0 3 5,031.2
-
Kazakhstan 6,500.0 2 - - -
-
Africa/Middle East/Central Asia 29,875.1
56.2 ▲
United Arab Emirates 5,764.0 2
42 14,983.1
5 - - -
269.0
-
2,042.8
1/1/2012-09/30/2012
Nigeria 2,735.0
▲
Saudi Arabia 5,759.1 4 3,686.9 5
3
$0
$5
$10
$15
$20
$25
Pro
ce
ed
s (
US
$b)
January 1, 2012 - September 30, 2012
January 1, 2013 - September 30, 2013
5
* Tie * Tie
-0.6 ▼ 3 3.8 1 ▲
▲ 7 8.8 5 ▲
DNB ASA 25 20* 170.2 0.6
Nord/LB 24 42 176.1 0.6 0.4
0.7 ▲ 1 1.3 1 ▲
▼ 1 1.3 0 -
Societe Federale de Participat 21* - 179.9 0.7
Santander 21* 16* 179.9 0.7 -1.2
-3.0 ▼ 1 1.3 -1 ▼
▼ 3 3.8 1 ▲
RBC Capital Markets 21* 7 179.9 0.7
Citi 20 20* 233.3 0.9 -0.3
▲
100.0 8027,505.6
32.977.0
1
21,177.2
https://www.thomsonone.com
17
▲
9 ▲
▲
▲
Visit http://dmi.thomsonreuters.com to View Archives and Order Custom League Tables
Change in
# of Deals per Bookrunner
Market2013
Rank # of Deals
2012
Rank
▼-9.7% -14.9%
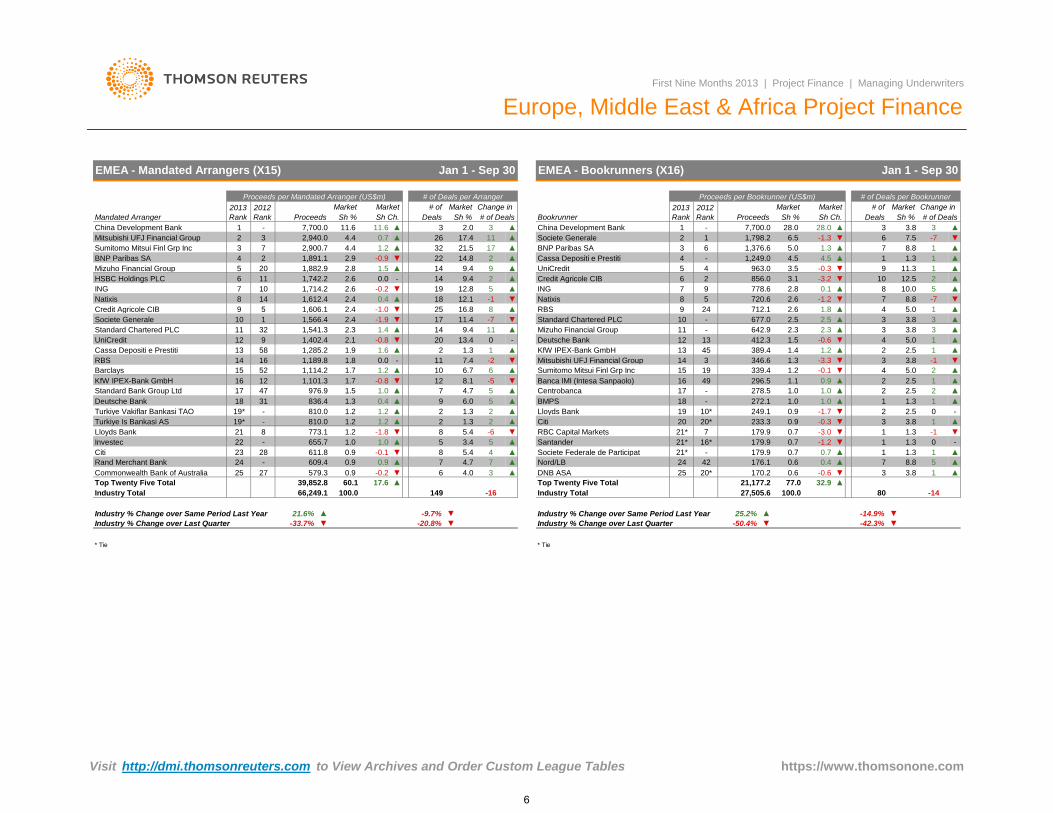
-42.3%Industry % Change over Last Quarter -50.4%
EMEA - Mandated Arrangers (X15)
Europe, Middle East & Africa Project Finance
3
-0.2
Proceeds per Bookrunner (US$m)
Change in # of2012
Rank
- 7,700.0
Jan 1 - Sep 30EMEA - Bookrunners (X16)
# of Market
Sh % Sh Ch. Bookrunner
Sumitomo Mitsui Finl Grp Inc 3
BNP Paribas SA
1
4
2,940.03Mitsubishi UFJ Financial Group 2
DealsMandated Arranger
2013
Rank
Market
Sh %
Jan 1 - Sep 30
Proceeds
▲
First Nine Months 2013 | Project Finance | Managing Underwriters
Proceeds per Mandated Arranger (US$m)
4.4 0.7
# of Deals per Arranger
3 ▲
# of Deals
Market
2.0
▲
26 17.4
China Development Bank
▲ ▲11
311.6
Market
11.6 China Development Bank
Deals
▲
4.4
1,882.9
2
7 1.22,900.7 ▲
▲
▼ 22 14.8 2
14
21.532
Mizuho Financial Group 5
1,891.1
1.5 9.42.820
2.9 -0.9
-HSBC Holdings PLC 6 11 1,742.2 0.02.6 ▲14 9.4 2
19 12.8 5
Credit Agricole CIB 16.8 8 ▲
▲
▼12.1 -1
▼10 2.6ING 7
Natixis 8 14 1,612.4
1,714.2
1,606.1
2.4 0.4
9
▲
-1.0 ▼2.4
18
25
17
Standard Chartered PLC 11 32 1,541.3 2.3
5
Societe Generale 10 1 1,566.4 2.4 11.4▼ -7
14 9.4 11
2.1 -0.8
1.4 ▲
-1.9
-▼ 0
-2
UniCredit 12 9 1,402.4
▲58 1,285.2Cassa Depositi e Prestiti 13 2 1.3
20 13.4
11 7.41.8 0.0
1.6 ▲
-
1.9
RBS 14 16 1,189.8
Barclays 15 52 1,114.2 1.2 ▲
▼▼ -5
1.7 10 6.7 6
KfW IPEX-Bank GmbH 16 12 1,101.3 12 8.11.7 -0.8
57 4.7
9 6.0 5
Standard Bank Group Ltd 17
1.3 0.4
1.0 ▲
▲
1.547 976.9
1.2
Deutsche Bank 18 31 836.4
Turkiye Vakiflar Bankasi TAO 19* - 810.0 2 1.3 2
773.1
▲
1.2 1.2
1.2 ▲
▲▲ 2 1.3
1.0 1.0
Turkiye Is Bankasi AS 19* - 810.0
-1.8
Rand Merchant Bank 24
Lloyds Bank 21 8
Investec 22 -
Commonwealth Bank of Australia 25 27 579.3
0.9
655.7
23 28 611.8Citi
4.7
-0.2
▲
▼0.9
- 609.4
60.1
Industry % Change over Same Period Last Year 21.6% ▲
Top Twenty Five Total
Industry Total
39,852.8
0.9 -0.1
UniCredit
5
4.0
1
▼
▼1.2
▲
8
BNP Paribas SA
Cassa Depositi e Prestiti
KfW IPEX-Bank GmbH
Societe Generale
▼ -6
5
Centrobanca
▲17.6
6 3 ▲
4
▲70.9 7
Natixis
Banca IMI (Intesa Sanpaolo)
▲
▲
▼
▲
▲
▼
-16
▲3.4
4 -
6
5
Standard Chartered PLC
5
Mitsubishi UFJ Financial Group
BMPS
2
66,249.1
Industry % Change over Last Quarter -33.7% ▼ ▼-20.8%
100.0 149
1
8 5.4
ING 7 9
14 3
5.4
3 6
8
RBS 9 24
2Credit Agricole CIB
Mizuho Financial Group
28.0 3 3.8
Sh Ch. Sh %
▲
Sh %
Market
-1.31,798.2 6.5
1 - 7,700.0 28.0
2
Proceeds
▼
▲8.8
▼
▲
6 7.5 -7
▲
4.5 ▲
▲▼ 93.5 -0.3
10 12.5
1,376.6 1.35.0
11,249.0
17
1 1.34.5
2
11.3 1963.0
-3.2 ▼3.1856.0
7 8.8
5.0
▲
4
▲2.8778.6
720.6 -1.2 ▼2.6
0.1
3 ▲
4
▲8 10.0
▼
▲
5
-7
1
2.3
2.5 ▲
▲ 3 3.8
3 3.810 - 677.0
2.3
2.5
11 - 642.9
▲712.1 2.6 1.8
▲
Deutsche Bank 12 13 412.3 1.5 -0.6 ▼ 4 5.0 1
3
▲
-1 ▼
▲2 2.5 113 45 389.4 1.4 1.2
▼
▲
346.6 1.3
▲4 5.0 2
3.8-3.3 3
Sumitomo Mitsui Finl Grp Inc 15 19 1.2339.4
12 2.5
-0.1
49
11.0 ▲18 - 272.1 1.3
296.5 1.1
▼
▲2 2.5 2
▲0.9 ▲
17 - 278.5
1.0
0 -
1.0 1.0 ▲
Lloyds Bank 19 10* 249.1 2 2.50.9 -1.7 ▼
▼
▼▲
▼
16
Top Twenty Five Total
Industry Total -14
Industry % Change over Same Period Last Year 25.2%
6
1,105.6 ▲-4.0-3.2
1Hong Kong
1/1/2012-09/30/2012
Hinduja National Power Corp Power1,205.6
Stella SICEEP Finance Pty Ltd
1,399.5China Energy Aspiration LNG
AustraliaSDP Finco Pty Ltd
Nghi Son RefineryTata Steel Odisha Ltd
NSW Ports Finance Co Pty Ltd5/31/2013
5/22/20131/29/20136/5/2013
3
India
India
PetrochemicalsPower
ONGC Petro-additions Ltd 2,785.9
1/28/2013 Macau
3/21/20139/5/2013
4/28/20133/25/2013
Japan
1,102.3
Domicile Nation Breakdown
Singapore1,933.32,081.2
Hong Kong
Australia Leisure & PropertyTransportation
Oil & Gas
Australia
1,501.4
DatePackage Amt
US$m
Leisure & PropertyWater & Sewerage
VietnamIndia
Nation
4,096.9 IndustryPetrochemicals5,000.06/4/2013
First Nine Months 2013 | Project Finance | Managing Underwriters
Asia Pacific (inc. Australia & Japan) Project FinanceAsia Pacific & Japan Lowest Since 2009 | Petrochemicals Up 590%
Borrower SectorClosing
1,669.4
Senoko Energy Pte Ltd
Studio City Co Ltd
DomicileProceeds No.
IssuesAsia-Pacific (ex. Japan) 43,504.5
Scorecard: Asia Pacific (inc. Australia & Japan)1/1/2013-09/30/2013
% Chge in Proceeds
Proceeds No.US$m Issues US$m
Australia 12,435.2 30 23,924.5
138 57,843.8 133
Southeast Asia 10,379.8 45
Australasia 12,452.9 31 24,306.2 2623
▼▼▼
-48.8-48.0
-24.8
Vietnam 5,250.0
-18.6 ▼
- - - -Singapore 2,291.2
17 -42.2
▼7,518.4
4,145.823
▼
-69.54North Asia 5,002.9 12 6,142.9
10
1,205.6Macau 1,399.5South Korea 2,397.8
16,320.0India 15,668.9
6550 16,193.5
Jan 1 - Sep 30Top Asia Pacific & Japan Project Finance Deals
2,792.5 22 2,327.6 11 20.0 ▲▼
1▼
100.0
11,074.7 19 ▼-6.3
1 - - - -
2
64South Asia 15,668.9 50
$20
1/1/2012-09/30/2012Mkt.
Borrower Industry
Sector Analysis
Proceeds
Leisure & Property 9.9 4.6
Petrochemicals30.5 52 Power 14,099.4
Industry 6,170.915.6 7,197.3
Oil & Gas2 5
10
1,402.3
13.3
100 5
US$m Sh %
9,679.614,518.2
160
Transportation 28.6
5 -23.12,113.5
4,579.1
1/1/2013-09/30/2013
20.9 6
Water & Sewerage 1,520.9 3.3 Industry Total 46,296.9 100.0 100.0
16,681.26,448.5
144 60,171.4
-0.816 ▼
1,756.8
17,198.5
2.9 27.7
0.413
6.4
12.5-13.0
▼
▲
▲
Sh % Deals# of
▼2.3
0.8
▲18.6
Deals US$mChg. in Proceeds# of
3 43
470.3
Mkt. ShMkt.
▲
25
8
Jan 1 - Sep 30
10.7
24.1
$0
$2
$4
$6
$8
$10
$12
$14
$16
$18
Pro
ceed
s (U
S$b
)
January 1, 2012 - September 30, 2012January 1, 2013 - September 30, 2013
https://www.thomsonone.comVisit http://dmi.thomsonreuters.com to View Archives and Order Custom League Tables7
Asia Pacific (inc. Australia & Japan) Project Finance
10
12
3 15
13
1.8
CIBC World Markets Inc
Korea Development Bank
9
State Bank of India
▲
▲ ▲▲
1.0
▼
1 5
-6
3
6
4
▲
10
33 ▲
1.1837.1
677 9KB Financial Group Inc
▲
NongHyup Financial Group Inc
ICICI Bank Ltd
15 0 8239 2 0 8 ▲2▲ 1 9 +2+1
▼114 -
+26.771.1
453.0 1.61.1
-2.1324.0
+11.01▲497.5 1.7 ▲1.8 +31.6
-3.8▼
2.0
1.7
0 -4 3.8
10 7 558.1 2.0 -1.2 4▲
1.9 ▲ 1.01
11 526.9 ▲32
+5+2023
579.4
▲
▲▲
0
▲3.3
741.9 2.6 2.5▲ 6 5.71.5▲ 21.9
▼3.8 +2
957.8
▼ 6 5.73.9 -7.243.518 996.2
+3-0.7 12▼
-82.2
6.7+5 ▲
▲Mizuho Financial Group 4 4 1,718.8 6.0 +411.4
13 2,445.5
10,999.5
▲5.1 ▲ 8 7.6
18
1,119.3National Australia BankKorea Development Bank
1,926.4
5 2
3 16
6
Mitsubishi UFJ Financial Group
11*
9 358 34
Sumitomo Mitsui Finl Grp Inc 7Kasikornbank PCLWoori Financial Group
12 -
2
13 6
▼
▲▲
Yes Bank Ltd
▲
▲
▲
IDBI Bank Ltd
Sumitomo Mitsui Trust Holdings65.0
2.5 1▲0 90.8 4Credit Agricole CIB 14 31 696.8
151.5
Industrial & Comm Bank China 13 812.432 8▲-1.1
8.8 28.1 1
7 4.4 -1▼-1,210.1 2.6-1,282.8
1.8Westpac Banking 11 12 0.0Oversea-Chinese Banking
2.8Commonwealth Bank of Australia 0.0 14
10.617
DBS Group Holdings 8 13 1,415.0ANZ Banking Group 11
1,775.643.3 18 11.30.6 ▲
5.693.1
-2.46.3
1,362.1 2.9 ▼0.6 ▲
9 310
5 7▲0.8
1,545.97
Mizuho Financial Group 4 43Axis Bank Ltd
3.8
4.92,244.5
National Australia Bank 6Sumitomo Mitsui Finl Grp Inc 2,149.4
8
Change in
0.30.1
4.6▲▲
24.01 1
# of Market
-2
Market
0.6 ▲11.7
Sh %22.90.8Axis Bank Ltd
-2▲▲
8.5 12.417.1
13▲ 22 ▼13.8
▼-3 ▼
Sh Ch.Sh %
▲
1# of Deals
38.4
Market# of# of Deals per Bookrunner
Sh % Sh Ch. Deals Proceeds
2
Bookrunner2012 Rank
2012 Rank
Proceeds per Bookrunner (US$m)
Jan 1 - Sep 30
Change in # of DealsMandated Arranger Proceeds
2013 Rank
MarketDeals
Proceeds per Mandated Arranger (US$m) # of Deals per Arranger
Jan 1 - Sep 30
Market
Asia Pacific & Japan- Bookrunners (X28)
Market
First Nine Months 2013 | Project Finance | Managing Underwriters
Asia Pacific & Japan- Mandated Arrangers (X30)
State Bank of India 11,092.5
2013 Rank Sh %
Mitsubishi UFJ Financial Group 2 2 2,909.25.366.3
2,445.5 0.811.9
13 8.119
▲11.3 0 -
18 ▲11.3 218
* Tie
160
64
▲Yes Bank Ltd 0.7 ▲1 Bank of America Merrill Lynch 18* -326.8
13 0.6334.3
3.15
▼
▲ 1.0 +1
37,361.4
174.9 0.6
IDFC Ltd
IDBI Bank Ltd
25
17
CIBC World Markets Inc
-0.6
Woori Financial Group
HSBC Holdings PLC
18
-2 ▼
22.0%
▼ 280.8
Industry % Change over Last Quarter -43.7%
Development Bank of Japan Inc
Industry Total
-23.1%
10.020
46,296.9Top Twenty Five Total
▼
19
Kasikornbank PCL
Industry % Change over Same Period Last Year
24 34
15
516 61 670.5
11.1%
1.5
-
0▼-15
331.5
▲
579.4 1.3 ▲
677.9
ANZ Banking Group-
NongHyup Financial Group Inc
Citi
Development Bank of Japan Inc
Deutsche Bank3.8
▲ Industry % Change over Same Period Last Year▼Industry % Change over Last Quarter
Industry Total
▼-43.2%▲
▲
-22.4%
16Top Twenty Five Total 25,777.7
▲24.1%
+2
1.9%
105
▲
28,681.034.089.7
100.0
0.6 0.3 1▲
▲1.0 +1 ▲1.0 +11.0 0 -▲Bank of China Ltd 18* 29
174.9 0.6174.9
Credit Agricole CIB 0.6 1▲0.6 0.6
18* -
-1.5
1▲18* -18* - 0.6
▲ 1+11.00.6
1.0 +11▲
▼1.0 +118* - 0.6
17 9▲
0.60.4
174.9 0.61.9 -12175.2
1▲▼
16 25 ▲15 - 0.8239.2
205.80.80.7 -
▲12
0▲
1.01.9 +2
1-▲
0
18*
2
0 174.9Industrial & Comm Bank China 174.9
0.6▼▼-2
-1 UBS
▲
▲▲- 0.6174.9
0.6
▲100.0
1.30.70.1 1.9
▲
4.4▼ 74
-1.5-0.2
2.5
16 409.4
4▼1.2 -1.0
3
558.1
0.9Malayan Banking Bhd 23453.0
▼
1.9▼
479.221 1.02114
1
0.1 42.5
ICICI Bank Ltd 22
2.5481.220Bank of China Ltd
-1.11.0
23 1.0
6▼612.7 1.3 -3.31.3
15.0 ▲0.9
▲1.4 24 2115
0.3 ▲ 1 1.0 +1 ▲Industrial Bank of Korea 25 - 88.9 0.3
https://www.thomsonone.comVisit http://dmi.thomsonreuters.com to View Archives and Order Custom League Tables8
-
-
-
-
-
-
-
First Nine Months | Project Finance | Managing Underwriters
Project Finance Criteria Summary
If you would like to participate in the submissionprocess, receive quarterly press releases, orhave questions about league table criteriaplease contact:
Europe
Americas
E-mail: [email protected]: +1 646-223-8424Stephen Case
Bookrunner league tables will give full credit to the bookrunner, equal if joint. In cases of consolidation, credit will be given to thesurviving/parent firmStephen Sotere Angelides
Database coverage includes all loan transactions that have reached General close between January 1, 2012 and September 30, 2013 ofwhich Thomson Reuters has been made aware. All current data and previous year's data is as of 9:00am EDT on October 16, 2013.
League tables include limited recourse project finance, non-recourse project finance, and project finance loans and exclude loans with amaturity of less than 90 days from financial close.
Bilateral, self-arranged, commercial and unknown loans are excluded from league tables as well as loans with a maturity of less than 90days.
All league tables are based on deal proceeds unless otherwise specified.
Regional league tables are based on Domicile Nation.
Tel: +44 207 542 1991
Asia Pacific:
E-mail: [email protected] Mandated Arranger league tables will give equal credit to the Non-Americas mandated arranger and equal credit to the Americas Tier 1agent. In cases of consolidation, credit will be givien to the surviving/parent firm
-
-
JapanAi HashimotoTel: +813 6441 1155E-mail: [email protected]
Tel: +632 858 7221Carina Causon
E-mail: [email protected] All league table volumes and rankings are based on general close date instead.
Asia Pacific: Non-US dollar denominated transactions are converted to the US dollar equivalent at the time of pricing.
While Thomson Reuters has used reasonable endeavors to ensure that the information provided in this document is accurate and up to date as at the time of issue, neither Thomson Reuters nor itsthird party content providers shall be liable for any errors, inaccuracies or delays in the information, nor for any actions taken in reliance thereon, nor does it endorse any views or opinions of any thirdparty content provider. Thomson Reuters disclaims all warranties, express or implied, as to the accuracy or completeness of any of the content provided, or as to the fitness of the content for anypurpose to the extent permitted by law. The content herein is not appropriate for the purposes of making a decision to carry out a transaction or trade and does not provide any form of advice(investment, tax, legal) amounting to investment advice, nor make any recommendations or solicitations regarding particular financial instruments, investments or products, including the buying orselling of securities. Thomson Reuters has not undertaken any liability or obligation relating to the purchase or sale of securities for or by any person in connection with this document.
© 2013 Thomson Reuters. All rights reserved.
Thomson Reuters and the Thomson Reuters logo are registered trademarks and trademarks of Thomson Reuters and its affiliated companies. Any third party name or mark herein belongs to therelevant third party.
https://www.thomsonone.com9
Thomson Reuters Solutions for the Deal Making Community
FOR INVESTMENT BANKERS
Thomson Reuters Advanced Analytics for deal making improves efficiency at every step, from screening and targeting, to comparables analysis, building league tables, valuing a company and developing a client pitch book. This set of analytical and presentation tools enables you to undertake all these key tasks without having to leave Microsoft Office®. You can also access our key content sets easily to support your analysis.
ThomsonONE.com Investment Banking is our flagship desktop solution that combines real-time market data and Reuters news with our world class reference data. It includes access to Recent Deals, Active Acquirers and M&A New Issues terms and conditions.
FOR JUNIOR BANKERS
SOLUTION FOR• Managing Client Relationships• Deal Origination• New Issues Pre-Marketing / Roadshows
• Financial Modeling• Customized League Tables • Simple Deals screening • Valuation analysis and comparable deal screening • Full integration into Microsoft Office® for on-brand pitch book creation
SOLUTION FOR
FOR INFORMATION PROFESSIONALS, MARKET DATA, RESEARCHSDC Platinum is the world’s foremost financial transactions database, covering new issues, M&A, syndicated loans, private equity, project finance, poison pills, and more.
• Market Analysis & Trends (Geography, Sector, Asset Class, Deal Type, Deal Size, etc.)• Deal Origination (Debt Maturity Analysis, Company Lifecycle including Private Equity)• Pitch Creation (Firm Credentials, Representative Acquirors)• M&A Targeting (Active Strategic/Sponsor Acquirors, Target Company Screener)• Negotiation (T&C Benchmarking)
Microsoft, Office, Word, Excel and PowerPoint are either registered trademarks or trademarks of Microsoft Corporation in the United States and/or other countries. Copyright 2013 Thomson Reuters. All rights reserved.
SOLUTION FOR
Access unique analysis for free anytime using Thomson ReutersDeals Intelligence website and receive regular updates,delivered direct to your inbox.Go to online.thomsonreuters.com/dealsintelligence
SOLUTION FOR
FOR STRATEGY AND PLANNING TEAMS
To purchase individual Thomson Reuters Deals or League Table reports,please contact our Thomson Reuters On Demand group:Web: http://financial.thomsonreuters.com/ondemandEmail: [email protected]
Send us a sales enquiry at: financial.thomsonreuters.com/salesRead more about our products at: financial.thomsonreuters.com/products
Thomson Reuters Deals Business Intelligence enables you to slice and dice our renowned Deals and Fees data to create ad hoc reports, analyze market trends, benchmark your performance and identify opportunities – all within a tool built into your workflow in Excel®, saving you valuable time and giving you a competitive edge.
• Conducting market analysis and identifying trends• Benchmarking your performance and monitoring competitors• Targeting clients by wallet size and banking relationship• Allocating resources more effectively by evaluating and analyzing lost deals
10
Related Documents