EARLY CHILDHOOD EDUCATION AND CARE 3.1 3 Early Childhood Education and Care CONTENTS 3.1 Profile of ECEC 3.1 3.2 Framework of performance indicators 3.7 3.3 Key performance indicator results 3.9 3.4 Definitions of key terms 3.30 3.5 References 3.35 Attachment tables Attachment tables are identified in references throughout this chapter by a ‘3A’ prefix (for example, table 3A.1) and are available from the website www.pc.gov.au/rogs/2018. This chapter reports on the performance of early childhood education and care (ECEC) services, which comprise child care and preschool services. Further information on the Report on Government Services including other reported service areas, the glossary and list of abbreviations is available at www.pc.gov.au/rogs/2018. 3.1 Profile of ECEC Service overview The ECEC sector provides a range of services for children based on their age and education, care and development needs. ECEC services provide one or more of the following broad service types: • Child care services — are provided to children aged 0–12 years including: long day care; family day care; outside school hours care (OSHC); occasional care; and other care (see section 3.4 for definitions). • Preschool services — are services that deliver a preschool program. A ‘preschool program’ is a structured, play-based learning program, delivered by a qualified teacher, aimed at children in the year or two before they commence full time schooling (table 3.1).

Welcome message from author
This document is posted to help you gain knowledge. Please leave a comment to let me know what you think about it! Share it to your friends and learn new things together.
Transcript
EARLY CHILDHOOD EDUCATION AND CARE 3.1
3 Early Childhood Education and Care
CONTENTS 3.1 Profile of ECEC 3.1
3.2 Framework of performance indicators 3.7
3.3 Key performance indicator results 3.9
3.4 Definitions of key terms 3.30
3.5 References 3.35
Attachment tables Attachment tables are identified in references throughout this chapter by a ‘3A’ prefix (for example, table 3A.1) and are available from the website www.pc.gov.au/rogs/2018.
This chapter reports on the performance of early childhood education and care (ECEC) services, which comprise child care and preschool services.
Further information on the Report on Government Services including other reported service areas, the glossary and list of abbreviations is available at www.pc.gov.au/rogs/2018.
3.1 Profile of ECEC
Service overview
The ECEC sector provides a range of services for children based on their age and education, care and development needs. ECEC services provide one or more of the following broad service types:
• Child care services — are provided to children aged 0–12 years including: long day care; family day care; outside school hours care (OSHC); occasional care; and other care (see section 3.4 for definitions).
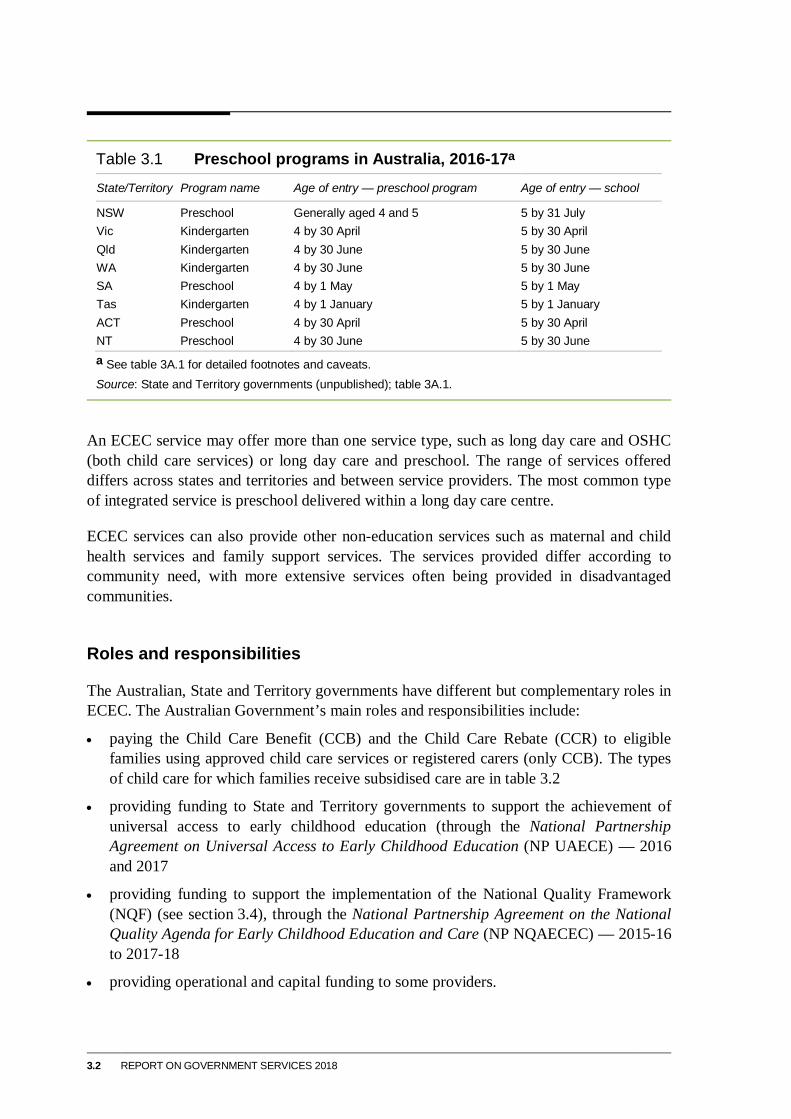
• Preschool services — are services that deliver a preschool program. A ‘preschool program’ is a structured, play-based learning program, delivered by a qualified teacher, aimed at children in the year or two before they commence full time schooling (table 3.1).
3.2 REPORT ON GOVERNMENT SERVICES 2018
Table 3.1 Preschool programs in Australia, 2016-17a
State/Territory Program name Age of entry — preschool program Age of entry — school
NSW Preschool Generally aged 4 and 5 5 by 31 July Vic Kindergarten 4 by 30 April 5 by 30 April Qld Kindergarten 4 by 30 June 5 by 30 June WA Kindergarten 4 by 30 June 5 by 30 June SA Preschool 4 by 1 May 5 by 1 May Tas Kindergarten 4 by 1 January 5 by 1 January ACT Preschool 4 by 30 April 5 by 30 April NT Preschool 4 by 30 June 5 by 30 June
a See table 3A.1 for detailed footnotes and caveats. Source: State and Territory governments (unpublished); table 3A.1.
An ECEC service may offer more than one service type, such as long day care and OSHC (both child care services) or long day care and preschool. The range of services offered differs across states and territories and between service providers. The most common type of integrated service is preschool delivered within a long day care centre.
ECEC services can also provide other non-education services such as maternal and child health services and family support services. The services provided differ according to community need, with more extensive services often being provided in disadvantaged communities.
Roles and responsibilities
The Australian, State and Territory governments have different but complementary roles in ECEC. The Australian Government’s main roles and responsibilities include:
• paying the Child Care Benefit (CCB) and the Child Care Rebate (CCR) to eligible families using approved child care services or registered carers (only CCB). The types of child care for which families receive subsidised care are in table 3.2
• providing funding to State and Territory governments to support the achievement of universal access to early childhood education (through the National Partnership Agreement on Universal Access to Early Childhood Education (NP UAECE) — 2016 and 2017
• providing funding to support the implementation of the National Quality Framework (NQF) (see section 3.4), through the National Partnership Agreement on the National Quality Agenda for Early Childhood Education and Care (NP NQAECEC) — 2015-16 to 2017-18
• providing operational and capital funding to some providers.
EARLY CHILDHOOD EDUCATION AND CARE 3.3
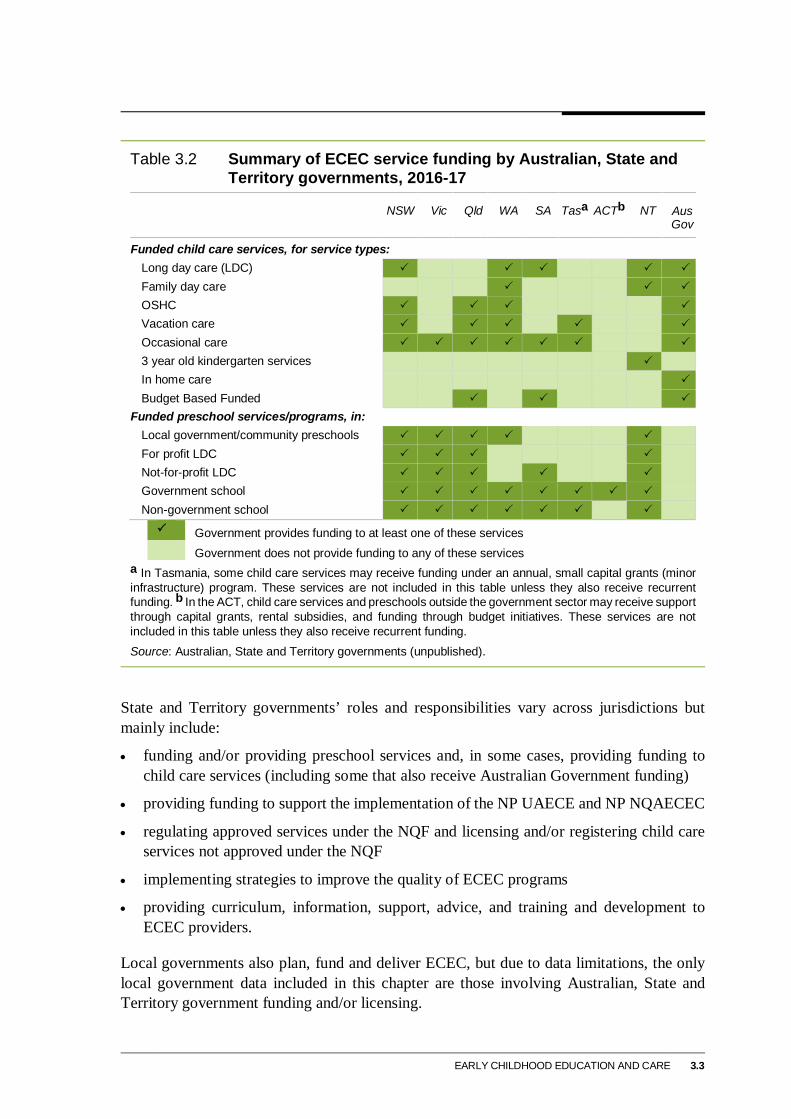
Table 3.2 Summary of ECEC service funding by Australian, State and
Territory governments, 2016-17 NSW Vic Qld WA SA Tasa ACTb NT Aus
Gov
Funded child care services, for service types: Long day care (LDC) Family day care OSHC Vacation care Occasional care 3 year old kindergarten services In home care Budget Based Funded
Funded preschool services/programs, in: Local government/community preschools For profit LDC Not-for-profit LDC Government school Non-government school
Government provides funding to at least one of these services Government does not provide funding to any of these services a In Tasmania, some child care services may receive funding under an annual, small capital grants (minor infrastructure) program. These services are not included in this table unless they also receive recurrent funding. b In the ACT, child care services and preschools outside the government sector may receive support through capital grants, rental subsidies, and funding through budget initiatives. These services are not included in this table unless they also receive recurrent funding. Source: Australian, State and Territory governments (unpublished).
State and Territory governments’ roles and responsibilities vary across jurisdictions but mainly include:
• funding and/or providing preschool services and, in some cases, providing funding to child care services (including some that also receive Australian Government funding)
• providing funding to support the implementation of the NP UAECE and NP NQAECEC
• regulating approved services under the NQF and licensing and/or registering child care services not approved under the NQF
• implementing strategies to improve the quality of ECEC programs
• providing curriculum, information, support, advice, and training and development to ECEC providers.
Local governments also plan, fund and deliver ECEC, but due to data limitations, the only local government data included in this chapter are those involving Australian, State and Territory government funding and/or licensing.
3.4 REPORT ON GOVERNMENT SERVICES 2018
Funding
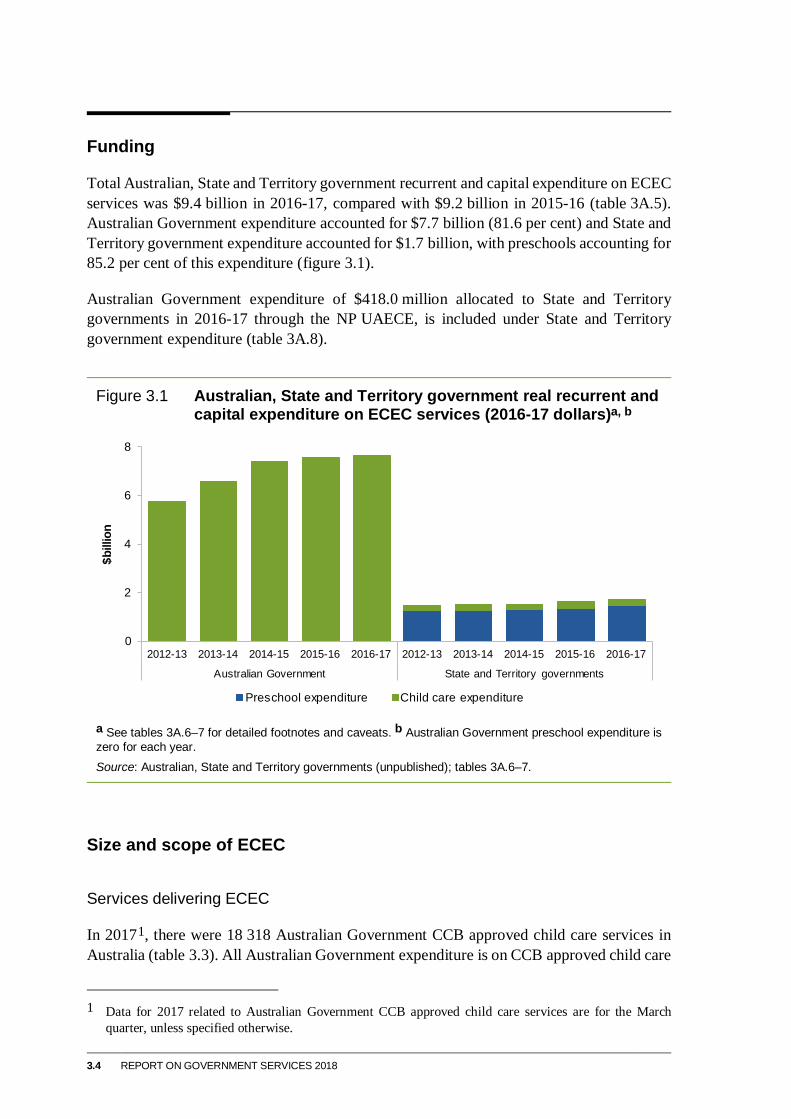
Total Australian, State and Territory government recurrent and capital expenditure on ECEC services was $9.4 billion in 2016-17, compared with $9.2 billion in 2015-16 (table 3A.5). Australian Government expenditure accounted for $7.7 billion (81.6 per cent) and State and Territory government expenditure accounted for $1.7 billion, with preschools accounting for 85.2 per cent of this expenditure (figure 3.1).
Australian Government expenditure of $418.0 million allocated to State and Territory governments in 2016-17 through the NP UAECE, is included under State and Territory government expenditure (table 3A.8).
Figure 3.1 Australian, State and Territory government real recurrent and
capital expenditure on ECEC services (2016-17 dollars)a, b
a See tables 3A.6–7 for detailed footnotes and caveats. b Australian Government preschool expenditure is zero for each year. Source: Australian, State and Territory governments (unpublished); tables 3A.6–7.
Size and scope of ECEC
Services delivering ECEC
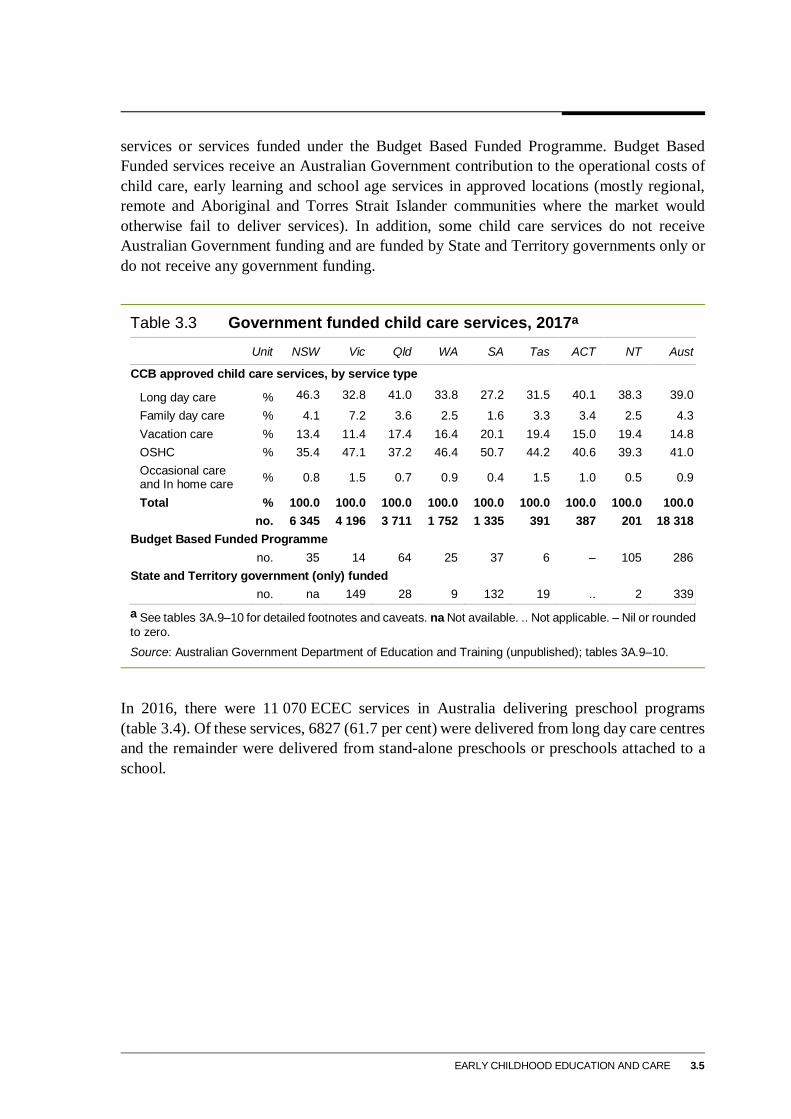
In 20171, there were 18 318 Australian Government CCB approved child care services in Australia (table 3.3). All Australian Government expenditure is on CCB approved child care
1 Data for 2017 related to Australian Government CCB approved child care services are for the March
quarter, unless specified otherwise.
0
2
4
6
8
2012-13 2013-14 2014-15 2015-16 2016-17 2012-13 2013-14 2014-15 2015-16 2016-17
Australian Government State and Territory governments
$bill
ion
Preschool expenditure Child care expenditure
EARLY CHILDHOOD EDUCATION AND CARE 3.5
services or services funded under the Budget Based Funded Programme. Budget Based Funded services receive an Australian Government contribution to the operational costs of child care, early learning and school age services in approved locations (mostly regional, remote and Aboriginal and Torres Strait Islander communities where the market would otherwise fail to deliver services). In addition, some child care services do not receive Australian Government funding and are funded by State and Territory governments only or do not receive any government funding.
Table 3.3 Government funded child care services, 2017a Unit NSW Vic Qld WA SA Tas ACT NT Aust
CCB approved child care services, by service type
Long day care % 46.3 32.8 41.0 33.8 27.2 31.5 40.1 38.3 39.0 Family day care % 4.1 7.2 3.6 2.5 1.6 3.3 3.4 2.5 4.3 Vacation care % 13.4 11.4 17.4 16.4 20.1 19.4 15.0 19.4 14.8 OSHC % 35.4 47.1 37.2 46.4 50.7 44.2 40.6 39.3 41.0 Occasional care and In home care % 0.8 1.5 0.7 0.9 0.4 1.5 1.0 0.5 0.9
Total % 100.0 100.0 100.0 100.0 100.0 100.0 100.0 100.0 100.0 no. 6 345 4 196 3 711 1 752 1 335 391 387 201 18 318 Budget Based Funded Programme no. 35 14 64 25 37 6 – 105 286 State and Territory government (only) funded no. na 149 28 9 132 19 .. 2 339
a See tables 3A.9–10 for detailed footnotes and caveats. na Not available. .. Not applicable. – Nil or rounded to zero. Source: Australian Government Department of Education and Training (unpublished); tables 3A.9–10.
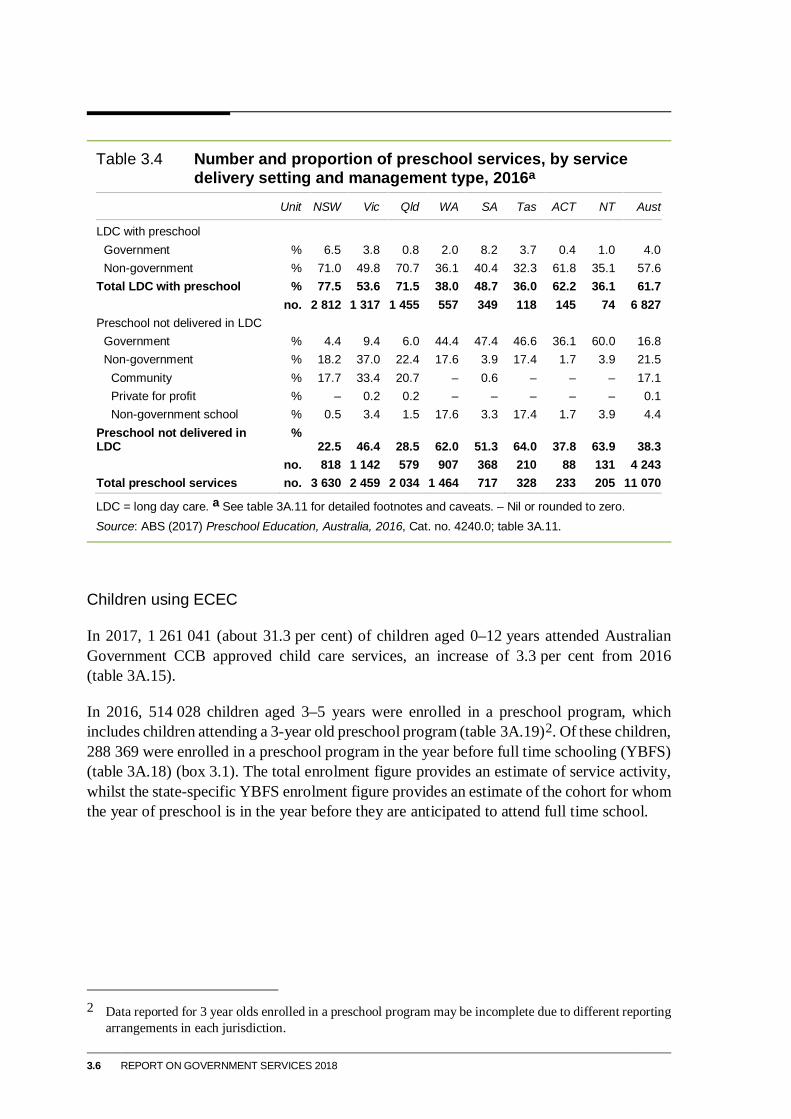
In 2016, there were 11 070 ECEC services in Australia delivering preschool programs (table 3.4). Of these services, 6827 (61.7 per cent) were delivered from long day care centres and the remainder were delivered from stand-alone preschools or preschools attached to a school.
3.6 REPORT ON GOVERNMENT SERVICES 2018
Table 3.4 Number and proportion of preschool services, by service
delivery setting and management type, 2016a Unit NSW Vic Qld WA SA Tas ACT NT Aust
LDC with preschool Government % 6.5 3.8 0.8 2.0 8.2 3.7 0.4 1.0 4.0 Non-government % 71.0 49.8 70.7 36.1 40.4 32.3 61.8 35.1 57.6
Total LDC with preschool % 77.5 53.6 71.5 38.0 48.7 36.0 62.2 36.1 61.7 no. 2 812 1 317 1 455 557 349 118 145 74 6 827 Preschool not delivered in LDC
Government % 4.4 9.4 6.0 44.4 47.4 46.6 36.1 60.0 16.8 Non-government % 18.2 37.0 22.4 17.6 3.9 17.4 1.7 3.9 21.5
Community % 17.7 33.4 20.7 – 0.6 – – – 17.1 Private for profit % – 0.2 0.2 – – – – – 0.1 Non-government school % 0.5 3.4 1.5 17.6 3.3 17.4 1.7 3.9 4.4
Preschool not delivered in LDC
% 22.5 46.4 28.5 62.0 51.3 64.0 37.8 63.9 38.3
no. 818 1 142 579 907 368 210 88 131 4 243 Total preschool services no. 3 630 2 459 2 034 1 464 717 328 233 205 11 070
LDC = long day care. a See table 3A.11 for detailed footnotes and caveats. – Nil or rounded to zero. Source: ABS (2017) Preschool Education, Australia, 2016, Cat. no. 4240.0; table 3A.11.
Children using ECEC
In 2017, 1 261 041 (about 31.3 per cent) of children aged 0–12 years attended Australian Government CCB approved child care services, an increase of 3.3 per cent from 2016 (table 3A.15).
In 2016, 514 028 children aged 3–5 years were enrolled in a preschool program, which includes children attending a 3-year old preschool program (table 3A.19)2. Of these children, 288 369 were enrolled in a preschool program in the year before full time schooling (YBFS) (table 3A.18) (box 3.1). The total enrolment figure provides an estimate of service activity, whilst the state-specific YBFS enrolment figure provides an estimate of the cohort for whom the year of preschool is in the year before they are anticipated to attend full time school.
2 Data reported for 3 year olds enrolled in a preschool program may be incomplete due to different reporting
arrangements in each jurisdiction.
EARLY CHILDHOOD EDUCATION AND CARE 3.7
Box 3.1 Recent developments affecting the count of children enrolled
in a preschool program Due to changes in coverage and methodologies affecting the National Early Childhood Education and Care Collection (NECECC), preschool program participation data included in this Report are not fully comparable with previous reports. Significant changes affecting the 2016 data include:
• the Australian Bureau of Statistics (ABS) has amended its data linkage approach to enhance the accuracy of child counts in NECECC, resulting in a lower count of children enrolled in a preschool program
• an expanded child identification strategy in the Child Care Management System has increased the count of children enrolled in a preschool program, as all children at long day care centres (of the appropriate age) are now recorded as enrolled in a preschool program
• the ABS has developed a new definition of the YBFS population (referred to as the state-specific YBFS), which was included in its NECECC for the 2016 reference year. This state-specific YBFS definition takes into account the preschool and school age entry provisions of the state or territory in which the child usually resides and the child’s date of birth (see table 3.1). This improves on previous definitions by accounting for the differences across Australia in the age at which children are to be enrolled in school. The state‑specific YBFS method will be reviewed and refined over time.
For more information on NECECC data quality, including collection methodologies and data limitations, see Preschool Education, Australia (Cat. no. 4240.0) (ABS 2017).
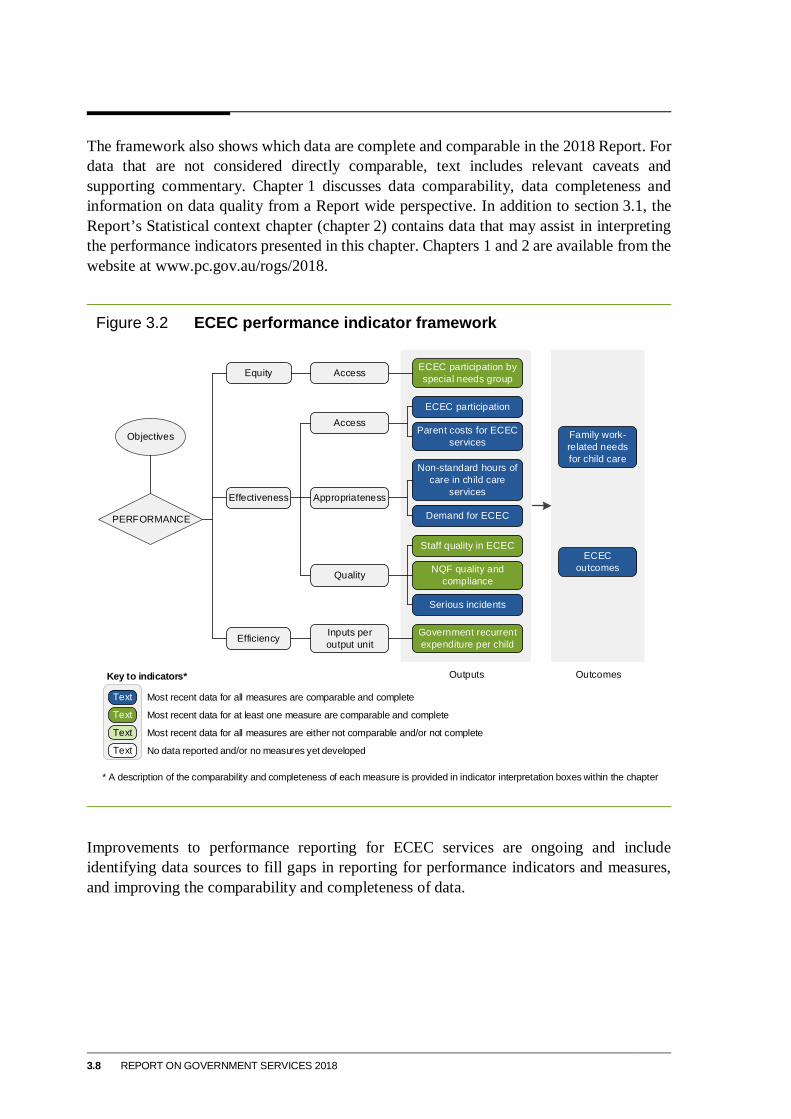
3.2 Framework of performance indicators The performance indicator framework for ECEC services is based on common objectives for ECEC (box 3.2).
Box 3.2 Objectives for ECEC services ECEC services aim to meet the education, care and development needs of children, and meet the needs of families including enabling increased workforce participation, by providing universal access to early childhood education services for eligible children and accessible child care services that:
• are high quality, affordable, flexible and can be implemented across a range of settings
• are delivered in a safe, nurturing and inclusive environment
• target improved access for, and participation by, Aboriginal and Torres Strait Islander, vulnerable and disadvantaged children.
Governments aim for ECEC services to meet these objectives in an equitable and efficient manner.
The performance indicator framework provides information on equity, efficiency, effectiveness, and distinguishes the outputs and outcomes of ECEC services (figure 3.2).
3.8 REPORT ON GOVERNMENT SERVICES 2018
The framework also shows which data are complete and comparable in the 2018 Report. For data that are not considered directly comparable, text includes relevant caveats and supporting commentary. Chapter 1 discusses data comparability, data completeness and information on data quality from a Report wide perspective. In addition to section 3.1, the Report’s Statistical context chapter (chapter 2) contains data that may assist in interpreting the performance indicators presented in this chapter. Chapters 1 and 2 are available from the website at www.pc.gov.au/rogs/2018.
Figure 3.2 ECEC performance indicator framework
Improvements to performance reporting for ECEC services are ongoing and include identifying data sources to fill gaps in reporting for performance indicators and measures, and improving the comparability and completeness of data.
Family work-related needs for child care
ECEC outcomes
ECEC participation by special needs group
ECEC participation
Non-standard hours of care in child care
services
Parent costs for ECEC services
Demand for ECEC
Staff quality in ECEC
NQF quality and compliance
Serious incidents
Government recurrent expenditure per child
Outputs OutcomesKey to indicators*
* A description of the comparability and completeness of each measure is provided in indicator interpretation boxes within the chapter
Most recent data for all measures are either not comparable and/or not complete
No data reported and/or no measures yet developed
Most recent data for all measures are comparable and complete
Text
Text
Text Most recent data for at least one measure are comparable and complete
Text
AccessEquity
Access
Effectiveness Appropriateness
Quality
Inputs per output unitEfficiency
Objectives
PERFORMANCE
EARLY CHILDHOOD EDUCATION AND CARE 3.9
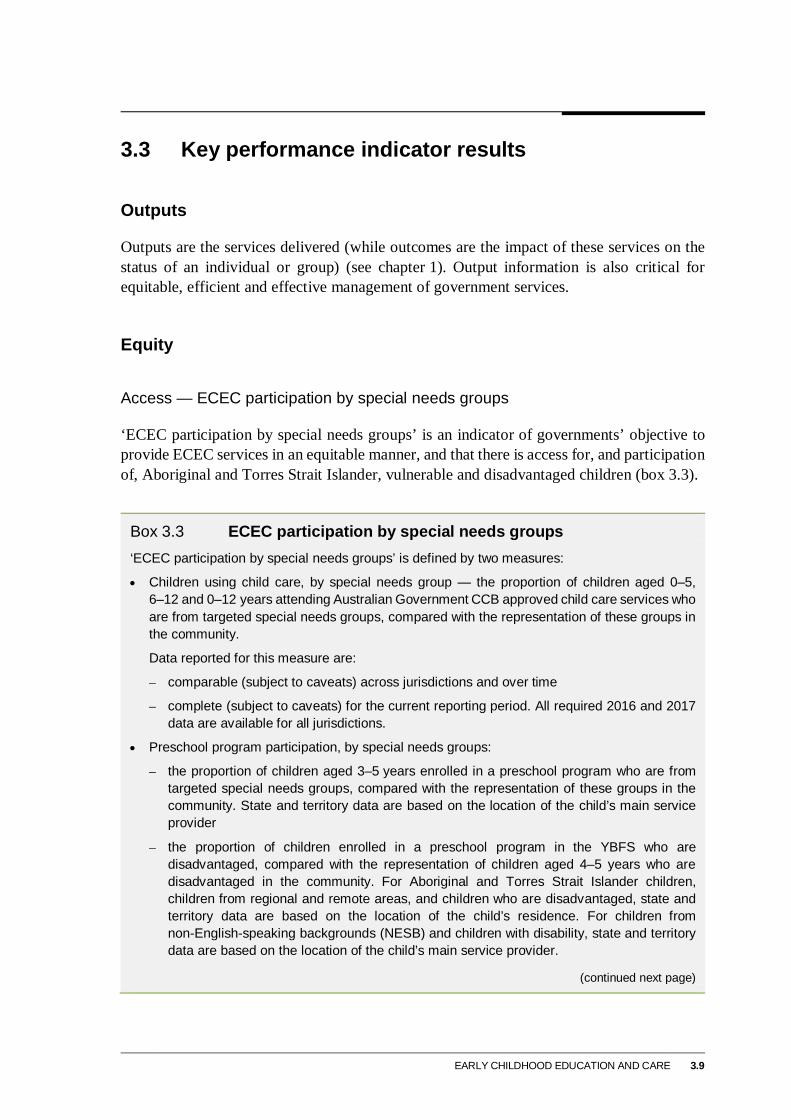
3.3 Key performance indicator results
Outputs
Outputs are the services delivered (while outcomes are the impact of these services on the status of an individual or group) (see chapter 1). Output information is also critical for equitable, efficient and effective management of government services.
Equity
Access — ECEC participation by special needs groups
‘ECEC participation by special needs groups’ is an indicator of governments’ objective to provide ECEC services in an equitable manner, and that there is access for, and participation of, Aboriginal and Torres Strait Islander, vulnerable and disadvantaged children (box 3.3).
Box 3.3 ECEC participation by special needs groups ‘ECEC participation by special needs groups’ is defined by two measures:
• Children using child care, by special needs group — the proportion of children aged 0–5, 6–12 and 0–12 years attending Australian Government CCB approved child care services who are from targeted special needs groups, compared with the representation of these groups in the community.
Data reported for this measure are:
– comparable (subject to caveats) across jurisdictions and over time
– complete (subject to caveats) for the current reporting period. All required 2016 and 2017 data are available for all jurisdictions.
• Preschool program participation, by special needs groups:
– the proportion of children aged 3–5 years enrolled in a preschool program who are from targeted special needs groups, compared with the representation of these groups in the community. State and territory data are based on the location of the child’s main service provider
– the proportion of children enrolled in a preschool program in the YBFS who are disadvantaged, compared with the representation of children aged 4–5 years who are disadvantaged in the community. For Aboriginal and Torres Strait Islander children, children from regional and remote areas, and children who are disadvantaged, state and territory data are based on the location of the child’s residence. For children from non-English-speaking backgrounds (NESB) and children with disability, state and territory data are based on the location of the child’s main service provider.
(continued next page)
3.10 REPORT ON GOVERNMENT SERVICES 2018
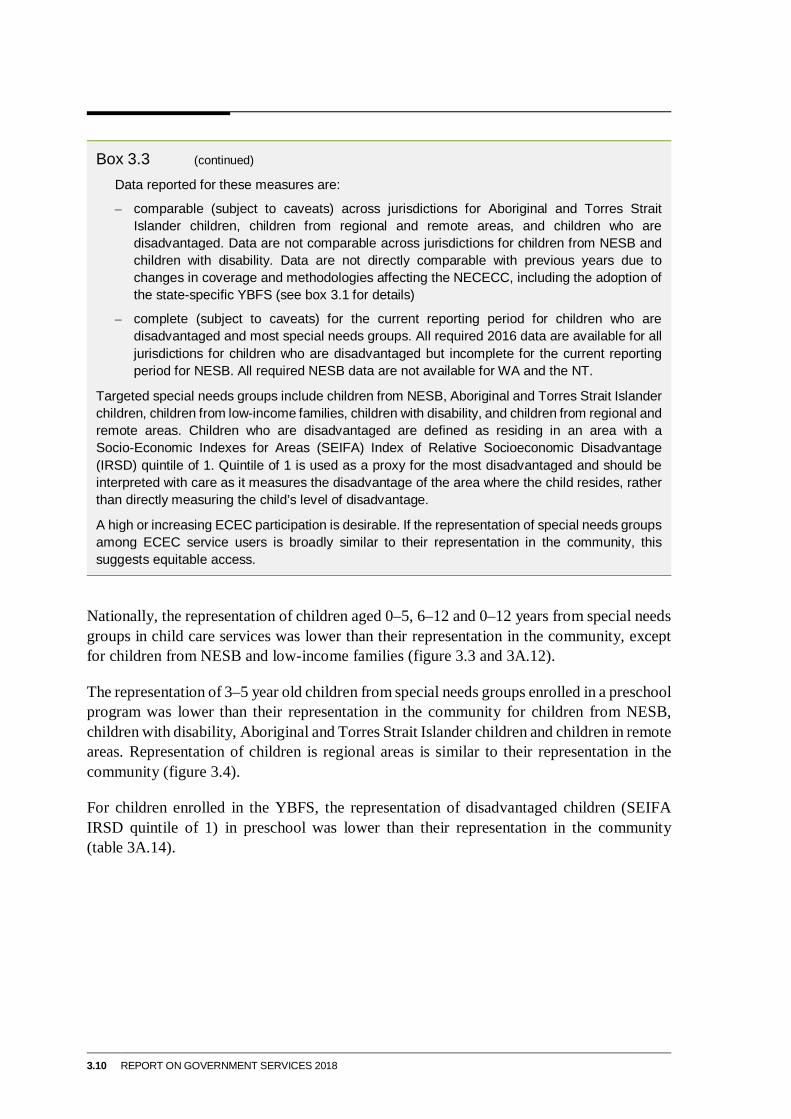
Box 3.3 (continued)
Data reported for these measures are:
– comparable (subject to caveats) across jurisdictions for Aboriginal and Torres Strait Islander children, children from regional and remote areas, and children who are disadvantaged. Data are not comparable across jurisdictions for children from NESB and children with disability. Data are not directly comparable with previous years due to changes in coverage and methodologies affecting the NECECC, including the adoption of the state-specific YBFS (see box 3.1 for details)
– complete (subject to caveats) for the current reporting period for children who are disadvantaged and most special needs groups. All required 2016 data are available for all jurisdictions for children who are disadvantaged but incomplete for the current reporting period for NESB. All required NESB data are not available for WA and the NT.
Targeted special needs groups include children from NESB, Aboriginal and Torres Strait Islander children, children from low-income families, children with disability, and children from regional and remote areas. Children who are disadvantaged are defined as residing in an area with a Socio-Economic Indexes for Areas (SEIFA) Index of Relative Socioeconomic Disadvantage (IRSD) quintile of 1. Quintile of 1 is used as a proxy for the most disadvantaged and should be interpreted with care as it measures the disadvantage of the area where the child resides, rather than directly measuring the child’s level of disadvantage.
A high or increasing ECEC participation is desirable. If the representation of special needs groups among ECEC service users is broadly similar to their representation in the community, this suggests equitable access.
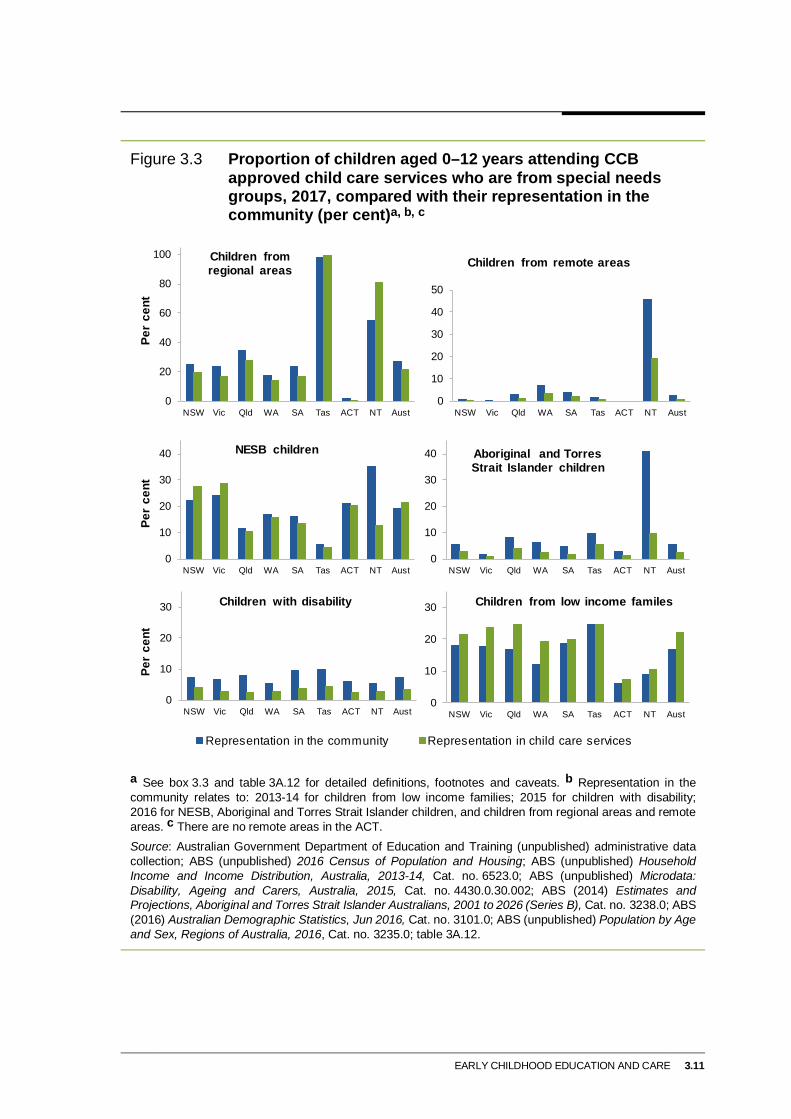
Nationally, the representation of children aged 0–5, 6–12 and 0–12 years from special needs groups in child care services was lower than their representation in the community, except for children from NESB and low-income families (figure 3.3 and 3A.12).
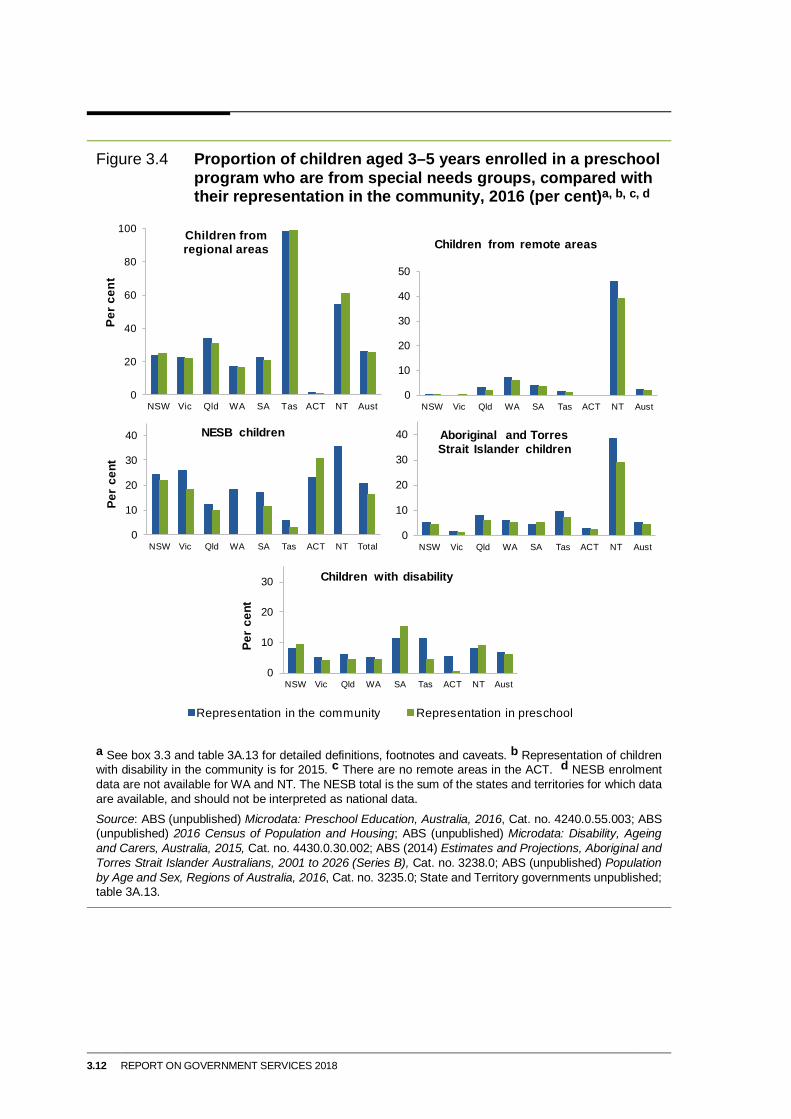
The representation of 3–5 year old children from special needs groups enrolled in a preschool program was lower than their representation in the community for children from NESB, children with disability, Aboriginal and Torres Strait Islander children and children in remote areas. Representation of children is regional areas is similar to their representation in the community (figure 3.4).
For children enrolled in the YBFS, the representation of disadvantaged children (SEIFA IRSD quintile of 1) in preschool was lower than their representation in the community (table 3A.14).
EARLY CHILDHOOD EDUCATION AND CARE 3.11
Figure 3.3 Proportion of children aged 0–12 years attending CCB
approved child care services who are from special needs groups, 2017, compared with their representation in the community (per cent)a, b, c
a See box 3.3 and table 3A.12 for detailed definitions, footnotes and caveats. b Representation in the community relates to: 2013-14 for children from low income families; 2015 for children with disability; 2016 for NESB, Aboriginal and Torres Strait Islander children, and children from regional areas and remote areas. c There are no remote areas in the ACT. Source: Australian Government Department of Education and Training (unpublished) administrative data collection; ABS (unpublished) 2016 Census of Population and Housing; ABS (unpublished) Household Income and Income Distribution, Australia, 2013-14, Cat. no. 6523.0; ABS (unpublished) Microdata: Disability, Ageing and Carers, Australia, 2015, Cat. no. 4430.0.30.002; ABS (2014) Estimates and Projections, Aboriginal and Torres Strait Islander Australians, 2001 to 2026 (Series B), Cat. no. 3238.0; ABS (2016) Australian Demographic Statistics, Jun 2016, Cat. no. 3101.0; ABS (unpublished) Population by Age and Sex, Regions of Australia, 2016, Cat. no. 3235.0; table 3A.12.
0
20
40
60
80
100
NSW Vic Qld WA SA Tas ACT NT Aust
Per
cent
Children from regional areas
0
10
20
30
40
50
NSW Vic Qld WA SA Tas ACT NT Aust
Children from remote areas
0
10
20
30
40
NSW Vic Qld WA SA Tas ACT NT Aust
Per
cent
NESB children
0
10
20
30
40
NSW Vic Qld WA SA Tas ACT NT Aust
Aboriginal and Torres Strait Islander children
0
10
20
30
NSW Vic Qld WA SA Tas ACT NT Aust
Per
cent
Children with disability
0
10
20
30
NSW Vic Qld WA SA Tas ACT NT Aust
Children from low income familes
Representation in the community Representation in child care services
3.12 REPORT ON GOVERNMENT SERVICES 2018
Figure 3.4 Proportion of children aged 3–5 years enrolled in a preschool
program who are from special needs groups, compared with their representation in the community, 2016 (per cent)a, b, c, d
a See box 3.3 and table 3A.13 for detailed definitions, footnotes and caveats. b Representation of children with disability in the community is for 2015. c There are no remote areas in the ACT. d NESB enrolment data are not available for WA and NT. The NESB total is the sum of the states and territories for which data are available, and should not be interpreted as national data. Source: ABS (unpublished) Microdata: Preschool Education, Australia, 2016, Cat. no. 4240.0.55.003; ABS (unpublished) 2016 Census of Population and Housing; ABS (unpublished) Microdata: Disability, Ageing and Carers, Australia, 2015, Cat. no. 4430.0.30.002; ABS (2014) Estimates and Projections, Aboriginal and Torres Strait Islander Australians, 2001 to 2026 (Series B), Cat. no. 3238.0; ABS (unpublished) Population by Age and Sex, Regions of Australia, 2016, Cat. no. 3235.0; State and Territory governments unpublished; table 3A.13.
0
20
40
60
80
100
NSW Vic Qld WA SA Tas ACT NT Aust
Per c
ent
Children from regional areas
0
10
20
30
40
50
NSW Vic Qld WA SA Tas ACT NT Aust
Children from remote areas
0
10
20
30
40
NSW Vic Qld WA SA Tas ACT NT Total
Per
cent
NESB children
0
10
20
30
40
NSW Vic Qld WA SA Tas ACT NT Aust
Aboriginal and Torres Strait Islander children
0
10
20
30
NSW Vic Qld WA SA Tas ACT NT Aust
Per
cent
Children with disability
Representation in the community Representation in preschool
EARLY CHILDHOOD EDUCATION AND CARE 3.13
Effectiveness
Access — ECEC participation
‘ECEC participation’ is an indicator of governments’ objective to ensure that ECEC services are accessible (box 3.4).
Box 3.4 ECEC participation ‘ECEC participation’ is defined by two measures:
• Children using child care — the proportion of children who are attending Australian Government CCB approved child care services by age group (0–5, 6–12 and 0–12 years)
Data reported for this measure are:
– comparable (subject to caveats) across jurisdictions and over time
– complete for the current reporting period (subject to caveats). All required 2017 data are available for all jurisdictions.
• Preschool program participation — the proportion of children who are enrolled in a preschool program in the YBFS. To be considered as enrolled, the child must have attended the preschool program for at least one hour during the reference period, or be absent due to illness or extended holiday leave and expected to return. State and territory data are based on the location of the child’s residence.
Data reported for this measure are:
– comparable (subject to caveats) across jurisdictions. Data are not directly comparable with previous years due to changes in coverage and methodologies affecting the NECECC, including the adoption of the state-specific YBFS (see box 3.1 for details)
– complete (subject to caveats) for the current reporting period. All required 2016 data are available for all jurisdictions.
A higher or increasing proportion of children participating in ECEC services is desirable. However, this indicator can be difficult to interpret as this indicator does not provide information on parental preferences for using child care and preschool.
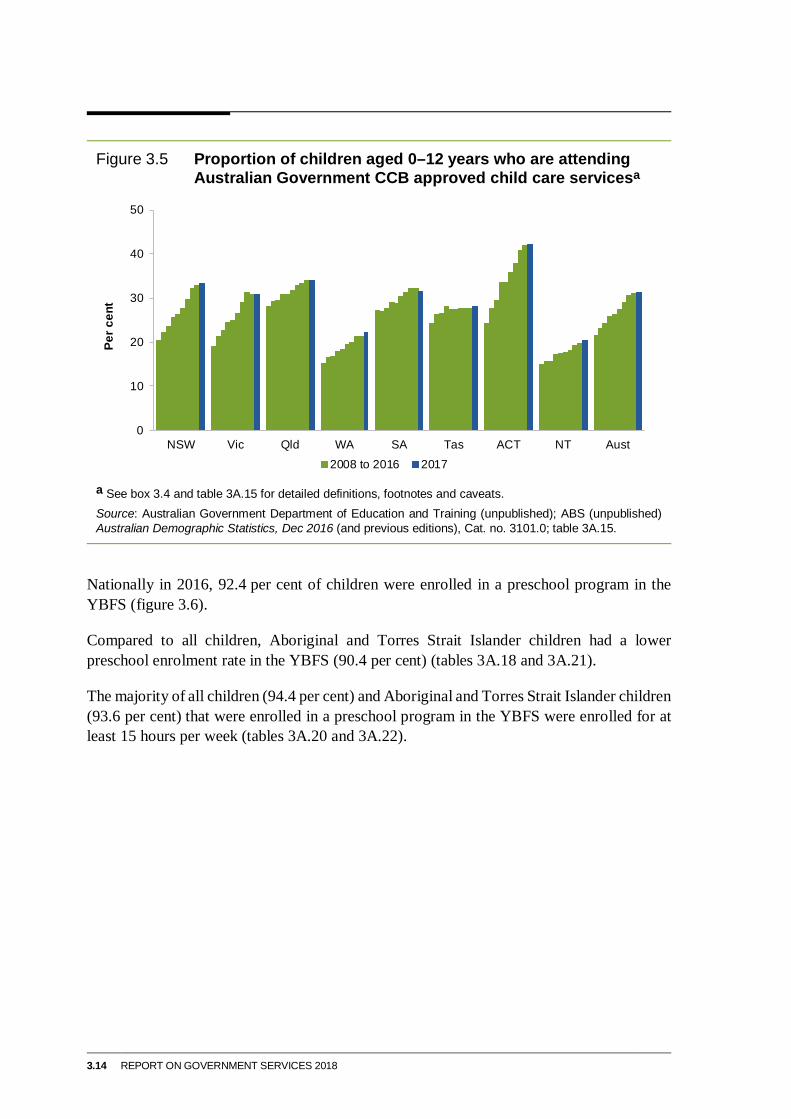
Nationally in 2017, 31.3 per cent of children aged 0–12 years attended Australian Government CCB approved child care, up from 31.0 per cent in 2016 and 21.7 per cent in 2008 (figure 3.5). The majority (64.5 per cent) of attendees are aged 0–5 years, over half (55.5 per cent) receive a long day care service and over a quarter (29.8 per cent) receive an OSHC service (table 3A.15–16).
The average hours of attendance in Australian Government CCB approved child care in 2017 varied considerably across jurisdictions for all service types (table 3A.17). Nationally, average attendance per child was above 25 hours per week for long day care, family day care, vacation care and in home care, but considerably less for OSHC and occasional care.
3.14 REPORT ON GOVERNMENT SERVICES 2018
Figure 3.5 Proportion of children aged 0–12 years who are attending
Australian Government CCB approved child care servicesa
a See box 3.4 and table 3A.15 for detailed definitions, footnotes and caveats. Source: Australian Government Department of Education and Training (unpublished); ABS (unpublished) Australian Demographic Statistics, Dec 2016 (and previous editions), Cat. no. 3101.0; table 3A.15.
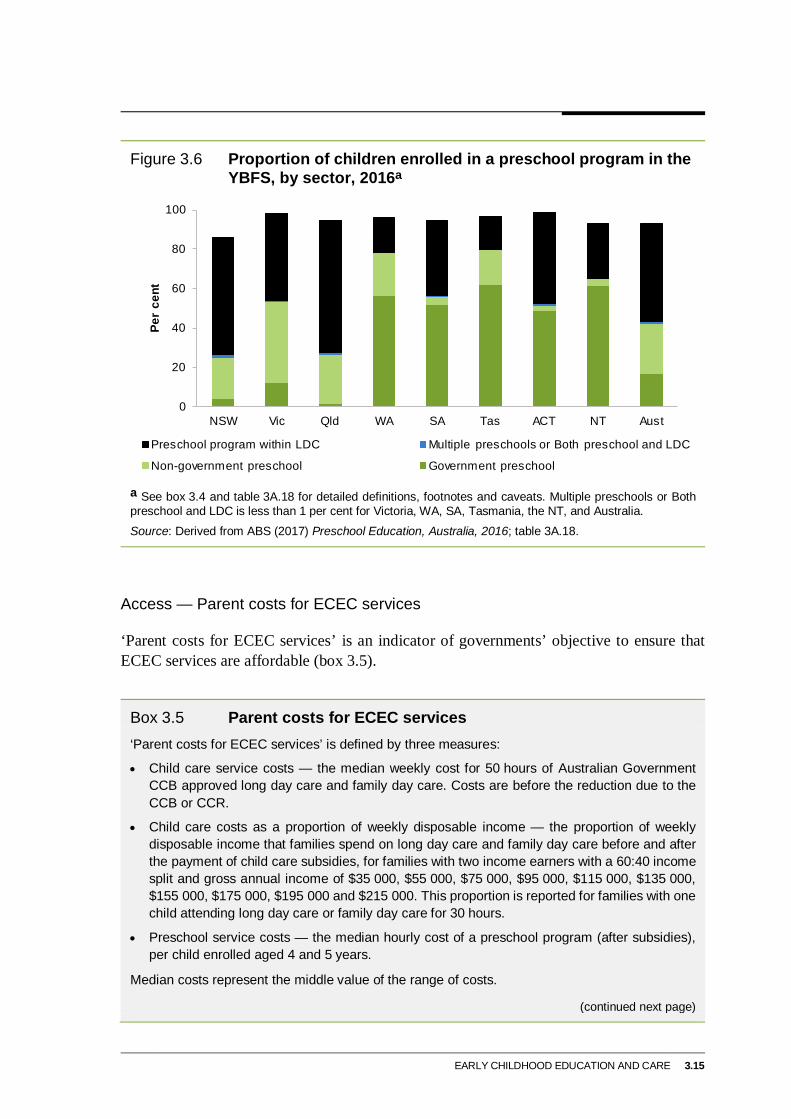
Nationally in 2016, 92.4 per cent of children were enrolled in a preschool program in the YBFS (figure 3.6).
Compared to all children, Aboriginal and Torres Strait Islander children had a lower preschool enrolment rate in the YBFS (90.4 per cent) (tables 3A.18 and 3A.21).
The majority of all children (94.4 per cent) and Aboriginal and Torres Strait Islander children (93.6 per cent) that were enrolled in a preschool program in the YBFS were enrolled for at least 15 hours per week (tables 3A.20 and 3A.22).
0
10
20
30
40
50
NSW Vic Qld WA SA Tas ACT NT Aust
Per c
ent
2008 to 2016 2017
EARLY CHILDHOOD EDUCATION AND CARE 3.15
Figure 3.6 Proportion of children enrolled in a preschool program in the
YBFS, by sector, 2016a
a See box 3.4 and table 3A.18 for detailed definitions, footnotes and caveats. Multiple preschools or Both preschool and LDC is less than 1 per cent for Victoria, WA, SA, Tasmania, the NT, and Australia. Source: Derived from ABS (2017) Preschool Education, Australia, 2016; table 3A.18.
Access — Parent costs for ECEC services
‘Parent costs for ECEC services’ is an indicator of governments’ objective to ensure that ECEC services are affordable (box 3.5).
Box 3.5 Parent costs for ECEC services ‘Parent costs for ECEC services’ is defined by three measures:
• Child care service costs — the median weekly cost for 50 hours of Australian Government CCB approved long day care and family day care. Costs are before the reduction due to the CCB or CCR.
• Child care costs as a proportion of weekly disposable income — the proportion of weekly disposable income that families spend on long day care and family day care before and after the payment of child care subsidies, for families with two income earners with a 60:40 income split and gross annual income of $35 000, $55 000, $75 000, $95 000, $115 000, $135 000, $155 000, $175 000, $195 000 and $215 000. This proportion is reported for families with one child attending long day care or family day care for 30 hours.
• Preschool service costs — the median hourly cost of a preschool program (after subsidies), per child enrolled aged 4 and 5 years.
Median costs represent the middle value of the range of costs.
(continued next page)
0
20
40
60
80
100
NSW Vic Qld WA SA Tas ACT NT Aust
Per
cent
Preschool program within LDC Multiple preschools or Both preschool and LDC
Non-government preschool Government preschool
3.16 REPORT ON GOVERNMENT SERVICES 2018
Box 3.5 (continued) Provided the service quality is held constant, lower median service costs are desirable. While a similar proportion of income across income groups suggests a more equitable outcome. Families who use more care per week are expected to face higher out-of-pocket costs.
Various factors influence ECEC costs and care needs to be exercised when interpreting results, as:
• fees are set independently by ECEC service providers and there is significant variation in the fees across services
• costs are influenced by a number of factors including NQF approval requirements, award wages, and whether fees include charges for additional services such as nappies and meals, as well as localised issues such as, land values and rental costs, rates, and other localised costs of living)
• median costs data may reflect particular scenarios of ECEC use and family income level, so do not reflect the out-of-pocket costs by families at varying levels of income or care usage
• for preschool service costs, there are a mix of providers (community, private and government). Differences in charging practices can be due to commercial or cost recovery decisions made by individual services. Some preschool programs, particularly those offered at government preschools, have no tuition fees.
Data reported for this indicator are:
• comparable (subject to caveats) across jurisdictions and over time
• complete (subject to caveats) for the current reporting period. All required 2016 data (preschool service costs) and 2017 data (child care service costs) are available for all jurisdictions.
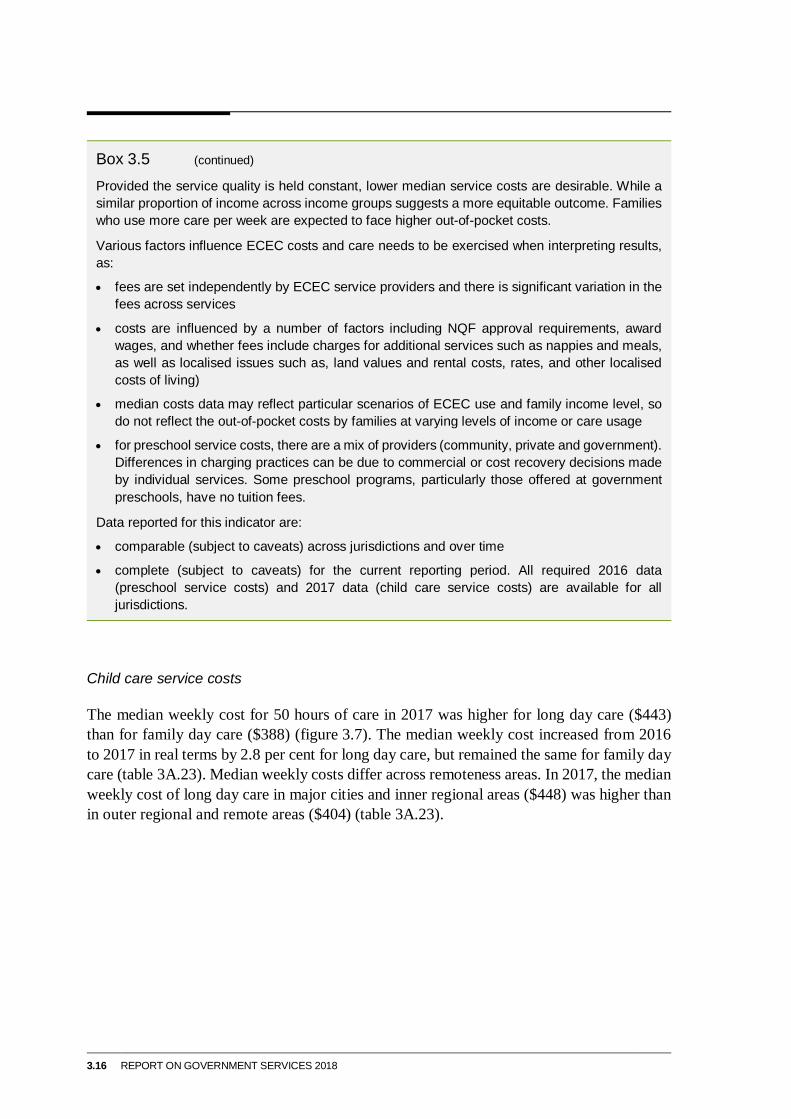
Child care service costs
The median weekly cost for 50 hours of care in 2017 was higher for long day care ($443) than for family day care ($388) (figure 3.7). The median weekly cost increased from 2016 to 2017 in real terms by 2.8 per cent for long day care, but remained the same for family day care (table 3A.23). Median weekly costs differ across remoteness areas. In 2017, the median weekly cost of long day care in major cities and inner regional areas ($448) was higher than in outer regional and remote areas ($404) (table 3A.23).
EARLY CHILDHOOD EDUCATION AND CARE 3.17
Figure 3.7 Median cost of Australian Government CCB approved child
care services, by selected service types, 2017a
a See box 3.5 and table 3A.23 for detailed definitions, footnotes and caveats. Source: Australian Government Department of Education and Training (unpublished); table 3A.23.
Child care costs as a proportion of weekly disposable income
Nationally in 2017, child care subsidies reduced the out-of-pocket costs for 30 hours of day care for all family income categories. However, the subsidies had a greater impact (as a proportion of family income) for lower income families, reducing the variation in the child care costs across income categories (table 3A.24).
Across jurisdictions in 2017, the out-of-pocket costs for 30 hours of child care, as a proportion of weekly disposable (after subsidies), were higher for long day care than family day care. Out-of-pocket costs for:
• long day care — were between 7.5 and 4.6 per cent for gross family incomes of $35 000 and $215 000, respectively (table 3A.24)
• family day care — were between 7.1 and 4.4 per cent for gross family incomes of $35 000 and $215 000, respectively (table 3A.24).
Preschool service costs
Nationally, the median cost per hour for a preschool program (after subsidies) per child was $2.61 in 2016, an increase from $2.34 in 2015 (2015-16 dollars) (table 3A.25). The median cost is zero for WA, SA, Tasmania, the ACT and the NT — government preschool is free in these jurisdictions.
0
100
200
300
400
500
600
NSW Vic Qld WA SA Tas ACT NT Aust
$/w
eek
Long day care Family day care
3.18 REPORT ON GOVERNMENT SERVICES 2018
Median hourly costs differ across remoteness areas. In 2016, the median hourly cost of preschool (after subsidies) in major cities was $2.87, compared to $2.09 in regional areas and zero in remote areas (table 3A.26).
Appropriateness — Non-standard hours of care in child care services
‘Non-standard hours of care in child care services’ is an indicator of governments’ objective to ensure that government funded child care services are accessible and flexible (box 3.6).
Box 3.6 Non-standard hours of care in child care services ‘Non-standard hours of care in child care services’ is defined as the proportion of Australian Government CCB approved child care services that provide non-standard hours of care, by service type. Definitions of ‘standard hours’ and ‘non-standard hours’ are provided in section 3.4.
A high or increasing proportion of services providing non-standard hours of care can suggest greater flexibility of services to meet the needs of families. That said, this indicator does not provide information on demand for non-standard hours of care or whether available non-standard hours services meet the needs of users.
Provision of non-standard hours of care can be influenced by a range of factors, such as costs to services and parents, demand for care, availability of carers, and compliance with legislative requirements.
Data reported for this measure are:
• comparable (subject to caveats) across jurisdictions and over time
• complete (subject to caveats) for the current reporting period. All required 2017 data are available for all jurisdictions.
In March 2017, 26.5 per cent of CCB approved child care services provided non-standard hours of care, an increase from 23.6 per cent in 2014 (figure 3.8). The proportion of services providing non-standard hours of care varies by service type, ranging nationally from nil for occasional care services to 38.1 per cent of in-home care services (table 3A.27).
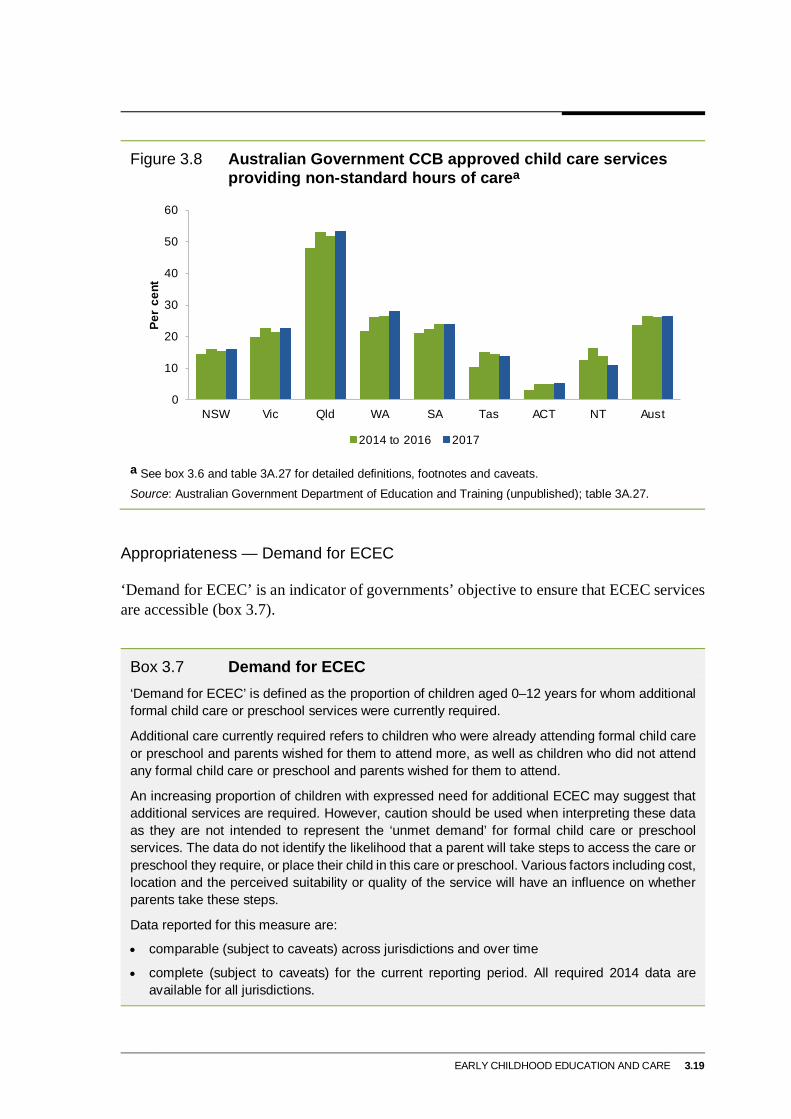
EARLY CHILDHOOD EDUCATION AND CARE 3.19
Figure 3.8 Australian Government CCB approved child care services
providing non-standard hours of carea
a See box 3.6 and table 3A.27 for detailed definitions, footnotes and caveats. Source: Australian Government Department of Education and Training (unpublished); table 3A.27.
Appropriateness — Demand for ECEC
‘Demand for ECEC’ is an indicator of governments’ objective to ensure that ECEC services are accessible (box 3.7).
Box 3.7 Demand for ECEC ‘Demand for ECEC’ is defined as the proportion of children aged 0–12 years for whom additional formal child care or preschool services were currently required.
Additional care currently required refers to children who were already attending formal child care or preschool and parents wished for them to attend more, as well as children who did not attend any formal child care or preschool and parents wished for them to attend.
An increasing proportion of children with expressed need for additional ECEC may suggest that additional services are required. However, caution should be used when interpreting these data as they are not intended to represent the ‘unmet demand’ for formal child care or preschool services. The data do not identify the likelihood that a parent will take steps to access the care or preschool they require, or place their child in this care or preschool. Various factors including cost, location and the perceived suitability or quality of the service will have an influence on whether parents take these steps.
Data reported for this measure are:
• comparable (subject to caveats) across jurisdictions and over time
• complete (subject to caveats) for the current reporting period. All required 2014 data are available for all jurisdictions.
0
10
20
30
40
50
60
NSW Vic Qld WA SA Tas ACT NT Aust
Per
cent
2014 to 2016 2017
3.20 REPORT ON GOVERNMENT SERVICES 2018
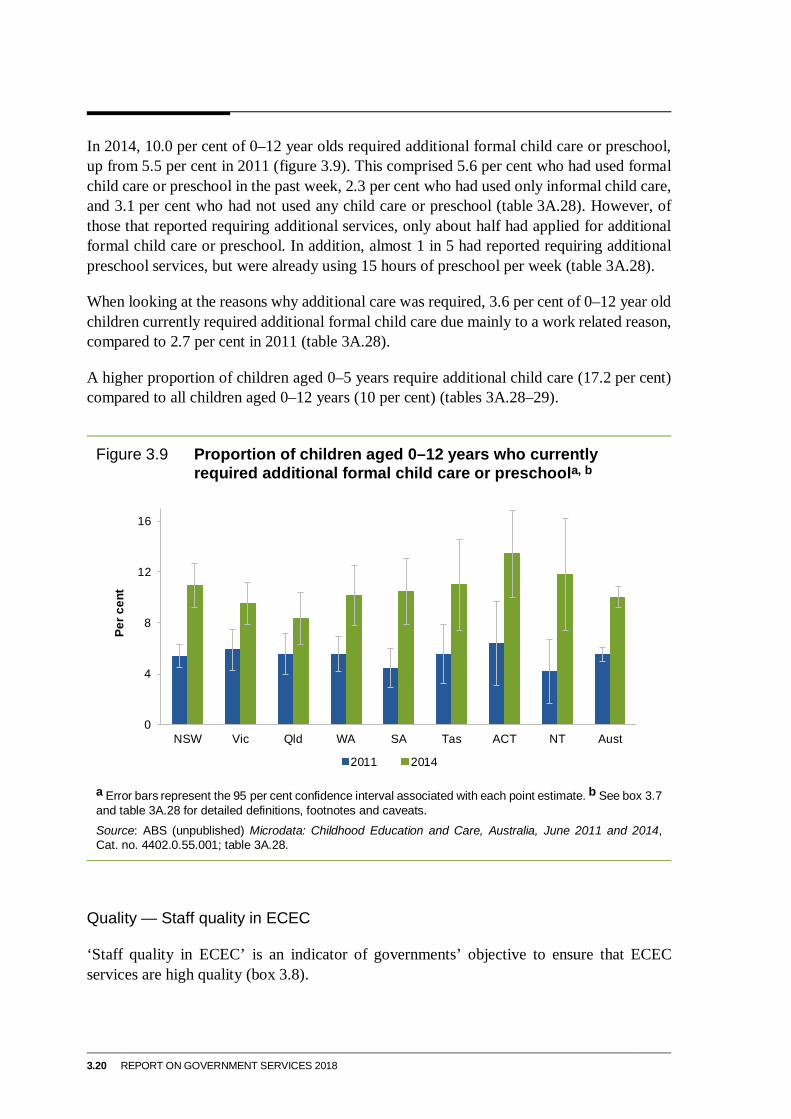
In 2014, 10.0 per cent of 0–12 year olds required additional formal child care or preschool, up from 5.5 per cent in 2011 (figure 3.9). This comprised 5.6 per cent who had used formal child care or preschool in the past week, 2.3 per cent who had used only informal child care, and 3.1 per cent who had not used any child care or preschool (table 3A.28). However, of those that reported requiring additional services, only about half had applied for additional formal child care or preschool. In addition, almost 1 in 5 had reported requiring additional preschool services, but were already using 15 hours of preschool per week (table 3A.28).
When looking at the reasons why additional care was required, 3.6 per cent of 0–12 year old children currently required additional formal child care due mainly to a work related reason, compared to 2.7 per cent in 2011 (table 3A.28).
A higher proportion of children aged 0–5 years require additional child care (17.2 per cent) compared to all children aged 0–12 years (10 per cent) (tables 3A.28–29).
Figure 3.9 Proportion of children aged 0–12 years who currently
required additional formal child care or preschoola, b
a Error bars represent the 95 per cent confidence interval associated with each point estimate. b See box 3.7 and table 3A.28 for detailed definitions, footnotes and caveats. Source: ABS (unpublished) Microdata: Childhood Education and Care, Australia, June 2011 and 2014, Cat. no. 4402.0.55.001; table 3A.28.
Quality — Staff quality in ECEC
‘Staff quality in ECEC’ is an indicator of governments’ objective to ensure that ECEC services are high quality (box 3.8).
0
4
8
12
16
NSW Vic Qld WA SA Tas ACT NT Aust
Per c
ent
2011 2014
EARLY CHILDHOOD EDUCATION AND CARE 3.21
Box 3.8 Staff quality in ECEC ‘Staff quality in ECEC’ is defined by two measures:
• The proportion of paid primary contact staff employed by Australian Government CCB approved child care services with a relevant formal qualification (at or above Certificate level III), or three or more years of relevant experience.
• The proportion of teachers delivering preschool programs (across all services, not just CCB approved services) who are at least three year university trained and early childhood qualified. Teachers are defined using the following worker roles: principal/director/coordinator/teacher in charge and group leader/teacher. At least three-year university trained includes: ‘Bachelor degree (3 years or equivalent)’, ‘Bachelor degree (4 years pass and honours)’, ‘Graduate diploma/certificate and above’.
Some studies and research (for example, Huntsman [2008], OECD [2006], and Warren and Haisken-DeNew [2013]) have shown a link between education levels of ECEC staff and children’s learning outcomes, suggesting that a high or increasing proportion is desirable.
Data reported for these measures are:
• comparable (subject to caveats) across jurisdictions and over time for paid primary contact staff employed by Australian Government CCB approved child care services, but not for teachers delivering preschool programs
• complete (subject to caveats) for the current reporting period. All required 2016 data for the first measure and 2014 data for the second measure are available for all jurisdictions.
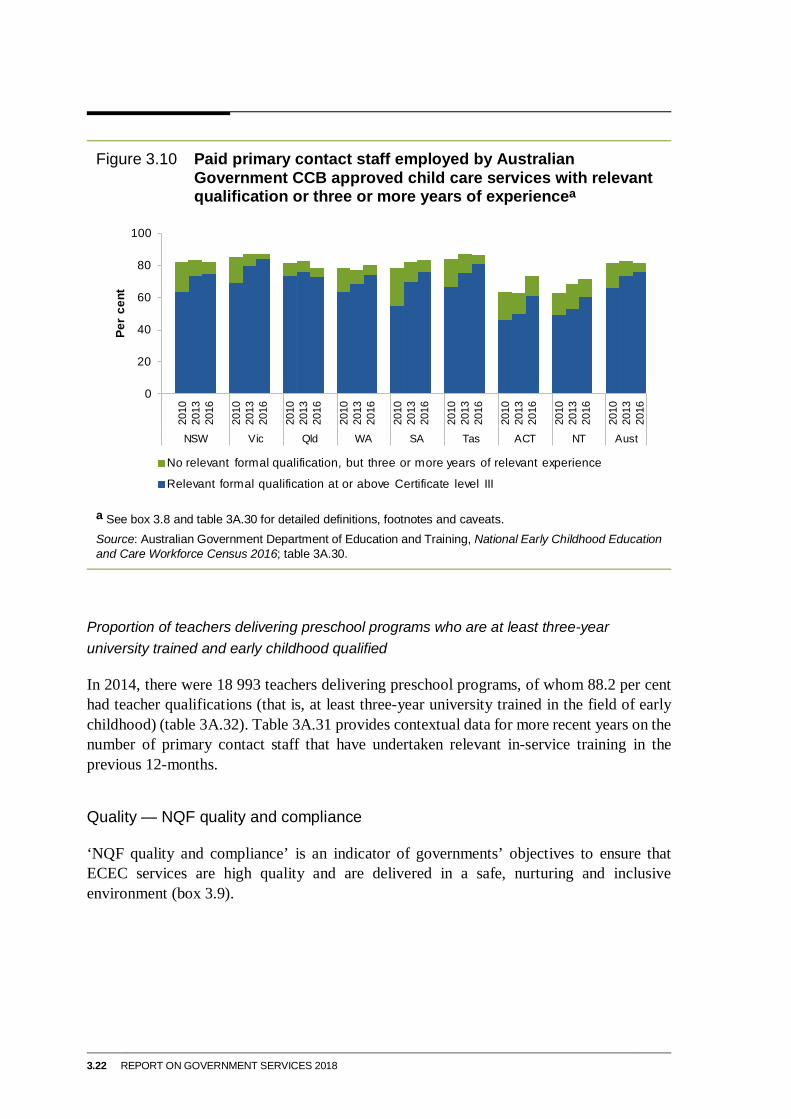
Proportion of paid primary contact staff employed by Australian Government CCB approved child care services, by relevant formal qualifications, or three years or more relevant experience
In 2016, 81.5 per cent of the 129 884 paid primary contact staff employed by Australian Government CCB approved child care services had a relevant formal qualification or three or more years relevant experience, a decrease from 82.6 per cent in 2013 (figure 3.10). Of all paid primary contact staff, 31.5 per cent held Certificate III or IV, 31.9 per cent held a diploma or advanced diploma, and 12.8 per cent held a bachelor degree or above (table 3A.30).
3.22 REPORT ON GOVERNMENT SERVICES 2018
Figure 3.10 Paid primary contact staff employed by Australian
Government CCB approved child care services with relevant qualification or three or more years of experiencea
a See box 3.8 and table 3A.30 for detailed definitions, footnotes and caveats. Source: Australian Government Department of Education and Training, National Early Childhood Education and Care Workforce Census 2016; table 3A.30.
Proportion of teachers delivering preschool programs who are at least three-year university trained and early childhood qualified
In 2014, there were 18 993 teachers delivering preschool programs, of whom 88.2 per cent had teacher qualifications (that is, at least three-year university trained in the field of early childhood) (table 3A.32). Table 3A.31 provides contextual data for more recent years on the number of primary contact staff that have undertaken relevant in-service training in the previous 12-months.
Quality — NQF quality and compliance
‘NQF quality and compliance’ is an indicator of governments’ objectives to ensure that ECEC services are high quality and are delivered in a safe, nurturing and inclusive environment (box 3.9).
0
20
40
60
80
100
2010
2013
2016
2010
2013
2016
2010
2013
2016
2010
2013
2016
2010
2013
2016
2010
2013
2016
2010
2013
2016
2010
2013
2016
2010
2013
2016
NSW Vic Qld WA SA Tas ACT NT Aust
Per
cent
No relevant formal qualification, but three or more years of relevant experience
Relevant formal qualification at or above Certificate level III
EARLY CHILDHOOD EDUCATION AND CARE 3.23
Box 3.9 NQF quality and compliance ‘NQF quality and compliance’ is defined by measures Achievement of National Quality Standard (NQS) and Confirmed breaches.
Achievement of NQS The proportion of NQF approved services with a quality rating, whose overall rating is ‘Meeting NQS’, ‘Exceeding NQS’ or ‘Excellent’.
Services receive an overall rating of Meeting NQS if they are rated as Meeting NQS in all seven quality areas or have a mix of quality areas rated Meeting NQS and Exceeding NQS. Services receive an overall rating of Exceeding NQS if four or more quality areas are rated as Exceeding NQS, including two of the four following quality areas: Quality Area 1, Quality Area 5, Quality Area 6 and Quality Area 7. The Excellent rating can only be awarded by the Australian Children’s Education and Care Quality Authority (ACECQA), on application by the Approved Provider (ACECQA 2016) (see section 3.4 for further information on NQS achievement).
A high proportion of services that achieve the NQS suggests a high quality of service.
Data reported for this measure are:
• comparable (subject to caveats) across jurisdictions and over time
• complete (subject to caveats) for the current reporting period. All required data as at 30 June 2017 are available for all jurisdictions.
Confirmed breaches The number of confirmed breaches by NQF approved services divided by the number of NQF approved services, multiplied by 100.
A confirmed breach constitutes a failure by an ECEC service to abide by relevant legislation, regulations or conditions. Confirmed breaches have been investigated by the regulatory body and considered to have substance.
Breaches vary in circumstance and severity. Some breaches can have serious implications for the quality of care provided to children (such as requirements to undertake criminal record checks for staff and requirements to install smoke detectors). Other breaches do not necessarily directly affect the quality of care (such as requirements to display NQF approval information).
All else being equal, a low or decreasing rate of confirmed breaches can suggest a higher quality service. A high or increasing rate of confirmed breaches does not necessarily mean that a jurisdiction has lower service safety and quality, as it might mean it has a more effective reporting and monitoring regime.
Data reported for this measure are:
• not comparable across jurisdictions due to differences in administrative and reporting procedures. Confirmed breaches data are not available for prior years
• complete (subject to caveats) for the current reporting period. All required data for 2016-17 are available for all jurisdictions.
The majority of ECEC services are approved and regulated under the NQF, including child care services (long day care, family day care, vacation care and OSHC) and preschool services. As at 30 June 2017, there were 15 546 NQF approved ECEC services
3.24 REPORT ON GOVERNMENT SERVICES 2018
(table 3A.33). Some ECEC services are licensed and/or registered to operate by State and Territory governments, but are not approved under the NQF, including occasional care and mobile preschools (State and Territory governments, unpublished).
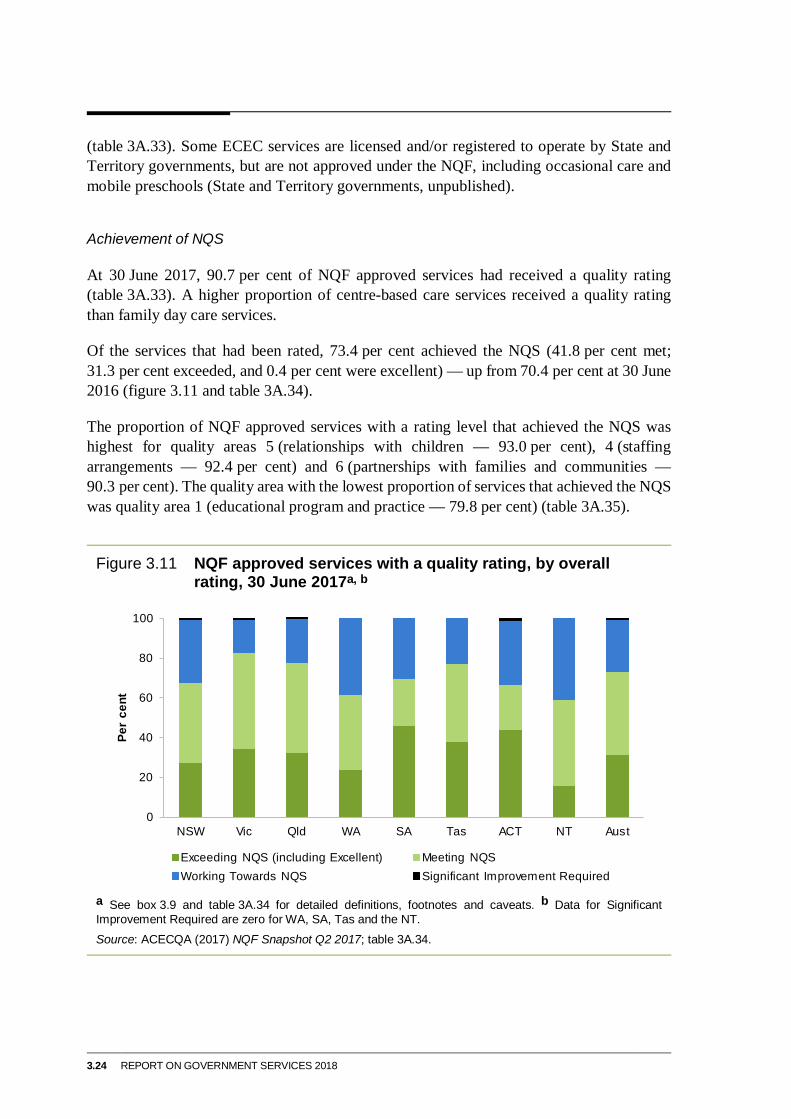
Achievement of NQS
At 30 June 2017, 90.7 per cent of NQF approved services had received a quality rating (table 3A.33). A higher proportion of centre-based care services received a quality rating than family day care services.
Of the services that had been rated, 73.4 per cent achieved the NQS (41.8 per cent met; 31.3 per cent exceeded, and 0.4 per cent were excellent) — up from 70.4 per cent at 30 June 2016 (figure 3.11 and table 3A.34).
The proportion of NQF approved services with a rating level that achieved the NQS was highest for quality areas 5 (relationships with children — 93.0 per cent), 4 (staffing arrangements — 92.4 per cent) and 6 (partnerships with families and communities — 90.3 per cent). The quality area with the lowest proportion of services that achieved the NQS was quality area 1 (educational program and practice — 79.8 per cent) (table 3A.35).
Figure 3.11 NQF approved services with a quality rating, by overall
rating, 30 June 2017a, b
a See box 3.9 and table 3A.34 for detailed definitions, footnotes and caveats. b Data for Significant Improvement Required are zero for WA, SA, Tas and the NT. Source: ACECQA (2017) NQF Snapshot Q2 2017; table 3A.34.
0
20
40
60
80
100
NSW Vic Qld WA SA Tas ACT NT Aust
Per
cent
Exceeding NQS (including Excellent) Meeting NQSWorking Towards NQS Significant Improvement Required
EARLY CHILDHOOD EDUCATION AND CARE 3.25
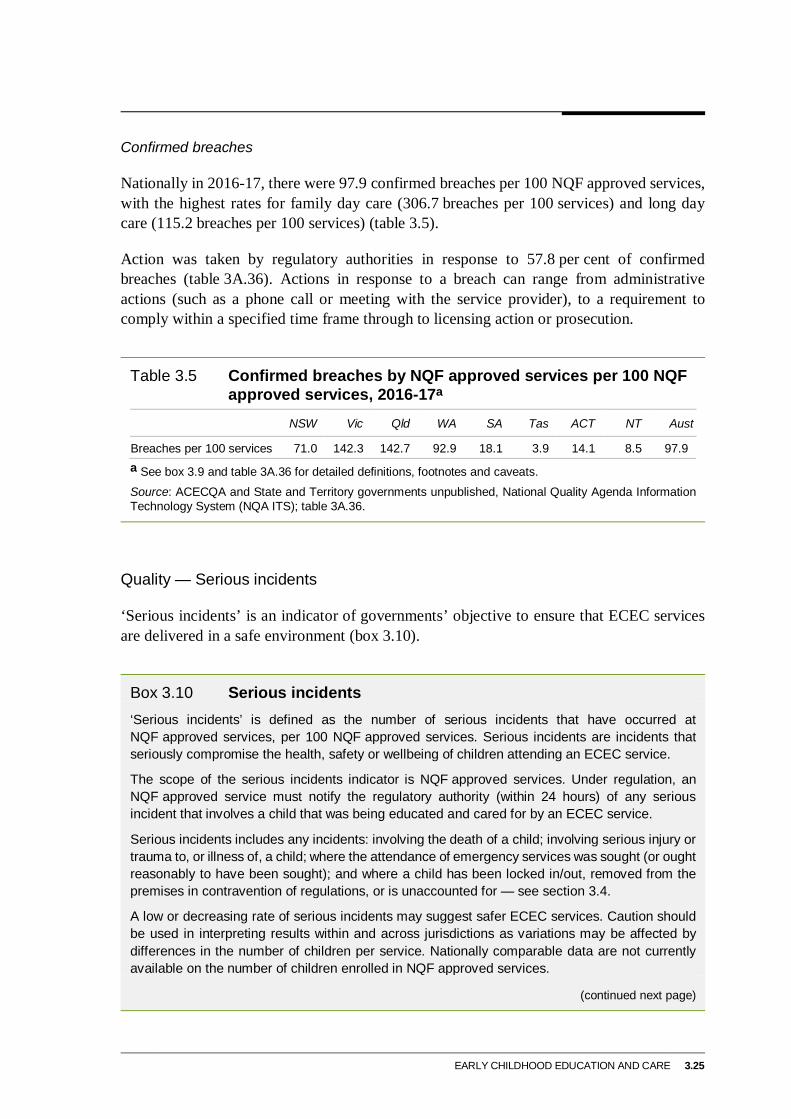
Confirmed breaches
Nationally in 2016-17, there were 97.9 confirmed breaches per 100 NQF approved services, with the highest rates for family day care (306.7 breaches per 100 services) and long day care (115.2 breaches per 100 services) (table 3.5).
Action was taken by regulatory authorities in response to 57.8 per cent of confirmed breaches (table 3A.36). Actions in response to a breach can range from administrative actions (such as a phone call or meeting with the service provider), to a requirement to comply within a specified time frame through to licensing action or prosecution.
Table 3.5 Confirmed breaches by NQF approved services per 100 NQF
approved services, 2016-17a NSW Vic Qld WA SA Tas ACT NT Aust
Breaches per 100 services 71.0 142.3 142.7 92.9 18.1 3.9 14.1 8.5 97.9
a See box 3.9 and table 3A.36 for detailed definitions, footnotes and caveats. Source: ACECQA and State and Territory governments unpublished, National Quality Agenda Information Technology System (NQA ITS); table 3A.36.
Quality — Serious incidents
‘Serious incidents’ is an indicator of governments’ objective to ensure that ECEC services are delivered in a safe environment (box 3.10).
Box 3.10 Serious incidents ‘Serious incidents’ is defined as the number of serious incidents that have occurred at NQF approved services, per 100 NQF approved services. Serious incidents are incidents that seriously compromise the health, safety or wellbeing of children attending an ECEC service.
The scope of the serious incidents indicator is NQF approved services. Under regulation, an NQF approved service must notify the regulatory authority (within 24 hours) of any serious incident that involves a child that was being educated and cared for by an ECEC service.
Serious incidents includes any incidents: involving the death of a child; involving serious injury or trauma to, or illness of, a child; where the attendance of emergency services was sought (or ought reasonably to have been sought); and where a child has been locked in/out, removed from the premises in contravention of regulations, or is unaccounted for — see section 3.4.
A low or decreasing rate of serious incidents may suggest safer ECEC services. Caution should be used in interpreting results within and across jurisdictions as variations may be affected by differences in the number of children per service. Nationally comparable data are not currently available on the number of children enrolled in NQF approved services.
(continued next page)
3.26 REPORT ON GOVERNMENT SERVICES 2018
Box 3.10 (continued) Data reported for this measure are:
• comparable (subject to caveats) across jurisdictions. Serious incidents data are not available for prior years
• complete (subject to caveats) for the current reporting period. All required 2016-17 data are available for all jurisdictions.
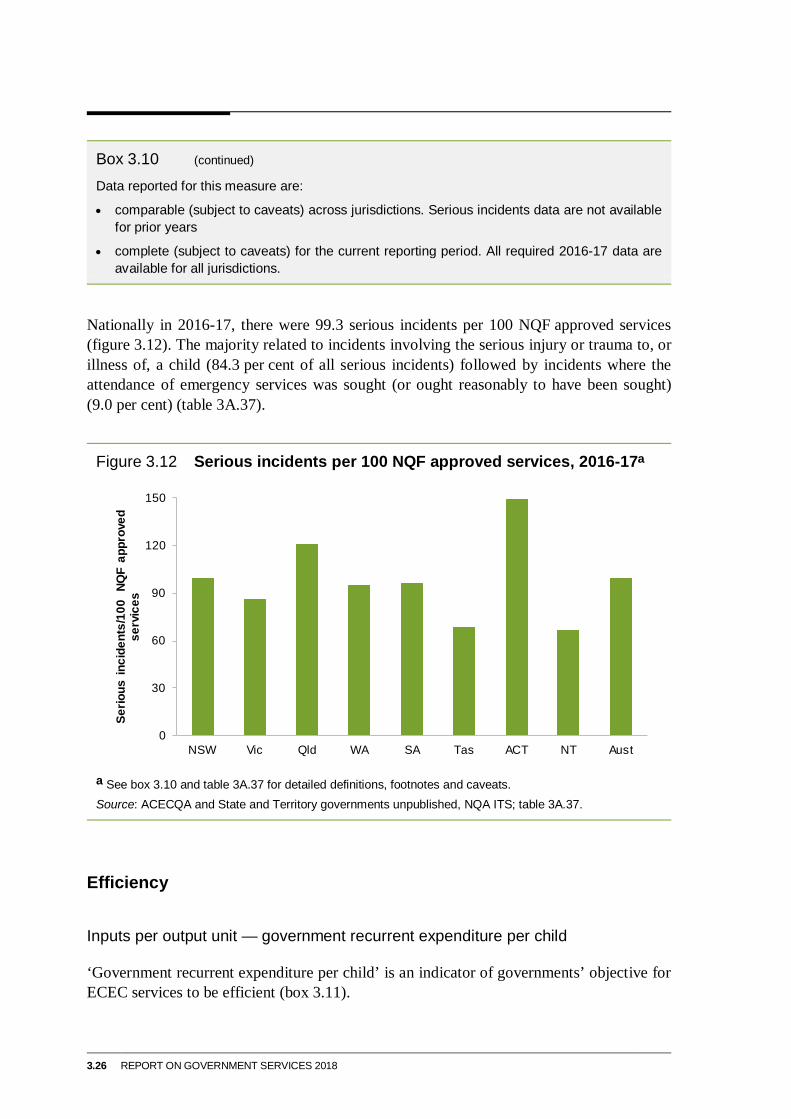
Nationally in 2016-17, there were 99.3 serious incidents per 100 NQF approved services (figure 3.12). The majority related to incidents involving the serious injury or trauma to, or illness of, a child (84.3 per cent of all serious incidents) followed by incidents where the attendance of emergency services was sought (or ought reasonably to have been sought) (9.0 per cent) (table 3A.37).
Figure 3.12 Serious incidents per 100 NQF approved services, 2016-17a
a See box 3.10 and table 3A.37 for detailed definitions, footnotes and caveats. Source: ACECQA and State and Territory governments unpublished, NQA ITS; table 3A.37.
Efficiency
Inputs per output unit — government recurrent expenditure per child
‘Government recurrent expenditure per child’ is an indicator of governments’ objective for ECEC services to be efficient (box 3.11).
0
30
60
90
120
150
NSW Vic Qld WA SA Tas ACT NT Aust
Serio
us in
cide
nts/
100
NQF
appr
oved
se
rvic
es
EARLY CHILDHOOD EDUCATION AND CARE 3.27
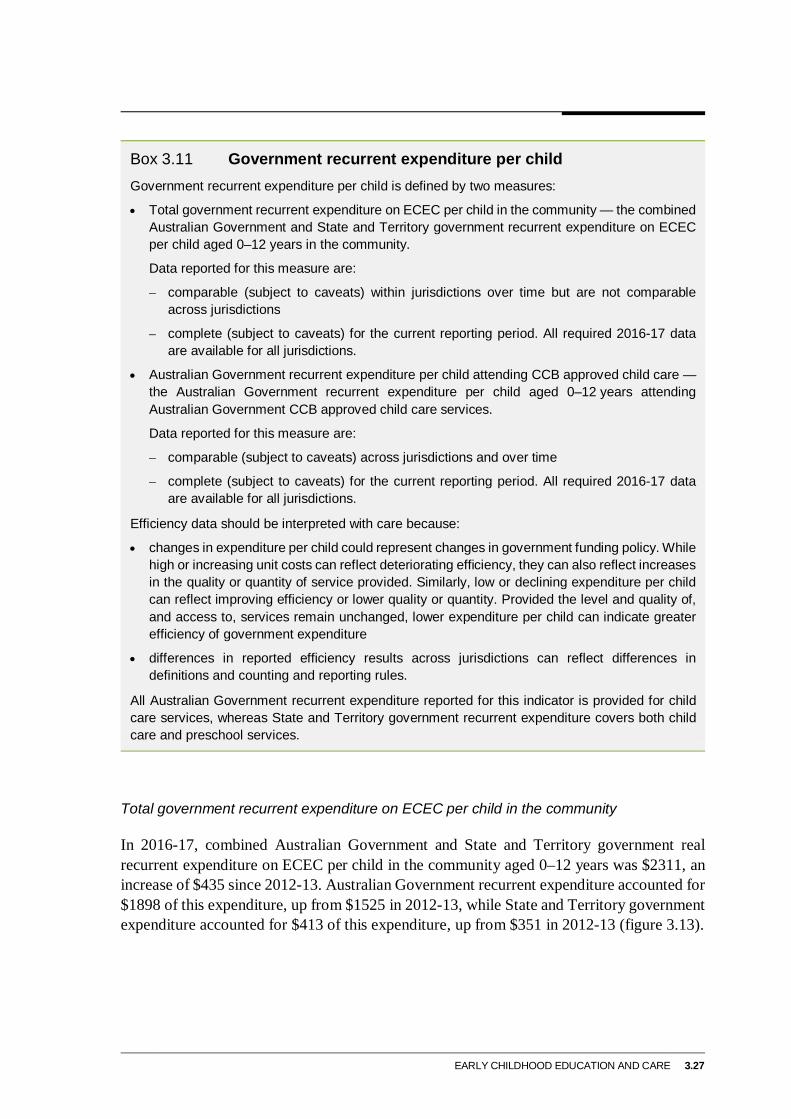
Box 3.11 Government recurrent expenditure per child Government recurrent expenditure per child is defined by two measures:
• Total government recurrent expenditure on ECEC per child in the community — the combined Australian Government and State and Territory government recurrent expenditure on ECEC per child aged 0–12 years in the community.
Data reported for this measure are:
– comparable (subject to caveats) within jurisdictions over time but are not comparable across jurisdictions
– complete (subject to caveats) for the current reporting period. All required 2016-17 data are available for all jurisdictions.
• Australian Government recurrent expenditure per child attending CCB approved child care — the Australian Government recurrent expenditure per child aged 0–12 years attending Australian Government CCB approved child care services.
Data reported for this measure are:
– comparable (subject to caveats) across jurisdictions and over time
– complete (subject to caveats) for the current reporting period. All required 2016-17 data are available for all jurisdictions.
Efficiency data should be interpreted with care because:
• changes in expenditure per child could represent changes in government funding policy. While high or increasing unit costs can reflect deteriorating efficiency, they can also reflect increases in the quality or quantity of service provided. Similarly, low or declining expenditure per child can reflect improving efficiency or lower quality or quantity. Provided the level and quality of, and access to, services remain unchanged, lower expenditure per child can indicate greater efficiency of government expenditure
• differences in reported efficiency results across jurisdictions can reflect differences in definitions and counting and reporting rules.
All Australian Government recurrent expenditure reported for this indicator is provided for child care services, whereas State and Territory government recurrent expenditure covers both child care and preschool services.
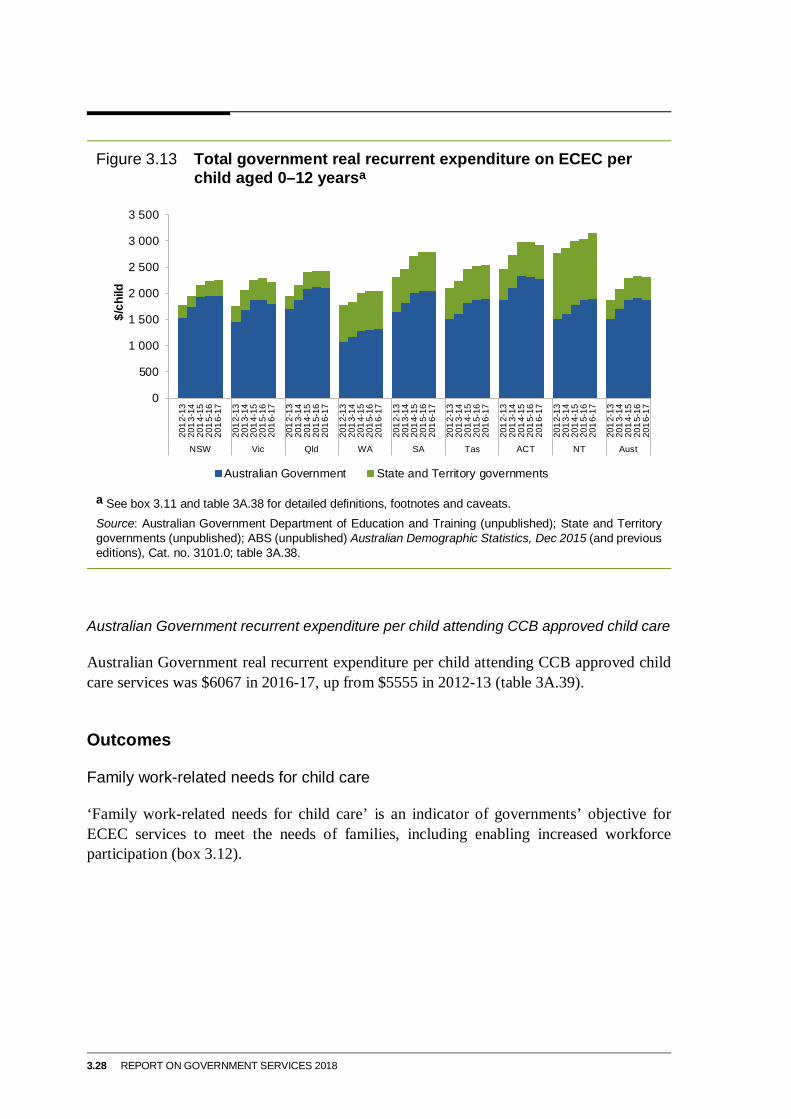
Total government recurrent expenditure on ECEC per child in the community
In 2016-17, combined Australian Government and State and Territory government real recurrent expenditure on ECEC per child in the community aged 0–12 years was $2311, an increase of $435 since 2012-13. Australian Government recurrent expenditure accounted for $1898 of this expenditure, up from $1525 in 2012-13, while State and Territory government expenditure accounted for $413 of this expenditure, up from $351 in 2012-13 (figure 3.13).
3.28 REPORT ON GOVERNMENT SERVICES 2018
Figure 3.13 Total government real recurrent expenditure on ECEC per
child aged 0–12 yearsa
a See box 3.11 and table 3A.38 for detailed definitions, footnotes and caveats. Source: Australian Government Department of Education and Training (unpublished); State and Territory governments (unpublished); ABS (unpublished) Australian Demographic Statistics, Dec 2015 (and previous editions), Cat. no. 3101.0; table 3A.38.
Australian Government recurrent expenditure per child attending CCB approved child care
Australian Government real recurrent expenditure per child attending CCB approved child care services was $6067 in 2016-17, up from $5555 in 2012-13 (table 3A.39).
Outcomes
Family work-related needs for child care
‘Family work-related needs for child care’ is an indicator of governments’ objective for ECEC services to meet the needs of families, including enabling increased workforce participation (box 3.12).
0
500
1 000
1 500
2 000
2 500
3 000
3 500
2012
-13
2013
-14
2014
-15
2015
-16
2016
-17
2012
-13
2013
-14
2014
-15
2015
-16
2016
-17
2012
-13
2013
-14
2014
-15
2015
-16
2016
-17
2012
-13
2013
-14
2014
-15
2015
-16
2016
-17
2012
-13
2013
-14
2014
-15
2015
-16
2016
-17
2012
-13
2013
-14
2014
-15
2015
-16
2016
-17
2012
-13
2013
-14
2014
-15
2015
-16
2016
-17
2012
-13
2013
-14
2014
-15
2015
-16
2016
-17
2012
-13
2013
-14
2014
-15
2015
-16
2016
-17
NSW Vic Qld WA SA Tas ACT NT Aust
$/ch
ild
Australian Government State and Territory governments
EARLY CHILDHOOD EDUCATION AND CARE 3.29
Box 3.12 Family work-related needs for child care ‘Family work-related needs for child care’ is defined as the proportion of people aged 15 years and over not in the labour force due to caring for children, who report the main reason for not being in the labour force as child care service-related.
A relatively small or decreasing proportion of people not in the labour force due to caring for children who report the main reason for not being in the labour force as child care service-related may indicate that services are meeting the needs of families. However, there are a number of factors which affect the labour force participation decisions of people responsible for caring for children, of which child care service-related reasons are a subset. Also, due to the subjective nature of self-reporting, care should be taken when interpreting the data, particularly for child care service-related reasons.
Data reported for this measure are:
• comparable (subject to caveats) across jurisdictions and over time
• complete (subject to caveats) for the current reporting period. All required 2015 data are available for all jurisdictions.
In 2015, 281 800 people aged 15 years and over reported that they were not in the labour force due to caring for children (table 3A.40). Of these people, over 40 per cent reported not being in the labour force for a child care service-related reason, with the most common reason given being cost of child care (34.0 per cent). The most common non-service-related reason was a preference to look after children (at 27.5 per cent) (table 3A.40).
ECEC outcomes
‘ECEC outcomes’ is an indicator of governments’ objective to provide ECEC services that meet the education, care, and development needs of children (box 3.13).
Box 3.13 ECEC outcomes ‘ECEC outcomes’ is defined as the proportion of children with ECEC experience who are developmentally vulnerable on one or more domains of the Australian Early Development Census (AEDC). The AEDC collects data from teachers on the early childhood development of children when they are in their first year of full time schooling. Children are considered developmentally vulnerable in a domain if they score below the 10th percentile. The domains are: language and cognitive skills; physical health and wellbeing; social competence; emotional maturity; and communications skills and general knowledge.
(continued next page)
3.30 REPORT ON GOVERNMENT SERVICES 2018
Box 3.13 (continued) A low proportion of children who received ECEC reported as developmentally vulnerable is desirable, and a lower proportion of children who received some ECEC reported as developmentally vulnerable compared to children who did not receive any ECEC could indicate that receiving ECEC leads to better development outcomes. However, results should be interpreted with caution as:
• these data report on the correlation between ECEC experience and development outcomes. The causal impact of ECEC experience on development outcomes cannot be determined from these data
• ECEC experience is just one factor contributing to development. A range of other factors also influence development outcomes, including parental and family circumstances and other services such as health and parenting support
• ECEC experience is reported by the teacher, and therefore, dependent on the teacher’s knowledge of the child’s previous experience
• the data do not include how much ECEC (for example, hours per week) children received
• not all children in the dataset have a complete response for whether or not they attended ECEC.
Data reported for this measure are:
• comparable (subject to caveats) across jurisdictions and over time
• complete (subject to caveats) for the current reporting period. All required 2012 and 2015 data are available for all jurisdictions.
In 2015, 22.0 per cent of children in their first year of full time schooling were developmentally vulnerable on one or more domains — unchanged from 2012 (table 3A.41). Children who received some ECEC were less likely to be developmentally vulnerable on one or more domains (19.9 per cent), compared to children who did not receive any ECEC (38.5 per cent).
3.4 Definitions of key terms Capital expenditure Expenditure on the acquisition or enhancement of fixed assets, less trade-in
values and/or receipts from the sale of replaced or otherwise disposed of items. Capital expenditure does not include expenditure on fixed assets which fall below threshold capitalisation levels, depreciation or costs associated with maintaining, renting or leasing equipment.
Children from low-income families
Children in families with gross income (excluding Family Tax Benefit) of less than the annual income threshold for receiving the maximum rate of CCB.
Children from non-English-speaking backgrounds
Children living in situations where the main language spoken at home is not English.
EARLY CHILDHOOD EDUCATION AND CARE 3.31
Children with disability A child that has a need for additional assistance in any of the following areas (learning and applying knowledge, education; communication; mobility; self-care; interpersonal interactions and relationships; other- including general tasks, domestic life, community and social life) compared to children of a similar age, that is related to underlying long term health condition or disability (long term is longer than six months).
Comparability Data are considered comparable if (subject to caveats) they can be used to inform an assessment of comparative performance. Typically, data are considered comparable when they are collected in the same way and in accordance with the same definitions. For comparable indicators or measures, significant differences in reported results allow an assessment of differences in performance, rather than being the result of anomalies in the data.
Completeness Data are considered complete if all required data are available for all jurisdictions that provide the service.
Family day care Services providing small group early childhood education and care for children in the home environment of a registered carer. Family day care is primarily aimed at 0–5 year olds, but primary school children may also receive the service before and after school, and during school holidays. Staff work in partnership with scheme management and coordination unit staff.
Formal child care Organised education and care provided by a person other than the child’s parent or guardian, usually outside of the child’s home — includes, long day care, family day care, OSHC, vacation care, occasional care (excluding babysitting), other care and in home care.
Formal qualifications Early childhood-related teaching degree (three or four years), a child care certificate or associate diploma (two years) and/or other relevant qualifications (for example, a diploma or degree in child care [three years], primary teaching, other teaching, nursing [including mothercraft nursing], psychology and social work).
In home care Education and care service provided by an approved carer in the child’s home. Families eligible for in home care include those where the parent(s) or child has an illness/disability, those in regional or remote areas, those where the parents are working shift work or non-standard hours, those with multiple births (more than two) and/or more than two children under school age, and those with a breastfeeding mother working from home.
In-service training Formal training only (that is, structured training sessions that can be conducted in-house or externally), including training in work or own time but not training towards qualifications included in obtaining formal qualifications. It includes: • management or financial training • training for additional needs children (such as children with disability,
Aboriginal or Torres Strait Islander children and children from a culturally diverse background)
• other child care-related training • other relevant courses (such as a first aid certificate).
Long day care Services aimed primarily at 0–5 year olds that are provided in a centre, usually by a mix of qualified and other staff. Educational, care and recreational programs are provided based on the developmental needs, interests and experience of each child. In some jurisdictions, primary school children may also receive care before and after school, and during school vacations. Some long day care centres may also provide preschool and kindergarten services (i.e. a preschool program) and OSHC (see relevant definitions). Long day care services may operate from stand-alone or shared premises, including on school grounds.
3.32 REPORT ON GOVERNMENT SERVICES 2018
National Quality Framework (NQF)
The NQF came into effect from 1 January 2012 and is a national system jointly governed by the Australian Government and State and Territory governments. It aims to raise quality and enable continuous improvement in ECEC through: • an applied law system, comprising the Education and Care Services
National Law and the Education and Care Services National Regulations • the NQS — which sets a national benchmark for the quality of services in
seven key quality areas (ACECQA 2016).
NQF approved services Under the NQF, an approved provider must apply for and be granted a service approval for each education and care service it wants to operate. There are two types of approved services under the NQF: • Centre-based care service: an education and care service other than a
family day care service. This includes most long day care, preschool and OSHC services that are delivered at a centre.
• Family day care service: an education and care service delivered through the use of two or more educators to provide education and care for children in residences, whether or not the service also provides education and care to children at a place other than the residence.
National Quality Standard (NQS) achievement
NQF approved services are rated against the NQS. To determine a rating for each quality area within a service, prior to 1 February 2018, 58 elements, located across the 18 standards, were assessed as being met or not met. If all elements in a standard were met, the standard would be rated as Meeting NQS or Exceeding NQS. Each quality area was then rated by calculating the rating of all of the standards within that quality area. If all standards were met, the quality area would be rated as Meeting NQS. If at least two of the standards were rated Exceeding NQS and all other standards were met, the quality area would be rated Exceeding NQS. Services received an overall rating of Exceeding NQS if four or more quality areas were rated as Exceeding NQS, including two of the four following quality areas: Quality Area 1, Quality Area 5, Quality Area 6 and Quality Area 7. Services with an overall rating of Exceeding NQS could apply to ACECQA to be awarded an Excellent rating. Services with an overall rating of Excellent are included in data for services with an Exceeding NQS rating. The Excellent rating can only be awarded by ACECQA, on application by the Approved Provider. A revised version of the NQS commenced in all State and Territory jurisdictions on 1 February 2018.
Non-standard hours of care
Defined by service type as: • long day care — service operates before 7 am or after 6.30 pm on any day
Monday to Friday or on weekends (to be considered a service offering non-standard hours of care only need to meet 1 of these 3 criteria)
• family day care — service operates before 7 am, or after 6.30 pm on any day Monday to Friday or overnight or on weekends (to be considered a service offering non-standard hours of care only need to meet 1 of these 4 criteria)
• vacation care — service operates before 7 am or after 6.30 pm on any day Monday to Friday (to be considered a service offering non-standard hours of care only need to meet 1 of these 2 criteria)
• OSHC — service operates before 7 am (before school) or after 6.30 pm (after school) on any day Monday to Friday (to be considered a service offering non-standard hours of care only need to meet 1 of these 2 criteria)
• occasional care — service operates before 7 am or after 6.30 pm on any day Monday to Friday or on weekends (to be considered a service offering non-standard hours of care only need to meet 1 of these 3 criteria)
• other — service operates before 7 am or after 6.30 pm on any day Monday to Friday or on weekends (to be considered a service offering non-standard hours of care only need to meet 1 of these 3 criteria).
EARLY CHILDHOOD EDUCATION AND CARE 3.33
Occasional care Services usually provided at a centre on an hourly or sessional basis for short periods or at irregular intervals for parents who need time to attend appointments, take care of personal matters, undertake casual and part time employment, study or have temporary respite from full time parenting. These services provide developmental education and care activities for children, and are primarily aimed at 0–5 year olds. Centres providing these services usually employ a mix of qualified and other staff.
Other care A child care service type in this Report that does not meet any of the other child care service type definitions. It may include services which support children with additional needs or in particular situations (including Aboriginal and Torres Strait Islander children, children from NESB, children with disability or of parents with disability, and children living in regional and remote areas). Other care services may include 3 year old preschool (or kindergarten) services (which do not meet the preschool service definition because they are not delivered by a qualified teacher), mobile services, playschools and nannies. Usage of other care services is reported only for State and Territory government funded services (i.e. non-CCB approved services).
Outside school hours care (OSHC)
Services that provide care for school aged children before school, after school, during school holidays, and on pupil free days. OSHC may use stand-alone facilities, share school buildings and grounds and/or share facilities such as community halls.
Preschool program A preschool program is a structured, play-based learning program, delivered by a qualified teacher, aimed at children in the year or two before they commence full time schooling. This definition of a preschool program is the same for all types of institutions that provide it, for all service settings and includes both government funded and privately provided preschool programs. Although various delivery models of preschool programs exist across jurisdictions, the YBFS is the term used to describe the ‘preschool’ program cohort. Preschool programs delivered to children in the year before full time schooling are intended to be available for a minimum of 600 hours per calendar year (or 15 hours per week for 40 weeks) (as per the NP UAECE). Children aged 3 to 6 years may be enrolled in a preschool program in the YBFS although the programs are typically delivered to 4 and 5 year olds.
Preschool services Services which deliver a preschool program. The preschool service type can be delivered from a range of service settings. Service settings include stand-alone preschools or kindergartens, preschools attached to a school and other service centres, such as long day care centres.
Primary contact staff Staff whose primary function is to provide child care and/or preschool services to children.
Real expenditure Actual expenditure adjusted for changes in prices. Adjustments were made using the General Government Final Consumption Expenditure price deflator and expressed in terms of final year prices.
Recurrent expenditure Expenditure that does not result in the creation or acquisition of fixed assets (new or second hand). It consists mainly of expenditure on wages, salaries and supplements, purchases of goods and services, and the consumption of fixed capital (depreciation).
Regional and remote areas
Regional and remote areas refer to remoteness areas based on the ABS’ Australian Statistical Geography Standard. The criteria for remoteness areas are based on the Accessibility/Remoteness Index of Australia, which measures the remoteness of a point based on the physical road distance to the nearest urban centre in each of five size classes. Regional areas includes ‘inner regional’ and ‘outer regional’ areas. Remote areas includes ‘remote’ and ‘very remote’ areas.
3.34 REPORT ON GOVERNMENT SERVICES 2018
Serious incidents For the purposes of Education and Care Services National Law, the following are prescribed as serious incidents: a. the death of a child:
– while being educated and cared for by an education and care service – following an incident while being educated and cared for by an education
and care service b. any incident involving serious injury or trauma to, or illness of, a child while
being educated and cared for by an education and care service: – which a reasonable person would consider required urgent medical
attention from a registered medical practitioner [Examples Whooping cough, broken limb, anaphylaxis reaction]
– for which the child attended, or ought reasonably to have attended, a hospital
c. any incident where the attendance of emergency services at the education and care service premises was sought, or ought reasonably to have been sought
d. any circumstance where a child being educated and cared for by an education and care service: – appears to be missing or cannot be accounted for – appears to have been taken or removed from the education and care
service premises in a manner that contravenes these Regulations – is mistakenly locked in or locked out of the education and care service
premises or any part of the premises.
Service A service refers to an individual location or establishment providing an ECEC service or services. One service (i.e. location or establishment) may provide more than one ECEC service type, i.e. provide a long day care service and preschool service, or two child care service types.
Service type Refers to the following categories of ECEC services: long day care; family day care; OSHC; before/after school care; vacation care; occasional care; in home care, and; other care preschool services. All service type categories are considered child care services, except for preschool services.
Special needs group An identifiable group within the general population who can have special difficulty accessing services. Special needs groups for which data are reported in this chapter include: children from NESB; Aboriginal and Torres Strait Islander children; children from low-income families (CCB approved child care services only); children with disability; and children from regional or remote areas.
Standard hours of care Defined by service type as: • long day care — service opens at 7 am or later and closes at 6.30 pm or
earlier every day Monday to Friday (does not operate on weekends) • family day care — service operates at 7 am or later and no later than
6.30 pm every day Monday to Friday (does not operate on weekends or overnight)
• vacation care — service operates at 7 am or later and no later than 6.30 pm every day Monday to Friday
• OSHC — service opens at 7 am or later (before school) and closes at 6.30 pm or earlier (after school) every day Monday to Friday
• occasional care — service operates at 7 am or later and no later than 6.30 pm every day Monday to Friday (does not operate on weekends)
• in home care — service operates at 7 am or later and no later than 6.30 pm every day Monday to Friday (does not operate on weekends).
Also see non-standard hours of care definition.
EARLY CHILDHOOD EDUCATION AND CARE 3.35
State and Territory government (only) funded
State and Territory government financed services — in particular, services that only receive State and Territory government contributions towards providing a specified service (i.e. excluding services which receive Australian Government funding).
Vacation care Services provided for children enrolled in schools (4–12 year olds) during the school holidays.
3.5 References ABS (Australian Bureau of Statistics) 2017, Preschool Education, Australia, 2016,
Cat. no. 4240.0, Canberra.
ACECQA (Australian Children’s Education and Care Quality Authority) 2016, Explaining the National Quality Framework, viewed 24 August 2017, <www.acecqa.gov.au/ national-quality-framework/explaining-the-national-quality-framework>.
Huntsman, L. 2008, Determinants of Quality Child Care: A Review of the Research Evidence, NSW Department of Community Service, Sydney.
OECD (Organisation for Economic Co-operation and Development) 2006, Starting Strong II: Early Childhood Education and Care, Paris.
Warren, D. and Haisken-DeNew, J.P. 2013, Early Bird Catches the Worm: The Causal Impact of Pre-school Participation and Teacher Qualifications in Year 3 NAPLAN Cognitive Tests, Melbourne Institute, University of Melbourne.
REPORT ONGOVERNMENTSERVICES 2018
EARLY CHILDHOODEDUCATION AND CARE
This file is available on the Review web page www.pc.gov.au/rogs/2018.
3A Early childhood education and care —attachment
Definitions for the indicators and descriptors in this attachment are in section 3.4 of thechapter. Unsourced information was obtained from the Australian, State and Territorygovernments.
Data in this Report are examined by the School and Early Education and Care WorkingGroup, but have not been formally audited by the Secretariat.
Information on the comparability and completeness of the data for the performance indicatorsand measures is in sections 3.2-3.
Data reported in the attachment tables are the most accurate available at the time of datacollection. Historical data may have been updated since the last edition of RoGS.
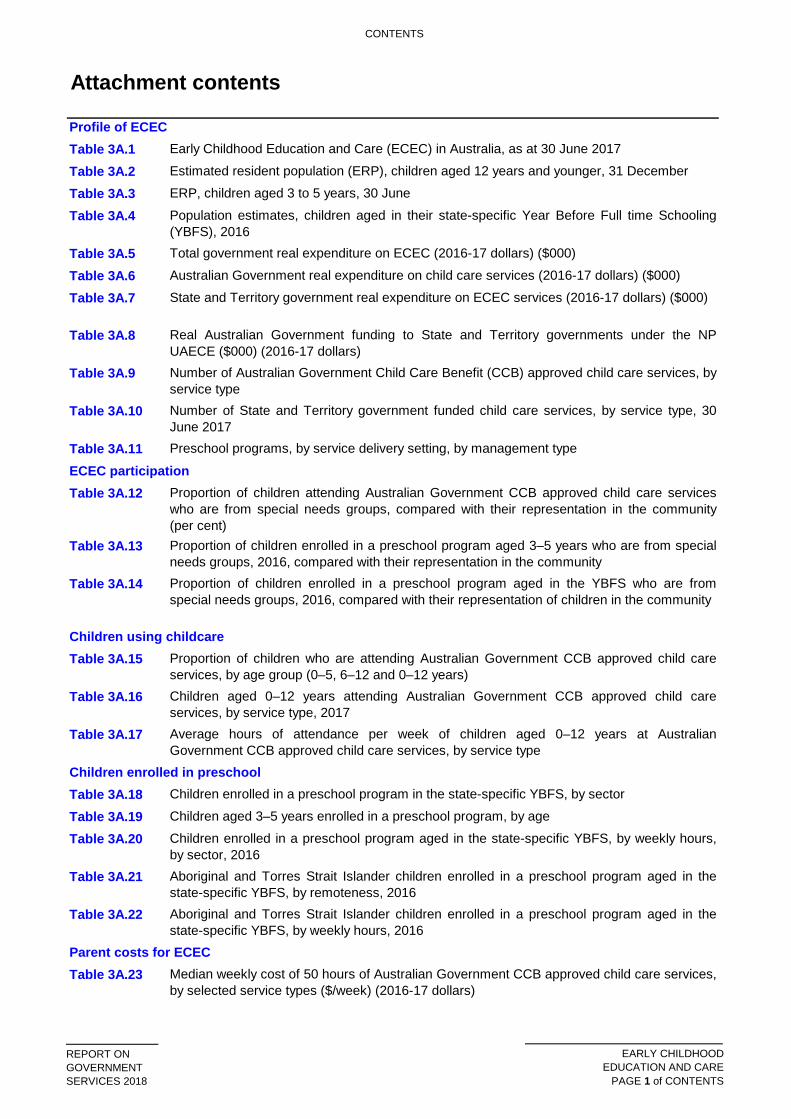
CONTENTS
REPORT ONGOVERNMENTSERVICES 2018
EARLY CHILDHOODEDUCATION AND CARE
PAGE 1 of CONTENTS
Attachment contents
Profile of ECECTable 3A.1 Early Childhood Education and Care (ECEC) in Australia, as at 30 June 2017
Table 3A.2 Estimated resident population (ERP), children aged 12 years and younger, 31 December
Table 3A.3 ERP, children aged 3 to 5 years, 30 June
Table 3A.4 Population estimates, children aged in their state-specific Year Before Full time Schooling(YBFS), 2016
Table 3A.5 Total government real expenditure on ECEC (2016-17 dollars) ($000)
Table 3A.6 Australian Government real expenditure on child care services (2016-17 dollars) ($000)
Table 3A.7 State and Territory government real expenditure on ECEC services (2016-17 dollars) ($000)
Table 3A.8 Real Australian Government funding to State and Territory governments under the NPUAECE ($000) (2016-17 dollars)
Table 3A.9 Number of Australian Government Child Care Benefit (CCB) approved child care services, byservice type
Table 3A.10 Number of State and Territory government funded child care services, by service type, 30June 2017
Table 3A.11 Preschool programs, by service delivery setting, by management type
ECEC participationTable 3A.12 Proportion of children attending Australian Government CCB approved child care services
who are from special needs groups, compared with their representation in the community(per cent)
Table 3A.13 Proportion of children enrolled in a preschool program aged 3–5 years who are from specialneeds groups, 2016, compared with their representation in the community
Table 3A.14 Proportion of children enrolled in a preschool program aged in the YBFS who are fromspecial needs groups, 2016, compared with their representation of children in the community
Children using childcareTable 3A.15 Proportion of children who are attending Australian Government CCB approved child care
services, by age group (0–5, 6–12 and 0–12 years) Table 3A.16 Children aged 0–12 years attending Australian Government CCB approved child care
services, by service type, 2017 Table 3A.17 Average hours of attendance per week of children aged 0–12 years at Australian
Government CCB approved child care services, by service type Children enrolled in preschoolTable 3A.18 Children enrolled in a preschool program in the state-specific YBFS, by sector
Table 3A.19 Children aged 3–5 years enrolled in a preschool program, by age
Table 3A.20 Children enrolled in a preschool program aged in the state-specific YBFS, by weekly hours,by sector, 2016
Table 3A.21 Aboriginal and Torres Strait Islander children enrolled in a preschool program aged in thestate-specific YBFS, by remoteness, 2016
Table 3A.22 Aboriginal and Torres Strait Islander children enrolled in a preschool program aged in thestate-specific YBFS, by weekly hours, 2016
Parent costs for ECECTable 3A.23 Median weekly cost of 50 hours of Australian Government CCB approved child care services,
by selected service types ($/week) (2016-17 dollars)
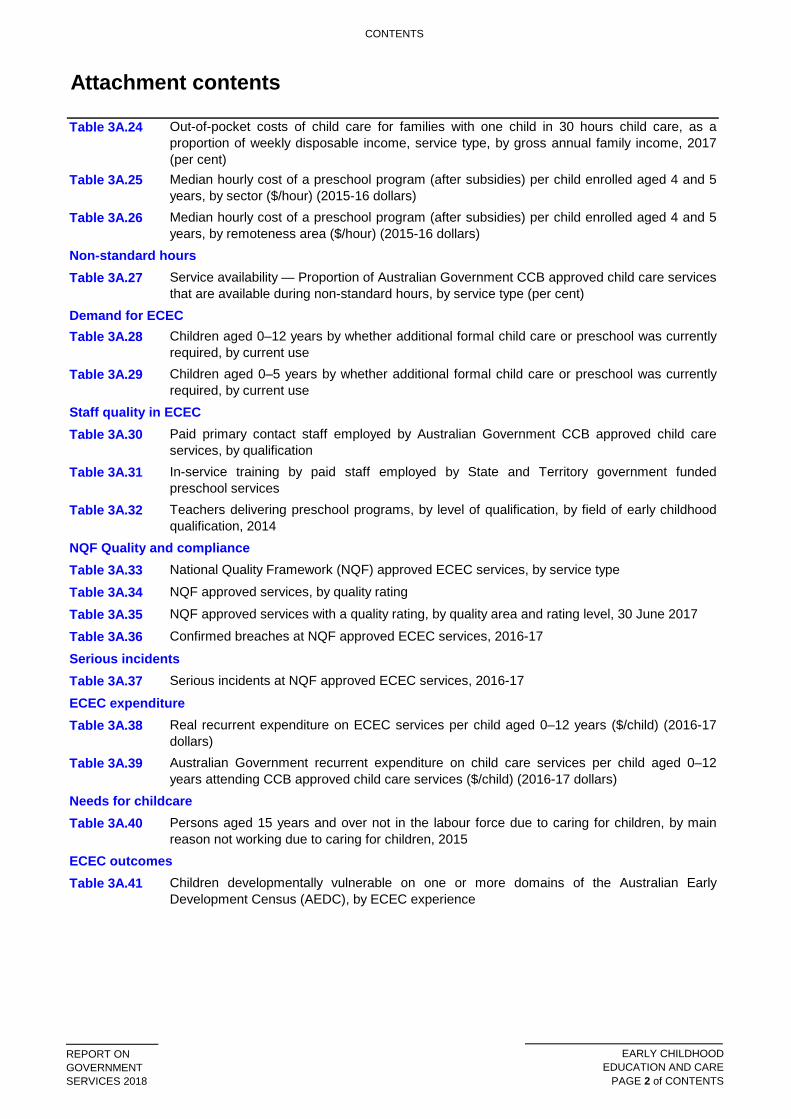
CONTENTS
REPORT ONGOVERNMENTSERVICES 2018
EARLY CHILDHOODEDUCATION AND CARE
PAGE 2 of CONTENTS
Attachment contents
Table 3A.24 Out-of-pocket costs of child care for families with one child in 30 hours child care, as aproportion of weekly disposable income, service type, by gross annual family income, 2017(per cent)
Table 3A.25 Median hourly cost of a preschool program (after subsidies) per child enrolled aged 4 and 5years, by sector ($/hour) (2015-16 dollars)
Table 3A.26 Median hourly cost of a preschool program (after subsidies) per child enrolled aged 4 and 5years, by remoteness area ($/hour) (2015-16 dollars)
Non-standard hoursTable 3A.27 Service availability — Proportion of Australian Government CCB approved child care services
that are available during non-standard hours, by service type (per cent) Demand for ECECTable 3A.28 Children aged 0–12 years by whether additional formal child care or preschool was currently
required, by current use Table 3A.29 Children aged 0–5 years by whether additional formal child care or preschool was currently
required, by current use Staff quality in ECECTable 3A.30 Paid primary contact staff employed by Australian Government CCB approved child care
services, by qualification Table 3A.31 In-service training by paid staff employed by State and Territory government funded
preschool services Table 3A.32 Teachers delivering preschool programs, by level of qualification, by field of early childhood
qualification, 2014 NQF Quality and complianceTable 3A.33 National Quality Framework (NQF) approved ECEC services, by service type
Table 3A.34 NQF approved services, by quality rating
Table 3A.35 NQF approved services with a quality rating, by quality area and rating level, 30 June 2017
Table 3A.36 Confirmed breaches at NQF approved ECEC services, 2016-17
Serious incidentsTable 3A.37 Serious incidents at NQF approved ECEC services, 2016-17
ECEC expenditureTable 3A.38 Real recurrent expenditure on ECEC services per child aged 0–12 years ($/child) (2016-17
dollars) Table 3A.39 Australian Government recurrent expenditure on child care services per child aged 0–12
years attending CCB approved child care services ($/child) (2016-17 dollars) Needs for childcareTable 3A.40 Persons aged 15 years and over not in the labour force due to caring for children, by main
reason not working due to caring for children, 2015 ECEC outcomesTable 3A.41 Children developmentally vulnerable on one or more domains of the Australian Early
Development Census (AEDC), by ECEC experience
PROFILE OF ECEC
REPORT ONGOVERNMENTSERVICES 2018
EARLY CHILDHOODEDUCATION AND CARE
PAGE 1 of PROFILE OF ECEC
Profile of ECEC
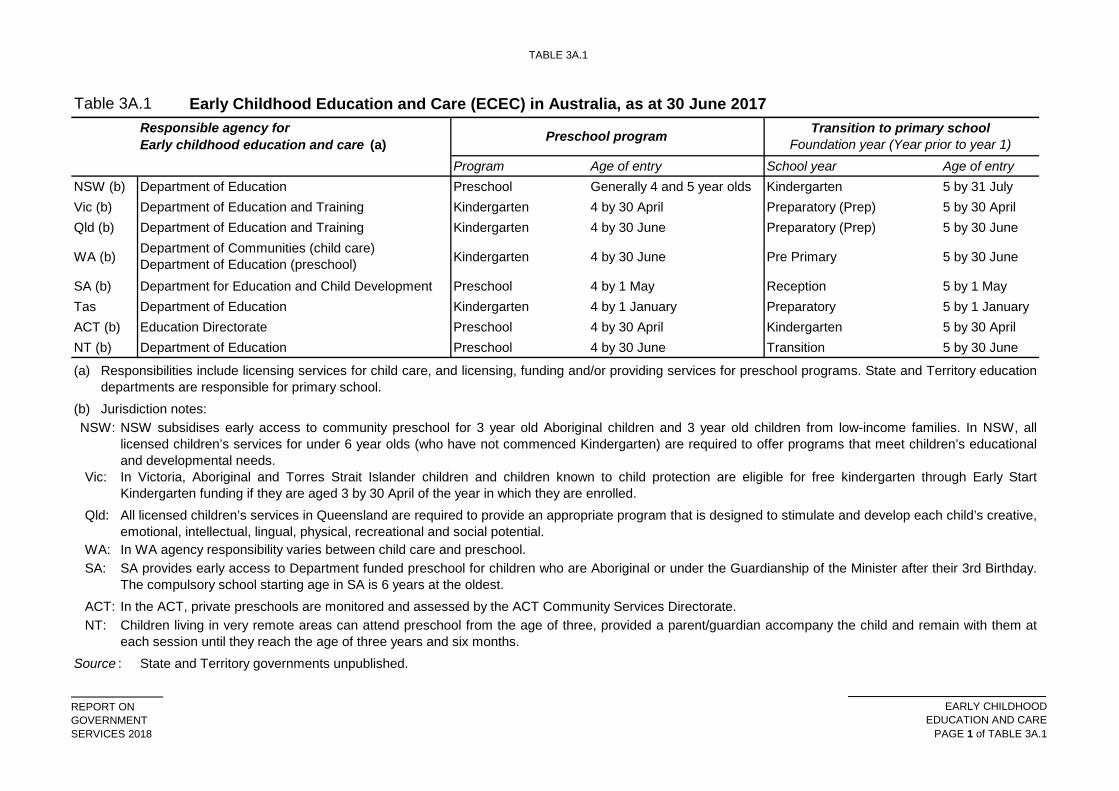
TABLE 3A.1
REPORT ONGOVERNMENTSERVICES 2018
EARLY CHILDHOODEDUCATION AND CARE
PAGE 1 of TABLE 3A.1
Table 3A.1
Program Age of entry School year Age of entryNSW (b) Department of Education Preschool Generally 4 and 5 year olds Kindergarten 5 by 31 JulyVic (b) Department of Education and Training Kindergarten 4 by 30 April Preparatory (Prep) 5 by 30 AprilQld (b) Department of Education and Training Kindergarten 4 by 30 June Preparatory (Prep) 5 by 30 June
WA (b) Kindergarten 4 by 30 June Pre Primary 5 by 30 June
SA (b) Department for Education and Child Development Preschool 4 by 1 May Reception 5 by 1 MayTas Department of Education Kindergarten 4 by 1 January Preparatory 5 by 1 JanuaryACT (b) Education Directorate Preschool 4 by 30 April Kindergarten 5 by 30 AprilNT (b) Department of Education Preschool 4 by 30 June Transition 5 by 30 June
(a)
(b) Jurisdiction notes:NSW:
Vic:
Qld:
WA:SA:
ACT:NT:
Source :
Responsibilities include licensing services for child care, and licensing, funding and/or providing services for preschool programs. State and Territory educationdepartments are responsible for primary school.
Department of Communities (child care)Department of Education (preschool)
SA provides early access to Department funded preschool for children who are Aboriginal or under the Guardianship of the Minister after their 3rd Birthday.The compulsory school starting age in SA is 6 years at the oldest. In the ACT, private preschools are monitored and assessed by the ACT Community Services Directorate. Children living in very remote areas can attend preschool from the age of three, provided a parent/guardian accompany the child and remain with them ateach session until they reach the age of three years and six months.
Early Childhood Education and Care (ECEC) in Australia, as at 30 June 2017
State and Territory governments unpublished.
Transition to primary schoolFoundation year (Year prior to year 1)Preschool programResponsible agency for
Early childhood education and care (a)
NSW subsidises early access to community preschool for 3 year old Aboriginal children and 3 year old children from low-income families. In NSW, alllicensed children’s services for under 6 year olds (who have not commenced Kindergarten) are required to offer programs that meet children’s educationaland developmental needs. In Victoria, Aboriginal and Torres Strait Islander children and children known to child protection are eligible for free kindergarten through Early StartKindergarten funding if they are aged 3 by 30 April of the year in which they are enrolled.All licensed children’s services in Queensland are required to provide an appropriate program that is designed to stimulate and develop each child’s creative,emotional, intellectual, lingual, physical, recreational and social potential.In WA agency responsibility varies between child care and preschool.
TABLE 3A.2
REPORT ONGOVERNMENTSERVICES 2018
EARLY CHILDHOODEDUCATION AND CARE
PAGE 1 of TABLE 3A.2
Table 3A.2NSW Vic Qld WA SA Tas ACT NT Aust (b)
2016Aged 0 to 5 years
0 years 95 617 78 477 61 012 34 908 20 075 5 827 5 197 3 891 305 0501 year 100 150 81 581 62 613 34 909 20 420 5 971 5 719 3 937 315 3532 years 99 350 80 139 63 192 34 294 20 313 5 948 5 623 3 765 312 6803 years 100 574 80 806 64 349 34 344 20 644 6 056 5 605 3 729 316 1664 years 101 605 80 994 65 175 34 282 20 978 6 143 5 596 3 820 318 6515 years 101 244 79 492 65 558 34 271 20 896 6 293 5 510 3 804 317 127Total 0 to 5 years 598 540 481 489 381 899 207 008 123 326 36 238 33 250 22 946 1 885 027
Aged 6 to 12 years 680 878 530 014 456 627 231 499 142 782 45 152 34 903 24 319 2 146 568Aged 0 to 12 years 1 279 418 1 011 503 838 526 438 507 266 108 81 390 68 153 47 265 4 031 595
2015Aged 0 to 5 years 590 961 455 430 382 444 208 278 121 433 36 676 32 634 22 556 1 850 602Aged 6 to 12 years 662 907 503 623 443 689 230 344 139 140 44 568 33 133 24 539 2 082 166Aged 0 to 12 years 1 253 868 959 053 826 133 438 622 260 573 81 244 65 767 47 095 3 932 768
2014Aged 0 to 5 years 582 679 449 176 381 930 206 255 121 278 37 208 32 168 22 678 1 833 556Aged 6 to 12 years 651 480 491 838 436 123 226 107 137 640 44 266 32 117 24 454 2 044 255Aged 0 to 12 years 1 234 159 941 014 818 053 432 362 258 918 81 474 64 285 47 132 3 877 811
2013Aged 0 to 5 years 585 661 443 387 380 195 203 427 120 250 37 701 31 310 22 695 1 824 811Aged 6 to 12 years 640 750 481 432 428 873 221 307 136 163 43 986 31 468 24 502 2 008 720Aged 0 to 12 years 1 226 411 924 819 809 068 424 734 256 413 81 687 62 778 47 197 3 833 531
2012Aged 0 to 5 years 571 439 435 260 374 414 197 761 119 270 37 903 30 333 22 368 1 788 933Aged 6 to 12 years 632 130 471 660 421 478 214 759 134 995 43 855 30 850 24 402 1 974 379
Estimated resident population (ERP), children aged 12 years and younger, 31 December (a)
TABLE 3A.2
REPORT ONGOVERNMENTSERVICES 2018
EARLY CHILDHOODEDUCATION AND CARE
PAGE 2 of TABLE 3A.2
Table 3A.2NSW Vic Qld WA SA Tas ACT NT Aust (b)
Estimated resident population (ERP), children aged 12 years and younger, 31 December (a)
Aged 0 to 12 years 1 203 569 906 920 795 892 412 520 254 265 81 758 61 183 46 770 3 763 3122011
Aged 0 to 5 years 567 122 423 973 368 341 190 225 117 564 38 238 29 111 22 083 1 756 831Aged 6 to 12 years 625 221 463 822 412 712 208 663 134 307 44 148 30 091 24 135 1 943 358Aged 0 to 12 years 1 192 343 887 795 781 053 398 888 251 871 82 386 59 202 46 218 3 700 189
2010Aged 0 to 5 years 565 040 418 542 362 943 184 238 116 416 38 481 28 440 22 104 1 736 377Aged 6 to 12 years 619 437 457 642 404 990 203 837 133 974 44 420 29 453 23 921 1 917 936Aged 0 to 12 years 1 184 477 876 184 767 933 388 075 250 390 82 901 57 893 46 025 3 654 313
2009Aged 0 to 5 years 559 035 411 742 358 576 179 733 115 114 38 641 27 768 22 124 1 712 908Aged 6 to 12 years 616 648 454 609 400 508 201 047 134 004 44 623 29 226 24 008 1 904 946Aged 0 to 12 years 1 175 683 866 351 759 084 380 780 249 118 83 264 56 994 46 132 3 617 854
2008Aged 0 to 5 years 548 146 401 792 348 709 173 956 112 829 38 179 26 865 21 831 1 672 487Aged 6 to 12 years 615 467 452 624 396 782 199 125 134 440 45 075 29 042 23 863 1 896 694Aged 0 to 12 years 1 163 613 854 416 745 491 373 081 247 269 83 254 55 907 45 694 3 569 181
2007Aged 0 to 5 years 534 768 390 590 334 376 165 863 110 580 37 353 26 025 21 581 1 621 324Aged 6 to 12 years 615 968 451 987 392 287 196 272 135 393 45 496 29 140 23 655 1 890 480Aged 0 to 12 years 1 150 736 842 577 726 663 362 135 245 973 82 849 55 165 45 236 3 511 804
(a)
(b)Source :
Australian Bureau of Statistics (ABS) ERP at 31 December, based on: the 2011 Census of Population and Housing , for 2007 to 2015; and. the 2016 Census ofPopulation and Housing , for 2016. ERP from 31 December 2011 are first preliminary.Includes other territories. The December 2016 ERP also includes Norfolk Island in the Australian total (in addition to the other territories).
ABS 2017, table generated 24 June 2017 using Quarterly Population Estimates (ERP), by State/Territory, Sex and Age , Cat. no. 1407.0, ABS.Stat Beta;ABS (unpublished) Australian Demographic Statistics , Cat. no. 3101.0 [data available on request].
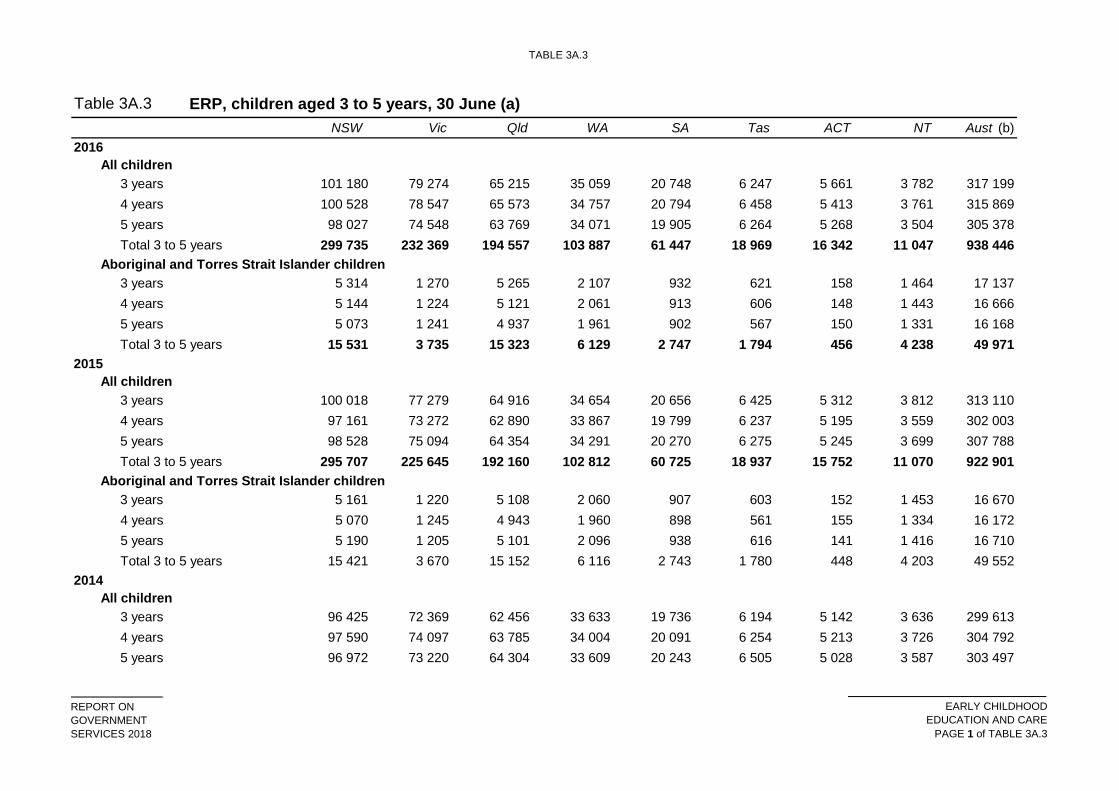
TABLE 3A.3
REPORT ONGOVERNMENTSERVICES 2018
EARLY CHILDHOODEDUCATION AND CARE
PAGE 1 of TABLE 3A.3
Table 3A.3NSW Vic Qld WA SA Tas ACT NT Aust (b)
2016All children
3 years 101 180 79 274 65 215 35 059 20 748 6 247 5 661 3 782 317 1994 years 100 528 78 547 65 573 34 757 20 794 6 458 5 413 3 761 315 8695 years 98 027 74 548 63 769 34 071 19 905 6 264 5 268 3 504 305 378Total 3 to 5 years 299 735 232 369 194 557 103 887 61 447 18 969 16 342 11 047 938 446
Aboriginal and Torres Strait Islander children3 years 5 314 1 270 5 265 2 107 932 621 158 1 464 17 1374 years 5 144 1 224 5 121 2 061 913 606 148 1 443 16 6665 years 5 073 1 241 4 937 1 961 902 567 150 1 331 16 168Total 3 to 5 years 15 531 3 735 15 323 6 129 2 747 1 794 456 4 238 49 971
2015All children
3 years 100 018 77 279 64 916 34 654 20 656 6 425 5 312 3 812 313 1104 years 97 161 73 272 62 890 33 867 19 799 6 237 5 195 3 559 302 0035 years 98 528 75 094 64 354 34 291 20 270 6 275 5 245 3 699 307 788Total 3 to 5 years 295 707 225 645 192 160 102 812 60 725 18 937 15 752 11 070 922 901
Aboriginal and Torres Strait Islander children3 years 5 161 1 220 5 108 2 060 907 603 152 1 453 16 6704 years 5 070 1 245 4 943 1 960 898 561 155 1 334 16 1725 years 5 190 1 205 5 101 2 096 938 616 141 1 416 16 710Total 3 to 5 years 15 421 3 670 15 152 6 116 2 743 1 780 448 4 203 49 552
2014All children
3 years 96 425 72 369 62 456 33 633 19 736 6 194 5 142 3 636 299 6134 years 97 590 74 097 63 785 34 004 20 091 6 254 5 213 3 726 304 7925 years 96 972 73 220 64 304 33 609 20 243 6 505 5 028 3 587 303 497
ERP, children aged 3 to 5 years, 30 June (a)
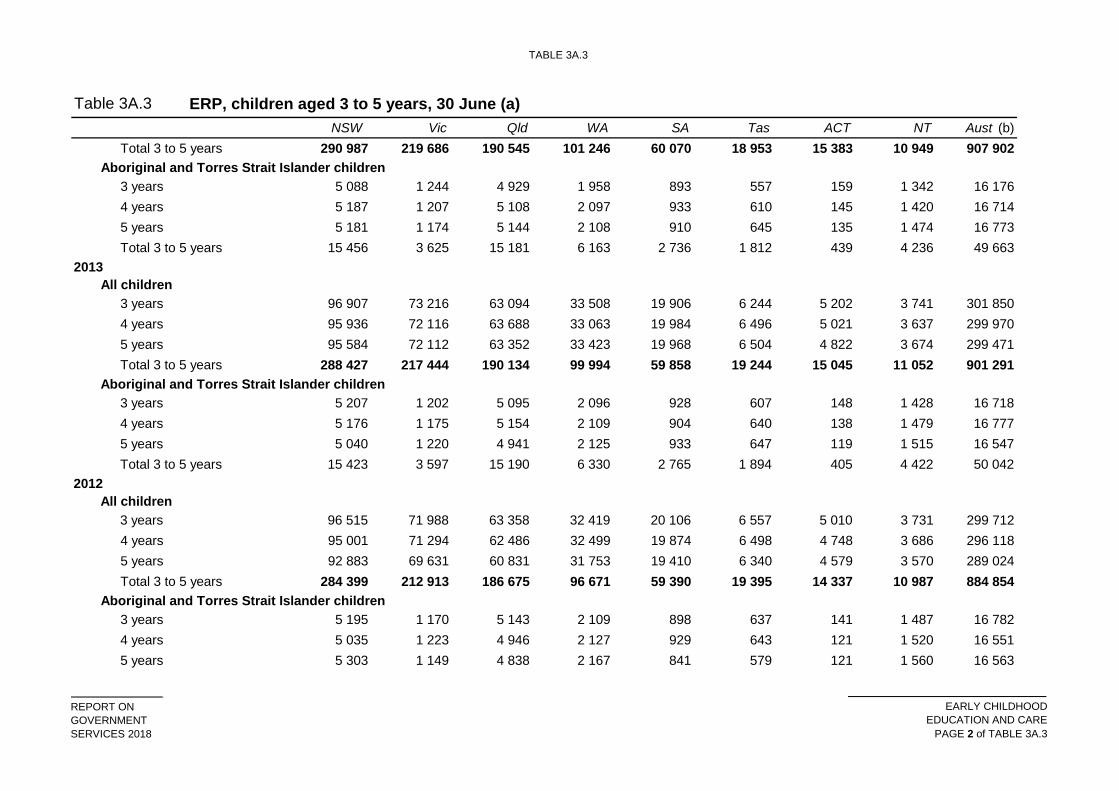
TABLE 3A.3
REPORT ONGOVERNMENTSERVICES 2018
EARLY CHILDHOODEDUCATION AND CARE
PAGE 2 of TABLE 3A.3
Table 3A.3NSW Vic Qld WA SA Tas ACT NT Aust (b)
ERP, children aged 3 to 5 years, 30 June (a)
Total 3 to 5 years 290 987 219 686 190 545 101 246 60 070 18 953 15 383 10 949 907 902Aboriginal and Torres Strait Islander children
3 years 5 088 1 244 4 929 1 958 893 557 159 1 342 16 1764 years 5 187 1 207 5 108 2 097 933 610 145 1 420 16 7145 years 5 181 1 174 5 144 2 108 910 645 135 1 474 16 773Total 3 to 5 years 15 456 3 625 15 181 6 163 2 736 1 812 439 4 236 49 663
2013All children
3 years 96 907 73 216 63 094 33 508 19 906 6 244 5 202 3 741 301 8504 years 95 936 72 116 63 688 33 063 19 984 6 496 5 021 3 637 299 9705 years 95 584 72 112 63 352 33 423 19 968 6 504 4 822 3 674 299 471Total 3 to 5 years 288 427 217 444 190 134 99 994 59 858 19 244 15 045 11 052 901 291
Aboriginal and Torres Strait Islander children3 years 5 207 1 202 5 095 2 096 928 607 148 1 428 16 7184 years 5 176 1 175 5 154 2 109 904 640 138 1 479 16 7775 years 5 040 1 220 4 941 2 125 933 647 119 1 515 16 547Total 3 to 5 years 15 423 3 597 15 190 6 330 2 765 1 894 405 4 422 50 042
2012All children
3 years 96 515 71 988 63 358 32 419 20 106 6 557 5 010 3 731 299 7124 years 95 001 71 294 62 486 32 499 19 874 6 498 4 748 3 686 296 1185 years 92 883 69 631 60 831 31 753 19 410 6 340 4 579 3 570 289 024Total 3 to 5 years 284 399 212 913 186 675 96 671 59 390 19 395 14 337 10 987 884 854
Aboriginal and Torres Strait Islander children3 years 5 195 1 170 5 143 2 109 898 637 141 1 487 16 7824 years 5 035 1 223 4 946 2 127 929 643 121 1 520 16 5515 years 5 303 1 149 4 838 2 167 841 579 121 1 560 16 563
TABLE 3A.3
REPORT ONGOVERNMENTSERVICES 2018
EARLY CHILDHOODEDUCATION AND CARE
PAGE 3 of TABLE 3A.3
Table 3A.3NSW Vic Qld WA SA Tas ACT NT Aust (b)
ERP, children aged 3 to 5 years, 30 June (a)
Total 3 to 5 years 15 533 3 542 14 927 6 403 2 668 1 859 383 4 567 49 896
(a)(b)Source :
ABS ERP data at 30 June based on the 2011 Census of Population and Housing . Estimates are first preliminary.Includes other territories (not including Norfolk Island).
ABS 2016, Australian Demographic Statistics, June 2016 , Cat. no. 3101.0; ABS 2014, Estimates and Projections, Aboriginal and Torres StraitIslander Australians, 2011 to 2026 , Cat. no. 3238.0.
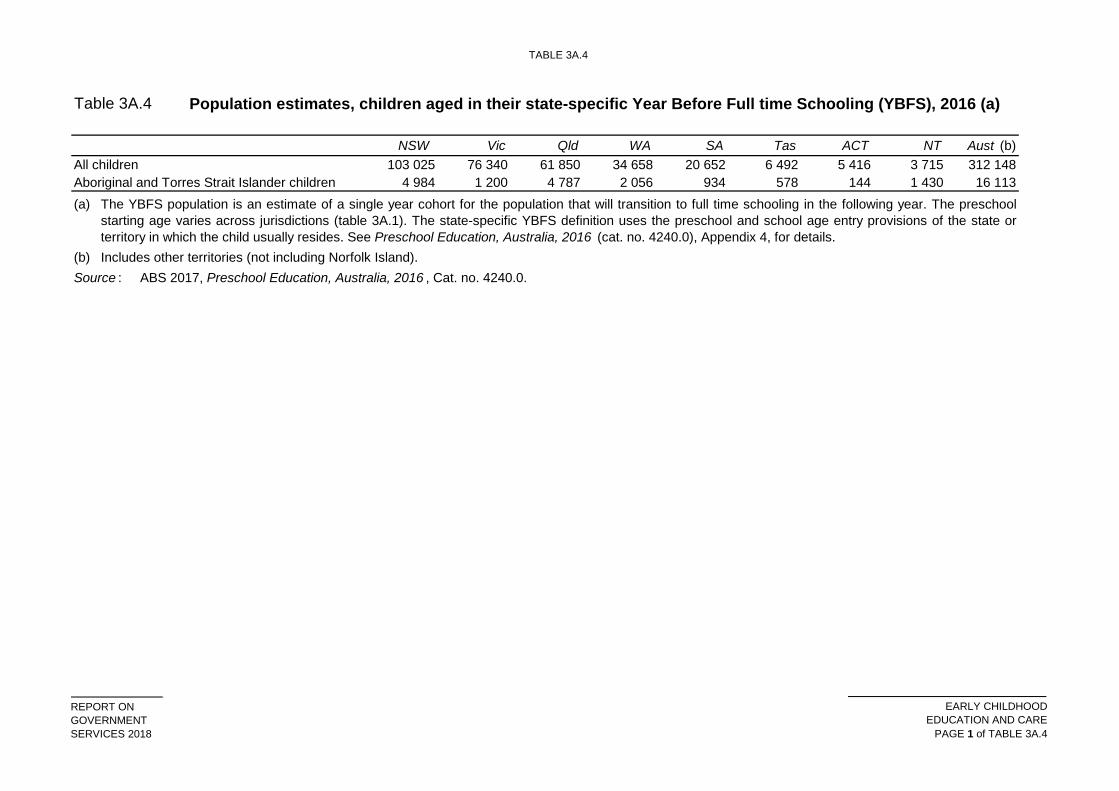
TABLE 3A.4
REPORT ONGOVERNMENTSERVICES 2018
EARLY CHILDHOODEDUCATION AND CARE
PAGE 1 of TABLE 3A.4
Table 3A.4
NSW Vic Qld WA SA Tas ACT NT Aust (b)All children 103 025 76 340 61 850 34 658 20 652 6 492 5 416 3 715 312 148Aboriginal and Torres Strait Islander children 4 984 1 200 4 787 2 056 934 578 144 1 430 16 113(a)
(b)Source : ABS 2017, Preschool Education, Australia, 2016 , Cat. no. 4240.0.
Population estimates, children aged in their state-specific Year Before Full time Schooling (YBFS), 2016 (a)
Includes other territories (not including Norfolk Island).
The YBFS population is an estimate of a single year cohort for the population that will transition to full time schooling in the following year. The preschoolstarting age varies across jurisdictions (table 3A.1). The state-specific YBFS definition uses the preschool and school age entry provisions of the state orterritory in which the child usually resides. See Preschool Education, Australia, 2016 (cat. no. 4240.0), Appendix 4, for details.
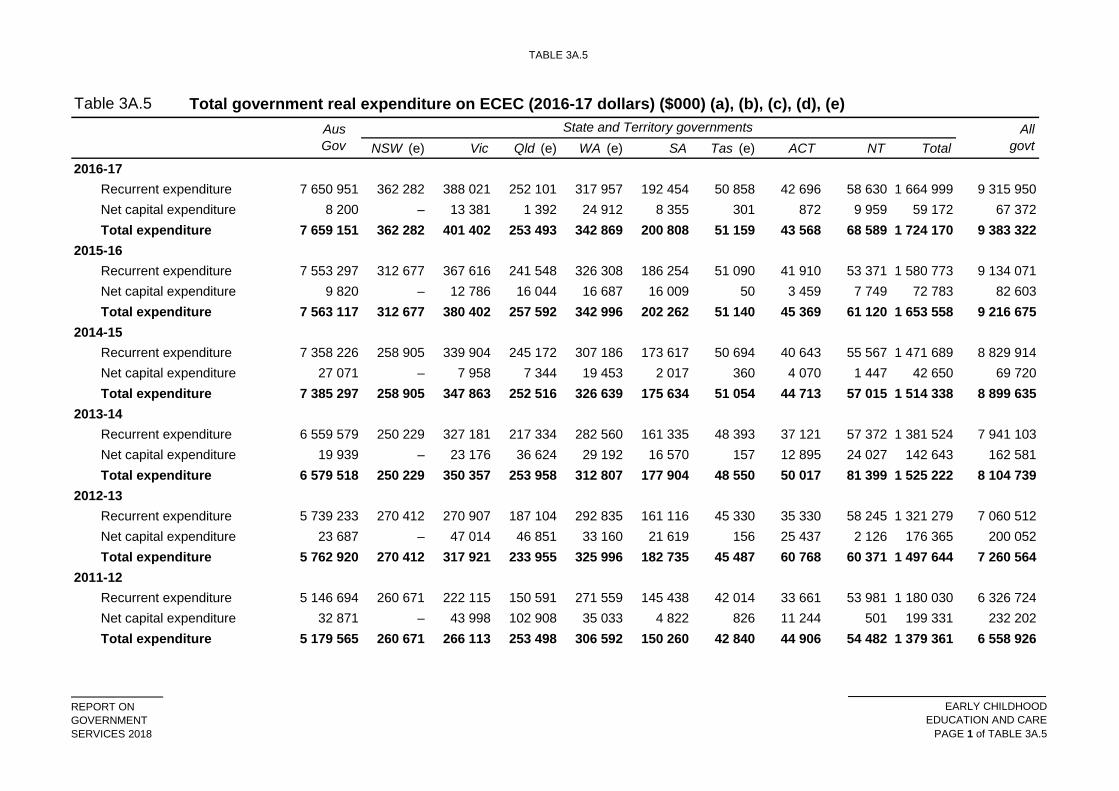
TABLE 3A.5
REPORT ONGOVERNMENTSERVICES 2018
EARLY CHILDHOODEDUCATION AND CARE
PAGE 1 of TABLE 3A.5
Table 3A.5
NSW (e) Vic Qld (e) WA (e) SA Tas (e) ACT NT Total2016-17
Recurrent expenditure 7 650 951 362 282 388 021 252 101 317 957 192 454 50 858 42 696 58 630 1 664 999 9 315 950Net capital expenditure 8 200 – 13 381 1 392 24 912 8 355 301 872 9 959 59 172 67 372Total expenditure 7 659 151 362 282 401 402 253 493 342 869 200 808 51 159 43 568 68 589 1 724 170 9 383 322
2015-16Recurrent expenditure 7 553 297 312 677 367 616 241 548 326 308 186 254 51 090 41 910 53 371 1 580 773 9 134 071Net capital expenditure 9 820 – 12 786 16 044 16 687 16 009 50 3 459 7 749 72 783 82 603Total expenditure 7 563 117 312 677 380 402 257 592 342 996 202 262 51 140 45 369 61 120 1 653 558 9 216 675
2014-15Recurrent expenditure 7 358 226 258 905 339 904 245 172 307 186 173 617 50 694 40 643 55 567 1 471 689 8 829 914Net capital expenditure 27 071 – 7 958 7 344 19 453 2 017 360 4 070 1 447 42 650 69 720Total expenditure 7 385 297 258 905 347 863 252 516 326 639 175 634 51 054 44 713 57 015 1 514 338 8 899 635
2013-14Recurrent expenditure 6 559 579 250 229 327 181 217 334 282 560 161 335 48 393 37 121 57 372 1 381 524 7 941 103Net capital expenditure 19 939 – 23 176 36 624 29 192 16 570 157 12 895 24 027 142 643 162 581Total expenditure 6 579 518 250 229 350 357 253 958 312 807 177 904 48 550 50 017 81 399 1 525 222 8 104 739
2012-13Recurrent expenditure 5 739 233 270 412 270 907 187 104 292 835 161 116 45 330 35 330 58 245 1 321 279 7 060 512Net capital expenditure 23 687 – 47 014 46 851 33 160 21 619 156 25 437 2 126 176 365 200 052Total expenditure 5 762 920 270 412 317 921 233 955 325 996 182 735 45 487 60 768 60 371 1 497 644 7 260 564
2011-12Recurrent expenditure 5 146 694 260 671 222 115 150 591 271 559 145 438 42 014 33 661 53 981 1 180 030 6 326 724Net capital expenditure 32 871 – 43 998 102 908 35 033 4 822 826 11 244 501 199 331 232 202Total expenditure 5 179 565 260 671 266 113 253 498 306 592 150 260 42 840 44 906 54 482 1 379 361 6 558 926
Total government real expenditure on ECEC (2016-17 dollars) ($000) (a), (b), (c), (d), (e)AusGov
State and Territory governments Allgovt
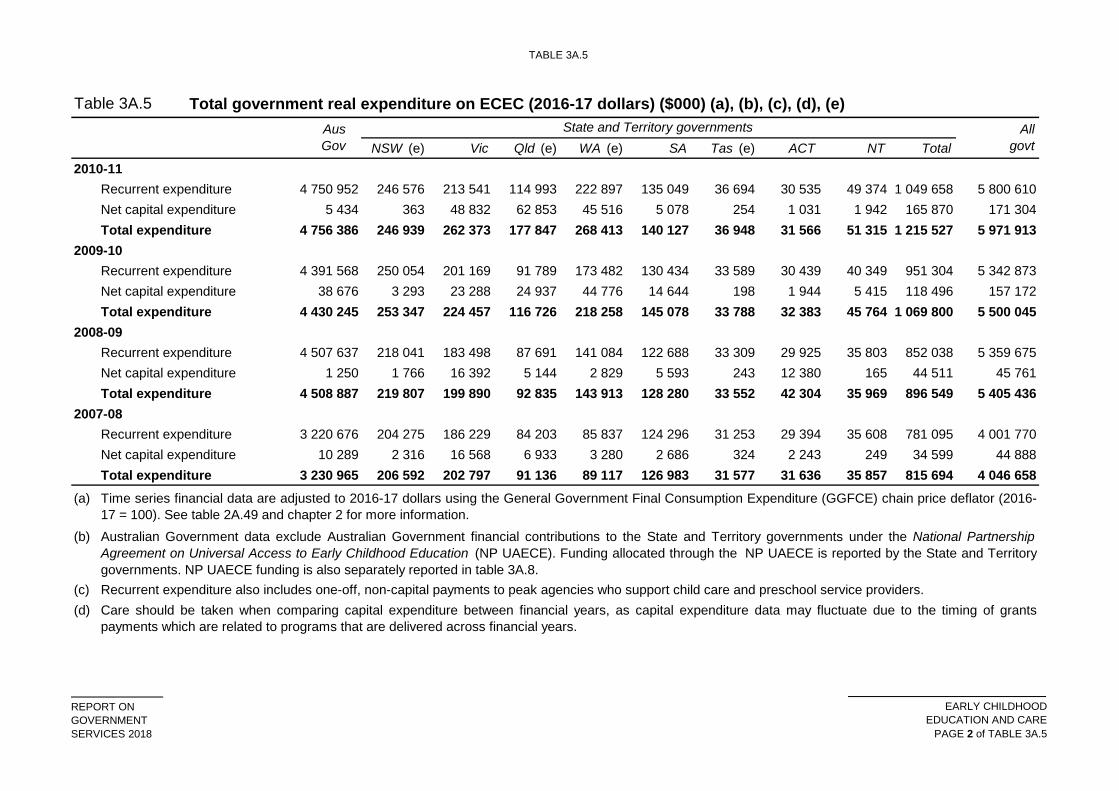
TABLE 3A.5
REPORT ONGOVERNMENTSERVICES 2018
EARLY CHILDHOODEDUCATION AND CARE
PAGE 2 of TABLE 3A.5
Table 3A.5
NSW (e) Vic Qld (e) WA (e) SA Tas (e) ACT NT Total
Total government real expenditure on ECEC (2016-17 dollars) ($000) (a), (b), (c), (d), (e)AusGov
State and Territory governments Allgovt
2010-11Recurrent expenditure 4 750 952 246 576 213 541 114 993 222 897 135 049 36 694 30 535 49 374 1 049 658 5 800 610Net capital expenditure 5 434 363 48 832 62 853 45 516 5 078 254 1 031 1 942 165 870 171 304Total expenditure 4 756 386 246 939 262 373 177 847 268 413 140 127 36 948 31 566 51 315 1 215 527 5 971 913
2009-10Recurrent expenditure 4 391 568 250 054 201 169 91 789 173 482 130 434 33 589 30 439 40 349 951 304 5 342 873Net capital expenditure 38 676 3 293 23 288 24 937 44 776 14 644 198 1 944 5 415 118 496 157 172Total expenditure 4 430 245 253 347 224 457 116 726 218 258 145 078 33 788 32 383 45 764 1 069 800 5 500 045
2008-09Recurrent expenditure 4 507 637 218 041 183 498 87 691 141 084 122 688 33 309 29 925 35 803 852 038 5 359 675Net capital expenditure 1 250 1 766 16 392 5 144 2 829 5 593 243 12 380 165 44 511 45 761Total expenditure 4 508 887 219 807 199 890 92 835 143 913 128 280 33 552 42 304 35 969 896 549 5 405 436
2007-08Recurrent expenditure 3 220 676 204 275 186 229 84 203 85 837 124 296 31 253 29 394 35 608 781 095 4 001 770Net capital expenditure 10 289 2 316 16 568 6 933 3 280 2 686 324 2 243 249 34 599 44 888Total expenditure 3 230 965 206 592 202 797 91 136 89 117 126 983 31 577 31 636 35 857 815 694 4 046 658
(a)
(b)
(c)(d)
Australian Government data exclude Australian Government financial contributions to the State and Territory governments under the National PartnershipAgreement on Universal Access to Early Childhood Education (NP UAECE). Funding allocated through the NP UAECE is reported by the State and Territorygovernments. NP UAECE funding is also separately reported in table 3A.8.
Time series financial data are adjusted to 2016-17 dollars using the General Government Final Consumption Expenditure (GGFCE) chain price deflator (2016-17 = 100). See table 2A.49 and chapter 2 for more information.
Recurrent expenditure also includes one-off, non-capital payments to peak agencies who support child care and preschool service providers.Care should be taken when comparing capital expenditure between financial years, as capital expenditure data may fluctuate due to the timing of grantspayments which are related to programs that are delivered across financial years.
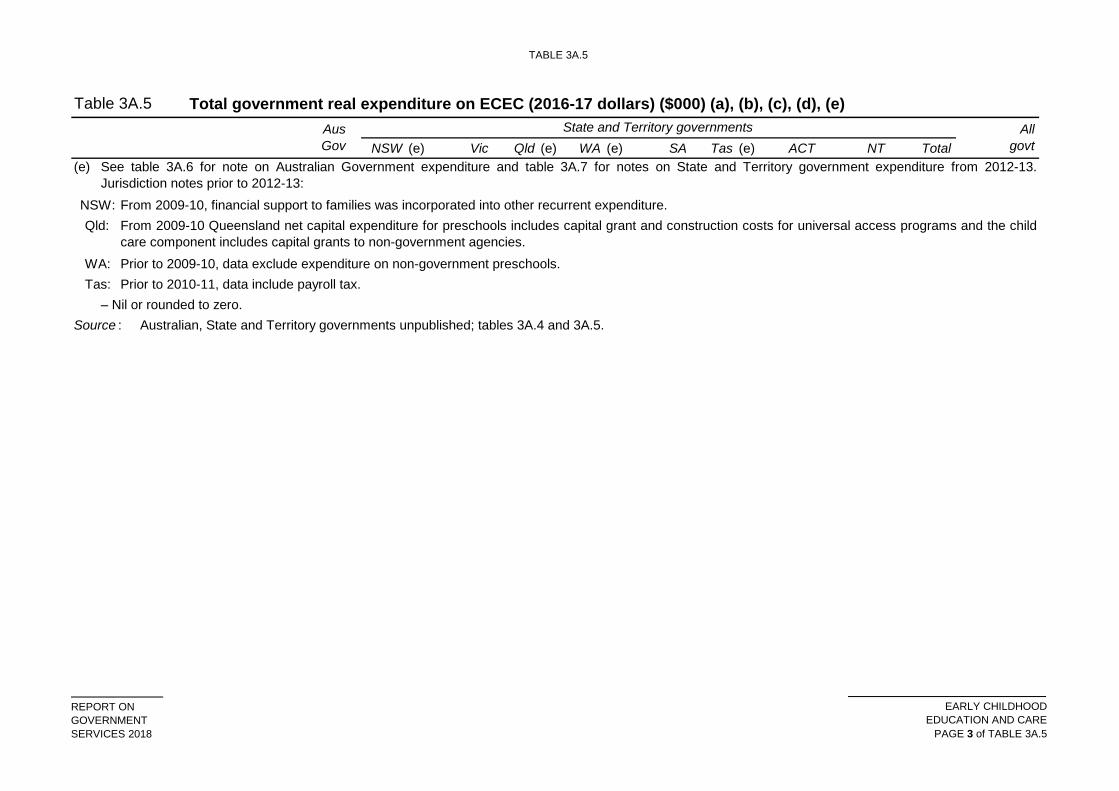
TABLE 3A.5
REPORT ONGOVERNMENTSERVICES 2018
EARLY CHILDHOODEDUCATION AND CARE
PAGE 3 of TABLE 3A.5
Table 3A.5
NSW (e) Vic Qld (e) WA (e) SA Tas (e) ACT NT Total
Total government real expenditure on ECEC (2016-17 dollars) ($000) (a), (b), (c), (d), (e)AusGov
State and Territory governments Allgovt
(e)
NSW:Qld:
WA:Tas:
– Nil or rounded to zero.Source : Australian, State and Territory governments unpublished; tables 3A.4 and 3A.5.
Prior to 2010-11, data include payroll tax.
From 2009-10, financial support to families was incorporated into other recurrent expenditure.From 2009-10 Queensland net capital expenditure for preschools includes capital grant and construction costs for universal access programs and the childcare component includes capital grants to non-government agencies. Prior to 2009-10, data exclude expenditure on non-government preschools.
See table 3A.6 for note on Australian Government expenditure and table 3A.7 for notes on State and Territory government expenditure from 2012-13.Jurisdiction notes prior to 2012-13:
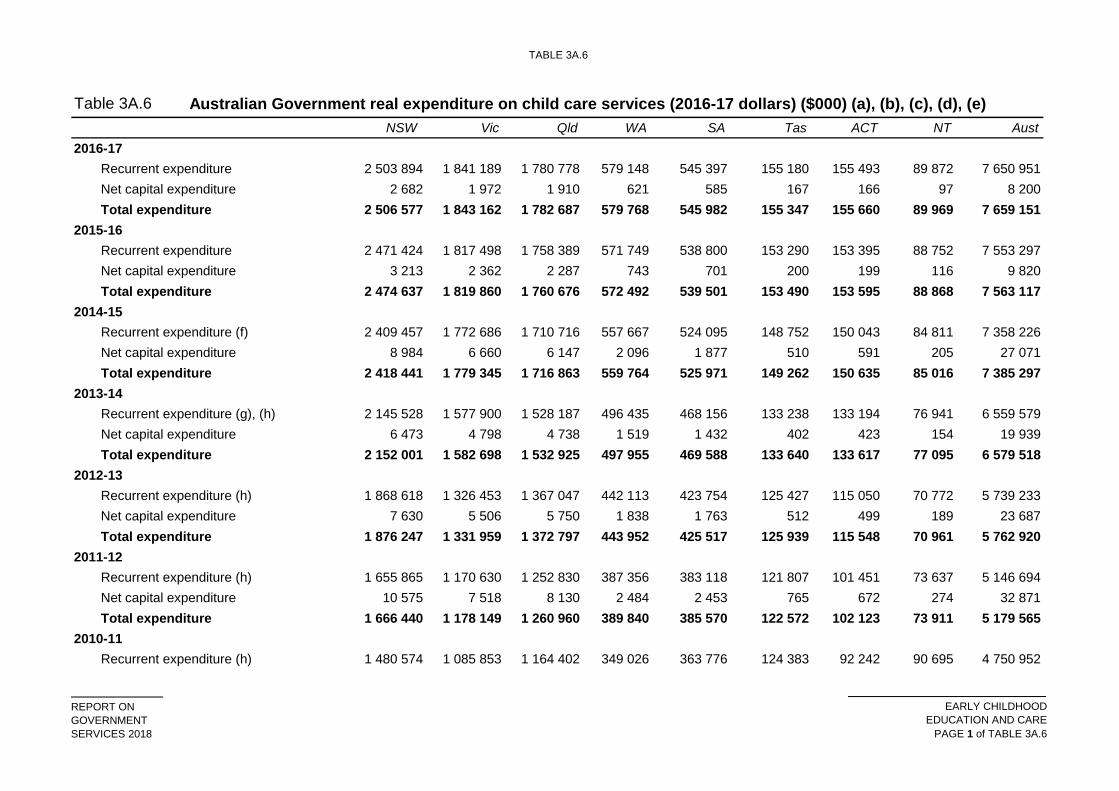
TABLE 3A.6
REPORT ONGOVERNMENTSERVICES 2018
EARLY CHILDHOODEDUCATION AND CARE
PAGE 1 of TABLE 3A.6
Table 3A.6NSW Vic Qld WA SA Tas ACT NT Aust
2016-17Recurrent expenditure 2 503 894 1 841 189 1 780 778 579 148 545 397 155 180 155 493 89 872 7 650 951Net capital expenditure 2 682 1 972 1 910 621 585 167 166 97 8 200Total expenditure 2 506 577 1 843 162 1 782 687 579 768 545 982 155 347 155 660 89 969 7 659 151
2015-16Recurrent expenditure 2 471 424 1 817 498 1 758 389 571 749 538 800 153 290 153 395 88 752 7 553 297Net capital expenditure 3 213 2 362 2 287 743 701 200 199 116 9 820Total expenditure 2 474 637 1 819 860 1 760 676 572 492 539 501 153 490 153 595 88 868 7 563 117
2014-15Recurrent expenditure (f) 2 409 457 1 772 686 1 710 716 557 667 524 095 148 752 150 043 84 811 7 358 226Net capital expenditure 8 984 6 660 6 147 2 096 1 877 510 591 205 27 071Total expenditure 2 418 441 1 779 345 1 716 863 559 764 525 971 149 262 150 635 85 016 7 385 297
2013-14Recurrent expenditure (g), (h) 2 145 528 1 577 900 1 528 187 496 435 468 156 133 238 133 194 76 941 6 559 579Net capital expenditure 6 473 4 798 4 738 1 519 1 432 402 423 154 19 939Total expenditure 2 152 001 1 582 698 1 532 925 497 955 469 588 133 640 133 617 77 095 6 579 518
2012-13Recurrent expenditure (h) 1 868 618 1 326 453 1 367 047 442 113 423 754 125 427 115 050 70 772 5 739 233Net capital expenditure 7 630 5 506 5 750 1 838 1 763 512 499 189 23 687Total expenditure 1 876 247 1 331 959 1 372 797 443 952 425 517 125 939 115 548 70 961 5 762 920
2011-12Recurrent expenditure (h) 1 655 865 1 170 630 1 252 830 387 356 383 118 121 807 101 451 73 637 5 146 694Net capital expenditure 10 575 7 518 8 130 2 484 2 453 765 672 274 32 871Total expenditure 1 666 440 1 178 149 1 260 960 389 840 385 570 122 572 102 123 73 911 5 179 565
2010-11Recurrent expenditure (h) 1 480 574 1 085 853 1 164 402 349 026 363 776 124 383 92 242 90 695 4 750 952
Australian Government real expenditure on child care services (2016-17 dollars) ($000) (a), (b), (c), (d), (e)
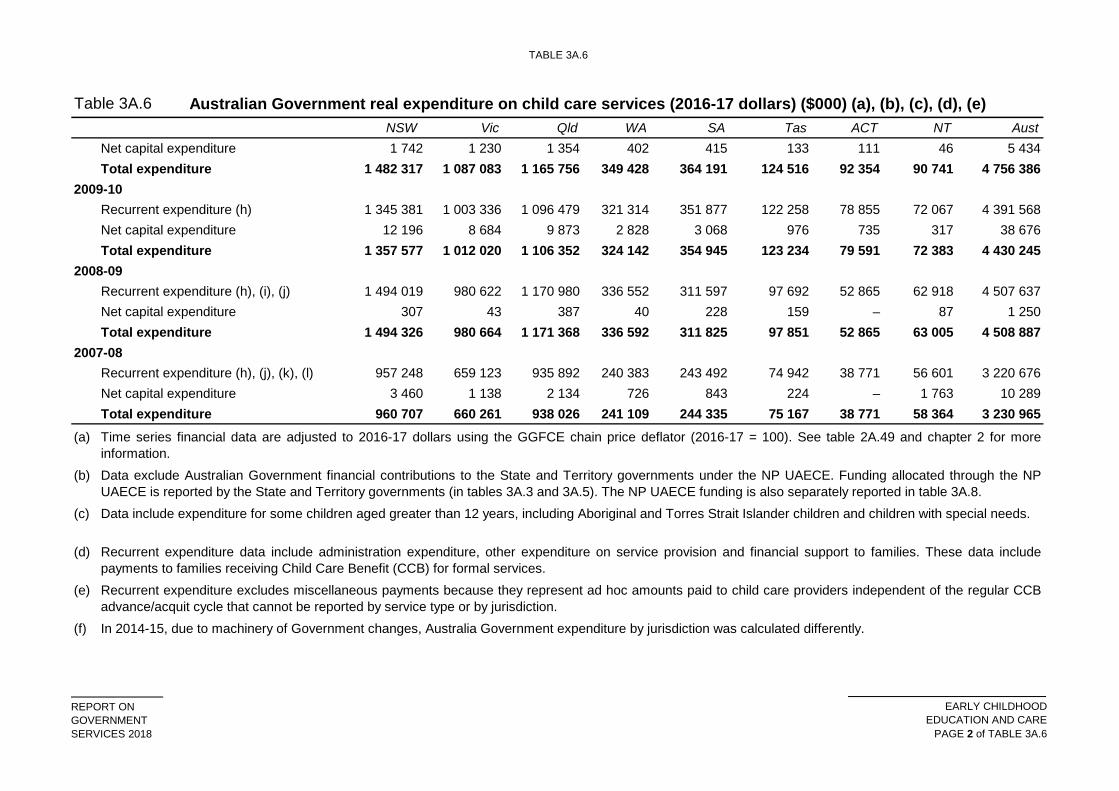
TABLE 3A.6
REPORT ONGOVERNMENTSERVICES 2018
EARLY CHILDHOODEDUCATION AND CARE
PAGE 2 of TABLE 3A.6
Table 3A.6NSW Vic Qld WA SA Tas ACT NT Aust
Australian Government real expenditure on child care services (2016-17 dollars) ($000) (a), (b), (c), (d), (e)
Net capital expenditure 1 742 1 230 1 354 402 415 133 111 46 5 434Total expenditure 1 482 317 1 087 083 1 165 756 349 428 364 191 124 516 92 354 90 741 4 756 386
2009-10Recurrent expenditure (h) 1 345 381 1 003 336 1 096 479 321 314 351 877 122 258 78 855 72 067 4 391 568Net capital expenditure 12 196 8 684 9 873 2 828 3 068 976 735 317 38 676Total expenditure 1 357 577 1 012 020 1 106 352 324 142 354 945 123 234 79 591 72 383 4 430 245
2008-09Recurrent expenditure (h), (i), (j) 1 494 019 980 622 1 170 980 336 552 311 597 97 692 52 865 62 918 4 507 637Net capital expenditure 307 43 387 40 228 159 – 87 1 250Total expenditure 1 494 326 980 664 1 171 368 336 592 311 825 97 851 52 865 63 005 4 508 887
2007-08Recurrent expenditure (h), (j), (k), (l) 957 248 659 123 935 892 240 383 243 492 74 942 38 771 56 601 3 220 676Net capital expenditure 3 460 1 138 2 134 726 843 224 – 1 763 10 289Total expenditure 960 707 660 261 938 026 241 109 244 335 75 167 38 771 58 364 3 230 965
(a)
(b)
(c)
(d)
(e)
(f)
Recurrent expenditure excludes miscellaneous payments because they represent ad hoc amounts paid to child care providers independent of the regular CCBadvance/acquit cycle that cannot be reported by service type or by jurisdiction.
Time series financial data are adjusted to 2016-17 dollars using the GGFCE chain price deflator (2016-17 = 100). See table 2A.49 and chapter 2 for moreinformation.Data exclude Australian Government financial contributions to the State and Territory governments under the NP UAECE. Funding allocated through the NPUAECE is reported by the State and Territory governments (in tables 3A.3 and 3A.5). The NP UAECE funding is also separately reported in table 3A.8.
Recurrent expenditure data include administration expenditure, other expenditure on service provision and financial support to families. These data includepayments to families receiving Child Care Benefit (CCB) for formal services.
In 2014-15, due to machinery of Government changes, Australia Government expenditure by jurisdiction was calculated differently.
Data include expenditure for some children aged greater than 12 years, including Aboriginal and Torres Strait Islander children and children with special needs.
TABLE 3A.6
REPORT ONGOVERNMENTSERVICES 2018
EARLY CHILDHOODEDUCATION AND CARE
PAGE 3 of TABLE 3A.6
Table 3A.6NSW Vic Qld WA SA Tas ACT NT Aust
Australian Government real expenditure on child care services (2016-17 dollars) ($000) (a), (b), (c), (d), (e)
(g)
(h)
(i)
(j)
(k)
(l)
– Nil or rounded to zero.Source : Australian Government Department of Education and Training unpublished.
In 2007-08, an estimate Child Care Tax Rebate (CCTR) expenditure is included. CCTR expenditure may include some double counting where customers wereassessed for their CCTR entitlement and then later reassessed.
From 2007-08 to 2008-09, the Australian total does not equal the sum of the individual State and Territory amounts because there was a component ofexpenditure belonging to the Australian Government which could not be disaggregated by State and Territory.
In years 2007-08 to 2013-14, administration expenditure, other expenditure on service provision and financial support to families expenditure was pro-ratedacross states and territories based on numbers of children attending care, except for specific purpose payments (which includes Budget Based Fundedservices), which are included for each State and Territory.
In 2013-14, due to machinery of Government changes, only 9.5 months of Department of Education and Training expenses are included in recurrent expenditureand, therefore, total expenditure. Departmental expenses are a small component of recurrent expenditure.
In 2007-08, data for recurrent expenditure include an estimate of Department of Families, Housing, Community Services and Indigenous Affairs and Departmentof Education, Employment and Workplace Relations departmental expenditure.
In 2008-09, data for recurrent expenditure is based on departmental expenditure figures from the Department of Education, Employment and WorkplaceRelations Annual Report 2008-09, and includes a proportion of Centrelink expenditure infrastructure costs.
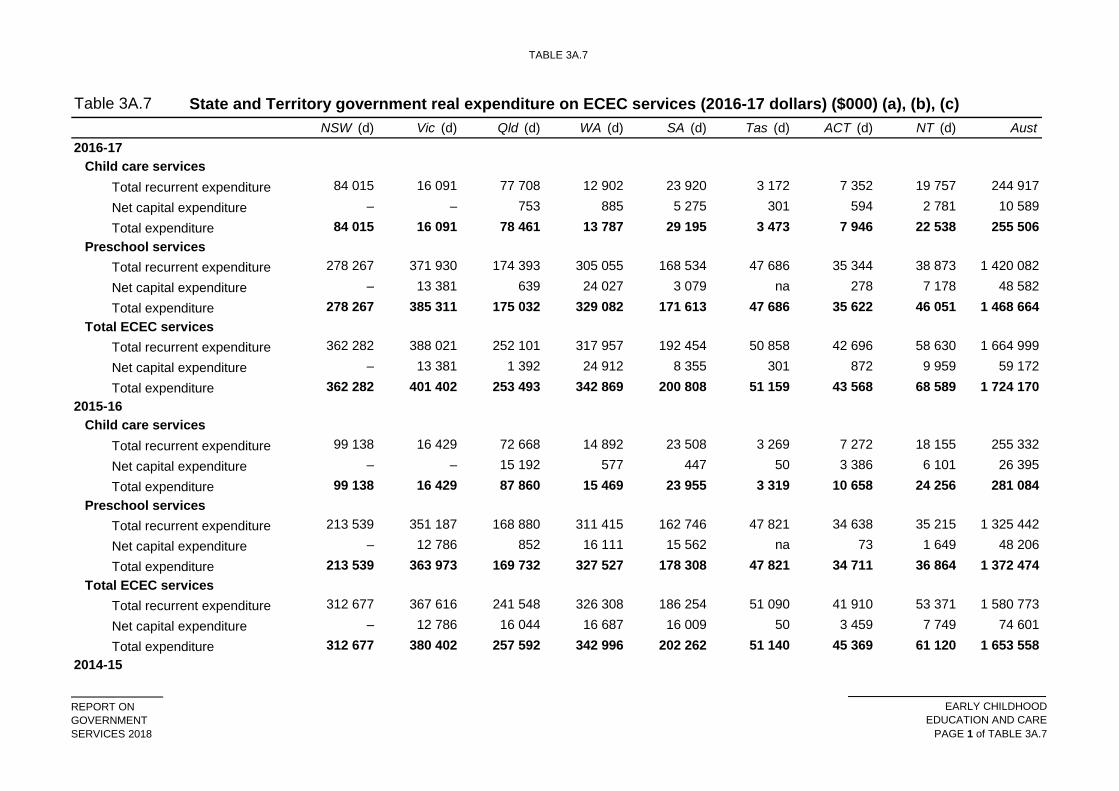
TABLE 3A.7
REPORT ONGOVERNMENTSERVICES 2018
EARLY CHILDHOODEDUCATION AND CARE
PAGE 1 of TABLE 3A.7
Table 3A.7NSW (d) Vic (d) Qld (d) WA (d) SA (d) Tas (d) ACT (d) NT (d) Aust
2016-17Child care services
Total recurrent expenditure 84 015 16 091 77 708 12 902 23 920 3 172 7 352 19 757 244 917Net capital expenditure – – 753 885 5 275 301 594 2 781 10 589Total expenditure 84 015 16 091 78 461 13 787 29 195 3 473 7 946 22 538 255 506
Preschool servicesTotal recurrent expenditure 278 267 371 930 174 393 305 055 168 534 47 686 35 344 38 873 1 420 082Net capital expenditure – 13 381 639 24 027 3 079 na 278 7 178 48 582Total expenditure 278 267 385 311 175 032 329 082 171 613 47 686 35 622 46 051 1 468 664
Total ECEC servicesTotal recurrent expenditure 362 282 388 021 252 101 317 957 192 454 50 858 42 696 58 630 1 664 999Net capital expenditure – 13 381 1 392 24 912 8 355 301 872 9 959 59 172Total expenditure 362 282 401 402 253 493 342 869 200 808 51 159 43 568 68 589 1 724 170
2015-16Child care services
Total recurrent expenditure 99 138 16 429 72 668 14 892 23 508 3 269 7 272 18 155 255 332Net capital expenditure – – 15 192 577 447 50 3 386 6 101 26 395Total expenditure 99 138 16 429 87 860 15 469 23 955 3 319 10 658 24 256 281 084
Preschool servicesTotal recurrent expenditure 213 539 351 187 168 880 311 415 162 746 47 821 34 638 35 215 1 325 442Net capital expenditure – 12 786 852 16 111 15 562 na 73 1 649 48 206Total expenditure 213 539 363 973 169 732 327 527 178 308 47 821 34 711 36 864 1 372 474
Total ECEC servicesTotal recurrent expenditure 312 677 367 616 241 548 326 308 186 254 51 090 41 910 53 371 1 580 773Net capital expenditure – 12 786 16 044 16 687 16 009 50 3 459 7 749 74 601Total expenditure 312 677 380 402 257 592 342 996 202 262 51 140 45 369 61 120 1 653 558
2014-15
State and Territory government real expenditure on ECEC services (2016-17 dollars) ($000) (a), (b), (c)
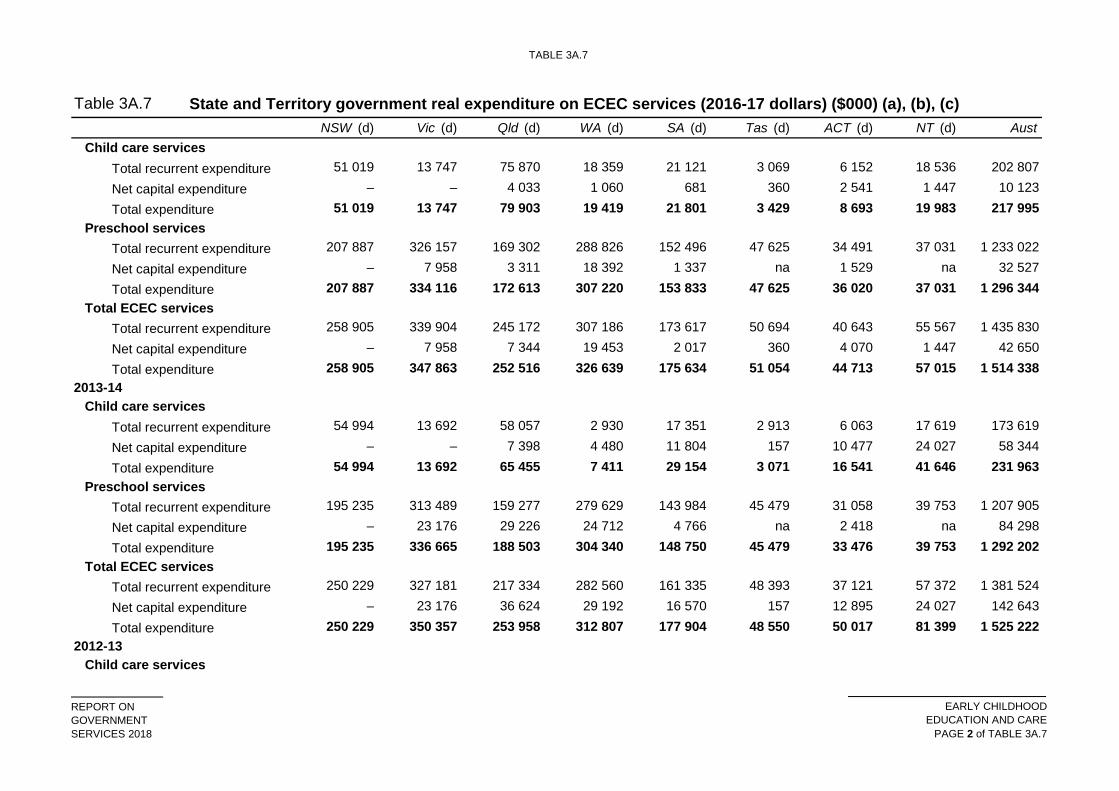
TABLE 3A.7
REPORT ONGOVERNMENTSERVICES 2018
EARLY CHILDHOODEDUCATION AND CARE
PAGE 2 of TABLE 3A.7
Table 3A.7NSW (d) Vic (d) Qld (d) WA (d) SA (d) Tas (d) ACT (d) NT (d) Aust
State and Territory government real expenditure on ECEC services (2016-17 dollars) ($000) (a), (b), (c)
Child care servicesTotal recurrent expenditure 51 019 13 747 75 870 18 359 21 121 3 069 6 152 18 536 202 807Net capital expenditure – – 4 033 1 060 681 360 2 541 1 447 10 123Total expenditure 51 019 13 747 79 903 19 419 21 801 3 429 8 693 19 983 217 995
Preschool servicesTotal recurrent expenditure 207 887 326 157 169 302 288 826 152 496 47 625 34 491 37 031 1 233 022Net capital expenditure – 7 958 3 311 18 392 1 337 na 1 529 na 32 527Total expenditure 207 887 334 116 172 613 307 220 153 833 47 625 36 020 37 031 1 296 344
Total ECEC servicesTotal recurrent expenditure 258 905 339 904 245 172 307 186 173 617 50 694 40 643 55 567 1 435 830Net capital expenditure – 7 958 7 344 19 453 2 017 360 4 070 1 447 42 650Total expenditure 258 905 347 863 252 516 326 639 175 634 51 054 44 713 57 015 1 514 338
2013-14Child care services
Total recurrent expenditure 54 994 13 692 58 057 2 930 17 351 2 913 6 063 17 619 173 619Net capital expenditure – – 7 398 4 480 11 804 157 10 477 24 027 58 344Total expenditure 54 994 13 692 65 455 7 411 29 154 3 071 16 541 41 646 231 963
Preschool servicesTotal recurrent expenditure 195 235 313 489 159 277 279 629 143 984 45 479 31 058 39 753 1 207 905Net capital expenditure – 23 176 29 226 24 712 4 766 na 2 418 na 84 298Total expenditure 195 235 336 665 188 503 304 340 148 750 45 479 33 476 39 753 1 292 202
Total ECEC servicesTotal recurrent expenditure 250 229 327 181 217 334 282 560 161 335 48 393 37 121 57 372 1 381 524Net capital expenditure – 23 176 36 624 29 192 16 570 157 12 895 24 027 142 643Total expenditure 250 229 350 357 253 958 312 807 177 904 48 550 50 017 81 399 1 525 222
2012-13Child care services
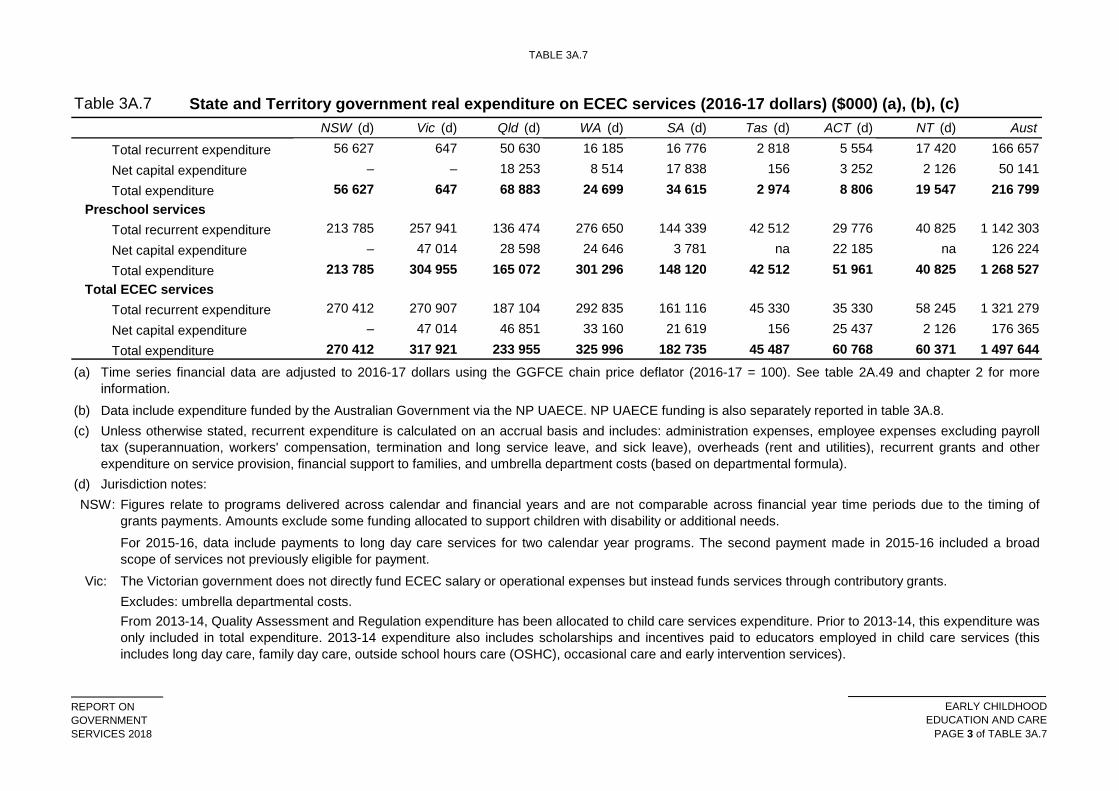
TABLE 3A.7
REPORT ONGOVERNMENTSERVICES 2018
EARLY CHILDHOODEDUCATION AND CARE
PAGE 3 of TABLE 3A.7
Table 3A.7NSW (d) Vic (d) Qld (d) WA (d) SA (d) Tas (d) ACT (d) NT (d) Aust
State and Territory government real expenditure on ECEC services (2016-17 dollars) ($000) (a), (b), (c)
Total recurrent expenditure 56 627 647 50 630 16 185 16 776 2 818 5 554 17 420 166 657Net capital expenditure – – 18 253 8 514 17 838 156 3 252 2 126 50 141Total expenditure 56 627 647 68 883 24 699 34 615 2 974 8 806 19 547 216 799
Preschool servicesTotal recurrent expenditure 213 785 257 941 136 474 276 650 144 339 42 512 29 776 40 825 1 142 303Net capital expenditure – 47 014 28 598 24 646 3 781 na 22 185 na 126 224Total expenditure 213 785 304 955 165 072 301 296 148 120 42 512 51 961 40 825 1 268 527
Total ECEC servicesTotal recurrent expenditure 270 412 270 907 187 104 292 835 161 116 45 330 35 330 58 245 1 321 279Net capital expenditure – 47 014 46 851 33 160 21 619 156 25 437 2 126 176 365Total expenditure 270 412 317 921 233 955 325 996 182 735 45 487 60 768 60 371 1 497 644
(a)
(b)(c)
(d) Jurisdiction notes:NSW:
Vic:
For 2015-16, data include payments to long day care services for two calendar year programs. The second payment made in 2015-16 included a broadscope of services not previously eligible for payment.
Time series financial data are adjusted to 2016-17 dollars using the GGFCE chain price deflator (2016-17 = 100). See table 2A.49 and chapter 2 for moreinformation.Data include expenditure funded by the Australian Government via the NP UAECE. NP UAECE funding is also separately reported in table 3A.8.Unless otherwise stated, recurrent expenditure is calculated on an accrual basis and includes: administration expenses, employee expenses excluding payrolltax (superannuation, workers' compensation, termination and long service leave, and sick leave), overheads (rent and utilities), recurrent grants and otherexpenditure on service provision, financial support to families, and umbrella department costs (based on departmental formula).
The Victorian government does not directly fund ECEC salary or operational expenses but instead funds services through contributory grants.
From 2013-14, Quality Assessment and Regulation expenditure has been allocated to child care services expenditure. Prior to 2013-14, this expenditure wasonly included in total expenditure. 2013-14 expenditure also includes scholarships and incentives paid to educators employed in child care services (thisincludes long day care, family day care, outside school hours care (OSHC), occasional care and early intervention services).
Figures relate to programs delivered across calendar and financial years and are not comparable across financial year time periods due to the timing ofgrants payments. Amounts exclude some funding allocated to support children with disability or additional needs.
Excludes: umbrella departmental costs.
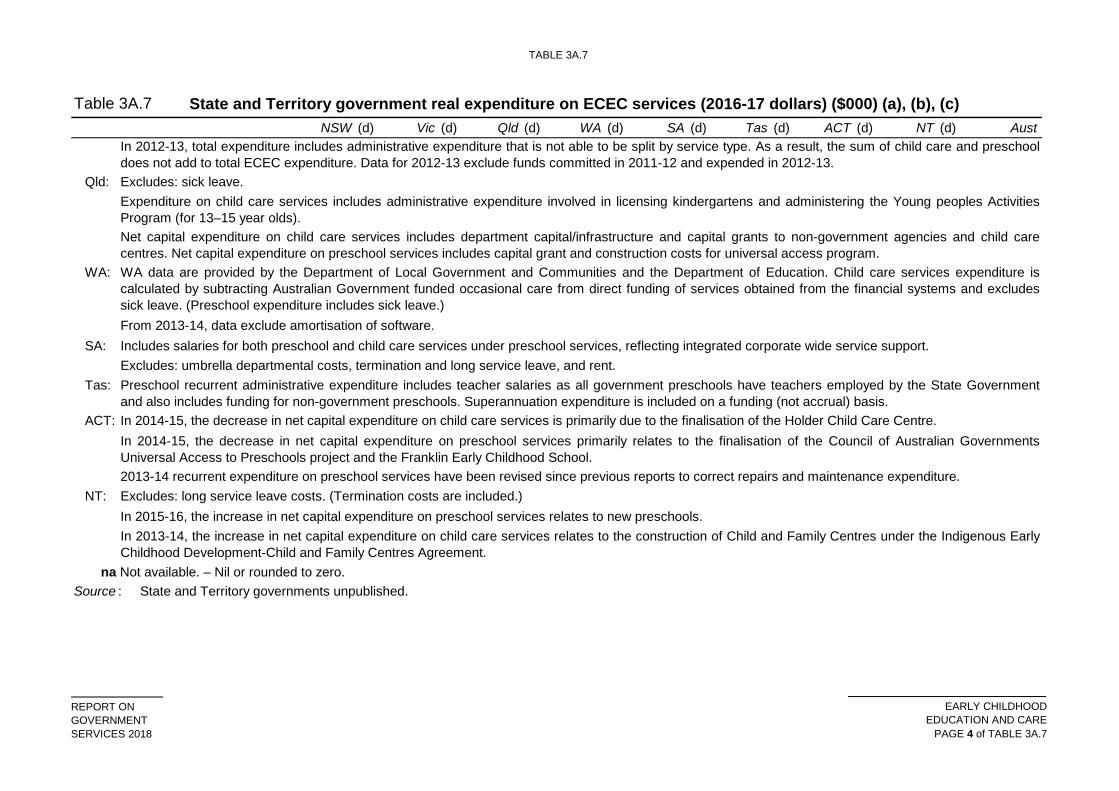
TABLE 3A.7
REPORT ONGOVERNMENTSERVICES 2018
EARLY CHILDHOODEDUCATION AND CARE
PAGE 4 of TABLE 3A.7
Table 3A.7NSW (d) Vic (d) Qld (d) WA (d) SA (d) Tas (d) ACT (d) NT (d) Aust
State and Territory government real expenditure on ECEC services (2016-17 dollars) ($000) (a), (b), (c)
Qld:
WA:
SA:
Tas:
ACT:
NT:
Source :
Expenditure on child care services includes administrative expenditure involved in licensing kindergartens and administering the Young peoples ActivitiesProgram (for 13–15 year olds).
In 2015-16, the increase in net capital expenditure on preschool services relates to new preschools.In 2013-14, the increase in net capital expenditure on child care services relates to the construction of Child and Family Centres under the Indigenous EarlyChildhood Development-Child and Family Centres Agreement.
Excludes: sick leave.
In 2014-15, the decrease in net capital expenditure on child care services is primarily due to the finalisation of the Holder Child Care Centre.
Excludes: long service leave costs. (Termination costs are included.)2013-14 recurrent expenditure on preschool services have been revised since previous reports to correct repairs and maintenance expenditure.
In 2014-15, the decrease in net capital expenditure on preschool services primarily relates to the finalisation of the Council of Australian GovernmentsUniversal Access to Preschools project and the Franklin Early Childhood School.
Excludes: umbrella departmental costs, termination and long service leave, and rent.Preschool recurrent administrative expenditure includes teacher salaries as all government preschools have teachers employed by the State Governmentand also includes funding for non-government preschools. Superannuation expenditure is included on a funding (not accrual) basis.
State and Territory governments unpublished.na Not available. – Nil or rounded to zero.
In 2012-13, total expenditure includes administrative expenditure that is not able to be split by service type. As a result, the sum of child care and preschooldoes not add to total ECEC expenditure. Data for 2012-13 exclude funds committed in 2011-12 and expended in 2012-13.
WA data are provided by the Department of Local Government and Communities and the Department of Education. Child care services expenditure iscalculated by subtracting Australian Government funded occasional care from direct funding of services obtained from the financial systems and excludessick leave. (Preschool expenditure includes sick leave.)From 2013-14, data exclude amortisation of software.Includes salaries for both preschool and child care services under preschool services, reflecting integrated corporate wide service support.
Net capital expenditure on child care services includes department capital/infrastructure and capital grants to non-government agencies and child carecentres. Net capital expenditure on preschool services includes capital grant and construction costs for universal access program.
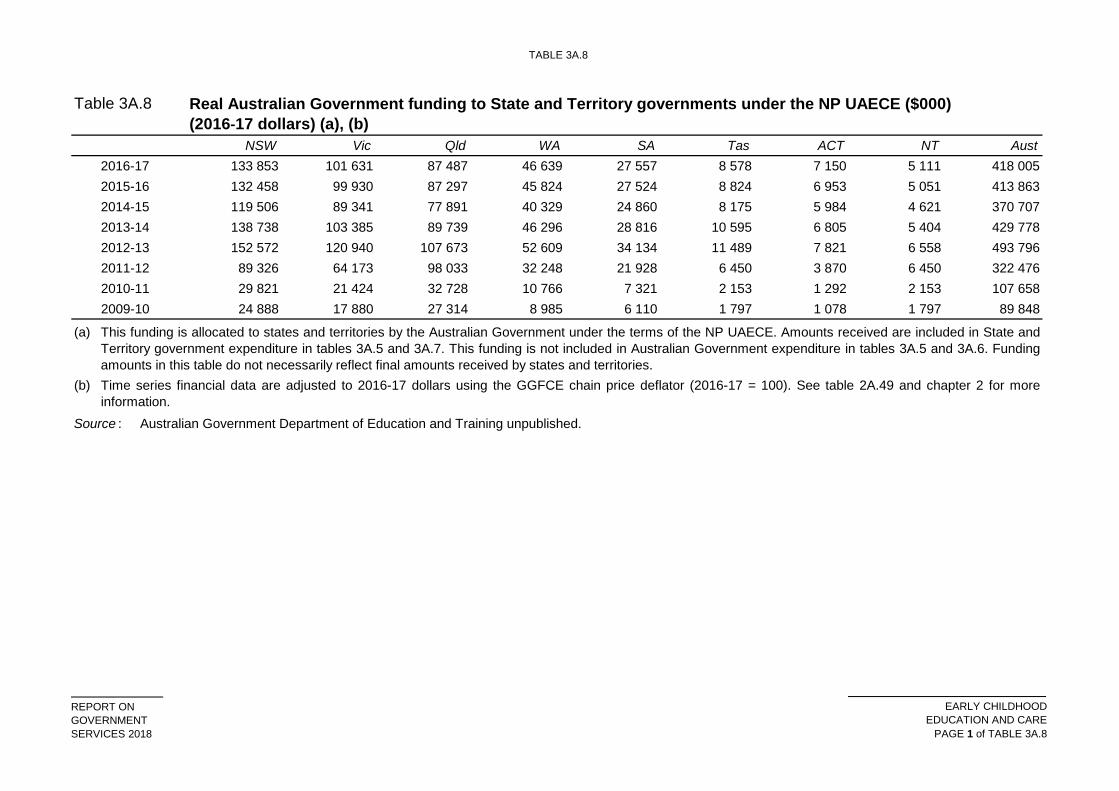
TABLE 3A.8
REPORT ONGOVERNMENTSERVICES 2018
EARLY CHILDHOODEDUCATION AND CARE
PAGE 1 of TABLE 3A.8
Table 3A.8
NSW Vic Qld WA SA Tas ACT NT Aust2016-17 133 853 101 631 87 487 46 639 27 557 8 578 7 150 5 111 418 0052015-16 132 458 99 930 87 297 45 824 27 524 8 824 6 953 5 051 413 8632014-15 119 506 89 341 77 891 40 329 24 860 8 175 5 984 4 621 370 7072013-14 138 738 103 385 89 739 46 296 28 816 10 595 6 805 5 404 429 7782012-13 152 572 120 940 107 673 52 609 34 134 11 489 7 821 6 558 493 7962011-12 89 326 64 173 98 033 32 248 21 928 6 450 3 870 6 450 322 4762010-11 29 821 21 424 32 728 10 766 7 321 2 153 1 292 2 153 107 6582009-10 24 888 17 880 27 314 8 985 6 110 1 797 1 078 1 797 89 848
(a)
(b)
Source :
Real Australian Government funding to State and Territory governments under the NP UAECE ($000) (2016-17 dollars) (a), (b)
This funding is allocated to states and territories by the Australian Government under the terms of the NP UAECE. Amounts received are included in State andTerritory government expenditure in tables 3A.5 and 3A.7. This funding is not included in Australian Government expenditure in tables 3A.5 and 3A.6. Fundingamounts in this table do not necessarily reflect final amounts received by states and territories.
Australian Government Department of Education and Training unpublished.
Time series financial data are adjusted to 2016-17 dollars using the GGFCE chain price deflator (2016-17 = 100). See table 2A.49 and chapter 2 for moreinformation.
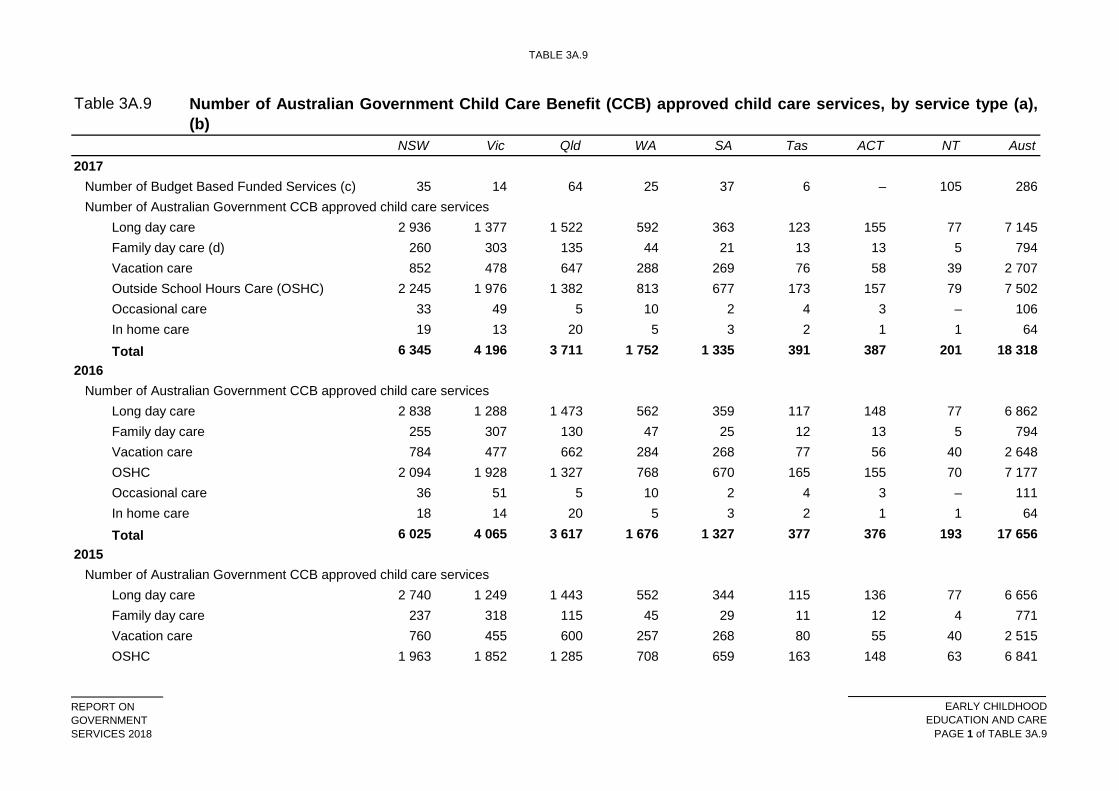
TABLE 3A.9
REPORT ONGOVERNMENTSERVICES 2018
EARLY CHILDHOODEDUCATION AND CARE
PAGE 1 of TABLE 3A.9
Table 3A.9
NSW Vic Qld WA SA Tas ACT NT Aust2017
Number of Budget Based Funded Services (c) 35 14 64 25 37 6 – 105 286Number of Australian Government CCB approved child care services
Long day care 2 936 1 377 1 522 592 363 123 155 77 7 145Family day care (d) 260 303 135 44 21 13 13 5 794Vacation care 852 478 647 288 269 76 58 39 2 707Outside School Hours Care (OSHC) 2 245 1 976 1 382 813 677 173 157 79 7 502Occasional care 33 49 5 10 2 4 3 – 106In home care 19 13 20 5 3 2 1 1 64Total 6 345 4 196 3 711 1 752 1 335 391 387 201 18 318
2016Number of Australian Government CCB approved child care services
Long day care 2 838 1 288 1 473 562 359 117 148 77 6 862Family day care 255 307 130 47 25 12 13 5 794Vacation care 784 477 662 284 268 77 56 40 2 648OSHC 2 094 1 928 1 327 768 670 165 155 70 7 177Occasional care 36 51 5 10 2 4 3 – 111In home care 18 14 20 5 3 2 1 1 64Total 6 025 4 065 3 617 1 676 1 327 377 376 193 17 656
2015Number of Australian Government CCB approved child care services
Long day care 2 740 1 249 1 443 552 344 115 136 77 6 656Family day care 237 318 115 45 29 11 12 4 771Vacation care 760 455 600 257 268 80 55 40 2 515OSHC 1 963 1 852 1 285 708 659 163 148 63 6 841
Number of Australian Government Child Care Benefit (CCB) approved child care services, by service type (a),(b)
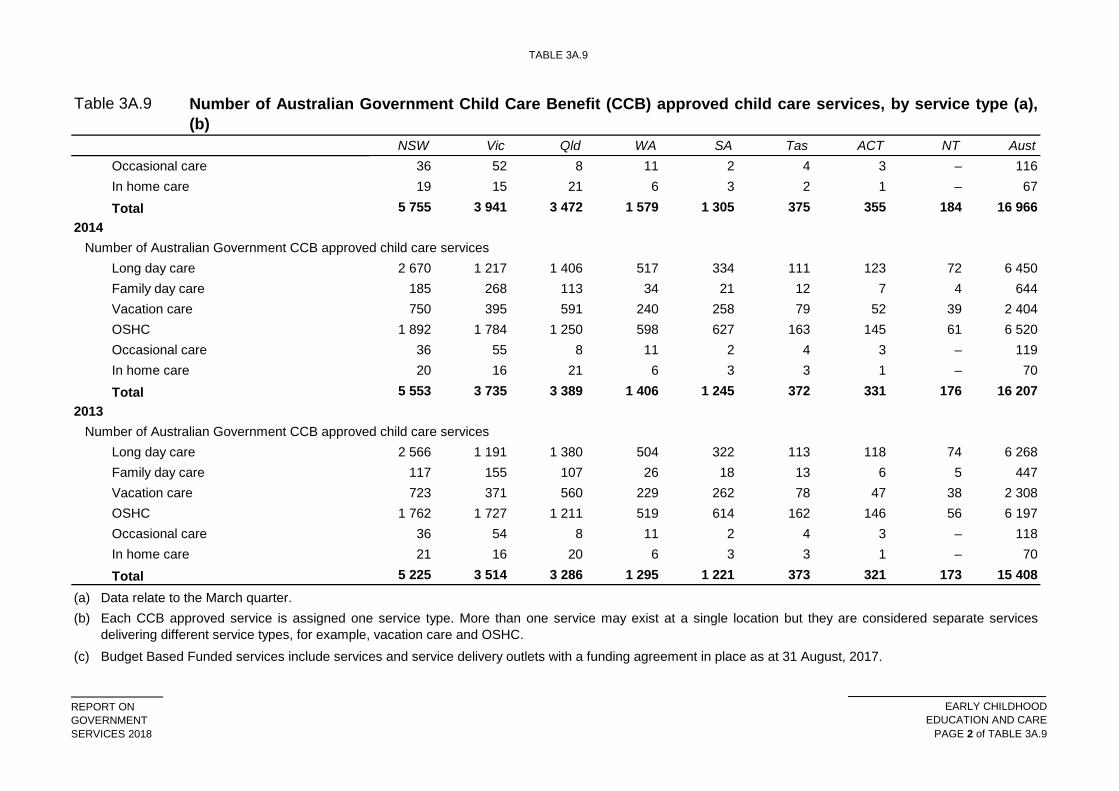
TABLE 3A.9
REPORT ONGOVERNMENTSERVICES 2018
EARLY CHILDHOODEDUCATION AND CARE
PAGE 2 of TABLE 3A.9
Table 3A.9
NSW Vic Qld WA SA Tas ACT NT Aust
Number of Australian Government Child Care Benefit (CCB) approved child care services, by service type (a),(b)
Occasional care 36 52 8 11 2 4 3 – 116In home care 19 15 21 6 3 2 1 – 67Total 5 755 3 941 3 472 1 579 1 305 375 355 184 16 966
2014Number of Australian Government CCB approved child care services
Long day care 2 670 1 217 1 406 517 334 111 123 72 6 450Family day care 185 268 113 34 21 12 7 4 644Vacation care 750 395 591 240 258 79 52 39 2 404OSHC 1 892 1 784 1 250 598 627 163 145 61 6 520Occasional care 36 55 8 11 2 4 3 – 119In home care 20 16 21 6 3 3 1 – 70Total 5 553 3 735 3 389 1 406 1 245 372 331 176 16 207
2013Number of Australian Government CCB approved child care services
Long day care 2 566 1 191 1 380 504 322 113 118 74 6 268Family day care 117 155 107 26 18 13 6 5 447Vacation care 723 371 560 229 262 78 47 38 2 308OSHC 1 762 1 727 1 211 519 614 162 146 56 6 197Occasional care 36 54 8 11 2 4 3 – 118In home care 21 16 20 6 3 3 1 – 70Total 5 225 3 514 3 286 1 295 1 221 373 321 173 15 408
(a)(b)
(c)
Data relate to the March quarter. Each CCB approved service is assigned one service type. More than one service may exist at a single location but they are considered separate servicesdelivering different service types, for example, vacation care and OSHC.Budget Based Funded services include services and service delivery outlets with a funding agreement in place as at 31 August, 2017.
TABLE 3A.9
REPORT ONGOVERNMENTSERVICES 2018
EARLY CHILDHOODEDUCATION AND CARE
PAGE 3 of TABLE 3A.9
Table 3A.9
NSW Vic Qld WA SA Tas ACT NT Aust
Number of Australian Government Child Care Benefit (CCB) approved child care services, by service type (a),(b)
(d)
Source : Australian Government Department of Education and Training (unpublished), Child Care Management System (CCMS).– Nil or rounded to zero.
2017 family day care provider data is sourced from the 2016 National Early Childhood Education and Care Workforce Census . State or Territory is based on thelocation of the family day care scheme, and may not match the location where the care is delivered.
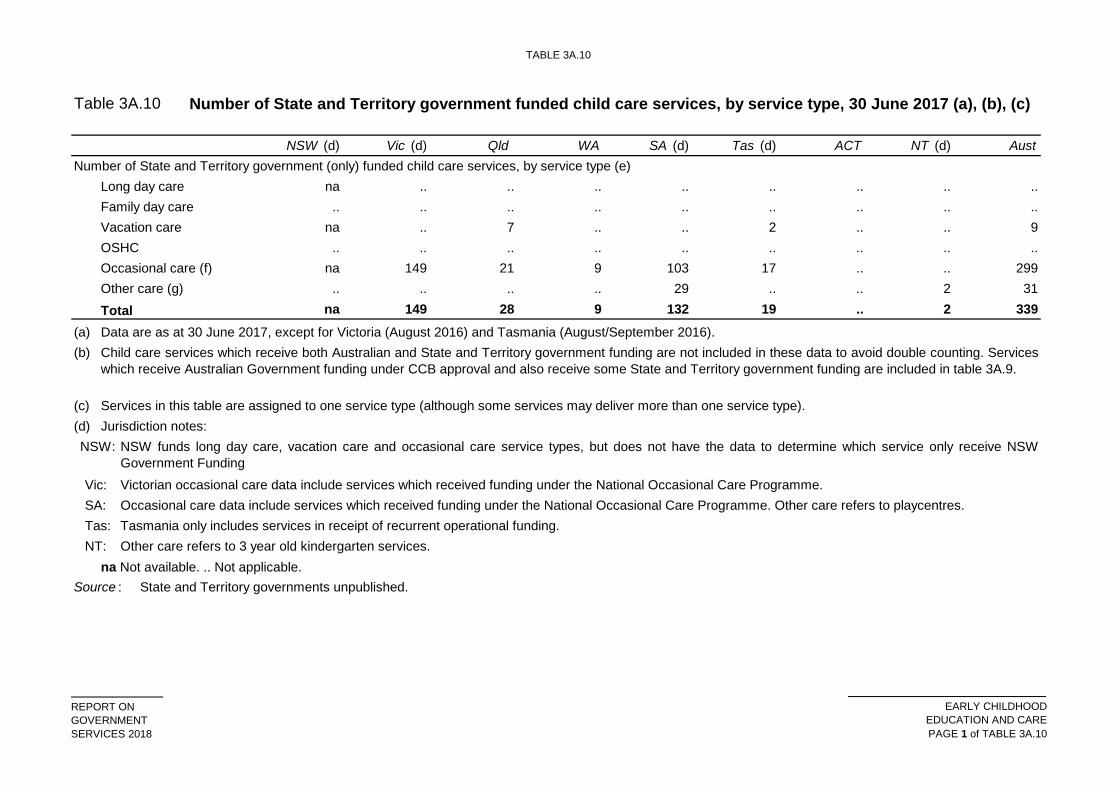
TABLE 3A.10
REPORT ONGOVERNMENTSERVICES 2018
EARLY CHILDHOODEDUCATION AND CAREPAGE 1 of TABLE 3A.10
Table 3A.10
NSW (d) Vic (d) Qld WA SA (d) Tas (d) ACT NT (d) AustNumber of State and Territory government (only) funded child care services, by service type (e)
Long day care na .. .. .. .. .. .. .. ..Family day care .. .. .. .. .. .. .. .. ..Vacation care na .. 7 .. .. 2 .. .. 9OSHC .. .. .. .. .. .. .. .. ..Occasional care (f) na 149 21 9 103 17 .. .. 299Other care (g) .. .. .. .. 29 .. .. 2 31Total na 149 28 9 132 19 .. 2 339
(a) Data are as at 30 June 2017, except for Victoria (August 2016) and Tasmania (August/September 2016).(b)
(c) Services in this table are assigned to one service type (although some services may deliver more than one service type).(d) Jurisdiction notes:NSW:
Vic:SA:Tas:NT:
Source : State and Territory governments unpublished.na Not available. .. Not applicable.
Number of State and Territory government funded child care services, by service type, 30 June 2017 (a), (b), (c)
Child care services which receive both Australian and State and Territory government funding are not included in these data to avoid double counting. Serviceswhich receive Australian Government funding under CCB approval and also receive some State and Territory government funding are included in table 3A.9.
Other care refers to 3 year old kindergarten services.Tasmania only includes services in receipt of recurrent operational funding.
NSW funds long day care, vacation care and occasional care service types, but does not have the data to determine which service only receive NSWGovernment FundingVictorian occasional care data include services which received funding under the National Occasional Care Programme.Occasional care data include services which received funding under the National Occasional Care Programme. Other care refers to playcentres.
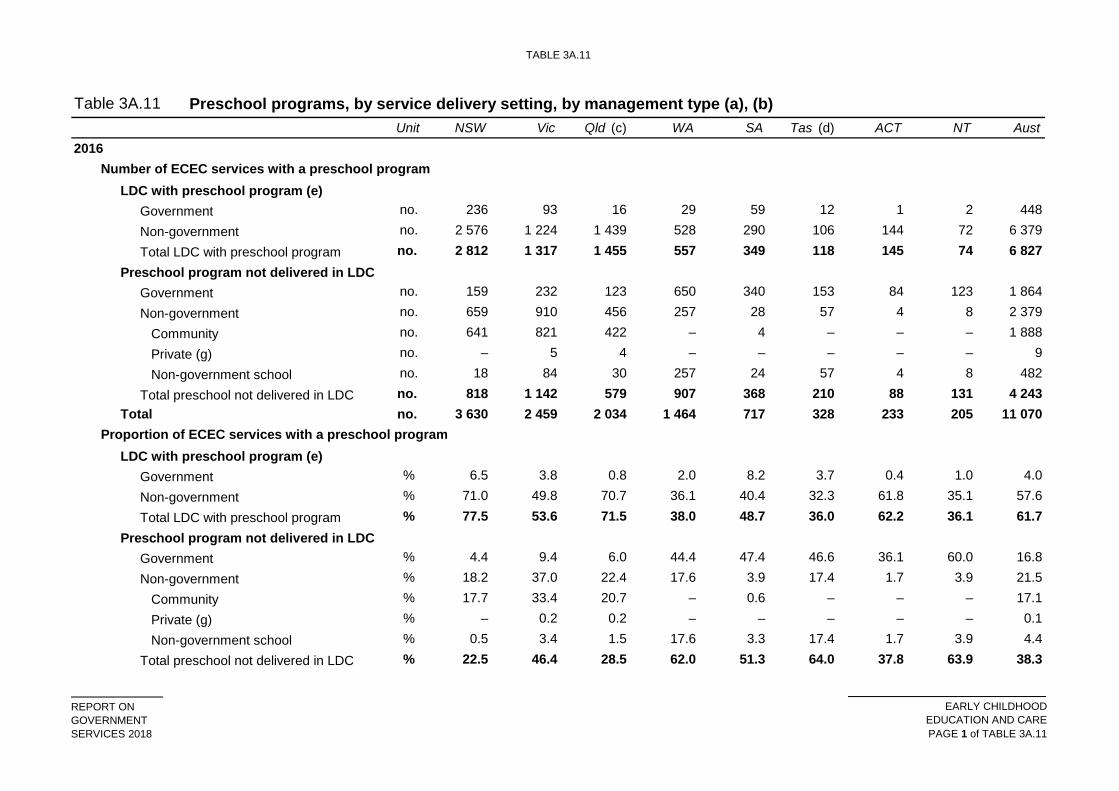
TABLE 3A.11
REPORT ONGOVERNMENTSERVICES 2018
EARLY CHILDHOODEDUCATION AND CAREPAGE 1 of TABLE 3A.11
Table 3A.11Unit NSW Vic Qld (c) WA SA Tas (d) ACT NT Aust
2016Number of ECEC services with a preschool program
LDC with preschool program (e) Government no. 236 93 16 29 59 12 1 2 448Non-government no. 2 576 1 224 1 439 528 290 106 144 72 6 379Total LDC with preschool program no. 2 812 1 317 1 455 557 349 118 145 74 6 827
Preschool program not delivered in LDCGovernment no. 159 232 123 650 340 153 84 123 1 864Non-government no. 659 910 456 257 28 57 4 8 2 379
Community no. 641 821 422 – 4 – – – 1 888Private (g) no. – 5 4 – – – – – 9Non-government school no. 18 84 30 257 24 57 4 8 482
Total preschool not delivered in LDC no. 818 1 142 579 907 368 210 88 131 4 243Total no. 3 630 2 459 2 034 1 464 717 328 233 205 11 070
Proportion of ECEC services with a preschool programLDC with preschool program (e)
Government % 6.5 3.8 0.8 2.0 8.2 3.7 0.4 1.0 4.0Non-government % 71.0 49.8 70.7 36.1 40.4 32.3 61.8 35.1 57.6Total LDC with preschool program % 77.5 53.6 71.5 38.0 48.7 36.0 62.2 36.1 61.7
Preschool program not delivered in LDCGovernment % 4.4 9.4 6.0 44.4 47.4 46.6 36.1 60.0 16.8Non-government % 18.2 37.0 22.4 17.6 3.9 17.4 1.7 3.9 21.5
Community % 17.7 33.4 20.7 – 0.6 – – – 17.1Private (g) % – 0.2 0.2 – – – – – 0.1Non-government school % 0.5 3.4 1.5 17.6 3.3 17.4 1.7 3.9 4.4
Total preschool not delivered in LDC % 22.5 46.4 28.5 62.0 51.3 64.0 37.8 63.9 38.3
Preschool programs, by service delivery setting, by management type (a), (b)
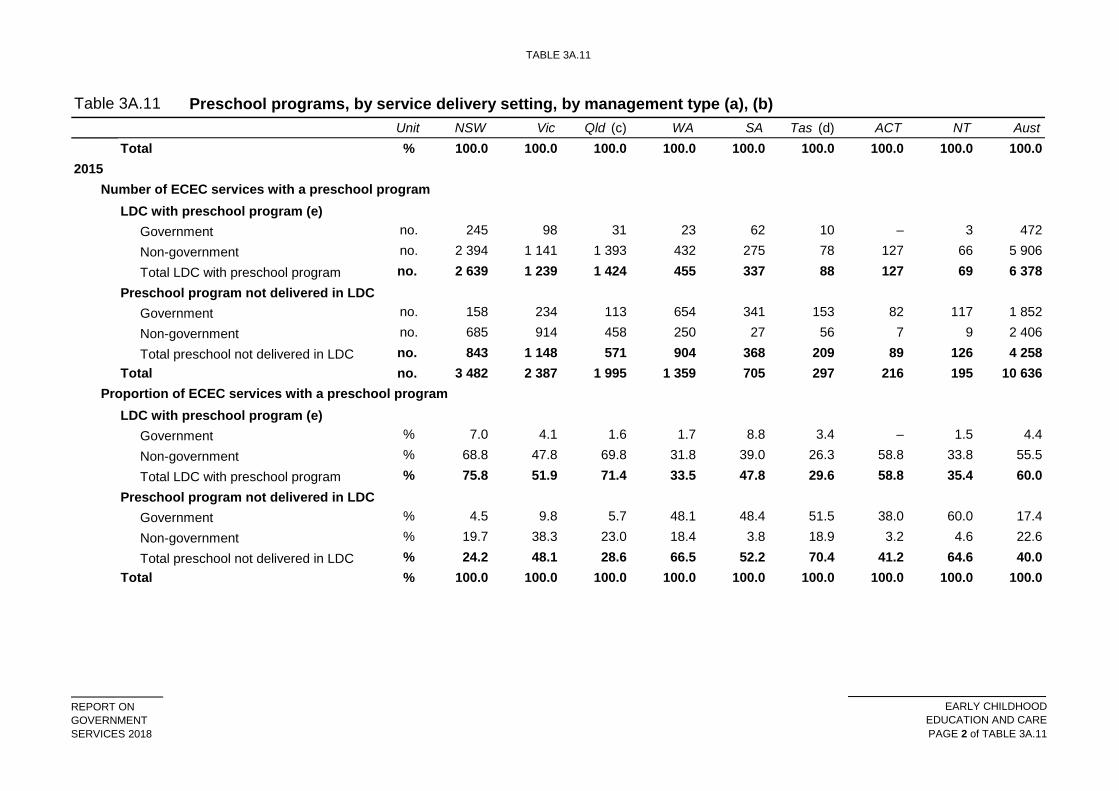
TABLE 3A.11
REPORT ONGOVERNMENTSERVICES 2018
EARLY CHILDHOODEDUCATION AND CAREPAGE 2 of TABLE 3A.11
Table 3A.11Unit NSW Vic Qld (c) WA SA Tas (d) ACT NT Aust
Preschool programs, by service delivery setting, by management type (a), (b)
Total % 100.0 100.0 100.0 100.0 100.0 100.0 100.0 100.0 100.02015
Number of ECEC services with a preschool programLDC with preschool program (e)
Government no. 245 98 31 23 62 10 – 3 472Non-government no. 2 394 1 141 1 393 432 275 78 127 66 5 906Total LDC with preschool program no. 2 639 1 239 1 424 455 337 88 127 69 6 378
Preschool program not delivered in LDCGovernment no. 158 234 113 654 341 153 82 117 1 852Non-government no. 685 914 458 250 27 56 7 9 2 406Total preschool not delivered in LDC no. 843 1 148 571 904 368 209 89 126 4 258
Total no. 3 482 2 387 1 995 1 359 705 297 216 195 10 636Proportion of ECEC services with a preschool program
LDC with preschool program (e) Government % 7.0 4.1 1.6 1.7 8.8 3.4 – 1.5 4.4Non-government % 68.8 47.8 69.8 31.8 39.0 26.3 58.8 33.8 55.5Total LDC with preschool program % 75.8 51.9 71.4 33.5 47.8 29.6 58.8 35.4 60.0
Preschool program not delivered in LDCGovernment % 4.5 9.8 5.7 48.1 48.4 51.5 38.0 60.0 17.4Non-government % 19.7 38.3 23.0 18.4 3.8 18.9 3.2 4.6 22.6Total preschool not delivered in LDC % 24.2 48.1 28.6 66.5 52.2 70.4 41.2 64.6 40.0
Total % 100.0 100.0 100.0 100.0 100.0 100.0 100.0 100.0 100.0
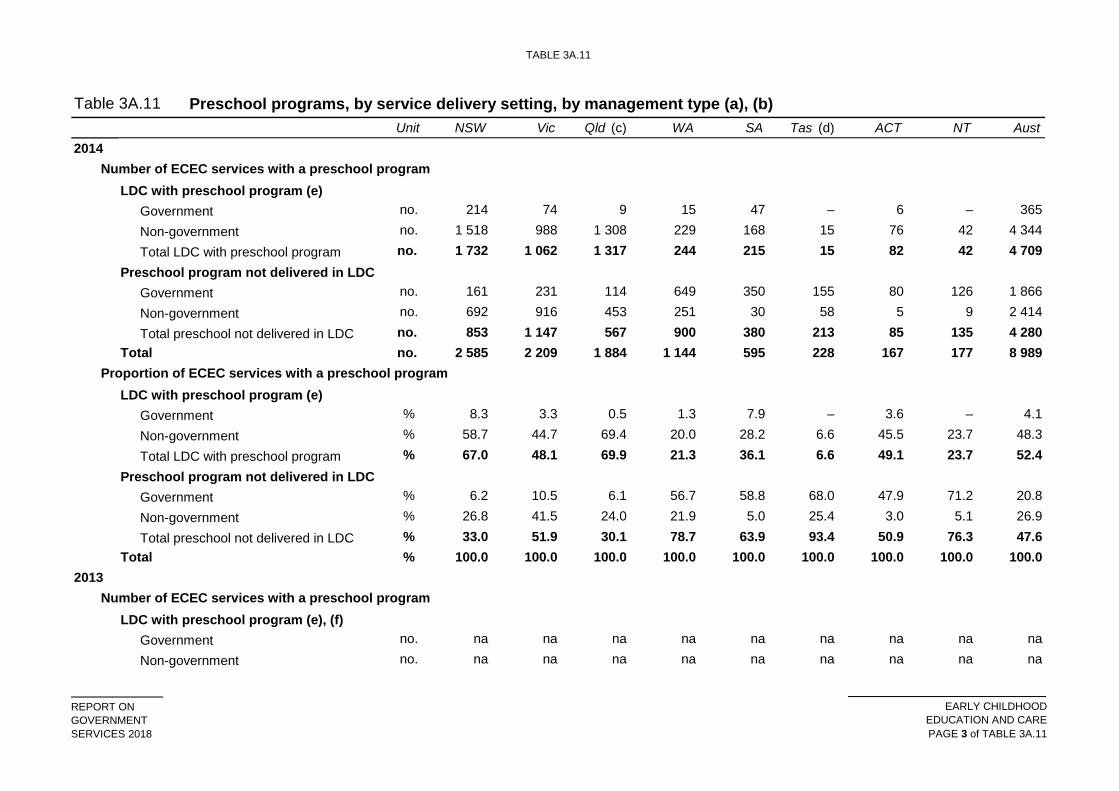
TABLE 3A.11
REPORT ONGOVERNMENTSERVICES 2018
EARLY CHILDHOODEDUCATION AND CAREPAGE 3 of TABLE 3A.11
Table 3A.11Unit NSW Vic Qld (c) WA SA Tas (d) ACT NT Aust
Preschool programs, by service delivery setting, by management type (a), (b)
2014Number of ECEC services with a preschool program
LDC with preschool program (e) Government no. 214 74 9 15 47 – 6 – 365Non-government no. 1 518 988 1 308 229 168 15 76 42 4 344Total LDC with preschool program no. 1 732 1 062 1 317 244 215 15 82 42 4 709
Preschool program not delivered in LDCGovernment no. 161 231 114 649 350 155 80 126 1 866Non-government no. 692 916 453 251 30 58 5 9 2 414Total preschool not delivered in LDC no. 853 1 147 567 900 380 213 85 135 4 280
Total no. 2 585 2 209 1 884 1 144 595 228 167 177 8 989Proportion of ECEC services with a preschool program
LDC with preschool program (e) Government % 8.3 3.3 0.5 1.3 7.9 – 3.6 – 4.1Non-government % 58.7 44.7 69.4 20.0 28.2 6.6 45.5 23.7 48.3Total LDC with preschool program % 67.0 48.1 69.9 21.3 36.1 6.6 49.1 23.7 52.4
Preschool program not delivered in LDCGovernment % 6.2 10.5 6.1 56.7 58.8 68.0 47.9 71.2 20.8Non-government % 26.8 41.5 24.0 21.9 5.0 25.4 3.0 5.1 26.9Total preschool not delivered in LDC % 33.0 51.9 30.1 78.7 63.9 93.4 50.9 76.3 47.6
Total % 100.0 100.0 100.0 100.0 100.0 100.0 100.0 100.0 100.02013
Number of ECEC services with a preschool programLDC with preschool program (e), (f)
Government no. na na na na na na na na naNon-government no. na na na na na na na na na
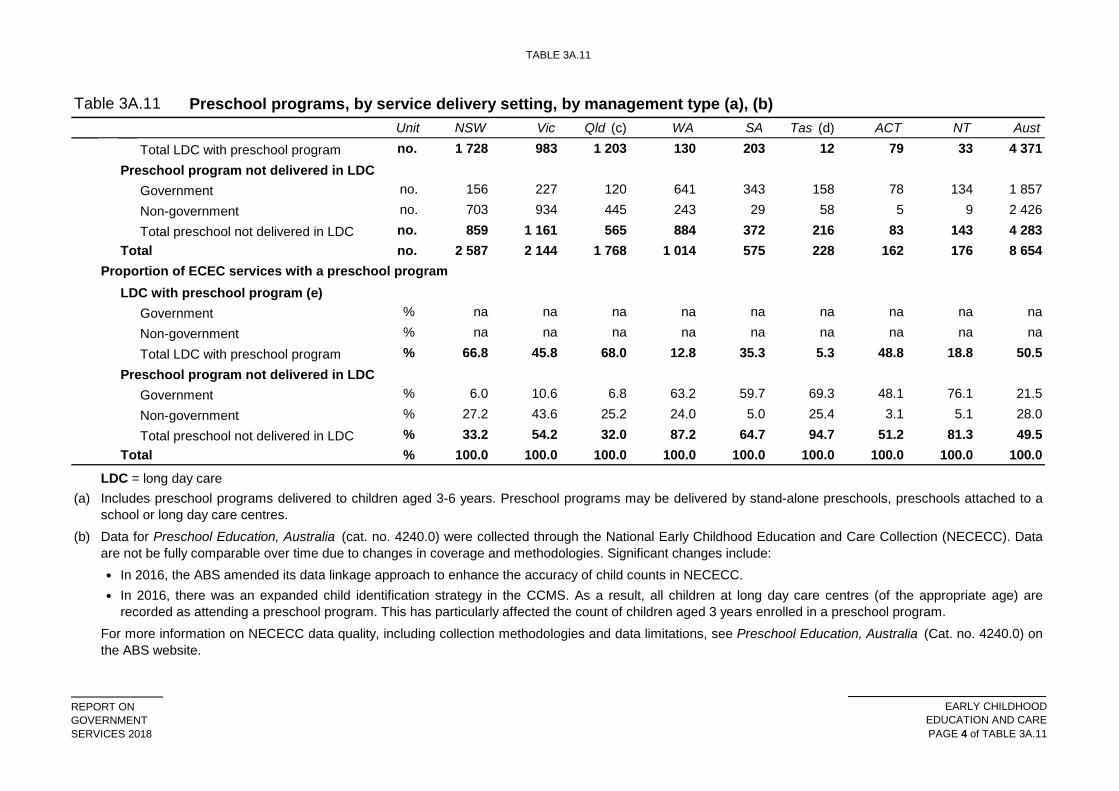
TABLE 3A.11
REPORT ONGOVERNMENTSERVICES 2018
EARLY CHILDHOODEDUCATION AND CAREPAGE 4 of TABLE 3A.11
Table 3A.11Unit NSW Vic Qld (c) WA SA Tas (d) ACT NT Aust
Preschool programs, by service delivery setting, by management type (a), (b)
Total LDC with preschool program no. 1 728 983 1 203 130 203 12 79 33 4 371Preschool program not delivered in LDC
Government no. 156 227 120 641 343 158 78 134 1 857Non-government no. 703 934 445 243 29 58 5 9 2 426Total preschool not delivered in LDC no. 859 1 161 565 884 372 216 83 143 4 283
Total no. 2 587 2 144 1 768 1 014 575 228 162 176 8 654Proportion of ECEC services with a preschool program
LDC with preschool program (e) Government % na na na na na na na na naNon-government % na na na na na na na na naTotal LDC with preschool program % 66.8 45.8 68.0 12.8 35.3 5.3 48.8 18.8 50.5
Preschool program not delivered in LDCGovernment % 6.0 10.6 6.8 63.2 59.7 69.3 48.1 76.1 21.5Non-government % 27.2 43.6 25.2 24.0 5.0 25.4 3.1 5.1 28.0Total preschool not delivered in LDC % 33.2 54.2 32.0 87.2 64.7 94.7 51.2 81.3 49.5
Total % 100.0 100.0 100.0 100.0 100.0 100.0 100.0 100.0 100.0LDC = long day care
(a)
(b)
••
Data for Preschool Education, Australia (cat. no. 4240.0) were collected through the National Early Childhood Education and Care Collection (NECECC). Dataare not be fully comparable over time due to changes in coverage and methodologies. Significant changes include:
In 2016, the ABS amended its data linkage approach to enhance the accuracy of child counts in NECECC.In 2016, there was an expanded child identification strategy in the CCMS. As a result, all children at long day care centres (of the appropriate age) arerecorded as attending a preschool program. This has particularly affected the count of children aged 3 years enrolled in a preschool program.
For more information on NECECC data quality, including collection methodologies and data limitations, see Preschool Education, Australia (Cat. no. 4240.0) onthe ABS website.
Includes preschool programs delivered to children aged 3-6 years. Preschool programs may be delivered by stand-alone preschools, preschools attached to aschool or long day care centres.
TABLE 3A.11
REPORT ONGOVERNMENTSERVICES 2018
EARLY CHILDHOODEDUCATION AND CAREPAGE 5 of TABLE 3A.11
Table 3A.11Unit NSW Vic Qld (c) WA SA Tas (d) ACT NT Aust
Preschool programs, by service delivery setting, by management type (a), (b)
(c)(d)(e)
(f)
(g)na Not available. – Nil or rounded to zero.
Source :
School-based preschools that provide supplementary long day care services are included in the LDC with preschool category. Some preschools are reclassifiedto long day care due to collection methodologies.
Queensland data include a small number of occasional care services providing a preschool program.
Includes 'other'.
In 2013, in response to the undercount issue, NSW completed a supplementary data report which indicated that 2136 long day care services delivered apreschool program to 55 187 children in 2013. This would increase the NSW proportion of preschool services delivered from a long day care centre to 71.3 percent.
ABS 2017 (and previous issues), Preschool Education, Australia, 2016 , Cat. no. 4240.0.
In Tasmania, preschool services not delivered in a long day care setting are delivered in a school setting.
ECEC PARTICIPATION
REPORT ONGOVERNMENTSERVICES 2018
EARLY CHILDHOODEDUCATION AND CARE
PAGE 1 of ECEC PARTICIPATION
ECEC participationby special needs groups
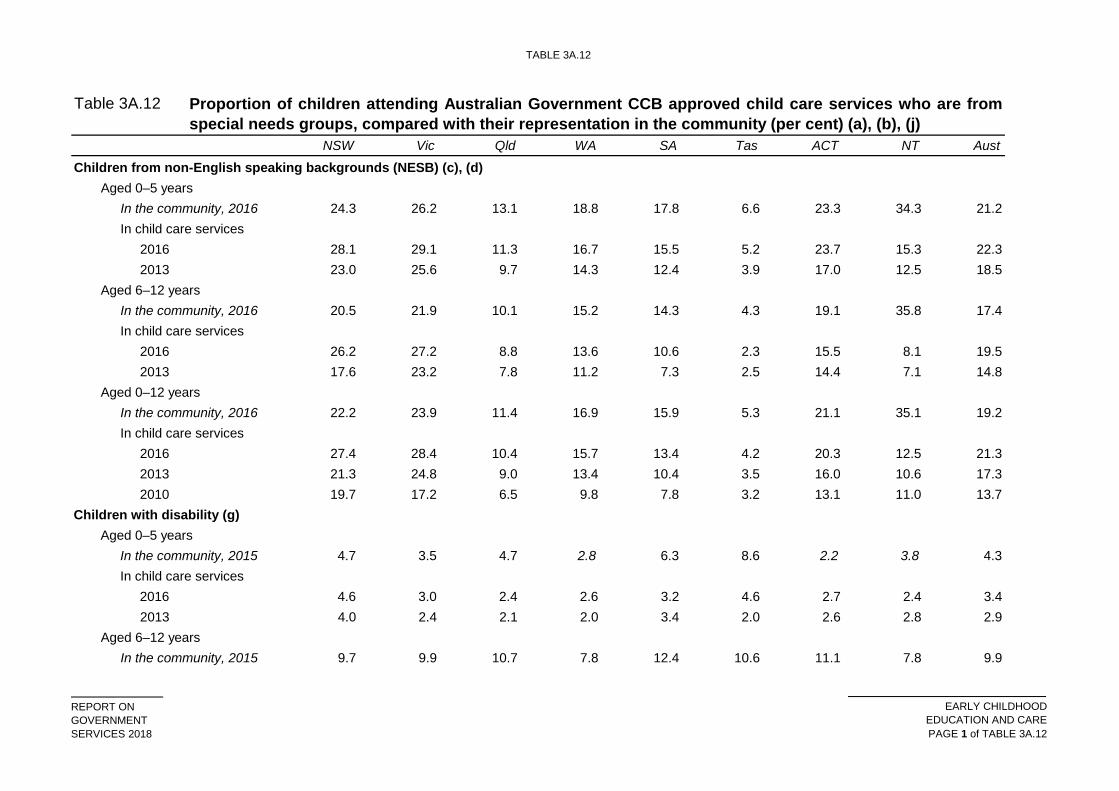
TABLE 3A.12
REPORT ONGOVERNMENTSERVICES 2018
EARLY CHILDHOODEDUCATION AND CAREPAGE 1 of TABLE 3A.12
Table 3A.12
NSW Vic Qld WA SA Tas ACT NT Aust
Children from non-English speaking backgrounds (NESB) (c), (d) Aged 0–5 years
In the community, 2016 24.3 26.2 13.1 18.8 17.8 6.6 23.3 34.3 21.2In child care services
2016 28.1 29.1 11.3 16.7 15.5 5.2 23.7 15.3 22.32013 23.0 25.6 9.7 14.3 12.4 3.9 17.0 12.5 18.5
Aged 6–12 yearsIn the community, 2016 20.5 21.9 10.1 15.2 14.3 4.3 19.1 35.8 17.4In child care services
2016 26.2 27.2 8.8 13.6 10.6 2.3 15.5 8.1 19.52013 17.6 23.2 7.8 11.2 7.3 2.5 14.4 7.1 14.8
Aged 0–12 yearsIn the community, 2016 22.2 23.9 11.4 16.9 15.9 5.3 21.1 35.1 19.2In child care services
2016 27.4 28.4 10.4 15.7 13.4 4.2 20.3 12.5 21.32013 21.3 24.8 9.0 13.4 10.4 3.5 16.0 10.6 17.32010 19.7 17.2 6.5 9.8 7.8 3.2 13.1 11.0 13.7
Children with disability (g)Aged 0–5 years
In the community, 2015 4.7 3.5 4.7 2.8 6.3 8.6 2.2 3.8 4.3In child care services
2016 4.6 3.0 2.4 2.6 3.2 4.6 2.7 2.4 3.42013 4.0 2.4 2.1 2.0 3.4 2.0 2.6 2.8 2.9
Aged 6–12 yearsIn the community, 2015 9.7 9.9 10.7 7.8 12.4 10.6 11.1 7.8 9.9
Proportion of children attending Australian Government CCB approved child care services who are fromspecial needs groups, compared with their representation in the community (per cent) (a), (b), (j)
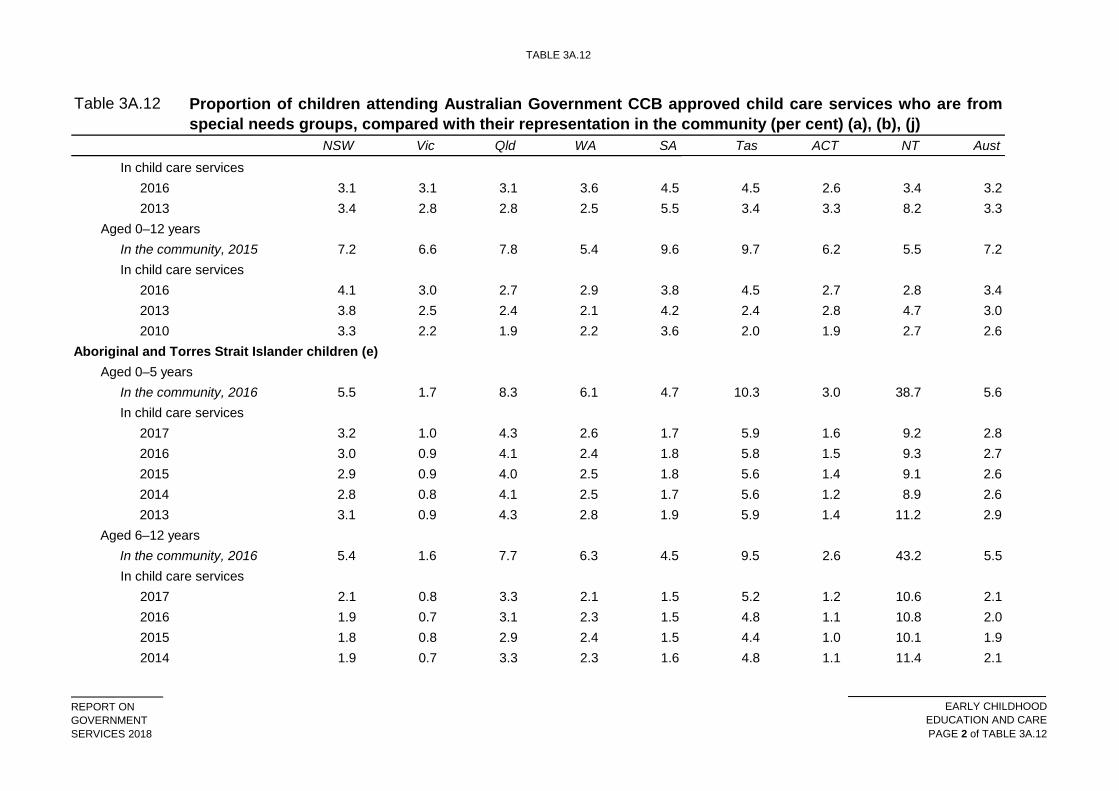
TABLE 3A.12
REPORT ONGOVERNMENTSERVICES 2018
EARLY CHILDHOODEDUCATION AND CAREPAGE 2 of TABLE 3A.12
Table 3A.12
NSW Vic Qld WA SA Tas ACT NT Aust
Proportion of children attending Australian Government CCB approved child care services who are fromspecial needs groups, compared with their representation in the community (per cent) (a), (b), (j)
In child care services2016 3.1 3.1 3.1 3.6 4.5 4.5 2.6 3.4 3.22013 3.4 2.8 2.8 2.5 5.5 3.4 3.3 8.2 3.3
Aged 0–12 yearsIn the community, 2015 7.2 6.6 7.8 5.4 9.6 9.7 6.2 5.5 7.2In child care services
2016 4.1 3.0 2.7 2.9 3.8 4.5 2.7 2.8 3.42013 3.8 2.5 2.4 2.1 4.2 2.4 2.8 4.7 3.02010 3.3 2.2 1.9 2.2 3.6 2.0 1.9 2.7 2.6
Aboriginal and Torres Strait Islander children (e)Aged 0–5 years
In the community, 2016 5.5 1.7 8.3 6.1 4.7 10.3 3.0 38.7 5.6In child care services
2017 3.2 1.0 4.3 2.6 1.7 5.9 1.6 9.2 2.82016 3.0 0.9 4.1 2.4 1.8 5.8 1.5 9.3 2.72015 2.9 0.9 4.0 2.5 1.8 5.6 1.4 9.1 2.62014 2.8 0.8 4.1 2.5 1.7 5.6 1.2 8.9 2.62013 3.1 0.9 4.3 2.8 1.9 5.9 1.4 11.2 2.9
Aged 6–12 yearsIn the community, 2016 5.4 1.6 7.7 6.3 4.5 9.5 2.6 43.2 5.5In child care services
2017 2.1 0.8 3.3 2.1 1.5 5.2 1.2 10.6 2.12016 1.9 0.7 3.1 2.3 1.5 4.8 1.1 10.8 2.02015 1.8 0.8 2.9 2.4 1.5 4.4 1.0 10.1 1.92014 1.9 0.7 3.3 2.3 1.6 4.8 1.1 11.4 2.1
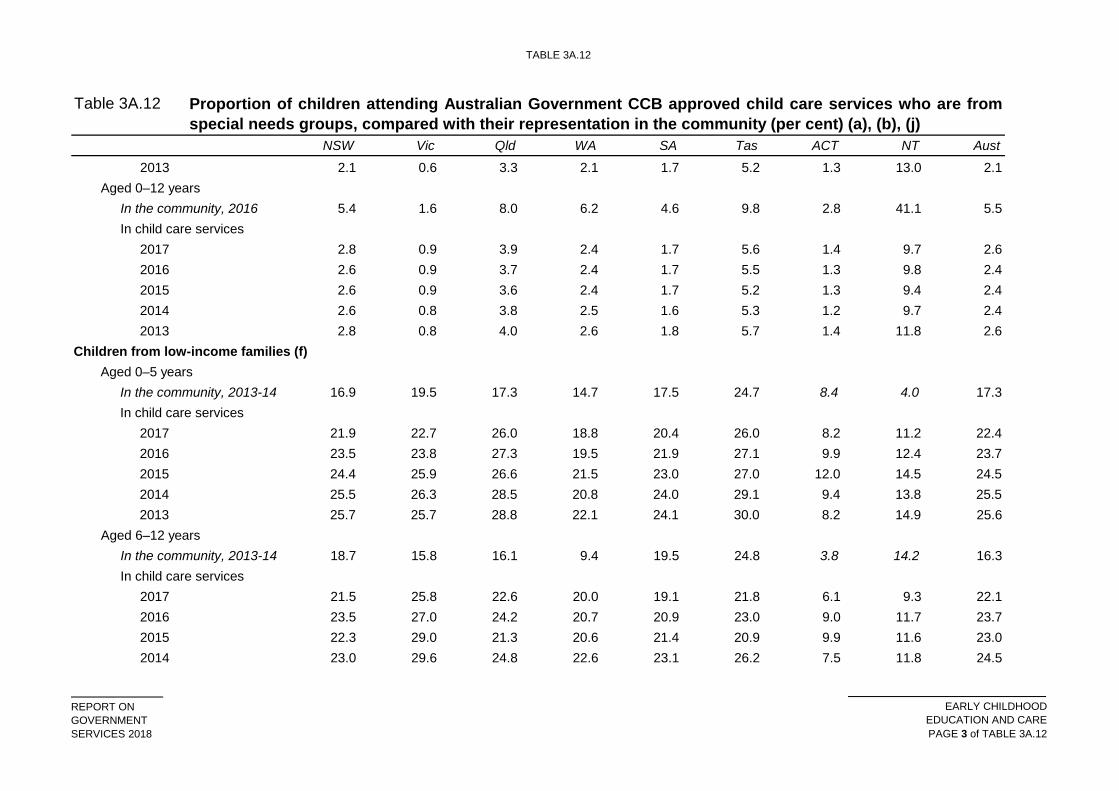
TABLE 3A.12
REPORT ONGOVERNMENTSERVICES 2018
EARLY CHILDHOODEDUCATION AND CAREPAGE 3 of TABLE 3A.12
Table 3A.12
NSW Vic Qld WA SA Tas ACT NT Aust
Proportion of children attending Australian Government CCB approved child care services who are fromspecial needs groups, compared with their representation in the community (per cent) (a), (b), (j)
2013 2.1 0.6 3.3 2.1 1.7 5.2 1.3 13.0 2.1Aged 0–12 years
In the community, 2016 5.4 1.6 8.0 6.2 4.6 9.8 2.8 41.1 5.5In child care services
2017 2.8 0.9 3.9 2.4 1.7 5.6 1.4 9.7 2.62016 2.6 0.9 3.7 2.4 1.7 5.5 1.3 9.8 2.42015 2.6 0.9 3.6 2.4 1.7 5.2 1.3 9.4 2.42014 2.6 0.8 3.8 2.5 1.6 5.3 1.2 9.7 2.42013 2.8 0.8 4.0 2.6 1.8 5.7 1.4 11.8 2.6
Children from low-income families (f)Aged 0–5 years
In the community, 2013-14 16.9 19.5 17.3 14.7 17.5 24.7 8.4 4.0 17.3In child care services
2017 21.9 22.7 26.0 18.8 20.4 26.0 8.2 11.2 22.42016 23.5 23.8 27.3 19.5 21.9 27.1 9.9 12.4 23.72015 24.4 25.9 26.6 21.5 23.0 27.0 12.0 14.5 24.52014 25.5 26.3 28.5 20.8 24.0 29.1 9.4 13.8 25.52013 25.7 25.7 28.8 22.1 24.1 30.0 8.2 14.9 25.6
Aged 6–12 yearsIn the community, 2013-14 18.7 15.8 16.1 9.4 19.5 24.8 3.8 14.2 16.3In child care services
2017 21.5 25.8 22.6 20.0 19.1 21.8 6.1 9.3 22.12016 23.5 27.0 24.2 20.7 20.9 23.0 9.0 11.7 23.72015 22.3 29.0 21.3 20.6 21.4 20.9 9.9 11.6 23.02014 23.0 29.6 24.8 22.6 23.1 26.2 7.5 11.8 24.5
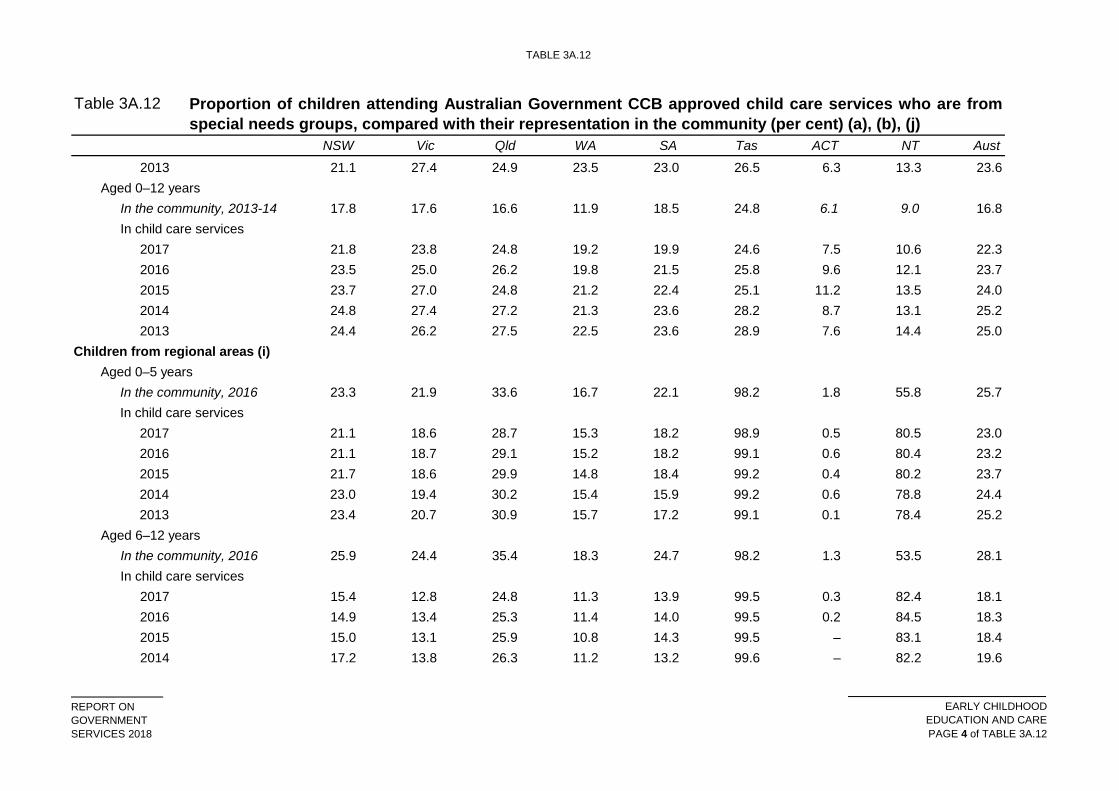
TABLE 3A.12
REPORT ONGOVERNMENTSERVICES 2018
EARLY CHILDHOODEDUCATION AND CAREPAGE 4 of TABLE 3A.12
Table 3A.12
NSW Vic Qld WA SA Tas ACT NT Aust
Proportion of children attending Australian Government CCB approved child care services who are fromspecial needs groups, compared with their representation in the community (per cent) (a), (b), (j)
2013 21.1 27.4 24.9 23.5 23.0 26.5 6.3 13.3 23.6Aged 0–12 years
In the community, 2013-14 17.8 17.6 16.6 11.9 18.5 24.8 6.1 9.0 16.8In child care services
2017 21.8 23.8 24.8 19.2 19.9 24.6 7.5 10.6 22.32016 23.5 25.0 26.2 19.8 21.5 25.8 9.6 12.1 23.72015 23.7 27.0 24.8 21.2 22.4 25.1 11.2 13.5 24.02014 24.8 27.4 27.2 21.3 23.6 28.2 8.7 13.1 25.22013 24.4 26.2 27.5 22.5 23.6 28.9 7.6 14.4 25.0
Children from regional areas (i)Aged 0–5 years
In the community, 2016 23.3 21.9 33.6 16.7 22.1 98.2 1.8 55.8 25.7In child care services
2017 21.1 18.6 28.7 15.3 18.2 98.9 0.5 80.5 23.02016 21.1 18.7 29.1 15.2 18.2 99.1 0.6 80.4 23.22015 21.7 18.6 29.9 14.8 18.4 99.2 0.4 80.2 23.72014 23.0 19.4 30.2 15.4 15.9 99.2 0.6 78.8 24.42013 23.4 20.7 30.9 15.7 17.2 99.1 0.1 78.4 25.2
Aged 6–12 yearsIn the community, 2016 25.9 24.4 35.4 18.3 24.7 98.2 1.3 53.5 28.1In child care services
2017 15.4 12.8 24.8 11.3 13.9 99.5 0.3 82.4 18.12016 14.9 13.4 25.3 11.4 14.0 99.5 0.2 84.5 18.32015 15.0 13.1 25.9 10.8 14.3 99.5 – 83.1 18.42014 17.2 13.8 26.3 11.2 13.2 99.6 – 82.2 19.6
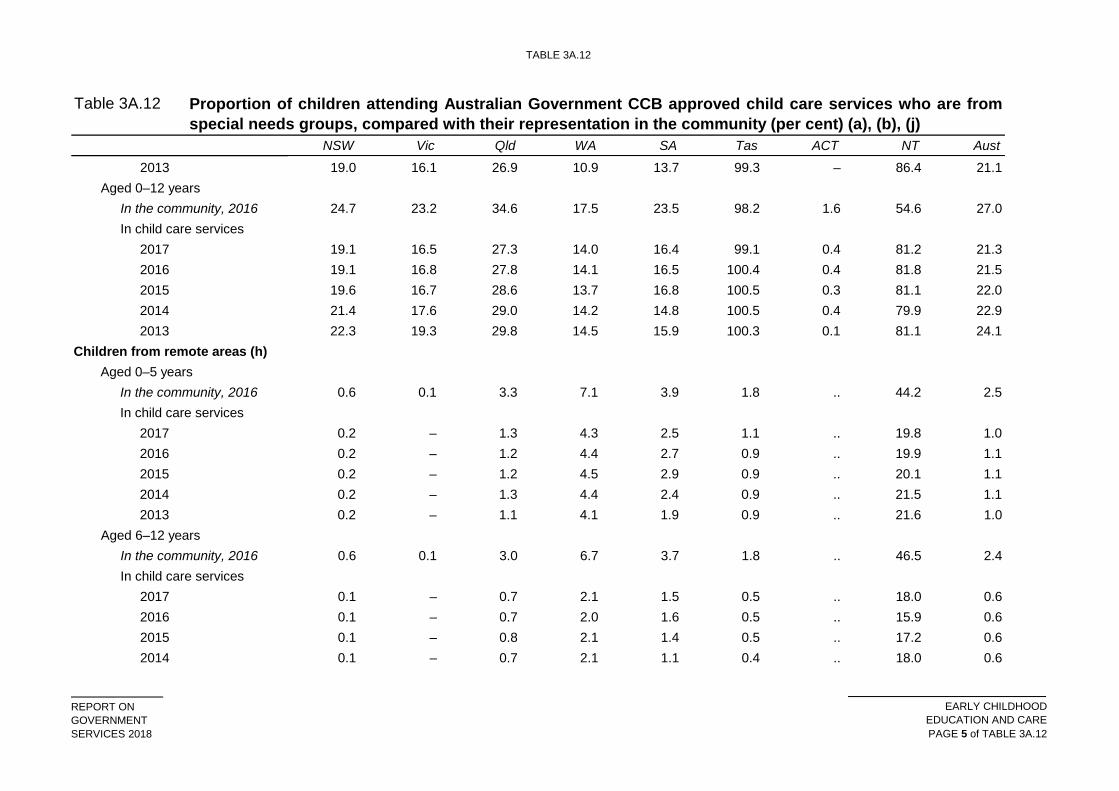
TABLE 3A.12
REPORT ONGOVERNMENTSERVICES 2018
EARLY CHILDHOODEDUCATION AND CAREPAGE 5 of TABLE 3A.12
Table 3A.12
NSW Vic Qld WA SA Tas ACT NT Aust
Proportion of children attending Australian Government CCB approved child care services who are fromspecial needs groups, compared with their representation in the community (per cent) (a), (b), (j)
2013 19.0 16.1 26.9 10.9 13.7 99.3 – 86.4 21.1Aged 0–12 years
In the community, 2016 24.7 23.2 34.6 17.5 23.5 98.2 1.6 54.6 27.0In child care services
2017 19.1 16.5 27.3 14.0 16.4 99.1 0.4 81.2 21.32016 19.1 16.8 27.8 14.1 16.5 100.4 0.4 81.8 21.52015 19.6 16.7 28.6 13.7 16.8 100.5 0.3 81.1 22.02014 21.4 17.6 29.0 14.2 14.8 100.5 0.4 79.9 22.92013 22.3 19.3 29.8 14.5 15.9 100.3 0.1 81.1 24.1
Children from remote areas (h)Aged 0–5 years
In the community, 2016 0.6 0.1 3.3 7.1 3.9 1.8 .. 44.2 2.5In child care services
2017 0.2 – 1.3 4.3 2.5 1.1 .. 19.8 1.02016 0.2 – 1.2 4.4 2.7 0.9 .. 19.9 1.12015 0.2 – 1.2 4.5 2.9 0.9 .. 20.1 1.12014 0.2 – 1.3 4.4 2.4 0.9 .. 21.5 1.12013 0.2 – 1.1 4.1 1.9 0.9 .. 21.6 1.0
Aged 6–12 yearsIn the community, 2016 0.6 0.1 3.0 6.7 3.7 1.8 .. 46.5 2.4In child care services
2017 0.1 – 0.7 2.1 1.5 0.5 .. 18.0 0.62016 0.1 – 0.7 2.0 1.6 0.5 .. 15.9 0.62015 0.1 – 0.8 2.1 1.4 0.5 .. 17.2 0.62014 0.1 – 0.7 2.1 1.1 0.4 .. 18.0 0.6
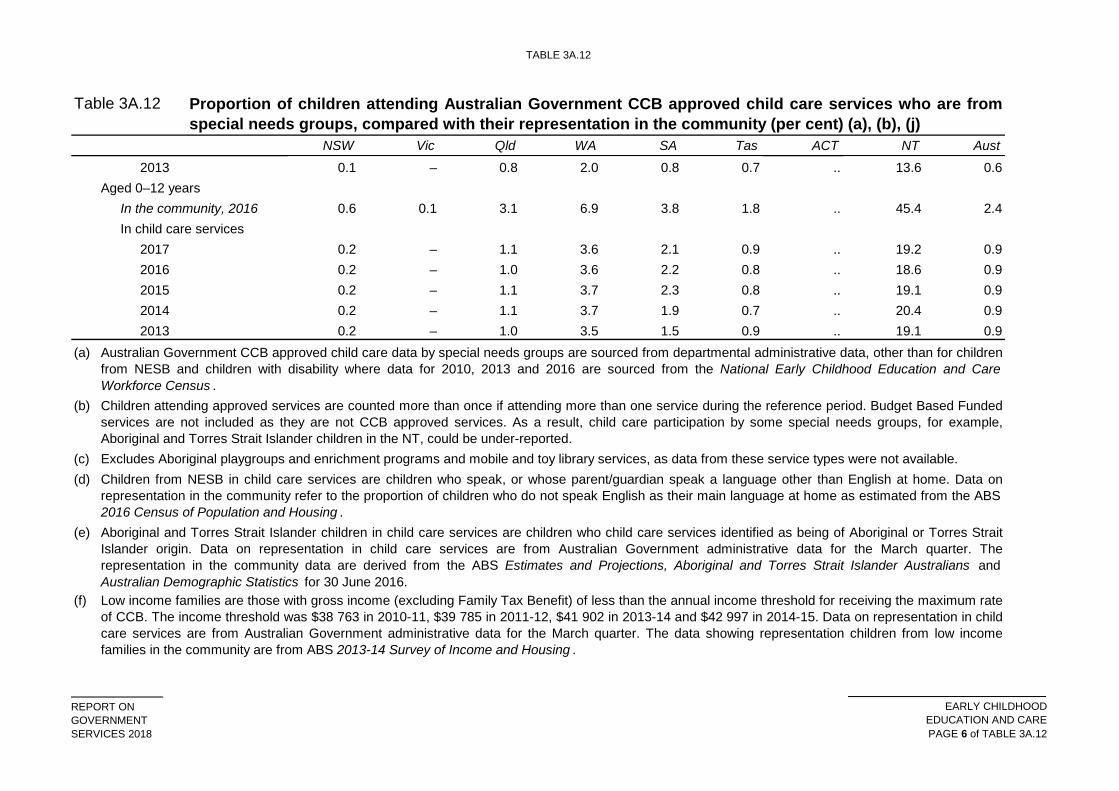
TABLE 3A.12
REPORT ONGOVERNMENTSERVICES 2018
EARLY CHILDHOODEDUCATION AND CAREPAGE 6 of TABLE 3A.12
Table 3A.12
NSW Vic Qld WA SA Tas ACT NT Aust
Proportion of children attending Australian Government CCB approved child care services who are fromspecial needs groups, compared with their representation in the community (per cent) (a), (b), (j)
2013 0.1 – 0.8 2.0 0.8 0.7 .. 13.6 0.6Aged 0–12 years
In the community, 2016 0.6 0.1 3.1 6.9 3.8 1.8 .. 45.4 2.4In child care services
2017 0.2 – 1.1 3.6 2.1 0.9 .. 19.2 0.92016 0.2 – 1.0 3.6 2.2 0.8 .. 18.6 0.92015 0.2 – 1.1 3.7 2.3 0.8 .. 19.1 0.92014 0.2 – 1.1 3.7 1.9 0.7 .. 20.4 0.92013 0.2 – 1.0 3.5 1.5 0.9 .. 19.1 0.9
(a)
(b)
(c) (d)
(e)
(f)
Aboriginal and Torres Strait Islander children in child care services are children who child care services identified as being of Aboriginal or Torres StraitIslander origin. Data on representation in child care services are from Australian Government administrative data for the March quarter. Therepresentation in the community data are derived from the ABS Estimates and Projections, Aboriginal and Torres Strait Islander Australians and Australian Demographic Statistics for 30 June 2016.Low income families are those with gross income (excluding Family Tax Benefit) of less than the annual income threshold for receiving the maximum rateof CCB. The income threshold was $38 763 in 2010-11, $39 785 in 2011-12, $41 902 in 2013-14 and $42 997 in 2014-15. Data on representation in childcare services are from Australian Government administrative data for the March quarter. The data showing representation children from low incomefamilies in the community are from ABS 2013-14 Survey of Income and Housing .
Australian Government CCB approved child care data by special needs groups are sourced from departmental administrative data, other than for childrenfrom NESB and children with disability where data for 2010, 2013 and 2016 are sourced from the National Early Childhood Education and CareWorkforce Census .Children attending approved services are counted more than once if attending more than one service during the reference period. Budget Based Fundedservices are not included as they are not CCB approved services. As a result, child care participation by some special needs groups, for example,Aboriginal and Torres Strait Islander children in the NT, could be under-reported. Excludes Aboriginal playgroups and enrichment programs and mobile and toy library services, as data from these service types were not available.Children from NESB in child care services are children who speak, or whose parent/guardian speak a language other than English at home. Data onrepresentation in the community refer to the proportion of children who do not speak English as their main language at home as estimated from the ABS2016 Census of Population and Housing .
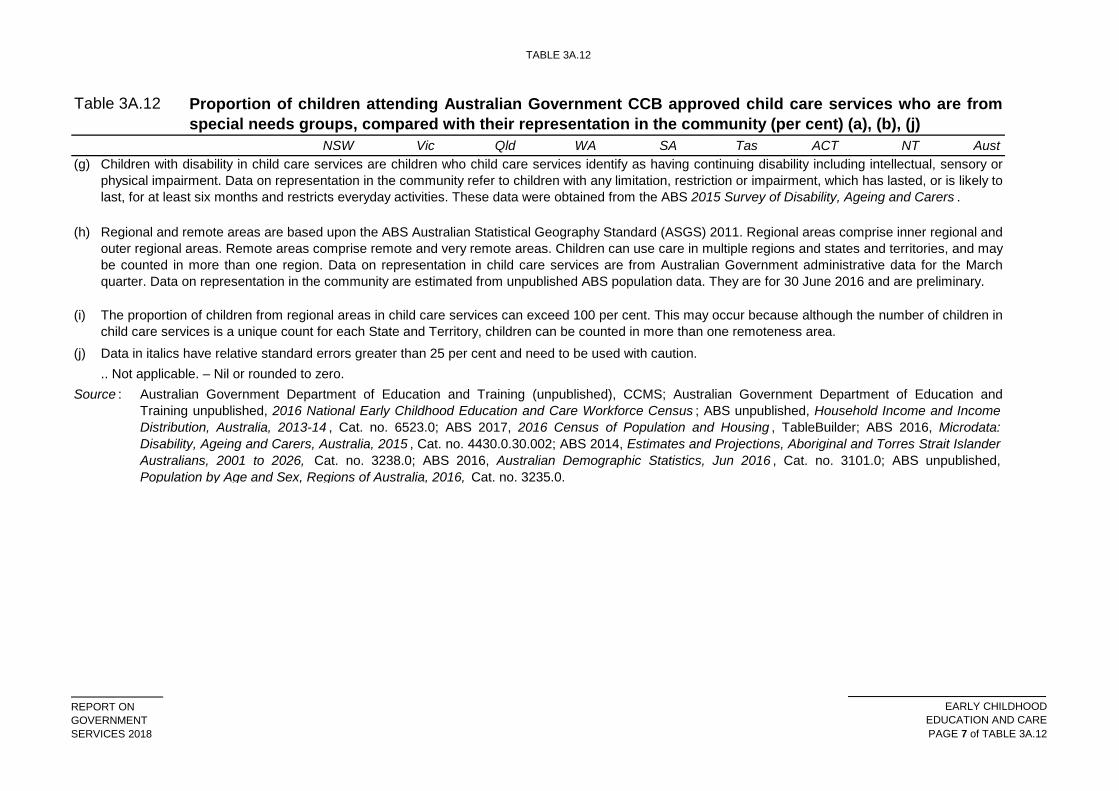
TABLE 3A.12
REPORT ONGOVERNMENTSERVICES 2018
EARLY CHILDHOODEDUCATION AND CAREPAGE 7 of TABLE 3A.12
Table 3A.12
NSW Vic Qld WA SA Tas ACT NT Aust
Proportion of children attending Australian Government CCB approved child care services who are fromspecial needs groups, compared with their representation in the community (per cent) (a), (b), (j)
(g)
(h)
(i)
(j)
Source :
Data in italics have relative standard errors greater than 25 per cent and need to be used with caution... Not applicable. – Nil or rounded to zero.
Australian Government Department of Education and Training (unpublished), CCMS; Australian Government Department of Education andTraining unpublished, 2016 National Early Childhood Education and Care Workforce Census ; ABS unpublished, Household Income and IncomeDistribution, Australia, 2013-14 , Cat. no. 6523.0; ABS 2017, 2016 Census of Population and Housing , TableBuilder; ABS 2016, Microdata: Disability, Ageing and Carers, Australia, 2015 , Cat. no. 4430.0.30.002; ABS 2014, Estimates and Projections, Aboriginal and Torres Strait IslanderAustralians, 2001 to 2026, Cat. no. 3238.0; ABS 2016, Australian Demographic Statistics, Jun 2016 , Cat. no. 3101.0; ABS unpublished,Population by Age and Sex, Regions of Australia, 2016, Cat. no. 3235.0.
Children with disability in child care services are children who child care services identify as having continuing disability including intellectual, sensory orphysical impairment. Data on representation in the community refer to children with any limitation, restriction or impairment, which has lasted, or is likely tolast, for at least six months and restricts everyday activities. These data were obtained from the ABS 2015 Survey of Disability, Ageing and Carers .
Regional and remote areas are based upon the ABS Australian Statistical Geography Standard (ASGS) 2011. Regional areas comprise inner regional andouter regional areas. Remote areas comprise remote and very remote areas. Children can use care in multiple regions and states and territories, and maybe counted in more than one region. Data on representation in child care services are from Australian Government administrative data for the Marchquarter. Data on representation in the community are estimated from unpublished ABS population data. They are for 30 June 2016 and are preliminary.
The proportion of children from regional areas in child care services can exceed 100 per cent. This may occur because although the number of children inchild care services is a unique count for each State and Territory, children can be counted in more than one remoteness area.
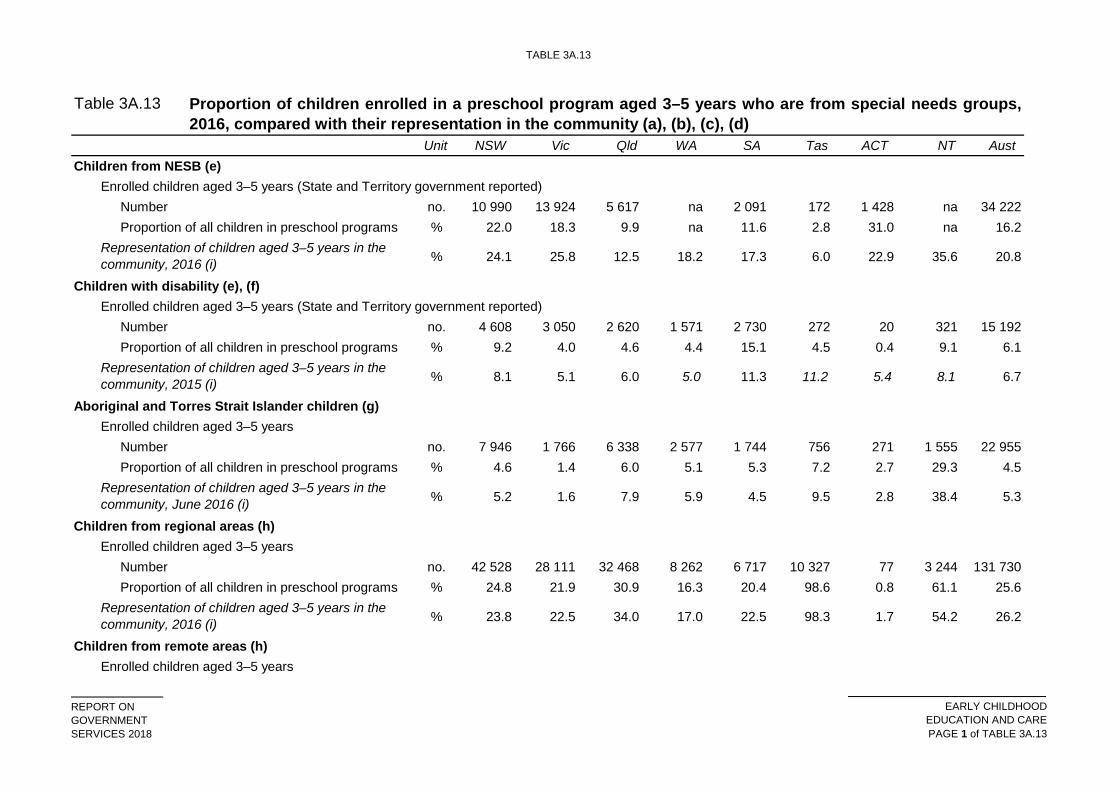
TABLE 3A.13
REPORT ONGOVERNMENTSERVICES 2018
EARLY CHILDHOODEDUCATION AND CAREPAGE 1 of TABLE 3A.13
Table 3A.13
Unit NSW Vic Qld WA SA Tas ACT NT Aust Children from NESB (e)
Enrolled children aged 3–5 years (State and Territory government reported) Number no. 10 990 13 924 5 617 na 2 091 172 1 428 na 34 222Proportion of all children in preschool programs % 22.0 18.3 9.9 na 11.6 2.8 31.0 na 16.2
% 24.1 25.8 12.5 18.2 17.3 6.0 22.9 35.6 20.8
Children with disability (e), (f)Enrolled children aged 3–5 years (State and Territory government reported)
Number no. 4 608 3 050 2 620 1 571 2 730 272 20 321 15 192Proportion of all children in preschool programs % 9.2 4.0 4.6 4.4 15.1 4.5 0.4 9.1 6.1
% 8.1 5.1 6.0 5.0 11.3 11.2 5.4 8.1 6.7
Aboriginal and Torres Strait Islander children (g)Enrolled children aged 3–5 years
Number no. 7 946 1 766 6 338 2 577 1 744 756 271 1 555 22 955Proportion of all children in preschool programs % 4.6 1.4 6.0 5.1 5.3 7.2 2.7 29.3 4.5
% 5.2 1.6 7.9 5.9 4.5 9.5 2.8 38.4 5.3
Children from regional areas (h)Enrolled children aged 3–5 years
Number no. 42 528 28 111 32 468 8 262 6 717 10 327 77 3 244 131 730Proportion of all children in preschool programs % 24.8 21.9 30.9 16.3 20.4 98.6 0.8 61.1 25.6
% 23.8 22.5 34.0 17.0 22.5 98.3 1.7 54.2 26.2
Children from remote areas (h)Enrolled children aged 3–5 years
Proportion of children enrolled in a preschool program aged 3–5 years who are from special needs groups,2016, compared with their representation in the community (a), (b), (c), (d)
Representation of children aged 3–5 years in the community, 2016 (i)
Representation of children aged 3–5 years in the community, 2015 (i)
Representation of children aged 3–5 years in the community, June 2016 (i)
Representation of children aged 3–5 years in the community, 2016 (i)
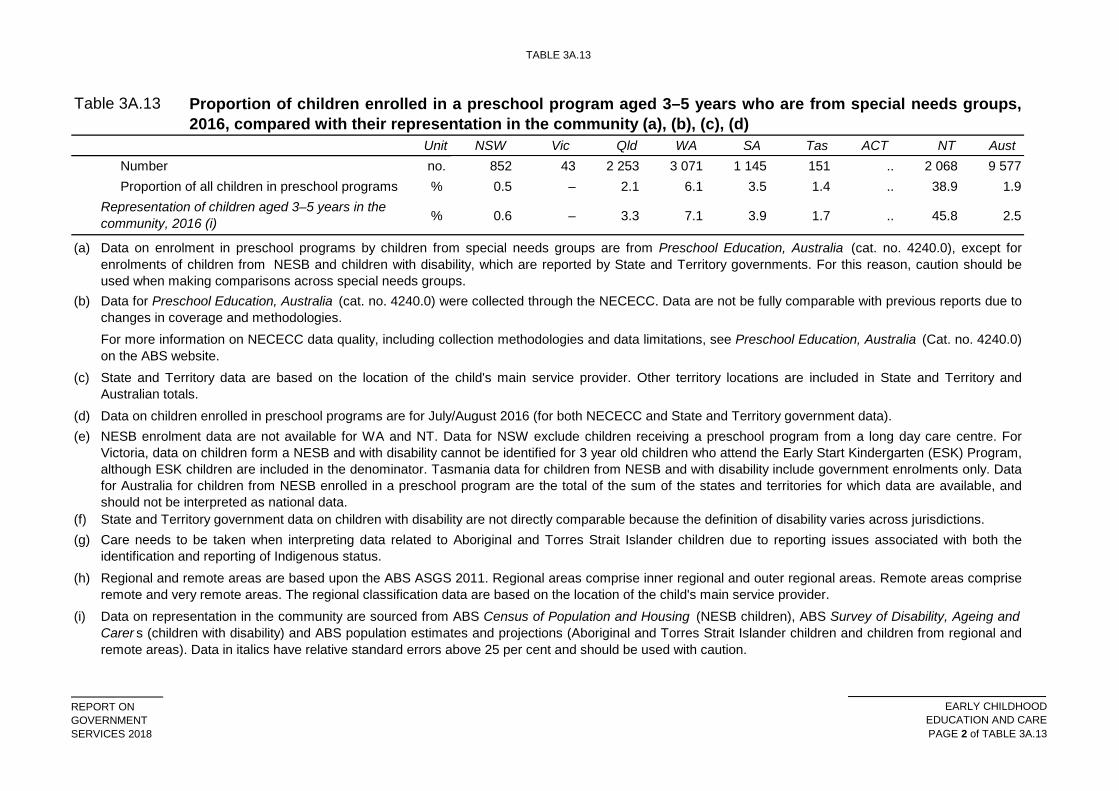
TABLE 3A.13
REPORT ONGOVERNMENTSERVICES 2018
EARLY CHILDHOODEDUCATION AND CAREPAGE 2 of TABLE 3A.13
Table 3A.13
Unit NSW Vic Qld WA SA Tas ACT NT Aust
Proportion of children enrolled in a preschool program aged 3–5 years who are from special needs groups,2016, compared with their representation in the community (a), (b), (c), (d)
Number no. 852 43 2 253 3 071 1 145 151 .. 2 068 9 577Proportion of all children in preschool programs % 0.5 – 2.1 6.1 3.5 1.4 .. 38.9 1.9
% 0.6 – 3.3 7.1 3.9 1.7 .. 45.8 2.5
(a)
(b)
(c)
(d)(e)
(f)(g)
(h)
(i)
Care needs to be taken when interpreting data related to Aboriginal and Torres Strait Islander children due to reporting issues associated with both theidentification and reporting of Indigenous status.
For more information on NECECC data quality, including collection methodologies and data limitations, see Preschool Education, Australia (Cat. no. 4240.0)on the ABS website.
Data on representation in the community are sourced from ABS Census of Population and Housing (NESB children), ABS Survey of Disability, Ageing andCarer s (children with disability) and ABS population estimates and projections (Aboriginal and Torres Strait Islander children and children from regional andremote areas). Data in italics have relative standard errors above 25 per cent and should be used with caution.
State and Territory government data on children with disability are not directly comparable because the definition of disability varies across jurisdictions.
Data on children enrolled in preschool programs are for July/August 2016 (for both NECECC and State and Territory government data).
Data on enrolment in preschool programs by children from special needs groups are from Preschool Education, Australia (cat. no. 4240.0), except forenrolments of children from NESB and children with disability, which are reported by State and Territory governments. For this reason, caution should beused when making comparisons across special needs groups.
NESB enrolment data are not available for WA and NT. Data for NSW exclude children receiving a preschool program from a long day care centre. ForVictoria, data on children form a NESB and with disability cannot be identified for 3 year old children who attend the Early Start Kindergarten (ESK) Program,although ESK children are included in the denominator. Tasmania data for children from NESB and with disability include government enrolments only. Datafor Australia for children from NESB enrolled in a preschool program are the total of the sum of the states and territories for which data are available, andshould not be interpreted as national data.
Representation of children aged 3–5 years in the community, 2016 (i)
Regional and remote areas are based upon the ABS ASGS 2011. Regional areas comprise inner regional and outer regional areas. Remote areas compriseremote and very remote areas. The regional classification data are based on the location of the child's main service provider.
Data for Preschool Education, Australia (cat. no. 4240.0) were collected through the NECECC. Data are not be fully comparable with previous reports due tochanges in coverage and methodologies.
State and Territory data are based on the location of the child's main service provider. Other territory locations are included in State and Territory andAustralian totals.
TABLE 3A.13
REPORT ONGOVERNMENTSERVICES 2018
EARLY CHILDHOODEDUCATION AND CAREPAGE 3 of TABLE 3A.13
Table 3A.13
Unit NSW Vic Qld WA SA Tas ACT NT Aust
Proportion of children enrolled in a preschool program aged 3–5 years who are from special needs groups,2016, compared with their representation in the community (a), (b), (c), (d)
Source :na Not available. .. Not applicable. – Nil or rounded to zero.
ABS 2017, Preschool Education, Australia, 2016, Cat. no. 4240.0; ABS 2017, 2016 Census of Population and Housing , TableBuilder; ABS 2016,Microdata: Disability, Ageing and Carers, Australia, 2015 , Cat. no. 4430.0.30.002; ABS 2014, Estimates and Projections, Aboriginal and Torres StraitIslander Australians, 2001 to 2026, Cat. no. 3238.0; ABS unpublished, Australian Demographic Statistics, Jun 2016, Cat. no. 3101.0; ABSunpublished, Population by Age and Sex, Regions of Australia, 2016 , Cat. no. 3235.0; State and Territory governments unpublished.
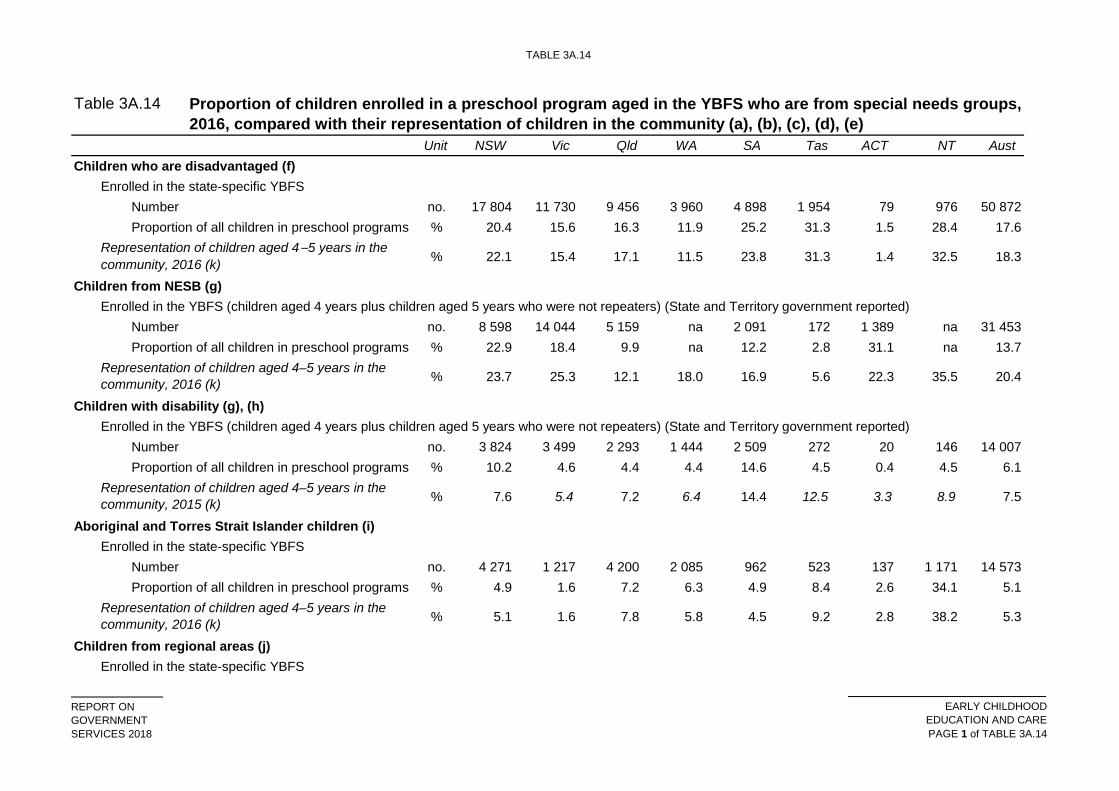
TABLE 3A.14
REPORT ONGOVERNMENTSERVICES 2018
EARLY CHILDHOODEDUCATION AND CAREPAGE 1 of TABLE 3A.14
Table 3A.14
Unit NSW Vic Qld WA SA Tas ACT NT Aust Children who are disadvantaged (f)
Enrolled in the state-specific YBFSNumber no. 17 804 11 730 9 456 3 960 4 898 1 954 79 976 50 872Proportion of all children in preschool programs % 20.4 15.6 16.3 11.9 25.2 31.3 1.5 28.4 17.6
% 22.1 15.4 17.1 11.5 23.8 31.3 1.4 32.5 18.3
Children from NESB (g)Enrolled in the YBFS (children aged 4 years plus children aged 5 years who were not repeaters) (State and Territory government reported)
Number no. 8 598 14 044 5 159 na 2 091 172 1 389 na 31 453Proportion of all children in preschool programs % 22.9 18.4 9.9 na 12.2 2.8 31.1 na 13.7
% 23.7 25.3 12.1 18.0 16.9 5.6 22.3 35.5 20.4
Children with disability (g), (h)Enrolled in the YBFS (children aged 4 years plus children aged 5 years who were not repeaters) (State and Territory government reported)
Number no. 3 824 3 499 2 293 1 444 2 509 272 20 146 14 007Proportion of all children in preschool programs % 10.2 4.6 4.4 4.4 14.6 4.5 0.4 4.5 6.1
% 7.6 5.4 7.2 6.4 14.4 12.5 3.3 8.9 7.5
Aboriginal and Torres Strait Islander children (i)Enrolled in the state-specific YBFS
Number no. 4 271 1 217 4 200 2 085 962 523 137 1 171 14 573Proportion of all children in preschool programs % 4.9 1.6 7.2 6.3 4.9 8.4 2.6 34.1 5.1
% 5.1 1.6 7.8 5.8 4.5 9.2 2.8 38.2 5.3
Children from regional areas (j)Enrolled in the state-specific YBFS
Proportion of children enrolled in a preschool program aged in the YBFS who are from special needs groups,2016, compared with their representation of children in the community (a), (b), (c), (d), (e)
Representation of children aged 4–5 years in the community, 2016 (k)
Representation of children aged 4–5 years in the community, 2015 (k)
Representation of children aged 4–5 years in the community, 2016 (k)
Representation of children aged 4 –5 years in the community, 2016 (k)
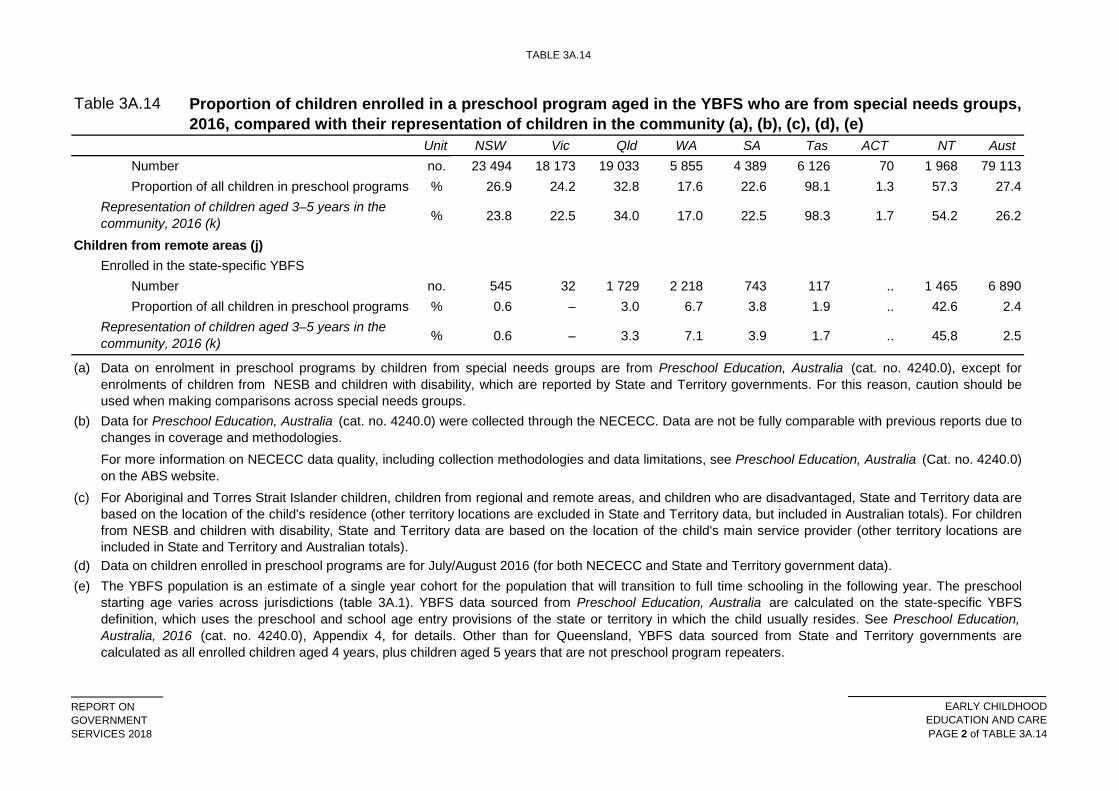
TABLE 3A.14
REPORT ONGOVERNMENTSERVICES 2018
EARLY CHILDHOODEDUCATION AND CAREPAGE 2 of TABLE 3A.14
Table 3A.14
Unit NSW Vic Qld WA SA Tas ACT NT Aust
Proportion of children enrolled in a preschool program aged in the YBFS who are from special needs groups,2016, compared with their representation of children in the community (a), (b), (c), (d), (e)
Number no. 23 494 18 173 19 033 5 855 4 389 6 126 70 1 968 79 113Proportion of all children in preschool programs % 26.9 24.2 32.8 17.6 22.6 98.1 1.3 57.3 27.4
% 23.8 22.5 34.0 17.0 22.5 98.3 1.7 54.2 26.2
Children from remote areas (j)Enrolled in the state-specific YBFS
Number no. 545 32 1 729 2 218 743 117 .. 1 465 6 890Proportion of all children in preschool programs % 0.6 – 3.0 6.7 3.8 1.9 .. 42.6 2.4
% 0.6 – 3.3 7.1 3.9 1.7 .. 45.8 2.5
(a)
(b)
(c)
(d)(e)
For more information on NECECC data quality, including collection methodologies and data limitations, see Preschool Education, Australia (Cat. no. 4240.0)on the ABS website.
Data for Preschool Education, Australia (cat. no. 4240.0) were collected through the NECECC. Data are not be fully comparable with previous reports due tochanges in coverage and methodologies.
Representation of children aged 3–5 years in the community, 2016 (k)
Representation of children aged 3–5 years in the community, 2016 (k)
Data on enrolment in preschool programs by children from special needs groups are from Preschool Education, Australia (cat. no. 4240.0), except forenrolments of children from NESB and children with disability, which are reported by State and Territory governments. For this reason, caution should beused when making comparisons across special needs groups.
For Aboriginal and Torres Strait Islander children, children from regional and remote areas, and children who are disadvantaged, State and Territory data arebased on the location of the child's residence (other territory locations are excluded in State and Territory data, but included in Australian totals). For childrenfrom NESB and children with disability, State and Territory data are based on the location of the child's main service provider (other territory locations areincluded in State and Territory and Australian totals).
The YBFS population is an estimate of a single year cohort for the population that will transition to full time schooling in the following year. The preschoolstarting age varies across jurisdictions (table 3A.1). YBFS data sourced from Preschool Education, Australia are calculated on the state-specific YBFSdefinition, which uses the preschool and school age entry provisions of the state or territory in which the child usually resides. See Preschool Education,Australia, 2016 (cat. no. 4240.0), Appendix 4, for details. Other than for Queensland, YBFS data sourced from State and Territory governments arecalculated as all enrolled children aged 4 years, plus children aged 5 years that are not preschool program repeaters.
Data on children enrolled in preschool programs are for July/August 2016 (for both NECECC and State and Territory government data).
TABLE 3A.14
REPORT ONGOVERNMENTSERVICES 2018
EARLY CHILDHOODEDUCATION AND CAREPAGE 3 of TABLE 3A.14
Table 3A.14
Unit NSW Vic Qld WA SA Tas ACT NT Aust
Proportion of children enrolled in a preschool program aged in the YBFS who are from special needs groups,2016, compared with their representation of children in the community (a), (b), (c), (d), (e)
(f)
(g)
(h)(i)
(j)
(k)•
••
•
Source :
Data on representation in the community are sourced from:
na Not available. .. Not applicable. – Nil or rounded to zero.ABS 2017, Preschool Education, Australia, 2016, Cat. no. 4240.0, data derived from TableBuilder; ABS 2017, 2016 Census of Population andHousing , TableBuilder; ABS 2016, Microdata: Disability, Ageing and Carers, Australia, 2015 , Cat. no. 4430.0.30.002; ABS 2014, Estimates andProjections, Aboriginal and Torres Strait Islander Australians, 2001 to 2026, Cat. no. 3238.0; ABS unpublished, Australian Demographic Statistics,Jun 2016, Cat. no. 3101.0; ABS unpublished, Population by Age and Sex, Regions of Australia, 2016 , Cat. no. 3235.0; State and Territorygovernments unpublished.
Disadvantage is defined for this measure to be children residing in an area with a Socio-Economic Indexes for Areas (SEIFA) Index of Relative Socio-Economic Disadvantage (IRSD) quintile of 1. SEIFA IRSD has been derived at the Statistical Area Level 1 and disaggregated into quintiles. Areas with aSEIFA IRSD quintile of 1 are not evenly distributed across Australia. Caution should be used when interpreting the IRSD counts for the ACT due to thedistributed nature of the ACT population.
NESB Children: ABS Census of Population and Housing.Children with disability: ABS Survey of Disability, Ageing and Carers. Data in italics have relative standard errors above 25 per cent and should be usedwith caution. Aboriginal and Torres Strait Islander children and children from regional and remote areas: ABS population estimates and projections.
Children who are disadvantaged: Estimates are preliminary for 30 June and have been aggregated based on Statistical Areas Level 1. Calculated as theproportion of 4 and 5 year olds in the community who reside in SEIFA IRSD quintile of 1.
NESB enrolment data are not available for WA and NT. Data for NSW exclude children receiving a preschool program from a long day care centre. ForVictoria, data on children form a NESB and with disability cannot be identified for 3 year old children who attend the ESK Program, although ESK children areincluded in the denominator. Tasmania data for children from NESB and with disability include government enrolments only. Data for Australia for childrenfrom NESB enrolled in a preschool program are the total of the sum of the states and territories for which data are available, and should not be interpreted asnational data. State and Territory government data on children with disability are not directly comparable because the definition of disability varies across jurisdictions.Care needs to be taken when interpreting data related to Aboriginal and Torres Strait Islander children due to reporting issues associated with both theidentification and reporting of Indigenous status.Regional and remote areas are based upon the ABS ASGS 2011. Regional areas comprise inner regional and outer regional areas. Remote areas compriseremote and very remote areas. The regional classification data are based on the location of the child's residence.
CHILDREN USING CHILDCARE
REPORT ONGOVERNMENTSERVICES 2018
EARLY CHILDHOODEDUCATION AND CARE
PAGE 1 of CHILDREN USING CHILDCARE
Children using childcare
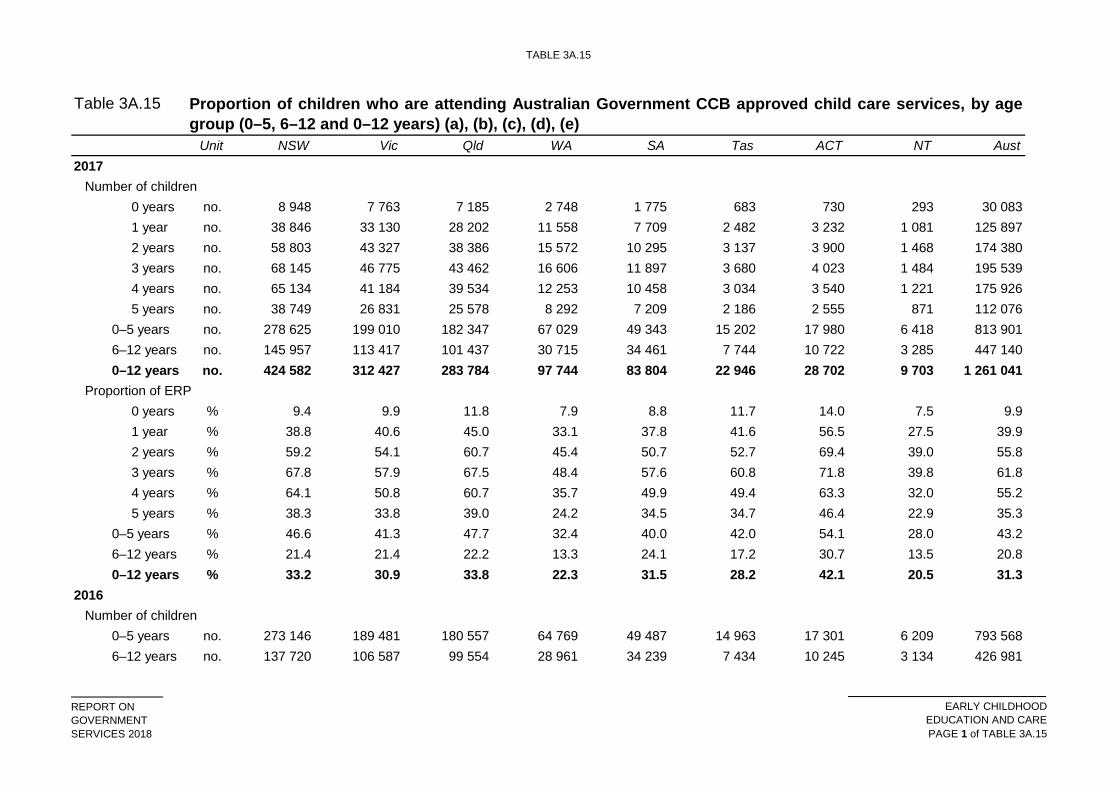
TABLE 3A.15
REPORT ONGOVERNMENTSERVICES 2018
EARLY CHILDHOODEDUCATION AND CAREPAGE 1 of TABLE 3A.15
Table 3A.15
Unit NSW Vic Qld WA SA Tas ACT NT Aust2017
Number of children 0 years no. 8 948 7 763 7 185 2 748 1 775 683 730 293 30 0831 year no. 38 846 33 130 28 202 11 558 7 709 2 482 3 232 1 081 125 8972 years no. 58 803 43 327 38 386 15 572 10 295 3 137 3 900 1 468 174 3803 years no. 68 145 46 775 43 462 16 606 11 897 3 680 4 023 1 484 195 5394 years no. 65 134 41 184 39 534 12 253 10 458 3 034 3 540 1 221 175 9265 years no. 38 749 26 831 25 578 8 292 7 209 2 186 2 555 871 112 076
0–5 years no. 278 625 199 010 182 347 67 029 49 343 15 202 17 980 6 418 813 9016–12 years no. 145 957 113 417 101 437 30 715 34 461 7 744 10 722 3 285 447 1400–12 years no. 424 582 312 427 283 784 97 744 83 804 22 946 28 702 9 703 1 261 041
Proportion of ERP0 years % 9.4 9.9 11.8 7.9 8.8 11.7 14.0 7.5 9.91 year % 38.8 40.6 45.0 33.1 37.8 41.6 56.5 27.5 39.92 years % 59.2 54.1 60.7 45.4 50.7 52.7 69.4 39.0 55.83 years % 67.8 57.9 67.5 48.4 57.6 60.8 71.8 39.8 61.84 years % 64.1 50.8 60.7 35.7 49.9 49.4 63.3 32.0 55.25 years % 38.3 33.8 39.0 24.2 34.5 34.7 46.4 22.9 35.3
0–5 years % 46.6 41.3 47.7 32.4 40.0 42.0 54.1 28.0 43.26–12 years % 21.4 21.4 22.2 13.3 24.1 17.2 30.7 13.5 20.80–12 years % 33.2 30.9 33.8 22.3 31.5 28.2 42.1 20.5 31.3
2016 Number of children
0–5 years no. 273 146 189 481 180 557 64 769 49 487 14 963 17 301 6 209 793 5686–12 years no. 137 720 106 587 99 554 28 961 34 239 7 434 10 245 3 134 426 981
Proportion of children who are attending Australian Government CCB approved child care services, by agegroup (0–5, 6–12 and 0–12 years) (a), (b), (c), (d), (e)
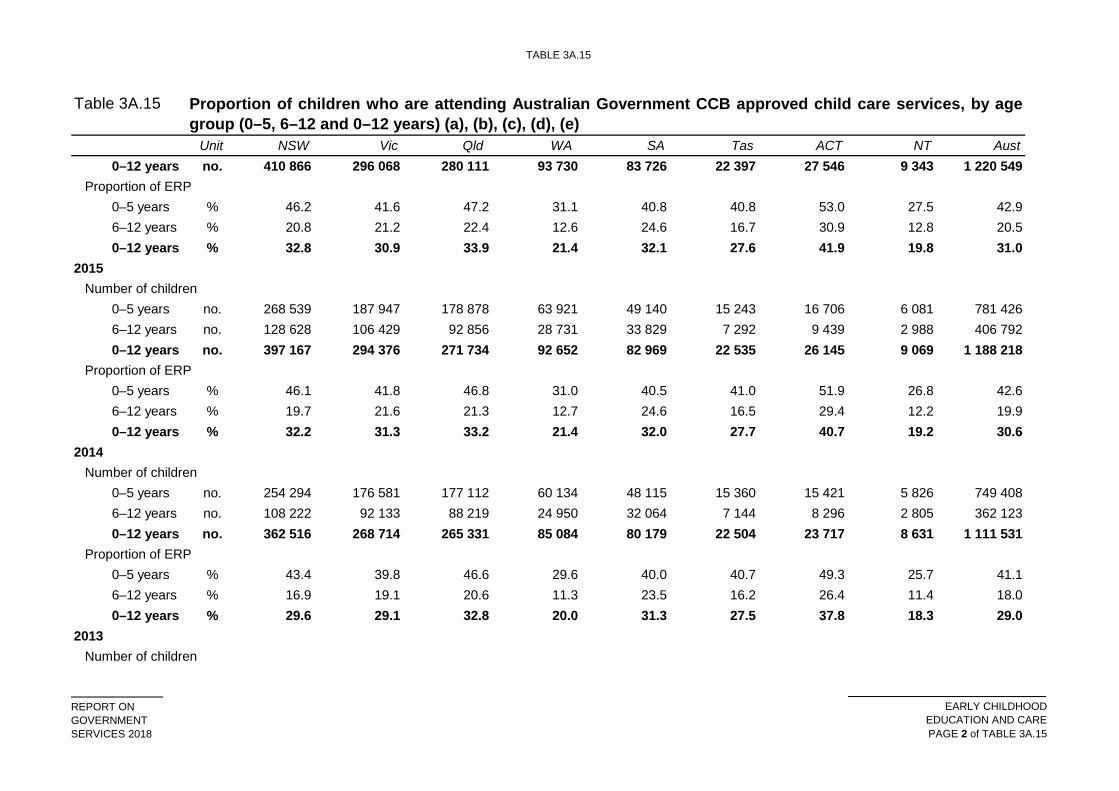
TABLE 3A.15
REPORT ONGOVERNMENTSERVICES 2018
EARLY CHILDHOODEDUCATION AND CAREPAGE 2 of TABLE 3A.15
Table 3A.15
Unit NSW Vic Qld WA SA Tas ACT NT Aust
Proportion of children who are attending Australian Government CCB approved child care services, by agegroup (0–5, 6–12 and 0–12 years) (a), (b), (c), (d), (e)
0–12 years no. 410 866 296 068 280 111 93 730 83 726 22 397 27 546 9 343 1 220 549Proportion of ERP
0–5 years % 46.2 41.6 47.2 31.1 40.8 40.8 53.0 27.5 42.96–12 years % 20.8 21.2 22.4 12.6 24.6 16.7 30.9 12.8 20.50–12 years % 32.8 30.9 33.9 21.4 32.1 27.6 41.9 19.8 31.0
2015 Number of children
0–5 years no. 268 539 187 947 178 878 63 921 49 140 15 243 16 706 6 081 781 4266–12 years no. 128 628 106 429 92 856 28 731 33 829 7 292 9 439 2 988 406 7920–12 years no. 397 167 294 376 271 734 92 652 82 969 22 535 26 145 9 069 1 188 218
Proportion of ERP0–5 years % 46.1 41.8 46.8 31.0 40.5 41.0 51.9 26.8 42.66–12 years % 19.7 21.6 21.3 12.7 24.6 16.5 29.4 12.2 19.90–12 years % 32.2 31.3 33.2 21.4 32.0 27.7 40.7 19.2 30.6
2014 Number of children
0–5 years no. 254 294 176 581 177 112 60 134 48 115 15 360 15 421 5 826 749 4086–12 years no. 108 222 92 133 88 219 24 950 32 064 7 144 8 296 2 805 362 1230–12 years no. 362 516 268 714 265 331 85 084 80 179 22 504 23 717 8 631 1 111 531
Proportion of ERP0–5 years % 43.4 39.8 46.6 29.6 40.0 40.7 49.3 25.7 41.16–12 years % 16.9 19.1 20.6 11.3 23.5 16.2 26.4 11.4 18.00–12 years % 29.6 29.1 32.8 20.0 31.3 27.5 37.8 18.3 29.0
2013 Number of children
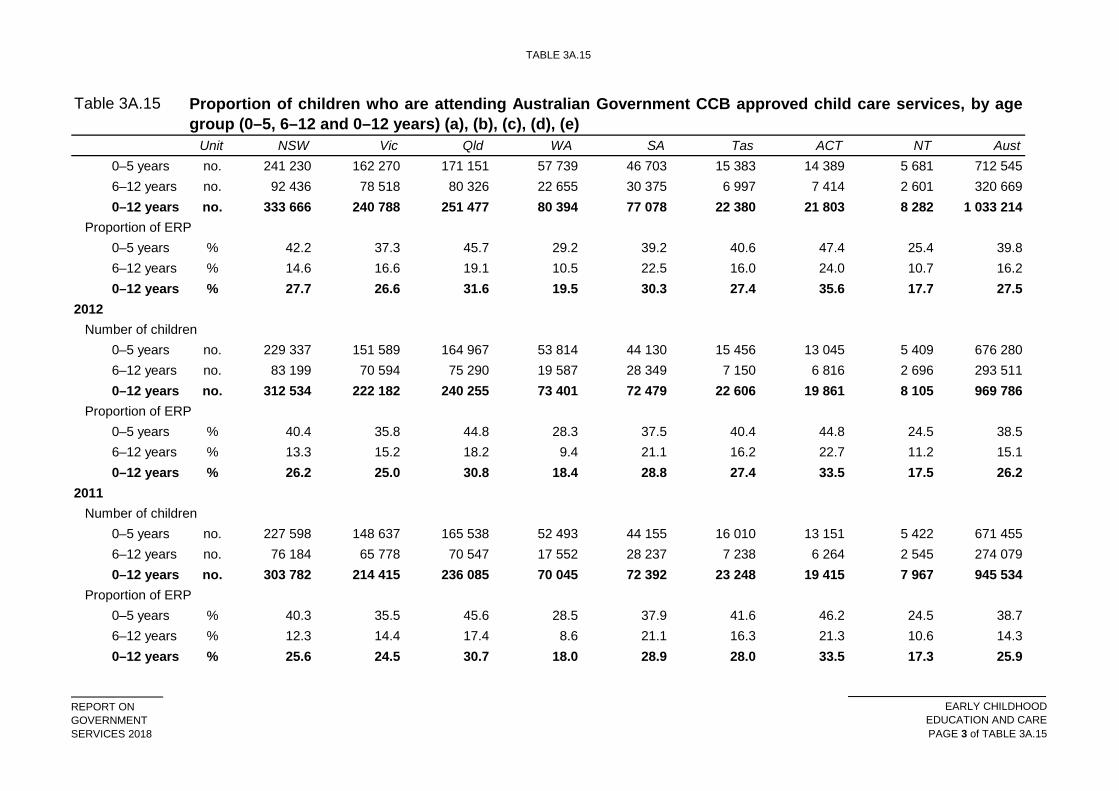
TABLE 3A.15
REPORT ONGOVERNMENTSERVICES 2018
EARLY CHILDHOODEDUCATION AND CAREPAGE 3 of TABLE 3A.15
Table 3A.15
Unit NSW Vic Qld WA SA Tas ACT NT Aust
Proportion of children who are attending Australian Government CCB approved child care services, by agegroup (0–5, 6–12 and 0–12 years) (a), (b), (c), (d), (e)
0–5 years no. 241 230 162 270 171 151 57 739 46 703 15 383 14 389 5 681 712 5456–12 years no. 92 436 78 518 80 326 22 655 30 375 6 997 7 414 2 601 320 6690–12 years no. 333 666 240 788 251 477 80 394 77 078 22 380 21 803 8 282 1 033 214
Proportion of ERP0–5 years % 42.2 37.3 45.7 29.2 39.2 40.6 47.4 25.4 39.86–12 years % 14.6 16.6 19.1 10.5 22.5 16.0 24.0 10.7 16.20–12 years % 27.7 26.6 31.6 19.5 30.3 27.4 35.6 17.7 27.5
2012 Number of children
0–5 years no. 229 337 151 589 164 967 53 814 44 130 15 456 13 045 5 409 676 2806–12 years no. 83 199 70 594 75 290 19 587 28 349 7 150 6 816 2 696 293 5110–12 years no. 312 534 222 182 240 255 73 401 72 479 22 606 19 861 8 105 969 786
Proportion of ERP0–5 years % 40.4 35.8 44.8 28.3 37.5 40.4 44.8 24.5 38.56–12 years % 13.3 15.2 18.2 9.4 21.1 16.2 22.7 11.2 15.10–12 years % 26.2 25.0 30.8 18.4 28.8 27.4 33.5 17.5 26.2
2011 Number of children
0–5 years no. 227 598 148 637 165 538 52 493 44 155 16 010 13 151 5 422 671 4556–12 years no. 76 184 65 778 70 547 17 552 28 237 7 238 6 264 2 545 274 0790–12 years no. 303 782 214 415 236 085 70 045 72 392 23 248 19 415 7 967 945 534
Proportion of ERP0–5 years % 40.3 35.5 45.6 28.5 37.9 41.6 46.2 24.5 38.76–12 years % 12.3 14.4 17.4 8.6 21.1 16.3 21.3 10.6 14.30–12 years % 25.6 24.5 30.7 18.0 28.9 28.0 33.5 17.3 25.9
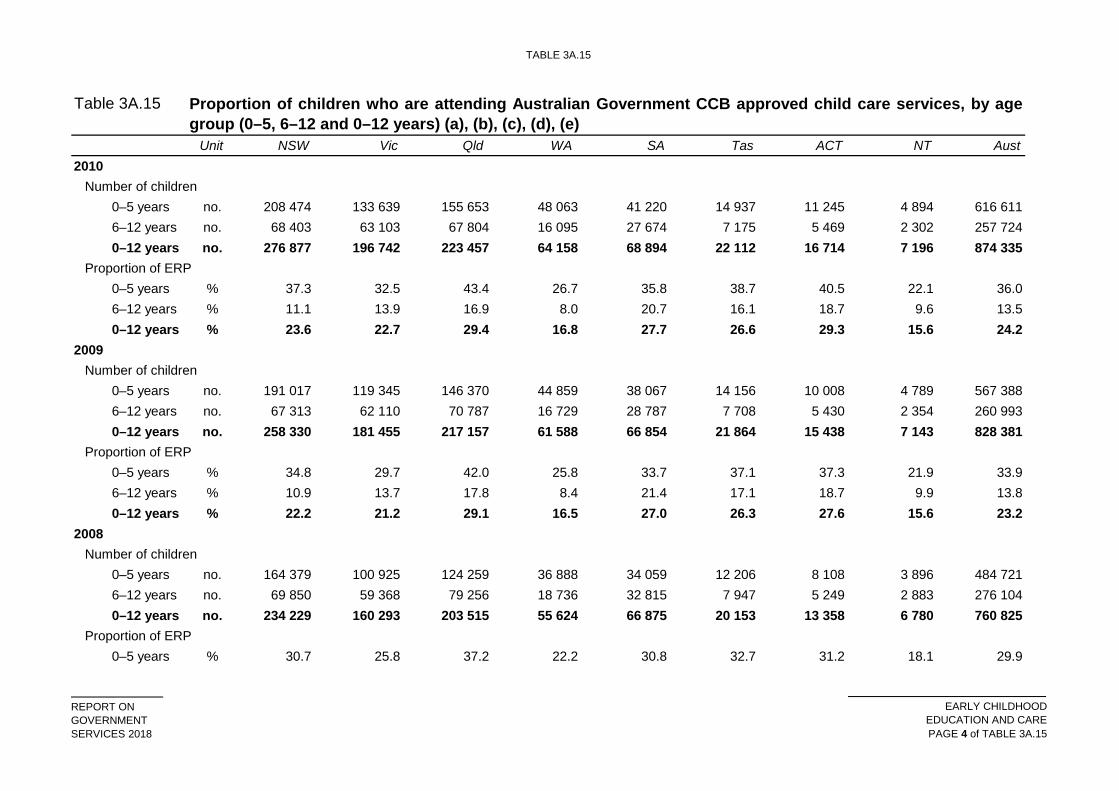
TABLE 3A.15
REPORT ONGOVERNMENTSERVICES 2018
EARLY CHILDHOODEDUCATION AND CAREPAGE 4 of TABLE 3A.15
Table 3A.15
Unit NSW Vic Qld WA SA Tas ACT NT Aust
Proportion of children who are attending Australian Government CCB approved child care services, by agegroup (0–5, 6–12 and 0–12 years) (a), (b), (c), (d), (e)
2010 Number of children
0–5 years no. 208 474 133 639 155 653 48 063 41 220 14 937 11 245 4 894 616 6116–12 years no. 68 403 63 103 67 804 16 095 27 674 7 175 5 469 2 302 257 7240–12 years no. 276 877 196 742 223 457 64 158 68 894 22 112 16 714 7 196 874 335
Proportion of ERP0–5 years % 37.3 32.5 43.4 26.7 35.8 38.7 40.5 22.1 36.06–12 years % 11.1 13.9 16.9 8.0 20.7 16.1 18.7 9.6 13.50–12 years % 23.6 22.7 29.4 16.8 27.7 26.6 29.3 15.6 24.2
2009 Number of children
0–5 years no. 191 017 119 345 146 370 44 859 38 067 14 156 10 008 4 789 567 3886–12 years no. 67 313 62 110 70 787 16 729 28 787 7 708 5 430 2 354 260 9930–12 years no. 258 330 181 455 217 157 61 588 66 854 21 864 15 438 7 143 828 381
Proportion of ERP0–5 years % 34.8 29.7 42.0 25.8 33.7 37.1 37.3 21.9 33.96–12 years % 10.9 13.7 17.8 8.4 21.4 17.1 18.7 9.9 13.80–12 years % 22.2 21.2 29.1 16.5 27.0 26.3 27.6 15.6 23.2
2008 Number of children
0–5 years no. 164 379 100 925 124 259 36 888 34 059 12 206 8 108 3 896 484 7216–12 years no. 69 850 59 368 79 256 18 736 32 815 7 947 5 249 2 883 276 1040–12 years no. 234 229 160 293 203 515 55 624 66 875 20 153 13 358 6 780 760 825
Proportion of ERP0–5 years % 30.7 25.8 37.2 22.2 30.8 32.7 31.2 18.1 29.9
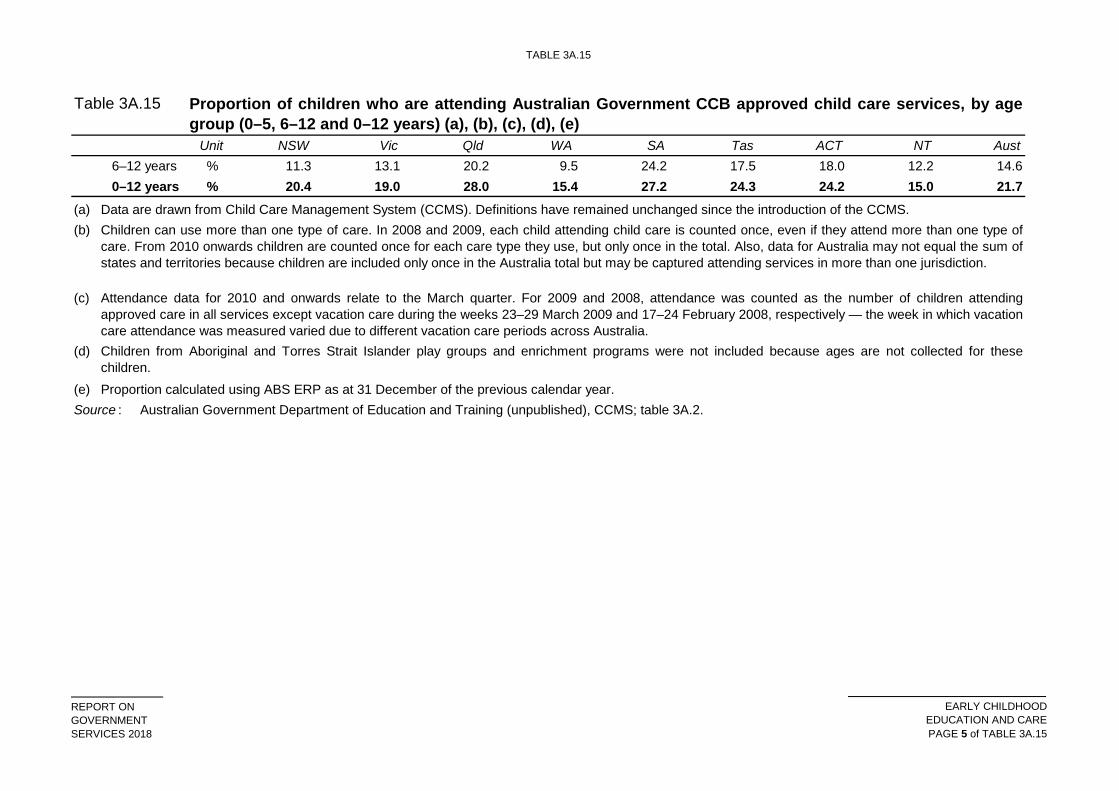
TABLE 3A.15
REPORT ONGOVERNMENTSERVICES 2018
EARLY CHILDHOODEDUCATION AND CAREPAGE 5 of TABLE 3A.15
Table 3A.15
Unit NSW Vic Qld WA SA Tas ACT NT Aust
Proportion of children who are attending Australian Government CCB approved child care services, by agegroup (0–5, 6–12 and 0–12 years) (a), (b), (c), (d), (e)
6–12 years % 11.3 13.1 20.2 9.5 24.2 17.5 18.0 12.2 14.60–12 years % 20.4 19.0 28.0 15.4 27.2 24.3 24.2 15.0 21.7
(a)(b)
(c)
(d)
(e)Source :
Children can use more than one type of care. In 2008 and 2009, each child attending child care is counted once, even if they attend more than one type ofcare. From 2010 onwards children are counted once for each care type they use, but only once in the total. Also, data for Australia may not equal the sum ofstates and territories because children are included only once in the Australia total but may be captured attending services in more than one jurisdiction.
Australian Government Department of Education and Training (unpublished), CCMS; table 3A.2.
Data are drawn from Child Care Management System (CCMS). Definitions have remained unchanged since the introduction of the CCMS.
Proportion calculated using ABS ERP as at 31 December of the previous calendar year.
Attendance data for 2010 and onwards relate to the March quarter. For 2009 and 2008, attendance was counted as the number of children attendingapproved care in all services except vacation care during the weeks 23–29 March 2009 and 17–24 February 2008, respectively — the week in which vacationcare attendance was measured varied due to different vacation care periods across Australia. Children from Aboriginal and Torres Strait Islander play groups and enrichment programs were not included because ages are not collected for thesechildren.
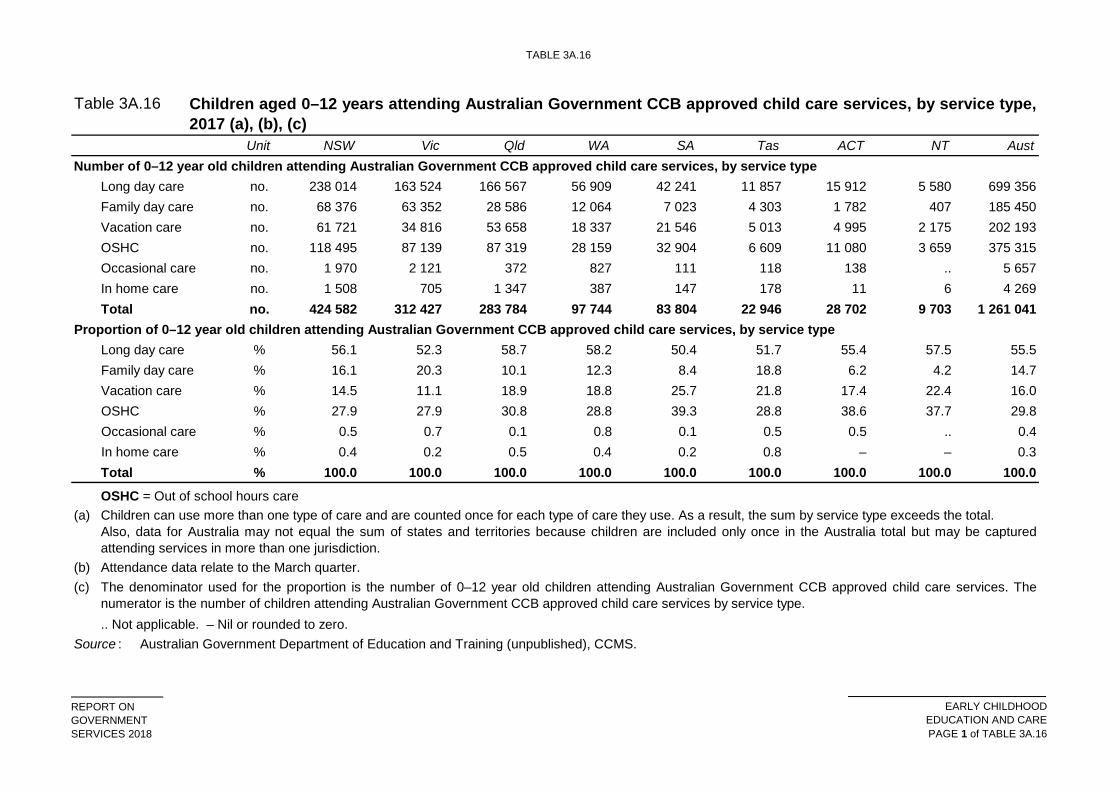
TABLE 3A.16
REPORT ONGOVERNMENTSERVICES 2018
EARLY CHILDHOODEDUCATION AND CAREPAGE 1 of TABLE 3A.16
Table 3A.16
Unit NSW Vic Qld WA SA Tas ACT NT AustNumber of 0–12 year old children attending Australian Government CCB approved child care services, by service type
Long day care no. 238 014 163 524 166 567 56 909 42 241 11 857 15 912 5 580 699 356Family day care no. 68 376 63 352 28 586 12 064 7 023 4 303 1 782 407 185 450Vacation care no. 61 721 34 816 53 658 18 337 21 546 5 013 4 995 2 175 202 193OSHC no. 118 495 87 139 87 319 28 159 32 904 6 609 11 080 3 659 375 315Occasional care no. 1 970 2 121 372 827 111 118 138 .. 5 657In home care no. 1 508 705 1 347 387 147 178 11 6 4 269Total no. 424 582 312 427 283 784 97 744 83 804 22 946 28 702 9 703 1 261 041
Proportion of 0–12 year old children attending Australian Government CCB approved child care services, by service typeLong day care % 56.1 52.3 58.7 58.2 50.4 51.7 55.4 57.5 55.5Family day care % 16.1 20.3 10.1 12.3 8.4 18.8 6.2 4.2 14.7Vacation care % 14.5 11.1 18.9 18.8 25.7 21.8 17.4 22.4 16.0OSHC % 27.9 27.9 30.8 28.8 39.3 28.8 38.6 37.7 29.8Occasional care % 0.5 0.7 0.1 0.8 0.1 0.5 0.5 .. 0.4In home care % 0.4 0.2 0.5 0.4 0.2 0.8 – – 0.3Total % 100.0 100.0 100.0 100.0 100.0 100.0 100.0 100.0 100.0OSHC = Out of school hours care
(a)
(b) (c)
Source :
Children can use more than one type of care and are counted once for each type of care they use. As a result, the sum by service type exceeds the total. Also, data for Australia may not equal the sum of states and territories because children are included only once in the Australia total but may be capturedattending services in more than one jurisdiction. Attendance data relate to the March quarter.
Australian Government Department of Education and Training (unpublished), CCMS.
Children aged 0–12 years attending Australian Government CCB approved child care services, by service type,2017 (a), (b), (c)
The denominator used for the proportion is the number of 0–12 year old children attending Australian Government CCB approved child care services. Thenumerator is the number of children attending Australian Government CCB approved child care services by service type... Not applicable. – Nil or rounded to zero.
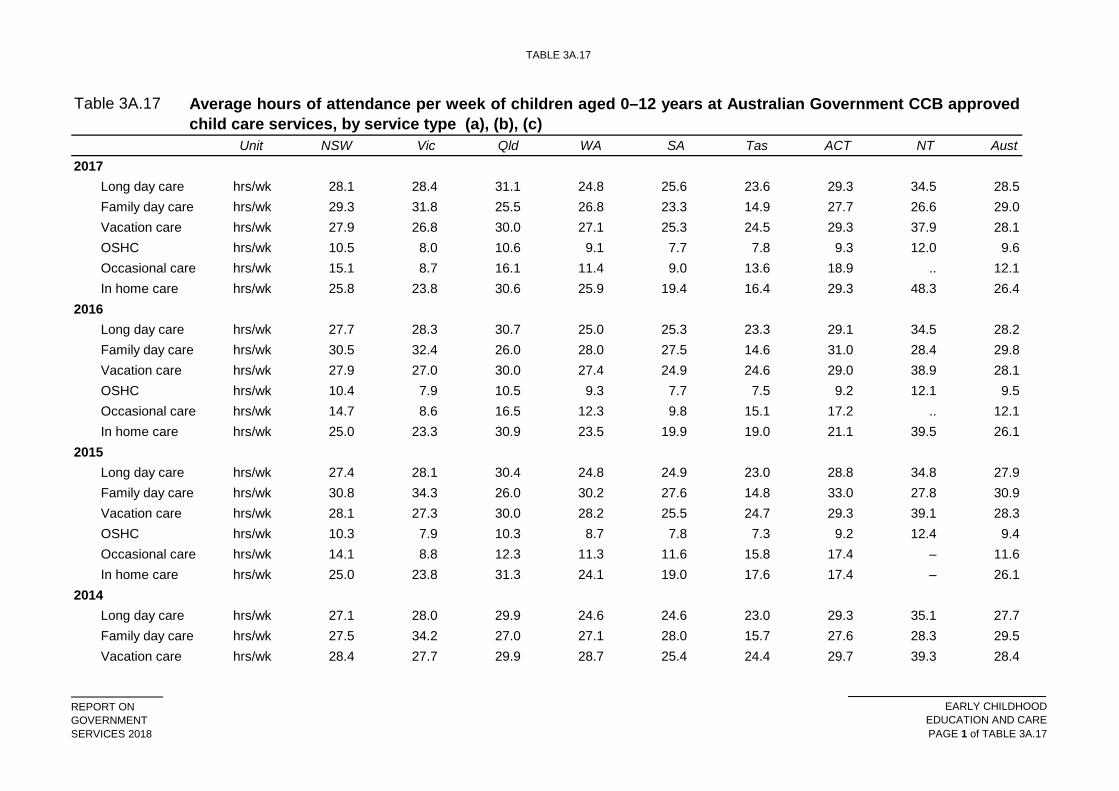
TABLE 3A.17
REPORT ONGOVERNMENTSERVICES 2018
EARLY CHILDHOODEDUCATION AND CAREPAGE 1 of TABLE 3A.17
Table 3A.17
Unit NSW Vic Qld WA SA Tas ACT NT Aust2017
Long day care hrs/wk 28.1 28.4 31.1 24.8 25.6 23.6 29.3 34.5 28.5Family day care hrs/wk 29.3 31.8 25.5 26.8 23.3 14.9 27.7 26.6 29.0Vacation care hrs/wk 27.9 26.8 30.0 27.1 25.3 24.5 29.3 37.9 28.1OSHC hrs/wk 10.5 8.0 10.6 9.1 7.7 7.8 9.3 12.0 9.6Occasional care hrs/wk 15.1 8.7 16.1 11.4 9.0 13.6 18.9 .. 12.1In home care hrs/wk 25.8 23.8 30.6 25.9 19.4 16.4 29.3 48.3 26.4
2016Long day care hrs/wk 27.7 28.3 30.7 25.0 25.3 23.3 29.1 34.5 28.2Family day care hrs/wk 30.5 32.4 26.0 28.0 27.5 14.6 31.0 28.4 29.8Vacation care hrs/wk 27.9 27.0 30.0 27.4 24.9 24.6 29.0 38.9 28.1OSHC hrs/wk 10.4 7.9 10.5 9.3 7.7 7.5 9.2 12.1 9.5Occasional care hrs/wk 14.7 8.6 16.5 12.3 9.8 15.1 17.2 .. 12.1In home care hrs/wk 25.0 23.3 30.9 23.5 19.9 19.0 21.1 39.5 26.1
2015Long day care hrs/wk 27.4 28.1 30.4 24.8 24.9 23.0 28.8 34.8 27.9Family day care hrs/wk 30.8 34.3 26.0 30.2 27.6 14.8 33.0 27.8 30.9Vacation care hrs/wk 28.1 27.3 30.0 28.2 25.5 24.7 29.3 39.1 28.3OSHC hrs/wk 10.3 7.9 10.3 8.7 7.8 7.3 9.2 12.4 9.4Occasional care hrs/wk 14.1 8.8 12.3 11.3 11.6 15.8 17.4 – 11.6In home care hrs/wk 25.0 23.8 31.3 24.1 19.0 17.6 17.4 – 26.1
2014Long day care hrs/wk 27.1 28.0 29.9 24.6 24.6 23.0 29.3 35.1 27.7Family day care hrs/wk 27.5 34.2 27.0 27.1 28.0 15.7 27.6 28.3 29.5Vacation care hrs/wk 28.4 27.7 29.9 28.7 25.4 24.4 29.7 39.3 28.4
Average hours of attendance per week of children aged 0–12 years at Australian Government CCB approvedchild care services, by service type (a), (b), (c)
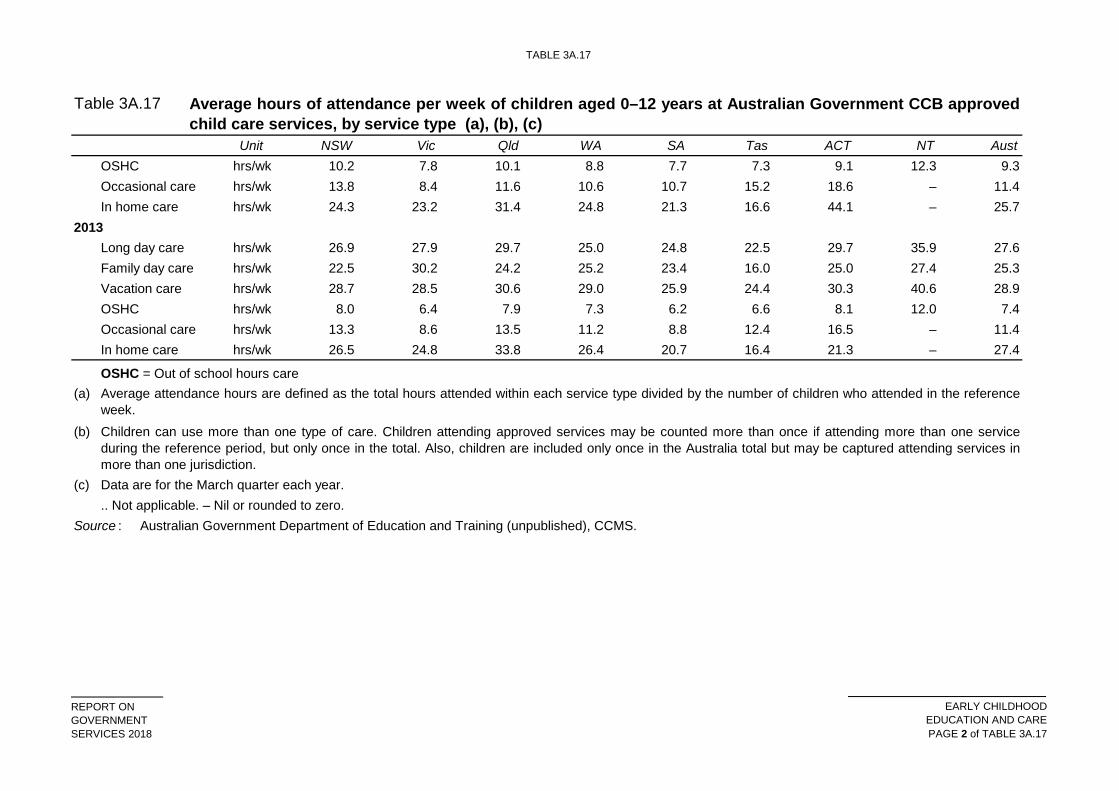
TABLE 3A.17
REPORT ONGOVERNMENTSERVICES 2018
EARLY CHILDHOODEDUCATION AND CAREPAGE 2 of TABLE 3A.17
Table 3A.17
Unit NSW Vic Qld WA SA Tas ACT NT Aust
Average hours of attendance per week of children aged 0–12 years at Australian Government CCB approvedchild care services, by service type (a), (b), (c)
OSHC hrs/wk 10.2 7.8 10.1 8.8 7.7 7.3 9.1 12.3 9.3Occasional care hrs/wk 13.8 8.4 11.6 10.6 10.7 15.2 18.6 – 11.4In home care hrs/wk 24.3 23.2 31.4 24.8 21.3 16.6 44.1 – 25.7
2013Long day care hrs/wk 26.9 27.9 29.7 25.0 24.8 22.5 29.7 35.9 27.6Family day care hrs/wk 22.5 30.2 24.2 25.2 23.4 16.0 25.0 27.4 25.3Vacation care hrs/wk 28.7 28.5 30.6 29.0 25.9 24.4 30.3 40.6 28.9OSHC hrs/wk 8.0 6.4 7.9 7.3 6.2 6.6 8.1 12.0 7.4Occasional care hrs/wk 13.3 8.6 13.5 11.2 8.8 12.4 16.5 – 11.4In home care hrs/wk 26.5 24.8 33.8 26.4 20.7 16.4 21.3 – 27.4
OSHC = Out of school hours care(a)
(b)
(c)
Source :
Data are for the March quarter each year.
Australian Government Department of Education and Training (unpublished), CCMS... Not applicable. – Nil or rounded to zero.
Average attendance hours are defined as the total hours attended within each service type divided by the number of children who attended in the referenceweek. Children can use more than one type of care. Children attending approved services may be counted more than once if attending more than one serviceduring the reference period, but only once in the total. Also, children are included only once in the Australia total but may be captured attending services inmore than one jurisdiction.
CHILDREN ENROLLED IN PRESCHOOL
REPORT ONGOVERNMENTSERVICES 2018
EARLY CHILDHOODEDUCATION AND CARE
PAGE 1 of CHILDREN ENROLLED IN PRESCHOOL
Children enrolled in preschool
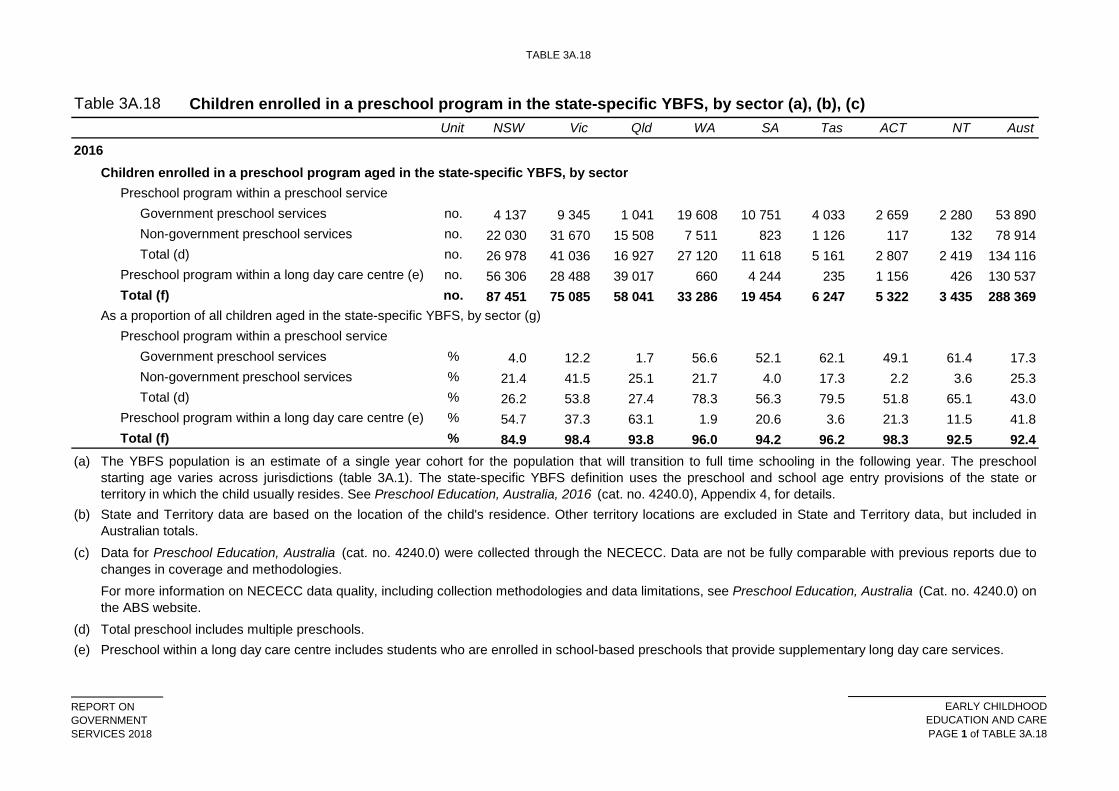
TABLE 3A.18
REPORT ONGOVERNMENTSERVICES 2018
EARLY CHILDHOODEDUCATION AND CAREPAGE 1 of TABLE 3A.18
Table 3A.18Unit NSW Vic Qld WA SA Tas ACT NT Aust
2016Children enrolled in a preschool program aged in the state-specific YBFS, by sector
Preschool program within a preschool serviceGovernment preschool services no. 4 137 9 345 1 041 19 608 10 751 4 033 2 659 2 280 53 890Non-government preschool services no. 22 030 31 670 15 508 7 511 823 1 126 117 132 78 914Total (d) no. 26 978 41 036 16 927 27 120 11 618 5 161 2 807 2 419 134 116
Preschool program within a long day care centre (e) no. 56 306 28 488 39 017 660 4 244 235 1 156 426 130 537Total (f) no. 87 451 75 085 58 041 33 286 19 454 6 247 5 322 3 435 288 369
As a proportion of all children aged in the state-specific YBFS, by sector (g)Preschool program within a preschool service
Government preschool services % 4.0 12.2 1.7 56.6 52.1 62.1 49.1 61.4 17.3Non-government preschool services % 21.4 41.5 25.1 21.7 4.0 17.3 2.2 3.6 25.3Total (d) % 26.2 53.8 27.4 78.3 56.3 79.5 51.8 65.1 43.0
Preschool program within a long day care centre (e) % 54.7 37.3 63.1 1.9 20.6 3.6 21.3 11.5 41.8Total (f) % 84.9 98.4 93.8 96.0 94.2 96.2 98.3 92.5 92.4
(a)
(b)
(c)
(d)(e)
Children enrolled in a preschool program in the state-specific YBFS, by sector (a), (b), (c)
Total preschool includes multiple preschools.
The YBFS population is an estimate of a single year cohort for the population that will transition to full time schooling in the following year. The preschoolstarting age varies across jurisdictions (table 3A.1). The state-specific YBFS definition uses the preschool and school age entry provisions of the state orterritory in which the child usually resides. See Preschool Education, Australia, 2016 (cat. no. 4240.0), Appendix 4, for details.
Preschool within a long day care centre includes students who are enrolled in school-based preschools that provide supplementary long day care services.
Data for Preschool Education, Australia (cat. no. 4240.0) were collected through the NECECC. Data are not be fully comparable with previous reports due tochanges in coverage and methodologies.
State and Territory data are based on the location of the child's residence. Other territory locations are excluded in State and Territory data, but included inAustralian totals.
For more information on NECECC data quality, including collection methodologies and data limitations, see Preschool Education, Australia (Cat. no. 4240.0) onthe ABS website.
TABLE 3A.18
REPORT ONGOVERNMENTSERVICES 2018
EARLY CHILDHOODEDUCATION AND CAREPAGE 2 of TABLE 3A.18
Table 3A.18Unit NSW Vic Qld WA SA Tas ACT NT Aust
Children enrolled in a preschool program in the state-specific YBFS, by sector (a), (b), (c)
(f)(g)Source : ABS 2017, Preschool Education, Australia, 2016 , Cat. no. 4240.0, Canberra.
Total includes data for children in receipt of a preschool program across both preschool and long day care settings. To calculate this proportion, enrolment data are divided by the number of children aged in the YBFS for each jurisdiction (table 3A.4).
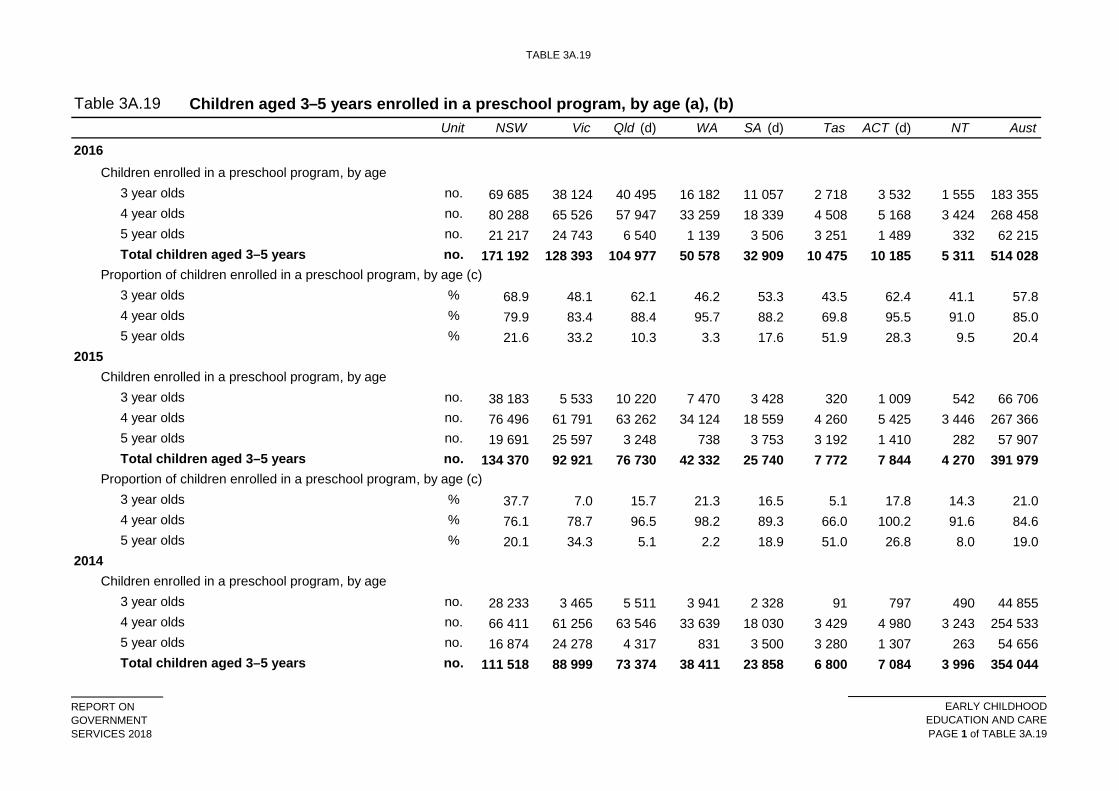
TABLE 3A.19
REPORT ONGOVERNMENTSERVICES 2018
EARLY CHILDHOODEDUCATION AND CAREPAGE 1 of TABLE 3A.19
Table 3A.19Unit NSW Vic Qld (d) WA SA (d) Tas ACT (d) NT Aust
2016Children enrolled in a preschool program, by age
3 year olds no. 69 685 38 124 40 495 16 182 11 057 2 718 3 532 1 555 183 3554 year olds no. 80 288 65 526 57 947 33 259 18 339 4 508 5 168 3 424 268 4585 year olds no. 21 217 24 743 6 540 1 139 3 506 3 251 1 489 332 62 215Total children aged 3–5 years no. 171 192 128 393 104 977 50 578 32 909 10 475 10 185 5 311 514 028
Proportion of children enrolled in a preschool program, by age (c) 3 year olds % 68.9 48.1 62.1 46.2 53.3 43.5 62.4 41.1 57.84 year olds % 79.9 83.4 88.4 95.7 88.2 69.8 95.5 91.0 85.05 year olds % 21.6 33.2 10.3 3.3 17.6 51.9 28.3 9.5 20.4
2015Children enrolled in a preschool program, by age
3 year olds no. 38 183 5 533 10 220 7 470 3 428 320 1 009 542 66 7064 year olds no. 76 496 61 791 63 262 34 124 18 559 4 260 5 425 3 446 267 3665 year olds no. 19 691 25 597 3 248 738 3 753 3 192 1 410 282 57 907Total children aged 3–5 years no. 134 370 92 921 76 730 42 332 25 740 7 772 7 844 4 270 391 979
Proportion of children enrolled in a preschool program, by age (c) 3 year olds % 37.7 7.0 15.7 21.3 16.5 5.1 17.8 14.3 21.04 year olds % 76.1 78.7 96.5 98.2 89.3 66.0 100.2 91.6 84.65 year olds % 20.1 34.3 5.1 2.2 18.9 51.0 26.8 8.0 19.0
2014Children enrolled in a preschool program, by age
3 year olds no. 28 233 3 465 5 511 3 941 2 328 91 797 490 44 8554 year olds no. 66 411 61 256 63 546 33 639 18 030 3 429 4 980 3 243 254 5335 year olds no. 16 874 24 278 4 317 831 3 500 3 280 1 307 263 54 656Total children aged 3–5 years no. 111 518 88 999 73 374 38 411 23 858 6 800 7 084 3 996 354 044
Children aged 3–5 years enrolled in a preschool program, by age (a), (b)
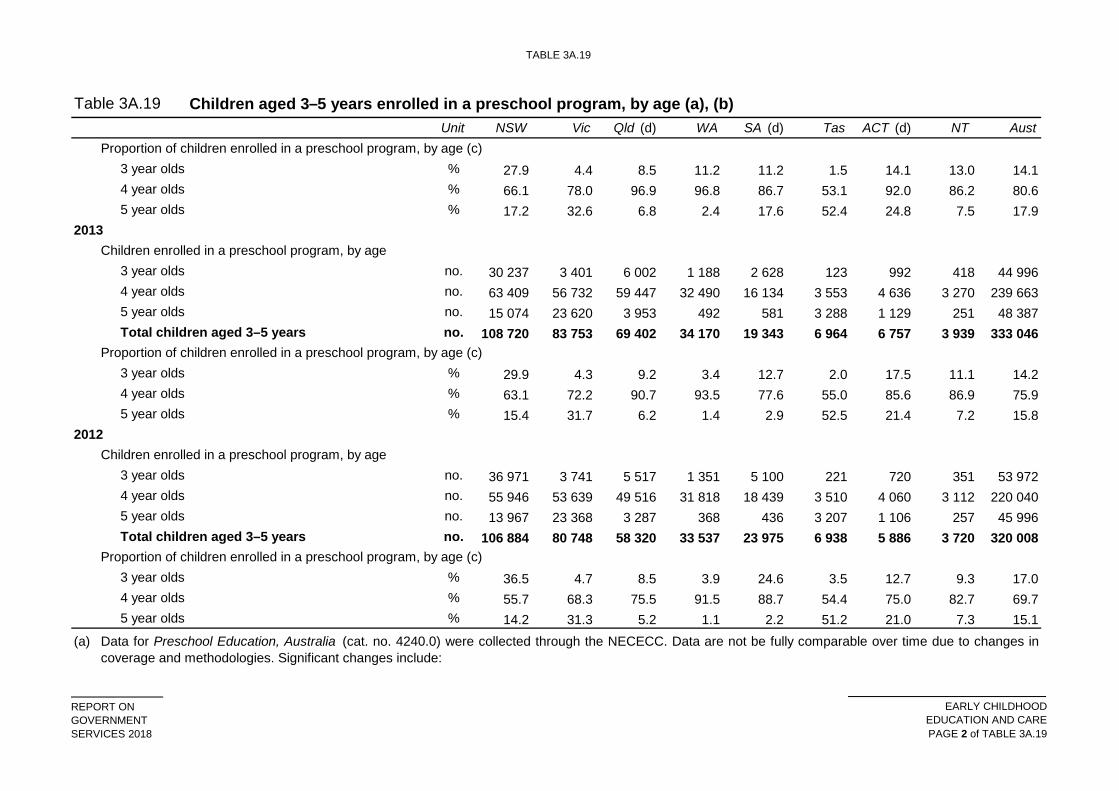
TABLE 3A.19
REPORT ONGOVERNMENTSERVICES 2018
EARLY CHILDHOODEDUCATION AND CAREPAGE 2 of TABLE 3A.19
Table 3A.19Unit NSW Vic Qld (d) WA SA (d) Tas ACT (d) NT Aust
Children aged 3–5 years enrolled in a preschool program, by age (a), (b)
Proportion of children enrolled in a preschool program, by age (c) 3 year olds % 27.9 4.4 8.5 11.2 11.2 1.5 14.1 13.0 14.14 year olds % 66.1 78.0 96.9 96.8 86.7 53.1 92.0 86.2 80.65 year olds % 17.2 32.6 6.8 2.4 17.6 52.4 24.8 7.5 17.9
2013Children enrolled in a preschool program, by age
3 year olds no. 30 237 3 401 6 002 1 188 2 628 123 992 418 44 9964 year olds no. 63 409 56 732 59 447 32 490 16 134 3 553 4 636 3 270 239 6635 year olds no. 15 074 23 620 3 953 492 581 3 288 1 129 251 48 387Total children aged 3–5 years no. 108 720 83 753 69 402 34 170 19 343 6 964 6 757 3 939 333 046
Proportion of children enrolled in a preschool program, by age (c) 3 year olds % 29.9 4.3 9.2 3.4 12.7 2.0 17.5 11.1 14.24 year olds % 63.1 72.2 90.7 93.5 77.6 55.0 85.6 86.9 75.95 year olds % 15.4 31.7 6.2 1.4 2.9 52.5 21.4 7.2 15.8
2012Children enrolled in a preschool program, by age
3 year olds no. 36 971 3 741 5 517 1 351 5 100 221 720 351 53 9724 year olds no. 55 946 53 639 49 516 31 818 18 439 3 510 4 060 3 112 220 0405 year olds no. 13 967 23 368 3 287 368 436 3 207 1 106 257 45 996Total children aged 3–5 years no. 106 884 80 748 58 320 33 537 23 975 6 938 5 886 3 720 320 008
Proportion of children enrolled in a preschool program, by age (c) 3 year olds % 36.5 4.7 8.5 3.9 24.6 3.5 12.7 9.3 17.04 year olds % 55.7 68.3 75.5 91.5 88.7 54.4 75.0 82.7 69.75 year olds % 14.2 31.3 5.2 1.1 2.2 51.2 21.0 7.3 15.1
(a) Data for Preschool Education, Australia (cat. no. 4240.0) were collected through the NECECC. Data are not be fully comparable over time due to changes incoverage and methodologies. Significant changes include:
TABLE 3A.19
REPORT ONGOVERNMENTSERVICES 2018
EARLY CHILDHOODEDUCATION AND CAREPAGE 3 of TABLE 3A.19
Table 3A.19Unit NSW Vic Qld (d) WA SA (d) Tas ACT (d) NT Aust
Children aged 3–5 years enrolled in a preschool program, by age (a), (b)
••
(b)
(c)
(d) Jurisdiction notes:Qld:
SA:
ACT:Source :
State and Territory data are based on the location of the child's main service provider. Other territory locations are included in State and Territory and Australiantotals.
ABS 2017 (and previous issues), Preschool Education, Australia, 2016 , Cat. no. 4240.0, data derived from TableBuilder; table 3A.3.
Proportion calculated as the number of enrolments (from the August NECECC) divided by the number of children in each jurisdiction (using ABS ERP at 30June), by age. ERP at 30 June based on the 2011 Census of Population and Housing .
2012 child level enrolment data for Queensland were not available and episode of enrolment data were used instead. An episode is a record of enrolment ata preschool program. Children may be enrolled in more than one preschool program so in these cases will be counted more than once in episode counts.These data are included in the national total. Care should be taken when comparing Queensland data from 2012 to 2013 and to 2012 data for otherjurisdictions. Care should also be taken when interpreting 2013, 2014 and 2015 data for Queensland and 2013 and 2014 data for WA as there may be someduplication of children. This is due to the inclusion of child aggregate data from some service providers.SA 2013 and 2014 data may not be fully comparable with 2012 data. Enrolment numbers in government funded preschools in 2013 and 2014 were affectedby the transition from a quarterly intake to a single annual intake.2012 totals for the ACT exclude data for preschools within independent schools, which were unavailable.
In 2016, the ABS amended its data linkage approach to enhance the accuracy of child counts in NECECC.In 2016, there was an expanded child identification strategy in the CCMS. As a result, all children at long day care centres (of the appropriate age) arerecorded as attending a preschool program. This has particularly affected the count of children aged 3 years enrolled in a preschool program.
For more information on NECECC data quality, including collection methodologies and data limitations, see Preschool Education, Australia (Cat. no. 4240.0) onthe ABS website and the ECEC NMDS specifications on the AIHW website.
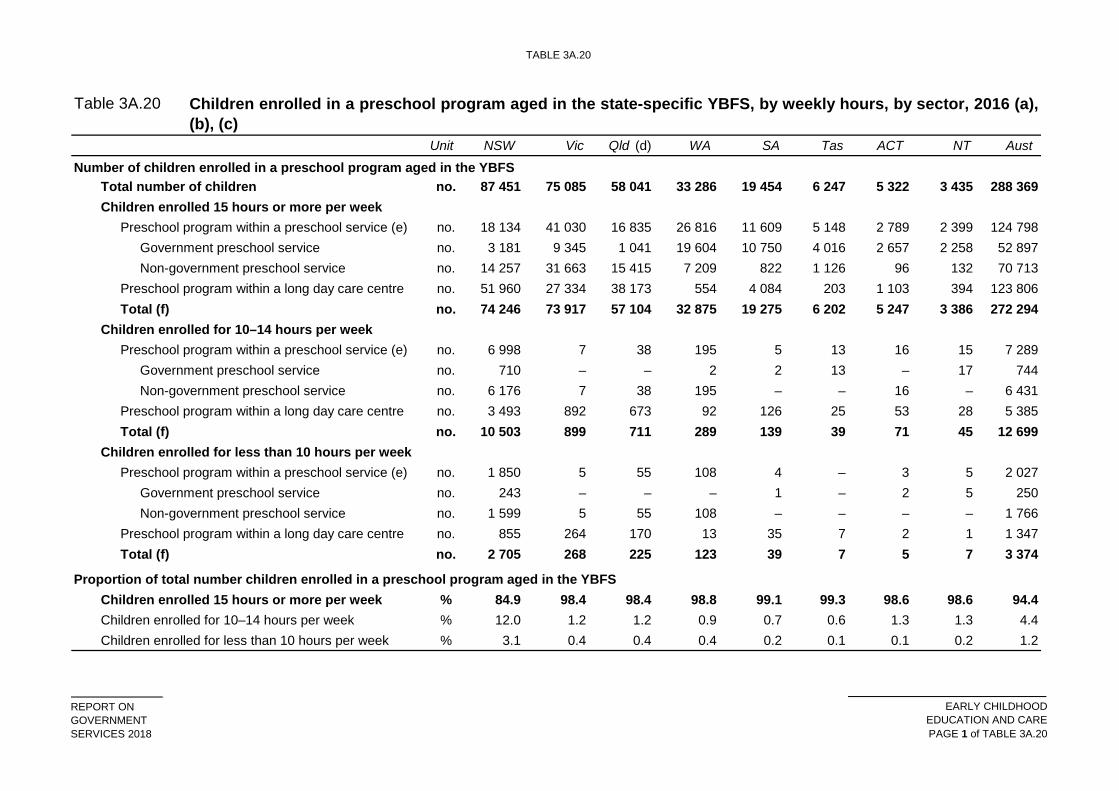
TABLE 3A.20
REPORT ONGOVERNMENTSERVICES 2018
EARLY CHILDHOODEDUCATION AND CAREPAGE 1 of TABLE 3A.20
Table 3A.20
Unit NSW Vic Qld (d) WA SA Tas ACT NT Aust
Number of children enrolled in a preschool program aged in the YBFSTotal number of children no. 87 451 75 085 58 041 33 286 19 454 6 247 5 322 3 435 288 369Children enrolled 15 hours or more per week
Preschool program within a preschool service (e) no. 18 134 41 030 16 835 26 816 11 609 5 148 2 789 2 399 124 798Government preschool service no. 3 181 9 345 1 041 19 604 10 750 4 016 2 657 2 258 52 897Non-government preschool service no. 14 257 31 663 15 415 7 209 822 1 126 96 132 70 713
Preschool program within a long day care centre no. 51 960 27 334 38 173 554 4 084 203 1 103 394 123 806Total (f) no. 74 246 73 917 57 104 32 875 19 275 6 202 5 247 3 386 272 294
Children enrolled for 10–14 hours per week Preschool program within a preschool service (e) no. 6 998 7 38 195 5 13 16 15 7 289
Government preschool service no. 710 – – 2 2 13 – 17 744Non-government preschool service no. 6 176 7 38 195 – – 16 – 6 431
Preschool program within a long day care centre no. 3 493 892 673 92 126 25 53 28 5 385Total (f) no. 10 503 899 711 289 139 39 71 45 12 699
Children enrolled for less than 10 hours per weekPreschool program within a preschool service (e) no. 1 850 5 55 108 4 – 3 5 2 027
Government preschool service no. 243 – – – 1 – 2 5 250Non-government preschool service no. 1 599 5 55 108 – – – – 1 766
Preschool program within a long day care centre no. 855 264 170 13 35 7 2 1 1 347Total (f) no. 2 705 268 225 123 39 7 5 7 3 374
Proportion of total number children enrolled in a preschool program aged in the YBFSChildren enrolled 15 hours or more per week % 84.9 98.4 98.4 98.8 99.1 99.3 98.6 98.6 94.4Children enrolled for 10–14 hours per week % 12.0 1.2 1.2 0.9 0.7 0.6 1.3 1.3 4.4Children enrolled for less than 10 hours per week % 3.1 0.4 0.4 0.4 0.2 0.1 0.1 0.2 1.2
Children enrolled in a preschool program aged in the state-specific YBFS, by weekly hours, by sector, 2016 (a),(b), (c)
TABLE 3A.20
REPORT ONGOVERNMENTSERVICES 2018
EARLY CHILDHOODEDUCATION AND CAREPAGE 2 of TABLE 3A.20
Table 3A.20
Unit NSW Vic Qld (d) WA SA Tas ACT NT Aust
Children enrolled in a preschool program aged in the state-specific YBFS, by weekly hours, by sector, 2016 (a),(b), (c)
(a)
(b)
(c)
(d)
(e)(f)
– Nil or rounded to zero.Source :
For Queensland data provided in aggregate, hours were calculated using averages at the provider level. Care needs to be taken when interpreting Queenslanddata as there may be some duplication of children. This is due to the inclusion of child aggregate data from some service providers.
ABS 2017 (and previous issues), Preschool Education, Australia, 2016 , Cat. no. 4240.0, data derived from TableBuilder.
The YBFS population is an estimate of a single year cohort for the population that will transition to full time schooling in the following year. The preschool startingage varies across jurisdictions (table 3A.1). The state-specific YBFS definition uses the preschool and school age entry provisions of the state or territory inwhich the child usually resides. See Preschool Education, Australia, 2016 (cat. no. 4240.0), Appendix 4, for details.
Total preschool includes multiple preschools. Total includes data for children in receipt of a preschool program across both preschool and long day care settings.
Data for Preschool Education, Australia (cat. no. 4240.0) were collected through the NECECC. Data are not be fully comparable with previous reports due tochanges in coverage and methodologies.
State and Territory data are based on the location of the child's residence. Other territory locations are excluded in State and Territory data, but included inAustralian totals.
For more information on NECECC data quality, including collection methodologies and data limitations, see Preschool Education, Australia (Cat. no. 4240.0) onthe ABS website.
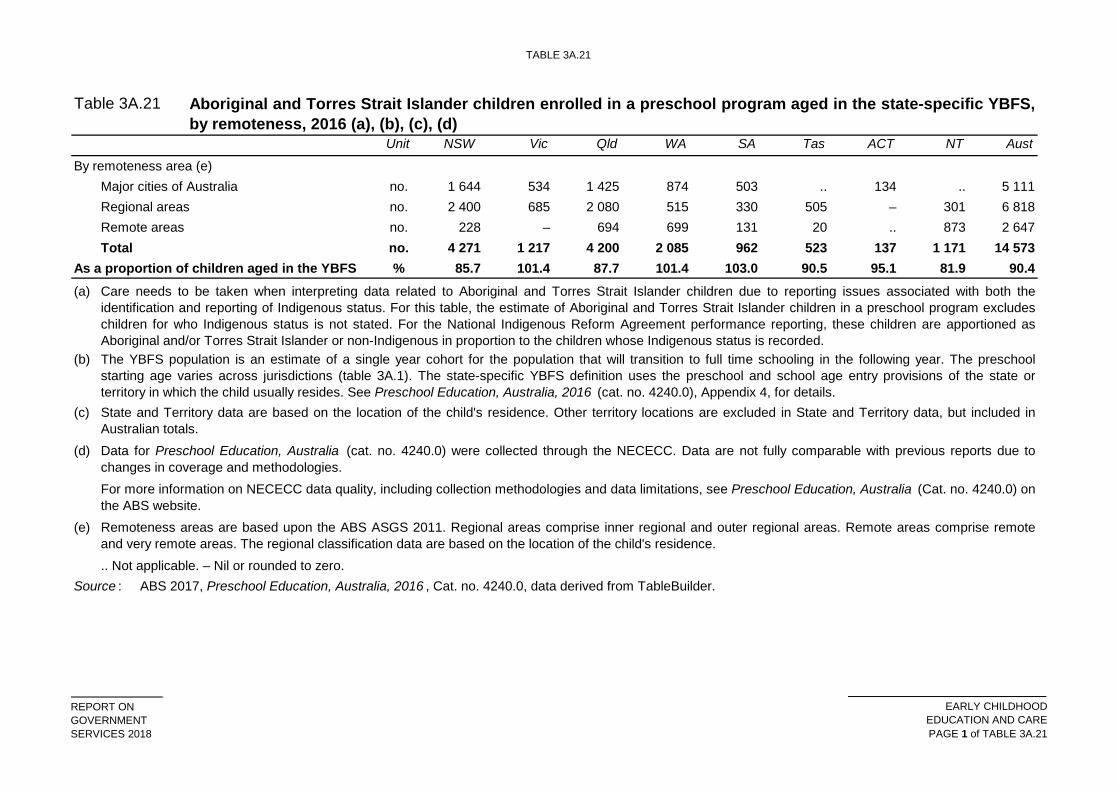
TABLE 3A.21
REPORT ONGOVERNMENTSERVICES 2018
EARLY CHILDHOODEDUCATION AND CAREPAGE 1 of TABLE 3A.21
Table 3A.21
Unit NSW Vic Qld WA SA Tas ACT NT Aust
By remoteness area (e) Major cities of Australia no. 1 644 534 1 425 874 503 .. 134 .. 5 111Regional areas no. 2 400 685 2 080 515 330 505 – 301 6 818Remote areas no. 228 – 694 699 131 20 .. 873 2 647Total no. 4 271 1 217 4 200 2 085 962 523 137 1 171 14 573
As a proportion of children aged in the YBFS % 85.7 101.4 87.7 101.4 103.0 90.5 95.1 81.9 90.4(a)
(b)
(c)
(d)
(e)
.. Not applicable. – Nil or rounded to zero. Source :
Aboriginal and Torres Strait Islander children enrolled in a preschool program aged in the state-specific YBFS,by remoteness, 2016 (a), (b), (c), (d)
ABS 2017, Preschool Education, Australia, 2016 , Cat. no. 4240.0, data derived from TableBuilder.
Remoteness areas are based upon the ABS ASGS 2011. Regional areas comprise inner regional and outer regional areas. Remote areas comprise remoteand very remote areas. The regional classification data are based on the location of the child's residence.
Care needs to be taken when interpreting data related to Aboriginal and Torres Strait Islander children due to reporting issues associated with both theidentification and reporting of Indigenous status. For this table, the estimate of Aboriginal and Torres Strait Islander children in a preschool program excludeschildren for who Indigenous status is not stated. For the National Indigenous Reform Agreement performance reporting, these children are apportioned asAboriginal and/or Torres Strait Islander or non-Indigenous in proportion to the children whose Indigenous status is recorded.The YBFS population is an estimate of a single year cohort for the population that will transition to full time schooling in the following year. The preschoolstarting age varies across jurisdictions (table 3A.1). The state-specific YBFS definition uses the preschool and school age entry provisions of the state orterritory in which the child usually resides. See Preschool Education, Australia, 2016 (cat. no. 4240.0), Appendix 4, for details.
Data for Preschool Education, Australia (cat. no. 4240.0) were collected through the NECECC. Data are not fully comparable with previous reports due tochanges in coverage and methodologies.
State and Territory data are based on the location of the child's residence. Other territory locations are excluded in State and Territory data, but included inAustralian totals.
For more information on NECECC data quality, including collection methodologies and data limitations, see Preschool Education, Australia (Cat. no. 4240.0) onthe ABS website.
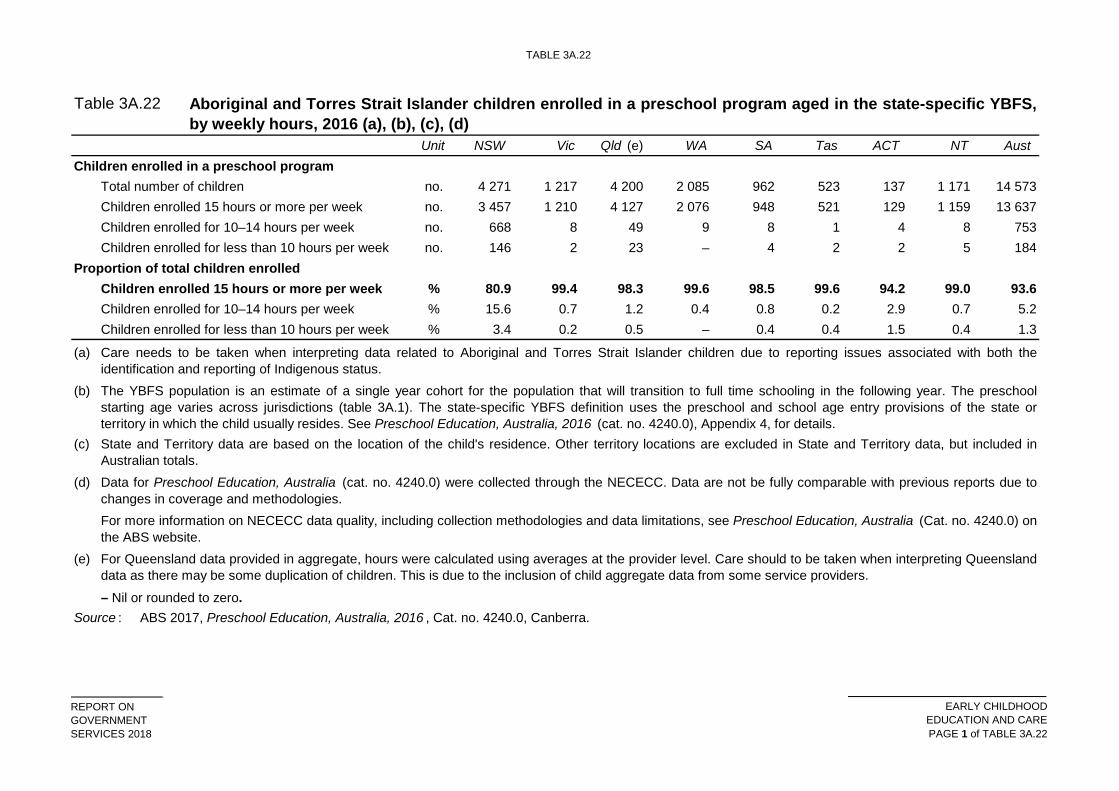
TABLE 3A.22
REPORT ONGOVERNMENTSERVICES 2018
EARLY CHILDHOODEDUCATION AND CAREPAGE 1 of TABLE 3A.22
Table 3A.22
Unit NSW Vic Qld (e) WA SA Tas ACT NT Aust Children enrolled in a preschool program
Total number of children no. 4 271 1 217 4 200 2 085 962 523 137 1 171 14 573Children enrolled 15 hours or more per week no. 3 457 1 210 4 127 2 076 948 521 129 1 159 13 637Children enrolled for 10–14 hours per week no. 668 8 49 9 8 1 4 8 753Children enrolled for less than 10 hours per week no. 146 2 23 – 4 2 2 5 184
Proportion of total children enrolledChildren enrolled 15 hours or more per week % 80.9 99.4 98.3 99.6 98.5 99.6 94.2 99.0 93.6Children enrolled for 10–14 hours per week % 15.6 0.7 1.2 0.4 0.8 0.2 2.9 0.7 5.2Children enrolled for less than 10 hours per week % 3.4 0.2 0.5 – 0.4 0.4 1.5 0.4 1.3
(a)
(b)
(c)
(d)
(e)
– Nil or rounded to zero.Source :
Aboriginal and Torres Strait Islander children enrolled in a preschool program aged in the state-specific YBFS,by weekly hours, 2016 (a), (b), (c), (d)
For Queensland data provided in aggregate, hours were calculated using averages at the provider level. Care should to be taken when interpreting Queenslanddata as there may be some duplication of children. This is due to the inclusion of child aggregate data from some service providers.
Care needs to be taken when interpreting data related to Aboriginal and Torres Strait Islander children due to reporting issues associated with both theidentification and reporting of Indigenous status.The YBFS population is an estimate of a single year cohort for the population that will transition to full time schooling in the following year. The preschoolstarting age varies across jurisdictions (table 3A.1). The state-specific YBFS definition uses the preschool and school age entry provisions of the state orterritory in which the child usually resides. See Preschool Education, Australia, 2016 (cat. no. 4240.0), Appendix 4, for details.State and Territory data are based on the location of the child's residence. Other territory locations are excluded in State and Territory data, but included inAustralian totals.
ABS 2017, Preschool Education, Australia, 2016 , Cat. no. 4240.0, Canberra.
Data for Preschool Education, Australia (cat. no. 4240.0) were collected through the NECECC. Data are not be fully comparable with previous reports due tochanges in coverage and methodologies.For more information on NECECC data quality, including collection methodologies and data limitations, see Preschool Education, Australia (Cat. no. 4240.0) onthe ABS website.
PARENT COSTS FOR ECEC
REPORT ONGOVERNMENTSERVICES 2018
EARLY CHILDHOODEDUCATION AND CARE
PAGE 1 of PARENT COSTS FOR ECEC
Parent costs for ECEC
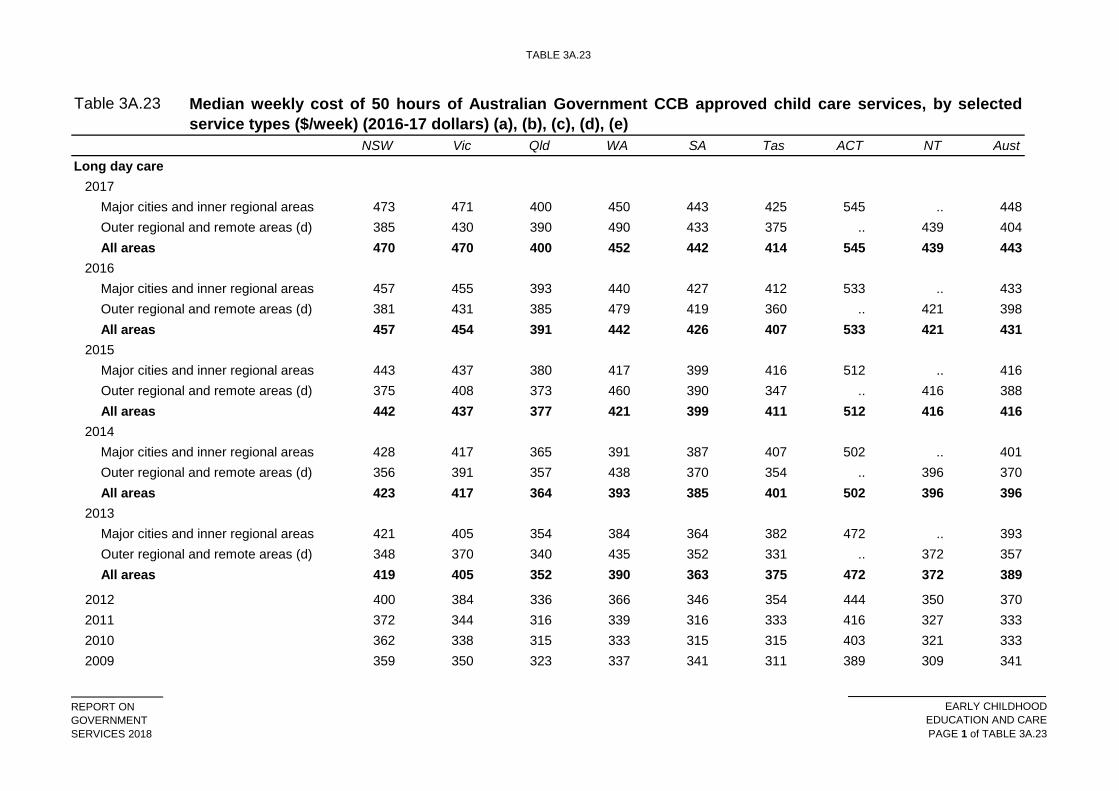
TABLE 3A.23
REPORT ONGOVERNMENTSERVICES 2018
EARLY CHILDHOODEDUCATION AND CAREPAGE 1 of TABLE 3A.23
Table 3A.23
NSW Vic Qld WA SA Tas ACT NT AustLong day care
2017Major cities and inner regional areas 473 471 400 450 443 425 545 .. 448Outer regional and remote areas (d) 385 430 390 490 433 375 .. 439 404All areas 470 470 400 452 442 414 545 439 443
2016Major cities and inner regional areas 457 455 393 440 427 412 533 .. 433Outer regional and remote areas (d) 381 431 385 479 419 360 .. 421 398All areas 457 454 391 442 426 407 533 421 431
2015Major cities and inner regional areas 443 437 380 417 399 416 512 .. 416Outer regional and remote areas (d) 375 408 373 460 390 347 .. 416 388All areas 442 437 377 421 399 411 512 416 416
2014Major cities and inner regional areas 428 417 365 391 387 407 502 .. 401Outer regional and remote areas (d) 356 391 357 438 370 354 .. 396 370All areas 423 417 364 393 385 401 502 396 396
2013Major cities and inner regional areas 421 405 354 384 364 382 472 .. 393Outer regional and remote areas (d) 348 370 340 435 352 331 .. 372 357All areas 419 405 352 390 363 375 472 372 389
2012 400 384 336 366 346 354 444 350 3702011 372 344 316 339 316 333 416 327 3332010 362 338 315 333 315 315 403 321 3332009 359 350 323 337 341 311 389 309 341
Median weekly cost of 50 hours of Australian Government CCB approved child care services, by selectedservice types ($/week) (2016-17 dollars) (a), (b), (c), (d), (e)
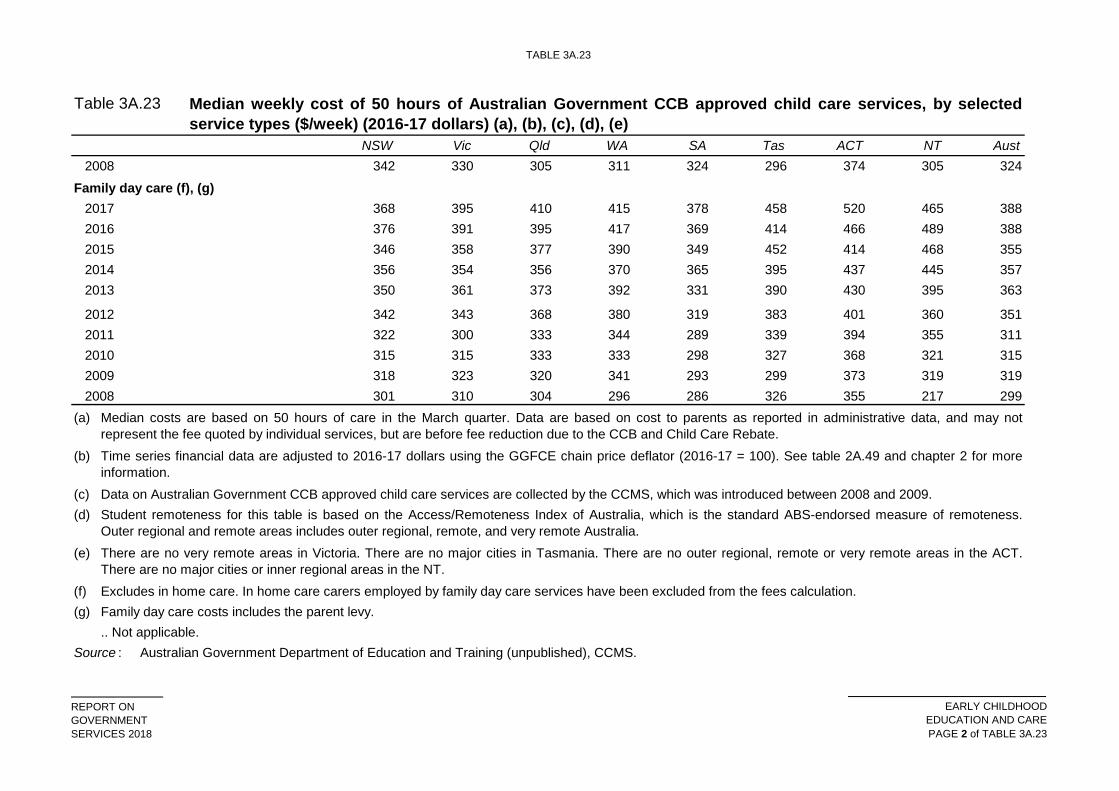
TABLE 3A.23
REPORT ONGOVERNMENTSERVICES 2018
EARLY CHILDHOODEDUCATION AND CAREPAGE 2 of TABLE 3A.23
Table 3A.23
NSW Vic Qld WA SA Tas ACT NT Aust
Median weekly cost of 50 hours of Australian Government CCB approved child care services, by selectedservice types ($/week) (2016-17 dollars) (a), (b), (c), (d), (e)
2008 342 330 305 311 324 296 374 305 324Family day care (f), (g)
2017 368 395 410 415 378 458 520 465 3882016 376 391 395 417 369 414 466 489 3882015 346 358 377 390 349 452 414 468 3552014 356 354 356 370 365 395 437 445 3572013 350 361 373 392 331 390 430 395 363
2012 342 343 368 380 319 383 401 360 3512011 322 300 333 344 289 339 394 355 3112010 315 315 333 333 298 327 368 321 3152009 318 323 320 341 293 299 373 319 3192008 301 310 304 296 286 326 355 217 299
(a)
(b)
(c)(d)
(e)
(f)(g)
.. Not applicable.Source : Australian Government Department of Education and Training (unpublished), CCMS.
Student remoteness for this table is based on the Access/Remoteness Index of Australia, which is the standard ABS-endorsed measure of remoteness.Outer regional and remote areas includes outer regional, remote, and very remote Australia.There are no very remote areas in Victoria. There are no major cities in Tasmania. There are no outer regional, remote or very remote areas in the ACT.There are no major cities or inner regional areas in the NT.
Family day care costs includes the parent levy.
Median costs are based on 50 hours of care in the March quarter. Data are based on cost to parents as reported in administrative data, and may notrepresent the fee quoted by individual services, but are before fee reduction due to the CCB and Child Care Rebate.
Excludes in home care. In home care carers employed by family day care services have been excluded from the fees calculation.
Data on Australian Government CCB approved child care services are collected by the CCMS, which was introduced between 2008 and 2009.
Time series financial data are adjusted to 2016-17 dollars using the GGFCE chain price deflator (2016-17 = 100). See table 2A.49 and chapter 2 for moreinformation.
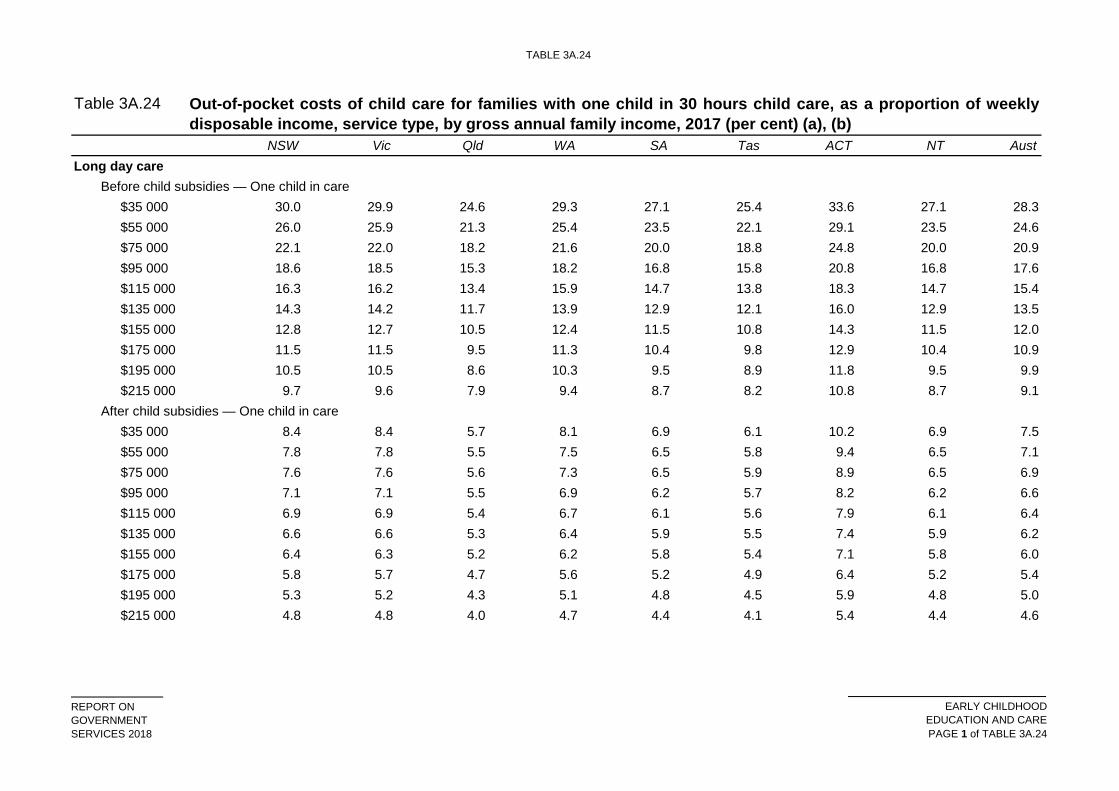
TABLE 3A.24
REPORT ONGOVERNMENTSERVICES 2018
EARLY CHILDHOODEDUCATION AND CAREPAGE 1 of TABLE 3A.24
Table 3A.24
NSW Vic Qld WA SA Tas ACT NT AustLong day care
Before child subsidies — One child in care$35 000 30.0 29.9 24.6 29.3 27.1 25.4 33.6 27.1 28.3$55 000 26.0 25.9 21.3 25.4 23.5 22.1 29.1 23.5 24.6$75 000 22.1 22.0 18.2 21.6 20.0 18.8 24.8 20.0 20.9$95 000 18.6 18.5 15.3 18.2 16.8 15.8 20.8 16.8 17.6$115 000 16.3 16.2 13.4 15.9 14.7 13.8 18.3 14.7 15.4$135 000 14.3 14.2 11.7 13.9 12.9 12.1 16.0 12.9 13.5$155 000 12.8 12.7 10.5 12.4 11.5 10.8 14.3 11.5 12.0$175 000 11.5 11.5 9.5 11.3 10.4 9.8 12.9 10.4 10.9$195 000 10.5 10.5 8.6 10.3 9.5 8.9 11.8 9.5 9.9$215 000 9.7 9.6 7.9 9.4 8.7 8.2 10.8 8.7 9.1
After child subsidies — One child in care$35 000 8.4 8.4 5.7 8.1 6.9 6.1 10.2 6.9 7.5$55 000 7.8 7.8 5.5 7.5 6.5 5.8 9.4 6.5 7.1$75 000 7.6 7.6 5.6 7.3 6.5 5.9 8.9 6.5 6.9$95 000 7.1 7.1 5.5 6.9 6.2 5.7 8.2 6.2 6.6$115 000 6.9 6.9 5.4 6.7 6.1 5.6 7.9 6.1 6.4$135 000 6.6 6.6 5.3 6.4 5.9 5.5 7.4 5.9 6.2$155 000 6.4 6.3 5.2 6.2 5.8 5.4 7.1 5.8 6.0$175 000 5.8 5.7 4.7 5.6 5.2 4.9 6.4 5.2 5.4$195 000 5.3 5.2 4.3 5.1 4.8 4.5 5.9 4.8 5.0$215 000 4.8 4.8 4.0 4.7 4.4 4.1 5.4 4.4 4.6
Out-of-pocket costs of child care for families with one child in 30 hours child care, as a proportion of weeklydisposable income, service type, by gross annual family income, 2017 (per cent) (a), (b)
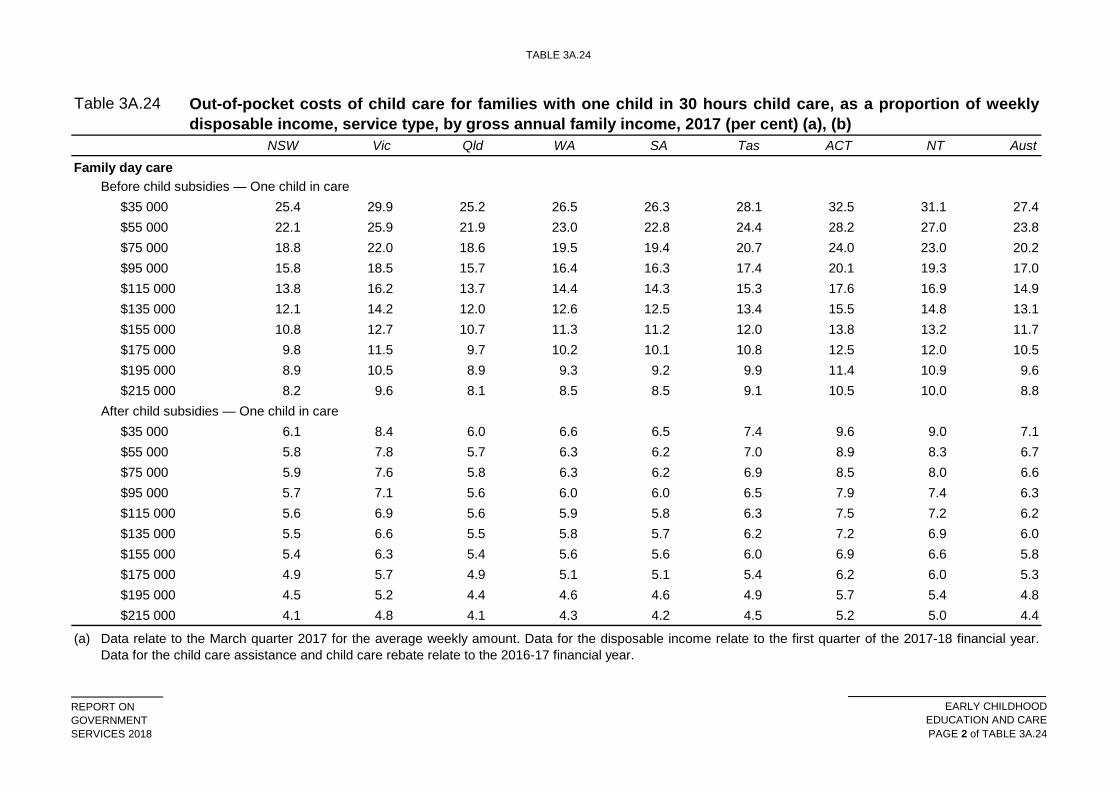
TABLE 3A.24
REPORT ONGOVERNMENTSERVICES 2018
EARLY CHILDHOODEDUCATION AND CAREPAGE 2 of TABLE 3A.24
Table 3A.24
NSW Vic Qld WA SA Tas ACT NT Aust
Out-of-pocket costs of child care for families with one child in 30 hours child care, as a proportion of weeklydisposable income, service type, by gross annual family income, 2017 (per cent) (a), (b)
Family day careBefore child subsidies — One child in care
$35 000 25.4 29.9 25.2 26.5 26.3 28.1 32.5 31.1 27.4$55 000 22.1 25.9 21.9 23.0 22.8 24.4 28.2 27.0 23.8$75 000 18.8 22.0 18.6 19.5 19.4 20.7 24.0 23.0 20.2$95 000 15.8 18.5 15.7 16.4 16.3 17.4 20.1 19.3 17.0$115 000 13.8 16.2 13.7 14.4 14.3 15.3 17.6 16.9 14.9$135 000 12.1 14.2 12.0 12.6 12.5 13.4 15.5 14.8 13.1$155 000 10.8 12.7 10.7 11.3 11.2 12.0 13.8 13.2 11.7$175 000 9.8 11.5 9.7 10.2 10.1 10.8 12.5 12.0 10.5$195 000 8.9 10.5 8.9 9.3 9.2 9.9 11.4 10.9 9.6$215 000 8.2 9.6 8.1 8.5 8.5 9.1 10.5 10.0 8.8
After child subsidies — One child in care$35 000 6.1 8.4 6.0 6.6 6.5 7.4 9.6 9.0 7.1$55 000 5.8 7.8 5.7 6.3 6.2 7.0 8.9 8.3 6.7$75 000 5.9 7.6 5.8 6.3 6.2 6.9 8.5 8.0 6.6$95 000 5.7 7.1 5.6 6.0 6.0 6.5 7.9 7.4 6.3$115 000 5.6 6.9 5.6 5.9 5.8 6.3 7.5 7.2 6.2$135 000 5.5 6.6 5.5 5.8 5.7 6.2 7.2 6.9 6.0$155 000 5.4 6.3 5.4 5.6 5.6 6.0 6.9 6.6 5.8$175 000 4.9 5.7 4.9 5.1 5.1 5.4 6.2 6.0 5.3$195 000 4.5 5.2 4.4 4.6 4.6 4.9 5.7 5.4 4.8$215 000 4.1 4.8 4.1 4.3 4.2 4.5 5.2 5.0 4.4
(a) Data relate to the March quarter 2017 for the average weekly amount. Data for the disposable income relate to the first quarter of the 2017-18 financial year.Data for the child care assistance and child care rebate relate to the 2016-17 financial year.
TABLE 3A.24
REPORT ONGOVERNMENTSERVICES 2018
EARLY CHILDHOODEDUCATION AND CAREPAGE 3 of TABLE 3A.24
Table 3A.24
NSW Vic Qld WA SA Tas ACT NT Aust
Out-of-pocket costs of child care for families with one child in 30 hours child care, as a proportion of weeklydisposable income, service type, by gross annual family income, 2017 (per cent) (a), (b)
(b)
Source :
These data are based on the scenario of 30 hours long day care or family day care per week and a specific family income level. 30 hours of care per weekreflects the average long day care and family day care use per week. In the March quarter 2017, the national average was 28.5 hours attendance per week perchild in long day care and 29.0 hours attendance per week per child in family day care (table 3A.17).
Australian Government Department of Education and Training (unpublished), CCMS.
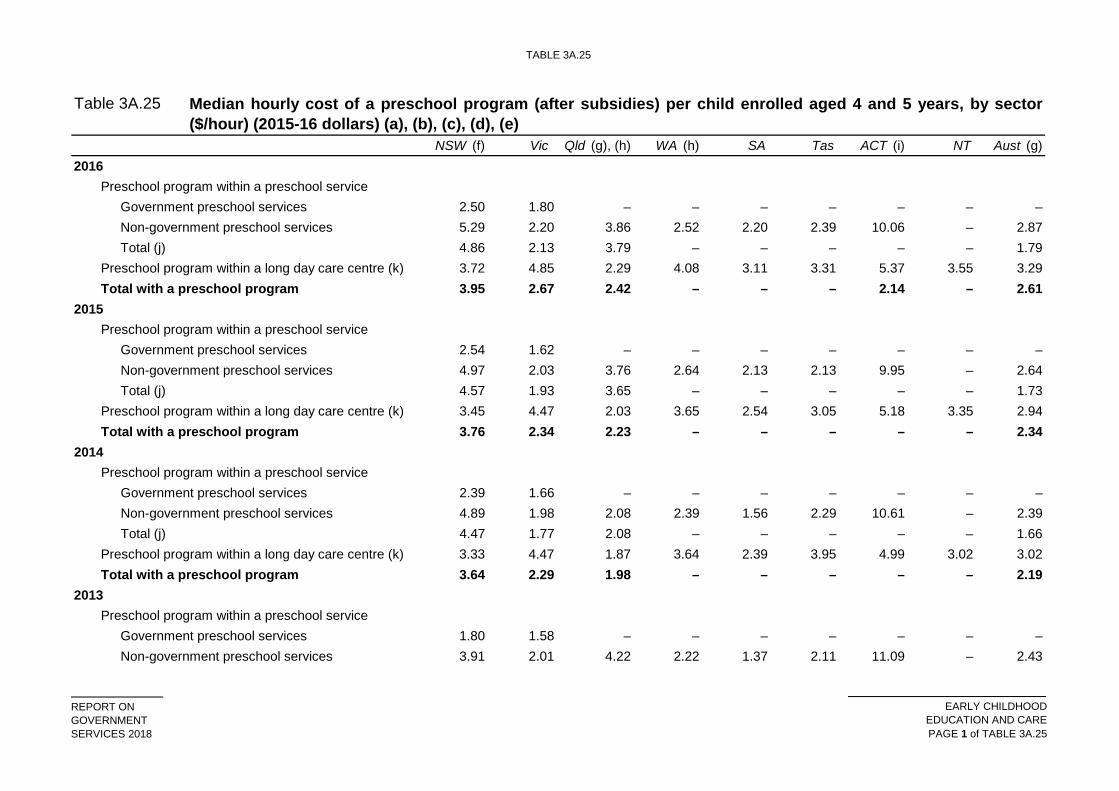
TABLE 3A.25
REPORT ONGOVERNMENTSERVICES 2018
EARLY CHILDHOODEDUCATION AND CAREPAGE 1 of TABLE 3A.25
Table 3A.25
NSW (f) Vic Qld (g), (h) WA (h) SA Tas ACT (i) NT Aust (g)2016
Preschool program within a preschool serviceGovernment preschool services 2.50 1.80 – – – – – – –Non-government preschool services 5.29 2.20 3.86 2.52 2.20 2.39 10.06 – 2.87Total (j) 4.86 2.13 3.79 – – – – – 1.79
Preschool program within a long day care centre (k) 3.72 4.85 2.29 4.08 3.11 3.31 5.37 3.55 3.29Total with a preschool program 3.95 2.67 2.42 – – – 2.14 – 2.61
2015Preschool program within a preschool service
Government preschool services 2.54 1.62 – – – – – – –Non-government preschool services 4.97 2.03 3.76 2.64 2.13 2.13 9.95 – 2.64Total (j) 4.57 1.93 3.65 – – – – – 1.73
Preschool program within a long day care centre (k) 3.45 4.47 2.03 3.65 2.54 3.05 5.18 3.35 2.94Total with a preschool program 3.76 2.34 2.23 – – – – – 2.34
2014Preschool program within a preschool service
Government preschool services 2.39 1.66 – – – – – – –Non-government preschool services 4.89 1.98 2.08 2.39 1.56 2.29 10.61 – 2.39Total (j) 4.47 1.77 2.08 – – – – – 1.66
Preschool program within a long day care centre (k) 3.33 4.47 1.87 3.64 2.39 3.95 4.99 3.02 3.02Total with a preschool program 3.64 2.29 1.98 – – – – – 2.19
2013Preschool program within a preschool service
Government preschool services 1.80 1.58 – – – – – – –Non-government preschool services 3.91 2.01 4.22 2.22 1.37 2.11 11.09 – 2.43
Median hourly cost of a preschool program (after subsidies) per child enrolled aged 4 and 5 years, by sector($/hour) (2015-16 dollars) (a), (b), (c), (d), (e)
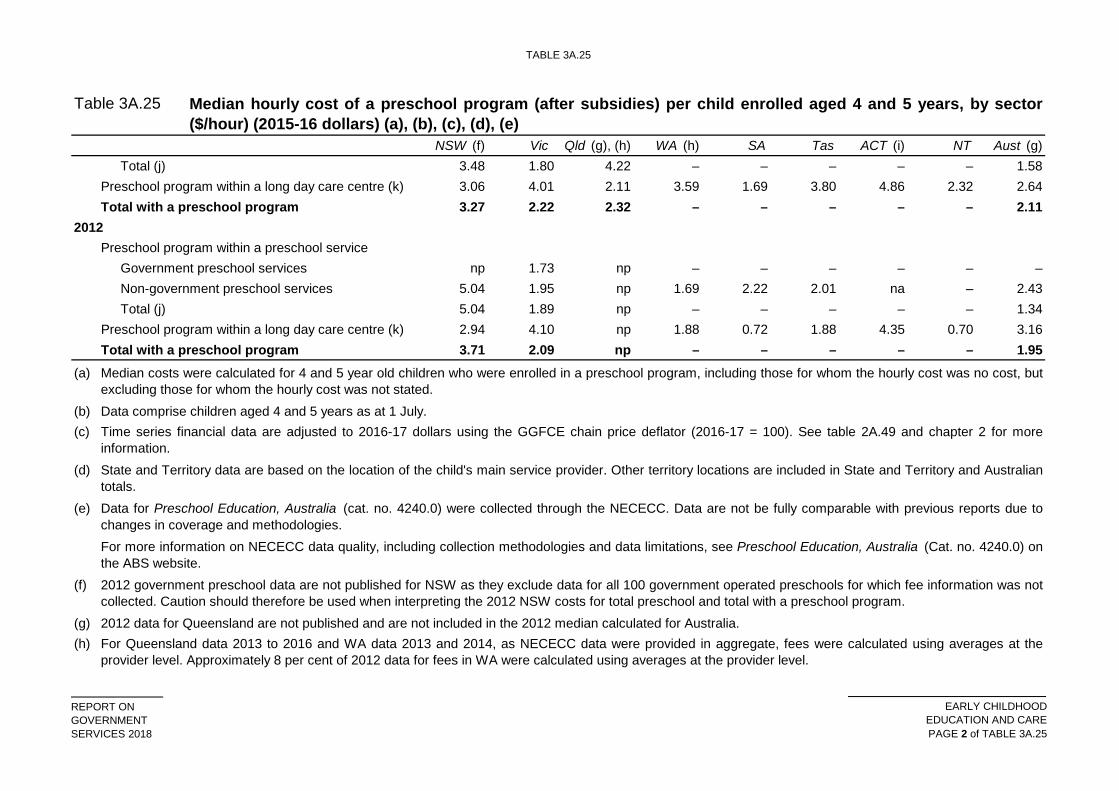
TABLE 3A.25
REPORT ONGOVERNMENTSERVICES 2018
EARLY CHILDHOODEDUCATION AND CAREPAGE 2 of TABLE 3A.25
Table 3A.25
NSW (f) Vic Qld (g), (h) WA (h) SA Tas ACT (i) NT Aust (g)
Median hourly cost of a preschool program (after subsidies) per child enrolled aged 4 and 5 years, by sector($/hour) (2015-16 dollars) (a), (b), (c), (d), (e)
Total (j) 3.48 1.80 4.22 – – – – – 1.58Preschool program within a long day care centre (k) 3.06 4.01 2.11 3.59 1.69 3.80 4.86 2.32 2.64Total with a preschool program 3.27 2.22 2.32 – – – – – 2.11
2012Preschool program within a preschool service
Government preschool services np 1.73 np – – – – – –Non-government preschool services 5.04 1.95 np 1.69 2.22 2.01 na – 2.43Total (j) 5.04 1.89 np – – – – – 1.34
Preschool program within a long day care centre (k) 2.94 4.10 np 1.88 0.72 1.88 4.35 0.70 3.16Total with a preschool program 3.71 2.09 np – – – – – 1.95
(a)
(b)(c)
(d)
(e)
(f)
(g)(h) For Queensland data 2013 to 2016 and WA data 2013 and 2014, as NECECC data were provided in aggregate, fees were calculated using averages at the
provider level. Approximately 8 per cent of 2012 data for fees in WA were calculated using averages at the provider level.
Median costs were calculated for 4 and 5 year old children who were enrolled in a preschool program, including those for whom the hourly cost was no cost, butexcluding those for whom the hourly cost was not stated.Data comprise children aged 4 and 5 years as at 1 July.
2012 government preschool data are not published for NSW as they exclude data for all 100 government operated preschools for which fee information was notcollected. Caution should therefore be used when interpreting the 2012 NSW costs for total preschool and total with a preschool program.
For more information on NECECC data quality, including collection methodologies and data limitations, see Preschool Education, Australia (Cat. no. 4240.0) onthe ABS website.
State and Territory data are based on the location of the child's main service provider. Other territory locations are included in State and Territory and Australiantotals.
Time series financial data are adjusted to 2016-17 dollars using the GGFCE chain price deflator (2016-17 = 100). See table 2A.49 and chapter 2 for moreinformation.
Data for Preschool Education, Australia (cat. no. 4240.0) were collected through the NECECC. Data are not be fully comparable with previous reports due tochanges in coverage and methodologies.
2012 data for Queensland are not published and are not included in the 2012 median calculated for Australia.
TABLE 3A.25
REPORT ONGOVERNMENTSERVICES 2018
EARLY CHILDHOODEDUCATION AND CAREPAGE 3 of TABLE 3A.25
Table 3A.25
NSW (f) Vic Qld (g), (h) WA (h) SA Tas ACT (i) NT Aust (g)
Median hourly cost of a preschool program (after subsidies) per child enrolled aged 4 and 5 years, by sector($/hour) (2015-16 dollars) (a), (b), (c), (d), (e)
(i)(j)(k)
na Not available. – Nil or rounded to zero. np Not published.Source :
Includes long day care with preschool and long day care with a preschool program and preschool.
ABS unpublished, Microdata: Preschool Education, Australia, 2016 (and previous years), Cat. no. 4240.0.55.003.
Total preschool includes multiple preschools.2012 data for the ACT exclude data for preschools within independent schools, which were unavailable.
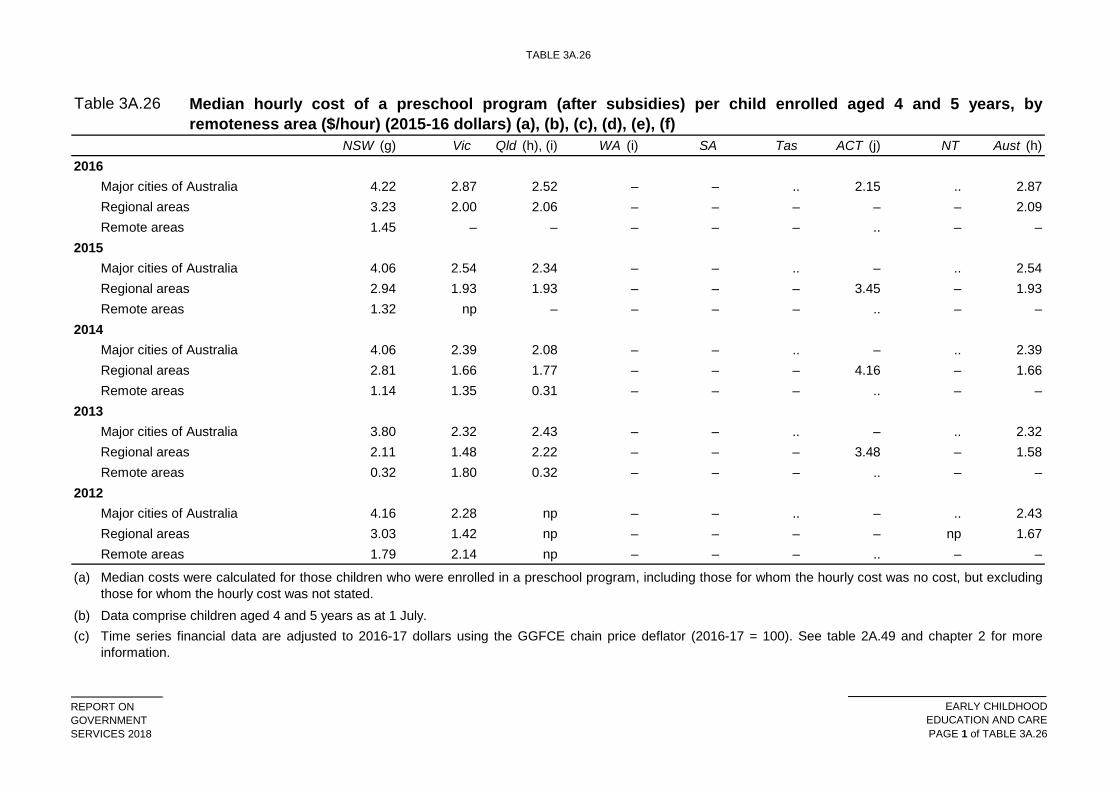
TABLE 3A.26
REPORT ONGOVERNMENTSERVICES 2018
EARLY CHILDHOODEDUCATION AND CAREPAGE 1 of TABLE 3A.26
Table 3A.26
NSW (g) Vic Qld (h), (i) WA (i) SA Tas ACT (j) NT Aust (h)2016
Major cities of Australia 4.22 2.87 2.52 – – .. 2.15 .. 2.87Regional areas 3.23 2.00 2.06 – – – – – 2.09Remote areas 1.45 – – – – – .. – –
2015Major cities of Australia 4.06 2.54 2.34 – – .. – .. 2.54Regional areas 2.94 1.93 1.93 – – – 3.45 – 1.93Remote areas 1.32 np – – – – .. – –
2014Major cities of Australia 4.06 2.39 2.08 – – .. – .. 2.39Regional areas 2.81 1.66 1.77 – – – 4.16 – 1.66Remote areas 1.14 1.35 0.31 – – – .. – –
2013Major cities of Australia 3.80 2.32 2.43 – – .. – .. 2.32Regional areas 2.11 1.48 2.22 – – – 3.48 – 1.58Remote areas 0.32 1.80 0.32 – – – .. – –
2012Major cities of Australia 4.16 2.28 np – – .. – .. 2.43Regional areas 3.03 1.42 np – – – – np 1.67Remote areas 1.79 2.14 np – – – .. – –
(a)
(b)(c)
Median hourly cost of a preschool program (after subsidies) per child enrolled aged 4 and 5 years, byremoteness area ($/hour) (2015-16 dollars) (a), (b), (c), (d), (e), (f)
Median costs were calculated for those children who were enrolled in a preschool program, including those for whom the hourly cost was no cost, but excludingthose for whom the hourly cost was not stated.Data comprise children aged 4 and 5 years as at 1 July.Time series financial data are adjusted to 2016-17 dollars using the GGFCE chain price deflator (2016-17 = 100). See table 2A.49 and chapter 2 for moreinformation.
TABLE 3A.26
REPORT ONGOVERNMENTSERVICES 2018
EARLY CHILDHOODEDUCATION AND CAREPAGE 2 of TABLE 3A.26
Table 3A.26
NSW (g) Vic Qld (h), (i) WA (i) SA Tas ACT (j) NT Aust (h)
Median hourly cost of a preschool program (after subsidies) per child enrolled aged 4 and 5 years, byremoteness area ($/hour) (2015-16 dollars) (a), (b), (c), (d), (e), (f)
(d)
(e)
(f)
(g)
(h)(i)
(j)
Source : ABS unpublished, Microdata: Preschool Education, Australia, 2012, 2013, 2014 and 2015 , Cat. no. 4240.0.55.003, Canberra... Not applicable. – Nil or rounded to zero. np Not published.
For Queensland data 2013 to 2016 and WA data 2013 and 2014, as NECECC data were provided in aggregate, fees were calculated using averages at theprovider level. Approximately 8 per cent of 2012 data for fees in WA were calculated using averages at the provider level. 2012 data for the ACT exclude data for preschools within independent schools, which were unavailable.
Remoteness areas are based upon the ABS ASGS 2011. Regional areas comprise inner regional and outer regional areas. Remote areas comprise remote andvery remote areas. The regional classification data are based on the location of the child's main service provider.
State and Territory data are based on the location of the child's main service provider. Other territory locations are included in State and Territory and Australiantotals.Data for Preschool Education, Australia (cat. no. 4240.0) were collected through the NECECC. Data are not be fully comparable with previous reports due tochanges in coverage and methodologies.For more information on NECECC data quality, including collection methodologies and data limitations, see Preschool Education, Australia (Cat. no. 4240.0) onthe ABS website.
For 2012, NSW data exclude all 100 government operated preschools, for which fee information is not collected. Caution should therefore be used wheninterpreting the 2012 NSW costs.For 2012, data for Queensland are not published and are not included in the 2012 median calculated for Australia.
NON-STANDARD HOURS
REPORT ONGOVERNMENTSERVICES 2018
EARLY CHILDHOODEDUCATION AND CARE
PAGE 1 of NON-STANDARD HOURS
Non-standard hoursof care in child care
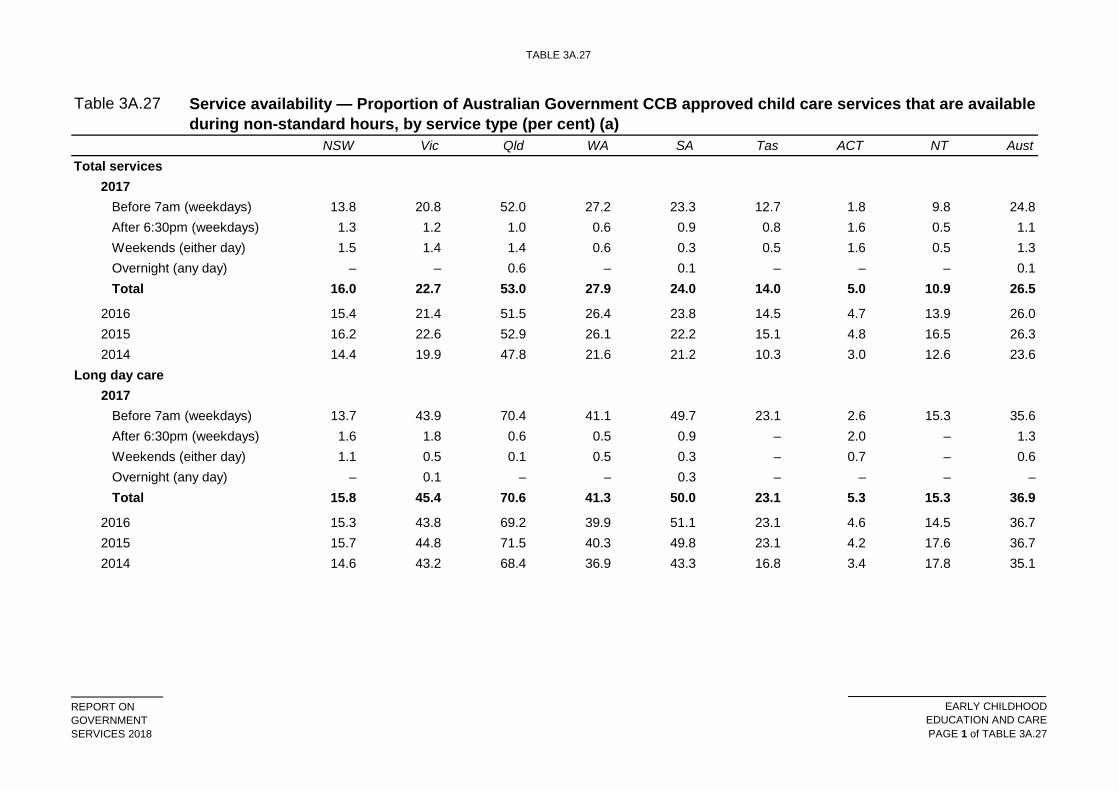
TABLE 3A.27
REPORT ONGOVERNMENTSERVICES 2018
EARLY CHILDHOODEDUCATION AND CAREPAGE 1 of TABLE 3A.27
Table 3A.27
NSW Vic Qld WA SA Tas ACT NT AustTotal services
2017Before 7am (weekdays) 13.8 20.8 52.0 27.2 23.3 12.7 1.8 9.8 24.8After 6:30pm (weekdays) 1.3 1.2 1.0 0.6 0.9 0.8 1.6 0.5 1.1Weekends (either day) 1.5 1.4 1.4 0.6 0.3 0.5 1.6 0.5 1.3Overnight (any day) – – 0.6 – 0.1 – – – 0.1Total 16.0 22.7 53.0 27.9 24.0 14.0 5.0 10.9 26.5
2016 15.4 21.4 51.5 26.4 23.8 14.5 4.7 13.9 26.02015 16.2 22.6 52.9 26.1 22.2 15.1 4.8 16.5 26.32014 14.4 19.9 47.8 21.6 21.2 10.3 3.0 12.6 23.6
Long day care2017
Before 7am (weekdays) 13.7 43.9 70.4 41.1 49.7 23.1 2.6 15.3 35.6After 6:30pm (weekdays) 1.6 1.8 0.6 0.5 0.9 – 2.0 – 1.3Weekends (either day) 1.1 0.5 0.1 0.5 0.3 – 0.7 – 0.6Overnight (any day) – 0.1 – – 0.3 – – – –Total 15.8 45.4 70.6 41.3 50.0 23.1 5.3 15.3 36.9
2016 15.3 43.8 69.2 39.9 51.1 23.1 4.6 14.5 36.72015 15.7 44.8 71.5 40.3 49.8 23.1 4.2 17.6 36.72014 14.6 43.2 68.4 36.9 43.3 16.8 3.4 17.8 35.1
Service availability — Proportion of Australian Government CCB approved child care services that are availableduring non-standard hours, by service type (per cent) (a)
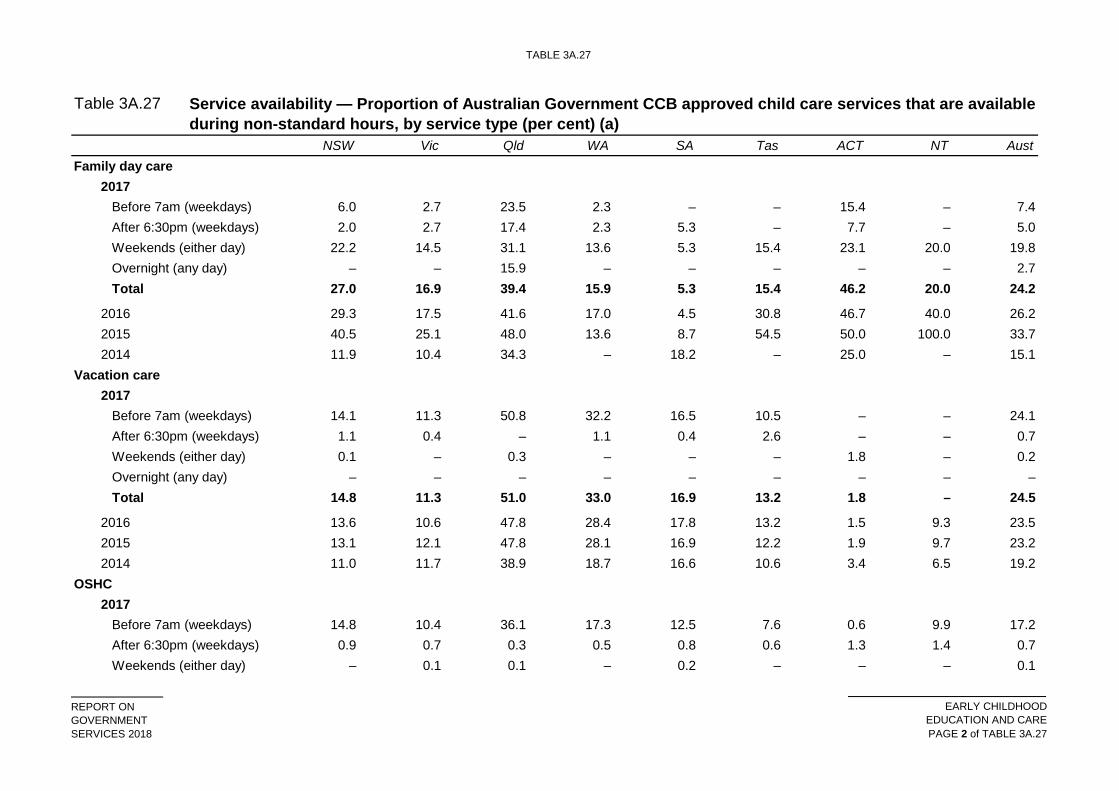
TABLE 3A.27
REPORT ONGOVERNMENTSERVICES 2018
EARLY CHILDHOODEDUCATION AND CAREPAGE 2 of TABLE 3A.27
Table 3A.27
NSW Vic Qld WA SA Tas ACT NT Aust
Service availability — Proportion of Australian Government CCB approved child care services that are availableduring non-standard hours, by service type (per cent) (a)
Family day care 2017
Before 7am (weekdays) 6.0 2.7 23.5 2.3 – – 15.4 – 7.4After 6:30pm (weekdays) 2.0 2.7 17.4 2.3 5.3 – 7.7 – 5.0Weekends (either day) 22.2 14.5 31.1 13.6 5.3 15.4 23.1 20.0 19.8Overnight (any day) – – 15.9 – – – – – 2.7Total 27.0 16.9 39.4 15.9 5.3 15.4 46.2 20.0 24.2
2016 29.3 17.5 41.6 17.0 4.5 30.8 46.7 40.0 26.22015 40.5 25.1 48.0 13.6 8.7 54.5 50.0 100.0 33.72014 11.9 10.4 34.3 – 18.2 – 25.0 – 15.1
Vacation care2017
Before 7am (weekdays) 14.1 11.3 50.8 32.2 16.5 10.5 – – 24.1After 6:30pm (weekdays) 1.1 0.4 – 1.1 0.4 2.6 – – 0.7Weekends (either day) 0.1 – 0.3 – – – 1.8 – 0.2Overnight (any day) – – – – – – – – –Total 14.8 11.3 51.0 33.0 16.9 13.2 1.8 – 24.5
2016 13.6 10.6 47.8 28.4 17.8 13.2 1.5 9.3 23.52015 13.1 12.1 47.8 28.1 16.9 12.2 1.9 9.7 23.22014 11.0 11.7 38.9 18.7 16.6 10.6 3.4 6.5 19.2
OSHC2017
Before 7am (weekdays) 14.8 10.4 36.1 17.3 12.5 7.6 0.6 9.9 17.2After 6:30pm (weekdays) 0.9 0.7 0.3 0.5 0.8 0.6 1.3 1.4 0.7Weekends (either day) – 0.1 0.1 – 0.2 – – – 0.1
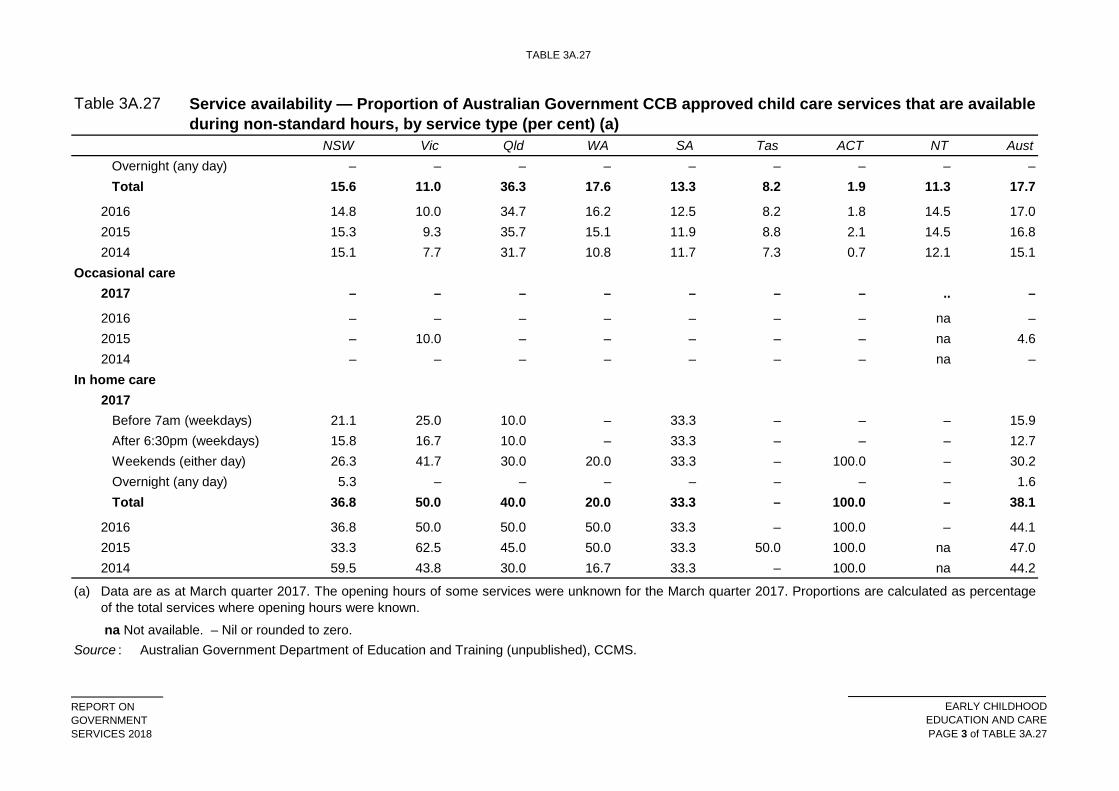
TABLE 3A.27
REPORT ONGOVERNMENTSERVICES 2018
EARLY CHILDHOODEDUCATION AND CAREPAGE 3 of TABLE 3A.27
Table 3A.27
NSW Vic Qld WA SA Tas ACT NT Aust
Service availability — Proportion of Australian Government CCB approved child care services that are availableduring non-standard hours, by service type (per cent) (a)
Overnight (any day) – – – – – – – – –Total 15.6 11.0 36.3 17.6 13.3 8.2 1.9 11.3 17.7
2016 14.8 10.0 34.7 16.2 12.5 8.2 1.8 14.5 17.02015 15.3 9.3 35.7 15.1 11.9 8.8 2.1 14.5 16.82014 15.1 7.7 31.7 10.8 11.7 7.3 0.7 12.1 15.1
Occasional care2017 – – – – – – – .. –
2016 – – – – – – – na –2015 – 10.0 – – – – – na 4.62014 – – – – – – – na –
In home care 2017
Before 7am (weekdays) 21.1 25.0 10.0 – 33.3 – – – 15.9After 6:30pm (weekdays) 15.8 16.7 10.0 – 33.3 – – – 12.7Weekends (either day) 26.3 41.7 30.0 20.0 33.3 – 100.0 – 30.2Overnight (any day) 5.3 – – – – – – – 1.6Total 36.8 50.0 40.0 20.0 33.3 – 100.0 – 38.1
2016 36.8 50.0 50.0 50.0 33.3 – 100.0 – 44.12015 33.3 62.5 45.0 50.0 33.3 50.0 100.0 na 47.02014 59.5 43.8 30.0 16.7 33.3 – 100.0 na 44.2
(a)
Source : Australian Government Department of Education and Training (unpublished), CCMS. na Not available. – Nil or rounded to zero.
Data are as at March quarter 2017. The opening hours of some services were unknown for the March quarter 2017. Proportions are calculated as percentageof the total services where opening hours were known.
DEMAND FOR ECEC
REPORT ONGOVERNMENTSERVICES 2018
EARLY CHILDHOODEDUCATION AND CARE
PAGE 1 of DEMAND FOR ECEC
Demand for ECEC

TABLE 3A.28
REPORT ONGOVERNMENTSERVICES 2018
EARLY CHILDHOODEDUCATION AND CAREPAGE 1 of TABLE 3A.28
Table 3A.28
Unit2014
Children aged 0–12 yearsFor whom additional formal child care or preschool was currently required, and who currently required additional:
Child care (f) '000Preschool (g) '000Child care or preschool (h) '000
'000
All 0–12 year old children '000
'000
Proportion of 0–12 year old children
% 88.9 ± 1.7 90.4 ± 1.6 91.7 ± 2.0 89.9 ± 2.3 89.5 ± 2.5 89.0 ± 3.5 88.2 ± 3.2 88.2 ± 4.3 90.0 ± 0.8And who currently:
Used formal child care (i) % 21.0 ± 2.6 19.4 ± 2.0 21.6 ± 3.1 13.6 ± 2.6 15.9 ± 3.4 14.8 ± 2.7 26.9 ± 4.3 18.0 ± 5.5 19.6 ± 1.1
Used informal care only (j) % 24.4 ± 2.4 22.5 ± 3.0 19.1 ± 3.0 23.1 ± 3.1 26.8 ± 4.1 26.7 ± 4.8 17.1 ± 6.3 23.9 ± 6.7 22.8 ± 1.3
Used preschool (k) % 3.6 ± 0.8 7.4 ± 1.3 4.1 ± 1.0 4.8 ± 1.3 4.4 ± 1.5 9.0 ± 2.6 np 2.9 ± 2.5 4.9 ± 0.5
Did not use child care or preschool % 49.8 ± 3.0 50.1 ± 2.7 55.5 ± 3.2 57.4 ± 3.6 52.5 ± 4.7 50.5 ± 4.9 48.2 ± 6.7 54.0 ± 5.6 52.2 ± 1.3
% 10.9 ± 1.7 9.5 ± 1.6 8.4 ± 2.0 10.1 ± 2.4 10.5 ± 2.5 11.0 ± 3.6 13.4 ± 3.4 11.8 ± 4.4 10.0 ± 0.8And who currently:
Used formal child care (i) % 5.1 ± 1.0 1.9 ± 0.7 2.6 ± 1.1 2.0 ± 1.1 2.6 ± 1.3 2.1 ± 1.2 3.5 ± 2.0 4.1 ± 3.0 3.2 ± 0.4
Used informal care only (j) % 2.4 ± 0.8 2.6 ± 1.2 1.4 ± 1.0 2.4 ± 1.0 2.1 ± 1.3 4.0 ± 2.9 np np 2.3 ± 0.4
Used preschool (k) % 1.6 ± 0.6 2.9 ± 0.9 1.4 ± 0.8 3.9 ± 1.2 3.8 ± 1.7 3.5 ± 1.5 7.1 ± 2.8 1.8 ± 1.6 2.4 ± 0.4
For whom additional formal child care or preschool was required
For whom additional formal child care or preschool was not required
For whom additional formal child care or preschool was not currently required
For whom additional formal child care was currently required for mainly work-related reasons
29.9
Children aged 0–12 years by whether additional formal child care or preschool was currently required, bycurrent use (a), (b), (c), (d), (e)
248.6
3 461.1
3 843.8
2.7 1.8 4.0
175.5 384.4
48.2 26.9 67.8
744.4
811.5
14.1 16.5 26.9
230.5
257.4
22.2 22.0 43.7
387.9
431.6
6.4 3.7 9.0
72.9
81.9
4.4 4.0 8.5
54.6
NSW Vic
94.4 61.3 43.2
134.9
1 097.7
1 234.7
49.6 25.3
88.9
843.0
932.5
Qld WA SA Tas ACT NT Aust
55.8
63.3 33.9
24.8 13.0 8.9 4.1 np 1.6 137.5
TABLE 3A.28
REPORT ONGOVERNMENTSERVICES 2018
EARLY CHILDHOODEDUCATION AND CAREPAGE 2 of TABLE 3A.28
Table 3A.28
Unit
Children aged 0–12 years by whether additional formal child care or preschool was currently required, bycurrent use (a), (b), (c), (d), (e)
NSW Vic Qld WA SA Tas ACT NT AustDid not use child care or preschool % 2.5 ± 1.0 3.4 ± 1.1 3.2 ± 1.1 3.4 ± 1.5 3.0 ± 1.4 4.5 ± 2.2 np 4.4 ± 2.9 3.1 ± 0.5
Whether additional formal child care or preschool currently required was available upon application (l)% 13.1 ± 6.5 15.9 ± 7.5 11.7 ± 5.1 11.4 ± 9.1 19.0 ±10.4 24.4 ±15.3 np 15.0 ±13.5 12.9 ± 3.0
% 25.9 ± 7.3 19.9 ± 8.5 9.6 ± 7.9 10.3 ± 6.9 13.4 ± 8.2 np 32.9 ±26.6 32.5 ±19.4 18.9 ± 3.1
% 48.3 ± 7.0 42.4 ± 9.9 59.3 ±12.1 44.6 ±15.3 46.1 ±14.9 60.0 ±14.4 np 52.5 ±13.3 49.2 ± 5.3
% 14.2 ± 5.5 21.0 ± 8.4 11.9 ± 7.3 27.0 ± 8.0 21.2 ±11.3 np 38.8 ±24.1 np 18.9 ± 2.6
% 4.0 ± 1.2 2.7 ± 0.9 3.1 ± 1.5 3.0 ± 1.3 3.5 ± 1.6 5.0 ± 2.9 np 4.7 ± 3.1 3.6 ± 0.6
2011Children aged 0–12 years
For whom additional formal child care or preschool was currently required, and who currently required additional:Child care (f) '000Preschool (g) '000Child care or preschool (h) '000
'000
All 0–12 year old children '000
'000
Proportion of all 0–12 year old children
3.3 1.7 4.8
81.3
67.6 201.9
3 446.6
251.2
13.4
380.7 3 647.6
np 1.2 1.4
31.4
33.2
2.4
Available upon application
For whom additional formal child care or preschool was not currently required 732.9
773.5 86.3 58.1For whom additional formal child care was currently required for mainly work-related reasons
27.3 26.9 21.2 10.4 7.7 2.6
1 176.9
42.4 26.9
888.4
63.6
1 110.5
43.1
34.0 10.2
9.1 3.5
11.2
239.7
149.4 3.5
3.7
55.3
Not available upon applicationDid not apply for additional formal child care or preschoolNot applicable because stated currently required additional preschool but already using maximum amount of preschool (15 hours per week)
97.9
For whom additional formal child care was currently required for mainly work-related reasons
52.5
834.8
np 40.4 13.5
np
6.3 21.2
359.8
TABLE 3A.28
REPORT ONGOVERNMENTSERVICES 2018
EARLY CHILDHOODEDUCATION AND CAREPAGE 3 of TABLE 3A.28
Table 3A.28
Unit
Children aged 0–12 years by whether additional formal child care or preschool was currently required, bycurrent use (a), (b), (c), (d), (e)
NSW Vic Qld WA SA Tas ACT NT Aust
% 94.4 ± 0.8 94.0 ± 1.5 94.8 ± 1.8 94.5 ± 1.9 95.4 ± 1.0 94.2 ± 3.6 95.2 ± 3.2 94.6 ± 3.0 94.5 ± 0.5And who currently:
Used formal child care (i) % 20.1 ± 2.1 20.5 ± 2.3 23.9 ± 2.7 12.3 ± 1.9 20.1 ± 2.7 16.6 ± 4.1 26.0 ± 5.6 18.4 ± 5.9 20.2 ± 1.2
Used informal care only (j) % 27.5 ± 2.6 25.2 ± 2.7 23.7 ± 2.8 31.6 ± 3.7 34.6 ± 3.5 33.6 ± 5.0 27.0 ± 5.9 24.7 ± 7.0 27.2 ± 1.4
Used preschool (k) % 5.8 ± 0.9 9.5 ± 1.3 4.6 ± 1.0 8.9 ± 1.4 7.6 ± 1.1 9.7 ± 2.2 8.1 ± 2.7 7.5 ± 2.2 7.0 ± 0.5
Did not use child care or preschool % 54.1 ± 2.5 53.3 ± 2.8 56.1 ± 3.4 58.3 ± 3.2 51.9 ± 3.5 58.9 ± 5.4 47.0 ± 4.7 60.2 ± 7.6 54.7 ± 1.5
% 5.4 ± 0.9 5.9 ± 1.6 5.6 ± 1.6 5.6 ± 1.4 4.5 ± 1.5 5.6 ± 2.3 6.4 ± 3.3 4.2 ± 2.5 5.5 ± 0.5And who currently:
Used formal child care (i) % 2.3 ± 0.6 2.3 ± 0.9 3.0 ± 1.0 2.6 ± 0.9 1.2 ± 0.8 1.9 ± 1.2 np 2.4 ± 1.7 2.3 ± 0.4
Used informal care only (j) % 1.4 ± 0.5 1.6 ± 0.9 0.9 ± 0.5 0.9 ± 0.8 1.8 ± 0.9 1.5 ± 1.1 2.4 ± 1.7 np 1.3 ± 0.3
Used preschool (k) % 0.5 ± 0.4 1.4 ± 0.6 0.4 ± 0.3 np 0.9 ± 0.7 1.9 ± 1.6 2.6 ± 2.1 np 0.8 ± 0.2
Did not use child care or preschool % 2.0 ± 0.7 2.2 ± 0.9 2.3 ± 1.0 1.1 ± 0.7 1.7 ± 1.1 np np np 2.0 ± 0.4
% 2.3 ± 0.6 3.0 ± 1.0 2.7 ± 1.4 2.7 ± 1.0 3.1 ± 1.4 3.0 ± 1.7 4.1 ± 2.9 np 2.7 ± 0.4
(a)
(b) As data are from a survey they are subject to error, including sampling variability and non-sampling errors. Data in italics have relative standard errors between25 per cent and 50 per cent and need to be used with caution. Data with relative standard errors greater than 50 per cent are considered too unreliable forgeneral use and are not published here. The 95 per cent confidence interval (a reliability estimate) associated with each proportion estimate is reported (forexample, 80.0 per cent ± 2.7 per cent). See chapter 2 for more information on confidence intervals and relative standard errors.
For whom additional formal child care or preschool was not required
For whom additional formal child care or preschool was required
Additional formal child care or preschool includes current requirements for child care or preschool services for children attending formal child care or preschoolservices and parents wished for them to attend more, and children who did not attend formal child care or preschool services and parents wished for them toattend. These data are not intended for use as a measure of 'unmet demand'.
For whom additional formal child care was currently required for mainly work-related reasons
TABLE 3A.28
REPORT ONGOVERNMENTSERVICES 2018
EARLY CHILDHOODEDUCATION AND CAREPAGE 4 of TABLE 3A.28
Table 3A.28
Unit
Children aged 0–12 years by whether additional formal child care or preschool was currently required, bycurrent use (a), (b), (c), (d), (e)
NSW Vic Qld WA SA Tas ACT NT Aust(c)
(d)
(e)(f)
(g)
(h)(i)(j)(k)(i)
np Not published. Source : ABS unpublished, Microdata: Childhood Education and Care, Australia, June 2011 and 2014 , Cat. no. 4402.0.55.001.
Only includes children who used informal care and did not use formal care or preschool.
Components do not add to total as a child may require both additional formal child care and preschool services.Includes children who used formal care and those who used both formal and informal care.
The 2014 Childhood Education and Care Survey (CEaCS) was conducted in both urban and rural areas in all states and territories but excluded people living inAboriginal and Torres Strait Islander Communities. This exclusion is unlikely to impact on state and territory estimates, except in the NT where they account forapproximately 15 per cent of the population aged 15–74 years. In comparison, the 2011 CEaCS excluded people living in Aboriginal and Torres Strait IslanderCommunities or in very remote parts of Australia. For more information on data quality, including collection methodologies and data limitations, see Childhood Education and Care, Australia (Cat. no. 4402.0) onthe ABS website.Data that were not published due to small numbers are included in the total for Australia.Includes children who attended formal child care and parents wished for them to attend more, and children who did not attend formal child care and parentswished for them to attend.Includes children who attended preschool and parents wished for them to attend more, and children who did not attend preschool and parents wished for themto attend.
This item is only included for 2014 because data are not comparable to 2011. Includes children who used preschool, including those who also used formal child care, informal care or both.
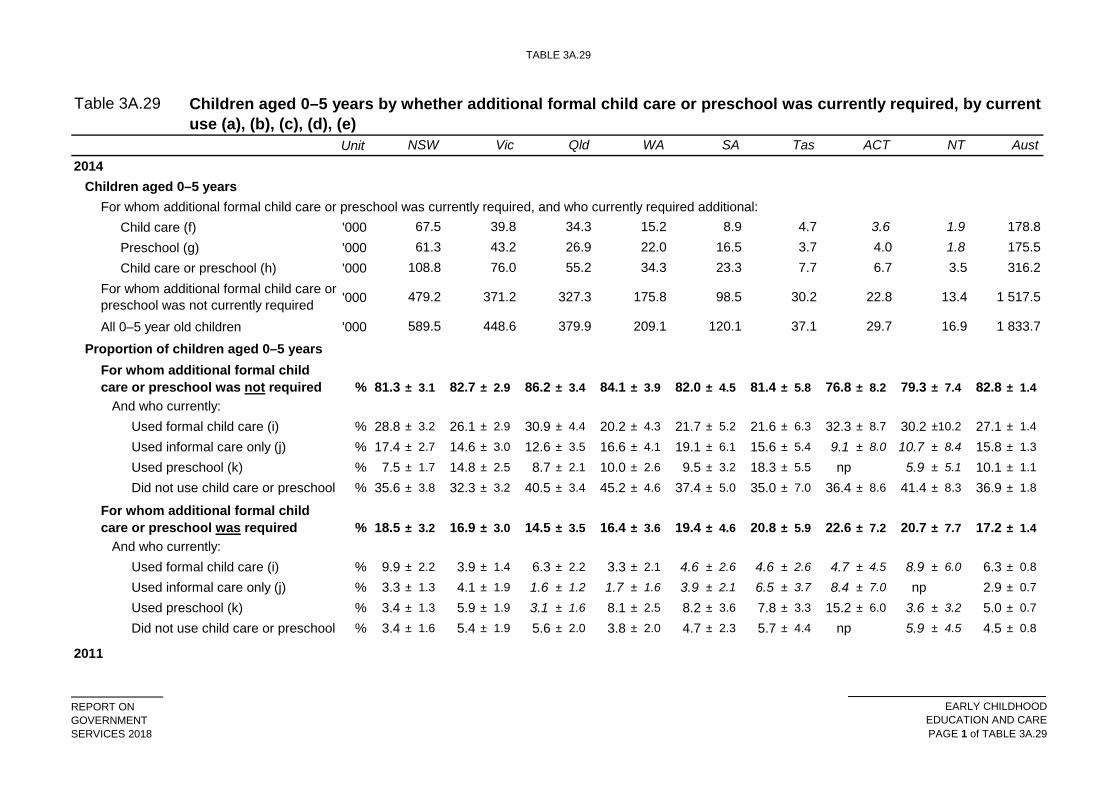
TABLE 3A.29
REPORT ONGOVERNMENTSERVICES 2018
EARLY CHILDHOODEDUCATION AND CAREPAGE 1 of TABLE 3A.29
Table 3A.29
Unit2014
Children aged 0–5 yearsFor whom additional formal child care or preschool was currently required, and who currently required additional:
Child care (f) '000Preschool (g) '000Child care or preschool (h) '000
'000
All 0–5 year old children '000Proportion of children aged 0–5 years
% 81.3 ± 3.1 82.7 ± 2.9 86.2 ± 3.4 84.1 ± 3.9 82.0 ± 4.5 81.4 ± 5.8 76.8 ± 8.2 79.3 ± 7.4 82.8 ± 1.4And who currently:
Used formal child care (i) % 28.8 ± 3.2 26.1 ± 2.9 30.9 ± 4.4 20.2 ± 4.3 21.7 ± 5.2 21.6 ± 6.3 32.3 ± 8.7 30.2 ±10.2 27.1 ± 1.4
Used informal care only (j) % 17.4 ± 2.7 14.6 ± 3.0 12.6 ± 3.5 16.6 ± 4.1 19.1 ± 6.1 15.6 ± 5.4 9.1 ± 8.0 10.7 ± 8.4 15.8 ± 1.3
Used preschool (k) % 7.5 ± 1.7 14.8 ± 2.5 8.7 ± 2.1 10.0 ± 2.6 9.5 ± 3.2 18.3 ± 5.5 np 5.9 ± 5.1 10.1 ± 1.1
Did not use child care or preschool % 35.6 ± 3.8 32.3 ± 3.2 40.5 ± 3.4 45.2 ± 4.6 37.4 ± 5.0 35.0 ± 7.0 36.4 ± 8.6 41.4 ± 8.3 36.9 ± 1.8
% 18.5 ± 3.2 16.9 ± 3.0 14.5 ± 3.5 16.4 ± 3.6 19.4 ± 4.6 20.8 ± 5.9 22.6 ± 7.2 20.7 ± 7.7 17.2 ± 1.4And who currently:
Used formal child care (i) % 9.9 ± 2.2 3.9 ± 1.4 6.3 ± 2.2 3.3 ± 2.1 4.6 ± 2.6 4.6 ± 2.6 4.7 ± 4.5 8.9 ± 6.0 6.3 ± 0.8
Used informal care only (j) % 3.3 ± 1.3 4.1 ± 1.9 1.6 ± 1.2 1.7 ± 1.6 3.9 ± 2.1 6.5 ± 3.7 8.4 ± 7.0 np 2.9 ± 0.7
Used preschool (k) % 3.4 ± 1.3 5.9 ± 1.9 3.1 ± 1.6 8.1 ± 2.5 8.2 ± 3.6 7.8 ± 3.3 15.2 ± 6.0 3.6 ± 3.2 5.0 ± 0.7
Did not use child care or preschool % 3.4 ± 1.6 5.4 ± 1.9 5.6 ± 2.0 3.8 ± 2.0 4.7 ± 2.3 5.7 ± 4.4 np 5.9 ± 4.5 4.5 ± 0.8
2011
Children aged 0–5 years by whether additional formal child care or preschool was currently required, by currentuse (a), (b), (c), (d), (e)
NSW Vic Qld WA SA Tas ACT NT Aust
67.5 39.8 34.3 15.2 8.9 4.7 3.6 1.9 178.8 4.0 1.8 175.5
108.8 76.0 55.2 34.3 23.3 7.7 6.7 61.3 43.2 26.9 22.0 16.5 3.7
3.5 316.2
For whom additional formal child care or preschool was required
For whom additional formal child care or preschool was not required
13.4 1 517.5
589.5 448.6 379.9 209.1 120.1 37.1 29.7 16.9
For whom additional formal child care or preschool was not currently required 479.2 371.2 327.3 175.8 98.5 30.2 22.8
1 833.7
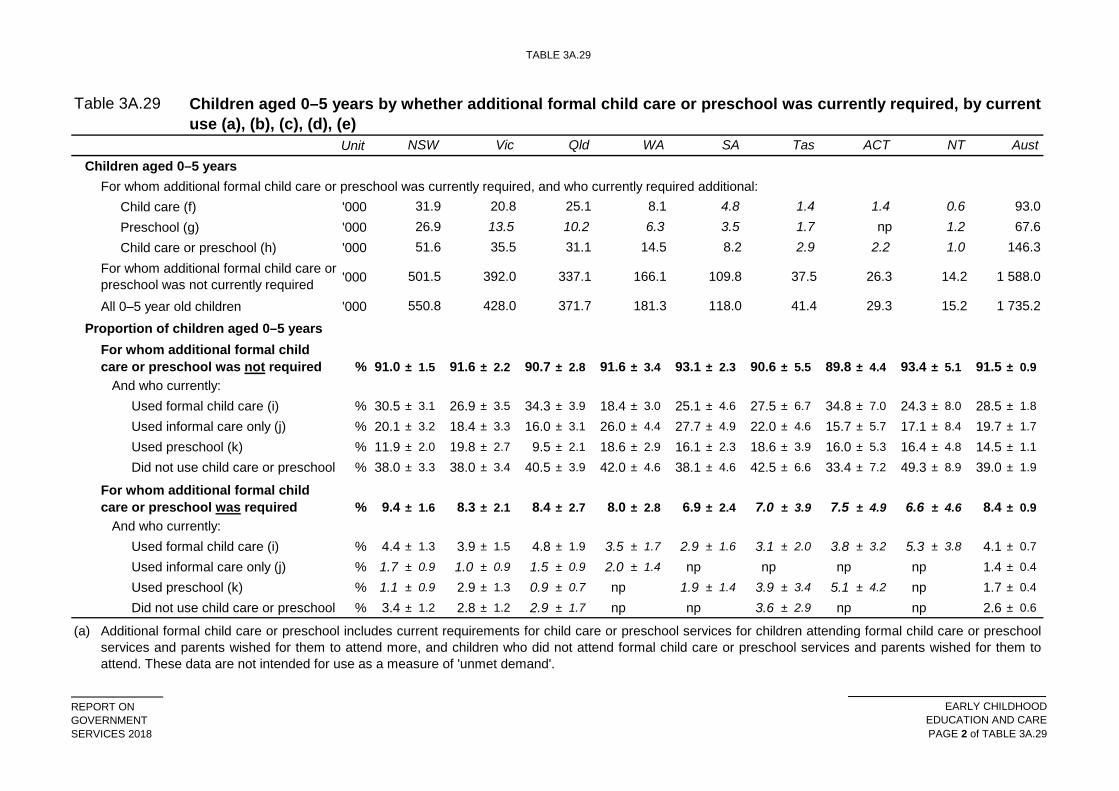
TABLE 3A.29
REPORT ONGOVERNMENTSERVICES 2018
EARLY CHILDHOODEDUCATION AND CAREPAGE 2 of TABLE 3A.29
Table 3A.29
Unit
Children aged 0–5 years by whether additional formal child care or preschool was currently required, by currentuse (a), (b), (c), (d), (e)
NSW Vic Qld WA SA Tas ACT NT AustChildren aged 0–5 years
For whom additional formal child care or preschool was currently required, and who currently required additional:Child care (f) '000Preschool (g) '000Child care or preschool (h) '000
'000
All 0–5 year old children '000Proportion of children aged 0–5 years
% 91.0 ± 1.5 91.6 ± 2.2 90.7 ± 2.8 91.6 ± 3.4 93.1 ± 2.3 90.6 ± 5.5 89.8 ± 4.4 93.4 ± 5.1 91.5 ± 0.9And who currently:
Used formal child care (i) % 30.5 ± 3.1 26.9 ± 3.5 34.3 ± 3.9 18.4 ± 3.0 25.1 ± 4.6 27.5 ± 6.7 34.8 ± 7.0 24.3 ± 8.0 28.5 ± 1.8
Used informal care only (j) % 20.1 ± 3.2 18.4 ± 3.3 16.0 ± 3.1 26.0 ± 4.4 27.7 ± 4.9 22.0 ± 4.6 15.7 ± 5.7 17.1 ± 8.4 19.7 ± 1.7
Used preschool (k) % 11.9 ± 2.0 19.8 ± 2.7 9.5 ± 2.1 18.6 ± 2.9 16.1 ± 2.3 18.6 ± 3.9 16.0 ± 5.3 16.4 ± 4.8 14.5 ± 1.1
Did not use child care or preschool % 38.0 ± 3.3 38.0 ± 3.4 40.5 ± 3.9 42.0 ± 4.6 38.1 ± 4.6 42.5 ± 6.6 33.4 ± 7.2 49.3 ± 8.9 39.0 ± 1.9
% 9.4 ± 1.6 8.3 ± 2.1 8.4 ± 2.7 8.0 ± 2.8 6.9 ± 2.4 7.0 ± 3.9 7.5 ± 4.9 6.6 ± 4.6 8.4 ± 0.9And who currently:
Used formal child care (i) % 4.4 ± 1.3 3.9 ± 1.5 4.8 ± 1.9 3.5 ± 1.7 2.9 ± 1.6 3.1 ± 2.0 3.8 ± 3.2 5.3 ± 3.8 4.1 ± 0.7
Used informal care only (j) % 1.7 ± 0.9 1.0 ± 0.9 1.5 ± 0.9 2.0 ± 1.4 np np np np 1.4 ± 0.4
Used preschool (k) % 1.1 ± 0.9 2.9 ± 1.3 0.9 ± 0.7 np 1.9 ± 1.4 3.9 ± 3.4 5.1 ± 4.2 np 1.7 ± 0.4
Did not use child care or preschool % 3.4 ± 1.2 2.8 ± 1.2 2.9 ± 1.7 np np 3.6 ± 2.9 np np 2.6 ± 0.6
(a)
1.4 0.6 93.0 26.9 13.5 10.2 6.3 3.5 1.7 np 31.9 20.8 25.1 8.1 4.8 1.4
1.2 67.6 51.6 35.5 31.1 14.5 8.2 2.9 2.2 1.0 146.3
Additional formal child care or preschool includes current requirements for child care or preschool services for children attending formal child care or preschoolservices and parents wished for them to attend more, and children who did not attend formal child care or preschool services and parents wished for them toattend. These data are not intended for use as a measure of 'unmet demand'.
For whom additional formal child care or preschool was required
For whom additional formal child care or preschool was not required
1 588.0
550.8 428.0 371.7 181.3 118.0 41.4 29.3 15.2 1 735.2
For whom additional formal child care or preschool was not currently required 501.5 392.0 337.1 166.1 109.8 37.5 26.3 14.2
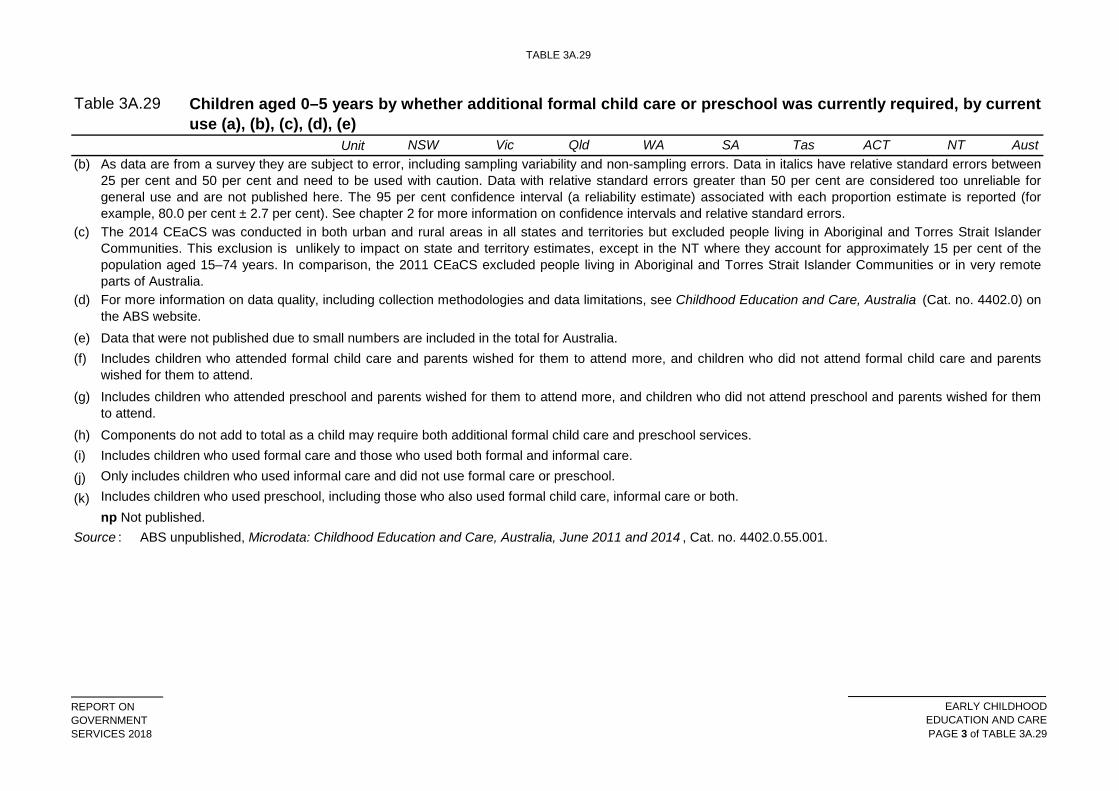
TABLE 3A.29
REPORT ONGOVERNMENTSERVICES 2018
EARLY CHILDHOODEDUCATION AND CAREPAGE 3 of TABLE 3A.29
Table 3A.29
Unit
Children aged 0–5 years by whether additional formal child care or preschool was currently required, by currentuse (a), (b), (c), (d), (e)
NSW Vic Qld WA SA Tas ACT NT Aust(b)
(c)
(d)
(e)(f)
(g)
(h)(i)(j)(k)
np Not published. Source :
Components do not add to total as a child may require both additional formal child care and preschool services.Includes children who used formal care and those who used both formal and informal care.Only includes children who used informal care and did not use formal care or preschool.Includes children who used preschool, including those who also used formal child care, informal care or both.
ABS unpublished, Microdata: Childhood Education and Care, Australia, June 2011 and 2014 , Cat. no. 4402.0.55.001.
As data are from a survey they are subject to error, including sampling variability and non-sampling errors. Data in italics have relative standard errors between25 per cent and 50 per cent and need to be used with caution. Data with relative standard errors greater than 50 per cent are considered too unreliable forgeneral use and are not published here. The 95 per cent confidence interval (a reliability estimate) associated with each proportion estimate is reported (forexample, 80.0 per cent ± 2.7 per cent). See chapter 2 for more information on confidence intervals and relative standard errors. The 2014 CEaCS was conducted in both urban and rural areas in all states and territories but excluded people living in Aboriginal and Torres Strait IslanderCommunities. This exclusion is unlikely to impact on state and territory estimates, except in the NT where they account for approximately 15 per cent of thepopulation aged 15–74 years. In comparison, the 2011 CEaCS excluded people living in Aboriginal and Torres Strait Islander Communities or in very remoteparts of Australia. For more information on data quality, including collection methodologies and data limitations, see Childhood Education and Care, Australia (Cat. no. 4402.0) onthe ABS website.Data that were not published due to small numbers are included in the total for Australia.Includes children who attended formal child care and parents wished for them to attend more, and children who did not attend formal child care and parentswished for them to attend.Includes children who attended preschool and parents wished for them to attend more, and children who did not attend preschool and parents wished for themto attend.
STAFF QUALITY IN ECEC
REPORT ONGOVERNMENTSERVICES 2018
EARLY CHILDHOODEDUCATION AND CARE
PAGE 1 of STAFF QUALITY IN ECEC
Staff quality in ECEC
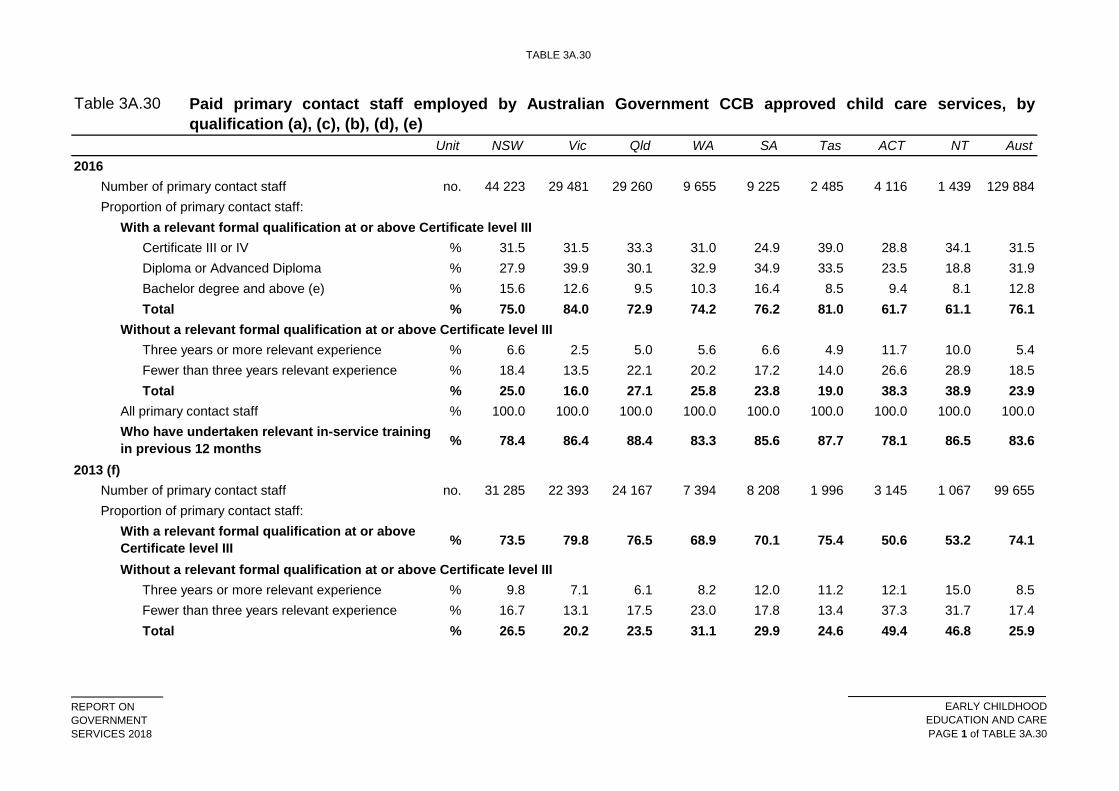
TABLE 3A.30
REPORT ONGOVERNMENTSERVICES 2018
EARLY CHILDHOODEDUCATION AND CAREPAGE 1 of TABLE 3A.30
Table 3A.30
Unit NSW Vic Qld WA SA Tas ACT NT Aust2016
Number of primary contact staff no. 44 223 29 481 29 260 9 655 9 225 2 485 4 116 1 439 129 884Proportion of primary contact staff:
With a relevant formal qualification at or above Certificate level IIICertificate III or IV % 31.5 31.5 33.3 31.0 24.9 39.0 28.8 34.1 31.5Diploma or Advanced Diploma % 27.9 39.9 30.1 32.9 34.9 33.5 23.5 18.8 31.9Bachelor degree and above (e) % 15.6 12.6 9.5 10.3 16.4 8.5 9.4 8.1 12.8Total % 75.0 84.0 72.9 74.2 76.2 81.0 61.7 61.1 76.1
Without a relevant formal qualification at or above Certificate level IIIThree years or more relevant experience % 6.6 2.5 5.0 5.6 6.6 4.9 11.7 10.0 5.4Fewer than three years relevant experience % 18.4 13.5 22.1 20.2 17.2 14.0 26.6 28.9 18.5Total % 25.0 16.0 27.1 25.8 23.8 19.0 38.3 38.9 23.9
All primary contact staff % 100.0 100.0 100.0 100.0 100.0 100.0 100.0 100.0 100.0
% 78.4 86.4 88.4 83.3 85.6 87.7 78.1 86.5 83.6
2013 (f)Number of primary contact staff no. 31 285 22 393 24 167 7 394 8 208 1 996 3 145 1 067 99 655Proportion of primary contact staff:
% 73.5 79.8 76.5 68.9 70.1 75.4 50.6 53.2 74.1
Without a relevant formal qualification at or above Certificate level IIIThree years or more relevant experience % 9.8 7.1 6.1 8.2 12.0 11.2 12.1 15.0 8.5Fewer than three years relevant experience % 16.7 13.1 17.5 23.0 17.8 13.4 37.3 31.7 17.4Total % 26.5 20.2 23.5 31.1 29.9 24.6 49.4 46.8 25.9
Paid primary contact staff employed by Australian Government CCB approved child care services, byqualification (a), (c), (b), (d), (e)
With a relevant formal qualification at or above Certificate level III
Who have undertaken relevant in-service training in previous 12 months
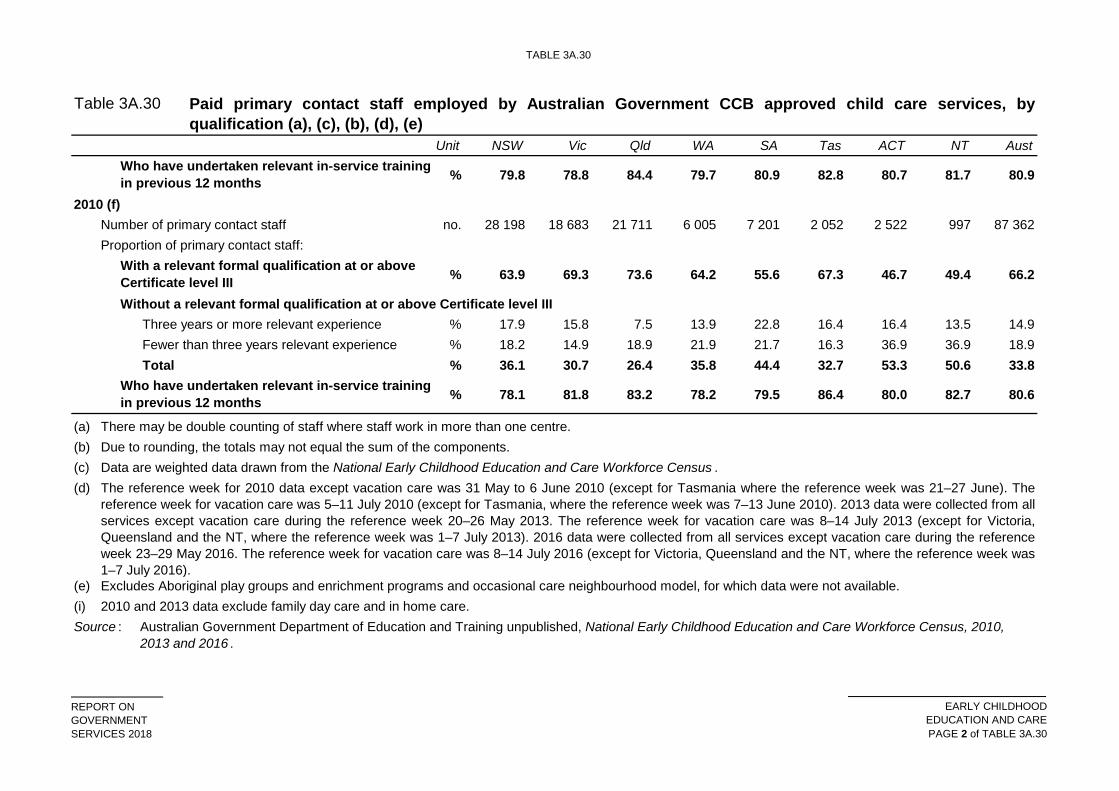
TABLE 3A.30
REPORT ONGOVERNMENTSERVICES 2018
EARLY CHILDHOODEDUCATION AND CAREPAGE 2 of TABLE 3A.30
Table 3A.30
Unit NSW Vic Qld WA SA Tas ACT NT Aust
Paid primary contact staff employed by Australian Government CCB approved child care services, byqualification (a), (c), (b), (d), (e)
% 79.8 78.8 84.4 79.7 80.9 82.8 80.7 81.7 80.9
2010 (f)Number of primary contact staff no. 28 198 18 683 21 711 6 005 7 201 2 052 2 522 997 87 362Proportion of primary contact staff:
% 63.9 69.3 73.6 64.2 55.6 67.3 46.7 49.4 66.2
Without a relevant formal qualification at or above Certificate level IIIThree years or more relevant experience % 17.9 15.8 7.5 13.9 22.8 16.4 16.4 13.5 14.9Fewer than three years relevant experience % 18.2 14.9 18.9 21.9 21.7 16.3 36.9 36.9 18.9Total % 36.1 30.7 26.4 35.8 44.4 32.7 53.3 50.6 33.8
% 78.1 81.8 83.2 78.2 79.5 86.4 80.0 82.7 80.6
(a)(b)(c)(d)
(e)(i)Source : Australian Government Department of Education and Training unpublished, National Early Childhood Education and Care Workforce Census, 2010,
2013 and 2016 .
The reference week for 2010 data except vacation care was 31 May to 6 June 2010 (except for Tasmania where the reference week was 21–27 June). Thereference week for vacation care was 5–11 July 2010 (except for Tasmania, where the reference week was 7–13 June 2010). 2013 data were collected from allservices except vacation care during the reference week 20–26 May 2013. The reference week for vacation care was 8–14 July 2013 (except for Victoria,Queensland and the NT, where the reference week was 1–7 July 2013). 2016 data were collected from all services except vacation care during the referenceweek 23–29 May 2016. The reference week for vacation care was 8–14 July 2016 (except for Victoria, Queensland and the NT, where the reference week was1–7 July 2016).
2010 and 2013 data exclude family day care and in home care.
Due to rounding, the totals may not equal the sum of the components.
Excludes Aboriginal play groups and enrichment programs and occasional care neighbourhood model, for which data were not available.
There may be double counting of staff where staff work in more than one centre.
Data are weighted data drawn from the National Early Childhood Education and Care Workforce Census .
Who have undertaken relevant in-service training in previous 12 months
Who have undertaken relevant in-service training in previous 12 months
With a relevant formal qualification at or above Certificate level III
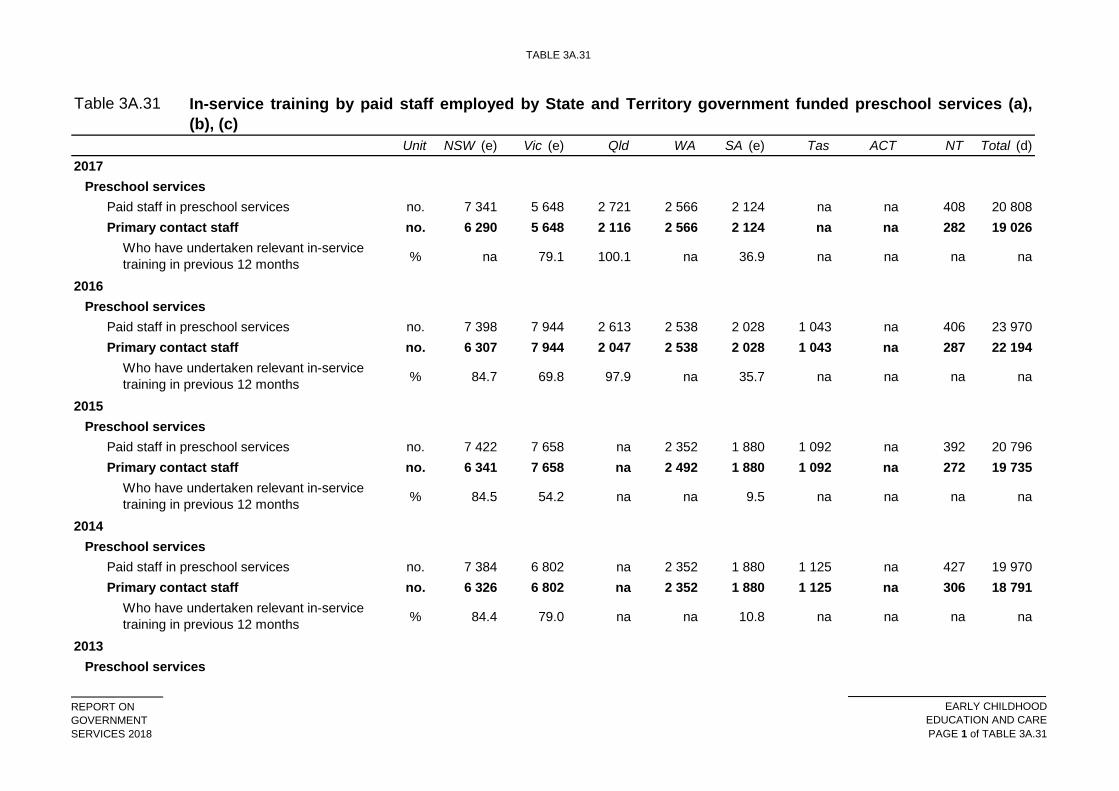
TABLE 3A.31
REPORT ONGOVERNMENTSERVICES 2018
EARLY CHILDHOODEDUCATION AND CAREPAGE 1 of TABLE 3A.31
Table 3A.31
Unit NSW (e) Vic (e) Qld WA SA (e) Tas ACT NT Total (d)2017
Preschool servicesPaid staff in preschool services no. 7 341 5 648 2 721 2 566 2 124 na na 408 20 808Primary contact staff no. 6 290 5 648 2 116 2 566 2 124 na na 282 19 026
% na 79.1 100.1 na 36.9 na na na na
2016Preschool services
Paid staff in preschool services no. 7 398 7 944 2 613 2 538 2 028 1 043 na 406 23 970Primary contact staff no. 6 307 7 944 2 047 2 538 2 028 1 043 na 287 22 194
% 84.7 69.8 97.9 na 35.7 na na na na
2015Preschool services
Paid staff in preschool services no. 7 422 7 658 na 2 352 1 880 1 092 na 392 20 796Primary contact staff no. 6 341 7 658 na 2 492 1 880 1 092 na 272 19 735
% 84.5 54.2 na na 9.5 na na na na
2014Preschool services
Paid staff in preschool services no. 7 384 6 802 na 2 352 1 880 1 125 na 427 19 970Primary contact staff no. 6 326 6 802 na 2 352 1 880 1 125 na 306 18 791
% 84.4 79.0 na na 10.8 na na na na
2013Preschool services
Who have undertaken relevant in-service training in previous 12 months
In-service training by paid staff employed by State and Territory government funded preschool services (a),(b), (c)
Who have undertaken relevant in-service training in previous 12 months
Who have undertaken relevant in-service training in previous 12 months
Who have undertaken relevant in-service training in previous 12 months
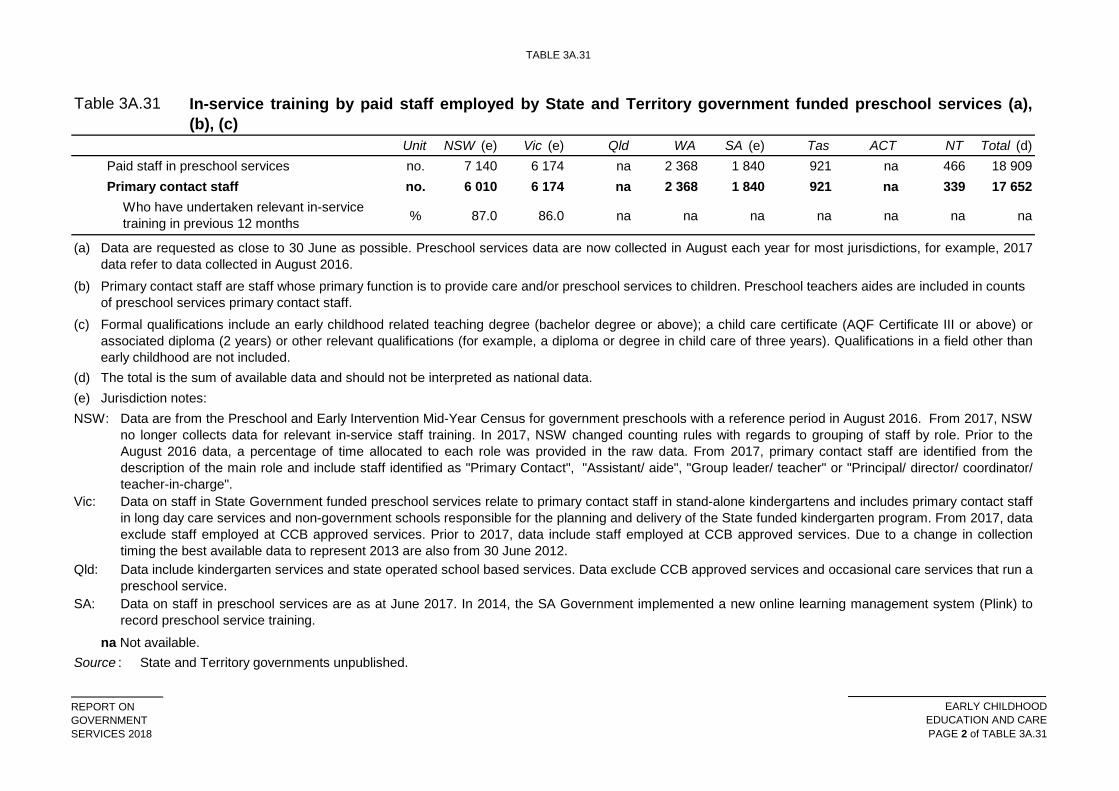
TABLE 3A.31
REPORT ONGOVERNMENTSERVICES 2018
EARLY CHILDHOODEDUCATION AND CAREPAGE 2 of TABLE 3A.31
Table 3A.31
Unit NSW (e) Vic (e) Qld WA SA (e) Tas ACT NT Total (d)
In-service training by paid staff employed by State and Territory government funded preschool services (a),(b), (c)
Paid staff in preschool services no. 7 140 6 174 na 2 368 1 840 921 na 466 18 909Primary contact staff no. 6 010 6 174 na 2 368 1 840 921 na 339 17 652
% 87.0 86.0 na na na na na na na
(a)
(b)
(c)
(d)(e) Jurisdiction notes:NSW:
Vic:
Qld:
SA:
Source : State and Territory governments unpublished.
Data are requested as close to 30 June as possible. Preschool services data are now collected in August each year for most jurisdictions, for example, 2017data refer to data collected in August 2016. Primary contact staff are staff whose primary function is to provide care and/or preschool services to children. Preschool teachers aides are included in counts of preschool services primary contact staff.
na Not available.
Data are from the Preschool and Early Intervention Mid-Year Census for government preschools with a reference period in August 2016. From 2017, NSWno longer collects data for relevant in-service staff training. In 2017, NSW changed counting rules with regards to grouping of staff by role. Prior to theAugust 2016 data, a percentage of time allocated to each role was provided in the raw data. From 2017, primary contact staff are identified from thedescription of the main role and include staff identified as "Primary Contact", "Assistant/ aide", "Group leader/ teacher" or "Principal/ director/ coordinator/teacher-in-charge". Data on staff in State Government funded preschool services relate to primary contact staff in stand-alone kindergartens and includes primary contact staffin long day care services and non-government schools responsible for the planning and delivery of the State funded kindergarten program. From 2017, dataexclude staff employed at CCB approved services. Prior to 2017, data include staff employed at CCB approved services. Due to a change in collectiontiming the best available data to represent 2013 are also from 30 June 2012.
Data on staff in preschool services are as at June 2017. In 2014, the SA Government implemented a new online learning management system (Plink) torecord preschool service training.
Who have undertaken relevant in-service training in previous 12 months
Data include kindergarten services and state operated school based services. Data exclude CCB approved services and occasional care services that run apreschool service.
The total is the sum of available data and should not be interpreted as national data.
Formal qualifications include an early childhood related teaching degree (bachelor degree or above); a child care certificate (AQF Certificate III or above) orassociated diploma (2 years) or other relevant qualifications (for example, a diploma or degree in child care of three years). Qualifications in a field other thanearly childhood are not included.
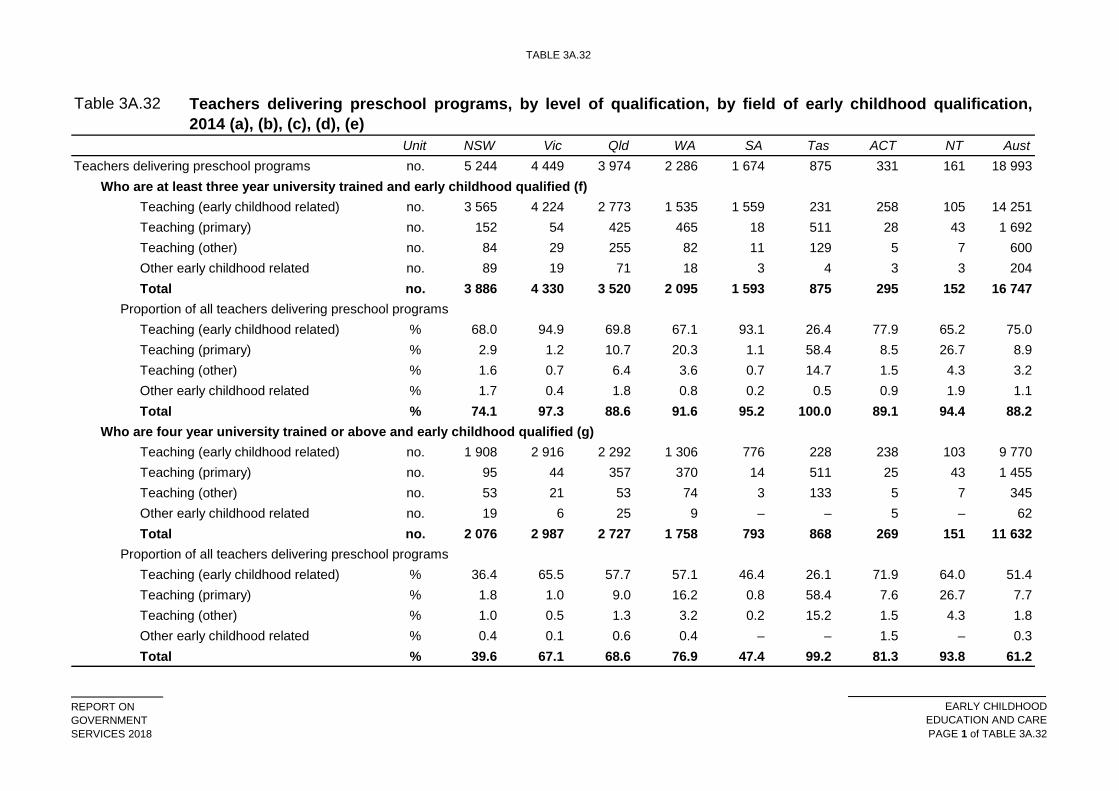
TABLE 3A.32
REPORT ONGOVERNMENTSERVICES 2018
EARLY CHILDHOODEDUCATION AND CAREPAGE 1 of TABLE 3A.32
Table 3A.32
Unit NSW Vic Qld WA SA Tas ACT NT AustTeachers delivering preschool programs no. 5 244 4 449 3 974 2 286 1 674 875 331 161 18 993
Who are at least three year university trained and early childhood qualified (f)Teaching (early childhood related) no. 3 565 4 224 2 773 1 535 1 559 231 258 105 14 251Teaching (primary) no. 152 54 425 465 18 511 28 43 1 692Teaching (other) no. 84 29 255 82 11 129 5 7 600Other early childhood related no. 89 19 71 18 3 4 3 3 204Total no. 3 886 4 330 3 520 2 095 1 593 875 295 152 16 747
Proportion of all teachers delivering preschool programsTeaching (early childhood related) % 68.0 94.9 69.8 67.1 93.1 26.4 77.9 65.2 75.0Teaching (primary) % 2.9 1.2 10.7 20.3 1.1 58.4 8.5 26.7 8.9Teaching (other) % 1.6 0.7 6.4 3.6 0.7 14.7 1.5 4.3 3.2Other early childhood related % 1.7 0.4 1.8 0.8 0.2 0.5 0.9 1.9 1.1Total % 74.1 97.3 88.6 91.6 95.2 100.0 89.1 94.4 88.2
Who are four year university trained or above and early childhood qualified (g)Teaching (early childhood related) no. 1 908 2 916 2 292 1 306 776 228 238 103 9 770Teaching (primary) no. 95 44 357 370 14 511 25 43 1 455Teaching (other) no. 53 21 53 74 3 133 5 7 345Other early childhood related no. 19 6 25 9 – – 5 – 62Total no. 2 076 2 987 2 727 1 758 793 868 269 151 11 632
Proportion of all teachers delivering preschool programsTeaching (early childhood related) % 36.4 65.5 57.7 57.1 46.4 26.1 71.9 64.0 51.4Teaching (primary) % 1.8 1.0 9.0 16.2 0.8 58.4 7.6 26.7 7.7Teaching (other) % 1.0 0.5 1.3 3.2 0.2 15.2 1.5 4.3 1.8Other early childhood related % 0.4 0.1 0.6 0.4 – – 1.5 – 0.3Total % 39.6 67.1 68.6 76.9 47.4 99.2 81.3 93.8 61.2
Teachers delivering preschool programs, by level of qualification, by field of early childhood qualification,2014 (a), (b), (c), (d), (e)
TABLE 3A.32
REPORT ONGOVERNMENTSERVICES 2018
EARLY CHILDHOODEDUCATION AND CAREPAGE 2 of TABLE 3A.32
Table 3A.32
Unit NSW Vic Qld WA SA Tas ACT NT Aust
Teachers delivering preschool programs, by level of qualification, by field of early childhood qualification,2014 (a), (b), (c), (d), (e)
(a)
(b)
(c)
(d)
(e)
(f)
(g)
Source : – Nil or rounded to zero.
ABS unpublished, Microdata: Preschool Education, Australia, 2014, Cat. no. 4240.0.55.003, Canberra.
Four year university trained or above includes 'Bachelor degree (4 years pass and honours)' and 'Graduate diploma/certificate and above'.
Teacher level data in the NECECC are not considered comparable across jurisdictions. The data do not include a unique identifier and as a consequence theycan only be reported as episodes of teachers delivering preschool programs. These data should be used with caution as there is a high likelihood of duplicationacross and within source data files, due to the same teacher delivering preschool programs at multiple service providers during the reference period. Inaddition, there is incomplete and inconsistent reporting of workers delivering preschool programs, a small level of under-coverage of the preschool programs insome sectors, and differences between data collection methodologies and alignment to the national data standards across jurisdictions.
Teachers are defined using a subset of contact worker roles in the NECECC. The worker roles defined as teachers are: principal/director/coordinator/teacher-in-charge and group leader/teacher. Teachers who are early childhood qualified include the fields of qualification: teaching (early childhood related), teaching (primary), teaching (other) and otherearly childhood relatedAt least three year university trained includes 'Bachelor degree (3 years or equivalent)', 'Bachelor degree (4 years pass and honours)', 'Graduatediploma/certificate and above'.
2013 National Early Childhood Education and Care Workforce Census data were used for imputation of worker data for 2014 CCMS input to the NECECC,therefore impacting the reliability and validity of worker and teacher estimates.For more information on data quality, including collection methodologies and data limitations, see Preschool Education, Australia (Cat. no. 4240.0) on the ABSwebsite and the ECEC NMDS specifications on the AIHW website.
NQF QUALITY AND COMPLIANCE
REPORT ONGOVERNMENTSERVICES 2018
EARLY CHILDHOODEDUCATION AND CARE
PAGE 1 of NQF QUALITY AND COMPLIANCE
NQF Quality and compliance
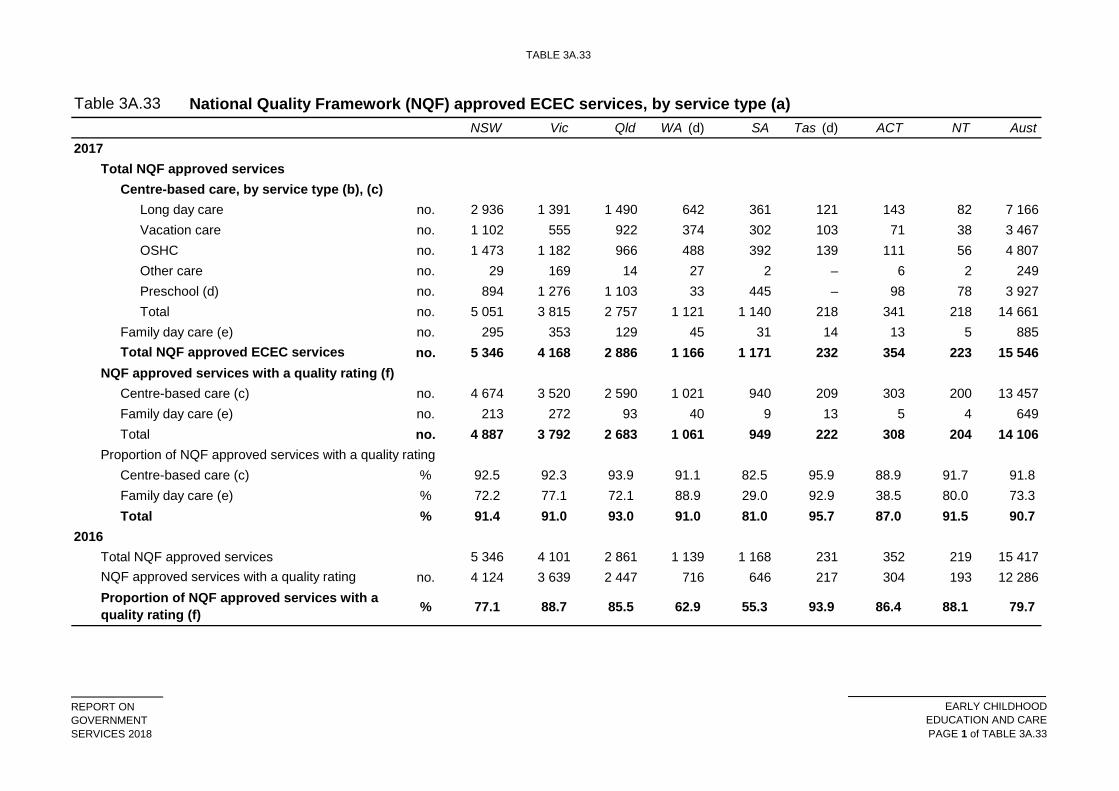
TABLE 3A.33
REPORT ONGOVERNMENTSERVICES 2018
EARLY CHILDHOODEDUCATION AND CAREPAGE 1 of TABLE 3A.33
Table 3A.33NSW Vic Qld WA (d) SA Tas (d) ACT NT Aust
2017Total NQF approved services
Centre-based care, by service type (b), (c)Long day care no. 2 936 1 391 1 490 642 361 121 143 82 7 166Vacation care no. 1 102 555 922 374 302 103 71 38 3 467OSHC no. 1 473 1 182 966 488 392 139 111 56 4 807Other care no. 29 169 14 27 2 – 6 2 249Preschool (d) no. 894 1 276 1 103 33 445 – 98 78 3 927Total no. 5 051 3 815 2 757 1 121 1 140 218 341 218 14 661
Family day care (e) no. 295 353 129 45 31 14 13 5 885no. 5 346 4 168 2 886 1 166 1 171 232 354 223 15 546
NQF approved services with a quality rating (f)Centre-based care (c) no. 4 674 3 520 2 590 1 021 940 209 303 200 13 457Family day care (e) no. 213 272 93 40 9 13 5 4 649Total no. 4 887 3 792 2 683 1 061 949 222 308 204 14 106
Proportion of NQF approved services with a quality rating Centre-based care (c) % 92.5 92.3 93.9 91.1 82.5 95.9 88.9 91.7 91.8Family day care (e) % 72.2 77.1 72.1 88.9 29.0 92.9 38.5 80.0 73.3Total % 91.4 91.0 93.0 91.0 81.0 95.7 87.0 91.5 90.7
2016Total NQF approved services 5 346 4 101 2 861 1 139 1 168 231 352 219 15 417
no. 4 124 3 639 2 447 716 646 217 304 193 12 286
% 77.1 88.7 85.5 62.9 55.3 93.9 86.4 88.1 79.7
National Quality Framework (NQF) approved ECEC services, by service type (a)
Total NQF approved ECEC services
NQF approved services with a quality ratingProportion of NQF approved services with a quality rating (f)
TABLE 3A.33
REPORT ONGOVERNMENTSERVICES 2018
EARLY CHILDHOODEDUCATION AND CAREPAGE 2 of TABLE 3A.33
Table 3A.33NSW Vic Qld WA (d) SA Tas (d) ACT NT Aust
National Quality Framework (NQF) approved ECEC services, by service type (a)
(a)
(b)
(c)
(d)
•
••
(e)
(f)
Source : ACECQA NQA ITS unpublished.
Counts of preschool services in this table should not be compared to counts of preschool services from the NECECC in table 3A.11 due to different collectionand reporting methodologies and purposes. Total counts of the preschool service type are undercounted in the NQA ITS due to:
– Nil or rounded to zero.
A family day care service is an education and care service delivered through the use of two or more educators to provide education and care for children inresidences, whether or not the service also provides education and care to children at a place other than a residence. They are sometimes known as family daycare schemes and they are administered and supported by central coordination units. Regulatory authorities received differential levels of funding to support implementation of the new assessment and rating function. Assessment and rating is onecomponent of the NQF and jurisdictions must also address complex licensing and/or compliance matters. The time invested by authorised officers incompliance to maximise the safety, health and wellbeing of children has an impact on the number of services that have received a quality rating.
In WA, almost all preschool services are out of scope of the NQF legislation so the number is relatively small. Preschool services in Tasmania are not covered by the NQF legislation so the number is zero.
non-obligatory self-reporting of service type. This particularly affects services which are long day care centres and also deliver preschool. Most preschoolservices reported in this table are stand-alone preschool centres or attached to a school.
This table includes services approved under the NQF as at 30 June. Data are sourced from the National Quality Agenda Information Technology System (NQAITS) and provided by the Australian Children's Education and Care Quality Authority (ACECQA). Some services also exist which are licensed or registered tooperate by State and Territory governments but are not approved under the NQF. Service type categories reported in this Report (such as long day care, OSHC and preschool) are defined in the chapter (see section 3.4). Occasional care is notin scope of the NQF. Total NQF approved services represents individual establishments or locations. As each individual service (i.e. establishment/ location)may deliver more than one service type, for example, long day care and preschool, or OSHC and vacation care, the sum of services by service types exceedsthe total number of NQF approved services. NQF approval is not based on these particular service types, rather services are approved as either a centre-basedor family day care service. Service type information is self-reported at the time of application for service approval. Service providers are not obliged to updatethis information if it subsequently changes. As a result, counts by service type could over or under estimate the true number. A centre-based care service is an education and care service other than a family day care service. This includes most long day care, preschool and OSHCservices that are delivered at a centre. It does not include preschools in Tasmania or the majority of preschools in WA.
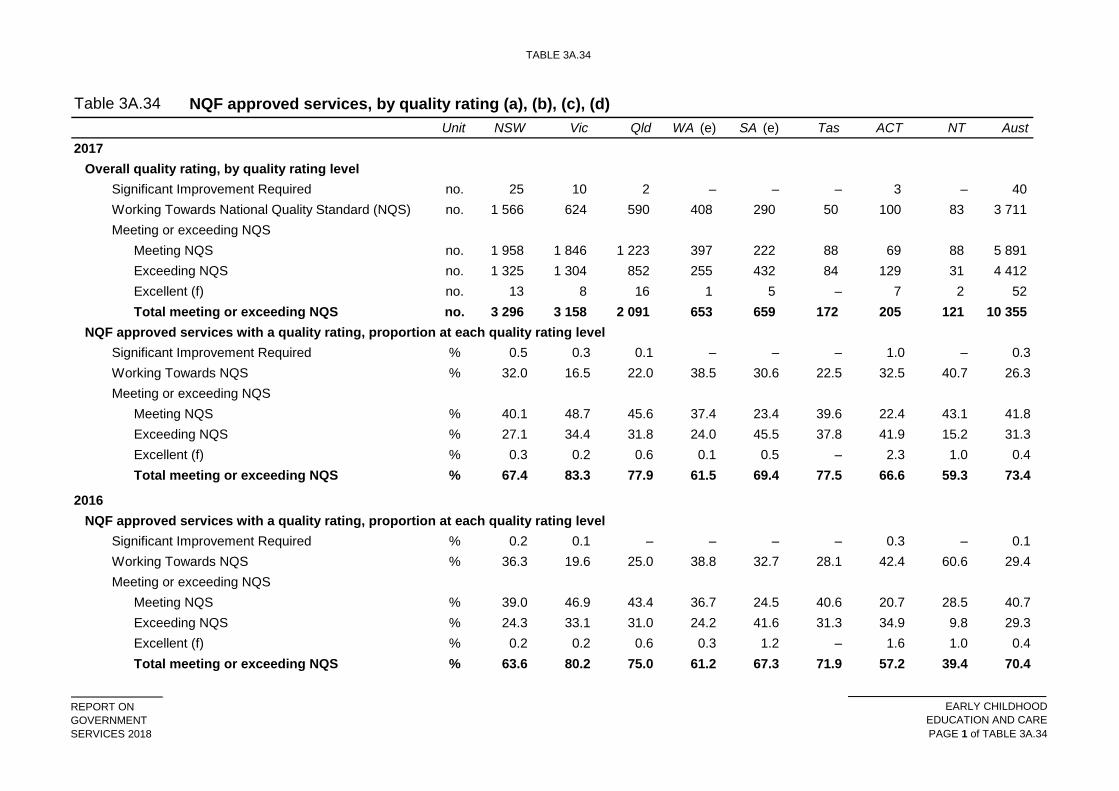
TABLE 3A.34
REPORT ONGOVERNMENTSERVICES 2018
EARLY CHILDHOODEDUCATION AND CAREPAGE 1 of TABLE 3A.34
Table 3A.34Unit NSW Vic Qld WA (e) SA (e) Tas ACT NT Aust
2017Overall quality rating, by quality rating level
Significant Improvement Required no. 25 10 2 – – – 3 – 40 Working Towards National Quality Standard (NQS) no. 1 566 624 590 408 290 50 100 83 3 711 Meeting or exceeding NQS
Meeting NQS no. 1 958 1 846 1 223 397 222 88 69 88 5 891 Exceeding NQS no. 1 325 1 304 852 255 432 84 129 31 4 412 Excellent (f) no. 13 8 16 1 5 – 7 2 52 Total meeting or exceeding NQS no. 3 296 3 158 2 091 653 659 172 205 121 10 355
NQF approved services with a quality rating, proportion at each quality rating levelSignificant Improvement Required % 0.5 0.3 0.1 – – – 1.0 – 0.3Working Towards NQS % 32.0 16.5 22.0 38.5 30.6 22.5 32.5 40.7 26.3Meeting or exceeding NQS
Meeting NQS % 40.1 48.7 45.6 37.4 23.4 39.6 22.4 43.1 41.8Exceeding NQS % 27.1 34.4 31.8 24.0 45.5 37.8 41.9 15.2 31.3Excellent (f) % 0.3 0.2 0.6 0.1 0.5 – 2.3 1.0 0.4Total meeting or exceeding NQS % 67.4 83.3 77.9 61.5 69.4 77.5 66.6 59.3 73.4
2016NQF approved services with a quality rating, proportion at each quality rating level
Significant Improvement Required % 0.2 0.1 – – – – 0.3 – 0.1Working Towards NQS % 36.3 19.6 25.0 38.8 32.7 28.1 42.4 60.6 29.4Meeting or exceeding NQS
Meeting NQS % 39.0 46.9 43.4 36.7 24.5 40.6 20.7 28.5 40.7Exceeding NQS % 24.3 33.1 31.0 24.2 41.6 31.3 34.9 9.8 29.3Excellent (f) % 0.2 0.2 0.6 0.3 1.2 – 1.6 1.0 0.4Total meeting or exceeding NQS % 63.6 80.2 75.0 61.2 67.3 71.9 57.2 39.4 70.4
NQF approved services, by quality rating (a), (b), (c), (d)
TABLE 3A.34
REPORT ONGOVERNMENTSERVICES 2018
EARLY CHILDHOODEDUCATION AND CAREPAGE 2 of TABLE 3A.34
Table 3A.34Unit NSW Vic Qld WA (e) SA (e) Tas ACT NT Aust
NQF approved services, by quality rating (a), (b), (c), (d)
(a)
(b)
(c)(d)
(e)
(f)
– Nil or rounded to zero. Source :
A family day care service is an education and care service delivered through the use of two or more educators to provide education and care for children inresidences, whether or not the service also provides education and care to children at a place other than a residence. They are sometimes known as familyday care schemes and they are administered and supported by central coordination units. In contrast to the other rating levels which result from the assessment and ratings process, the Excellent rating can only be awarded by ACECQA, onapplication by the Approved Provider.
ACECQA 2017 and unpublished, NQF Snapshot Q2 2017, Sydney.
Data as at 30 June for each reference year and are cumulative of services with a quality rating since ratings began in June 2012. At 30 June 2017 thisrepresents 90.7 per cent of all NQF approved services. Services with more than one quality rating are reported by their most recent quality rating.Regulatory authorities received differential levels of funding to support implementation of the new assessment and rating function. Assessment and rating isone component of the NQF and jurisdictions must also address complex licensing and/or compliance matters. The time invested by authorised officers incompliance to maximise the safety, health and wellbeing of children has an impact on the number of services that have received a quality rating.Detailed information on the NQS and assessment and ratings is available on the ACECQA website.A centre-based care service is an education and care service other than a family day care service. This includes most long day care, preschool and OSHCservices that are delivered at a centre. It does not include preschools in Tasmania or the majority of preschools in WA.
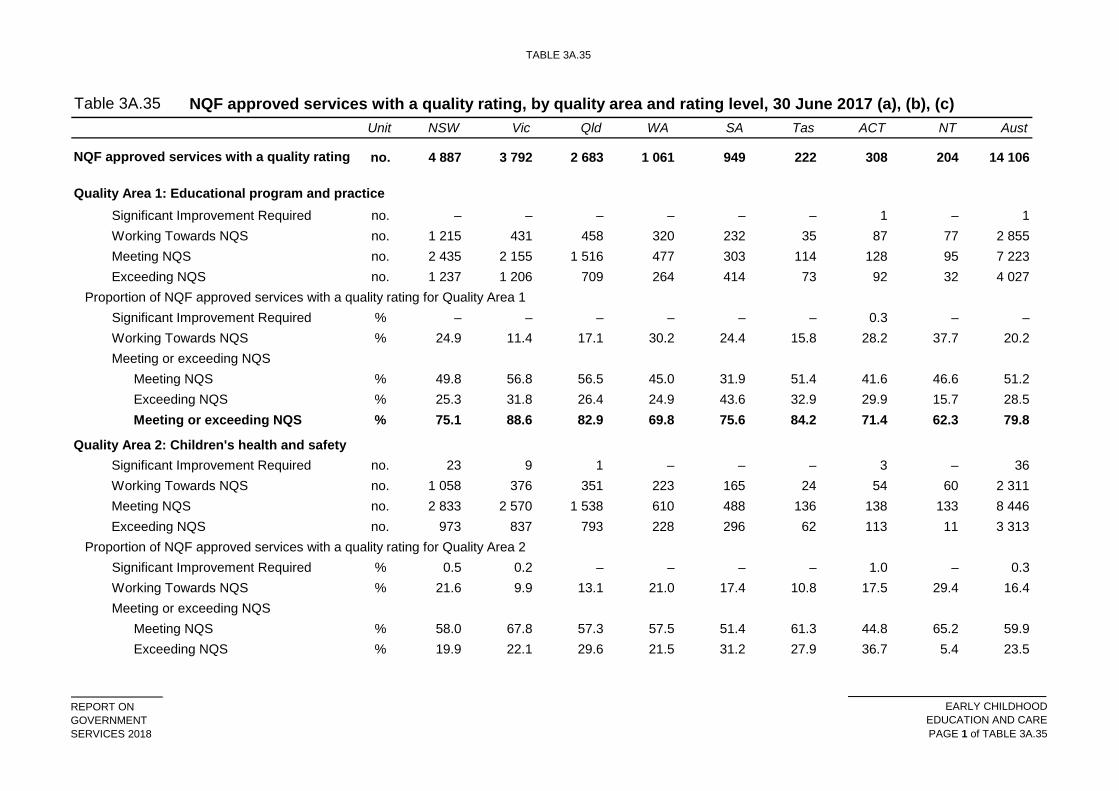
TABLE 3A.35
REPORT ONGOVERNMENTSERVICES 2018
EARLY CHILDHOODEDUCATION AND CAREPAGE 1 of TABLE 3A.35
Table 3A.35 NQF approved services with a quality rating, by quality area and rating level, 30 June 2017 (a), (b), (c)Unit NSW Vic Qld WA SA Tas ACT NT Aust
no. 4 887 3 792 2 683 1 061 949 222 308 204 14 106
Quality Area 1: Educational program and practiceSignificant Improvement Required no. – – – – – – 1 – 1Working Towards NQS no. 1 215 431 458 320 232 35 87 77 2 855Meeting NQS no. 2 435 2 155 1 516 477 303 114 128 95 7 223Exceeding NQS no. 1 237 1 206 709 264 414 73 92 32 4 027
Proportion of NQF approved services with a quality rating for Quality Area 1Significant Improvement Required % – – – – – – 0.3 – –Working Towards NQS % 24.9 11.4 17.1 30.2 24.4 15.8 28.2 37.7 20.2Meeting or exceeding NQS
Meeting NQS % 49.8 56.8 56.5 45.0 31.9 51.4 41.6 46.6 51.2Exceeding NQS % 25.3 31.8 26.4 24.9 43.6 32.9 29.9 15.7 28.5Meeting or exceeding NQS % 75.1 88.6 82.9 69.8 75.6 84.2 71.4 62.3 79.8
Quality Area 2: Children's health and safetySignificant Improvement Required no. 23 9 1 – – – 3 – 36Working Towards NQS no. 1 058 376 351 223 165 24 54 60 2 311Meeting NQS no. 2 833 2 570 1 538 610 488 136 138 133 8 446Exceeding NQS no. 973 837 793 228 296 62 113 11 3 313
Proportion of NQF approved services with a quality rating for Quality Area 2Significant Improvement Required % 0.5 0.2 – – – – 1.0 – 0.3Working Towards NQS % 21.6 9.9 13.1 21.0 17.4 10.8 17.5 29.4 16.4Meeting or exceeding NQS
Meeting NQS % 58.0 67.8 57.3 57.5 51.4 61.3 44.8 65.2 59.9Exceeding NQS % 19.9 22.1 29.6 21.5 31.2 27.9 36.7 5.4 23.5
NQF approved services with a quality rating

TABLE 3A.35
REPORT ONGOVERNMENTSERVICES 2018
EARLY CHILDHOODEDUCATION AND CAREPAGE 2 of TABLE 3A.35
Table 3A.35 NQF approved services with a quality rating, by quality area and rating level, 30 June 2017 (a), (b), (c)Unit NSW Vic Qld WA SA Tas ACT NT Aust
Meeting or exceeding NQS % 77.9 89.8 86.9 79.0 82.6 89.2 81.5 70.6 83.4
Quality Area 3: Physical environmentSignificant Improvement Required no. 10 2 1 – – – 2 – 15Working Towards NQS no. 1 071 277 381 269 166 24 61 62 2 311Meeting NQS no. 2 711 2 259 1 606 608 398 142 128 106 7 958Exceeding NQS no. 1 095 1 254 695 184 385 56 117 36 3 822
Proportion of NQF approved services with a quality rating for Quality Area 3Significant Improvement Required % 0.2 0.1 – – – – 0.6 – 0.1Working Towards NQS % 21.9 7.3 14.2 25.4 17.5 10.8 19.8 30.4 16.4Meeting or exceeding NQS
Meeting NQS % 55.5 59.6 59.9 57.3 41.9 64.0 41.6 52.0 56.4Exceeding NQS % 22.4 33.1 25.9 17.3 40.6 25.2 38.0 17.6 27.1Meeting or exceeding NQS % 77.9 92.6 85.8 74.6 82.5 89.2 79.5 69.6 83.5
Quality Area 4: Staffing arrangementsSignificant Improvement Required no. 9 3 1 – – – – – 13Working Towards NQS no. 498 209 122 98 77 6 14 41 1 065Meeting NQS no. 2 893 2 413 1 667 729 458 158 124 124 8 566Exceeding NQS no. 1 487 1 167 893 234 414 58 170 39 4 462
Proportion of NQF approved services with a quality rating for Quality Area 4Significant Improvement Required % 0.2 0.1 – – – – – – 0.1Working Towards NQS % 10.2 5.5 4.5 9.2 8.1 2.7 4.5 20.1 7.5Meeting or exceeding NQS
Meeting NQS % 59.2 63.6 62.1 68.7 48.3 71.2 40.3 60.8 60.7Exceeding NQS % 30.4 30.8 33.3 22.1 43.6 26.1 55.2 19.1 31.6Meeting or exceeding NQS % 89.6 94.4 95.4 90.8 91.9 97.3 95.5 79.9 92.4
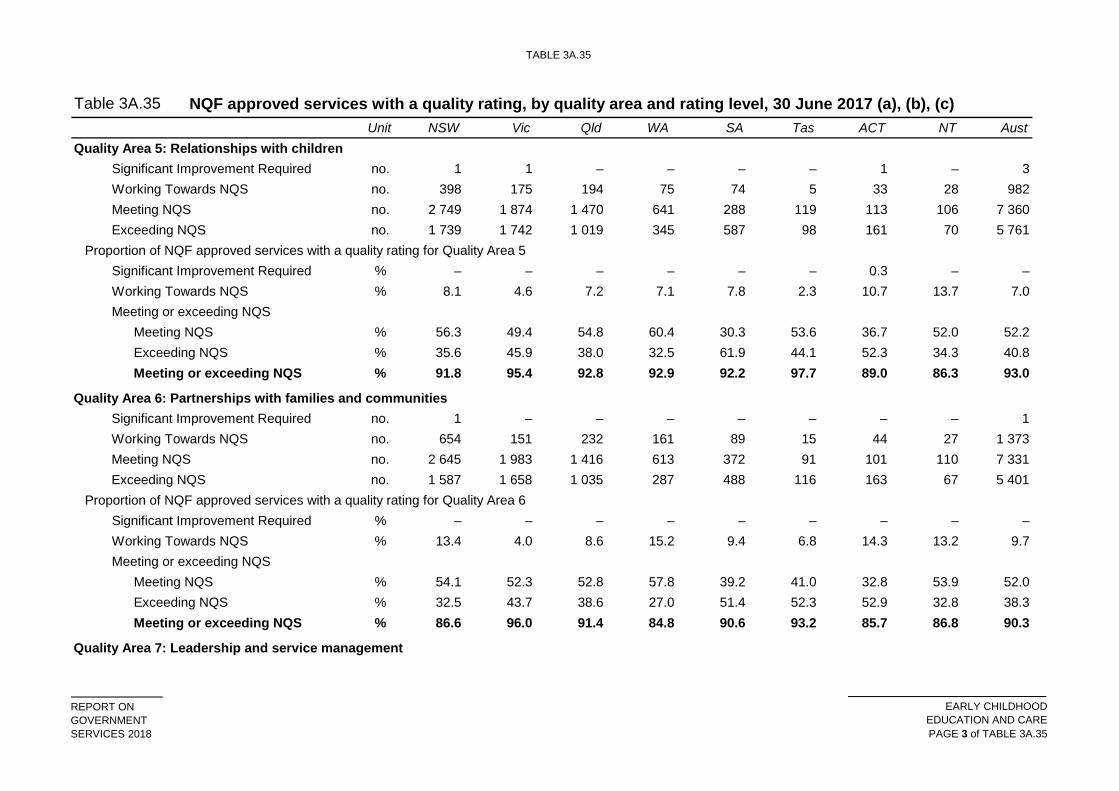
TABLE 3A.35
REPORT ONGOVERNMENTSERVICES 2018
EARLY CHILDHOODEDUCATION AND CAREPAGE 3 of TABLE 3A.35
Table 3A.35 NQF approved services with a quality rating, by quality area and rating level, 30 June 2017 (a), (b), (c)Unit NSW Vic Qld WA SA Tas ACT NT Aust
Quality Area 5: Relationships with childrenSignificant Improvement Required no. 1 1 – – – – 1 – 3Working Towards NQS no. 398 175 194 75 74 5 33 28 982Meeting NQS no. 2 749 1 874 1 470 641 288 119 113 106 7 360Exceeding NQS no. 1 739 1 742 1 019 345 587 98 161 70 5 761
Proportion of NQF approved services with a quality rating for Quality Area 5Significant Improvement Required % – – – – – – 0.3 – –Working Towards NQS % 8.1 4.6 7.2 7.1 7.8 2.3 10.7 13.7 7.0Meeting or exceeding NQS
Meeting NQS % 56.3 49.4 54.8 60.4 30.3 53.6 36.7 52.0 52.2Exceeding NQS % 35.6 45.9 38.0 32.5 61.9 44.1 52.3 34.3 40.8Meeting or exceeding NQS % 91.8 95.4 92.8 92.9 92.2 97.7 89.0 86.3 93.0
Quality Area 6: Partnerships with families and communitiesSignificant Improvement Required no. 1 – – – – – – – 1Working Towards NQS no. 654 151 232 161 89 15 44 27 1 373Meeting NQS no. 2 645 1 983 1 416 613 372 91 101 110 7 331Exceeding NQS no. 1 587 1 658 1 035 287 488 116 163 67 5 401
Proportion of NQF approved services with a quality rating for Quality Area 6Significant Improvement Required % – – – – – – – – –Working Towards NQS % 13.4 4.0 8.6 15.2 9.4 6.8 14.3 13.2 9.7Meeting or exceeding NQS
Meeting NQS % 54.1 52.3 52.8 57.8 39.2 41.0 32.8 53.9 52.0Exceeding NQS % 32.5 43.7 38.6 27.0 51.4 52.3 52.9 32.8 38.3Meeting or exceeding NQS % 86.6 96.0 91.4 84.8 90.6 93.2 85.7 86.8 90.3
Quality Area 7: Leadership and service management
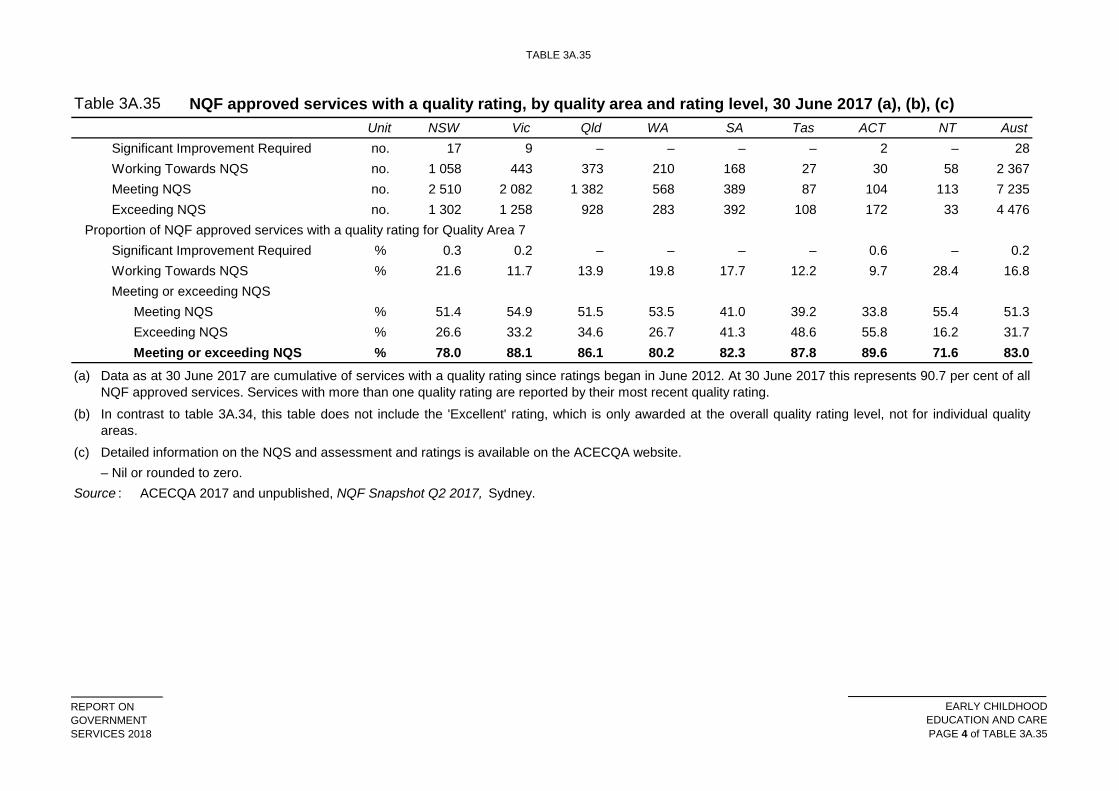
TABLE 3A.35
REPORT ONGOVERNMENTSERVICES 2018
EARLY CHILDHOODEDUCATION AND CAREPAGE 4 of TABLE 3A.35
Table 3A.35 NQF approved services with a quality rating, by quality area and rating level, 30 June 2017 (a), (b), (c)Unit NSW Vic Qld WA SA Tas ACT NT Aust
Significant Improvement Required no. 17 9 – – – – 2 – 28Working Towards NQS no. 1 058 443 373 210 168 27 30 58 2 367Meeting NQS no. 2 510 2 082 1 382 568 389 87 104 113 7 235Exceeding NQS no. 1 302 1 258 928 283 392 108 172 33 4 476
Proportion of NQF approved services with a quality rating for Quality Area 7Significant Improvement Required % 0.3 0.2 – – – – 0.6 – 0.2Working Towards NQS % 21.6 11.7 13.9 19.8 17.7 12.2 9.7 28.4 16.8Meeting or exceeding NQS
Meeting NQS % 51.4 54.9 51.5 53.5 41.0 39.2 33.8 55.4 51.3Exceeding NQS % 26.6 33.2 34.6 26.7 41.3 48.6 55.8 16.2 31.7Meeting or exceeding NQS % 78.0 88.1 86.1 80.2 82.3 87.8 89.6 71.6 83.0
(a)
(b)
(c)– Nil or rounded to zero.
Source : ACECQA 2017 and unpublished, NQF Snapshot Q2 2017, Sydney.
Data as at 30 June 2017 are cumulative of services with a quality rating since ratings began in June 2012. At 30 June 2017 this represents 90.7 per cent of allNQF approved services. Services with more than one quality rating are reported by their most recent quality rating.In contrast to table 3A.34, this table does not include the 'Excellent' rating, which is only awarded at the overall quality rating level, not for individual qualityareas.Detailed information on the NQS and assessment and ratings is available on the ACECQA website.
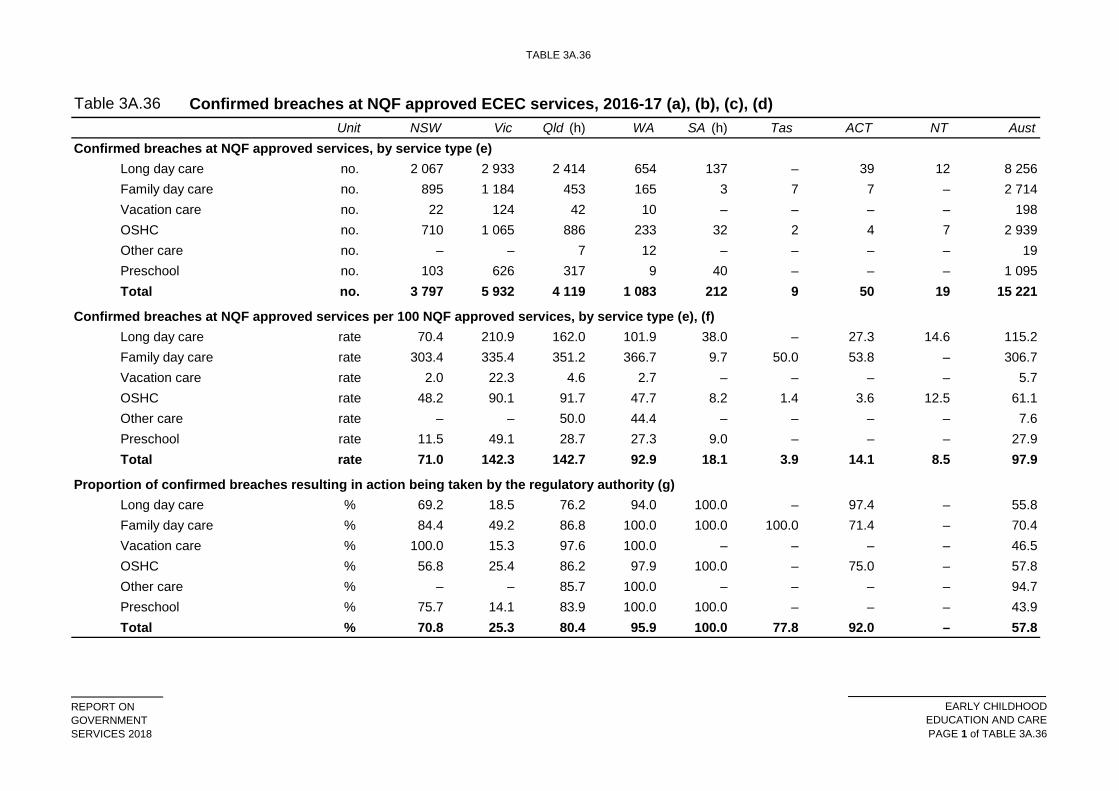
TABLE 3A.36
REPORT ONGOVERNMENTSERVICES 2018
EARLY CHILDHOODEDUCATION AND CAREPAGE 1 of TABLE 3A.36
Table 3A.36 Confirmed breaches at NQF approved ECEC services, 2016-17 (a), (b), (c), (d)Unit NSW Vic Qld (h) WA SA (h) Tas ACT NT Aust
Confirmed breaches at NQF approved services, by service type (e)Long day care no. 2 067 2 933 2 414 654 137 – 39 12 8 256Family day care no. 895 1 184 453 165 3 7 7 – 2 714Vacation care no. 22 124 42 10 – – – – 198OSHC no. 710 1 065 886 233 32 2 4 7 2 939Other care no. – – 7 12 – – – – 19Preschool no. 103 626 317 9 40 – – – 1 095Total no. 3 797 5 932 4 119 1 083 212 9 50 19 15 221
Confirmed breaches at NQF approved services per 100 NQF approved services, by service type (e), (f)Long day care rate 70.4 210.9 162.0 101.9 38.0 – 27.3 14.6 115.2Family day care rate 303.4 335.4 351.2 366.7 9.7 50.0 53.8 – 306.7Vacation care rate 2.0 22.3 4.6 2.7 – – – – 5.7OSHC rate 48.2 90.1 91.7 47.7 8.2 1.4 3.6 12.5 61.1Other care rate – – 50.0 44.4 – – – – 7.6Preschool rate 11.5 49.1 28.7 27.3 9.0 – – – 27.9Total rate 71.0 142.3 142.7 92.9 18.1 3.9 14.1 8.5 97.9
Proportion of confirmed breaches resulting in action being taken by the regulatory authority (g)Long day care % 69.2 18.5 76.2 94.0 100.0 – 97.4 – 55.8Family day care % 84.4 49.2 86.8 100.0 100.0 100.0 71.4 – 70.4Vacation care % 100.0 15.3 97.6 100.0 – – – – 46.5OSHC % 56.8 25.4 86.2 97.9 100.0 – 75.0 – 57.8Other care % – – 85.7 100.0 – – – – 94.7Preschool % 75.7 14.1 83.9 100.0 100.0 – – – 43.9Total % 70.8 25.3 80.4 95.9 100.0 77.8 92.0 – 57.8
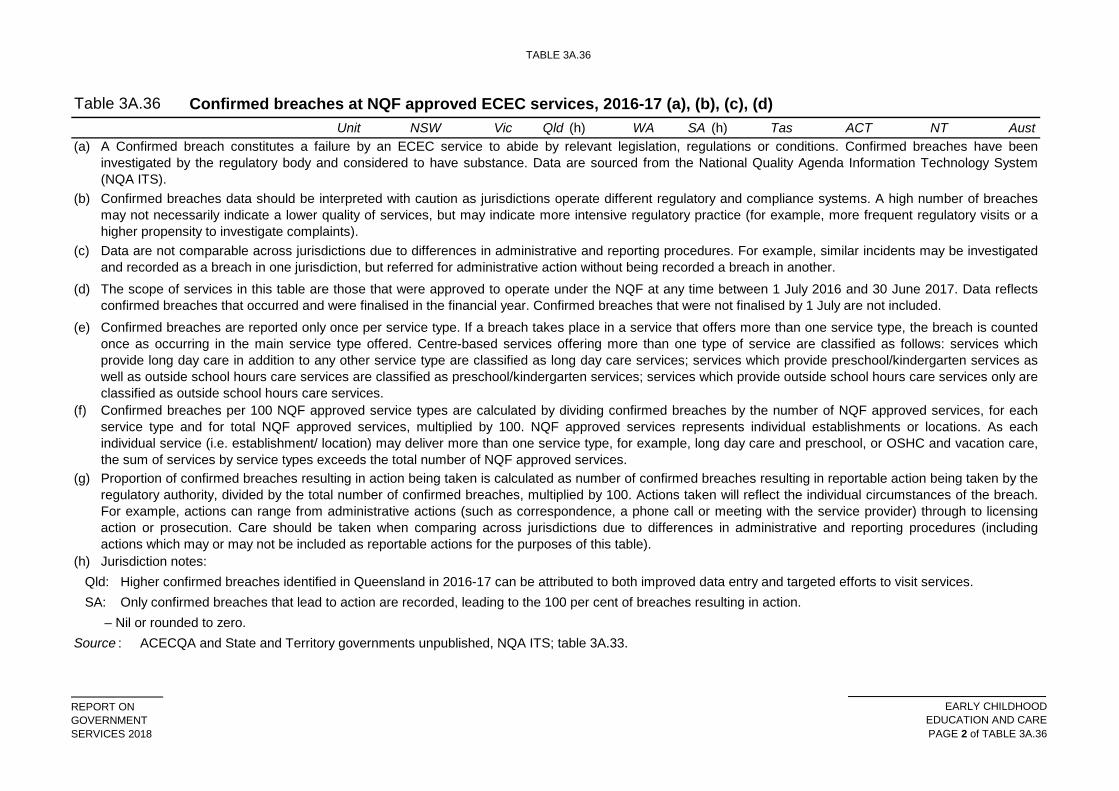
TABLE 3A.36
REPORT ONGOVERNMENTSERVICES 2018
EARLY CHILDHOODEDUCATION AND CAREPAGE 2 of TABLE 3A.36
Table 3A.36 Confirmed breaches at NQF approved ECEC services, 2016-17 (a), (b), (c), (d)Unit NSW Vic Qld (h) WA SA (h) Tas ACT NT Aust
(a)
(b)
(c)
(d)
(e)
(f)
(g)
(h) Jurisdiction notes:Qld:SA:
– Nil or rounded to zero. Source : ACECQA and State and Territory governments unpublished, NQA ITS; table 3A.33.
Only confirmed breaches that lead to action are recorded, leading to the 100 per cent of breaches resulting in action.
A Confirmed breach constitutes a failure by an ECEC service to abide by relevant legislation, regulations or conditions. Confirmed breaches have beeninvestigated by the regulatory body and considered to have substance. Data are sourced from the National Quality Agenda Information Technology System(NQA ITS).
The scope of services in this table are those that were approved to operate under the NQF at any time between 1 July 2016 and 30 June 2017. Data reflectsconfirmed breaches that occurred and were finalised in the financial year. Confirmed breaches that were not finalised by 1 July are not included.
Confirmed breaches per 100 NQF approved service types are calculated by dividing confirmed breaches by the number of NQF approved services, for eachservice type and for total NQF approved services, multiplied by 100. NQF approved services represents individual establishments or locations. As eachindividual service (i.e. establishment/ location) may deliver more than one service type, for example, long day care and preschool, or OSHC and vacation care,the sum of services by service types exceeds the total number of NQF approved services.
Confirmed breaches data should be interpreted with caution as jurisdictions operate different regulatory and compliance systems. A high number of breachesmay not necessarily indicate a lower quality of services, but may indicate more intensive regulatory practice (for example, more frequent regulatory visits or ahigher propensity to investigate complaints).
Higher confirmed breaches identified in Queensland in 2016-17 can be attributed to both improved data entry and targeted efforts to visit services.
Data are not comparable across jurisdictions due to differences in administrative and reporting procedures. For example, similar incidents may be investigatedand recorded as a breach in one jurisdiction, but referred for administrative action without being recorded a breach in another.
Proportion of confirmed breaches resulting in action being taken is calculated as number of confirmed breaches resulting in reportable action being taken by theregulatory authority, divided by the total number of confirmed breaches, multiplied by 100. Actions taken will reflect the individual circumstances of the breach.For example, actions can range from administrative actions (such as correspondence, a phone call or meeting with the service provider) through to licensingaction or prosecution. Care should be taken when comparing across jurisdictions due to differences in administrative and reporting procedures (includingactions which may or may not be included as reportable actions for the purposes of this table).
Confirmed breaches are reported only once per service type. If a breach takes place in a service that offers more than one service type, the breach is countedonce as occurring in the main service type offered. Centre-based services offering more than one type of service are classified as follows: services whichprovide long day care in addition to any other service type are classified as long day care services; services which provide preschool/kindergarten services aswell as outside school hours care services are classified as preschool/kindergarten services; services which provide outside school hours care services only areclassified as outside school hours care services.
SERIOUS INCIDENTS
REPORT ONGOVERNMENTSERVICES 2018
EARLY CHILDHOODEDUCATION AND CARE
PAGE 1 of SERIOUS INCIDENTS
Serious incidents
TABLE 3A.37
REPORT ONGOVERNMENTSERVICES 2018
EARLY CHILDHOODEDUCATION AND CAREPAGE 1 of TABLE 3A.37
Table 3A.37 Serious incidents at NQF approved ECEC services, 2016-17 (a), (b), (c)Unit NSW Vic Qld WA SA Tas ACT NT Aust
Serious incidents at NQF approved services, by type of incidentDeath of a child (d) no. – 1 1 – – – – – 2Injury/Trauma/Illness (e) no. 4 653 2 978 2 813 986 887 142 424 120 13 003Emergency services attended (f) no. 392 323 395 59 149 7 59 12 1 396
no. 250 293 265 59 93 10 44 17 1 031
Total no. 5 295 3 595 3 474 1 104 1 129 159 527 149 15 432Serious incidents by NQF approved services, by service type (h)
Long day care no. 3 517 2 326 2 197 822 669 109 299 94 10 033Family day care no. 233 92 137 55 49 12 15 3 596Vacation care no. 29 49 3 5 5 2 7 – 100OSHC no. 1 054 410 928 209 241 36 175 37 3 090Other care no. – – 1 5 – – – – 6Preschool no. 462 718 208 8 165 – 31 15 1 607Total no. 5 295 3 595 3 474 1 104 1 129 159 527 149 15 432
Serious incidents at NQF approved services per 100 NQF approved services, by service type (i)Long day care rate 119.8 167.2 147.4 128.0 185.3 90.1 209.1 114.6 140.0Family day care rate 79.0 26.1 106.2 122.2 158.1 85.7 115.4 60.0 67.3Vacation care rate 2.6 8.8 0.3 1.3 1.7 1.9 9.9 – 2.9OSHC rate 71.6 34.7 96.1 42.8 61.5 25.9 157.7 66.1 64.3Other care rate – – 7.1 18.5 – – – – 2.4Preschool rate 51.7 56.3 18.9 24.2 37.1 – 31.6 19.2 40.9Total rate 99.0 86.3 120.4 94.7 96.4 68.5 148.9 66.8 99.3
(a)
Child locked in/out, taken away or unaccounted for (g)
A serious incident is defined under Regulation 12 of the Education and Care Services National Regulations. Further details can be found in the definition of keyterms (section 3.4).
TABLE 3A.37
REPORT ONGOVERNMENTSERVICES 2018
EARLY CHILDHOODEDUCATION AND CAREPAGE 2 of TABLE 3A.37
Table 3A.37 Serious incidents at NQF approved ECEC services, 2016-17 (a), (b), (c)Unit NSW Vic Qld WA SA Tas ACT NT Aust
(b)
(c)
(d)
(e)
(f)
(g)
(h)
(i)
– Nil or rounded to zero. Source : ACECQA and State and Territory governments unpublished, NQA ITS.
Serious incidents per 100 NQF approved service types are calculated by dividing serious incidents by the number of NQF approved services, for each servicetype and for total NQF approved services, multiplied by 100. NQF approved services represents individual establishments or locations. As each individualservice (i.e. establishment/ location) may deliver more than one service type, for example, long day care and preschool, or OSHC and vacation care, the sum ofservices by service types exceeds the total number of NQF approved services.
Includes serious incidents including any circumstance where a child being educated and cared for by an education and care service: appears to be missing orcannot be accounted for; appears to have been taken or removed from the education and care service premises in a manner that contravenes Regulations; or,is mistakenly locked in or locked out of the education and care service premises or any part of the premises.
Includes serious incidents where there is the death of a child while being educated and cared for by an education and care service, or following an incident whilebeing educated and cared for by an education and care service.Includes serious incidents including any incident involving serious injury or trauma to, or illness of, a child while being educated and cared for by an educationand care service, which a reasonable person would consider required urgent medical attention from a registered medical practitioner (examples Whoopingcough, broken limb, anaphylaxis reaction), or for which the child attended, or ought reasonably to have attended, a hospital.Includes serious incidents including any incident where the attendance of emergency services at the education and care service premises was sought, or oughtreasonably to have been sought.
The scope of services in this table is services that were approved to operate under the NQF at any time between 1 July 2016 and 30 June 2017. Data reflectsserious incidents that occurred and were finalised in the financial year. Incidents that were not finalised by 1 July are not included.
Serious incidents are reported only once per service type. If an incident takes place in a service that offers more than one service type, the incident is countedonce as occurring in the main service type offered. Centre-based services offering more than one type of service are classified as follows: services whichprovide long day care in addition to any other service type are classified as long day care services; services which provide preschool/kindergarten services aswell as OSHC services are classified as preschool/kindergarten services; services which provide OSHC services only are classified as OSHC services.
Caution should be used in interpreting results within and across jurisdictions as variations may be affected by differences in the number of children per service.
ECEC EXPENDITURE
REPORT ONGOVERNMENTSERVICES 2018
EARLY CHILDHOODEDUCATION AND CARE
PAGE 1 of ECEC EXPENDITURE
ECEC expenditure
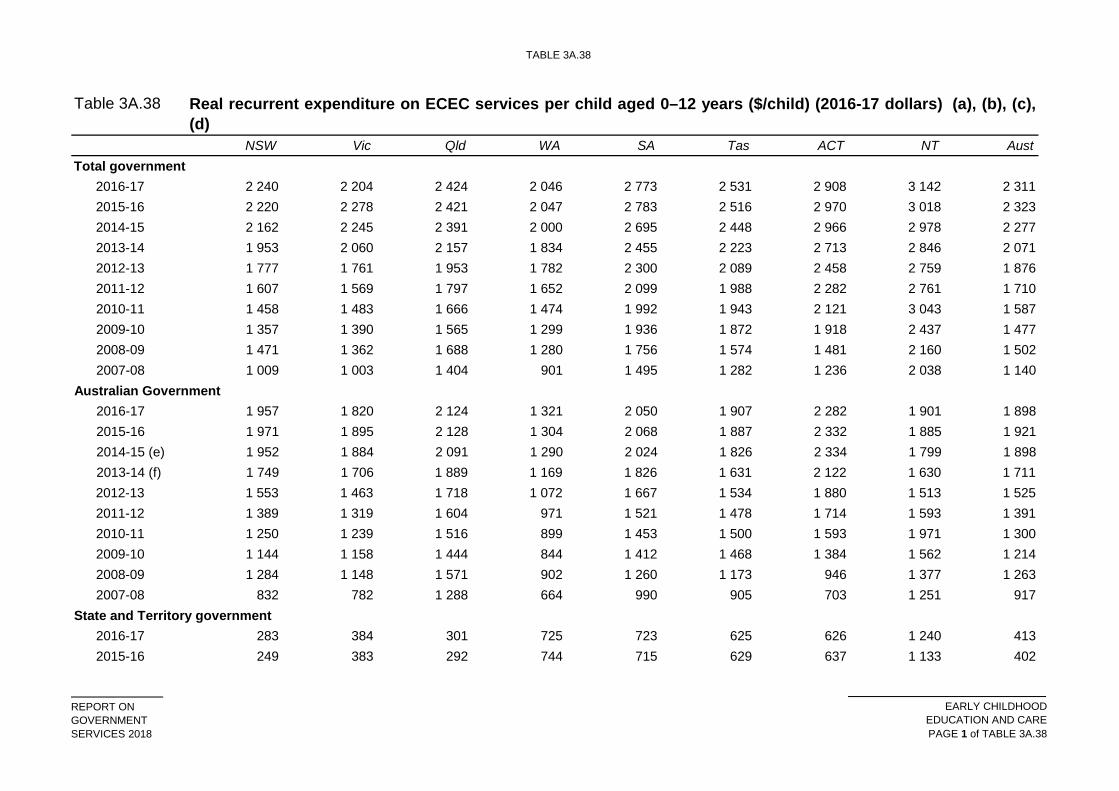
TABLE 3A.38
REPORT ONGOVERNMENTSERVICES 2018
EARLY CHILDHOODEDUCATION AND CAREPAGE 1 of TABLE 3A.38
Table 3A.38
NSW Vic Qld WA SA Tas ACT NT AustTotal government
2016-17 2 240 2 204 2 424 2 046 2 773 2 531 2 908 3 142 2 3112015-16 2 220 2 278 2 421 2 047 2 783 2 516 2 970 3 018 2 3232014-15 2 162 2 245 2 391 2 000 2 695 2 448 2 966 2 978 2 2772013-14 1 953 2 060 2 157 1 834 2 455 2 223 2 713 2 846 2 0712012-13 1 777 1 761 1 953 1 782 2 300 2 089 2 458 2 759 1 8762011-12 1 607 1 569 1 797 1 652 2 099 1 988 2 282 2 761 1 7102010-11 1 458 1 483 1 666 1 474 1 992 1 943 2 121 3 043 1 5872009-10 1 357 1 390 1 565 1 299 1 936 1 872 1 918 2 437 1 4772008-09 1 471 1 362 1 688 1 280 1 756 1 574 1 481 2 160 1 5022007-08 1 009 1 003 1 404 901 1 495 1 282 1 236 2 038 1 140
Australian Government2016-17 1 957 1 820 2 124 1 321 2 050 1 907 2 282 1 901 1 8982015-16 1 971 1 895 2 128 1 304 2 068 1 887 2 332 1 885 1 9212014-15 (e) 1 952 1 884 2 091 1 290 2 024 1 826 2 334 1 799 1 8982013-14 (f) 1 749 1 706 1 889 1 169 1 826 1 631 2 122 1 630 1 7112012-13 1 553 1 463 1 718 1 072 1 667 1 534 1 880 1 513 1 5252011-12 1 389 1 319 1 604 971 1 521 1 478 1 714 1 593 1 3912010-11 1 250 1 239 1 516 899 1 453 1 500 1 593 1 971 1 3002009-10 1 144 1 158 1 444 844 1 412 1 468 1 384 1 562 1 2142008-09 1 284 1 148 1 571 902 1 260 1 173 946 1 377 1 2632007-08 832 782 1 288 664 990 905 703 1 251 917
State and Territory government2016-17 283 384 301 725 723 625 626 1 240 4132015-16 249 383 292 744 715 629 637 1 133 402
Real recurrent expenditure on ECEC services per child aged 0–12 years ($/child) (2016-17 dollars) (a), (b), (c),(d)
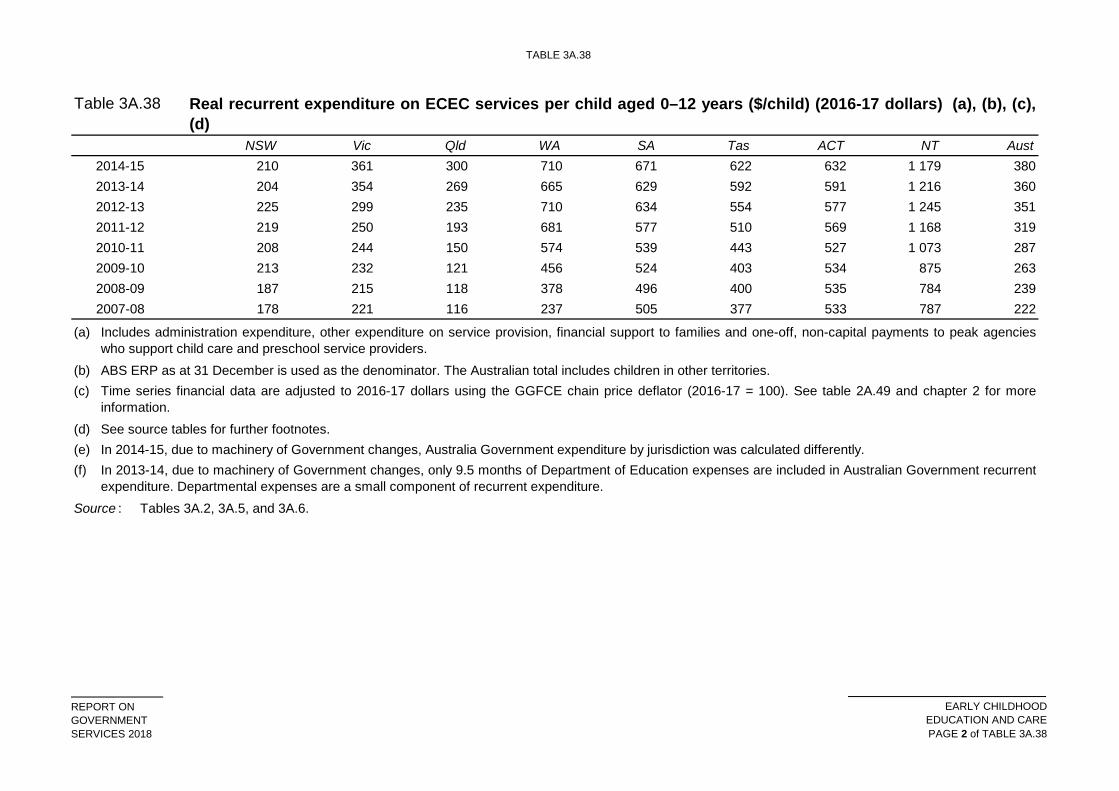
TABLE 3A.38
REPORT ONGOVERNMENTSERVICES 2018
EARLY CHILDHOODEDUCATION AND CAREPAGE 2 of TABLE 3A.38
Table 3A.38
NSW Vic Qld WA SA Tas ACT NT Aust
Real recurrent expenditure on ECEC services per child aged 0–12 years ($/child) (2016-17 dollars) (a), (b), (c),(d)
2014-15 210 361 300 710 671 622 632 1 179 3802013-14 204 354 269 665 629 592 591 1 216 3602012-13 225 299 235 710 634 554 577 1 245 3512011-12 219 250 193 681 577 510 569 1 168 3192010-11 208 244 150 574 539 443 527 1 073 2872009-10 213 232 121 456 524 403 534 875 2632008-09 187 215 118 378 496 400 535 784 2392007-08 178 221 116 237 505 377 533 787 222
(a)
(b)(c)
(d)(e)(f)
Source :
Includes administration expenditure, other expenditure on service provision, financial support to families and one-off, non-capital payments to peak agencieswho support child care and preschool service providers.
Tables 3A.2, 3A.5, and 3A.6.
ABS ERP as at 31 December is used as the denominator. The Australian total includes children in other territories.Time series financial data are adjusted to 2016-17 dollars using the GGFCE chain price deflator (2016-17 = 100). See table 2A.49 and chapter 2 for moreinformation.See source tables for further footnotes. In 2014-15, due to machinery of Government changes, Australia Government expenditure by jurisdiction was calculated differently.In 2013-14, due to machinery of Government changes, only 9.5 months of Department of Education expenses are included in Australian Government recurrentexpenditure. Departmental expenses are a small component of recurrent expenditure.
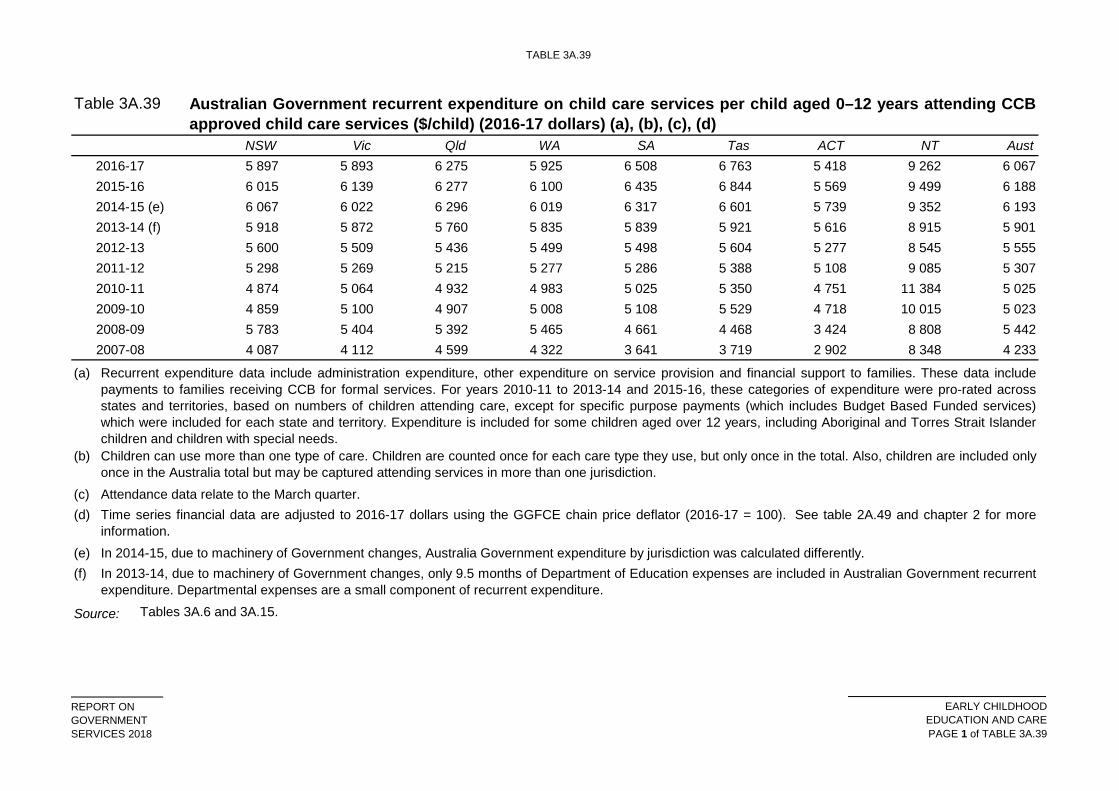
TABLE 3A.39
REPORT ONGOVERNMENTSERVICES 2018
EARLY CHILDHOODEDUCATION AND CAREPAGE 1 of TABLE 3A.39
Table 3A.39
NSW Vic Qld WA SA Tas ACT NT Aust2016-17 5 897 5 893 6 275 5 925 6 508 6 763 5 418 9 262 6 0672015-16 6 015 6 139 6 277 6 100 6 435 6 844 5 569 9 499 6 1882014-15 (e) 6 067 6 022 6 296 6 019 6 317 6 601 5 739 9 352 6 1932013-14 (f) 5 918 5 872 5 760 5 835 5 839 5 921 5 616 8 915 5 9012012-13 5 600 5 509 5 436 5 499 5 498 5 604 5 277 8 545 5 5552011-12 5 298 5 269 5 215 5 277 5 286 5 388 5 108 9 085 5 3072010-11 4 874 5 064 4 932 4 983 5 025 5 350 4 751 11 384 5 0252009-10 4 859 5 100 4 907 5 008 5 108 5 529 4 718 10 015 5 0232008-09 5 783 5 404 5 392 5 465 4 661 4 468 3 424 8 808 5 4422007-08 4 087 4 112 4 599 4 322 3 641 3 719 2 902 8 348 4 233
(a)
(b)
(c) (d)
(e)(f)
Source: Tables 3A.6 and 3A.15.
In 2014-15, due to machinery of Government changes, Australia Government expenditure by jurisdiction was calculated differently.
Australian Government recurrent expenditure on child care services per child aged 0–12 years attending CCBapproved child care services ($/child) (2016-17 dollars) (a), (b), (c), (d)
Children can use more than one type of care. Children are counted once for each care type they use, but only once in the total. Also, children are included onlyonce in the Australia total but may be captured attending services in more than one jurisdiction. Attendance data relate to the March quarter. Time series financial data are adjusted to 2016-17 dollars using the GGFCE chain price deflator (2016-17 = 100). See table 2A.49 and chapter 2 for moreinformation.
In 2013-14, due to machinery of Government changes, only 9.5 months of Department of Education expenses are included in Australian Government recurrentexpenditure. Departmental expenses are a small component of recurrent expenditure.
Recurrent expenditure data include administration expenditure, other expenditure on service provision and financial support to families. These data includepayments to families receiving CCB for formal services. For years 2010-11 to 2013-14 and 2015-16, these categories of expenditure were pro-rated acrossstates and territories, based on numbers of children attending care, except for specific purpose payments (which includes Budget Based Funded services)which were included for each state and territory. Expenditure is included for some children aged over 12 years, including Aboriginal and Torres Strait Islanderchildren and children with special needs.
NEEDS FOR CHILDCARE
REPORT ONGOVERNMENTSERVICES 2018
EARLY CHILDHOODEDUCATION AND CARE
PAGE 1 of NEEDS FOR CHILDCARE
Needs for childcare
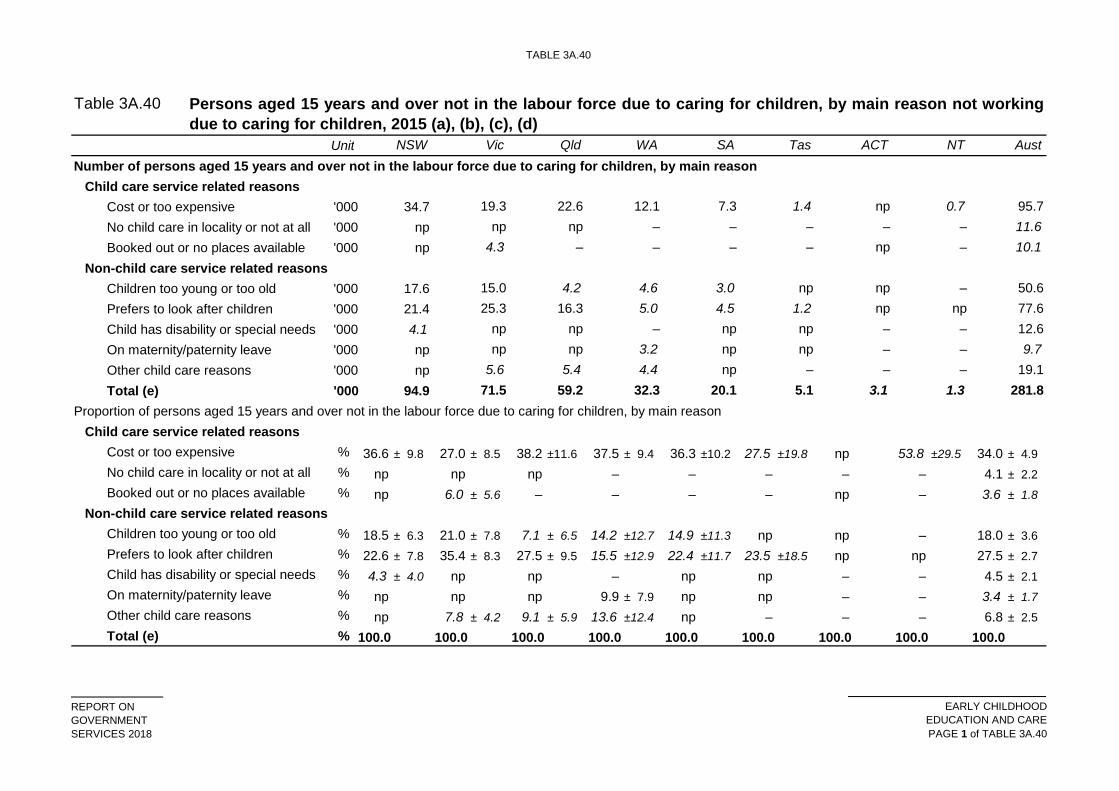
TABLE 3A.40
REPORT ONGOVERNMENTSERVICES 2018
EARLY CHILDHOODEDUCATION AND CAREPAGE 1 of TABLE 3A.40
Table 3A.40
UnitNumber of persons aged 15 years and over not in the labour force due to caring for children, by main reason
Child care service related reasonsCost or too expensive '000 34.7No child care in locality or not at all '000 npBooked out or no places available '000 np
Non-child care service related reasonsChildren too young or too old '000 17.6Prefers to look after children '000 21.4Child has disability or special needs '000 4.1On maternity/paternity leave '000 npOther child care reasons '000 npTotal (e) '000 94.9
Proportion of persons aged 15 years and over not in the labour force due to caring for children, by main reason Child care service related reasons
Cost or too expensive % 36.6 ± 9.8 27.0 ± 8.5 38.2 ±11.6 37.5 ± 9.4 36.3 ±10.2 27.5 ±19.8 np 53.8 ±29.5 34.0 ± 4.9No child care in locality or not at all % np np np – – – – – 4.1 ± 2.2Booked out or no places available % np 6.0 ± 5.6 – – – – np – 3.6 ± 1.8
Non-child care service related reasonsChildren too young or too old % 18.5 ± 6.3 21.0 ± 7.8 7.1 ± 6.5 14.2 ±12.7 14.9 ±11.3 np np – 18.0 ± 3.6Prefers to look after children % 22.6 ± 7.8 35.4 ± 8.3 27.5 ± 9.5 15.5 ±12.9 22.4 ±11.7 23.5 ±18.5 np np 27.5 ± 2.7Child has disability or special needs % 4.3 ± 4.0 np np – np np – – 4.5 ± 2.1On maternity/paternity leave % np np np 9.9 ± 7.9 np np – – 3.4 ± 1.7Other child care reasons % np 7.8 ± 4.2 9.1 ± 5.9 13.6 ±12.4 np – – – 6.8 ± 2.5Total (e) % 100.0 100.0 100.0 100.0
15.0 4.2 4.6 3.0 np np
np5.6 4.45.4
–
10.1np
50.677.6
–
95.7
12.69.7
np
–
11.60.7
––
– –
np np–
np –
19.1281.8
–3.1
–1.3
np20.1
–5.159.271.5 32.3
100.0 100.0 100.0 100.0100.0
7.3
npnp
1.4
npnp
– –
4.5 1.2
– –
19.3
np
12.1
–3.2
4.3
22.6
npnp
np –
16.3 5.0
–
25.3
Persons aged 15 years and over not in the labour force due to caring for children, by main reason not workingdue to caring for children, 2015 (a), (b), (c), (d)
SA Tas ACT NT AustNSW Vic Qld WA
TABLE 3A.40
REPORT ONGOVERNMENTSERVICES 2018
EARLY CHILDHOODEDUCATION AND CAREPAGE 2 of TABLE 3A.40
Table 3A.40
Unit
Persons aged 15 years and over not in the labour force due to caring for children, by main reason not workingdue to caring for children, 2015 (a), (b), (c), (d)
SA Tas ACT NT AustNSW Vic Qld WA(a)
(b)
(c)
(d)
(e)– Nil or rounded to zero. np Not published.
Source : Derived from ABS 2015, Participation, Job Search and Mobility, Australia, February 2015, Cat. no. 6226.0, Canberra.
Data are from the ABS Participation, Job Search and Mobility survey . Data comprise persons aged 15 years and over. The survey is conducted in both urbanand rural areas in all states and territories, but excludes people living in Aboriginal and Torres Strait Islander communities in very remote parts of Australia.
As data are from a survey they are subject to error, including sampling variability and non-sampling errors. Data in italics have relative standard errors between25 per cent and 50 per cent, and need to be used with caution. Data with relative standard errors greater than 50 per cent are not published ('np') as they areconsidered too unreliable for general use. Data which are not published ('np') are not available for publication but included in totals where applicable, unlessotherwise stated. The 95 per cent confidence interval (a reliability estimate) associated with each proportion estimate is reported (for example, 80.0 per cent ±2.7 per cent). See chapter 2 for more information on confidence intervals and relative standard errors. There are a number of factors which affect the labour force participation decisions of people responsible for caring for children, of which child care service relatedreasons are only some. Also, due to the subjective nature of self-reporting, care should be taken when interpreting the data, particularly for child care servicerelated reasons.
The sum of components may not equal the total due to not published data.
For more information on data quality, including collection methodologies and data limitations, see Participation, Job Search and Mobility, Australia (Cat. no.4402.0) on the ABS website.

ECEC OUTCOMES
REPORT ONGOVERNMENTSERVICES 2018
EARLY CHILDHOODEDUCATION AND CARE
PAGE 1 of ECEC OUTCOMES
ECEC outcomes
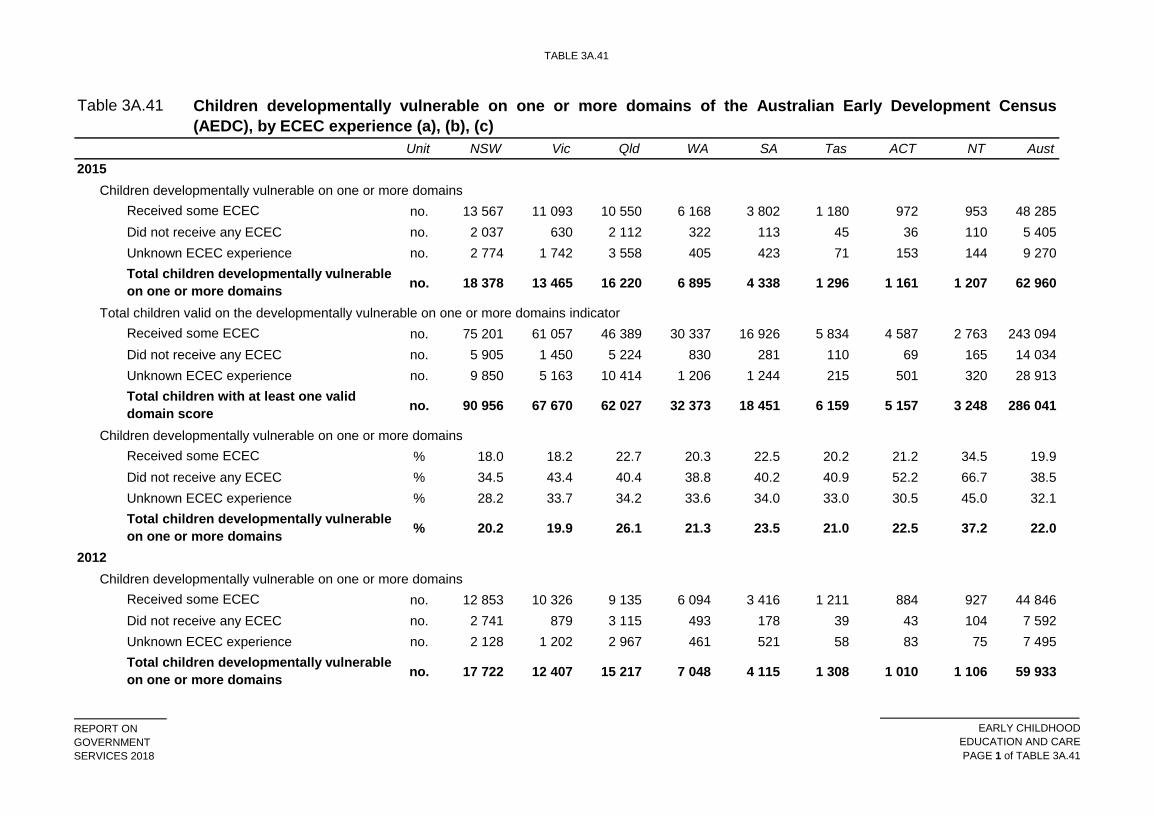
TABLE 3A.41
REPORT ONGOVERNMENTSERVICES 2018
EARLY CHILDHOODEDUCATION AND CAREPAGE 1 of TABLE 3A.41
Table 3A.41
Unit NSW Vic Qld WA SA Tas ACT NT Aust
Children developmentally vulnerable on one or more domainsno. 13 567 11 093 10 550 6 168 3 802 1 180 972 953 48 285
Did not receive any ECEC no. 2 037 630 2 112 322 113 45 36 110 5 405Unknown ECEC experience no. 2 774 1 742 3 558 405 423 71 153 144 9 270
no. 18 378 13 465 16 220 6 895 4 338 1 296 1 161 1 207 62 960
Total children valid on the developmentally vulnerable on one or more domains indicatorno. 75 201 61 057 46 389 30 337 16 926 5 834 4 587 2 763 243 094
Did not receive any ECEC no. 5 905 1 450 5 224 830 281 110 69 165 14 034Unknown ECEC experience no. 9 850 5 163 10 414 1 206 1 244 215 501 320 28 913
no. 90 956 67 670 62 027 32 373 18 451 6 159 5 157 3 248 286 041
Children developmentally vulnerable on one or more domains% 18.0 18.2 22.7 20.3 22.5 20.2 21.2 34.5 19.9
Did not receive any ECEC % 34.5 43.4 40.4 38.8 40.2 40.9 52.2 66.7 38.5Unknown ECEC experience % 28.2 33.7 34.2 33.6 34.0 33.0 30.5 45.0 32.1
% 20.2 19.9 26.1 21.3 23.5 21.0 22.5 37.2 22.0
Children developmentally vulnerable on one or more domainsno. 12 853 10 326 9 135 6 094 3 416 1 211 884 927 44 846
Did not receive any ECEC no. 2 741 879 3 115 493 178 39 43 104 7 592Unknown ECEC experience no. 2 128 1 202 2 967 461 521 58 83 75 7 495
no. 17 722 12 407 15 217 7 048 4 115 1 308 1 010 1 106 59 933
Children developmentally vulnerable on one or more domains of the Australian Early Development Census(AEDC), by ECEC experience (a), (b), (c)
Received some ECEC
2012
Total children developmentally vulnerable on one or more domains
2015
Received some ECEC
Total children developmentally vulnerable on one or more domains
Received some ECEC
Total children with at least one valid domain score
Received some ECEC
Total children developmentally vulnerable on one or more domains
TABLE 3A.41
REPORT ONGOVERNMENTSERVICES 2018
EARLY CHILDHOODEDUCATION AND CAREPAGE 2 of TABLE 3A.41
Table 3A.41
Unit NSW Vic Qld WA SA Tas ACT NT Aust
Children developmentally vulnerable on one or more domains of the Australian Early Development Census(AEDC), by ECEC experience (a), (b), (c)
Total children valid on the developmentally vulnerable on one or more domains indicatorno. 72 794 57 680 40 055 27 906 15 401 5 752 4 146 2 728 226 462
Did not receive any ECEC no. 8 437 2 175 8 866 1 253 447 139 140 185 21 642Unknown ECEC experience no. 7 690 3 729 9 073 1 472 1 507 195 308 204 24 178
no. 88 921 63 584 57 994 30 631 17 355 6 086 4 594 3 117 272 282
Children developmentally vulnerable on one or more domains% 17.7 17.9 22.8 21.8 22.2 21.1 21.3 34.0 19.8
Did not receive any ECEC % 32.5 40.4 35.1 39.3 39.8 28.1 30.7 56.2 35.1Unknown ECEC experience % 27.7 32.2 32.7 31.3 34.6 29.7 26.9 36.8 31.0
% 19.9 19.5 26.2 23.0 23.7 21.5 22.0 35.5 22.0
(a)
(b)(c)Source :
Received some ECEC
Received some ECEC
Total children with at least one valid domain score
Australian Government Department of Education and Training unpublished, Australian Early Development Census, 2012 and 2015.
Children classified as developmentally vulnerable score below the 10th percentile (in the lowest 10 per cent) of the national AEDC population for an AEDCdomain. Received some ECEC includes any formal child care or preschool. Family day care and informal care are not included.Data are reported by teachers and are therefore, dependent on the teacher's knowledge of the child's ECEC experience.
Total children developmentally vulnerable on one or more domains
Related Documents