FEB 2022

Welcome message from author
This document is posted to help you gain knowledge. Please leave a comment to let me know what you think about it! Share it to your friends and learn new things together.
Transcript
FEB 2022
2022 Global Markets & Economic Outlook / FEB 2022 / page 2
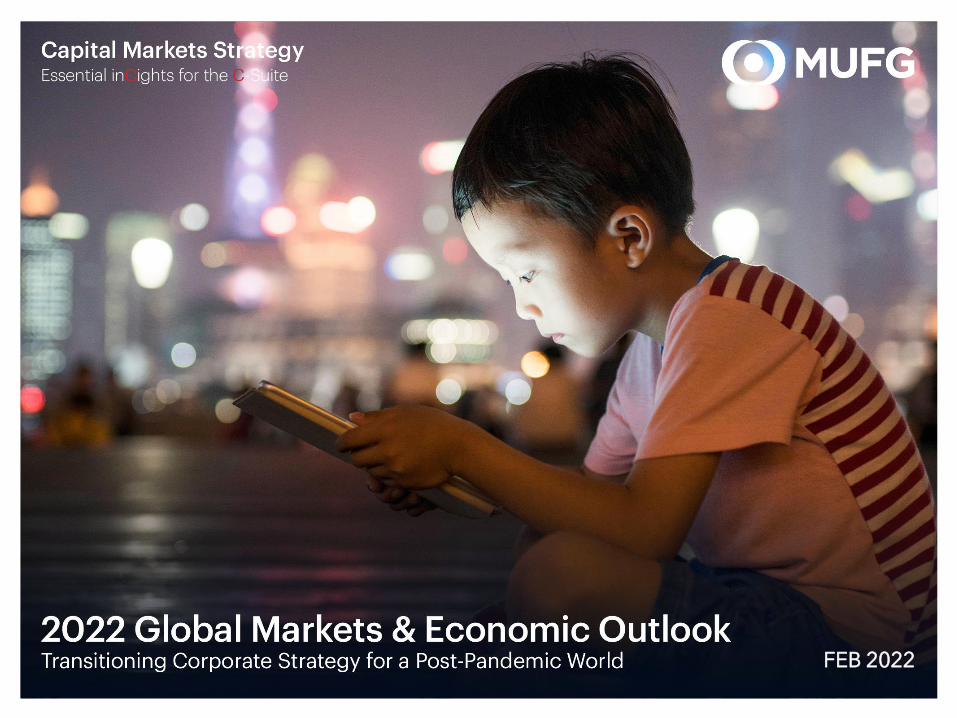
Technology’s Outsized Presence Companies with the world’s largest market capitalizations in 2005 and 2022 (in billion US dollars)
Source: Statista. Financial Times. Bloomberg. 2005 data as of March 31, 2005 and 2022 data as of January 1, 2022.
Tech
Oil / Energy
Finance
Physical Distribution
Conglomerate
Health
General Electric: $382 bn Exxon Mobil: $381 bn Microsoft: $263 bn Citigroup: $234 bn BP: $221bn Wal-Mart: $212 bn Royal Dutch Shell: $211 bn Johnson & Johnson: $200 bn
Microsoft: $2,525 bn
Alphabet: $1,922 bn
Amazon: $1,691 bn
Tesla: $1,061 bn
Meta: $936 bn
2022
2005
Apple: $2,913 bn
NVIDIA: $735 bn
Saudi Aramco: $1,907 bn
Global Corporate & Investment Banking Capital Markets Strategy Team
Tom Joyce Managing Director Capital Markets Strategist New York, NY [email protected] (212) 405-7472
Hailey Orr Director Capital Markets Strategist New York, NY [email protected] (212) 405-7429
Stephanie Kendal Associate Capital Markets Strategist New York, NY [email protected] (212) 405-7443
Contents
Introduction
I. Global Economy Rebalancing
II. Regime Change in Markets
III. Strategic Positioning from Strength
IV. Investing in a Post-Pandemic World
V. Resilient USD Credit Markets
VI. Geopolitical Risk & Big Government
Appendix A. 2021: In Memoriam B. 2021: Key Dates to Watch
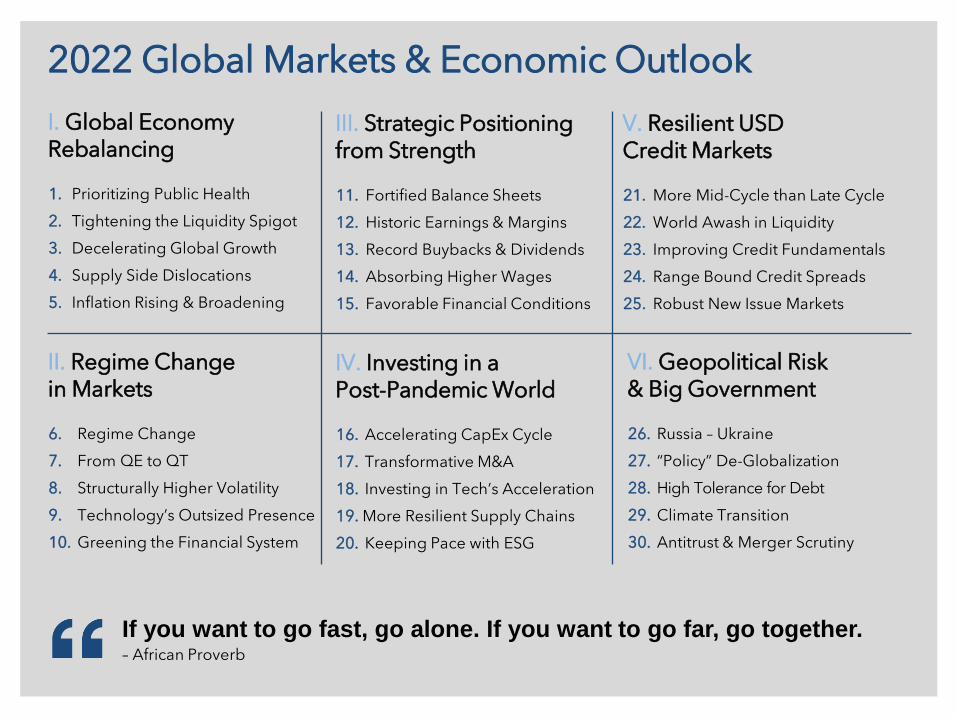
2022 Global Markets & Economic Outlook I. Global Economy Rebalancing
1. Prioritizing Public Health 2. Tightening the Liquidity Spigot 3. Decelerating Global Growth 4. Supply Side Dislocations 5. Inflation Rising & Broadening
III. Strategic Positioning from Strength
11. Fortified Balance Sheets 12. Historic Earnings & Margins 13. Record Buybacks & Dividends 14. Absorbing Higher Wages 15. Favorable Financial Conditions
V. Resilient USD Credit Markets
21. More Mid-Cycle than Late Cycle 22. World Awash in Liquidity 23. Improving Credit Fundamentals 24. Range Bound Credit Spreads 25. Robust New Issue Markets
VI. Geopolitical Risk & Big Government
26. Russia – Ukraine 27. “Policy” De-Globalization 28. High Tolerance for Debt 29. Climate Transition 30. Antitrust & Merger Scrutiny
II. Regime Change in Markets
6. Regime Change 7. From QE to QT 8. Structurally Higher Volatility 9. Technology’s Outsized Presence 10. Greening the Financial System
If you want to go fast, go alone. If you want to go far, go together. – African Proverb
IV. Investing in a Post-Pandemic World
16. Accelerating CapEx Cycle 17. Transformative M&A 18. Investing in Tech’s Acceleration 19. More Resilient Supply Chains 20. Keeping Pace with ESG


Introduction
“As a professor, I tended to think of history as run by impersonal forces. But when you see it in practice, you see the difference personalities make.” Henry Kissinger, US National Security Advisor & Secretary of State (1969 - 1977)
2022 Global Markets & Economic Outlook / FEB 2022 / page 8
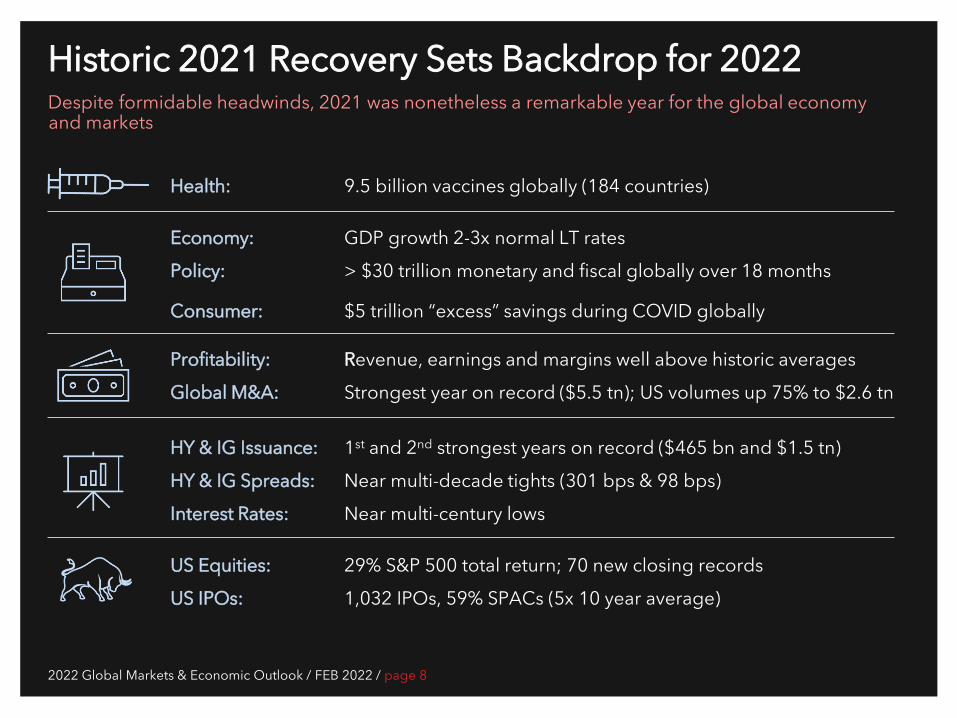
Historic 2021 Recovery Sets Backdrop for 2022 Despite formidable headwinds, 2021 was nonetheless a remarkable year for the global economy and markets
Health: 9.5 billion vaccines globally (184 countries)
Economy: GDP growth 2-3x normal LT rates Policy: > $30 trillion monetary and fiscal globally over 18 months Consumer: $5 trillion “excess” savings during COVID globally
Profitability: Revenue, earnings and margins well above historic averages Global M&A: Strongest year on record ($5.5 tn); US volumes up 75% to $2.6 tn
HY & IG Issuance: 1st and 2nd strongest years on record ($465 bn and $1.5 tn) HY & IG Spreads: Near multi-decade tights (301 bps & 98 bps) Interest Rates: Near multi-century lows
US Equities: 29% S&P 500 total return; 70 new closing records US IPOs: 1,032 IPOs, 59% SPACs (5x 10 year average)
2022 Global Markets & Economic Outlook / FEB 2022 / page 9
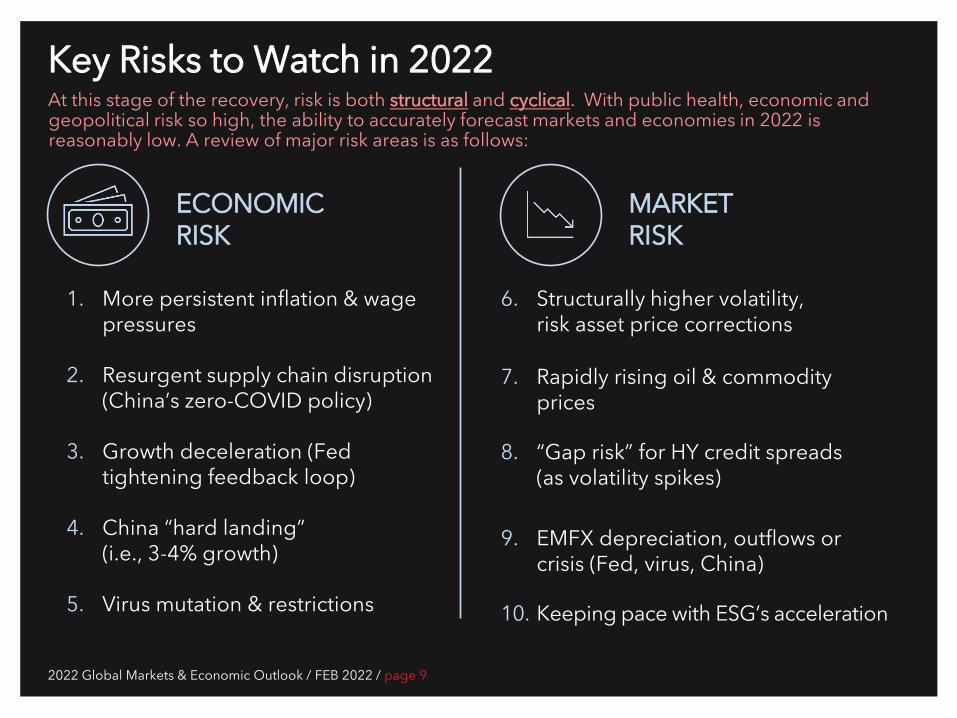
Key Risks to Watch in 2022 At this stage of the recovery, risk is both structural and cyclical. With public health, economic and geopolitical risk so high, the ability to accurately forecast markets and economies in 2022 is reasonably low. A review of major risk areas is as follows:
ECONOMIC RISK
MARKET RISK
1. More persistent inflation & wage pressures
2. Resurgent supply chain disruption (China’s zero-COVID policy)
3. Growth deceleration (Fed tightening feedback loop)
4. China “hard landing” (i.e., 3-4% growth)
5. Virus mutation & restrictions
6. Structurally higher volatility, risk asset price corrections
7. Rapidly rising oil & commodity prices
8. “Gap risk” for HY credit spreads (as volatility spikes)
9. EMFX depreciation, outflows or
crisis (Fed, virus, China)
10. Keeping pace with ESG’s acceleration
2022 Global Markets & Economic Outlook / FEB 2022 / page 10
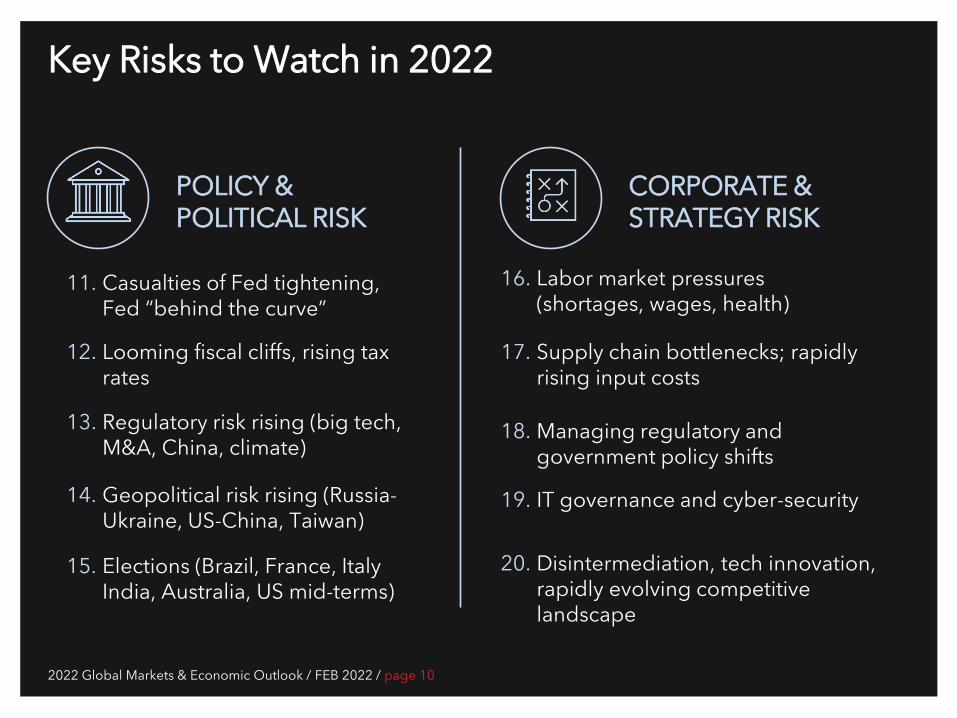
Key Risks to Watch in 2022
POLICY & POLITICAL RISK
CORPORATE & STRATEGY RISK
11. Casualties of Fed tightening, Fed “behind the curve”
12. Looming fiscal cliffs, rising tax rates
13. Regulatory risk rising (big tech, M&A, China, climate)
14. Geopolitical risk rising (Russia-Ukraine, US-China, Taiwan)
15. Elections (Brazil, France, Italy India, Australia, US mid-terms)
16. Labor market pressures (shortages, wages, health)
17. Supply chain bottlenecks; rapidly rising input costs
18. Managing regulatory and government policy shifts
19. IT governance and cyber-security
20. Disintermediation, tech innovation, rapidly evolving competitive landscape

2022 Global Markets & Economic Outlook / FEB 2022 / page 12
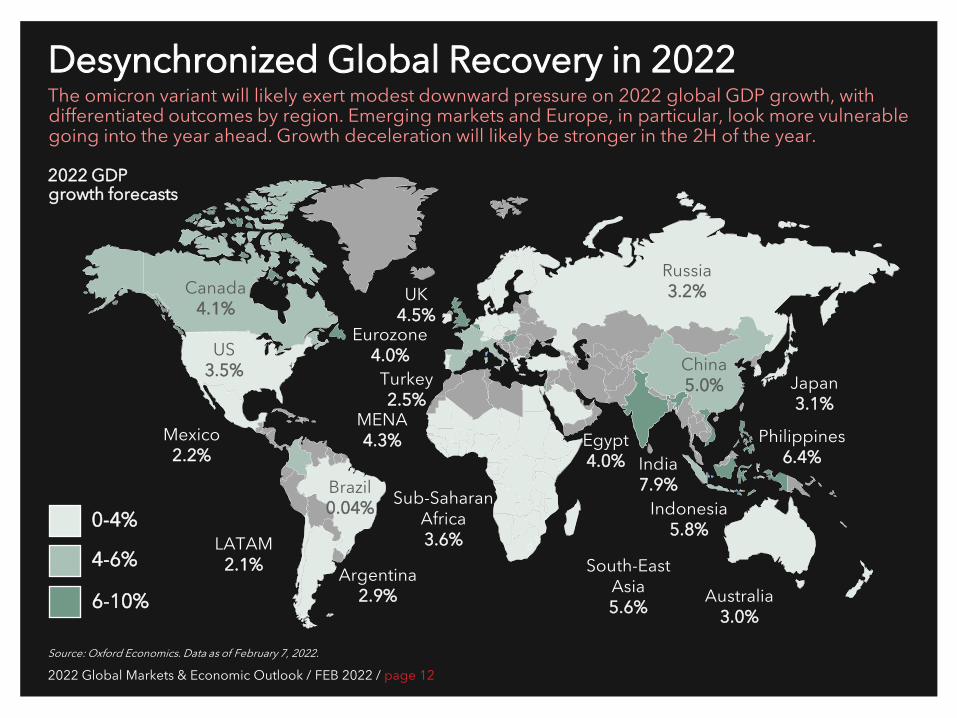
Desynchronized Global Recovery in 2022 The omicron variant will likely exert modest downward pressure on 2022 global GDP growth, with differentiated outcomes by region. Emerging markets and Europe, in particular, look more vulnerable going into the year ahead. Growth deceleration will likely be stronger in the 2H of the year.
Source: Oxford Economics. Data as of February 7, 2022.
0-4%
4-6%
6-10%
US 3.5%
MENA 4.3%
Australia 3.0%
Japan 3.1%
India 7.9%
Argentina 2.9%
Mexico 2.2%
Brazil 0.04%
UK 4.5%
Eurozone 4.0%
Sub-Saharan Africa 3.6%
China 5.0%
South-East Asia 5.6%
Canada 4.1%
Russia 3.2%
Indonesia 5.8%
Philippines 6.4%
LATAM 2.1%
Egypt 4.0%
Turkey 2.5%
2022 GDP growth forecasts
2022 Global Markets & Economic Outlook / FEB 2022 / page 13
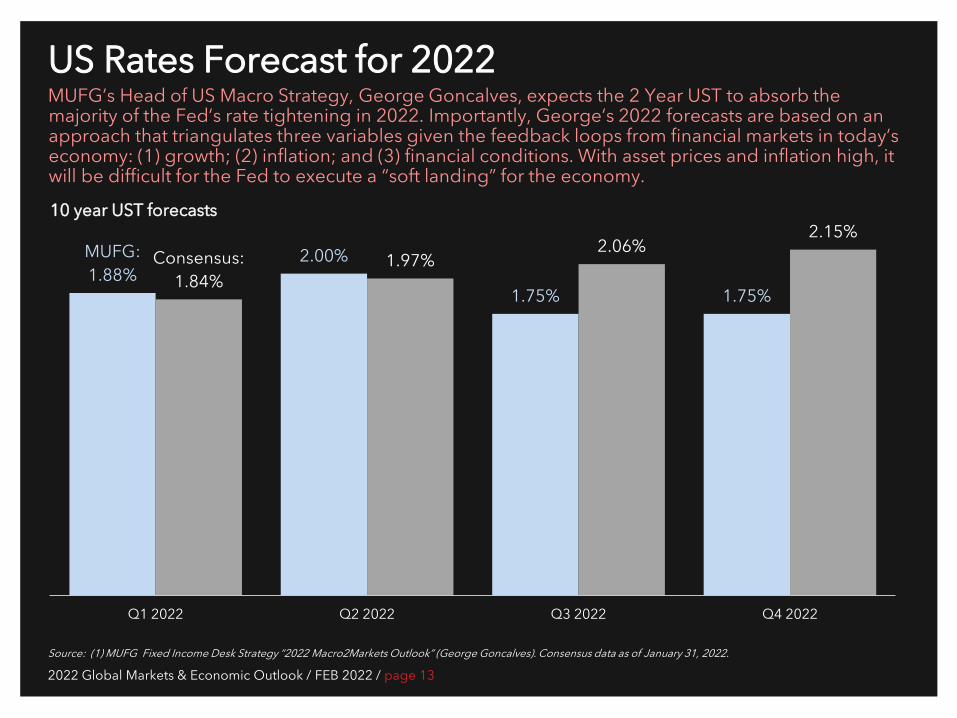
US Rates Forecast for 2022
Source: (1) MUFG Fixed Income Desk Strategy “2022 Macro2Markets Outlook” (George Goncalves). Consensus data as of January 31, 2022.
MUFG: 1.88%
2.00%
1.75% 1.75%
Consensus: 1.84%
1.97% 2.06%
2.15%
Q1 2022 Q2 2022 Q3 2022 Q4 2022
10 year UST forecasts
MUFG’s Head of US Macro Strategy, George Goncalves, expects the 2 Year UST to absorb the majority of the Fed’s rate tightening in 2022. Importantly, George’s 2022 forecasts are based on an approach that triangulates three variables given the feedback loops from financial markets in today’s economy: (1) growth; (2) inflation; and (3) financial conditions. With asset prices and inflation high, it will be difficult for the Fed to execute a “soft landing” for the economy.
2022 Global Markets & Economic Outlook / FEB 2022 / page 14
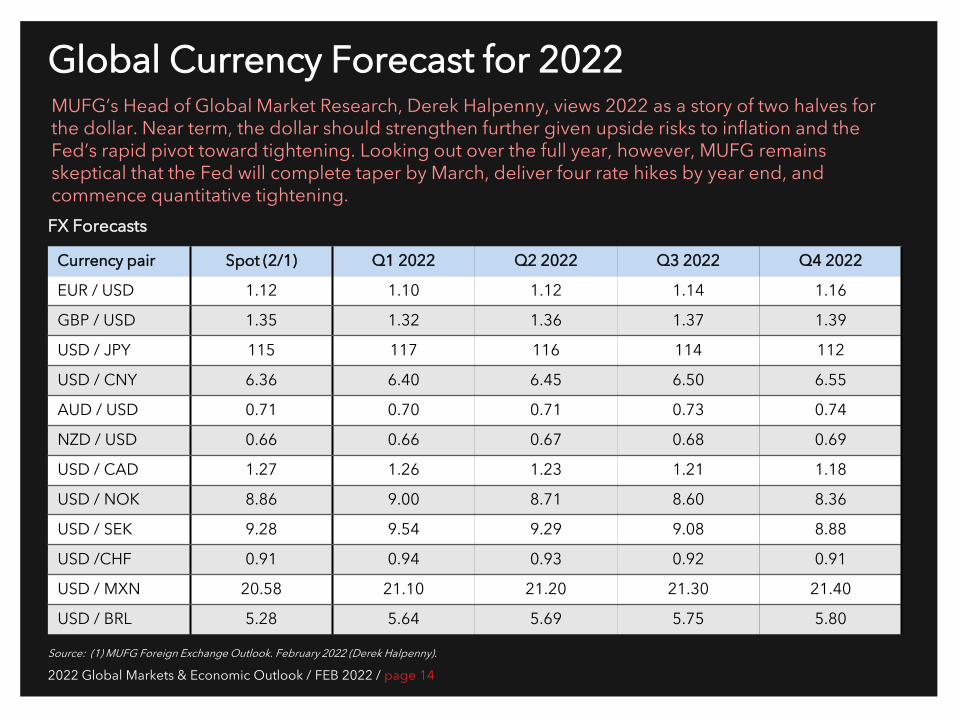
Global Currency Forecast for 2022
Source: (1) MUFG Foreign Exchange Outlook. February 2022 (Derek Halpenny).
Currency pair Spot (2/1) Q1 2022 Q2 2022 Q3 2022 Q4 2022
EUR / USD 1.12 1.10 1.12 1.14 1.16
GBP / USD 1.35 1.32 1.36 1.37 1.39
USD / JPY 115 117 116 114 112
USD / CNY 6.36 6.40 6.45 6.50 6.55
AUD / USD 0.71 0.70 0.71 0.73 0.74
NZD / USD 0.66 0.66 0.67 0.68 0.69
USD / CAD 1.27 1.26 1.23 1.21 1.18
USD / NOK 8.86 9.00 8.71 8.60 8.36
USD / SEK 9.28 9.54 9.29 9.08 8.88
USD /CHF 0.91 0.94 0.93 0.92 0.91
USD / MXN 20.58 21.10 21.20 21.30 21.40
USD / BRL 5.28 5.64 5.69 5.75 5.80
FX Forecasts
MUFG’s Head of Global Market Research, Derek Halpenny, views 2022 as a story of two halves for the dollar. Near term, the dollar should strengthen further given upside risks to inflation and the Fed’s rapid pivot toward tightening. Looking out over the full year, however, MUFG remains skeptical that the Fed will complete taper by March, deliver four rate hikes by year end, and commence quantitative tightening.
1 Global Economy Rebalancing
“It will be challenging to reduce inflation without giving rise to a recession.” Larry Summers, Former US Treasury Secretary, NEC Director & Harvard President
2022 Global Markets & Economic Outlook / FEB 2022 / page 16
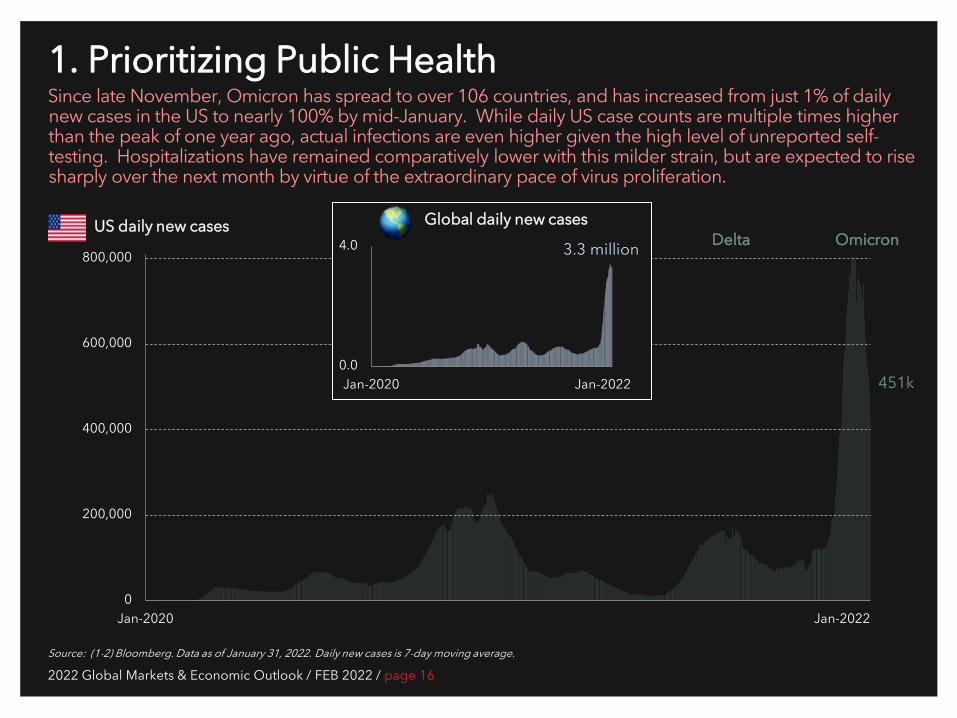
1. Prioritizing Public Health Since late November, Omicron has spread to over 106 countries, and has increased from just 1% of daily new cases in the US to nearly 100% by mid-January. While daily US case counts are multiple times higher than the peak of one year ago, actual infections are even higher given the high level of unreported self-testing. Hospitalizations have remained comparatively lower with this milder strain, but are expected to rise sharply over the next month by virtue of the extraordinary pace of virus proliferation.
Source: (1-2) Bloomberg. Data as of January 31, 2022. Daily new cases is 7-day moving average.
US daily new cases
0
200,000
400,000
600,000
800,000
Jan-2020 Jan-2022
451k
Delta Omicron
0.0
4.0
Jan-2020 Jan-2022
Global daily new cases
3.3 million
2022 Global Markets & Economic Outlook / FEB 2022 / page 17
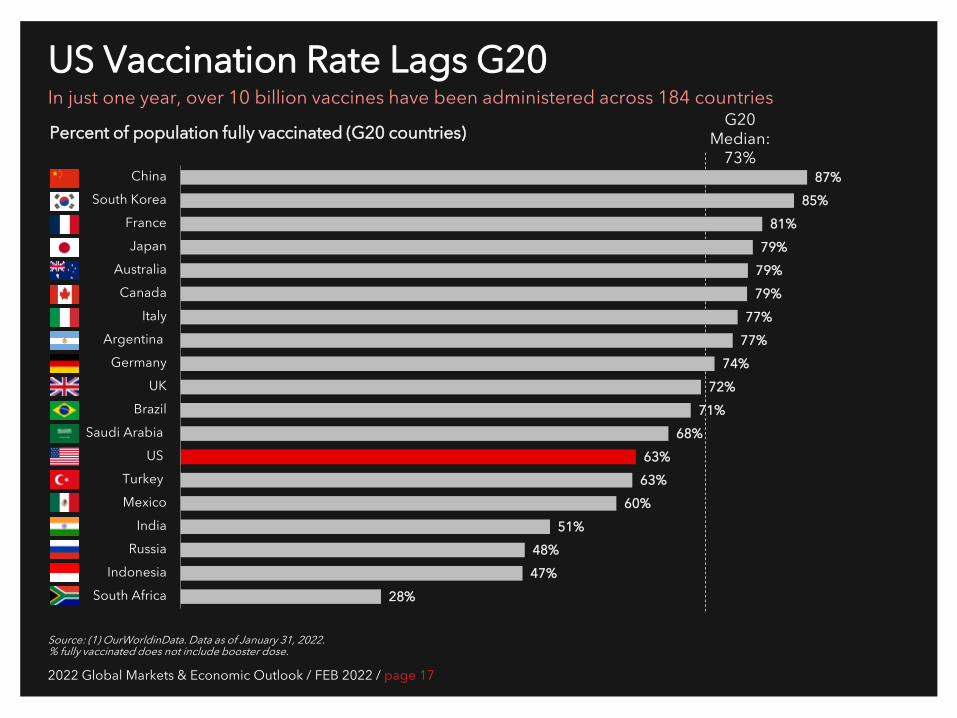
US Vaccination Rate Lags G20 In just one year, over 10 billion vaccines have been administered across 184 countries
Source: (1) OurWorldinData. Data as of January 31, 2022. % fully vaccinated does not include booster dose.
G20 Median:
73%
28%
47%
48%
51%
60%
63%
63%
68%
71%
72%
74%
77%
77%
79%
79%
79%
81%
85%
87%
South Africa
Indonesia
Russia
India
Mexico
Turkey
US
Saudi Arabia
Brazil
UK
Germany
Argentina
Italy
Canada
Australia
Japan
France
South Korea
China
Percent of population fully vaccinated (G20 countries)
2022 Global Markets & Economic Outlook / FEB 2022 / page 18
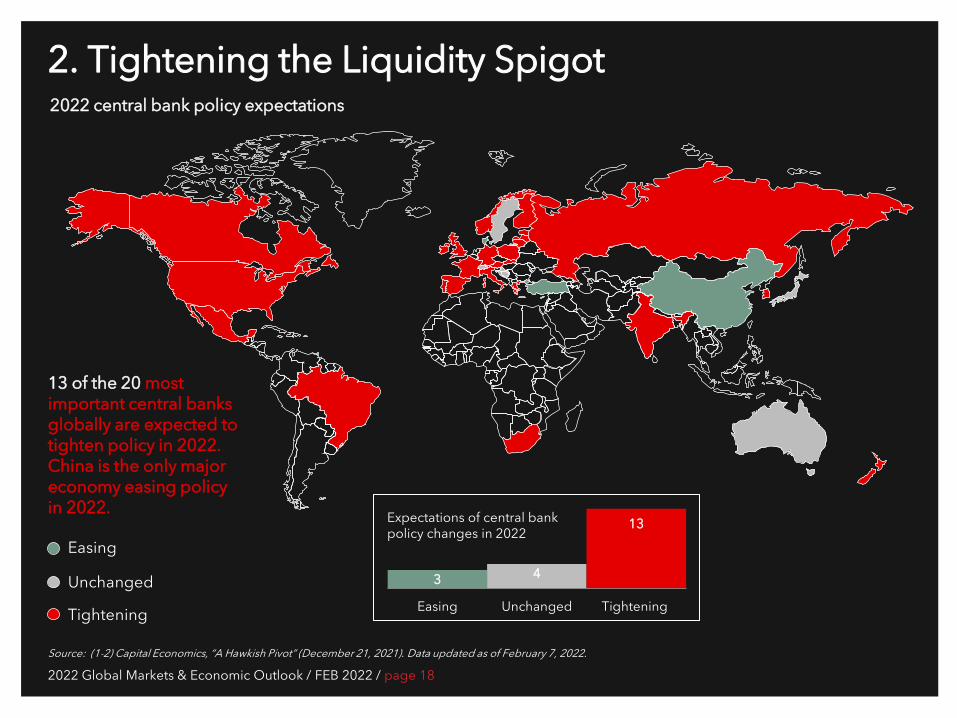
3 4
13
Easing Unchanged Tightening
2. Tightening the Liquidity Spigot
Source: (1-2) Capital Economics, “A Hawkish Pivot” (December 21, 2021). Data updated as of February 7, 2022.
13 of the 20 most important central banks globally are expected to tighten policy in 2022. China is the only major economy easing policy in 2022.
Tightening
Unchanged
Easing
Expectations of central bank policy changes in 2022
2022 central bank policy expectations
2022 Global Markets & Economic Outlook / FEB 2022 / page 19
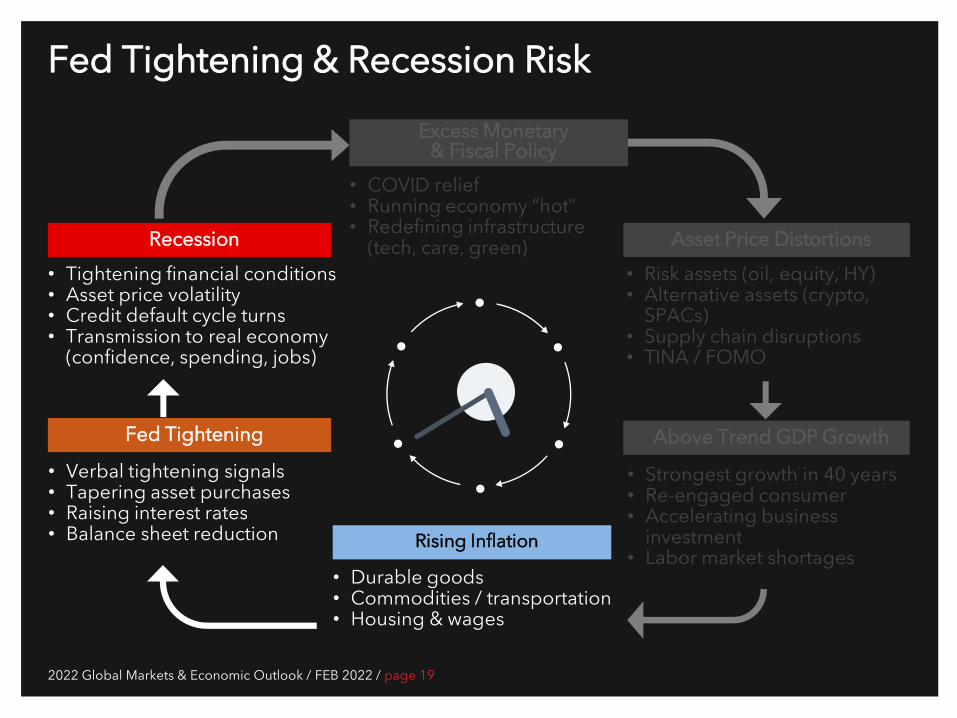
Fed Tightening & Recession Risk
• Tightening financial conditions • Asset price volatility • Credit default cycle turns • Transmission to real economy
(confidence, spending, jobs)
Recession
• Verbal tightening signals • Tapering asset purchases • Raising interest rates • Balance sheet reduction
Fed Tightening
• COVID relief • Running economy “hot” • Redefining infrastructure
(tech, care, green) • Risk assets (oil, equity, HY) • Alternative assets (crypto,
SPACs) • Supply chain disruptions • TINA / FOMO
Asset Price Distortions
• Strongest growth in 40 years • Re-engaged consumer • Accelerating business
investment • Labor market shortages
Above Trend GDP Growth
Rising Inflation
Excess Monetary & Fiscal Policy
• Durable goods • Commodities / transportation • Housing & wages
2022 Global Markets & Economic Outlook / FEB 2022 / page 20
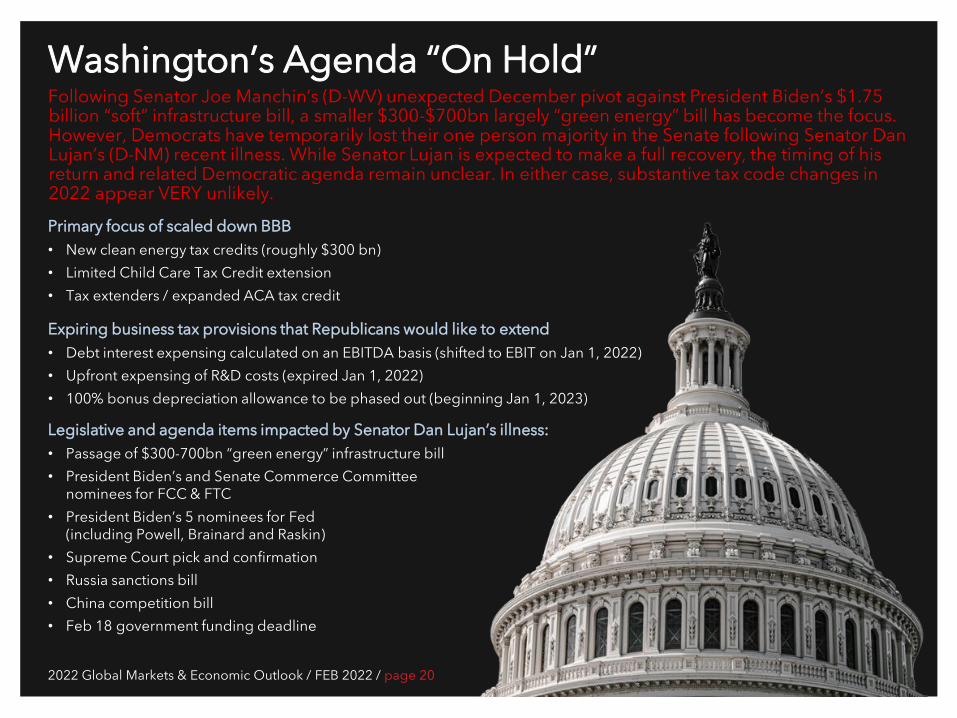
Washington’s Agenda “On Hold” Following Senator Joe Manchin’s (D-WV) unexpected December pivot against President Biden’s $1.75 billion “soft” infrastructure bill, a smaller $300-$700bn largely “green energy” bill has become the focus. However, Democrats have temporarily lost their one person majority in the Senate following Senator Dan Lujan’s (D-NM) recent illness. While Senator Lujan is expected to make a full recovery, the timing of his return and related Democratic agenda remain unclear. In either case, substantive tax code changes in 2022 appear VERY unlikely.
Expiring business tax provisions that Republicans would like to extend • Debt interest expensing calculated on an EBITDA basis (shifted to EBIT on Jan 1, 2022) • Upfront expensing of R&D costs (expired Jan 1, 2022) • 100% bonus depreciation allowance to be phased out (beginning Jan 1, 2023)
Primary focus of scaled down BBB • New clean energy tax credits (roughly $300 bn) • Limited Child Care Tax Credit extension • Tax extenders / expanded ACA tax credit
Legislative and agenda items impacted by Senator Dan Lujan’s illness: • Passage of $300-700bn “green energy” infrastructure bill • President Biden’s and Senate Commerce Committee
nominees for FCC & FTC • President Biden’s 5 nominees for Fed
(including Powell, Brainard and Raskin) • Supreme Court pick and confirmation • Russia sanctions bill • China competition bill • Feb 18 government funding deadline
2022 Global Markets & Economic Outlook / FEB 2022 / page 21
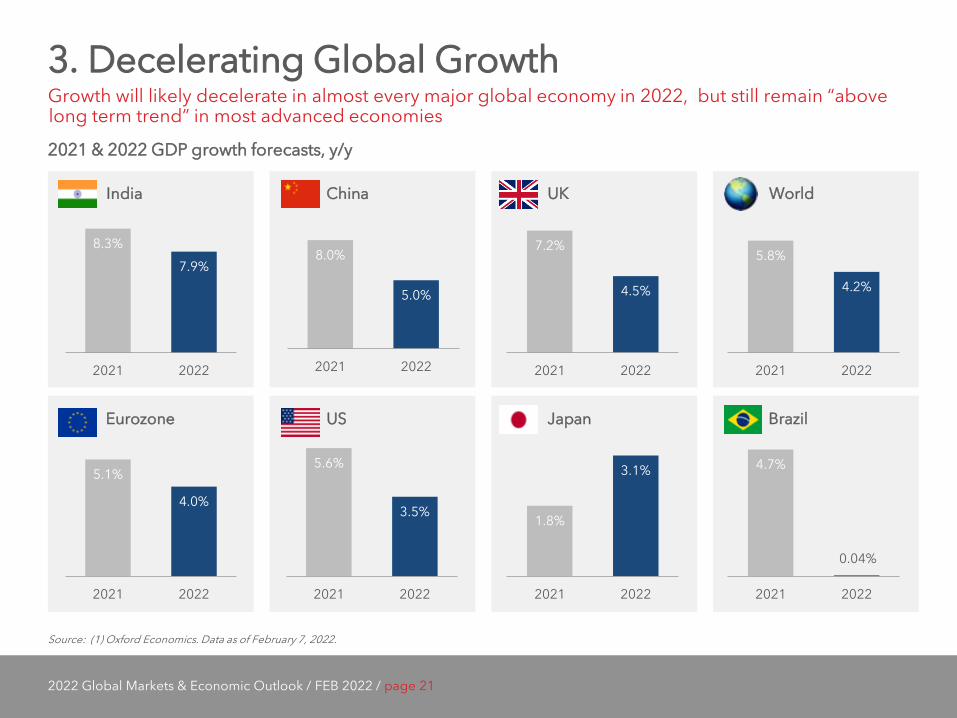
3. Decelerating Global Growth Growth will likely decelerate in almost every major global economy in 2022, but still remain “above long term trend” in most advanced economies
Source: (1) Oxford Economics. Data as of February 7, 2022.
2021 & 2022 GDP growth forecasts, y/y
India China UK World
US Japan Brazil
8.3%
7.9%
2021 2022
8.0%
5.0%
2021 2022
7.2%
4.5%
2021 2022
5.1%
4.0%
2021 2022
5.6%
3.5%
2021 2022
1.8%
3.1%
2021 2022
4.7%
2021 2022
0.04%
Eurozone
5.8%
4.2%
2021 2022
2022 Global Markets & Economic Outlook / FEB 2022 / page 22
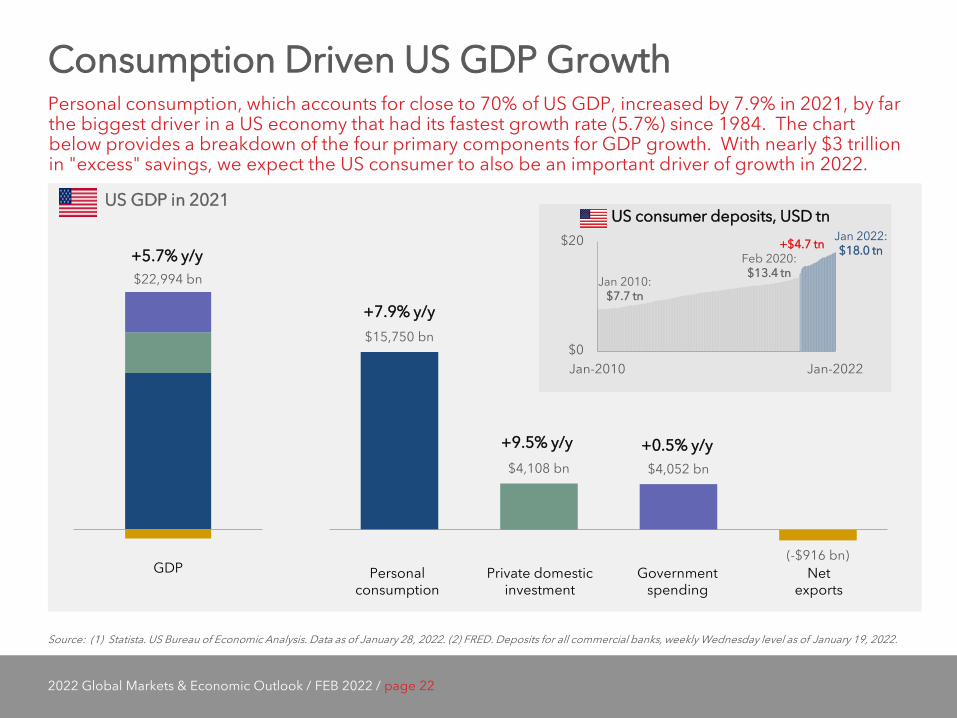
Consumption Driven US GDP Growth Personal consumption, which accounts for close to 70% of US GDP, increased by 7.9% in 2021, by far the biggest driver in a US economy that had its fastest growth rate (5.7%) since 1984. The chart below provides a breakdown of the four primary components for GDP growth. With nearly $3 trillion in "excess" savings, we expect the US consumer to also be an important driver of growth in 2022.
Source: (1) Statista. US Bureau of Economic Analysis. Data as of January 28, 2022. (2) FRED. Deposits for all commercial banks, weekly Wednesday level as of January 19, 2022.
US GDP in 2021
$15,750 bn
$4,108 bn $4,052 bn
(-$916 bn) PCE Gross priv. dom. Inv Govmt consu. Net exportsGDP
$22,994 bn
Personal consumption
Private domestic investment
Government spending
Net exports
+5.7% y/y
+7.9% y/y
+9.5% y/y +0.5% y/y
$0
$20
Jan-2010 Jan-2022
Jan 2010: $7.7 tn
Feb 2020: $13.4 tn
Jan 2022: $18.0 tn +$4.7 tn
US consumer deposits, USD tn
2022 Global Markets & Economic Outlook / FEB 2022 / page 23
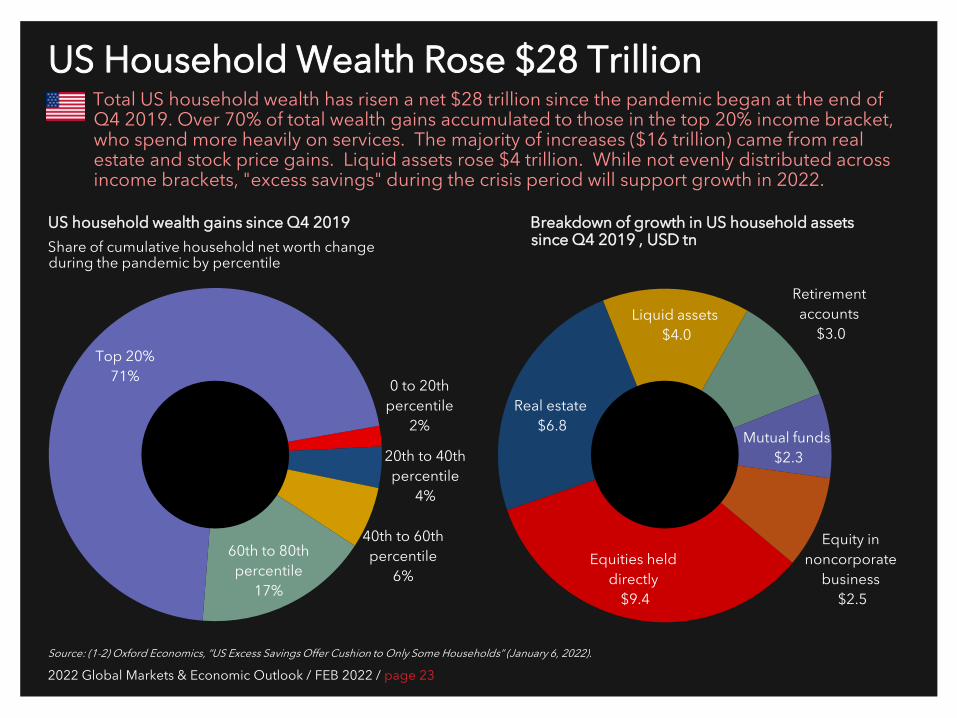
US Household Wealth Rose $28 Trillion Total US household wealth has risen a net $28 trillion since the pandemic began at the end of Q4 2019. Over 70% of total wealth gains accumulated to those in the top 20% income bracket, who spend more heavily on services. The majority of increases ($16 trillion) came from real estate and stock price gains. Liquid assets rose $4 trillion. While not evenly distributed across income brackets, "excess savings" during the crisis period will support growth in 2022.
Source: (1-2) Oxford Economics, “US Excess Savings Offer Cushion to Only Some Households” (January 6, 2022).
US household wealth gains since Q4 2019 Share of cumulative household net worth change during the pandemic by percentile
Breakdown of growth in US household assets since Q4 2019 , USD tn
0 to 20th percentile
2%
20th to 40th percentile
4%
40th to 60th percentile
6%
60th to 80th percentile
17%
Top 20% 71%
Equities held directly
$9.4
Real estate $6.8
Liquid assets $4.0
Retirement accounts
$3.0
Mutual funds $2.3
Equity in noncorporate
business $2.5
2022 Global Markets & Economic Outlook / FEB 2022 / page 24
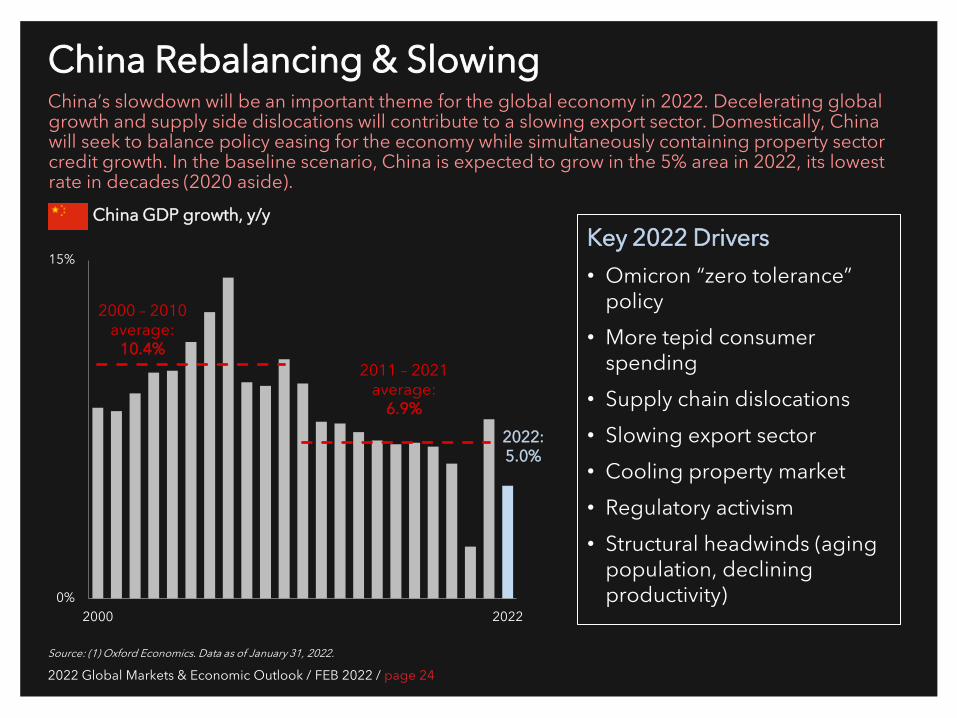
China Rebalancing & Slowing China’s slowdown will be an important theme for the global economy in 2022. Decelerating global growth and supply side dislocations will contribute to a slowing export sector. Domestically, China will seek to balance policy easing for the economy while simultaneously containing property sector credit growth. In the baseline scenario, China is expected to grow in the 5% area in 2022, its lowest rate in decades (2020 aside).
Source: (1) Oxford Economics. Data as of January 31, 2022.
China GDP growth, y/y
0%
15%
2000 2022
2000 – 2010 average:
10.4% 2011 – 2021
average: 6.9%
2022: 5.0%
Key 2022 Drivers • Omicron “zero tolerance”
policy • More tepid consumer
spending • Supply chain dislocations • Slowing export sector • Cooling property market • Regulatory activism • Structural headwinds (aging
population, declining productivity)

2022 Global Markets & Economic Outlook / FEB 2022 / page 26
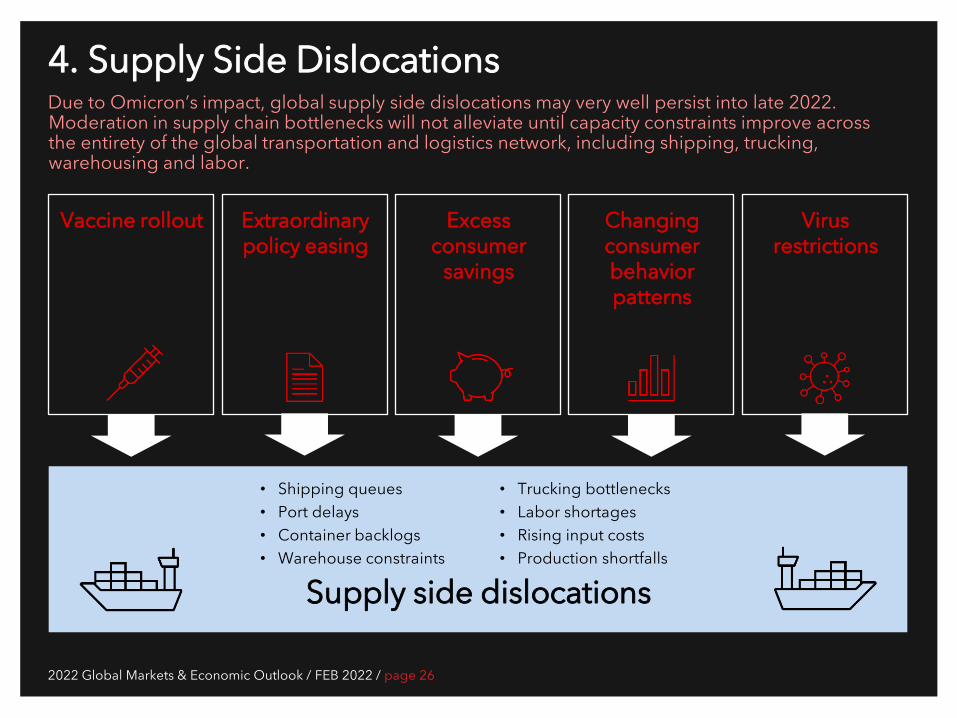
Supply side dislocations
Virus restrictions
Vaccine rollout Extraordinary policy easing
Excess consumer
savings
Changing consumer behavior patterns
4. Supply Side Dislocations
• Shipping queues • Port delays • Container backlogs • Warehouse constraints
• Trucking bottlenecks • Labor shortages • Rising input costs • Production shortfalls
Due to Omicron’s impact, global supply side dislocations may very well persist into late 2022. Moderation in supply chain bottlenecks will not alleviate until capacity constraints improve across the entirety of the global transportation and logistics network, including shipping, trucking, warehousing and labor.
2022 Global Markets & Economic Outlook / FEB 2022 / page 27
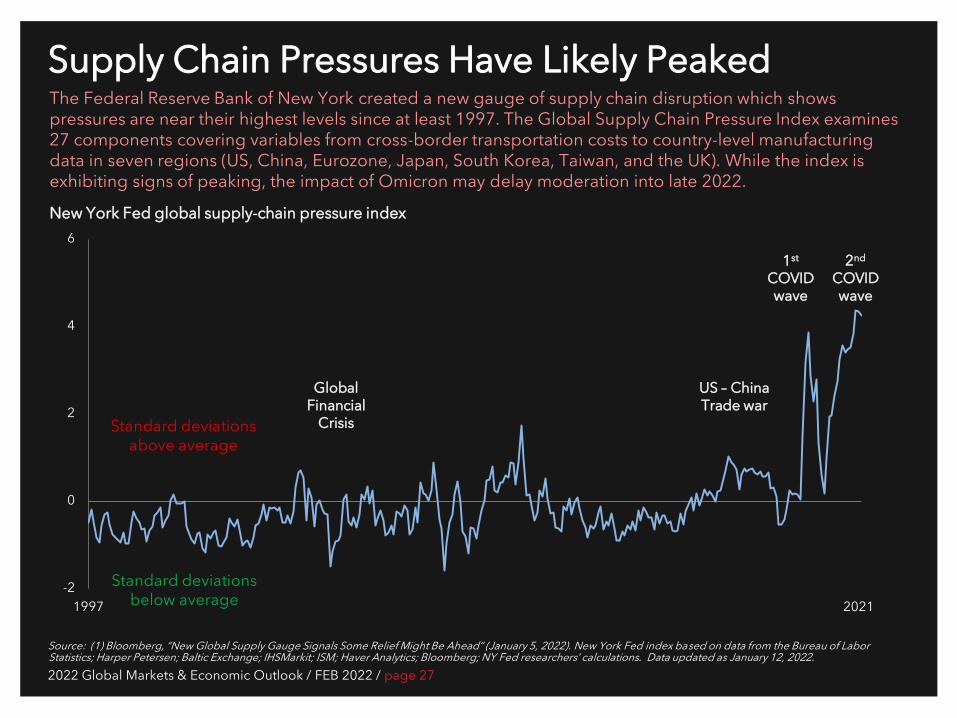
Supply Chain Pressures Have Likely Peaked
Source: (1) Bloomberg, “New Global Supply Gauge Signals Some Relief Might Be Ahead” (January 5, 2022). New York Fed index based on data from the Bureau of Labor Statistics; Harper Petersen; Baltic Exchange; IHSMarkit; ISM; Haver Analytics; Bloomberg; NY Fed researchers’ calculations. Data updated as January 12, 2022.
New York Fed global supply-chain pressure index
The Federal Reserve Bank of New York created a new gauge of supply chain disruption which shows pressures are near their highest levels since at least 1997. The Global Supply Chain Pressure Index examines 27 components covering variables from cross-border transportation costs to country-level manufacturing data in seven regions (US, China, Eurozone, Japan, South Korea, Taiwan, and the UK). While the index is exhibiting signs of peaking, the impact of Omicron may delay moderation into late 2022.
-2
0
2
4
6
1997 2021
Standard deviations above average
Standard deviations below average
Global Financial
Crisis
US – China Trade war
1st COVID wave
2nd COVID wave
2022 Global Markets & Economic Outlook / FEB 2022 / page 28
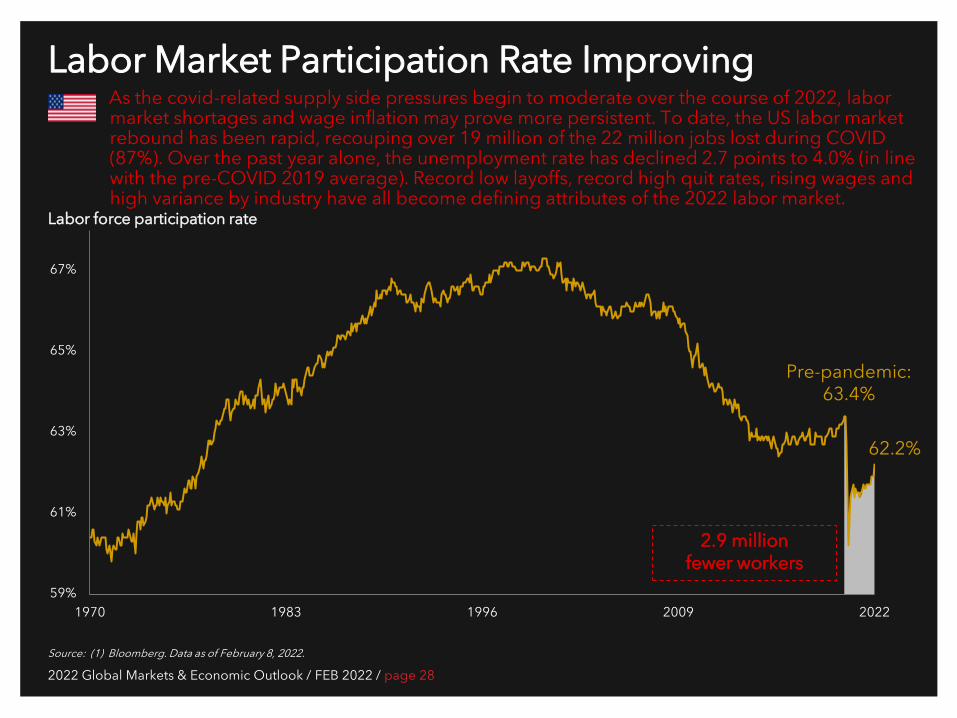
Labor Market Participation Rate Improving As the covid-related supply side pressures begin to moderate over the course of 2022, labor market shortages and wage inflation may prove more persistent. To date, the US labor market rebound has been rapid, recouping over 19 million of the 22 million jobs lost during COVID (87%). Over the past year alone, the unemployment rate has declined 2.7 points to 4.0% (in line with the pre-COVID 2019 average). Record low layoffs, record high quit rates, rising wages and high variance by industry have all become defining attributes of the 2022 labor market.
Source: (1) Bloomberg. Data as of February 8, 2022.
Labor force participation rate
59%
61%
63%
65%
67%
1970 1983 1996 2009 2022
62.2%
2.9 million fewer workers
Pre-pandemic: 63.4%
2022 Global Markets & Economic Outlook / FEB 2022 / page 29
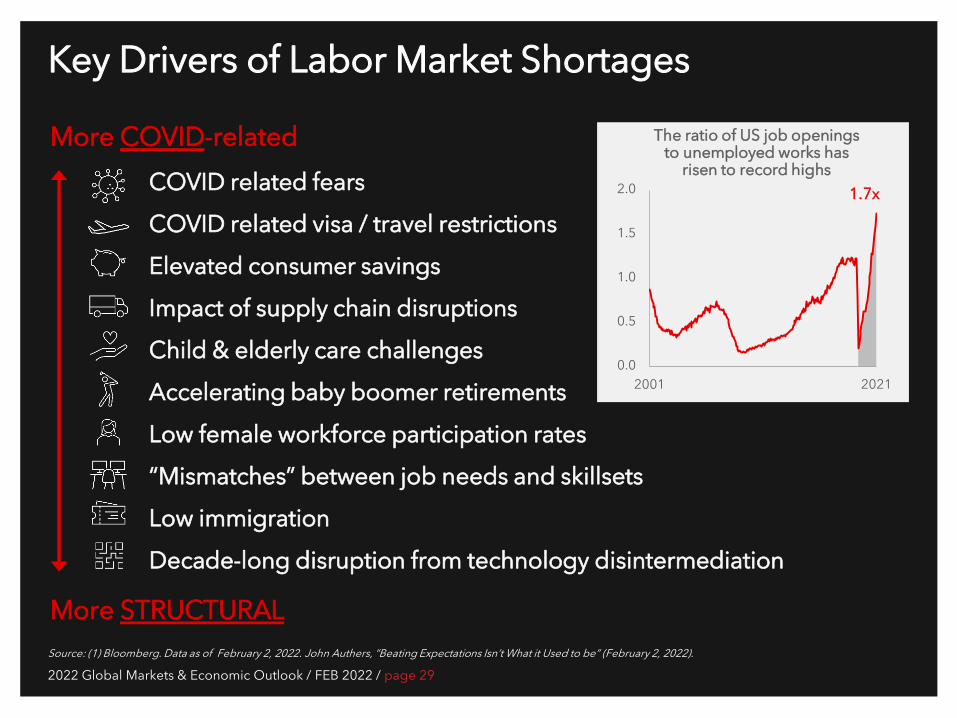
More COVID-related
Key Drivers of Labor Market Shortages
More STRUCTURAL
COVID related fears
COVID related visa / travel restrictions
Elevated consumer savings
Impact of supply chain disruptions
Child & elderly care challenges
Accelerating baby boomer retirements
Low female workforce participation rates
“Mismatches” between job needs and skillsets
Low immigration
Decade-long disruption from technology disintermediation
The ratio of US job openings to unemployed works has
risen to record highs
0.0
0.5
1.0
1.5
2.0
2001 2021
Source: (1) Bloomberg. Data as of February 2, 2022. John Authers, “Beating Expectations Isn’t What it Used to be” (February 2, 2022).
1.7x
2022 Global Markets & Economic Outlook / FEB 2022 / page 30
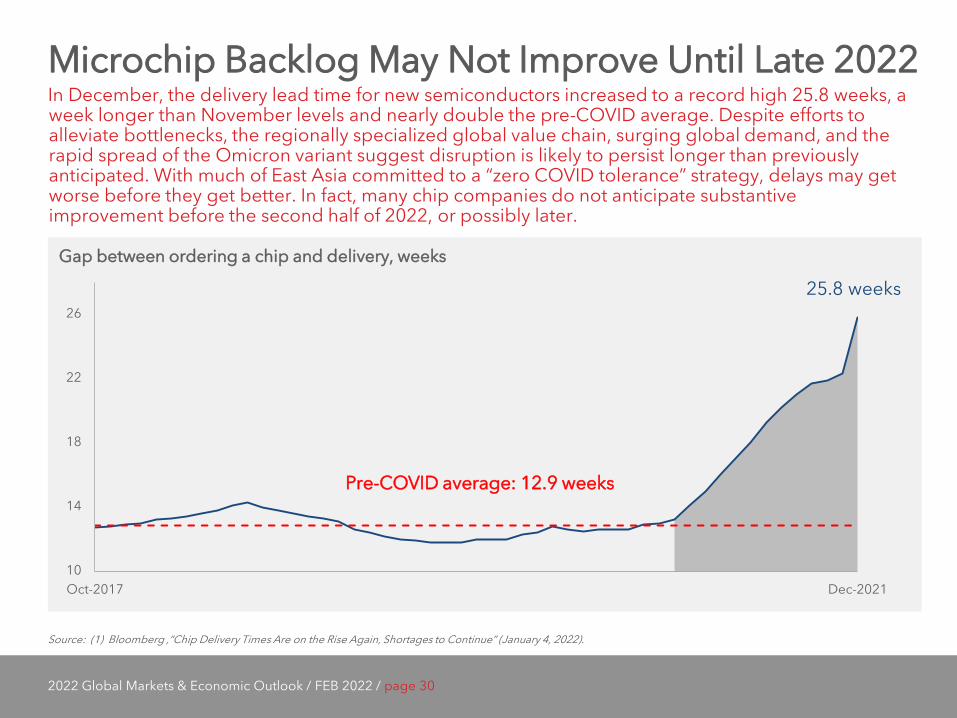
Microchip Backlog May Not Improve Until Late 2022 In December, the delivery lead time for new semiconductors increased to a record high 25.8 weeks, a week longer than November levels and nearly double the pre-COVID average. Despite efforts to alleviate bottlenecks, the regionally specialized global value chain, surging global demand, and the rapid spread of the Omicron variant suggest disruption is likely to persist longer than previously anticipated. With much of East Asia committed to a “zero COVID tolerance” strategy, delays may get worse before they get better. In fact, many chip companies do not anticipate substantive improvement before the second half of 2022, or possibly later.
Source: (1) Bloomberg ,“Chip Delivery Times Are on the Rise Again, Shortages to Continue” (January 4, 2022).
Gap between ordering a chip and delivery, weeks
10
14
18
22
26
Oct-2017 Dec-2021
Pre-COVID average: 12.9 weeks
25.8 weeks

2022 Global Markets & Economic Outlook / FEB 2022 / page 32
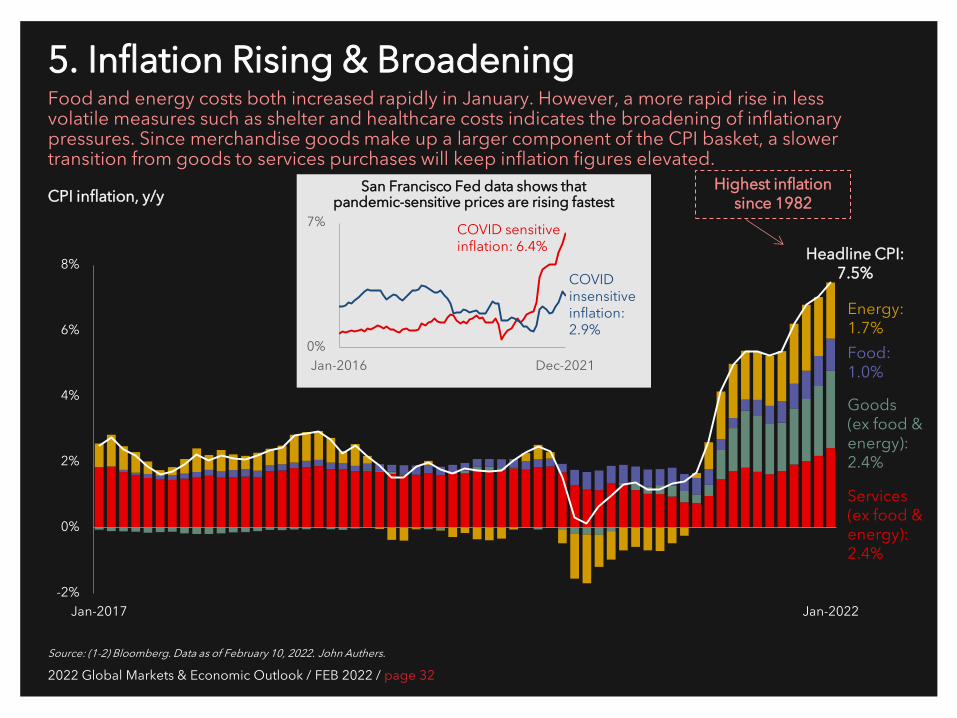
5. Inflation Rising & Broadening Food and energy costs both increased rapidly in January. However, a more rapid rise in less volatile measures such as shelter and healthcare costs indicates the broadening of inflationary pressures. Since merchandise goods make up a larger component of the CPI basket, a slower transition from goods to services purchases will keep inflation figures elevated.
Source: (1-2) Bloomberg. Data as of February 10, 2022. John Authers.
CPI inflation, y/y
-2%
0%
2%
4%
6%
8%
Jan-2017 Jan-2022
Headline CPI: 7.5%
Energy: 1.7%
Goods (ex food & energy): 2.4%
Services (ex food & energy): 2.4%
Food: 1.0%
0%
7%
Jan-2016 Dec-2021
San Francisco Fed data shows that pandemic-sensitive prices are rising fastest
COVID sensitive inflation: 6.4%
COVID insensitive inflation: 2.9%
Highest inflation since 1982
2022 Global Markets & Economic Outlook / FEB 2022 / page 33
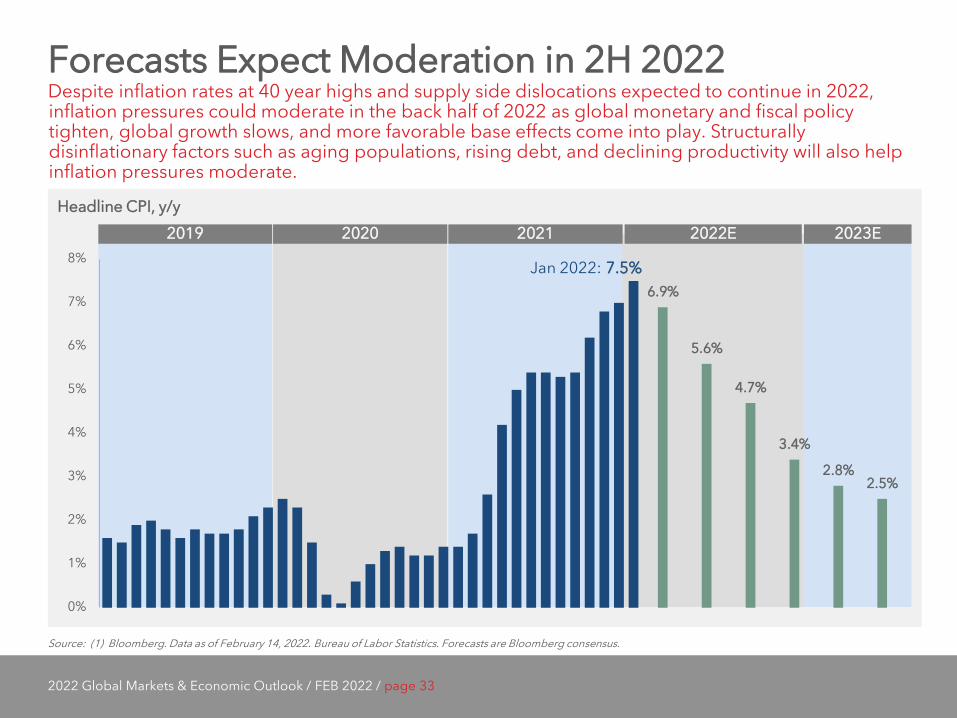
Forecasts Expect Moderation in 2H 2022 Despite inflation rates at 40 year highs and supply side dislocations expected to continue in 2022, inflation pressures could moderate in the back half of 2022 as global monetary and fiscal policy tighten, global growth slows, and more favorable base effects come into play. Structurally disinflationary factors such as aging populations, rising debt, and declining productivity will also help inflation pressures moderate.
6.9%
5.6%
4.7%
3.4%
2.8% 2.5%
0%
1%
2%
3%
4%
5%
6%
7%
8%
Source: (1) Bloomberg. Data as of February 14, 2022. Bureau of Labor Statistics. Forecasts are Bloomberg consensus.
Headline CPI, y/y
Jan 2022: 7.5%
2019 2020 2021 2022E 2023E
2022 Global Markets & Economic Outlook / FEB 2022 / page 34
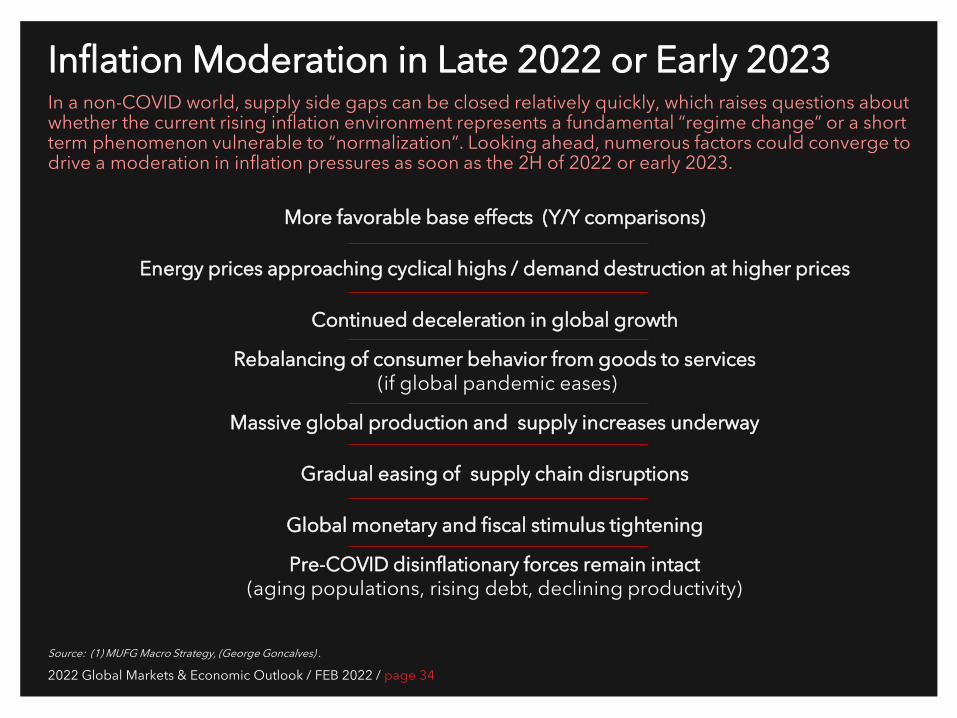
Inflation Moderation in Late 2022 or Early 2023 In a non-COVID world, supply side gaps can be closed relatively quickly, which raises questions about whether the current rising inflation environment represents a fundamental “regime change” or a short term phenomenon vulnerable to “normalization”. Looking ahead, numerous factors could converge to drive a moderation in inflation pressures as soon as the 2H of 2022 or early 2023.
Source: (1) MUFG Macro Strategy, (George Goncalves) .
More favorable base effects (Y/Y comparisons)
Continued deceleration in global growth
Massive global production and supply increases underway
Global monetary and fiscal stimulus tightening
Energy prices approaching cyclical highs / demand destruction at higher prices
Rebalancing of consumer behavior from goods to services (if global pandemic eases)
Gradual easing of supply chain disruptions
Pre-COVID disinflationary forces remain intact (aging populations, rising debt, declining productivity)
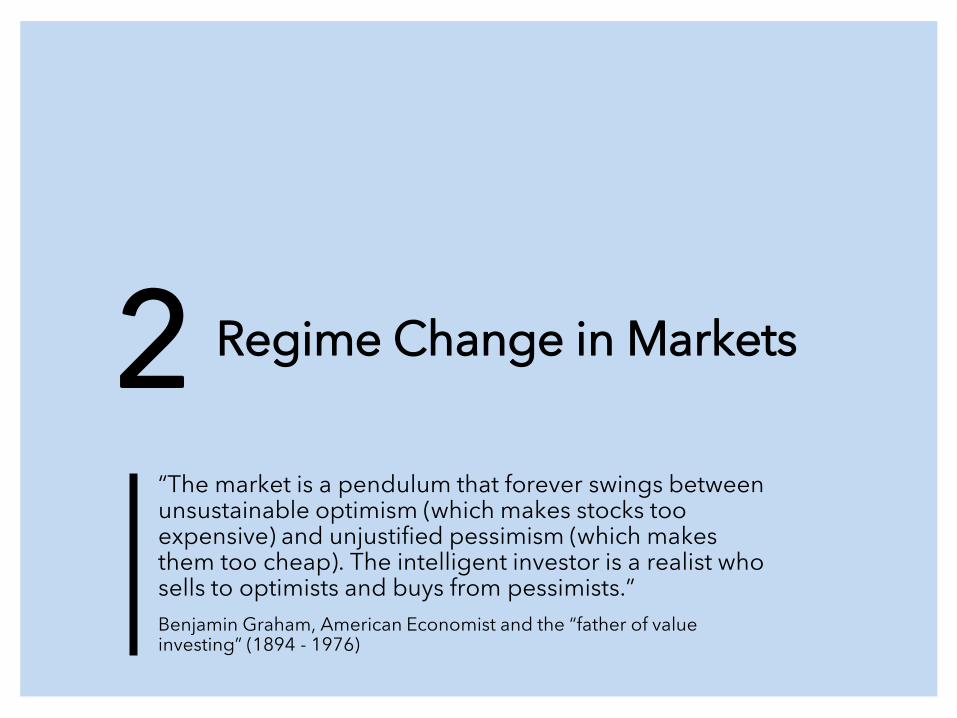
2 Regime Change in Markets
“The market is a pendulum that forever swings between unsustainable optimism (which makes stocks too expensive) and unjustified pessimism (which makes them too cheap). The intelligent investor is a realist who sells to optimists and buys from pessimists.” Benjamin Graham, American Economist and the “father of value investing” (1894 - 1976)
2022 Global Markets & Economic Outlook / FEB 2022 / page 37
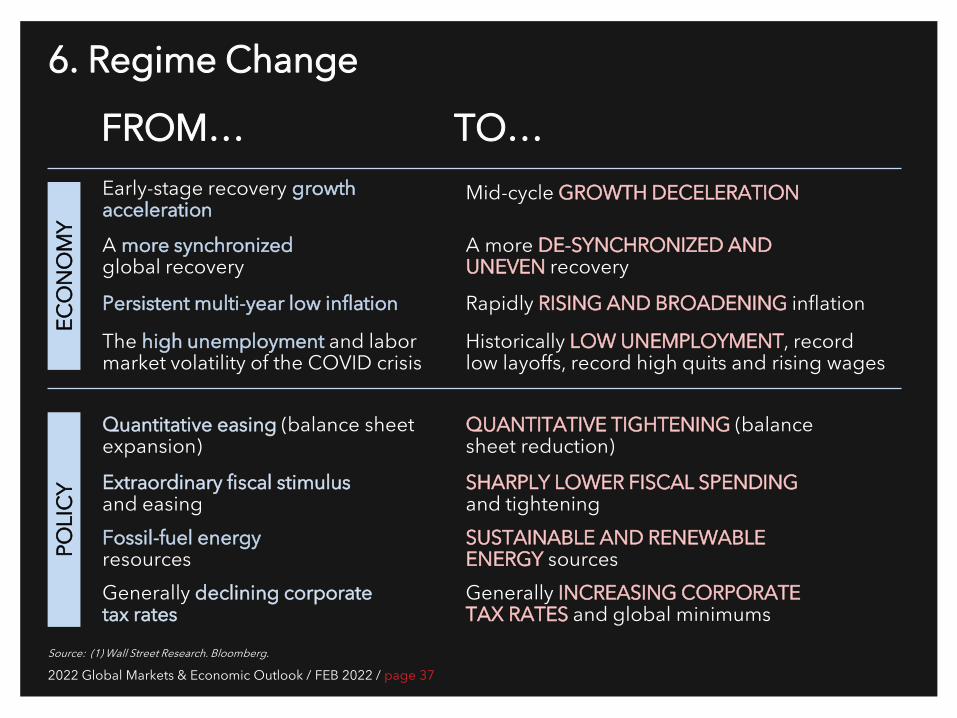
6. Regime Change
Source: (1) Wall Street Research. Bloomberg.
ECO
NO
MY
POLI
CY
Early-stage recovery growth acceleration A more synchronized global recovery
Persistent multi-year low inflation
The high unemployment and labor market volatility of the COVID crisis
Quantitative easing (balance sheet expansion)
Extraordinary fiscal stimulus and easing Fossil-fuel energy resources Generally declining corporate tax rates
Mid-cycle GROWTH DECELERATION
A more DE-SYNCHRONIZED AND UNEVEN recovery
Rapidly RISING AND BROADENING inflation
Historically LOW UNEMPLOYMENT, record low layoffs, record high quits and rising wages
QUANTITATIVE TIGHTENING (balance sheet reduction)
SHARPLY LOWER FISCAL SPENDING and tightening SUSTAINABLE AND RENEWABLE ENERGY sources Generally INCREASING CORPORATE TAX RATES and global minimums
FROM… TO…
2022 Global Markets & Economic Outlook / FEB 2022 / page 38
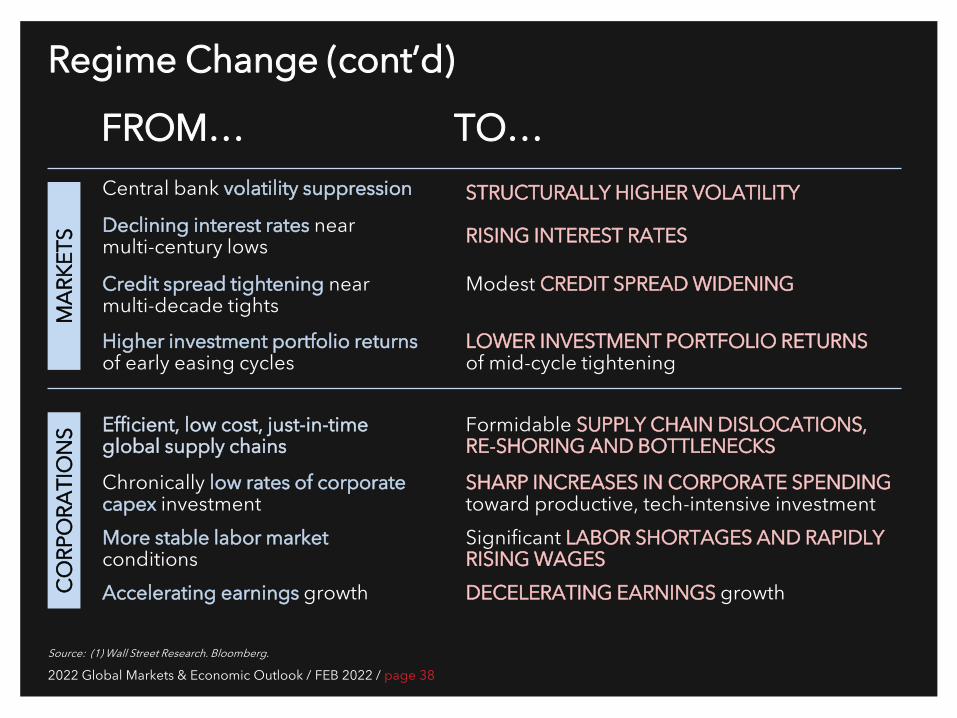
Regime Change (cont’d)
Source: (1) Wall Street Research. Bloomberg.
MA
RKET
S C
ORP
ORA
TIO
NS
Central bank volatility suppression
Declining interest rates near multi-century lows
Credit spread tightening near multi-decade tights
Higher investment portfolio returns of early easing cycles
Efficient, low cost, just-in-time global supply chains
Chronically low rates of corporate capex investment More stable labor market conditions Accelerating earnings growth
STRUCTURALLY HIGHER VOLATILITY
RISING INTEREST RATES
Modest CREDIT SPREAD WIDENING
LOWER INVESTMENT PORTFOLIO RETURNS of mid-cycle tightening
Formidable SUPPLY CHAIN DISLOCATIONS, RE-SHORING AND BOTTLENECKS
SHARP INCREASES IN CORPORATE SPENDING toward productive, tech-intensive investment Significant LABOR SHORTAGES AND RAPIDLY RISING WAGES DECELERATING EARNINGS growth
FROM… TO…
2022 Global Markets & Economic Outlook / FEB 2022 / page 40
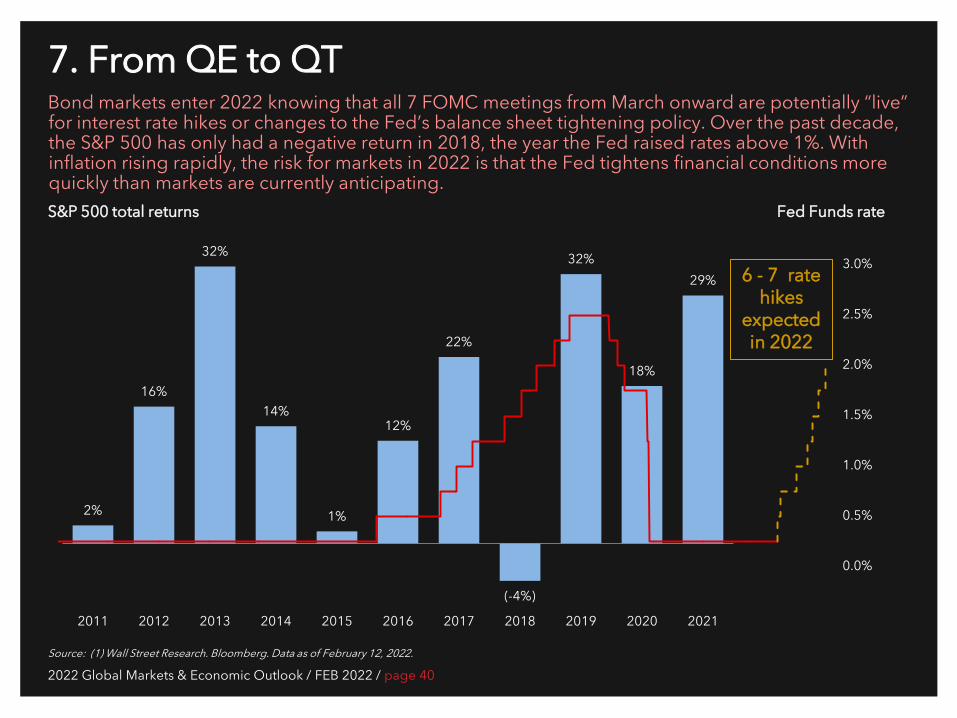
2%
16%
32%
14%
1%
12%
22%
(-4%)
32%
18%
29%
2011 2012 2013 2014 2015 2016 2017 2018 2019 2020 2021
0.0%
0.5%
1.0%
1.5%
2.0%
2.5%
3.0%
7. From QE to QT Bond markets enter 2022 knowing that all 7 FOMC meetings from March onward are potentially “live” for interest rate hikes or changes to the Fed’s balance sheet tightening policy. Over the past decade, the S&P 500 has only had a negative return in 2018, the year the Fed raised rates above 1%. With inflation rising rapidly, the risk for markets in 2022 is that the Fed tightens financial conditions more quickly than markets are currently anticipating.
Source: (1) Wall Street Research. Bloomberg. Data as of February 12, 2022.
S&P 500 total returns
6 - 7 rate hikes
expected in 2022
Fed Funds rate
2022 Global Markets & Economic Outlook / FEB 2022 / page 41
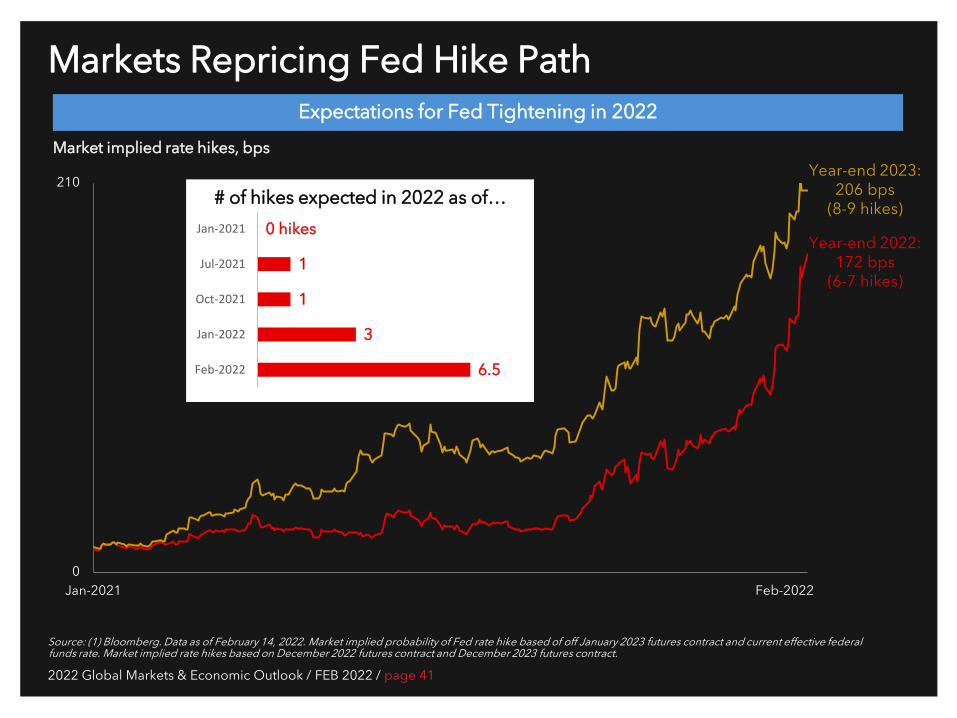
Markets Repricing Fed Hike Path
Source: (1) Bloomberg. Data as of February 14, 2022. Market implied probability of Fed rate hike based of off January 2023 futures contract and current effective federal funds rate. Market implied rate hikes based on December 2022 futures contract and December 2023 futures contract.
Expectations for Fed Tightening in 2022
Market implied rate hikes, bps
0
210
Jan-2021 Feb-2022
Year-end 2022: 172 bps
(6-7 hikes)
Year-end 2023: 206 bps
(8-9 hikes) 0 hikes
1
1
3
6.5
Jan-2021
Jul-2021
Oct-2021
Jan-2022
Feb-2022
# of hikes expected in 2022 as of…
2022 Global Markets & Economic Outlook / FEB 2022 / page 42
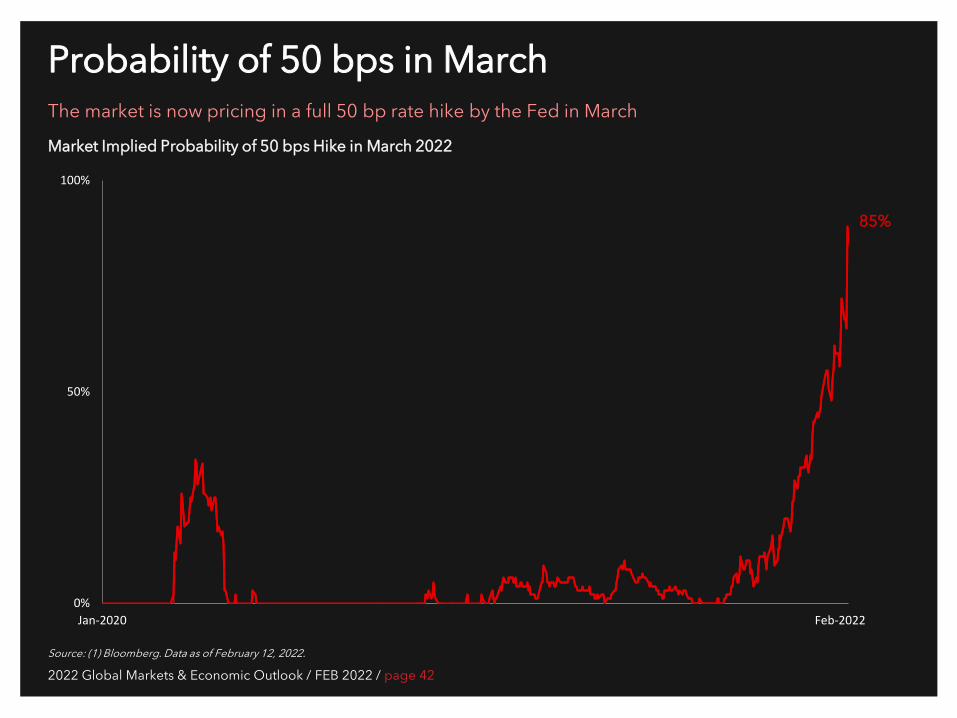
Probability of 50 bps in March The market is now pricing in a full 50 bp rate hike by the Fed in March
Source: (1) Bloomberg. Data as of February 12, 2022.
Market Implied Probability of 50 bps Hike in March 2022
0%
50%
100%
Jan-2020 Feb-2022
85%
2022 Global Markets & Economic Outlook / FEB 2022 / page 43
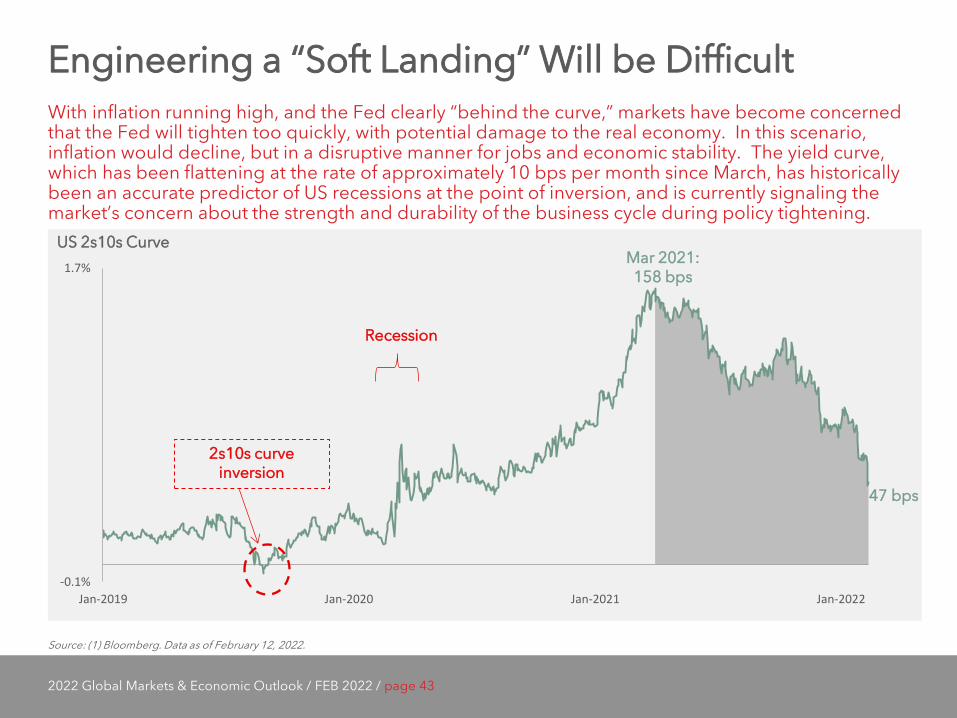
-0.1%
1.7%
Jan-2019 Jan-2020 Jan-2021 Jan-2022
Engineering a “Soft Landing” Will be Difficult With inflation running high, and the Fed clearly “behind the curve,” markets have become concerned that the Fed will tighten too quickly, with potential damage to the real economy. In this scenario, inflation would decline, but in a disruptive manner for jobs and economic stability. The yield curve, which has been flattening at the rate of approximately 10 bps per month since March, has historically been an accurate predictor of US recessions at the point of inversion, and is currently signaling the market’s concern about the strength and durability of the business cycle during policy tightening.
Source: (1) Bloomberg. Data as of February 12, 2022
US 2s10s Curve
2s10s curve inversion
Recession
47 bps
Source: (1) Bloomberg. Data as of February 12, 2022.
Mar 2021: 158 bps
2022 Global Markets & Economic Outlook / FEB 2022 / page 44
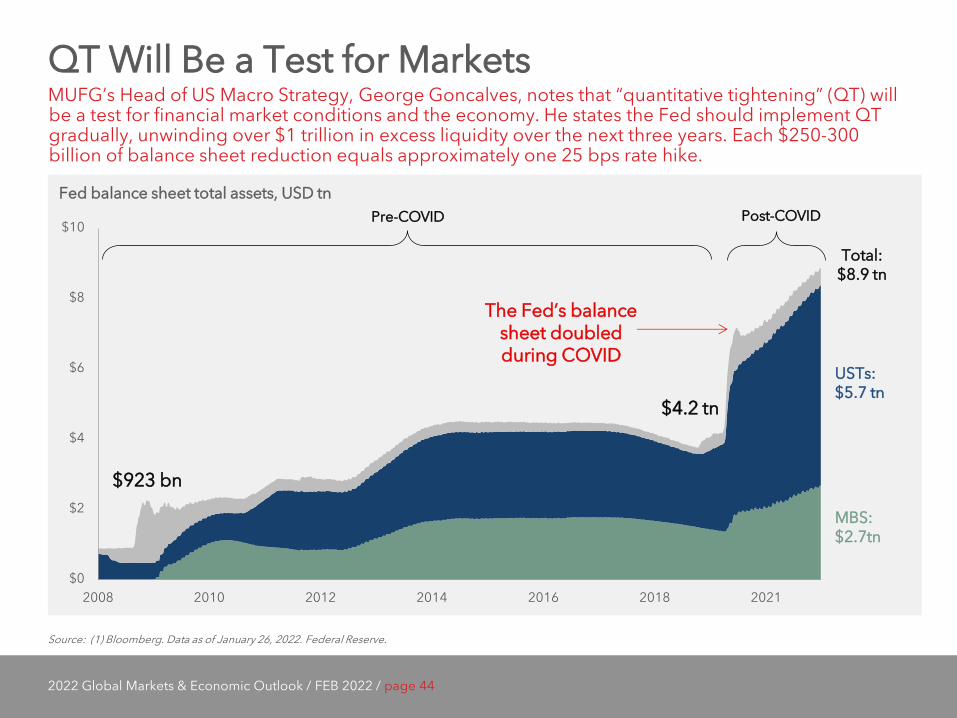
QT Will Be a Test for Markets MUFG’s Head of US Macro Strategy, George Goncalves, notes that “quantitative tightening” (QT) will be a test for financial market conditions and the economy. He states the Fed should implement QT gradually, unwinding over $1 trillion in excess liquidity over the next three years. Each $250-300 billion of balance sheet reduction equals approximately one 25 bps rate hike.
Source: (1) Bloomberg. Data as of January 26, 2022. Federal Reserve.
Fed balance sheet total assets, USD tn
$0
$2
$4
$6
$8
$10
2008 2010 2012 2014 2016 2018 2021
Pre-COVID Post-COVID
$923 bn
$4.2 tn
Total: $8.9 tn
MBS: $2.7tn
USTs: $5.7 tn
The Fed’s balance sheet doubled during COVID
2022 Global Markets & Economic Outlook / FEB 2022 / page 45
0
10
20
30
40
50
60
70
80
90
2001 2004 2007 2011 2014 2017 2021
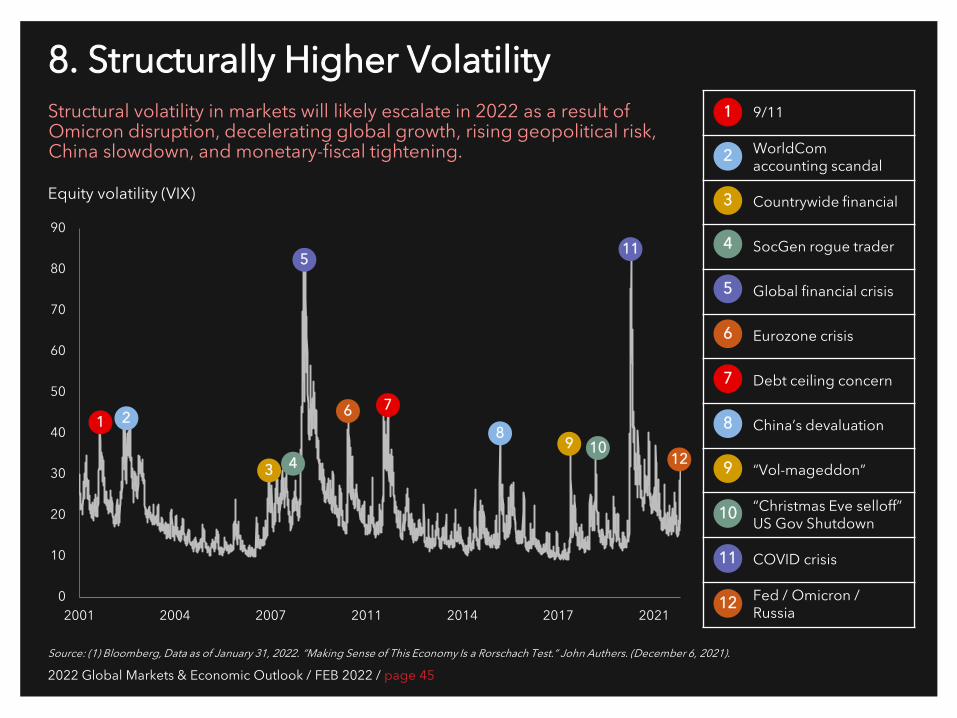
8. Structurally Higher Volatility Structural volatility in markets will likely escalate in 2022 as a result of Omicron disruption, decelerating global growth, rising geopolitical risk, China slowdown, and monetary-fiscal tightening.
Source: (1) Bloomberg, Data as of January 31, 2022. “Making Sense of This Economy Is a Rorschach Test.” John Authers. (December 6, 2021).
Equity volatility (VIX)
9/11
WorldCom accounting scandal
Countrywide financial
SocGen rogue trader
Global financial crisis
Eurozone crisis
Debt ceiling concern
China’s devaluation
“Vol-mageddon”
“Christmas Eve selloff” US Gov Shutdown
COVID crisis
Fed / Omicron / Russia
1
2
3
4
12
5
6
7
8
9
10
11
1 2
3 4 12
5
6 7
8 9 10
11
2022 Global Markets & Economic Outlook / FEB 2022 / page 46
Oil Markets Brent: +17.3%
WTI: +17.2%
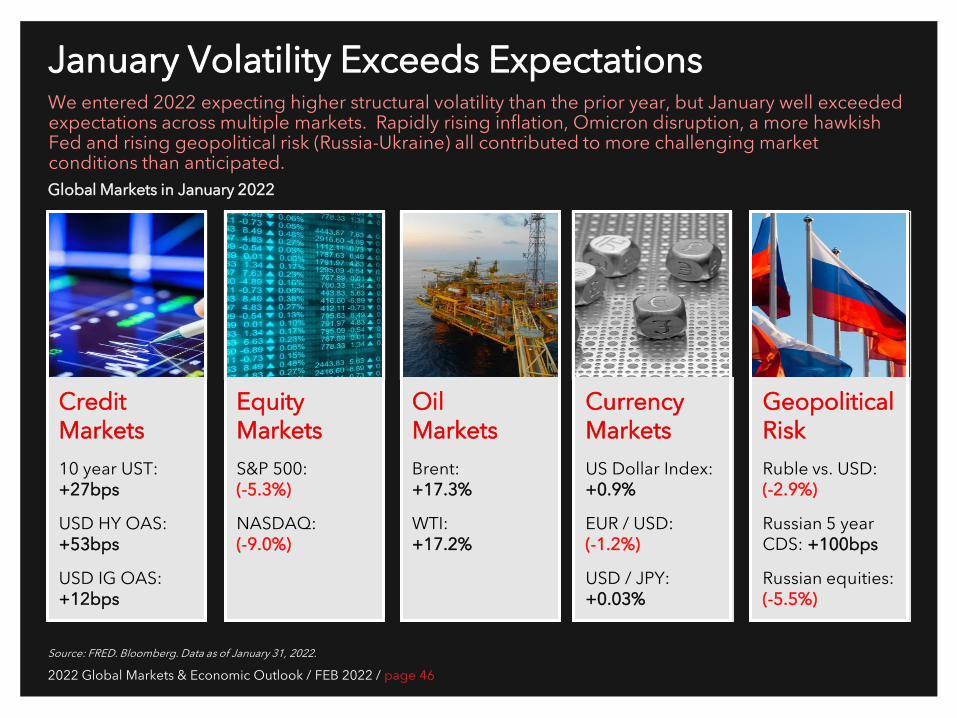
January Volatility Exceeds Expectations
Source: FRED. Bloomberg. Data as of January 31, 2022.
We entered 2022 expecting higher structural volatility than the prior year, but January well exceeded expectations across multiple markets. Rapidly rising inflation, Omicron disruption, a more hawkish Fed and rising geopolitical risk (Russia-Ukraine) all contributed to more challenging market conditions than anticipated.
Credit Markets 10 year UST: +27bps
USD HY OAS: +53bps
USD IG OAS: +12bps
Equity Markets S&P 500: (-5.3%)
NASDAQ: (-9.0%)
Geopolitical Risk Ruble vs. USD: (-2.9%)
Russian 5 year CDS: +100bps
Russian equities: (-5.5%)
Currency Markets US Dollar Index: +0.9%
EUR / USD: (-1.2%)
USD / JPY: +0.03%
Global Markets in January 2022
2022 Global Markets & Economic Outlook / FEB 2022 / page 47
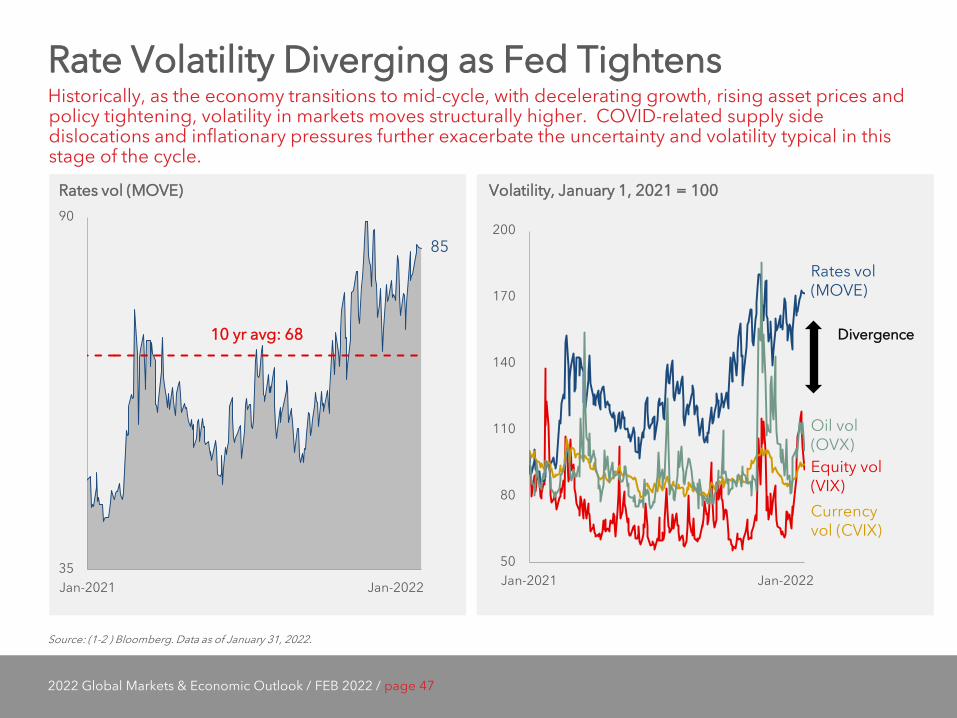
Rate Volatility Diverging as Fed Tightens Historically, as the economy transitions to mid-cycle, with decelerating growth, rising asset prices and policy tightening, volatility in markets moves structurally higher. COVID-related supply side dislocations and inflationary pressures further exacerbate the uncertainty and volatility typical in this stage of the cycle.
Source: (1-2 ) Bloomberg. Data as of January 31, 2022.
Volatility, January 1, 2021 = 100 Rates vol (MOVE)
35
90
Jan-2021 Jan-2022
10 yr avg: 68
85
Equity vol (VIX)
Oil vol (OVX)
Currency vol (CVIX)
Rates vol (MOVE)
50
80
110
140
170
200
Jan-2021 Jan-2022
Divergence


2022 Global Markets & Economic Outlook / FEB 2022 / page 49
9. Technology’s Outsized Presence Companies with the world’s largest market capitalizations in 2005 and 2022 (in billion US dollars)
Source: Statista. Financial Times. Bloomberg. 2005 data as of March 31, 2005 and 2022 data as of January 1, 2022.
Tech
Oil / Energy
Finance
Physical Distribution
Conglomerate
Health
General Electric: $382 bn Exxon Mobil: $381 bn Microsoft: $263 bn Citigroup: $234 bn BP: $221bn Wal-Mart: $212 bn Royal Dutch Shell: $211 bn Johnson & Johnson: $200 bn
Microsoft: $2,525 bn
Alphabet: $1,922 bn
Amazon: $1,691 bn
Tesla: $1,061 bn
Meta: $936 bn
2022
2005
Apple: $2,913 bn
NVIDIA: $735 bn
Saudi Aramco: $1,907 bn
2022 Global Markets & Economic Outlook / FEB 2022 / page 50
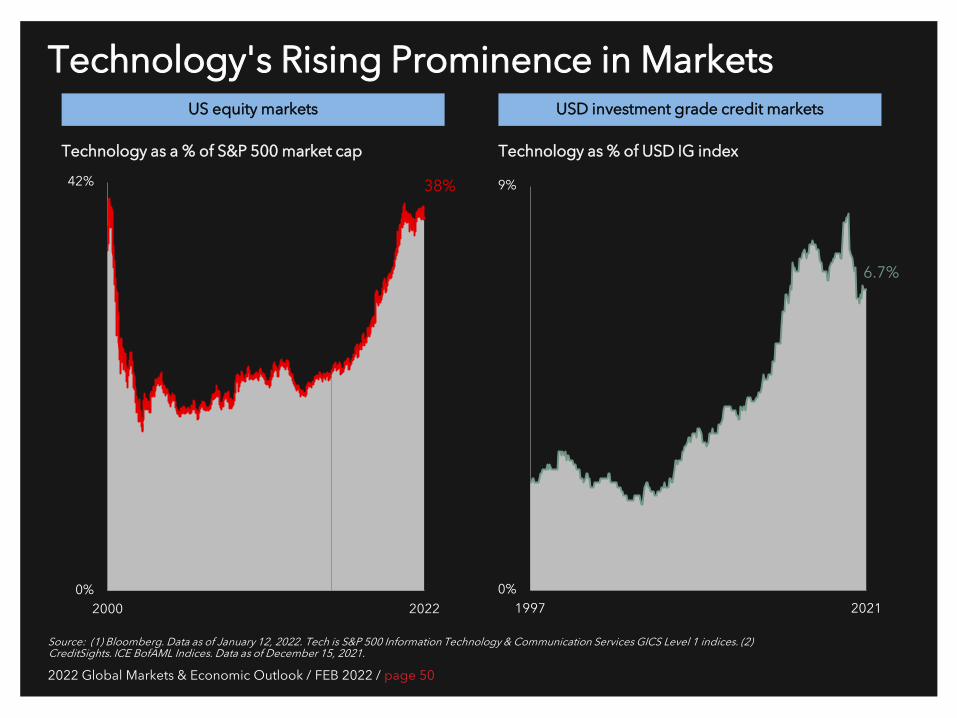
Technology's Rising Prominence in Markets
Source: (1) Bloomberg. Data as of January 12, 2022. Tech is S&P 500 Information Technology & Communication Services GICS Level 1 indices. (2) CreditSights. ICE BofAML Indices. Data as of December 15, 2021.
Technology as a % of S&P 500 market cap Technology as % of USD IG index
0%
42%
2000 2022
38%
0%
9%
1997 2021
6.7%
US equity markets USD investment grade credit markets

2022 Global Markets & Economic Outlook / FEB 2022 / page 52
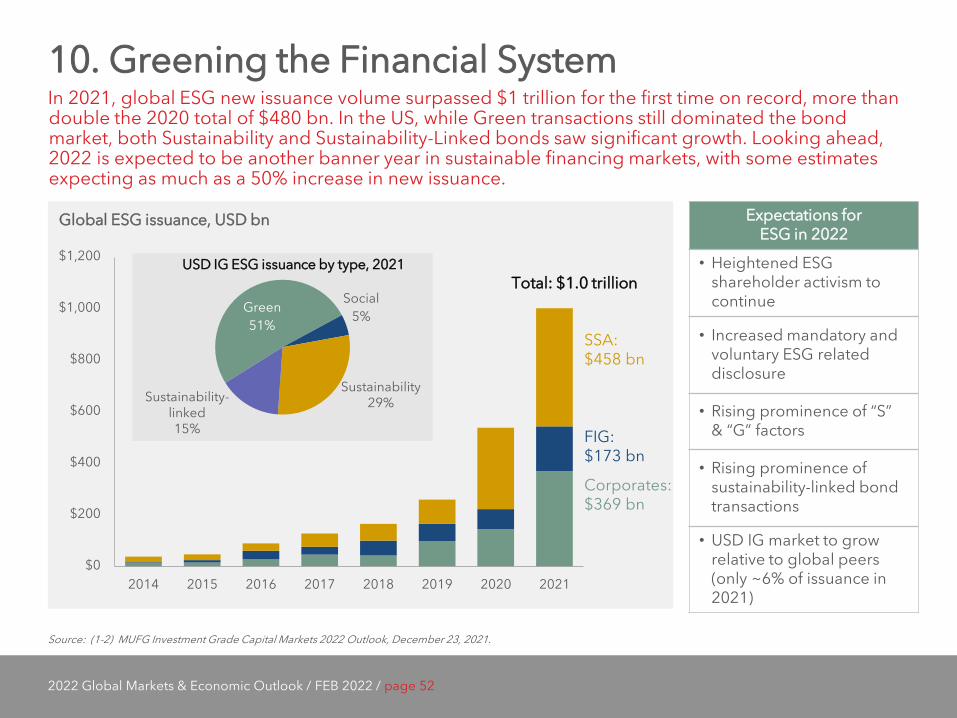
10. Greening the Financial System In 2021, global ESG new issuance volume surpassed $1 trillion for the first time on record, more than double the 2020 total of $480 bn. In the US, while Green transactions still dominated the bond market, both Sustainability and Sustainability-Linked bonds saw significant growth. Looking ahead, 2022 is expected to be another banner year in sustainable financing markets, with some estimates expecting as much as a 50% increase in new issuance.
Source: (1-2) MUFG Investment Grade Capital Markets 2022 Outlook, December 23, 2021.
Global ESG issuance, USD bn Expectations for ESG in 2022
• Heightened ESG shareholder activism to continue
• Increased mandatory and voluntary ESG related disclosure
• Rising prominence of “S” & “G” factors
• Rising prominence of sustainability-linked bond transactions
• USD IG market to grow relative to global peers (only ~6% of issuance in 2021)
$0
$200
$400
$600
$800
$1,000
$1,200
2014 2015 2016 2017 2018 2019 2020 2021
Corporates: $369 bn
FIG: $173 bn
SSA: $458 bn
Total: $1.0 trillion Green 51%
Social 5%
USD IG ESG issuance by type, 2021
Sustainability 29% Sustainability-
linked 15%
2022 Global Markets & Economic Outlook / FEB 2022 / page 53
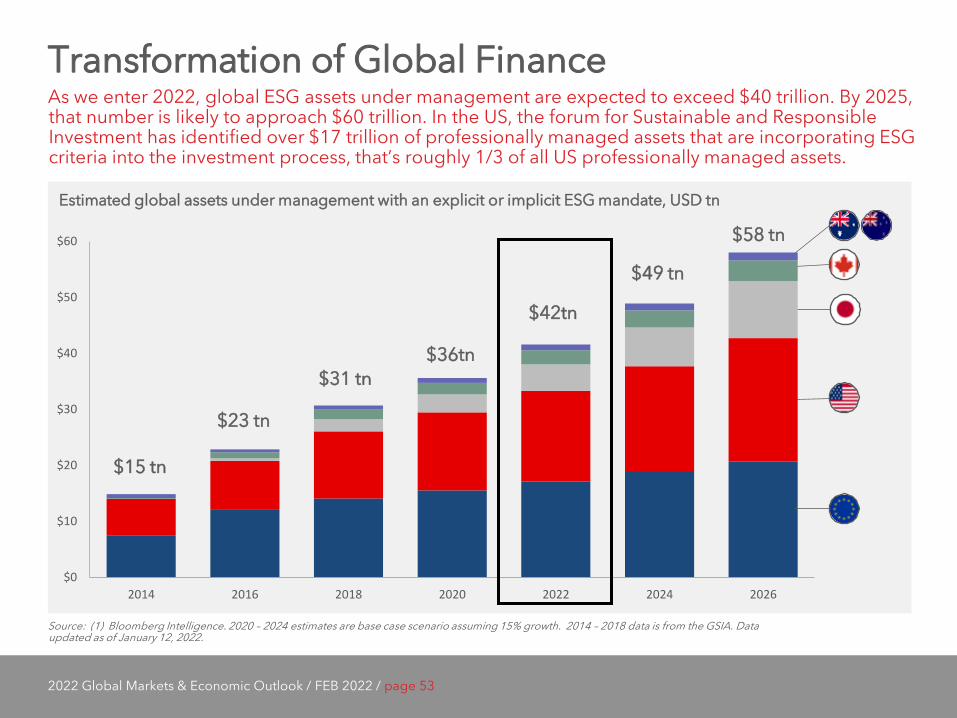
Transformation of Global Finance As we enter 2022, global ESG assets under management are expected to exceed $40 trillion. By 2025, that number is likely to approach $60 trillion. In the US, the forum for Sustainable and Responsible Investment has identified over $17 trillion of professionally managed assets that are incorporating ESG criteria into the investment process, that’s roughly 1/3 of all US professionally managed assets.
Source: (1) Bloomberg Intelligence. 2020 – 2024 estimates are base case scenario assuming 15% growth. 2014 – 2018 data is from the GSIA. Data updated as of January 12, 2022.
Estimated global assets under management with an explicit or implicit ESG mandate, USD tn
$0
$10
$20
$30
$40
$50
$60
2014 2016 2018 2020 2022 2024 2026
$15 tn
$23 tn
$31 tn $36tn
$42tn
$49 tn
$58 tn
2022 Global Markets & Economic Outlook / FEB 2022 / page 54
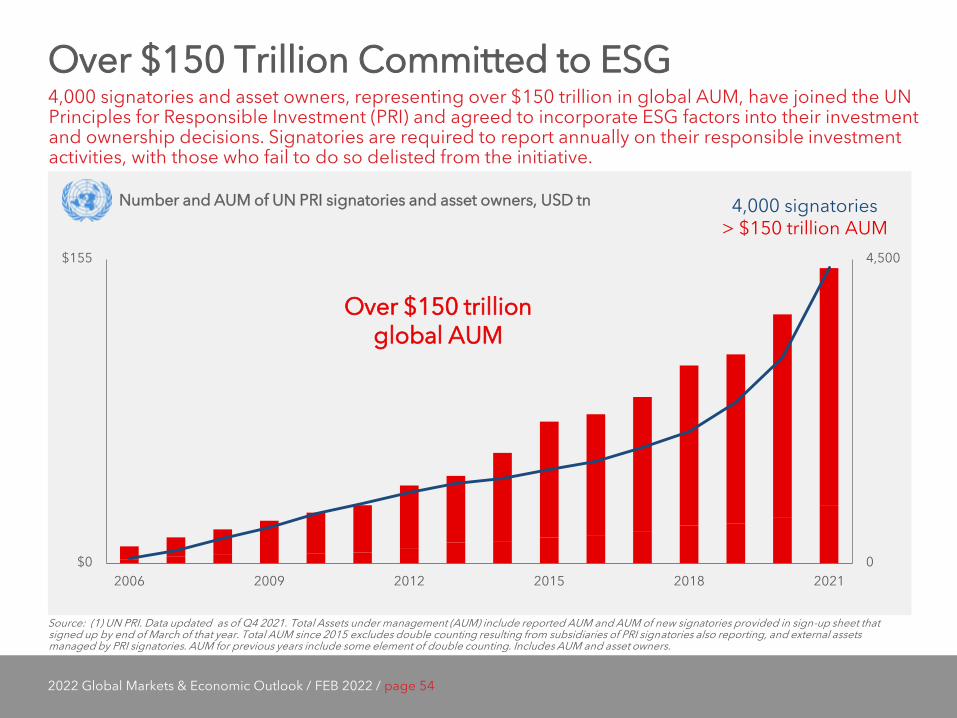
Over $150 Trillion Committed to ESG 4,000 signatories and asset owners, representing over $150 trillion in global AUM, have joined the UN Principles for Responsible Investment (PRI) and agreed to incorporate ESG factors into their investment and ownership decisions. Signatories are required to report annually on their responsible investment activities, with those who fail to do so delisted from the initiative.
Source: (1) UN PRI. Data updated as of Q4 2021. Total Assets under management (AUM) include reported AUM and AUM of new signatories provided in sign-up sheet that signed up by end of March of that year. Total AUM since 2015 excludes double counting resulting from subsidiaries of PRI signatories also reporting, and external assets managed by PRI signatories. AUM for previous years include some element of double counting. Includes AUM and asset owners.
Number and AUM of UN PRI signatories and asset owners, USD tn
0
4,500
$0
$155
2006 2009 2012 2015 2018 2021
4,000 signatories > $150 trillion AUM
Over $150 trillion global AUM

3 Strategic Positioning from Strength
“What made war inevitable was the growth of Athenian power and the fear which this caused in Sparta.” Thucydides in “The History of the Peloponnesian War” (Early 4th Century BC)
2022 Global Markets & Economic Outlook / FEB 2022 / page 56
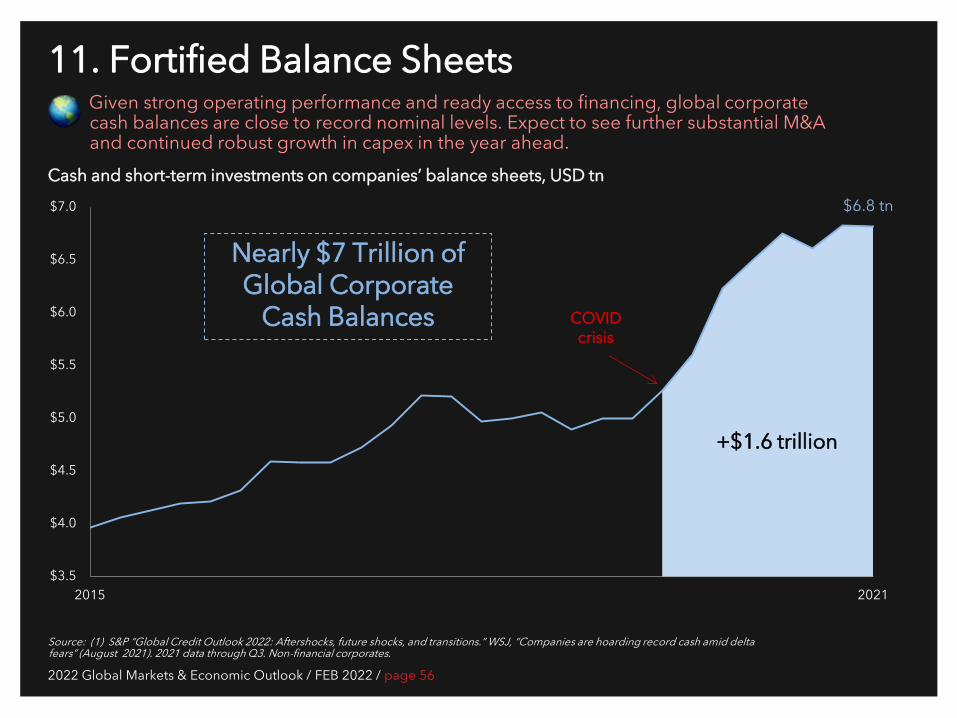
11. Fortified Balance Sheets Given strong operating performance and ready access to financing, global corporate cash balances are close to record nominal levels. Expect to see further substantial M&A and continued robust growth in capex in the year ahead.
Source: (1) S&P “Global Credit Outlook 2022: Aftershocks, future shocks, and transitions.” WSJ, “Companies are hoarding record cash amid delta fears” (August 2021). 2021 data through Q3. Non-financial corporates.
Cash and short-term investments on companies’ balance sheets, USD tn
$3.5
$4.0
$4.5
$5.0
$5.5
$6.0
$6.5
$7.0
2015 2021
$6.8 tn
+$1.6 trillion
COVID crisis
Nearly $7 Trillion of Global Corporate
Cash Balances
2022 Global Markets & Economic Outlook / FEB 2022 / page 57
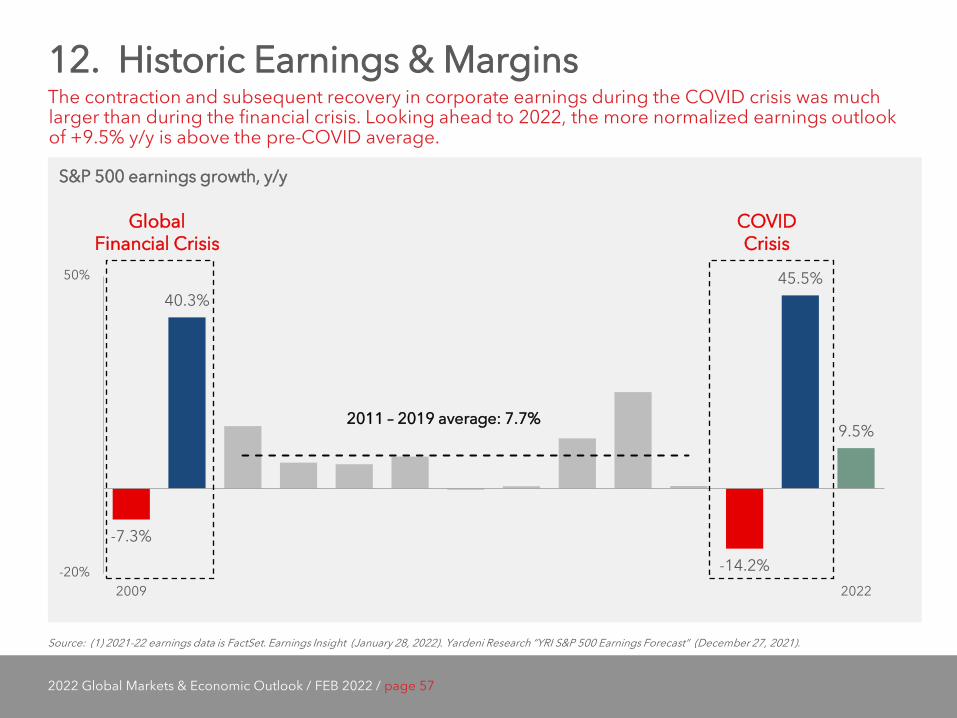
12. Historic Earnings & Margins The contraction and subsequent recovery in corporate earnings during the COVID crisis was much larger than during the financial crisis. Looking ahead to 2022, the more normalized earnings outlook of +9.5% y/y is above the pre-COVID average.
Source: (1) 2021-22 earnings data is FactSet. Earnings Insight (January 28, 2022). Yardeni Research “YRI S&P 500 Earnings Forecast” (December 27, 2021).
S&P 500 earnings growth, y/y
-7.3%
40.3%
-14.2%
45.5%
9.5%
-20%
50%
2009 2022
Global Financial Crisis
COVID Crisis
2011 – 2019 average: 7.7%
2022 Global Markets & Economic Outlook / FEB 2022 / page 58
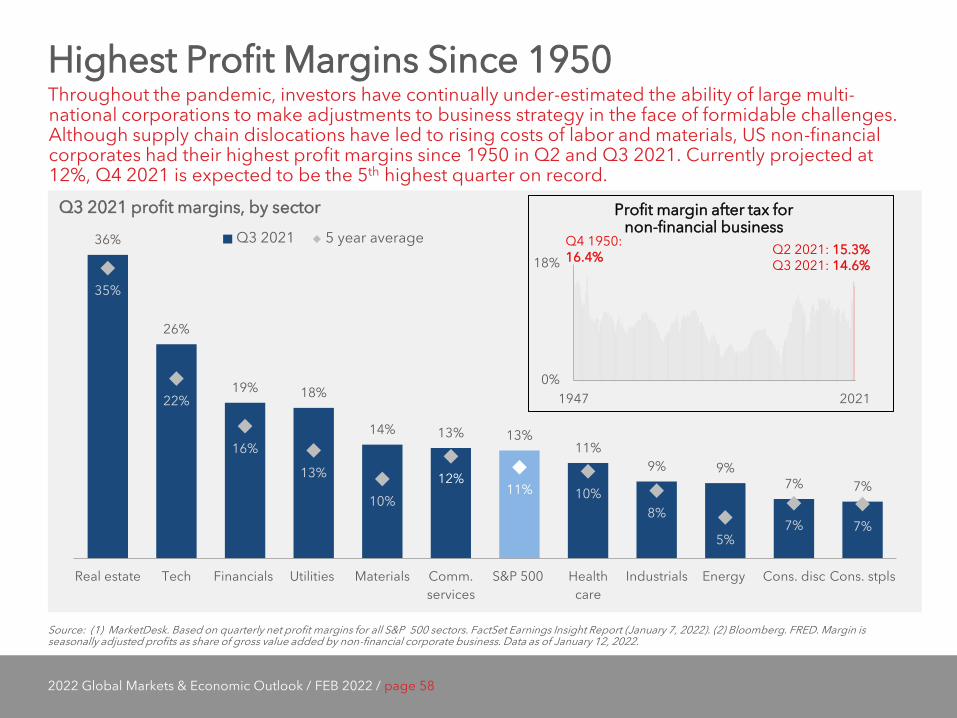
Highest Profit Margins Since 1950 Throughout the pandemic, investors have continually under-estimated the ability of large multi-national corporations to make adjustments to business strategy in the face of formidable challenges. Although supply chain dislocations have led to rising costs of labor and materials, US non-financial corporates had their highest profit margins since 1950 in Q2 and Q3 2021. Currently projected at 12%, Q4 2021 is expected to be the 5th highest quarter on record.
Source: (1) MarketDesk. Based on quarterly net profit margins for all S&P 500 sectors. FactSet Earnings Insight Report (January 7, 2022). (2) Bloomberg. FRED. Margin is seasonally adjusted profits as share of gross value added by non-financial corporate business. Data as of January 12, 2022.
Q3 2021 profit margins, by sector
36%
26%
19% 18%
14% 13% 13% 11%
9% 9% 7% 7%
35%
22%
16%
13%
10% 12%
11% 10% 8%
5% 7% 7%
Real estate Tech Financials Utilities Materials Comm.services
S&P 500 Healthcare
Industrials Energy Cons. disc Cons. stpls
Q3 2021 5 year average
0%
18%
1947 2021
Q2 2021: 15.3% Q3 2021: 14.6%
Q4 1950: 16.4%
Profit margin after tax for non-financial business


2022 Global Markets & Economic Outlook / FEB 2022 / page 60
13. Record Stock Buybacks S&P 500 companies repurchased a record $235 bn of stock in Q3, a 20% Q/Q increase. Activity remained highly concentrated with the top 20 purchasers accounting for over 50% of volume (vs. 45% avg. pre-COVID). Tech and financial sectors recorded the largest share of buybacks at 28% and 26%, respectively. We expect the rapid pace of buybacks to continue in 2022 given high cash flow and CEO confidence readings. Small market corrections may also create opportunities for buying.
Source: (1) S&P Dow Jones Indices. WSJ.
Quarterly S&P 500 buybacks, USD bn
5 year average: $155 bn
$0
$50
$100
$150
$200
$250
2016 2021
COVID Crisis
Period
Q3 2021: $235 bn
Regulatory Headwind: In mid-December, the SEC proposed greater disclosure requirements on buybacks, including rationale and criteria. In February, Congress will consider a 1% excise tax on stock buybacks as part of a possible $300-700bn soft infrastructure package.
2022 Global Markets & Economic Outlook / FEB 2022 / page 61
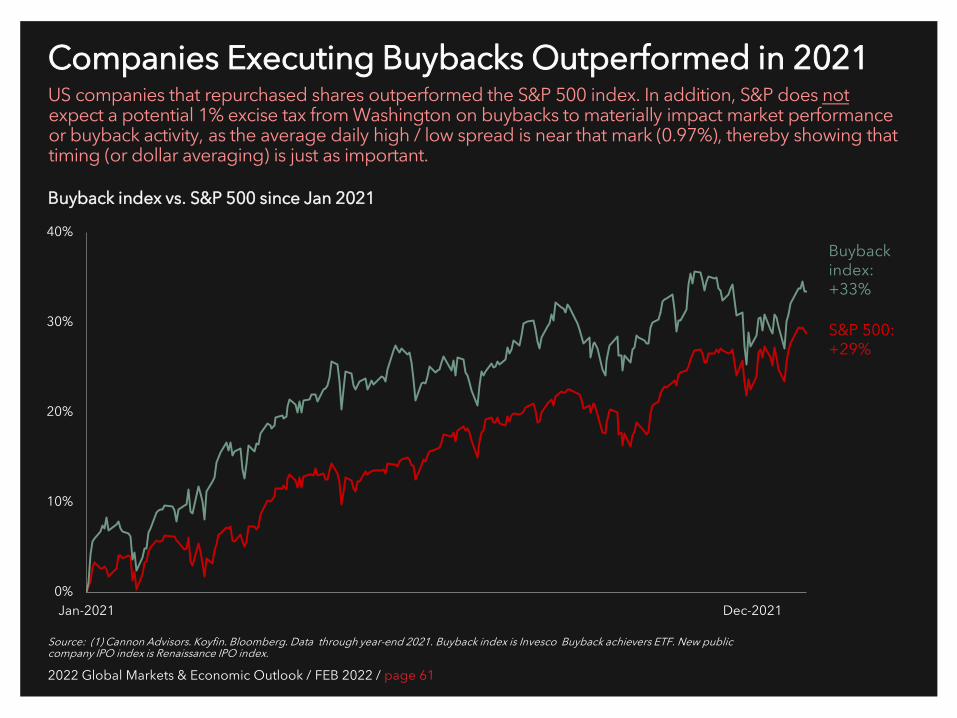
Companies Executing Buybacks Outperformed in 2021 US companies that repurchased shares outperformed the S&P 500 index. In addition, S&P does not expect a potential 1% excise tax from Washington on buybacks to materially impact market performance or buyback activity, as the average daily high / low spread is near that mark (0.97%), thereby showing that timing (or dollar averaging) is just as important.
Source: (1) Cannon Advisors. Koyfin. Bloomberg. Data through year-end 2021. Buyback index is Invesco Buyback achievers ETF. New public company IPO index is Renaissance IPO index.
Buyback index vs. S&P 500 since Jan 2021
0%
10%
20%
30%
40%
Jan-2021 Dec-2021
S&P 500: +29%
Buyback index: +33%
2022 Global Markets & Economic Outlook / FEB 2022 / page 62
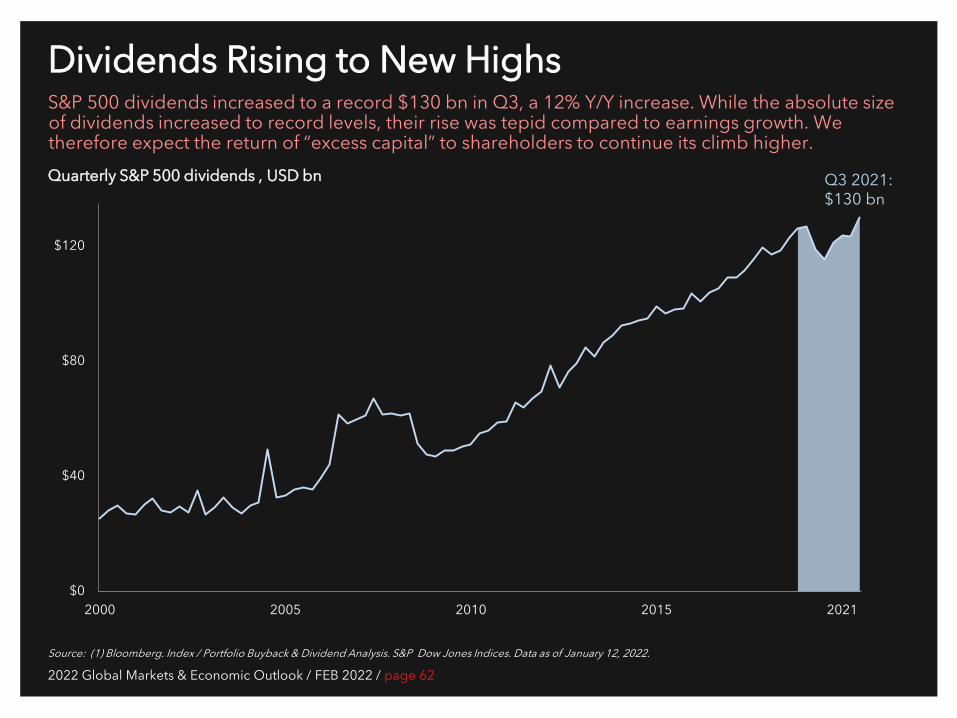
Dividends Rising to New Highs S&P 500 dividends increased to a record $130 bn in Q3, a 12% Y/Y increase. While the absolute size of dividends increased to record levels, their rise was tepid compared to earnings growth. We therefore expect the return of “excess capital” to shareholders to continue its climb higher.
Source: (1) Bloomberg. Index / Portfolio Buyback & Dividend Analysis. S&P Dow Jones Indices. Data as of January 12, 2022.
$0
$40
$80
$120
2000 2005 2010 2015 2021
Q3 2021: $130 bn
Quarterly S&P 500 dividends , USD bn
2022 Global Markets & Economic Outlook / FEB 2022 / page 63
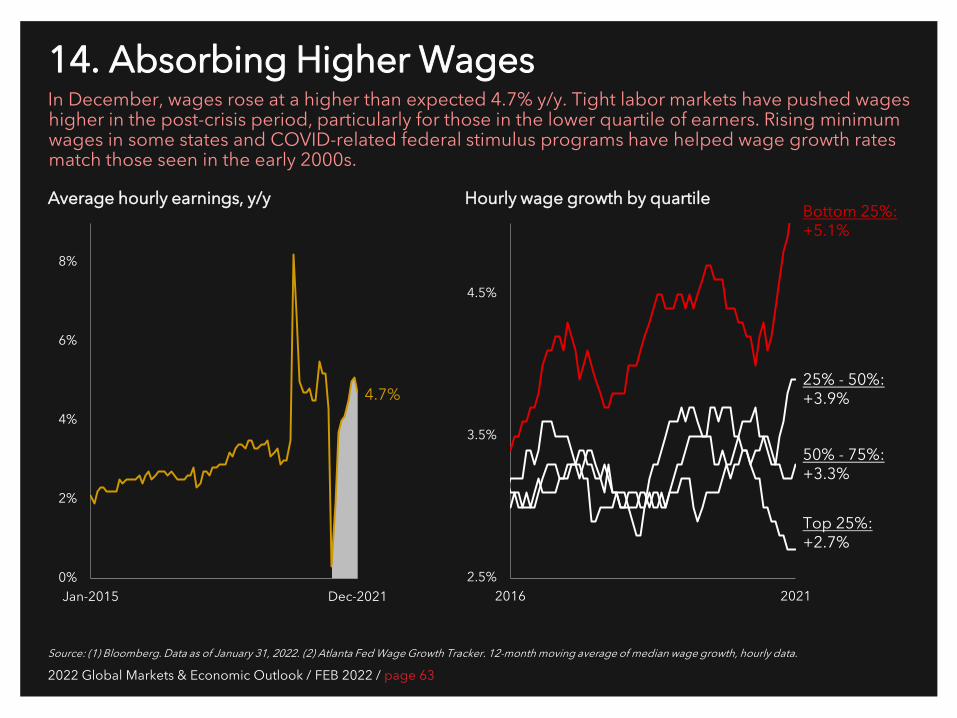
14. Absorbing Higher Wages In December, wages rose at a higher than expected 4.7% y/y. Tight labor markets have pushed wages higher in the post-crisis period, particularly for those in the lower quartile of earners. Rising minimum wages in some states and COVID-related federal stimulus programs have helped wage growth rates match those seen in the early 2000s.
Source: (1) Bloomberg. Data as of January 31, 2022. (2) Atlanta Fed Wage Growth Tracker. 12-month moving average of median wage growth, hourly data.
Average hourly earnings, y/y
2.5%
3.5%
4.5%
2016 2021
Bottom 25%: +5.1%
25% - 50%: +3.9%
50% - 75%: +3.3%
Top 25%: +2.7%
Hourly wage growth by quartile
0%
2%
4%
6%
8%
Jan-2015 Dec-2021
4.7%
2022 Global Markets & Economic Outlook / FEB 2022 / page 64
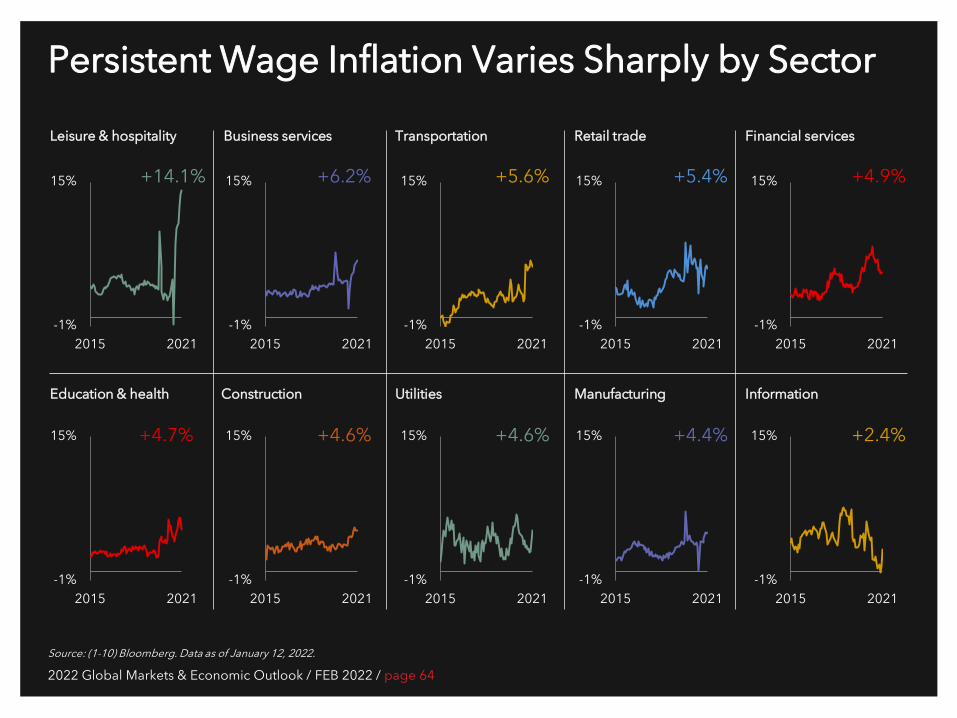
Persistent Wage Inflation Varies Sharply by Sector
Source: (1-10) Bloomberg. Data as of January 12, 2022.
-1%
15%
2015 2021
-1%
15%
2015 2021-1%
15%
2015 2021
-1%
15%
2015 2021-1%
15%
2015 2021
-1%
15%
2015 2021
-1%
15%
2015 2021
-1%
15%
2015 2021
-1%
15%
2015 2021
-1%
15%
2015 2021
Leisure & hospitality Business services
Construction Utilities Manufacturing
Transportation
Information
+14.1% +5.6% +6.2%
Retail trade
+4.9%
Education & health
Financial services
+5.4%
+4.7% +4.6% +4.6% +4.4% +2.4%

2022 Global Markets & Economic Outlook / FEB 2022 / page 66
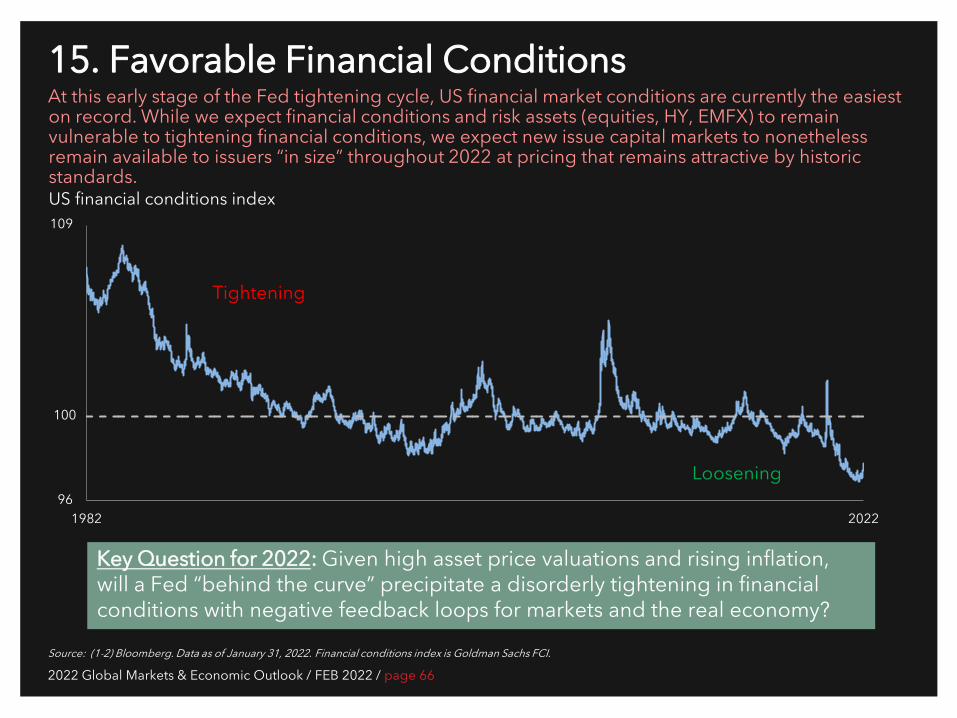
15. Favorable Financial Conditions At this early stage of the Fed tightening cycle, US financial market conditions are currently the easiest on record. While we expect financial conditions and risk assets (equities, HY, EMFX) to remain vulnerable to tightening financial conditions, we expect new issue capital markets to nonetheless remain available to issuers “in size” throughout 2022 at pricing that remains attractive by historic standards.
Source: (1-2) Bloomberg. Data as of January 31, 2022. Financial conditions index is Goldman Sachs FCI.
US financial conditions index
96
109
1982 2022
Tightening
Key Question for 2022: Given high asset price valuations and rising inflation, will a Fed “behind the curve” precipitate a disorderly tightening in financial conditions with negative feedback loops for markets and the real economy?
100
Loosening


4 Investing in a Post-Pandemic World
“We have much to learn from Leonardo. His ability to combine art, science, technology, the humanities and imagination remains an enduring legacy for creativity.” Walter Isaacson, in his biography, Leonardo Da Vinci
2022 Global Markets & Economic Outlook / FEB 2022 / page 69
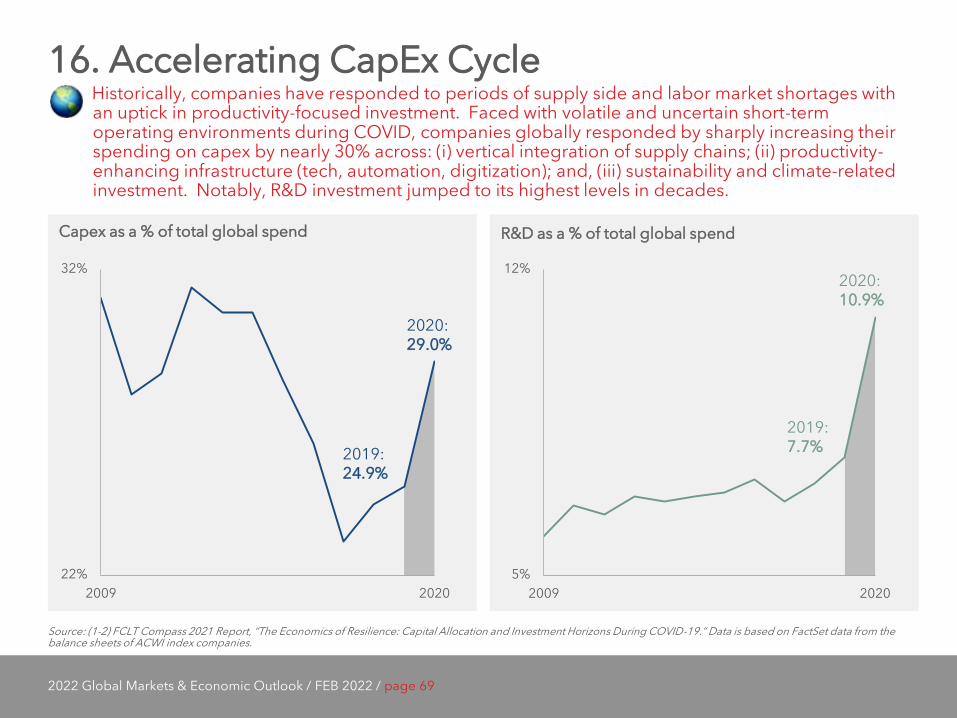
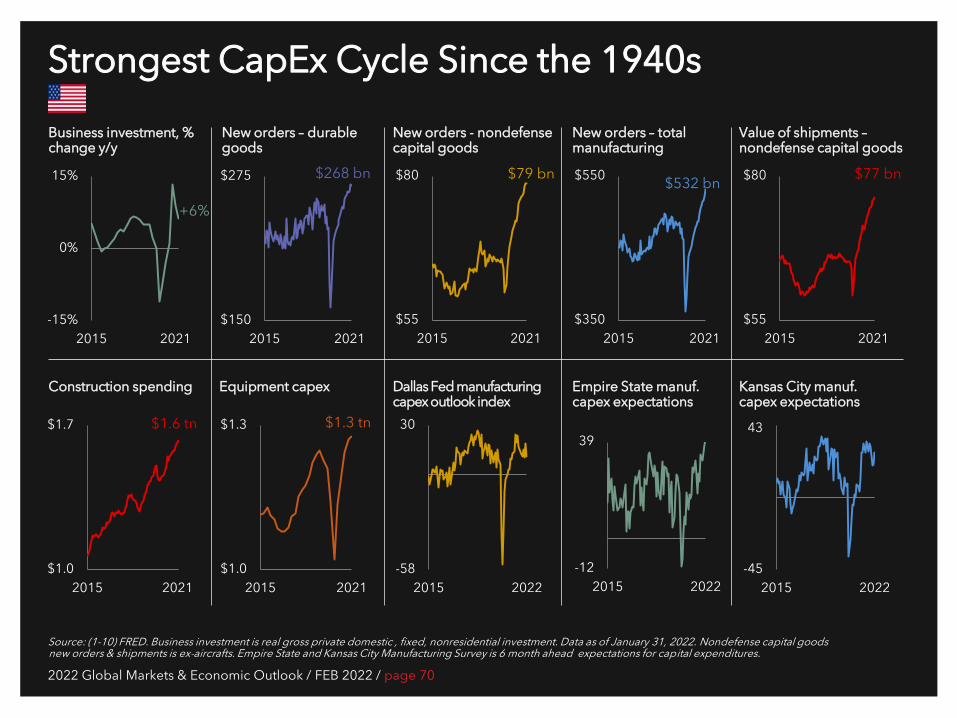
16. Accelerating CapEx Cycle Historically, companies have responded to periods of supply side and labor market shortages with an uptick in productivity-focused investment. Faced with volatile and uncertain short-term operating environments during COVID, companies globally responded by sharply increasing their spending on capex by nearly 30% across: (i) vertical integration of supply chains; (ii) productivity-enhancing infrastructure (tech, automation, digitization); and, (iii) sustainability and climate-related investment. Notably, R&D investment jumped to its highest levels in decades.
Source: (1-2) FCLT Compass 2021 Report, “The Economics of Resilience: Capital Allocation and Investment Horizons During COVID-19.” Data is based on FactSet data from the balance sheets of ACWI index companies.
Capex as a % of total global spend R&D as a % of total global spend
22%
32%
2009 20205%
12%
2009 2020
2019: 24.9%
2020: 29.0%
2019: 7.7%
2020: 10.9%
2022 Global Markets & Economic Outlook / FEB 2022 / page 70
Strongest CapEx Cycle Since the 1940s
Source: (1-10) FRED. Business investment is real gross private domestic , fixed, nonresidential investment. Data as of January 31, 2022. Nondefense capital goods new orders & shipments is ex-aircrafts. Empire State and Kansas City Manufacturing Survey is 6 month ahead expectations for capital expenditures.
Business investment, % change y/y
New orders – durable goods
Equipment capex Dallas Fed manufacturing capex outlook index
Empire State manuf. capex expectations
New orders - nondefense capital goods
Kansas City manuf. capex expectations
-15%
0%
15%
2015 2021
+6%
-12
39
2015 2022-58
30
2015 2022
$150
$275
2015 2021$55
$80
2015 2021
$79 bn $268 bn
New orders – total manufacturing
$55
$80
2015 2021
$77 bn
Construction spending
Value of shipments – nondefense capital goods
$350
$550
2015 2021
$532 bn
-45
43
2015 2022$1.0
$1.7
2015 2021
$1.6 tn
$1.0
$1.3
2015 2021
$1.3 tn
2022 Global Markets & Economic Outlook / FEB 2022 / page 71
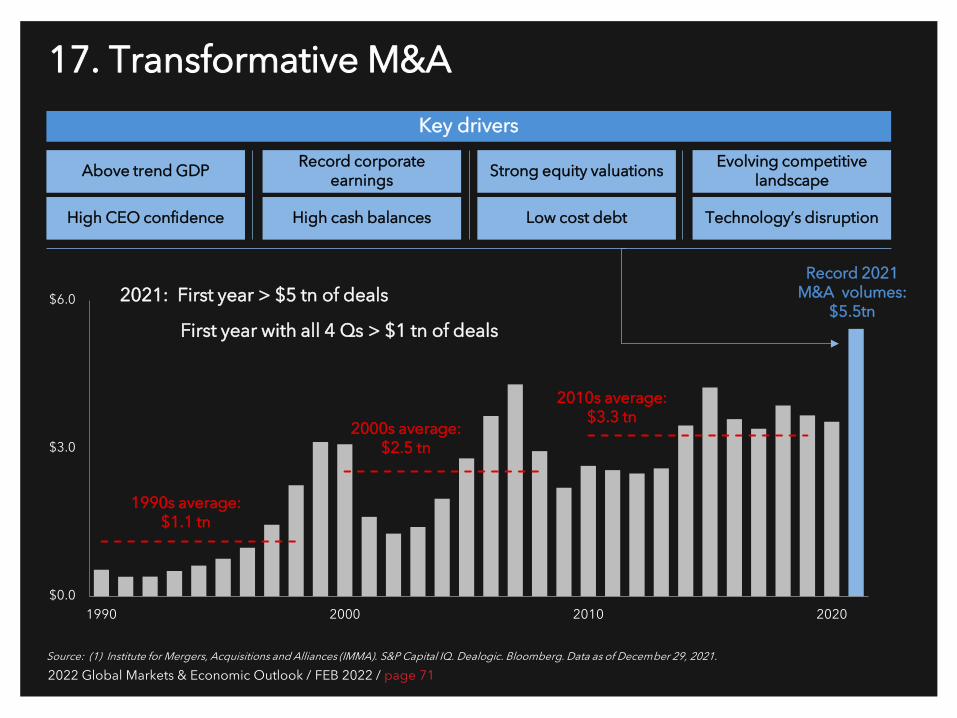
17. Transformative M&A
Source: (1) Institute for Mergers, Acquisitions and Alliances (IMMA). S&P Capital IQ. Dealogic. Bloomberg. Data as of December 29, 2021.
Record 2021 M&A volumes:
$5.5tn
$0.0
$3.0
$6.0
1990 2000 2010 2020
1990s average: $1.1 tn
2000s average: $2.5 tn
2010s average: $3.3 tn
Above trend GDP
High CEO confidence
Record corporate earnings
High cash balances
Strong equity valuations
Low cost debt
Evolving competitive landscape
Technology’s disruption
Key drivers
2021: First year > $5 tn of deals
First year with all 4 Qs > $1 tn of deals
2022 Global Markets & Economic Outlook / FEB 2022 / page 72
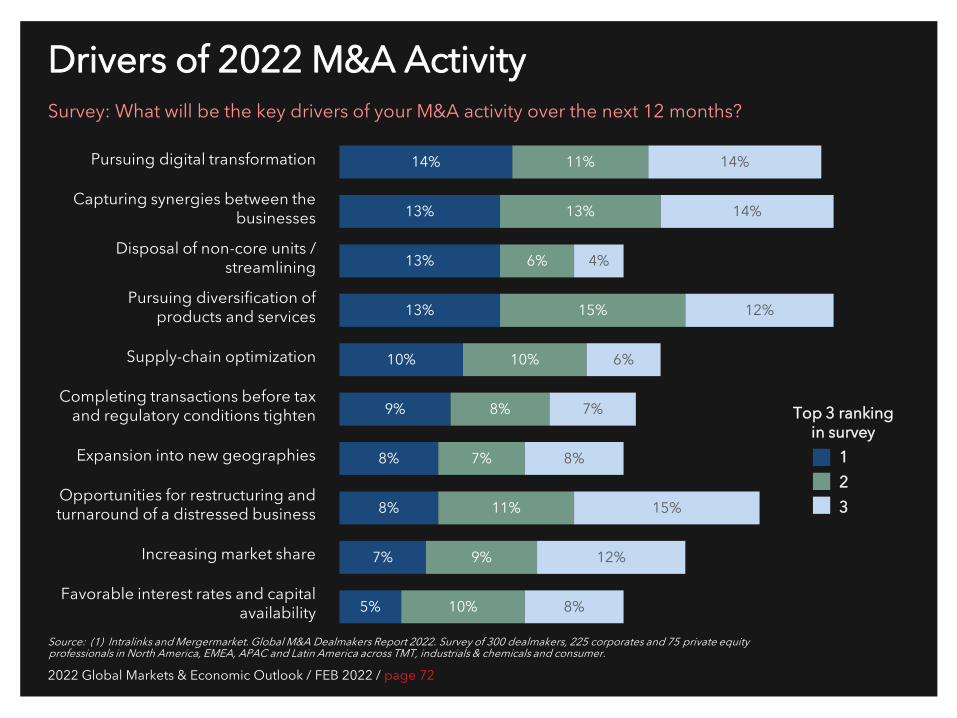
Drivers of 2022 M&A Activity Survey: What will be the key drivers of your M&A activity over the next 12 months?
Source: (1) Intralinks and Mergermarket. Global M&A Dealmakers Report 2022. Survey of 300 dealmakers, 225 corporates and 75 private equity professionals in North America, EMEA, APAC and Latin America across TMT, industrials & chemicals and consumer.
Pursuing digital transformation
Capturing synergies between the businesses
Disposal of non-core units / streamlining
Pursuing diversification of products and services
Supply-chain optimization
Completing transactions before tax and regulatory conditions tighten
Expansion into new geographies
Opportunities for restructuring and turnaround of a distressed business
Increasing market share
Favorable interest rates and capital availability
14%
13%
13%
13%
10%
9%
8%
8%
7%
5%
11%
13%
6%
15%
10%
8%
7%
11%
9%
10%
14%
14%
4%
12%
6%
7%
8%
15%
12%
8%
Top 3 ranking in survey
1 2 3
2022 Global Markets & Economic Outlook / FEB 2022 / page 73
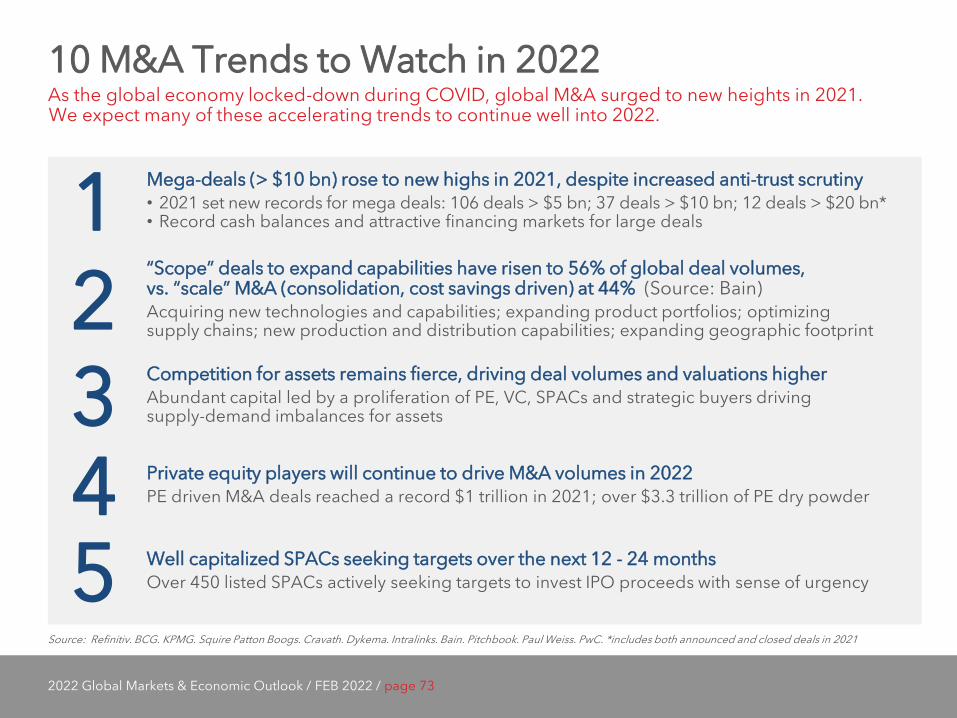
10 M&A Trends to Watch in 2022 As the global economy locked-down during COVID, global M&A surged to new heights in 2021. We expect many of these accelerating trends to continue well into 2022.
Source: Refinitiv. BCG. KPMG. Squire Patton Boogs. Cravath. Dykema. Intralinks. Bain. Pitchbook. Paul Weiss. PwC. *includes both announced and closed deals in 2021
1 2 3 4 5
Mega-deals (> $10 bn) rose to new highs in 2021, despite increased anti-trust scrutiny • 2021 set new records for mega deals: 106 deals > $5 bn; 37 deals > $10 bn; 12 deals > $20 bn* • Record cash balances and attractive financing markets for large deals
“Scope” deals to expand capabilities have risen to 56% of global deal volumes, vs. “scale” M&A (consolidation, cost savings driven) at 44% (Source: Bain) Acquiring new technologies and capabilities; expanding product portfolios; optimizing supply chains; new production and distribution capabilities; expanding geographic footprint
Competition for assets remains fierce, driving deal volumes and valuations higher Abundant capital led by a proliferation of PE, VC, SPACs and strategic buyers driving supply-demand imbalances for assets
Private equity players will continue to drive M&A volumes in 2022 PE driven M&A deals reached a record $1 trillion in 2021; over $3.3 trillion of PE dry powder
Well capitalized SPACs seeking targets over the next 12 - 24 months Over 450 listed SPACs actively seeking targets to invest IPO proceeds with sense of urgency
2022 Global Markets & Economic Outlook / FEB 2022 / page 74
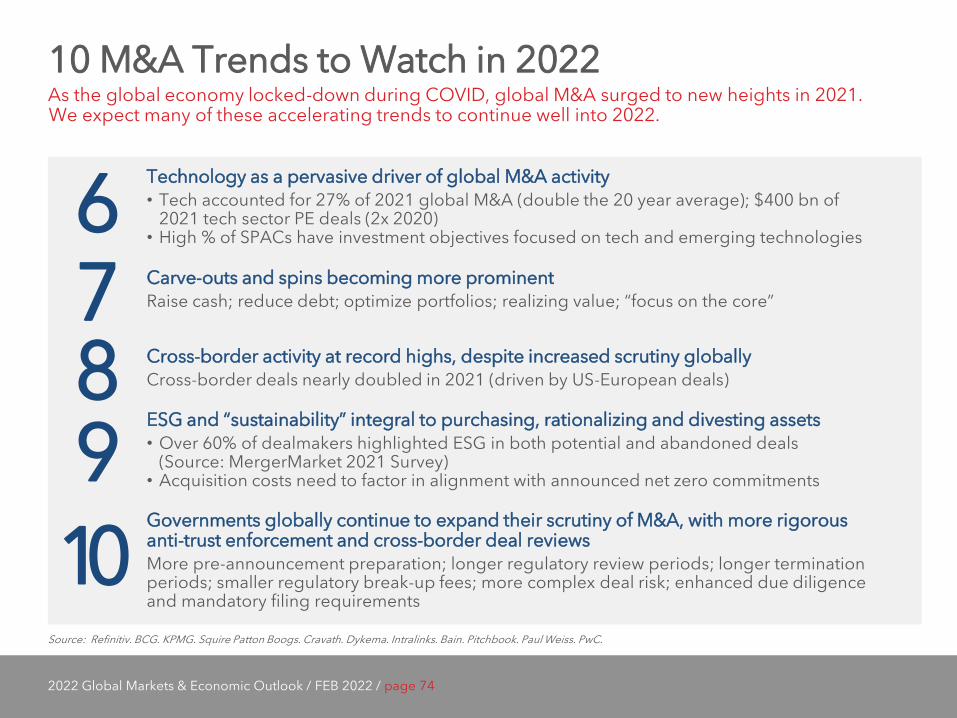
10 M&A Trends to Watch in 2022 As the global economy locked-down during COVID, global M&A surged to new heights in 2021. We expect many of these accelerating trends to continue well into 2022.
Source: Refinitiv. BCG. KPMG. Squire Patton Boogs. Cravath. Dykema. Intralinks. Bain. Pitchbook. Paul Weiss. PwC.
6 Technology as a pervasive driver of global M&A activity • Tech accounted for 27% of 2021 global M&A (double the 20 year average); $400 bn of
2021 tech sector PE deals (2x 2020) • High % of SPACs have investment objectives focused on tech and emerging technologies
7 Carve-outs and spins becoming more prominent Raise cash; reduce debt; optimize portfolios; realizing value; “focus on the core”
8 Cross-border activity at record highs, despite increased scrutiny globally Cross-border deals nearly doubled in 2021 (driven by US-European deals)
9 ESG and “sustainability” integral to purchasing, rationalizing and divesting assets • Over 60% of dealmakers highlighted ESG in both potential and abandoned deals
(Source: MergerMarket 2021 Survey) • Acquisition costs need to factor in alignment with announced net zero commitments
10 Governments globally continue to expand their scrutiny of M&A, with more rigorous anti-trust enforcement and cross-border deal reviews More pre-announcement preparation; longer regulatory review periods; longer termination periods; smaller regulatory break-up fees; more complex deal risk; enhanced due diligence and mandatory filing requirements
2022 Global Markets & Economic Outlook / FEB 2022 / page 75
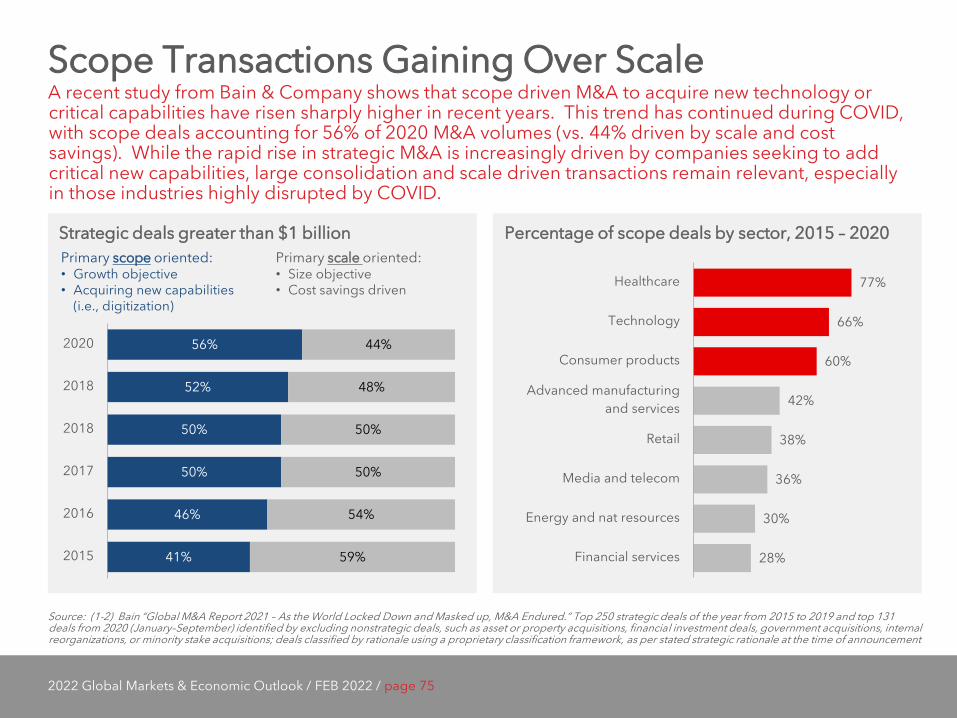
Scope Transactions Gaining Over Scale A recent study from Bain & Company shows that scope driven M&A to acquire new technology or critical capabilities have risen sharply higher in recent years. This trend has continued during COVID, with scope deals accounting for 56% of 2020 M&A volumes (vs. 44% driven by scale and cost savings). While the rapid rise in strategic M&A is increasingly driven by companies seeking to add critical new capabilities, large consolidation and scale driven transactions remain relevant, especially in those industries highly disrupted by COVID.
Strategic deals greater than $1 billion Percentage of scope deals by sector, 2015 – 2020
Source: (1-2) Bain “Global M&A Report 2021 – As the World Locked Down and Masked up, M&A Endured.” Top 250 strategic deals of the year from 2015 to 2019 and top 131 deals from 2020 (January–September) identified by excluding nonstrategic deals, such as asset or property acquisitions, financial investment deals, government acquisitions, internal reorganizations, or minority stake acquisitions; deals classified by rationale using a proprietary classification framework, as per stated strategic rationale at the time of announcement
56%
52%
50%
50%
46%
41%
44%
48%
50%
50%
54%
59%
2020
2018
2018
2017
2016
2015
77%
66%
60%
42%
38%
36%
30%
28%
Healthcare
Technology
Consumer products
Advanced manufacturingand services
Retail
Media and telecom
Energy and nat resources
Financial services
Primary scope oriented: • Growth objective • Acquiring new capabilities
(i.e., digitization)
Primary scale oriented: • Size objective • Cost savings driven
2022 Global Markets & Economic Outlook / FEB 2022 / page 76
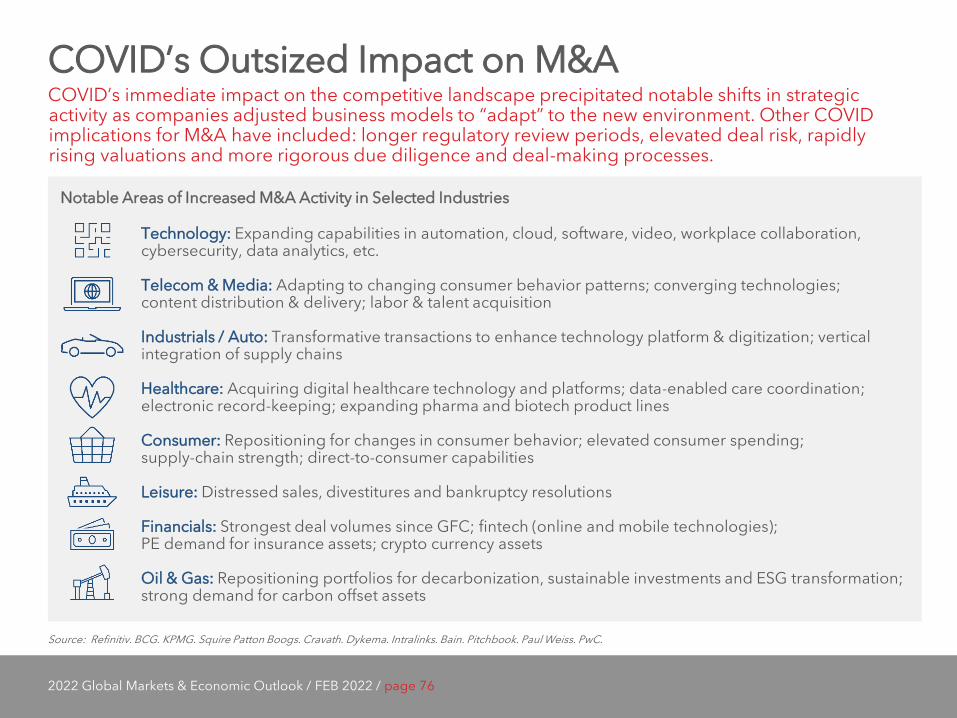
COVID’s Outsized Impact on M&A COVID’s immediate impact on the competitive landscape precipitated notable shifts in strategic activity as companies adjusted business models to “adapt” to the new environment. Other COVID implications for M&A have included: longer regulatory review periods, elevated deal risk, rapidly rising valuations and more rigorous due diligence and deal-making processes.
Source: Refinitiv. BCG. KPMG. Squire Patton Boogs. Cravath. Dykema. Intralinks. Bain. Pitchbook. Paul Weiss. PwC.
Notable Areas of Increased M&A Activity in Selected Industries
Technology: Expanding capabilities in automation, cloud, software, video, workplace collaboration, cybersecurity, data analytics, etc. Telecom & Media: Adapting to changing consumer behavior patterns; converging technologies; content distribution & delivery; labor & talent acquisition Industrials / Auto: Transformative transactions to enhance technology platform & digitization; vertical integration of supply chains Healthcare: Acquiring digital healthcare technology and platforms; data-enabled care coordination; electronic record-keeping; expanding pharma and biotech product lines Consumer: Repositioning for changes in consumer behavior; elevated consumer spending; supply-chain strength; direct-to-consumer capabilities Leisure: Distressed sales, divestitures and bankruptcy resolutions Financials: Strongest deal volumes since GFC; fintech (online and mobile technologies); PE demand for insurance assets; crypto currency assets Oil & Gas: Repositioning portfolios for decarbonization, sustainable investments and ESG transformation; strong demand for carbon offset assets

2022 Global Markets & Economic Outlook / FEB 2022 / page 78
TikTok users watch 167M videos
Twitter users post 575k tweets
Instagram users share 65k photos
Facebook users share 240k photos
Facebook live receives 44M views
YouTube users stream 694k hours
Netflix users stream 452k hours
Teams connects 100k users
Zoom hosts 856 minutes of webinars
Slack users send 148k messages
Google conducts 5.7M searches
Discord users send 668k messages
12M people send an iMessage
Clubhouse creates 208 rooms
Snapchat users send 2M snapchats
Amazon customers spend $283k
6M people shop online
Strava athletes share 1.5k activities
Instacart users spend $67k
Venmo users send $304k
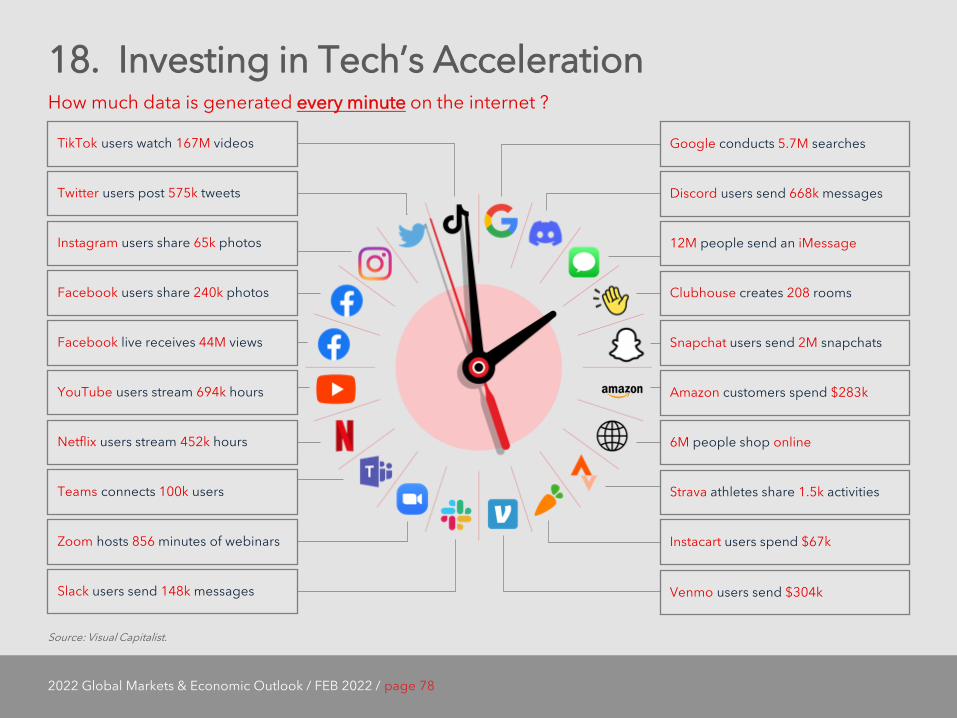
18. Investing in Tech’s Acceleration How much data is generated every minute on the internet ?
Source: Visual Capitalist.
2022 Global Markets & Economic Outlook / FEB 2022 / page 79
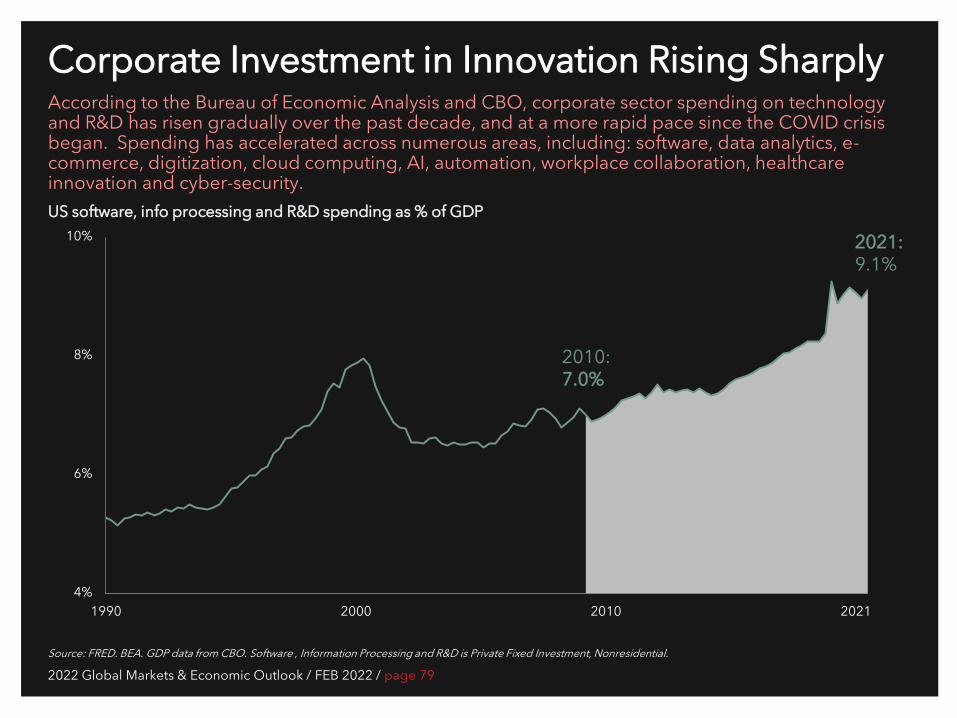
Corporate Investment in Innovation Rising Sharply According to the Bureau of Economic Analysis and CBO, corporate sector spending on technology and R&D has risen gradually over the past decade, and at a more rapid pace since the COVID crisis began. Spending has accelerated across numerous areas, including: software, data analytics, e-commerce, digitization, cloud computing, AI, automation, workplace collaboration, healthcare innovation and cyber-security.
Source: FRED. BEA. GDP data from CBO. Software , Information Processing and R&D is Private Fixed Investment, Nonresidential.
4%
6%
8%
10%
1990 2000 2010 2021
2021: 9.1%
2010: 7.0%
US software, info processing and R&D spending as % of GDP
2022 Global Markets & Economic Outlook / FEB 2022 / page 80
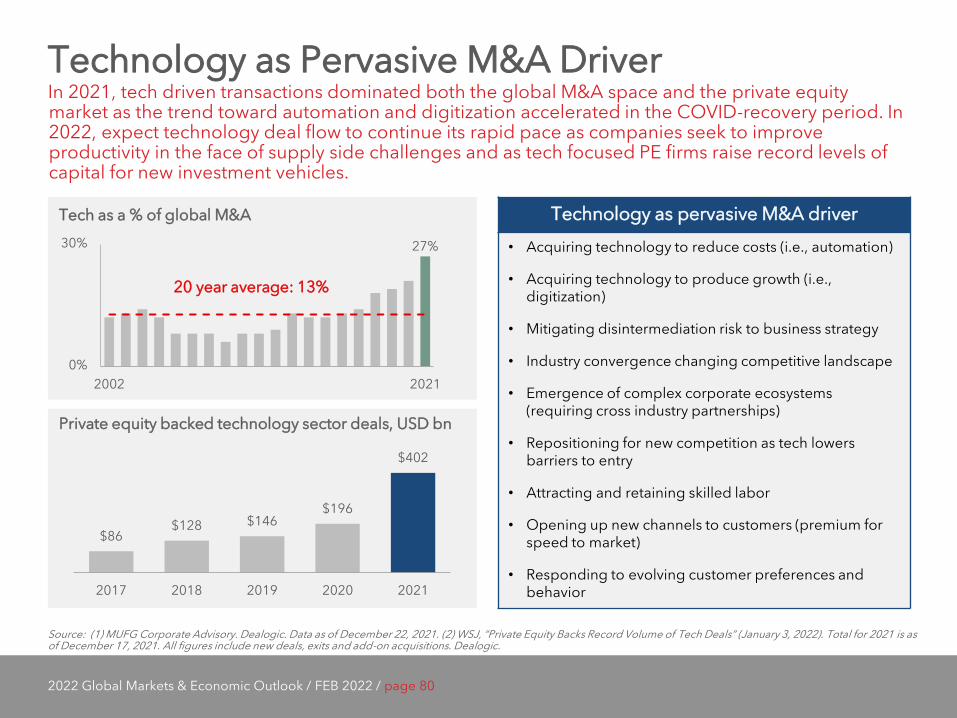
Technology as Pervasive M&A Driver In 2021, tech driven transactions dominated both the global M&A space and the private equity market as the trend toward automation and digitization accelerated in the COVID-recovery period. In 2022, expect technology deal flow to continue its rapid pace as companies seek to improve productivity in the face of supply side challenges and as tech focused PE firms raise record levels of capital for new investment vehicles.
Source: (1) MUFG Corporate Advisory. Dealogic. Data as of December 22, 2021. (2) WSJ, “Private Equity Backs Record Volume of Tech Deals” (January 3, 2022). Total for 2021 is as of December 17, 2021. All figures include new deals, exits and add-on acquisitions. Dealogic.
Tech as a % of global M&A
27%
0%
30%
2002 2021
20 year average: 13%
$86 $128 $146
$196
$402
2017 2018 2019 2020 2021
Private equity backed technology sector deals, USD bn
Technology as pervasive M&A driver • Acquiring technology to reduce costs (i.e., automation)
• Acquiring technology to produce growth (i.e., digitization)
• Mitigating disintermediation risk to business strategy
• Industry convergence changing competitive landscape
• Emergence of complex corporate ecosystems (requiring cross industry partnerships)
• Repositioning for new competition as tech lowers barriers to entry
• Attracting and retaining skilled labor
• Opening up new channels to customers (premium for speed to market)
• Responding to evolving customer preferences and behavior
2022 Global Markets & Economic Outlook / FEB 2022 / page 81
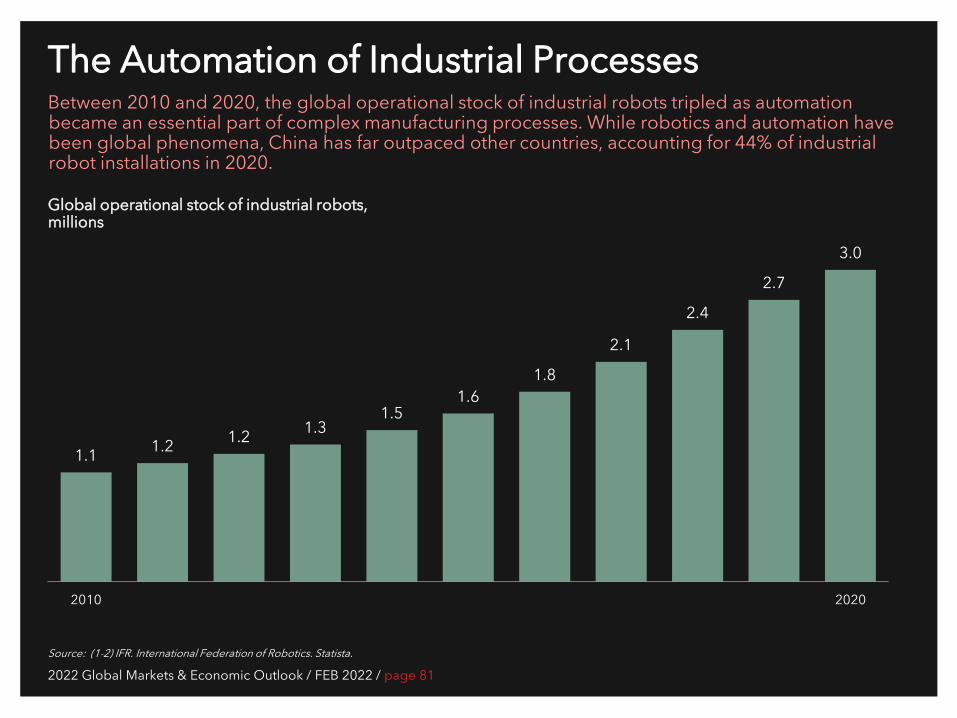
The Automation of Industrial Processes Between 2010 and 2020, the global operational stock of industrial robots tripled as automation became an essential part of complex manufacturing processes. While robotics and automation have been global phenomena, China has far outpaced other countries, accounting for 44% of industrial robot installations in 2020.
Source: (1-2) IFR. International Federation of Robotics. Statista.
Global operational stock of industrial robots, millions
1.1 1.2 1.2 1.3 1.5
1.6 1.8
2.1
2.4
2.7
3.0
2010 2020

2022 Global Markets & Economic Outlook / FEB 2022 / page 83
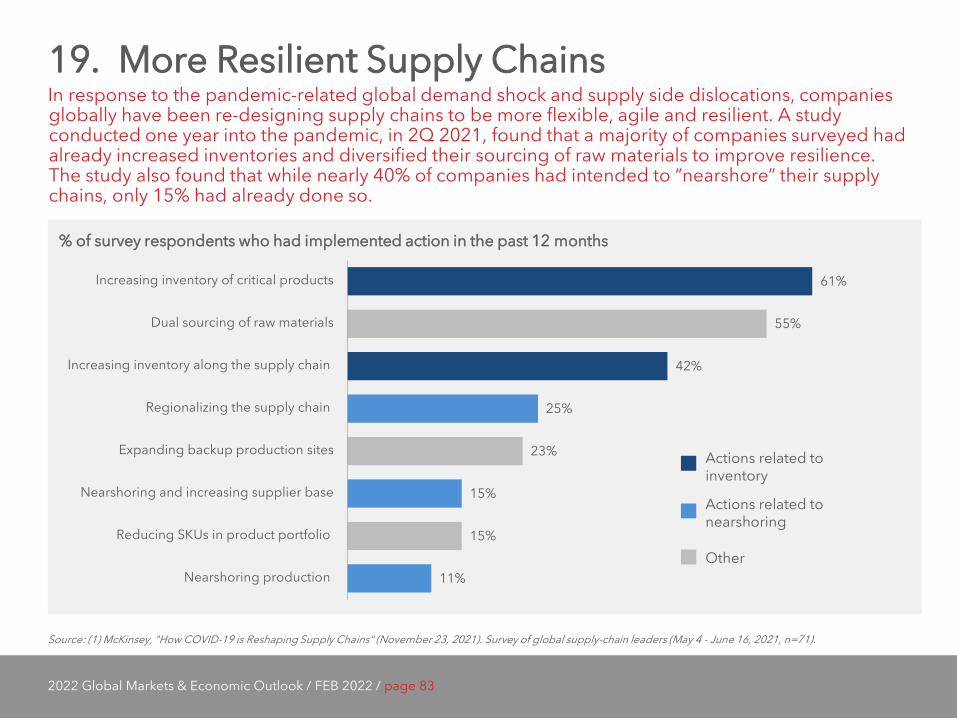
19. More Resilient Supply Chains In response to the pandemic-related global demand shock and supply side dislocations, companies globally have been re-designing supply chains to be more flexible, agile and resilient. A study conducted one year into the pandemic, in 2Q 2021, found that a majority of companies surveyed had already increased inventories and diversified their sourcing of raw materials to improve resilience. The study also found that while nearly 40% of companies had intended to “nearshore” their supply chains, only 15% had already done so.
Source: (1) McKinsey, "How COVID-19 is Reshaping Supply Chains" (November 23, 2021). Survey of global supply-chain leaders (May 4 - June 16, 2021, n=71).
% of survey respondents who had implemented action in the past 12 months
61%
55%
42%
25%
23%
15%
15%
11%
Increasing inventory of critical products
Dual sourcing of raw materials
Increasing inventory along the supply chain
Regionalizing the supply chain
Expanding backup production sites
Nearshoring and increasing supplier base
Reducing SKUs in product portfolio
Nearshoring production
Actions related to inventory
Other
Actions related to nearshoring
2022 Global Markets & Economic Outlook / FEB 2022 / page 84
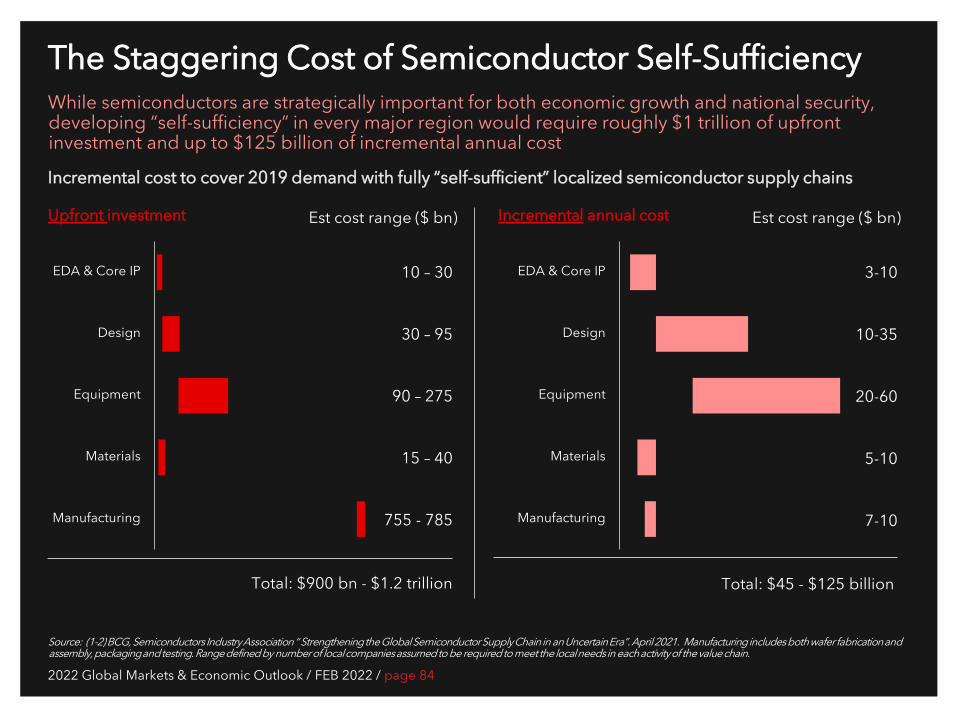
The Staggering Cost of Semiconductor Self-Sufficiency While semiconductors are strategically important for both economic growth and national security, developing “self-sufficiency” in every major region would require roughly $1 trillion of upfront investment and up to $125 billion of incremental annual cost
Source: (1-2) BCG, Semiconductors Industry Association “ Strengthening the Global Semiconductor Supply Chain in an Uncertain Era”. April 2021. Manufacturing includes both wafer fabrication and assembly, packaging and testing. Range defined by number of local companies assumed to be required to meet the local needs in each activity of the value chain.
Upfront investment Incremental annual cost
Incremental cost to cover 2019 demand with fully “self-sufficient” localized semiconductor supply chains
10 – 30
30 – 95
90 – 275
15 – 40
755 - 785
3-10
10-35
20-60
5-10
7-10
Est cost range ($ bn) Est cost range ($ bn)
Total: $900 bn - $1.2 trillion Total: $45 - $125 billion
EDA & Core IP
Design
Equipment
Materials
Manufacturing
EDA & Core IP
Design
Equipment
Materials
Manufacturing

2022 Global Markets & Economic Outlook / FEB 2022 / page 86
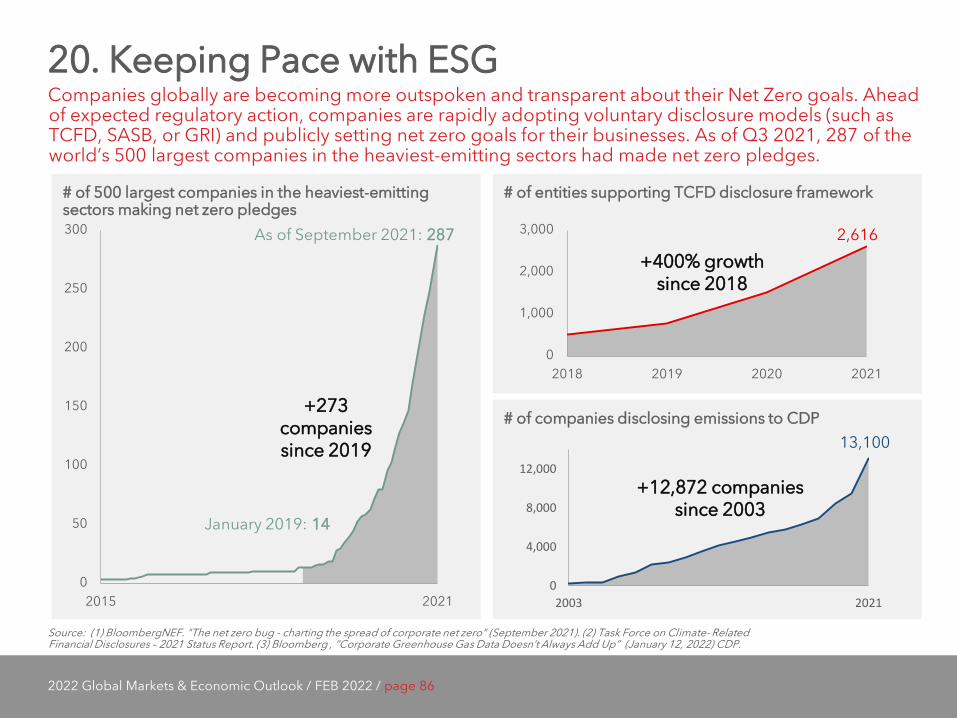
20. Keeping Pace with ESG Companies globally are becoming more outspoken and transparent about their Net Zero goals. Ahead of expected regulatory action, companies are rapidly adopting voluntary disclosure models (such as TCFD, SASB, or GRI) and publicly setting net zero goals for their businesses. As of Q3 2021, 287 of the world’s 500 largest companies in the heaviest-emitting sectors had made net zero pledges.
Source: (1) BloombergNEF. "The net zero bug - charting the spread of corporate net zero" (September 2021). (2) Task Force on Climate- Related Financial Disclosures – 2021 Status Report. (3) Bloomberg , “Corporate Greenhouse Gas Data Doesn’t Always Add Up” (January 12, 2022) CDP.
# of entities supporting TCFD disclosure framework
0
1,000
2,000
3,000
2018 2019 2020 2021
+400% growth since 2018
2,616
# of 500 largest companies in the heaviest-emitting sectors making net zero pledges
0
50
100
150
200
250
300
2015 2021
As of September 2021: 287
January 2019: 14
+273 companies since 2019
# of companies disclosing emissions to CDP
0
4,000
8,000
12,000
2003 2021
+12,872 companies since 2003
13,100
2022 Global Markets & Economic Outlook / FEB 2022 / page 87
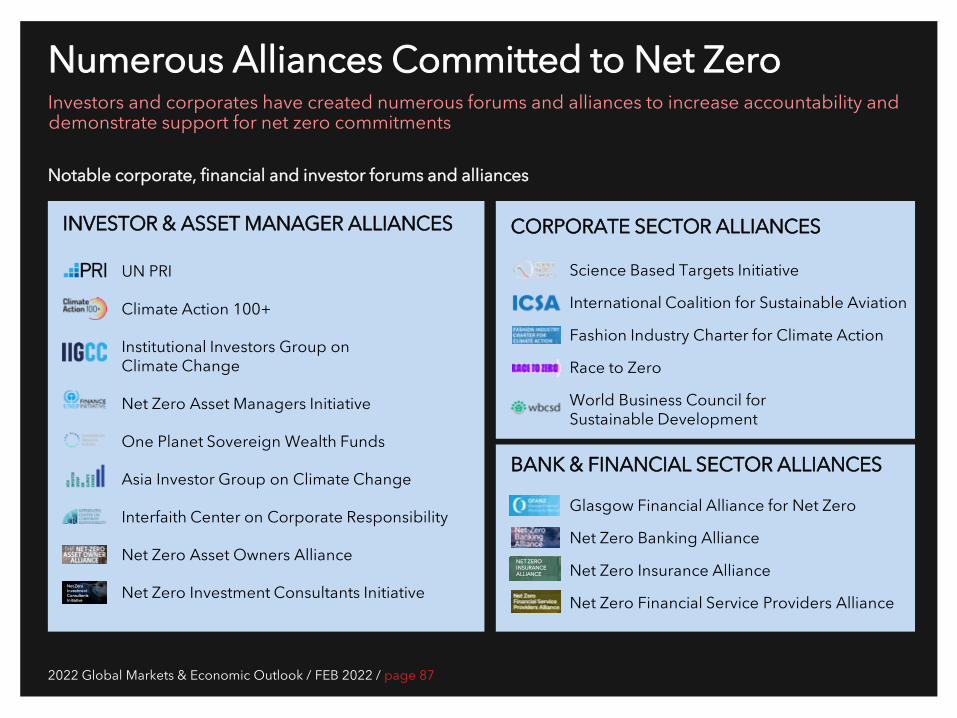
Numerous Alliances Committed to Net Zero Investors and corporates have created numerous forums and alliances to increase accountability and demonstrate support for net zero commitments
UN PRI
Climate Action 100+
Institutional Investors Group on Climate Change
Net Zero Asset Managers Initiative
One Planet Sovereign Wealth Funds
Asia Investor Group on Climate Change
Interfaith Center on Corporate Responsibility
Net Zero Asset Owners Alliance
Net Zero Investment Consultants Initiative
INVESTOR & ASSET MANAGER ALLIANCES
Notable corporate, financial and investor forums and alliances
Net Zero Investment Consultants Initiative
Science Based Targets Initiative
International Coalition for Sustainable Aviation
Fashion Industry Charter for Climate Action
Race to Zero
World Business Council for Sustainable Development
CORPORATE SECTOR ALLIANCES
Glasgow Financial Alliance for Net Zero
Net Zero Banking Alliance
Net Zero Insurance Alliance
Net Zero Financial Service Providers Alliance
BANK & FINANCIAL SECTOR ALLIANCES
NET ZERO INSURANCE ALLIANCE
2022 Global Markets & Economic Outlook / FEB 2022 / page 88
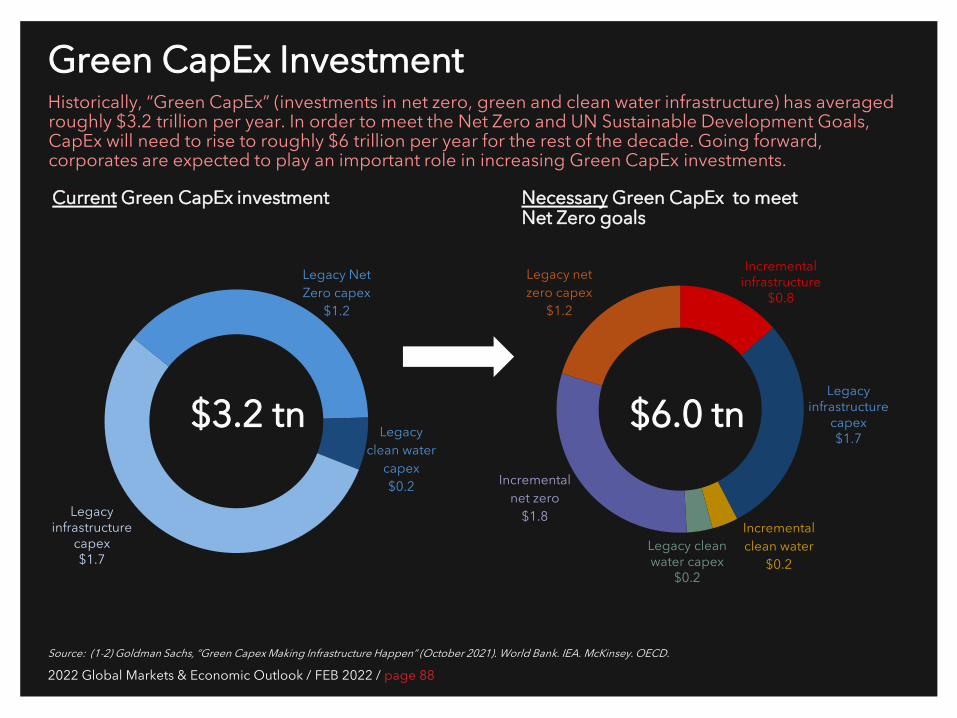
Green CapEx Investment Historically, “Green CapEx” (investments in net zero, green and clean water infrastructure) has averaged roughly $3.2 trillion per year. In order to meet the Net Zero and UN Sustainable Development Goals, CapEx will need to rise to roughly $6 trillion per year for the rest of the decade. Going forward, corporates are expected to play an important role in increasing Green CapEx investments.
Source: (1-2) Goldman Sachs, “Green Capex Making Infrastructure Happen” (October 2021). World Bank. IEA. McKinsey. OECD.
Current Green CapEx investment
Incremental clean water
$0.2
Incremental net zero
$1.8
Legacy net zero capex
$1.2
Legacy Net Zero capex
$1.2
Legacy clean water
capex $0.2
$6.0 tn
Necessary Green CapEx to meet Net Zero goals
Legacy infrastructure
capex $1.7
$3.2 tn
Legacy clean water capex
$0.2
Legacy infrastructure
capex $1.7
Incremental infrastructure
$0.8
2022 Global Markets & Economic Outlook / FEB 2022 / page 89
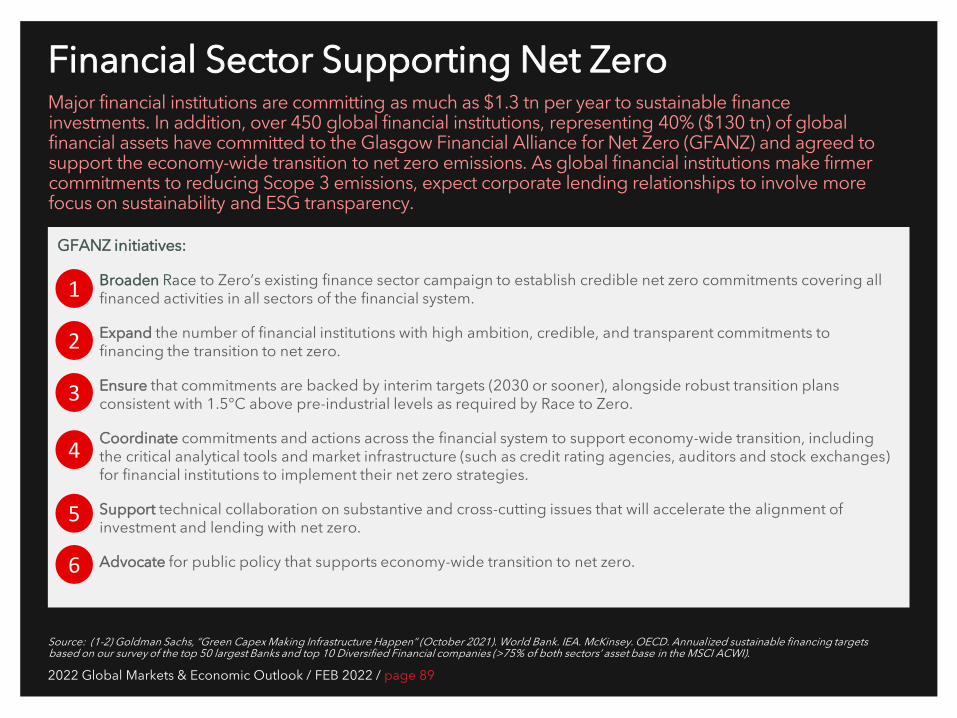
Financial Sector Supporting Net Zero Major financial institutions are committing as much as $1.3 tn per year to sustainable finance investments. In addition, over 450 global financial institutions, representing 40% ($130 tn) of global financial assets have committed to the Glasgow Financial Alliance for Net Zero (GFANZ) and agreed to support the economy-wide transition to net zero emissions. As global financial institutions make firmer commitments to reducing Scope 3 emissions, expect corporate lending relationships to involve more focus on sustainability and ESG transparency.
Source: (1-2) Goldman Sachs, “Green Capex Making Infrastructure Happen” (October 2021). World Bank. IEA. McKinsey. OECD. Annualized sustainable financing targets based on our survey of the top 50 largest Banks and top 10 Diversified Financial companies (>75% of both sectors’ asset base in the MSCI ACWI).
GFANZ initiatives:
Broaden Race to Zero’s existing finance sector campaign to establish credible net zero commitments covering all financed activities in all sectors of the financial system.
Expand the number of financial institutions with high ambition, credible, and transparent commitments to financing the transition to net zero.
Ensure that commitments are backed by interim targets (2030 or sooner), alongside robust transition plans consistent with 1.5°C above pre-industrial levels as required by Race to Zero.
Coordinate commitments and actions across the financial system to support economy-wide transition, including the critical analytical tools and market infrastructure (such as credit rating agencies, auditors and stock exchanges) for financial institutions to implement their net zero strategies.
Support technical collaboration on substantive and cross-cutting issues that will accelerate the alignment of investment and lending with net zero.
Advocate for public policy that supports economy-wide transition to net zero.
1
2
3
4
5
6
5 Resilient USD Credit Markets
“They sat far apart deliberately, to experience, daily, the sweetness of seeing each other across great distance.” Louise Gluck, American poet and winner of the 2020 Nobel Prize in Literature

2022 Global Markets & Economic Outlook / FEB 2022 / page 92
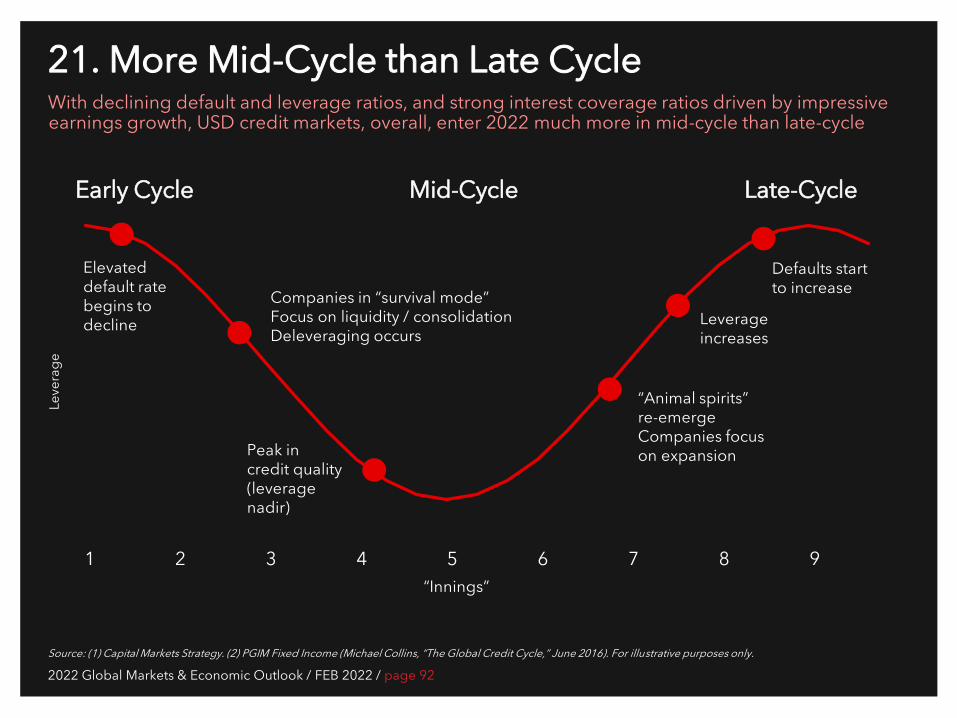
Defaults start to increase
“Animal spirits” re-emerge Companies focus on expansion
Leverage increases
Peak in credit quality (leverage nadir)
Companies in “survival mode” Focus on liquidity / consolidation Deleveraging occurs
Elevated default rate begins to decline
“Innings”
Leve
rage
1 2 3 4 5 6 7 8 9
21. More Mid-Cycle than Late Cycle With declining default and leverage ratios, and strong interest coverage ratios driven by impressive earnings growth, USD credit markets, overall, enter 2022 much more in mid-cycle than late-cycle
Source: (1) Capital Markets Strategy. (2) PGIM Fixed Income (Michael Collins, “The Global Credit Cycle,” June 2016). For illustrative purposes only.
Early Cycle Mid-Cycle Late-Cycle
2022 Global Markets & Economic Outlook / FEB 2022 / page 93
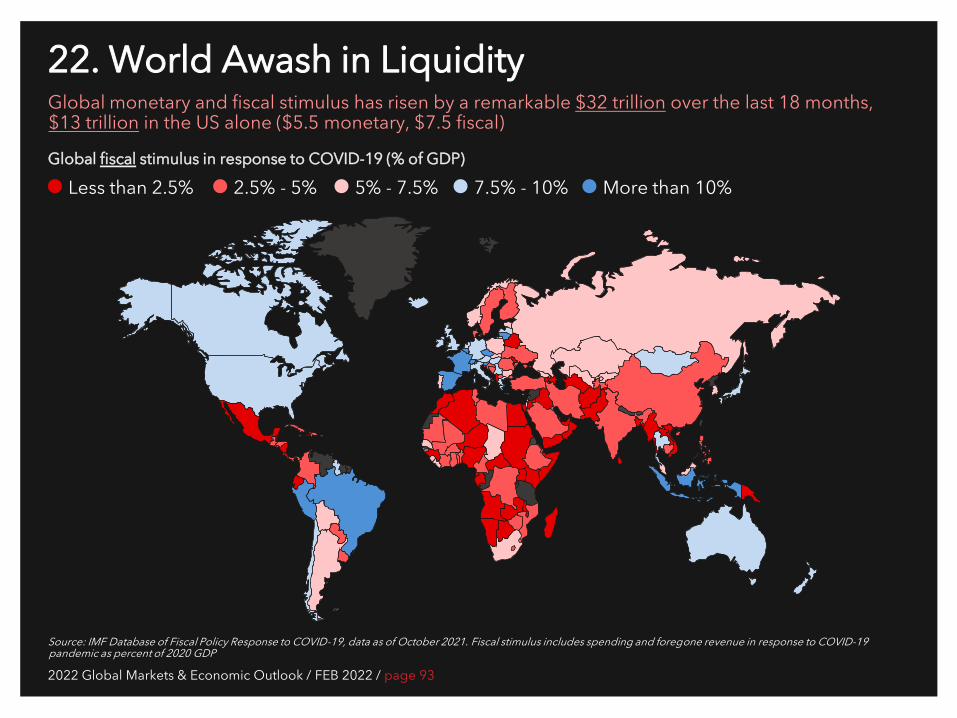
22. World Awash in Liquidity Global monetary and fiscal stimulus has risen by a remarkable $32 trillion over the last 18 months, $13 trillion in the US alone ($5.5 monetary, $7.5 fiscal)
Source: IMF Database of Fiscal Policy Response to COVID-19, data as of October 2021. Fiscal stimulus includes spending and foregone revenue in response to COVID-19 pandemic as percent of 2020 GDP
Global fiscal stimulus in response to COVID-19 (% of GDP)
Less than 2.5% 2.5% - 5% 5% - 7.5% 7.5% - 10% More than 10%
2022 Global Markets & Economic Outlook / FEB 2022 / page 94
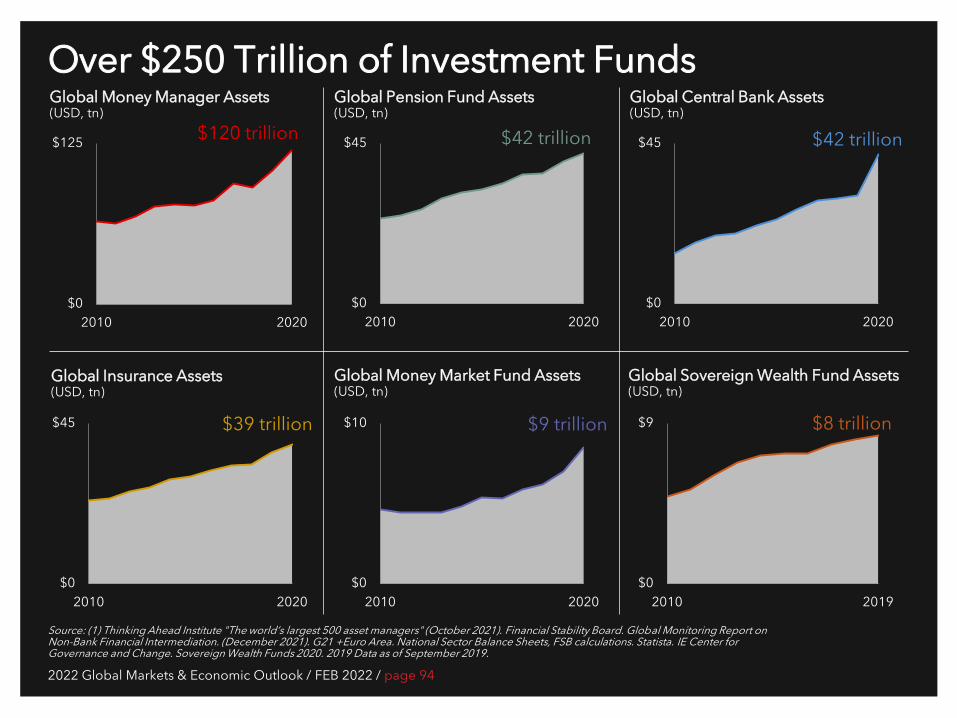
Over $250 Trillion of Investment Funds
Source: (1) Thinking Ahead Institute "The world’s largest 500 asset managers" (October 2021). Financial Stability Board. Global Monitoring Report on Non-Bank Financial Intermediation. (December 2021). G21 +Euro Area. National Sector Balance Sheets, FSB calculations. Statista. IE Center for Governance and Change. Sovereign Wealth Funds 2020. 2019 Data as of September 2019.
Global Money Manager Assets (USD, tn)
Global Pension Fund Assets (USD, tn)
Global Central Bank Assets (USD, tn)
Global Money Market Fund Assets (USD, tn)
$0
$125
2010 2020
$120 trillion
$0
$45
2010 2020
$42 trillion
$0
$10
2010 2020
$9 trillion
Global Insurance Assets (USD, tn)
$0
$45
2010 2020
$39 trillion
$0
$45
2010 2020
$42 trillion
Global Sovereign Wealth Fund Assets (USD, tn)
$0
$9
2010 2019
$8 trillion
2022 Global Markets & Economic Outlook / FEB 2022 / page 95
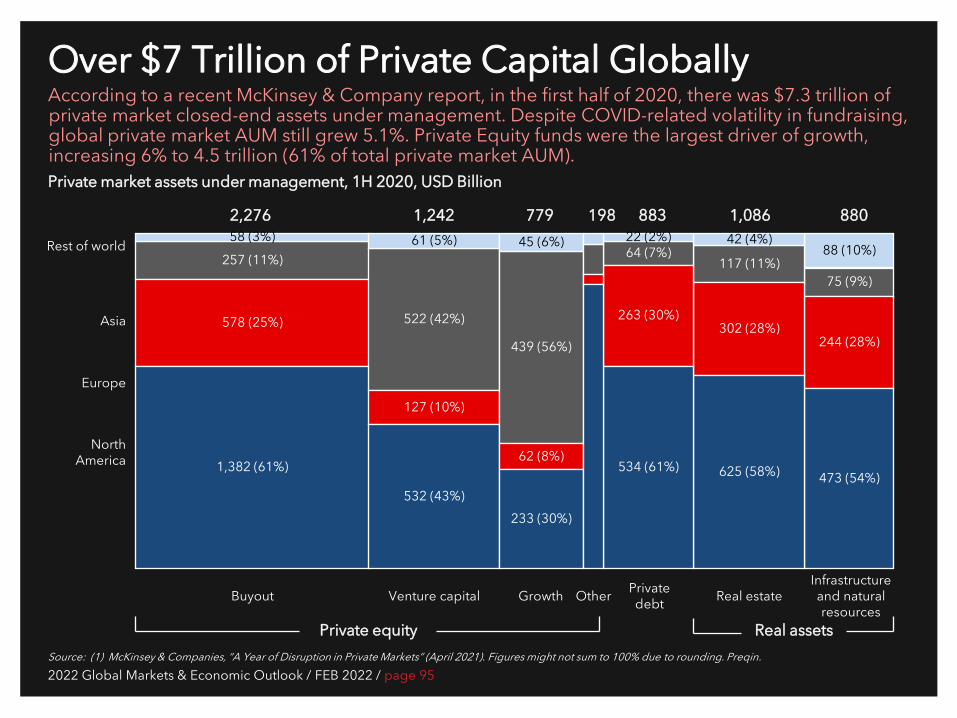
Over $7 Trillion of Private Capital Globally According to a recent McKinsey & Company report, in the first half of 2020, there was $7.3 trillion of private market closed-end assets under management. Despite COVID-related volatility in fundraising, global private market AUM still grew 5.1%. Private Equity funds were the largest driver of growth, increasing 6% to 4.5 trillion (61% of total private market AUM).
Source: (1) McKinsey & Companies, “A Year of Disruption in Private Markets” (April 2021). Figures might not sum to 100% due to rounding. Preqin.
Private market assets under management, 1H 2020, USD Billion
Rest of world
Asia
Europe
North America
Venture capital
Private equity Real assets
Growth Buyout Other Private debt Real estate
Infrastructure and natural resources
2,276 1,242 779 198 883 880 1,086
257 (11%)
578 (25%)
1,382 (61%)
58 (3%)
522 (42%)
127 (10%)
532 (43%)
61 (5%)
439 (56%)
62 (8%)
233 (30%)
45 (6%)
75 (9%)
244 (28%)
473 (54%)
88 (10%) 117 (11%)
302 (28%)
625 (58%)
42 (4%) 64 (7%)
263 (30%)
534 (61%)
22 (2%)
2022 Global Markets & Economic Outlook / FEB 2022 / page 96
0x
1x
2x
3x
4x
5x
Q1 2015 Q3 2021
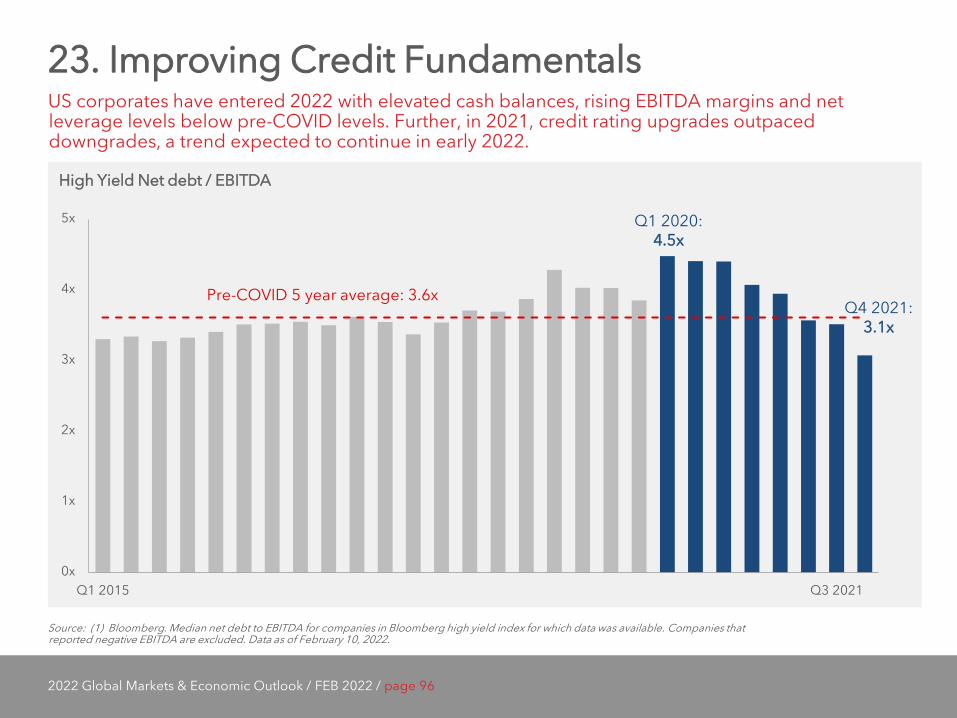
23. Improving Credit Fundamentals US corporates have entered 2022 with elevated cash balances, rising EBITDA margins and net leverage levels below pre-COVID levels. Further, in 2021, credit rating upgrades outpaced downgrades, a trend expected to continue in early 2022.
Source: (1) Bloomberg. Median net debt to EBITDA for companies in Bloomberg high yield index for which data was available. Companies that reported negative EBITDA are excluded. Data as of February 10, 2022.
High Yield Net debt / EBITDA
Q4 2021: 3.1x
Pre-COVID 5 year average: 3.6x
Q1 2020: 4.5x
2022 Global Markets & Economic Outlook / FEB 2022 / page 97
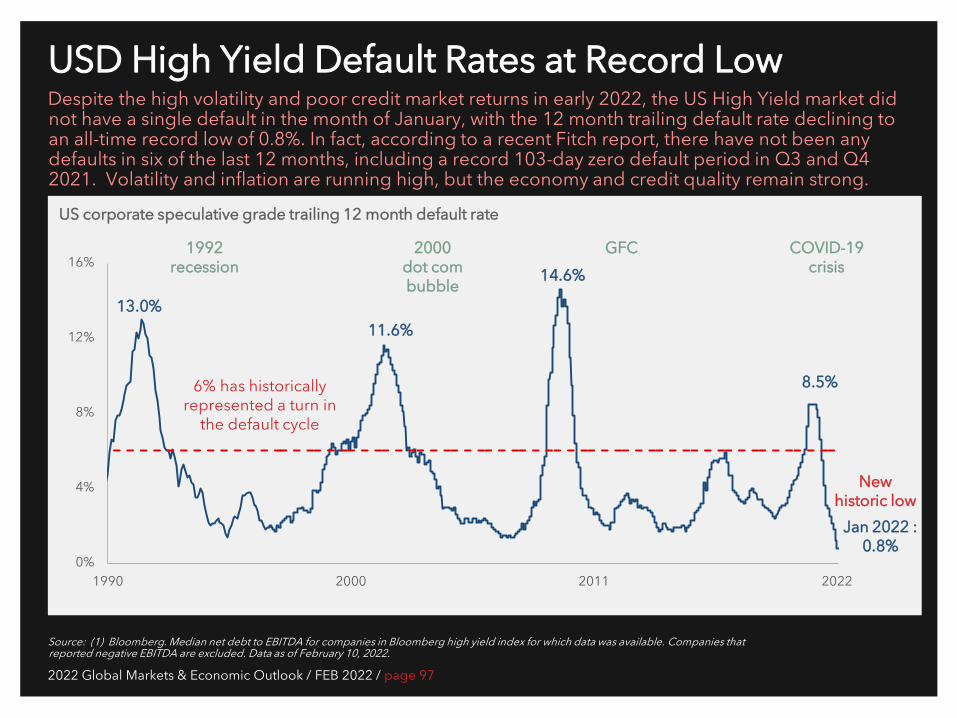
USD High Yield Default Rates at Record Low Despite the high volatility and poor credit market returns in early 2022, the US High Yield market did not have a single default in the month of January, with the 12 month trailing default rate declining to an all-time record low of 0.8%. In fact, according to a recent Fitch report, there have not been any defaults in six of the last 12 months, including a record 103-day zero default period in Q3 and Q4 2021. Volatility and inflation are running high, but the economy and credit quality remain strong.
Source: (1) Bloomberg. Median net debt to EBITDA for companies in Bloomberg high yield index for which data was available. Companies that reported negative EBITDA are excluded. Data as of February 10, 2022.
US corporate speculative grade trailing 12 month default rate
0%
4%
8%
12%
16%
1990 2000 2011 2022
1992 recession
2000 dot com bubble
GFC COVID-19 crisis
Jan 2022 : 0.8%
8.5%
14.6%
New historic low
6% has historically represented a turn in
the default cycle
11.6% 13.0%
2022 Global Markets & Economic Outlook / FEB 2022 / page 98
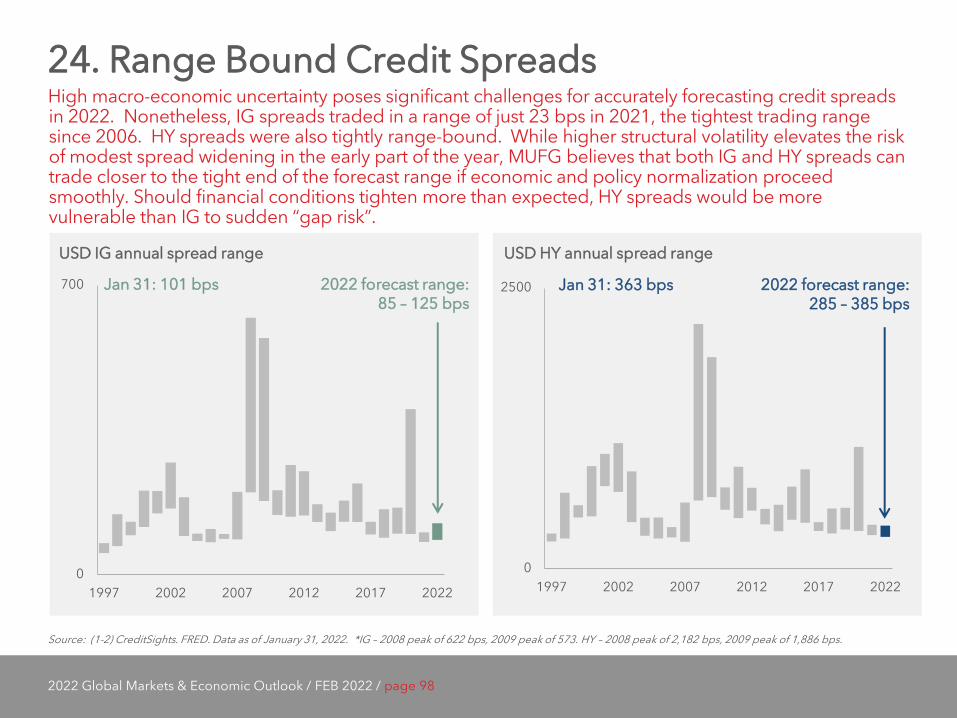
24. Range Bound Credit Spreads High macro-economic uncertainty poses significant challenges for accurately forecasting credit spreads in 2022. Nonetheless, IG spreads traded in a range of just 23 bps in 2021, the tightest trading range since 2006. HY spreads were also tightly range-bound. While higher structural volatility elevates the risk of modest spread widening in the early part of the year, MUFG believes that both IG and HY spreads can trade closer to the tight end of the forecast range if economic and policy normalization proceed smoothly. Should financial conditions tighten more than expected, HY spreads would be more vulnerable than IG to sudden “gap risk”.
Source: (1-2) CreditSights. FRED. Data as of January 31, 2022. *IG – 2008 peak of 622 bps, 2009 peak of 573. HY – 2008 peak of 2,182 bps, 2009 peak of 1,886 bps.
USD IG annual spread range USD HY annual spread range
0
700
1997 2002 2007 2012 2017 2022
0
2500
1997 2002 2007 2012 2017 2022
Jan 31: 363 bps
Jan 31: 101 bps
2022 forecast range: 85 – 125 bps
2022 forecast range: 285 – 385 bps
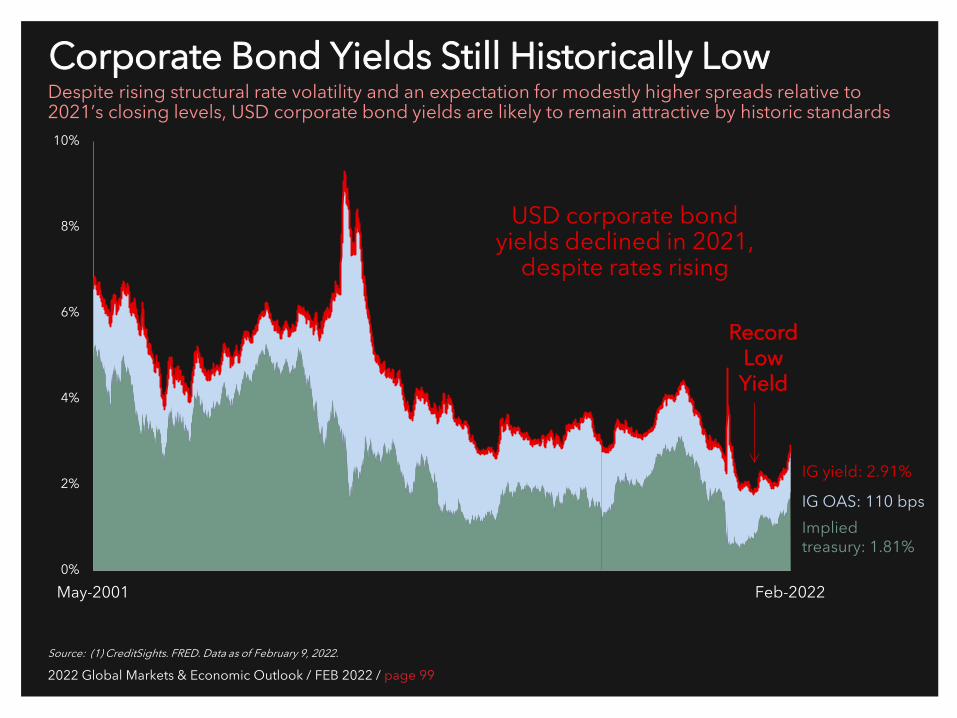
2022 Global Markets & Economic Outlook / FEB 2022 / page 99
USD corporate bond yields declined in 2021,
despite rates rising
Source: (1) CreditSights. FRED. Data as of February 9, 2022.
Corporate Bond Yields Still Historically Low
0%
2%
4%
6%
8%
10%
May-2001 Feb-2022
Record Low Yield
Despite rising structural rate volatility and an expectation for modestly higher spreads relative to 2021’s closing levels, USD corporate bond yields are likely to remain attractive by historic standards
IG yield: 2.91%
IG OAS: 110 bps Implied treasury: 1.81%
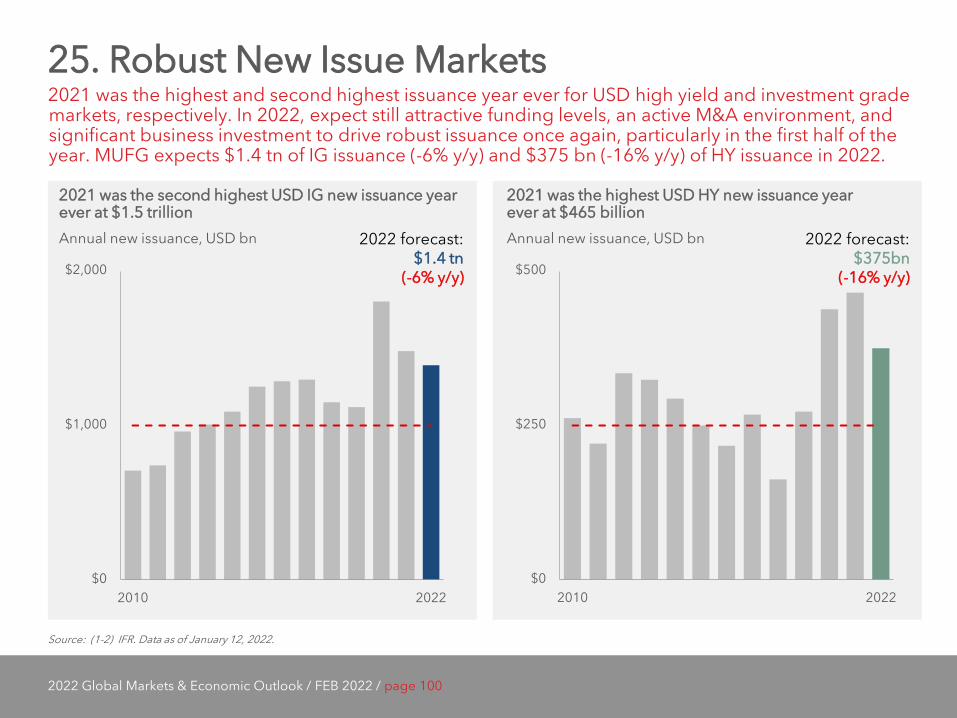
2022 Global Markets & Economic Outlook / FEB 2022 / page 100
2021 was the highest USD HY new issuance year ever at $465 billion
25. Robust New Issue Markets 2021 was the highest and second highest issuance year ever for USD high yield and investment grade markets, respectively. In 2022, expect still attractive funding levels, an active M&A environment, and significant business investment to drive robust issuance once again, particularly in the first half of the year. MUFG expects $1.4 tn of IG issuance (-6% y/y) and $375 bn (-16% y/y) of HY issuance in 2022.
Source: (1-2) IFR. Data as of January 12, 2022.
2021 was the second highest USD IG new issuance year ever at $1.5 trillion Annual new issuance, USD bn
$0
$1,000
$2,000
2010 2022$0
$250
$500
2010 2022
Annual new issuance, USD bn 2022 forecast: $1.4 tn
(-6% y/y)
2022 forecast: $375bn
(-16% y/y)
6 Geopolitical Risk & Big Government
“The United States brags about its political system, but the President says one thing during the election, something else when he takes office, something else at the midterm and something else when he leaves.” Deng Xiaoping, Leader of China from 1978 - 1989, also known as the “Architect of Modern China”
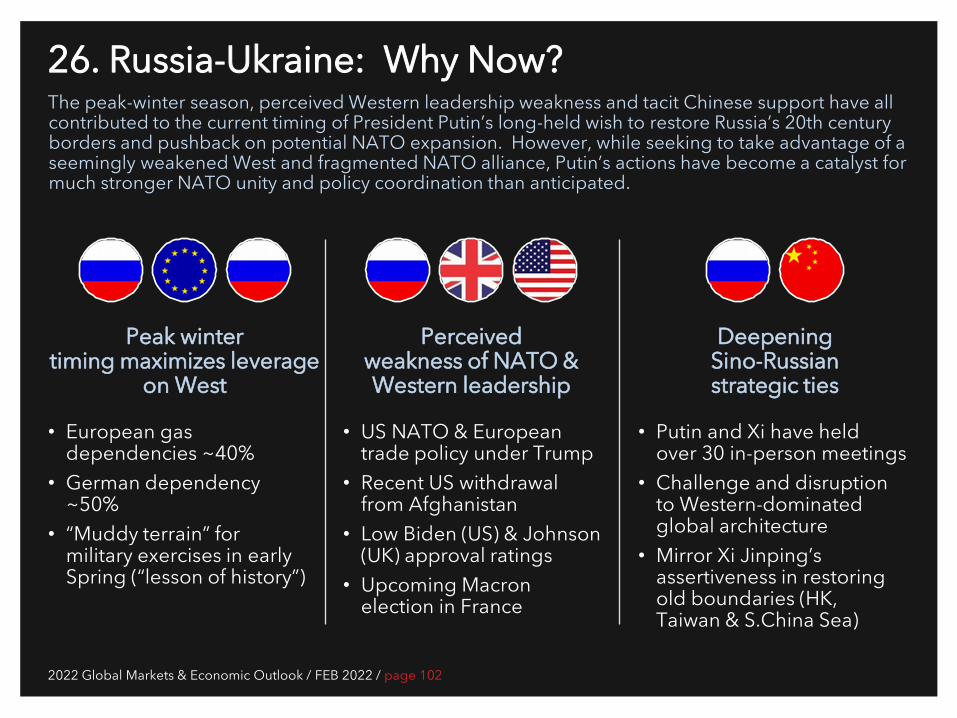
2022 Global Markets & Economic Outlook / FEB 2022 / page 102
26. Russia-Ukraine: Why Now? The peak-winter season, perceived Western leadership weakness and tacit Chinese support have all contributed to the current timing of President Putin’s long-held wish to restore Russia’s 20th century borders and pushback on potential NATO expansion. However, while seeking to take advantage of a seemingly weakened West and fragmented NATO alliance, Putin’s actions have become a catalyst for much stronger NATO unity and policy coordination than anticipated.
Peak winter timing maximizes leverage
on West
• European gas dependencies ~40%
• German dependency ~50%
• “Muddy terrain” for military exercises in early Spring (“lesson of history”)
Perceived weakness of NATO & Western leadership
• US NATO & European trade policy under Trump
• Recent US withdrawal from Afghanistan
• Low Biden (US) & Johnson (UK) approval ratings
• Upcoming Macron election in France
Deepening Sino-Russian strategic ties
• Putin and Xi have held over 30 in-person meetings
• Challenge and disruption to Western-dominated global architecture
• Mirror Xi Jinping’s assertiveness in restoring old boundaries (HK, Taiwan & S.China Sea)
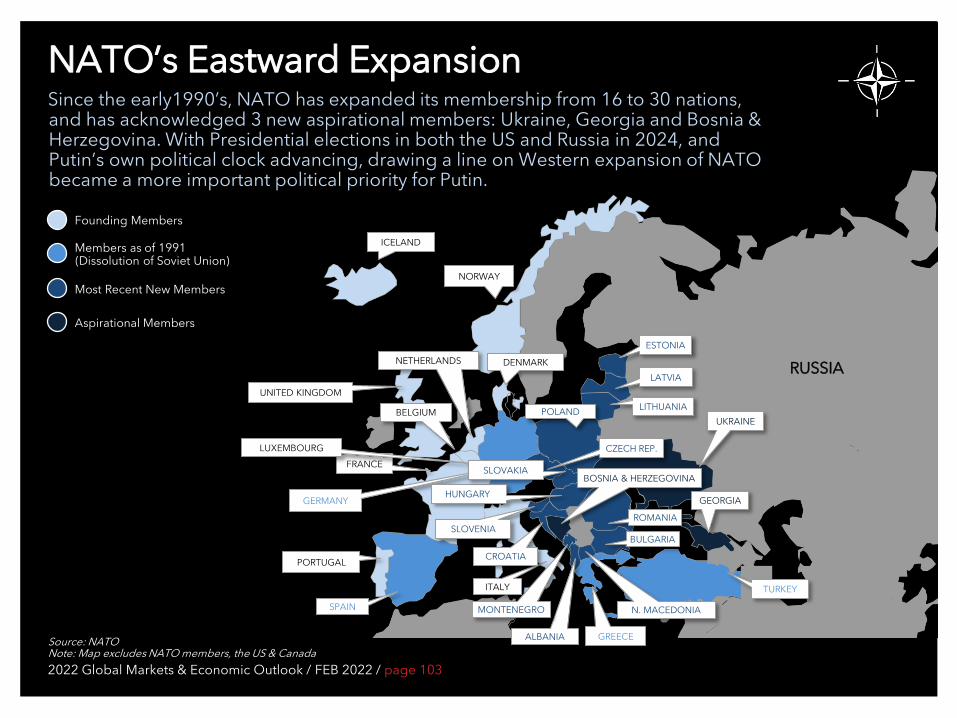
2022 Global Markets & Economic Outlook / FEB 2022 / page 103
NATO’s Eastward Expansion Since the early1990’s, NATO has expanded its membership from 16 to 30 nations, and has acknowledged 3 new aspirational members: Ukraine, Georgia and Bosnia & Herzegovina. With Presidential elections in both the US and Russia in 2024, and Putin’s own political clock advancing, drawing a line on Western expansion of NATO became a more important political priority for Putin.
Source: NATO Note: Map excludes NATO members, the US & Canada
Most Recent New Members
Members as of 1991 (Dissolution of Soviet Union)
Founding Members
Aspirational Members
UKRAINE
BOSNIA & HERZEGOVINA
GEORGIA
RUSSIA NETHERLANDS
ICELAND
BELGIUM
DENMARK
FRANCE
PORTUGAL
ITALY
LUXEMBOURG
NORWAY
UNITED KINGDOM
GERMANY
GREECE
TURKEY
SPAIN
ALBANIA
CROATIA
CZECH REP.
SLOVENIA
N. MACEDONIA
BULGARIA
ESTONIA
LATVIA
LITHUANIA POLAND
HUNGARY
MONTENEGRO
ROMANIA
SLOVAKIA
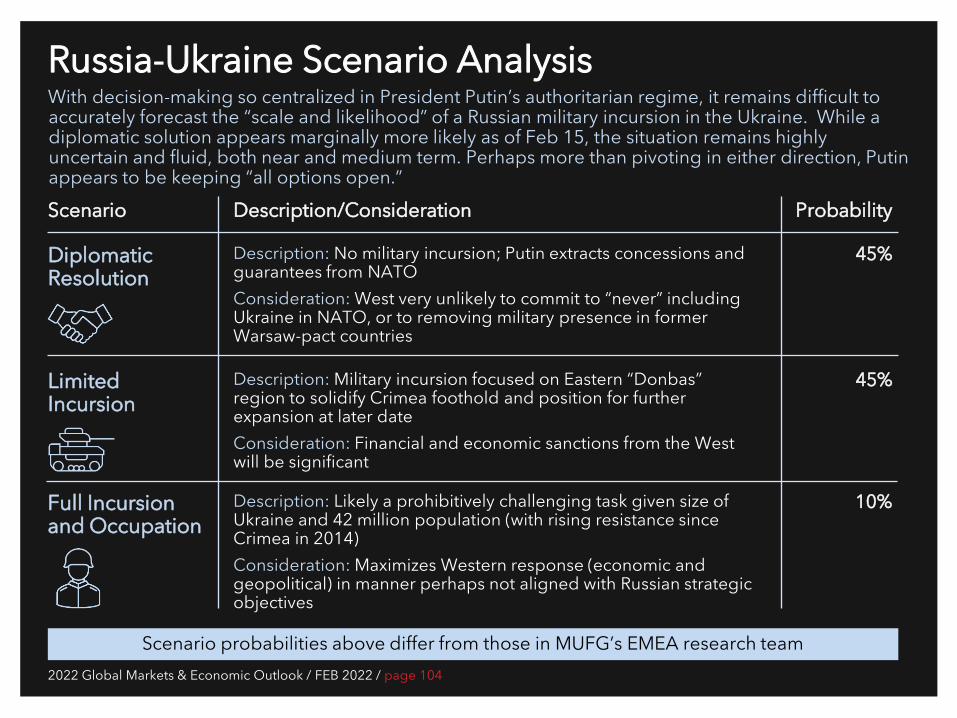
2022 Global Markets & Economic Outlook / FEB 2022 / page 104
Russia-Ukraine Scenario Analysis With decision-making so centralized in President Putin’s authoritarian regime, it remains difficult to accurately forecast the “scale and likelihood” of a Russian military incursion in the Ukraine. While a diplomatic solution appears marginally more likely as of Feb 15, the situation remains highly uncertain and fluid, both near and medium term. Perhaps more than pivoting in either direction, Putin appears to be keeping “all options open.”
Scenario Description/Consideration Probability
Limited Incursion
Description: Military incursion focused on Eastern “Donbas” region to solidify Crimea foothold and position for further expansion at later date Consideration: Financial and economic sanctions from the West will be significant
45%
Full Incursion and Occupation
Description: Likely a prohibitively challenging task given size of Ukraine and 42 million population (with rising resistance since Crimea in 2014) Consideration: Maximizes Western response (economic and geopolitical) in manner perhaps not aligned with Russian strategic objectives
10%
45%
Scenario probabilities above differ from those in MUFG’s EMEA research team
Diplomatic Resolution
Description: No military incursion; Putin extracts concessions and guarantees from NATO Consideration: West very unlikely to commit to “never” including Ukraine in NATO, or to removing military presence in former Warsaw-pact countries
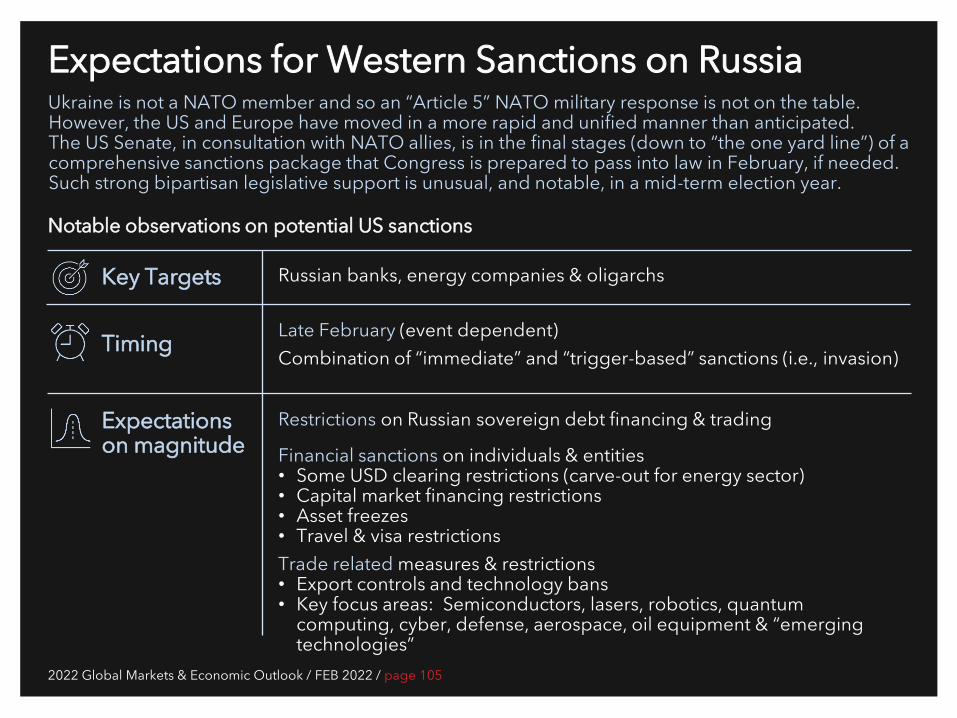
2022 Global Markets & Economic Outlook / FEB 2022 / page 105
Expectations for Western Sanctions on Russia Ukraine is not a NATO member and so an “Article 5” NATO military response is not on the table. However, the US and Europe have moved in a more rapid and unified manner than anticipated. The US Senate, in consultation with NATO allies, is in the final stages (down to “the one yard line”) of a comprehensive sanctions package that Congress is prepared to pass into law in February, if needed. Such strong bipartisan legislative support is unusual, and notable, in a mid-term election year.
Notable observations on potential US sanctions
Key Targets Russian banks, energy companies & oligarchs
Timing Late February (event dependent) Combination of “immediate” and “trigger-based” sanctions (i.e., invasion)
Expectations on magnitude
Restrictions on Russian sovereign debt financing & trading
Financial sanctions on individuals & entities • Some USD clearing restrictions (carve-out for energy sector) • Capital market financing restrictions • Asset freezes • Travel & visa restrictions Trade related measures & restrictions • Export controls and technology bans • Key focus areas: Semiconductors, lasers, robotics, quantum
computing, cyber, defense, aerospace, oil equipment & “emerging technologies”
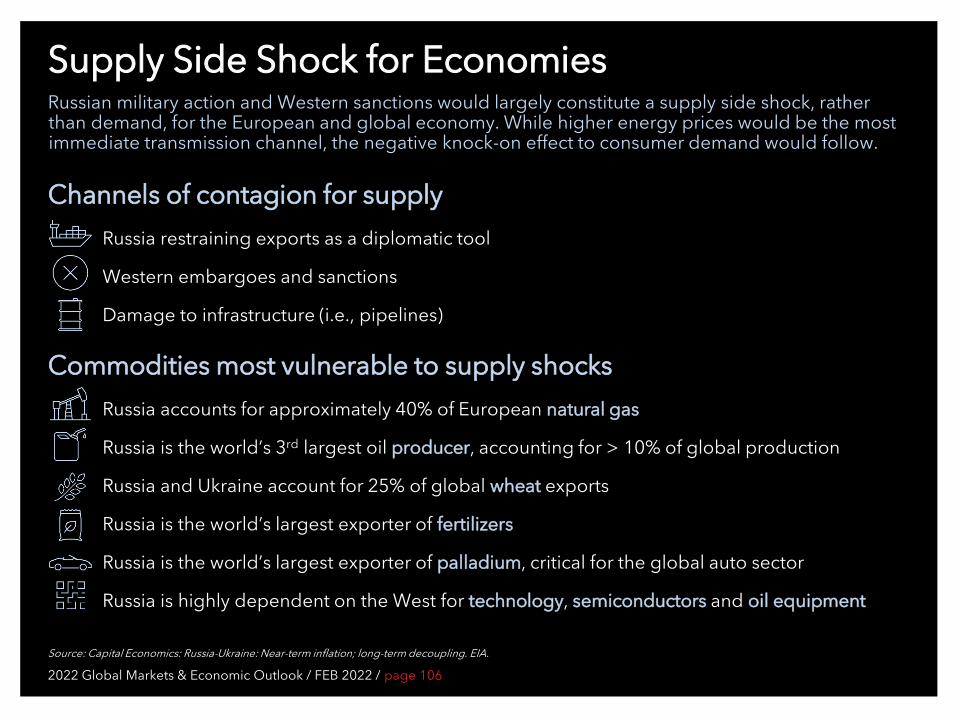
Supply Side Shock for Economies Russian military action and Western sanctions would largely constitute a supply side shock, rather than demand, for the European and global economy. While higher energy prices would be the most immediate transmission channel, the negative knock-on effect to consumer demand would follow.
Source: Capital Economics: Russia-Ukraine: Near-term inflation; long-term decoupling. EIA.
Channels of contagion for supply Russia restraining exports as a diplomatic tool
Western embargoes and sanctions
Damage to infrastructure (i.e., pipelines)
Commodities most vulnerable to supply shocks Russia accounts for approximately 40% of European natural gas
Russia is the world’s 3rd largest oil producer, accounting for > 10% of global production
Russia and Ukraine account for 25% of global wheat exports
Russia is the world’s largest exporter of fertilizers
Russia is the world’s largest exporter of palladium, critical for the global auto sector
Russia is highly dependent on the West for technology, semiconductors and oil equipment
2022 Global Markets & Economic Outlook / FEB 2022 / page 106
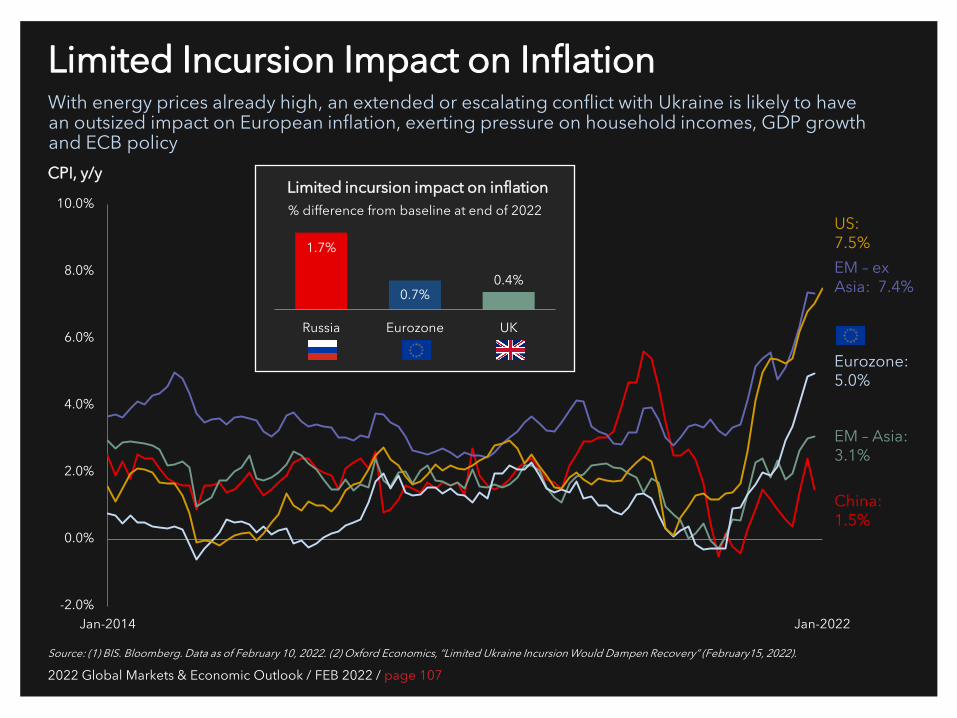
2022 Global Markets & Economic Outlook / FEB 2022 / page 107
Limited Incursion Impact on Inflation With energy prices already high, an extended or escalating conflict with Ukraine is likely to have an outsized impact on European inflation, exerting pressure on household incomes, GDP growth and ECB policy
Source: (1) BIS. Bloomberg. Data as of February 10, 2022. (2) Oxford Economics, “Limited Ukraine Incursion Would Dampen Recovery” (February15, 2022).
CPI, y/y
-2.0%
0.0%
2.0%
4.0%
6.0%
8.0%
10.0%
Jan-2014 Jan-2022
US: 7.5% EM – ex Asia: 7.4%
Eurozone: 5.0%
EM – Asia: 3.1%
China: 1.5%
Limited incursion impact on inflation % difference from baseline at end of 2022
1.7%
0.7% 0.4%
Russia Eurozone UK
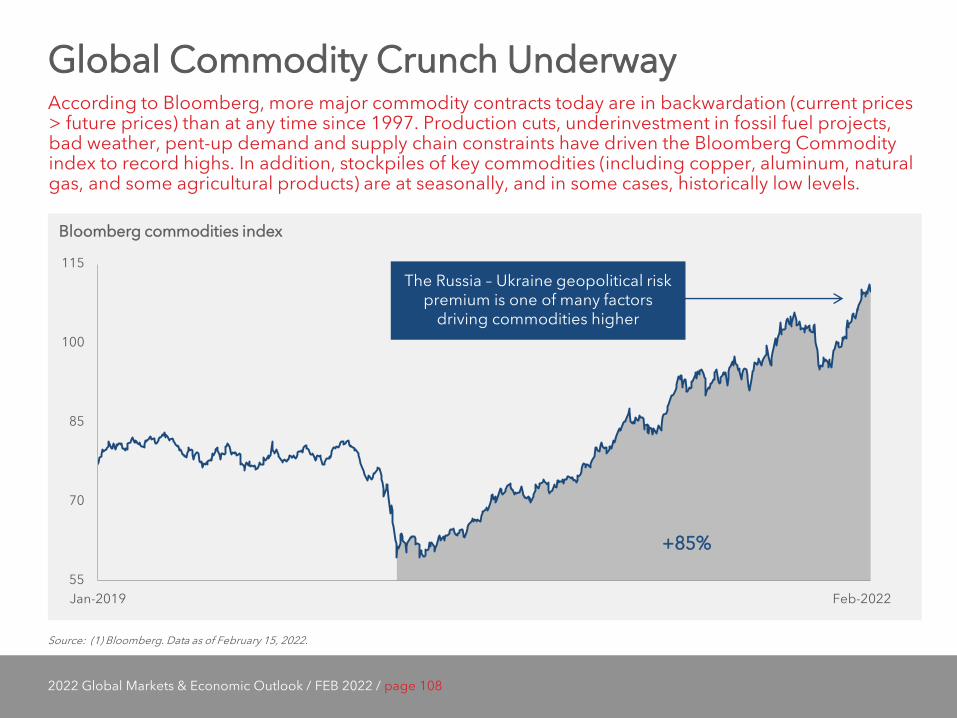
2022 Global Markets & Economic Outlook / FEB 2022 / page 108
Global Commodity Crunch Underway According to Bloomberg, more major commodity contracts today are in backwardation (current prices > future prices) than at any time since 1997. Production cuts, underinvestment in fossil fuel projects, bad weather, pent-up demand and supply chain constraints have driven the Bloomberg Commodity index to record highs. In addition, stockpiles of key commodities (including copper, aluminum, natural gas, and some agricultural products) are at seasonally, and in some cases, historically low levels.
Source: (1) Bloomberg. Data as of February 15, 2022.
Bloomberg commodities index
55
70
85
100
115
Jan-2019 Feb-2022
+85%
The Russia – Ukraine geopolitical risk premium is one of many factors
driving commodities higher
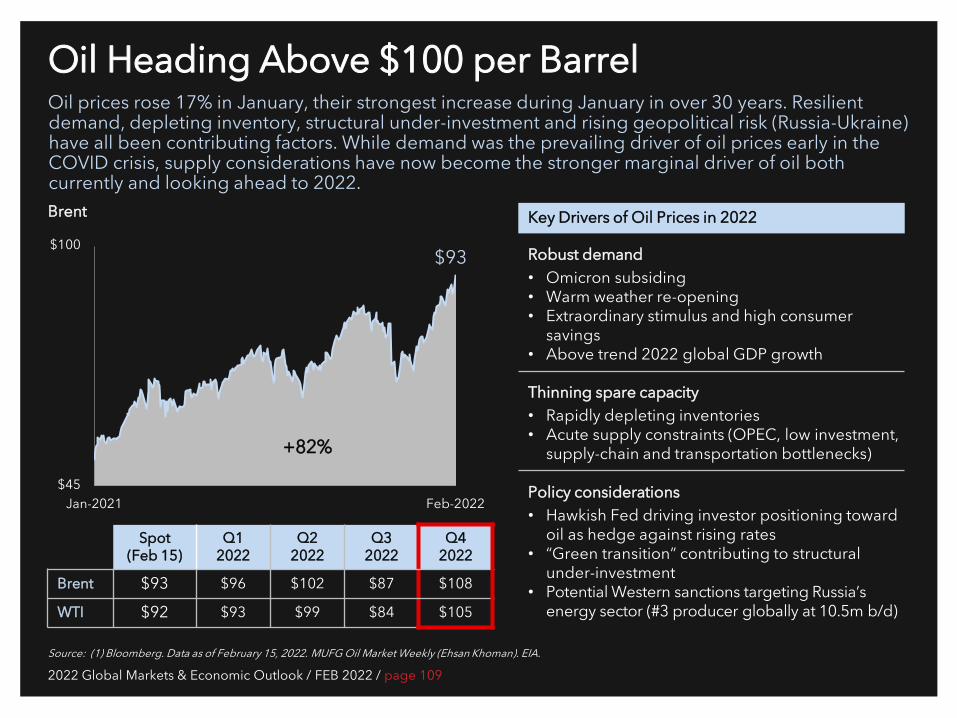
2022 Global Markets & Economic Outlook / FEB 2022 / page 109
Oil Heading Above $100 per Barrel Oil prices rose 17% in January, their strongest increase during January in over 30 years. Resilient demand, depleting inventory, structural under-investment and rising geopolitical risk (Russia-Ukraine) have all been contributing factors. While demand was the prevailing driver of oil prices early in the COVID crisis, supply considerations have now become the stronger marginal driver of oil both currently and looking ahead to 2022.
Source: (1) Bloomberg. Data as of February 15, 2022. MUFG Oil Market Weekly (Ehsan Khoman). EIA.
Brent Key Drivers of Oil Prices in 2022
Robust demand • Omicron subsiding • Warm weather re-opening • Extraordinary stimulus and high consumer
savings • Above trend 2022 global GDP growth
Thinning spare capacity • Rapidly depleting inventories • Acute supply constraints (OPEC, low investment,
supply-chain and transportation bottlenecks)
Policy considerations • Hawkish Fed driving investor positioning toward
oil as hedge against rising rates • “Green transition” contributing to structural
under-investment • Potential Western sanctions targeting Russia’s
energy sector (#3 producer globally at 10.5m b/d)
$45
$100
Jan-2021 Feb-2022
+82%
$93
Spot (Feb 15)
Q1 2022
Q2 2022
Q3 2022
Q4 2022
Brent $93 $96 $102 $87 $108
WTI $92 $93 $99 $84 $105
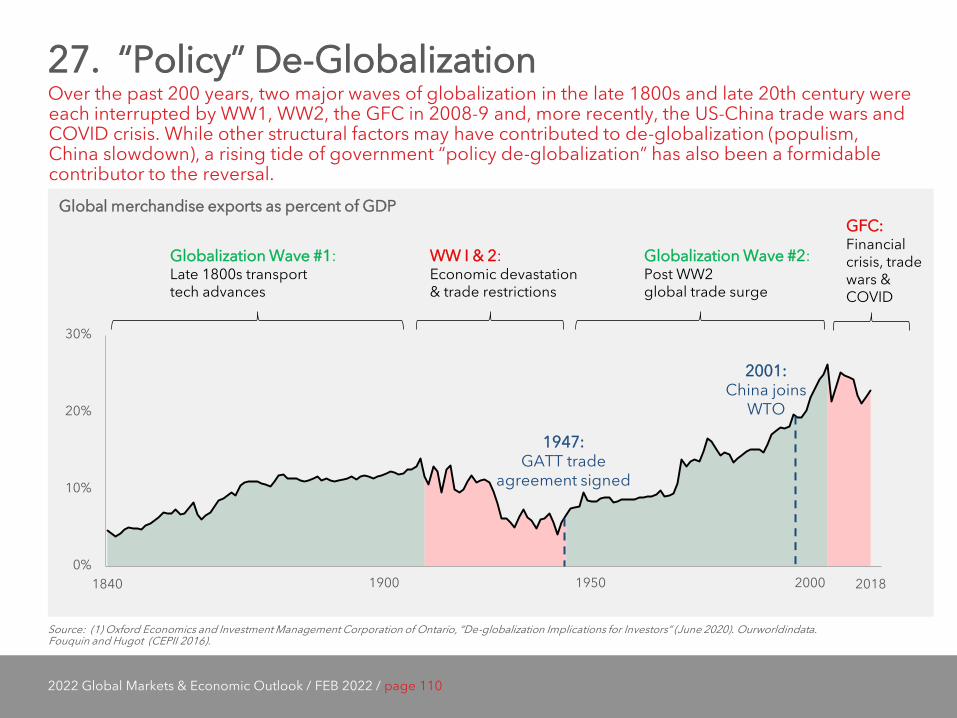
2022 Global Markets & Economic Outlook / FEB 2022 / page 110
27. “Policy” De-Globalization Over the past 200 years, two major waves of globalization in the late 1800s and late 20th century were each interrupted by WW1, WW2, the GFC in 2008-9 and, more recently, the US-China trade wars and COVID crisis. While other structural factors may have contributed to de-globalization (populism, China slowdown), a rising tide of government “policy de-globalization” has also been a formidable contributor to the reversal.
Source: (1) Oxford Economics and Investment Management Corporation of Ontario, “De-globalization Implications for Investors” (June 2020). Ourworldindata. Fouquin and Hugot (CEPII 2016).
Global merchandise exports as percent of GDP
Globalization Wave #1: Late 1800s transport tech advances
WW I & 2: Economic devastation & trade restrictions
Globalization Wave #2: Post WW2 global trade surge
GFC: Financial crisis, trade wars & COVID
1947: GATT trade
agreement signed
0%
10%
20%
30%
1840 2018
2001: China joins
WTO
1900 1950 2000
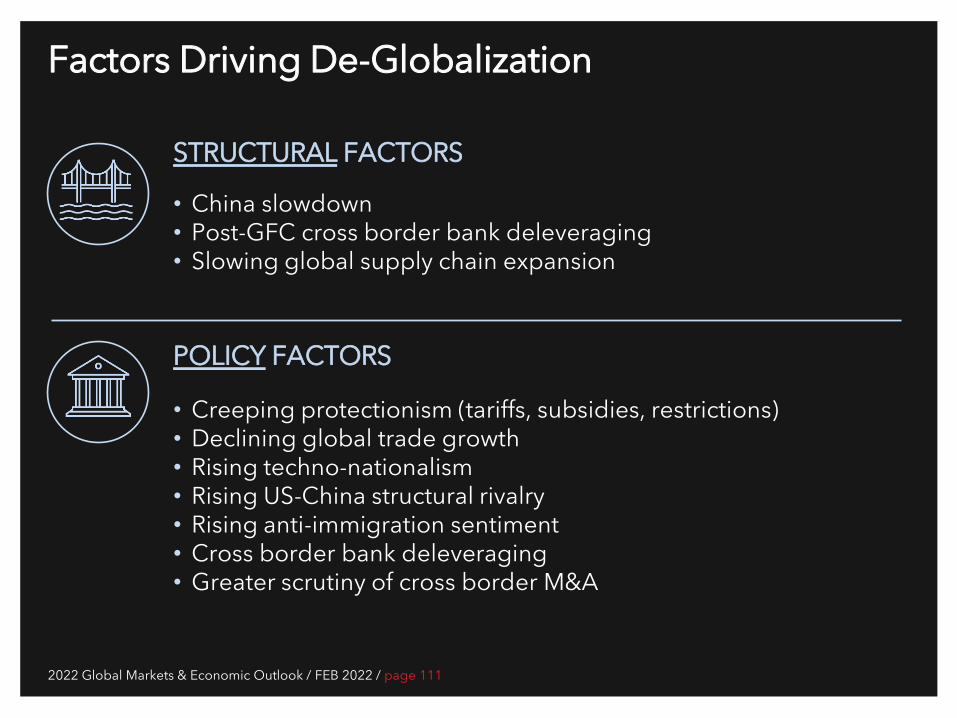
2022 Global Markets & Economic Outlook / FEB 2022 / page 111
Factors Driving De-Globalization
STRUCTURAL FACTORS
• China slowdown • Post-GFC cross border bank deleveraging • Slowing global supply chain expansion
POLICY FACTORS
• Creeping protectionism (tariffs, subsidies, restrictions) • Declining global trade growth • Rising techno-nationalism • Rising US-China structural rivalry • Rising anti-immigration sentiment • Cross border bank deleveraging • Greater scrutiny of cross border M&A
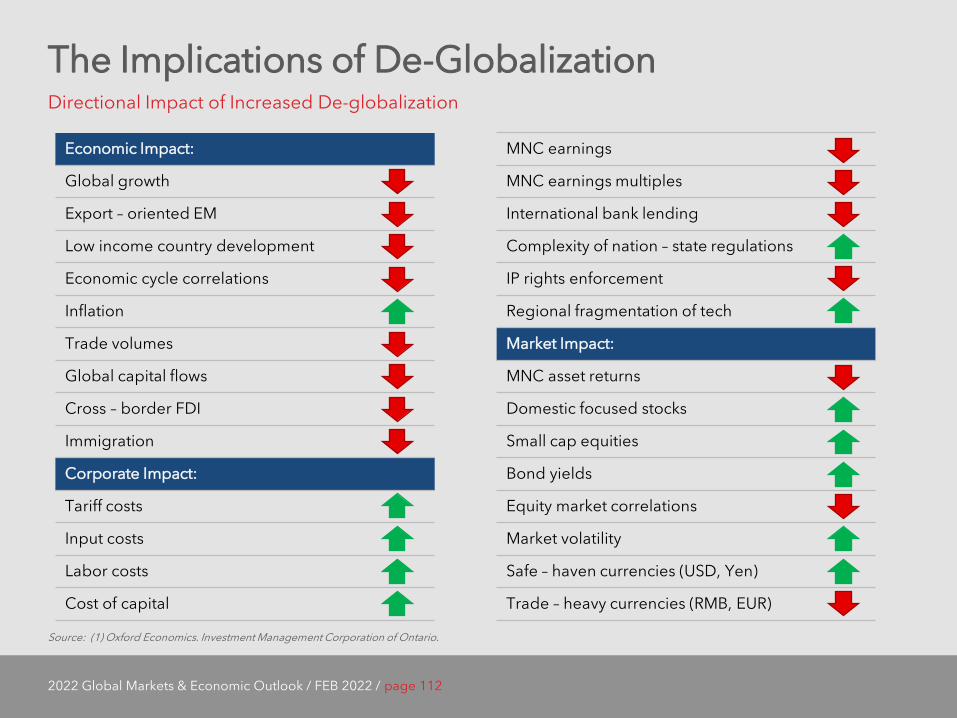
2022 Global Markets & Economic Outlook / FEB 2022 / page 112
The Implications of De-Globalization Directional Impact of Increased De-globalization
Source: (1) Oxford Economics. Investment Management Corporation of Ontario.
Economic Impact:
Global growth
Export – oriented EM
Low income country development
Economic cycle correlations
Inflation
Trade volumes
Global capital flows
Cross – border FDI
Immigration
Corporate Impact:
Tariff costs
Input costs
Labor costs
Cost of capital
MNC earnings
MNC earnings multiples
International bank lending
Complexity of nation – state regulations
IP rights enforcement
Regional fragmentation of tech
Market Impact:
MNC asset returns
Domestic focused stocks
Small cap equities
Bond yields
Equity market correlations
Market volatility
Safe – haven currencies (USD, Yen)
Trade – heavy currencies (RMB, EUR)
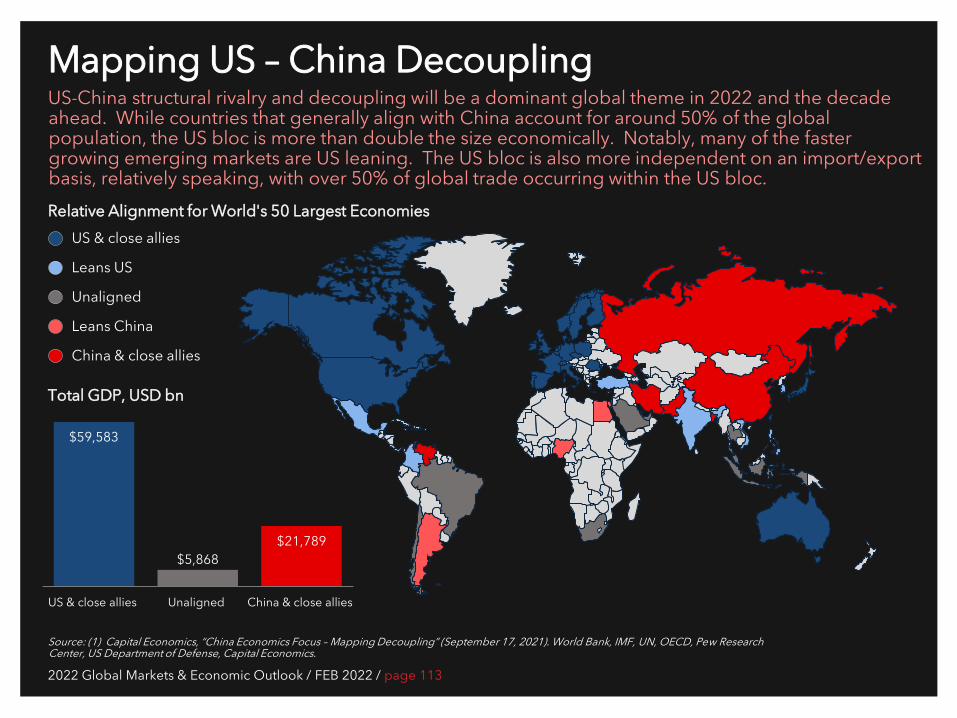
2022 Global Markets & Economic Outlook / FEB 2022 / page 113
$59,583
$5,868 $21,789
US & close allies Unaligned China & close allies
Mapping US – China Decoupling US-China structural rivalry and decoupling will be a dominant global theme in 2022 and the decade ahead. While countries that generally align with China account for around 50% of the global population, the US bloc is more than double the size economically. Notably, many of the faster growing emerging markets are US leaning. The US bloc is also more independent on an import/export basis, relatively speaking, with over 50% of global trade occurring within the US bloc.
Source: (1) Capital Economics, “China Economics Focus – Mapping Decoupling” (September 17, 2021). World Bank, IMF, UN, OECD, Pew Research Center, US Department of Defense, Capital Economics.
US & close allies
Leans US
Unaligned
Leans China
China & close allies
Total GDP, USD bn
Relative Alignment for World's 50 Largest Economies

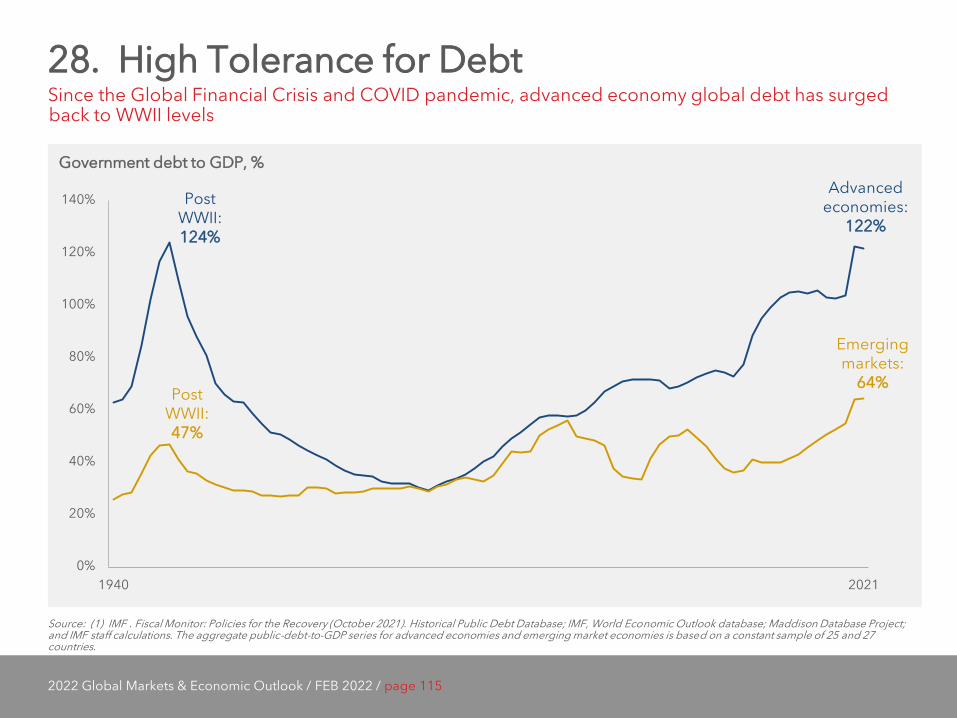
2022 Global Markets & Economic Outlook / FEB 2022 / page 115
28. High Tolerance for Debt Since the Global Financial Crisis and COVID pandemic, advanced economy global debt has surged back to WWII levels
Source: (1) IMF . Fiscal Monitor: Policies for the Recovery (October 2021). Historical Public Debt Database; IMF, World Economic Outlook database; Maddison Database Project; and IMF staff calculations. The aggregate public-debt-to-GDP series for advanced economies and emerging market economies is based on a constant sample of 25 and 27 countries.
Government debt to GDP, %
0%
20%
40%
60%
80%
100%
120%
140%
1940 2021
Post WWII: 124%
Post WWII: 47%
Advanced economies:
122%
Emerging markets:
64%
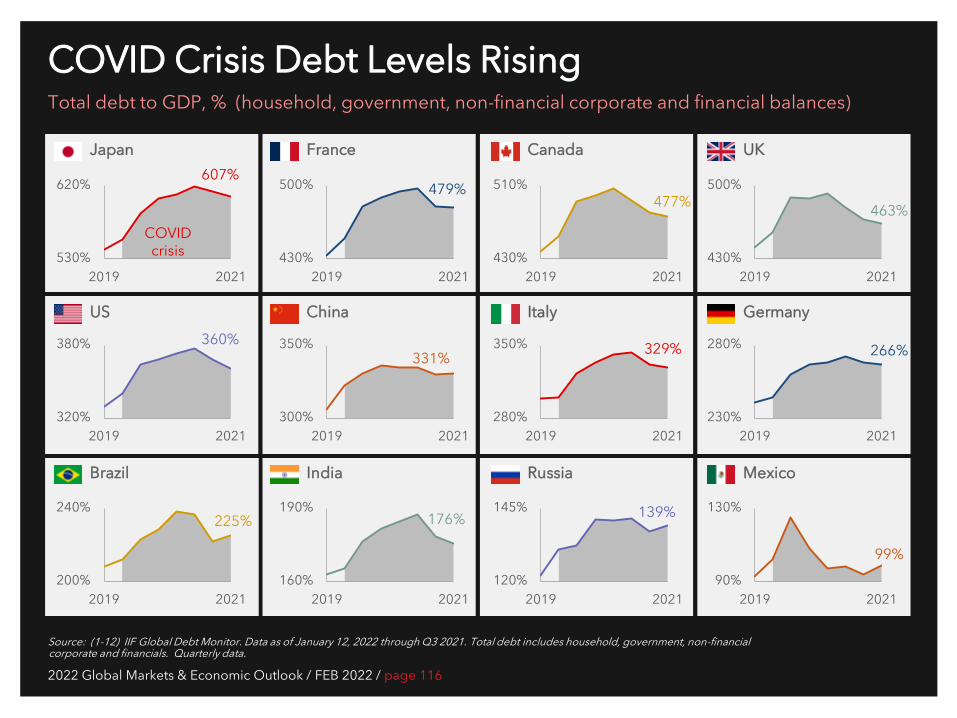
2022 Global Markets & Economic Outlook / FEB 2022 / page 116
530%
620%
2019 2021430%
500%
2019 2021430%
500%
2019 2021430%
510%
2019 2021
320%
380%
2019 2021280%
350%
2019 2021230%
280%
2019 2021
200%
240%
2019 2021160%
190%
2019 2021120%
145%
2019 202190%
130%
2019 2021
300%
350%
2019 2021
COVID Crisis Debt Levels Rising Total debt to GDP, % (household, government, non-financial corporate and financial balances)
Source: (1-12) IIF Global Debt Monitor. Data as of January 12, 2022 through Q3 2021. Total debt includes household, government, non-financial corporate and financials. Quarterly data.
Japan France Canada UK
US China Italy Germany
Brazil India Russia Mexico
607% 479%
477% 463%
360% 331% 329% 266%
225% 176% 139%
99%
COVID crisis
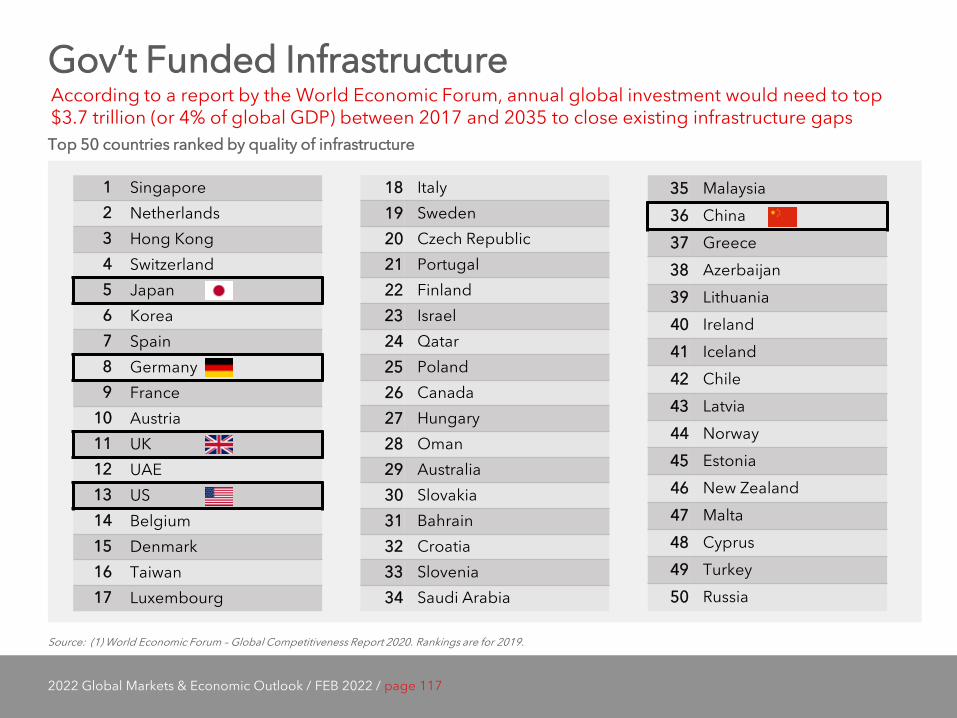
2022 Global Markets & Economic Outlook / FEB 2022 / page 117
Gov’t Funded Infrastructure
Source: (1) World Economic Forum – Global Competitiveness Report 2020. Rankings are for 2019.
1 Singapore 2 Netherlands 3 Hong Kong 4 Switzerland 5 Japan 6 Korea 7 Spain 8 Germany 9 France
10 Austria 11 UK 12 UAE 13 US 14 Belgium 15 Denmark 16 Taiwan 17 Luxembourg
18 Italy 19 Sweden 20 Czech Republic 21 Portugal 22 Finland 23 Israel 24 Qatar 25 Poland 26 Canada 27 Hungary 28 Oman 29 Australia 30 Slovakia 31 Bahrain 32 Croatia 33 Slovenia 34 Saudi Arabia
35 Malaysia 36 China
37 Greece 38 Azerbaijan 39 Lithuania 40 Ireland 41 Iceland 42 Chile 43 Latvia
44 Norway 45 Estonia 46 New Zealand 47 Malta
48 Cyprus 49 Turkey 50 Russia
Top 50 countries ranked by quality of infrastructure
According to a report by the World Economic Forum, annual global investment would need to top $3.7 trillion (or 4% of global GDP) between 2017 and 2035 to close existing infrastructure gaps
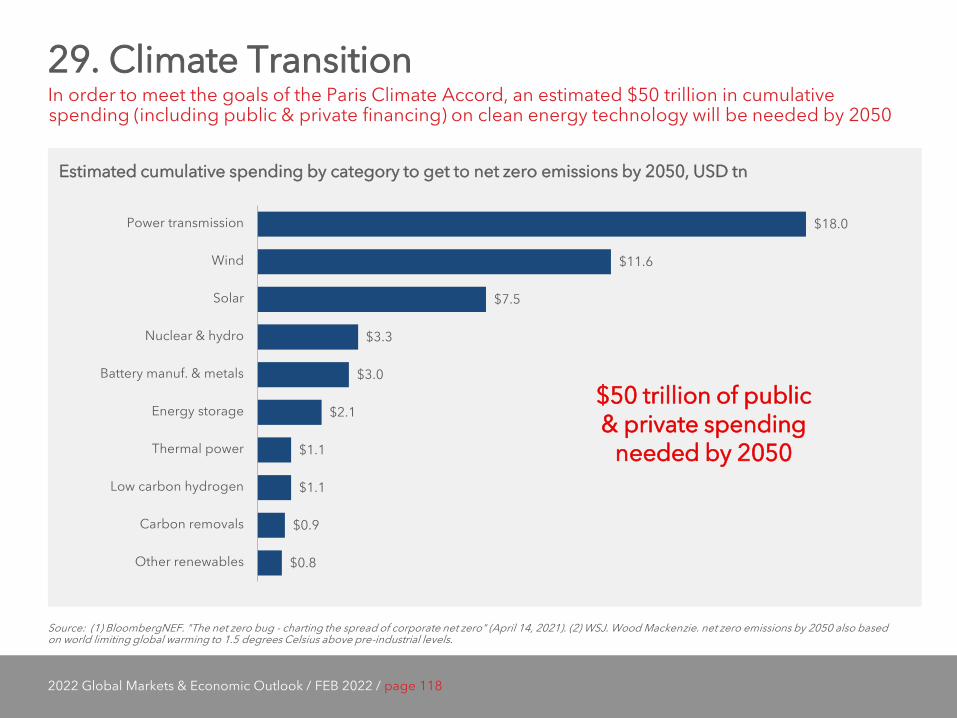
2022 Global Markets & Economic Outlook / FEB 2022 / page 118
29. Climate Transition In order to meet the goals of the Paris Climate Accord, an estimated $50 trillion in cumulative spending (including public & private financing) on clean energy technology will be needed by 2050
Source: (1) BloombergNEF. "The net zero bug - charting the spread of corporate net zero" (April 14, 2021). (2) WSJ. Wood Mackenzie. net zero emissions by 2050 also based on world limiting global warming to 1.5 degrees Celsius above pre-industrial levels.
Estimated cumulative spending by category to get to net zero emissions by 2050, USD tn
$18.0
$11.6
$7.5
$3.3
$3.0
$2.1
$1.1
$1.1
$0.9
$0.8
Power transmission
Wind
Solar
Nuclear & hydro
Battery manuf. & metals
Energy storage
Thermal power
Low carbon hydrogen
Carbon removals
Other renewables
$50 trillion of public & private spending
needed by 2050
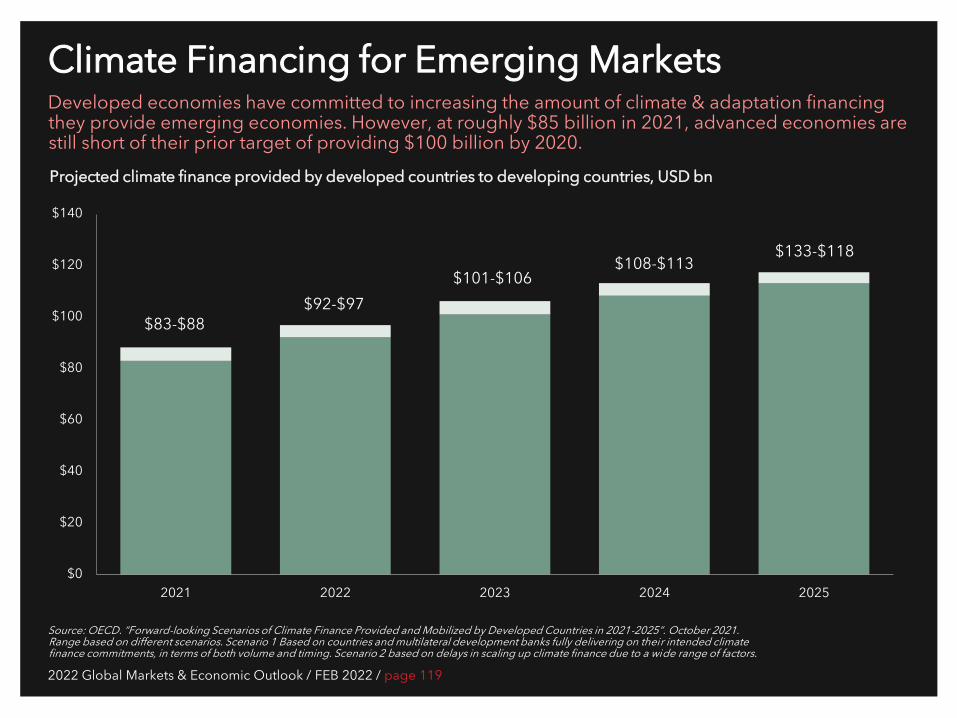
2022 Global Markets & Economic Outlook / FEB 2022 / page 119
Climate Financing for Emerging Markets Developed economies have committed to increasing the amount of climate & adaptation financing they provide emerging economies. However, at roughly $85 billion in 2021, advanced economies are still short of their prior target of providing $100 billion by 2020.
Source: OECD. “Forward-looking Scenarios of Climate Finance Provided and Mobilized by Developed Countries in 2021-2025”. October 2021. Range based on different scenarios. Scenario 1 Based on countries and multilateral development banks fully delivering on their intended climate finance commitments, in terms of both volume and timing. Scenario 2 based on delays in scaling up climate finance due to a wide range of factors.
Projected climate finance provided by developed countries to developing countries, USD bn
$0
$20
$40
$60
$80
$100
$120
$140
2021 2022 2023 2024 2025
$83-$88 $92-$97
$101-$106 $108-$113
$133-$118
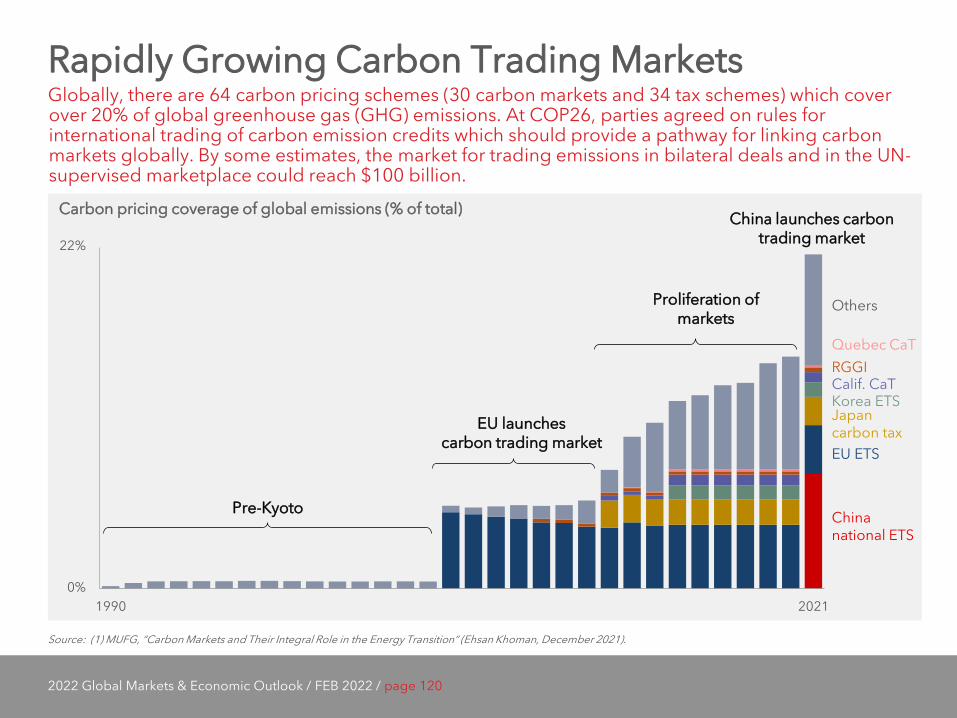
2022 Global Markets & Economic Outlook / FEB 2022 / page 120
Rapidly Growing Carbon Trading Markets Globally, there are 64 carbon pricing schemes (30 carbon markets and 34 tax schemes) which cover over 20% of global greenhouse gas (GHG) emissions. At COP26, parties agreed on rules for international trading of carbon emission credits which should provide a pathway for linking carbon markets globally. By some estimates, the market for trading emissions in bilateral deals and in the UN-supervised marketplace could reach $100 billion.
Source: (1) MUFG, “Carbon Markets and Their Integral Role in the Energy Transition” (Ehsan Khoman, December 2021).
Carbon pricing coverage of global emissions (% of total)
0%
22%
1990 2021
China national ETS
EU ETS
Japan carbon tax
Korea ETS Calif. CaT RGGI Quebec CaT
Others
Pre-Kyoto
EU launches carbon trading market
Proliferation of markets
China launches carbon trading market
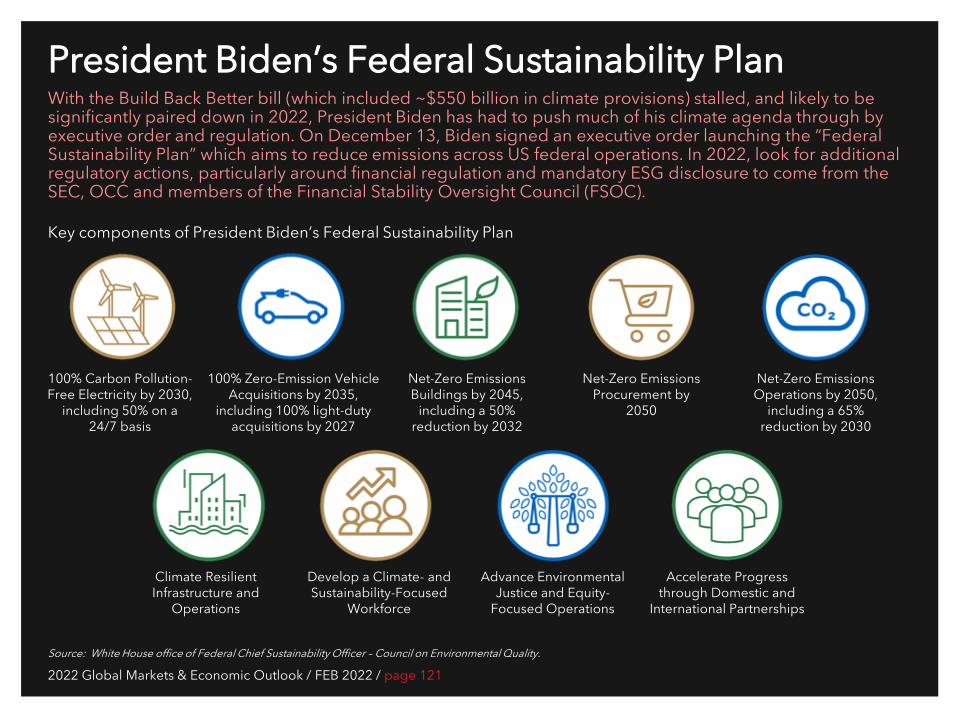
2022 Global Markets & Economic Outlook / FEB 2022 / page 121
President Biden’s Federal Sustainability Plan With the Build Back Better bill (which included ~$550 billion in climate provisions) stalled, and likely to be significantly paired down in 2022, President Biden has had to push much of his climate agenda through by executive order and regulation. On December 13, Biden signed an executive order launching the “Federal Sustainability Plan” which aims to reduce emissions across US federal operations. In 2022, look for additional regulatory actions, particularly around financial regulation and mandatory ESG disclosure to come from the SEC, OCC and members of the Financial Stability Oversight Council (FSOC).
Source: White House office of Federal Chief Sustainability Officer – Council on Environmental Quality.
Key components of President Biden’s Federal Sustainability Plan
100% Carbon Pollution-Free Electricity by 2030,
including 50% on a 24/7 basis
100% Zero-Emission Vehicle Acquisitions by 2035,
including 100% light-duty acquisitions by 2027
Net-Zero Emissions Buildings by 2045,
including a 50% reduction by 2032
Net-Zero Emissions Procurement by
2050
Net-Zero Emissions Operations by 2050,
including a 65% reduction by 2030
Climate Resilient Infrastructure and
Operations
Develop a Climate- and Sustainability-Focused
Workforce
Advance Environmental Justice and Equity-
Focused Operations
Accelerate Progress through Domestic and
International Partnerships

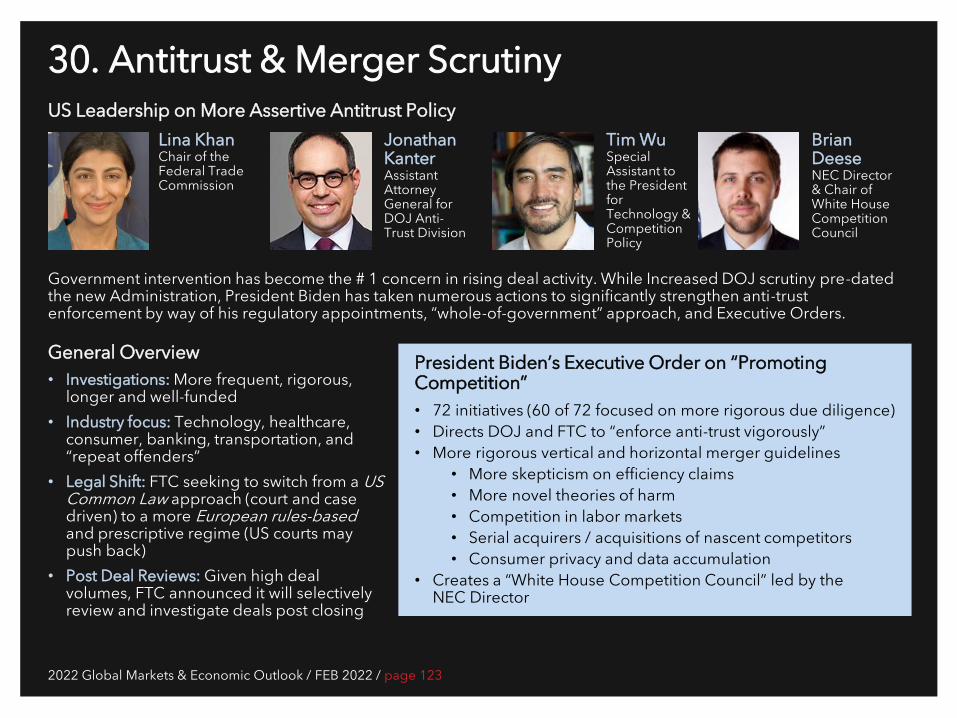
2022 Global Markets & Economic Outlook / FEB 2022 / page 123
30. Antitrust & Merger Scrutiny US Leadership on More Assertive Antitrust Policy
Lina Khan Chair of the Federal Trade Commission
Jonathan Kanter Assistant Attorney General for DOJ Anti-Trust Division
Tim Wu Special Assistant to the President for Technology & Competition Policy
Brian Deese NEC Director & Chair of White House Competition Council
Government intervention has become the # 1 concern in rising deal activity. While Increased DOJ scrutiny pre-dated the new Administration, President Biden has taken numerous actions to significantly strengthen anti-trust enforcement by way of his regulatory appointments, “whole-of-government” approach, and Executive Orders.
General Overview • Investigations: More frequent, rigorous,
longer and well-funded • Industry focus: Technology, healthcare,
consumer, banking, transportation, and “repeat offenders”
• Legal Shift: FTC seeking to switch from a US Common Law approach (court and case driven) to a more European rules-based and prescriptive regime (US courts may push back)
• Post Deal Reviews: Given high deal volumes, FTC announced it will selectively review and investigate deals post closing
President Biden’s Executive Order on “Promoting Competition” • 72 initiatives (60 of 72 focused on more rigorous due diligence) • Directs DOJ and FTC to “enforce anti-trust vigorously” • More rigorous vertical and horizontal merger guidelines
• More skepticism on efficiency claims • More novel theories of harm • Competition in labor markets • Serial acquirers / acquisitions of nascent competitors • Consumer privacy and data accumulation
• Creates a “White House Competition Council” led by the NEC Director
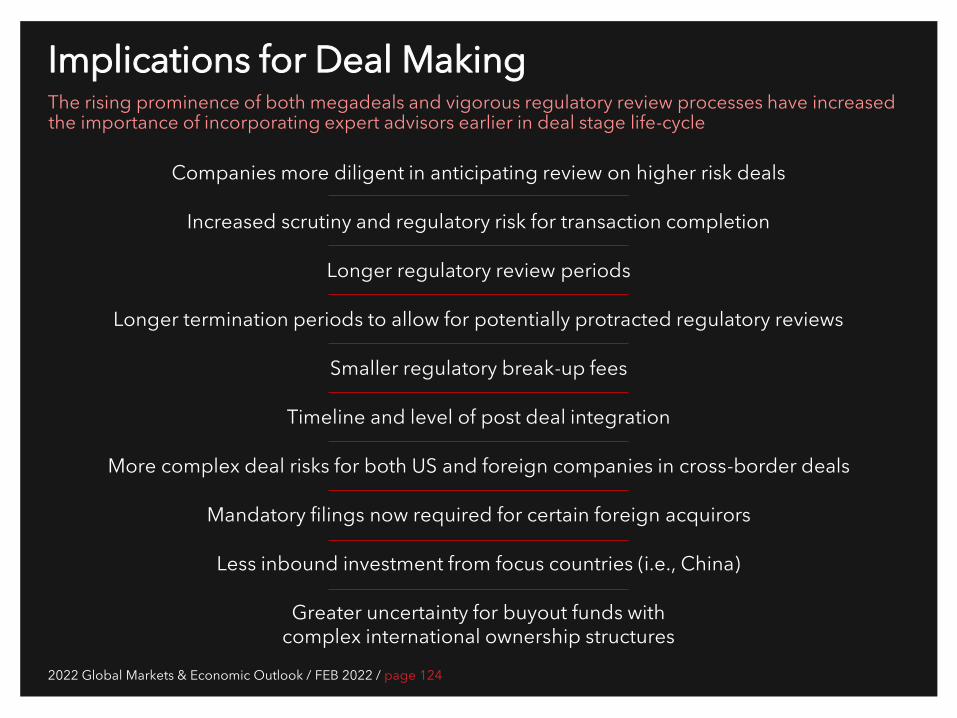
2022 Global Markets & Economic Outlook / FEB 2022 / page 124
Implications for Deal Making The rising prominence of both megadeals and vigorous regulatory review processes have increased the importance of incorporating expert advisors earlier in deal stage life-cycle
Companies more diligent in anticipating review on higher risk deals
Increased scrutiny and regulatory risk for transaction completion
Longer regulatory review periods
Longer termination periods to allow for potentially protracted regulatory reviews
Smaller regulatory break-up fees
Timeline and level of post deal integration
More complex deal risks for both US and foreign companies in cross-border deals
Mandatory filings now required for certain foreign acquirors
Less inbound investment from focus countries (i.e., China)
Greater uncertainty for buyout funds with complex international ownership structures
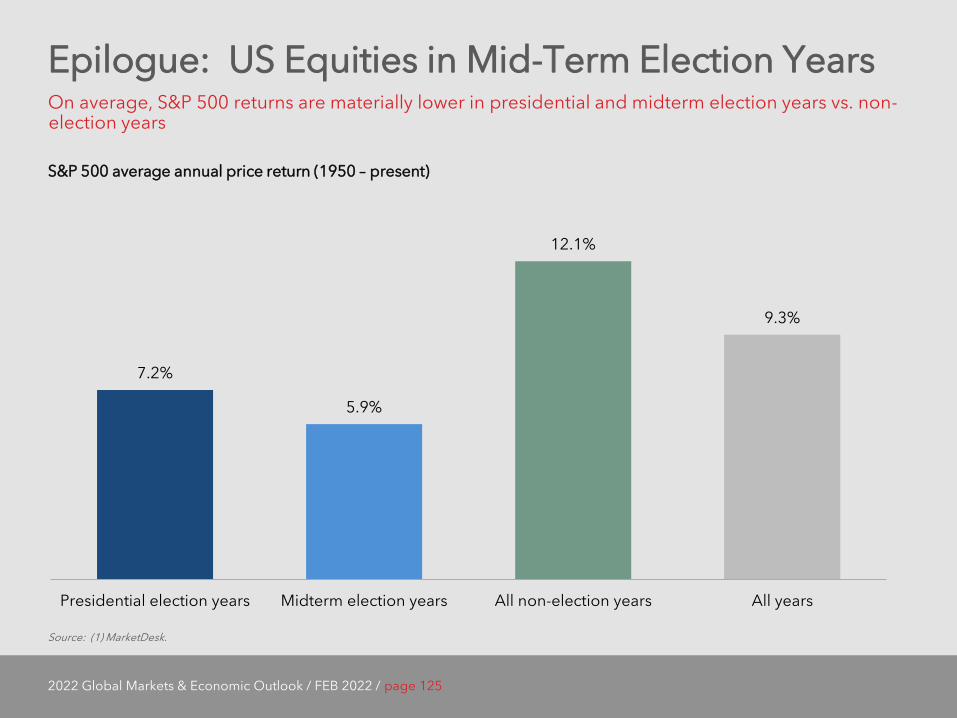
2022 Global Markets & Economic Outlook / FEB 2022 / page 125
Epilogue: US Equities in Mid-Term Election Years On average, S&P 500 returns are materially lower in presidential and midterm election years vs. non-election years
Source: (1) MarketDesk.
S&P 500 average annual price return (1950 – present)
7.2%
5.9%
12.1%
9.3%
Presidential election years Midterm election years All non-election years All years
Appendix:
2021: In Memoriam

2022 Global Markets & Economic Outlook / FEB 2022 / page 127
In memory of the
5 MILLION +
2022 Global Markets & Economic Outlook / FEB 2022 / page 127
COVID-19 fatalities.
More people in the world died of COVID in 2021 (> 3 million) than in 2020 (2 million)
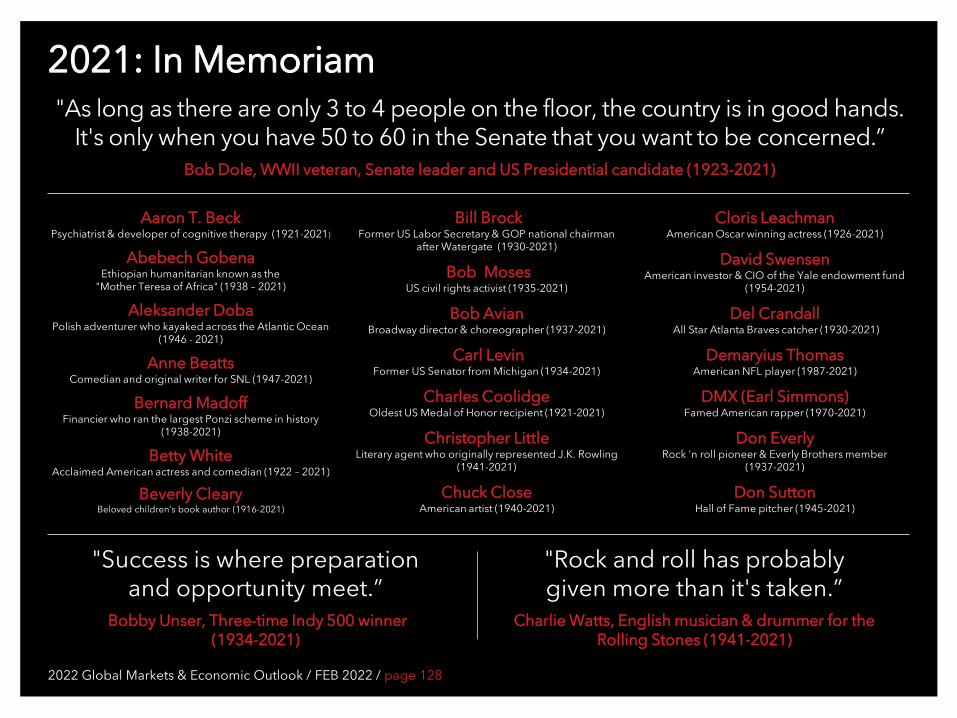
2022 Global Markets & Economic Outlook / FEB 2022 / page 128
2021: In Memoriam "As long as there are only 3 to 4 people on the floor, the country is in good hands.
It's only when you have 50 to 60 in the Senate that you want to be concerned.” Bob Dole, WWII veteran, Senate leader and US Presidential candidate (1923-2021)
Aaron T. Beck Psychiatrist & developer of cognitive therapy (1921-2021)
Abebech Gobena Ethiopian humanitarian known as the
"Mother Teresa of Africa" (1938 – 2021)
Aleksander Doba Polish adventurer who kayaked across the Atlantic Ocean
(1946 - 2021)
Anne Beatts Comedian and original writer for SNL (1947-2021)
Bernard Madoff Financier who ran the largest Ponzi scheme in history
(1938-2021)
Betty White Acclaimed American actress and comedian (1922 – 2021)
Beverly Cleary Beloved children’s book author (1916-2021)
Bill Brock Former US Labor Secretary & GOP national chairman
after Watergate (1930-2021)
Bob Moses US civil rights activist (1935-2021)
Bob Avian Broadway director & choreographer (1937-2021)
Carl Levin Former US Senator from Michigan (1934-2021)
Charles Coolidge Oldest US Medal of Honor recipient (1921-2021)
Christopher Little Literary agent who originally represented J.K. Rowling
(1941-2021)
Chuck Close American artist (1940-2021)
"Success is where preparation and opportunity meet.”
Bobby Unser, Three-time Indy 500 winner (1934-2021)
Cloris Leachman American Oscar winning actress (1926-2021)
David Swensen American investor & CIO of the Yale endowment fund
(1954-2021)
Del Crandall All Star Atlanta Braves catcher (1930-2021)
Demaryius Thomas American NFL player (1987-2021)
DMX (Earl Simmons) Famed American rapper (1970-2021)
Don Everly Rock 'n roll pioneer & Everly Brothers member
(1937-2021)
Don Sutton Hall of Fame pitcher (1945-2021)
"Rock and roll has probably given more than it's taken.”
Charlie Watts, English musician & drummer for the Rolling Stones (1941-2021)
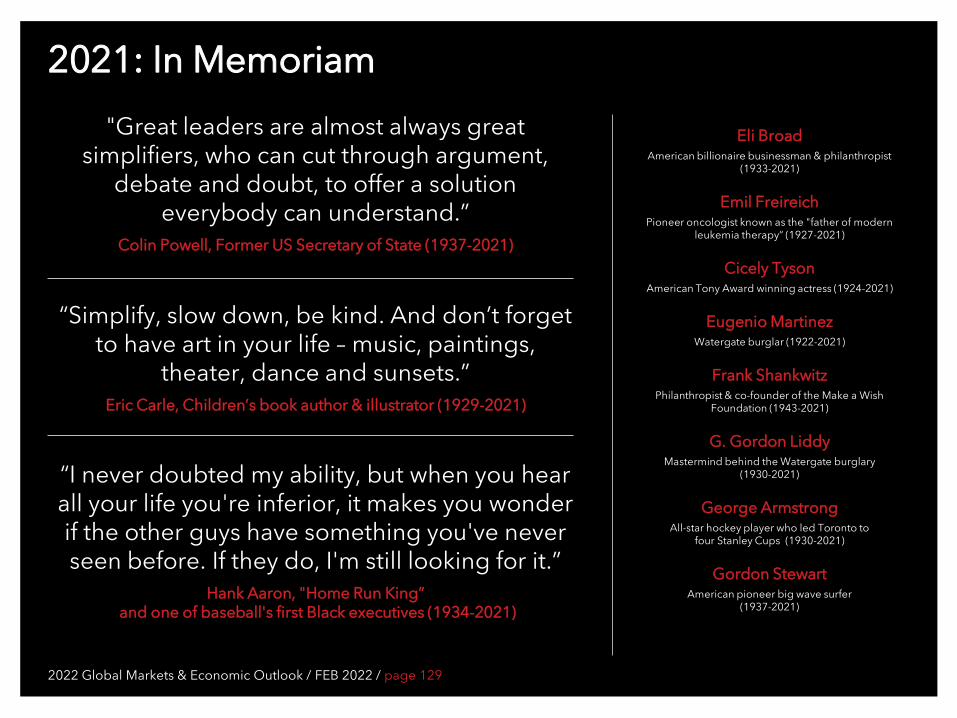
2022 Global Markets & Economic Outlook / FEB 2022 / page 129
2021: In Memoriam
Eli Broad American billionaire businessman & philanthropist
(1933-2021)
Emil Freireich Pioneer oncologist known as the "father of modern
leukemia therapy“ (1927-2021)
Cicely Tyson American Tony Award winning actress (1924-2021)
Eugenio Martinez Watergate burglar (1922-2021)
Frank Shankwitz Philanthropist & co-founder of the Make a Wish
Foundation (1943-2021)
G. Gordon Liddy Mastermind behind the Watergate burglary
(1930-2021)
George Armstrong All-star hockey player who led Toronto to
four Stanley Cups (1930-2021)
Gordon Stewart American pioneer big wave surfer
(1937-2021)
“I never doubted my ability, but when you hear all your life you're inferior, it makes you wonder if the other guys have something you've never seen before. If they do, I'm still looking for it.”
Hank Aaron, "Home Run King” and one of baseball's first Black executives (1934-2021)
“Simplify, slow down, be kind. And don’t forget to have art in your life – music, paintings,
theater, dance and sunsets.” Eric Carle, Children’s book author & illustrator (1929-2021)
"Great leaders are almost always great simplifiers, who can cut through argument,
debate and doubt, to offer a solution everybody can understand.”
Colin Powell, Former US Secretary of State (1937-2021)
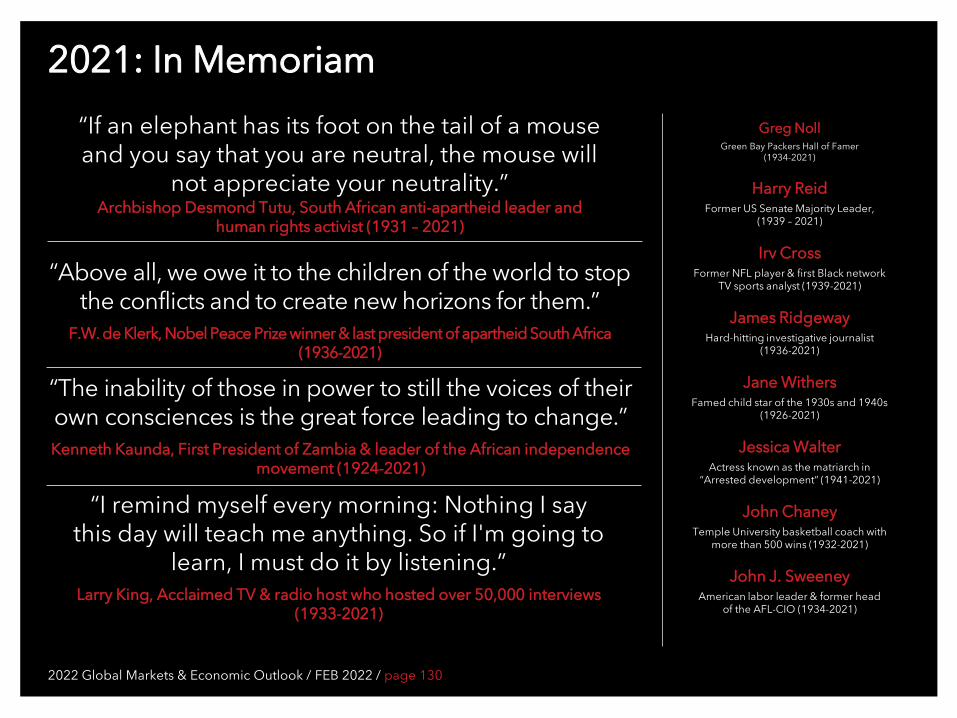
2022 Global Markets & Economic Outlook / FEB 2022 / page 130
2021: In Memoriam
“Above all, we owe it to the children of the world to stop the conflicts and to create new horizons for them.”
F.W. de Klerk, Nobel Peace Prize winner & last president of apartheid South Africa (1936-2021)
Greg Noll Green Bay Packers Hall of Famer
(1934-2021)
Harry Reid Former US Senate Majority Leader,
(1939 – 2021)
Irv Cross Former NFL player & first Black network
TV sports analyst (1939-2021)
James Ridgeway Hard-hitting investigative journalist
(1936-2021)
Jane Withers Famed child star of the 1930s and 1940s
(1926-2021)
Jessica Walter Actress known as the matriarch in
“Arrested development” (1941-2021)
John Chaney Temple University basketball coach with
more than 500 wins (1932-2021)
John J. Sweeney American labor leader & former head
of the AFL-CIO (1934-2021)
“I remind myself every morning: Nothing I say this day will teach me anything. So if I'm going to
learn, I must do it by listening.” Larry King, Acclaimed TV & radio host who hosted over 50,000 interviews
(1933-2021)
“If an elephant has its foot on the tail of a mouse and you say that you are neutral, the mouse will
not appreciate your neutrality.” Archbishop Desmond Tutu, South African anti-apartheid leader and
human rights activist (1931 – 2021)
“The inability of those in power to still the voices of their own consciences is the great force leading to change.” Kenneth Kaunda, First President of Zambia & leader of the African independence
movement (1924-2021)
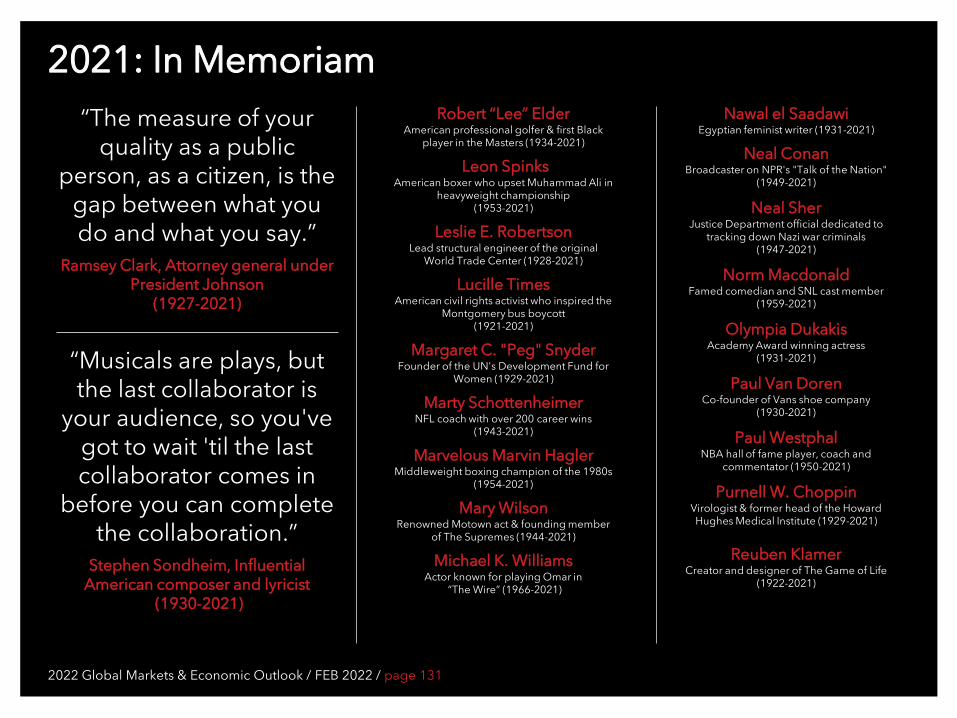
2022 Global Markets & Economic Outlook / FEB 2022 / page 131
2021: In Memoriam
“Musicals are plays, but the last collaborator is
your audience, so you've got to wait 'til the last collaborator comes in
before you can complete the collaboration.”
Stephen Sondheim, Influential American composer and lyricist
(1930-2021)
Robert “Lee” Elder American professional golfer & first Black
player in the Masters (1934-2021)
Leon Spinks American boxer who upset Muhammad Ali in
heavyweight championship (1953-2021)
Leslie E. Robertson Lead structural engineer of the original
World Trade Center (1928-2021)
Lucille Times American civil rights activist who inspired the
Montgomery bus boycott (1921-2021)
Margaret C. "Peg" Snyder Founder of the UN's Development Fund for
Women (1929-2021)
Marty Schottenheimer NFL coach with over 200 career wins
(1943-2021)
Marvelous Marvin Hagler Middleweight boxing champion of the 1980s
(1954-2021)
Mary Wilson Renowned Motown act & founding member
of The Supremes (1944-2021)
Michael K. Williams Actor known for playing Omar in
“The Wire” (1966-2021)
“The measure of your quality as a public
person, as a citizen, is the gap between what you do and what you say.”
Ramsey Clark, Attorney general under President Johnson
(1927-2021)
Nawal el Saadawi Egyptian feminist writer (1931-2021)
Neal Conan Broadcaster on NPR's "Talk of the Nation"
(1949-2021)
Neal Sher Justice Department official dedicated to
tracking down Nazi war criminals (1947-2021)
Norm Macdonald Famed comedian and SNL cast member
(1959-2021)
Olympia Dukakis Academy Award winning actress
(1931-2021)
Paul Van Doren Co-founder of Vans shoe company
(1930-2021)
Paul Westphal NBA hall of fame player, coach and
commentator (1950-2021)
Purnell W. Choppin Virologist & former head of the Howard Hughes Medical Institute (1929-2021)
Reuben Klamer Creator and designer of The Game of Life
(1922-2021)
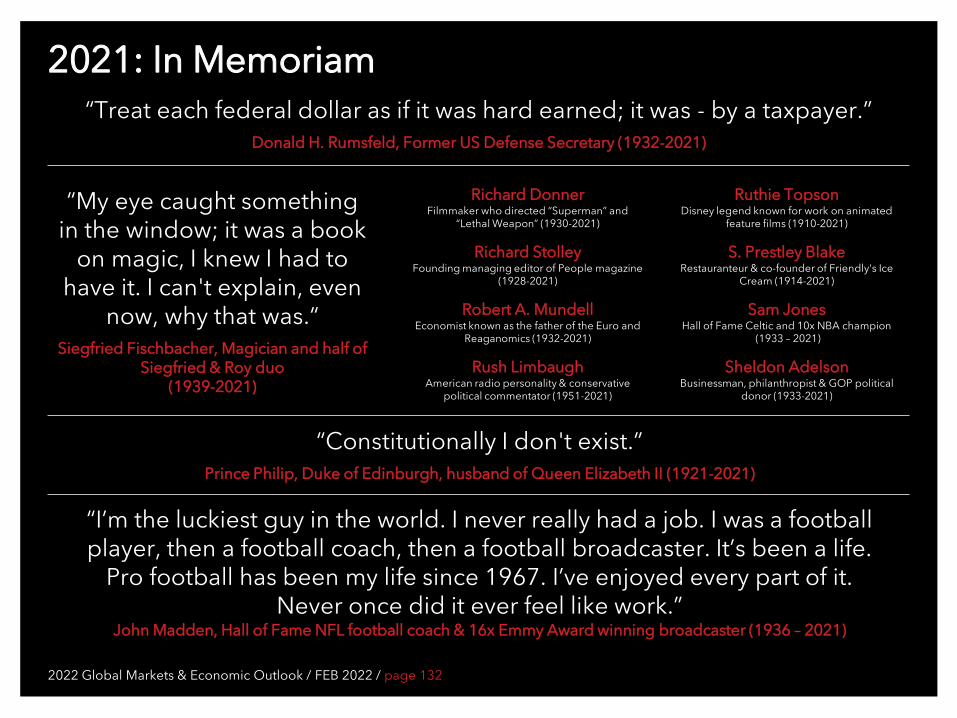
2022 Global Markets & Economic Outlook / FEB 2022 / page 132
2021: In Memoriam
“Constitutionally I don't exist.” Prince Philip, Duke of Edinburgh, husband of Queen Elizabeth II (1921-2021)
“My eye caught something in the window; it was a book
on magic, I knew I had to have it. I can't explain, even
now, why that was.“ Siegfried Fischbacher, Magician and half of
Siegfried & Roy duo (1939-2021)
Ruthie Topson Disney legend known for work on animated
feature films (1910-2021)
S. Prestley Blake Restauranteur & co-founder of Friendly's Ice
Cream (1914-2021)
Sam Jones Hall of Fame Celtic and 10x NBA champion
(1933 – 2021)
Sheldon Adelson Businessman, philanthropist & GOP political
donor (1933-2021)
“Treat each federal dollar as if it was hard earned; it was - by a taxpayer.” Donald H. Rumsfeld, Former US Defense Secretary (1932-2021)
Richard Donner Filmmaker who directed “Superman” and
“Lethal Weapon” (1930-2021)
Richard Stolley Founding managing editor of People magazine
(1928-2021)
Robert A. Mundell Economist known as the father of the Euro and
Reaganomics (1932-2021)
Rush Limbaugh American radio personality & conservative
political commentator (1951-2021)
“I’m the luckiest guy in the world. I never really had a job. I was a football player, then a football coach, then a football broadcaster. It’s been a life.
Pro football has been my life since 1967. I’ve enjoyed every part of it. Never once did it ever feel like work.”
John Madden, Hall of Fame NFL football coach & 16x Emmy Award winning broadcaster (1936 – 2021)

2022 Global Markets & Economic Outlook / FEB 2022 / page 133
2021: In Memoriam
Sarah Weddington Attorney who successfully argued Roe v. Wade
(1945 – 2021)
Shirley Fry Irvin Tennis star & four time Grand Slam champion (1927-2021)
Spencer Silver Creator of specialized adhesive for Post-it Notes
(1941-2021)
Stephen Bechtel Jr. Leader and co-owner of Bechtel corporation (1925-2021)
Steven Weinberg Nobel Prize winning theoretical physicist (1933-2021)
Stonewall Jackson Grand Ole Opry star for over 60 years (1932-2021)
Sylvia Weinstock Baker known as the "Da Vinci of wedding cakes“
(1930-2021)
Tanya Roberts Actress known for her roles in Charlie's Angels and
James Bond (1955-2021)
Toko Shinoda Trailblazing Japanese artist (1913-2021)
Tommy Lasorda Hall of Fame manager for the Dodgers (1927-2021)
Vartan Gregorian President of the Carnegie Corporation of New York
(1934-2021)
Vernon Jordan Civil Rights Activist and close advisor to President
Clinton (1935-2021)
Virgil Abloh American fashion designer and entrepreneur, Louis
Vuitton artistic director (1980-2021)
Walter Mondale US Vice President under Jimmy Carter (1928-2021)
Wilhelmina Cole Holladay Co-founder of the National Museum of Women in the
Arts (1922-2021)
Winfred Rembert Acclaimed artist who depicted scenes of the Jim Crow
South (1945-2021)
Johnny Isakson US Senator from Georgia (1944-2021)
“America may be slow to rise to a challenge. But our history has shown that once we make up our minds to really do something, nothing can stand in our way.”
Carrie Meek, Pioneering Black Congresswoman from Florida (1926-2021)
“Writing nonfiction is more like sculpture, a matter of shaping the research into the finished thing. Novels are like paintings, specifically watercolors.
Every stroke you put down you have to go with.” Joan Didion, Acclaimed American essayist and author (1934 – 2021)
Appendix:
2021: Key Dates to Watch
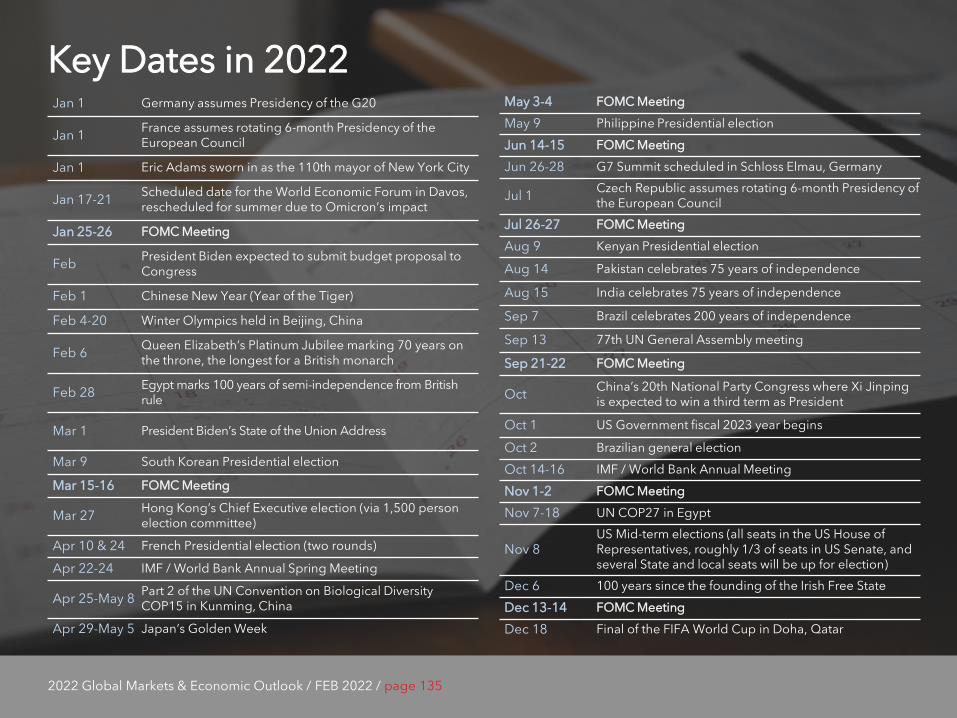
2022 Global Markets & Economic Outlook / FEB 2022 / page 135
Key Dates in 2022 Jan 1 Germany assumes Presidency of the G20
Jan 1 France assumes rotating 6-month Presidency of the European Council
Jan 1 Eric Adams sworn in as the 110th mayor of New York City
Jan 17-21 Scheduled date for the World Economic Forum in Davos, rescheduled for summer due to Omicron’s impact
Jan 25-26 FOMC Meeting
Feb President Biden expected to submit budget proposal to Congress
Feb 1 Chinese New Year (Year of the Tiger)
Feb 4-20 Winter Olympics held in Beijing, China
Feb 6 Queen Elizabeth’s Platinum Jubilee marking 70 years on the throne, the longest for a British monarch
Feb 28 Egypt marks 100 years of semi-independence from British rule
Mar 1 President Biden’s State of the Union Address
Mar 9 South Korean Presidential election
Mar 15-16 FOMC Meeting
Mar 27 Hong Kong’s Chief Executive election (via 1,500 person election committee)
Apr 10 & 24 French Presidential election (two rounds)
Apr 22-24 IMF / World Bank Annual Spring Meeting
Apr 25-May 8 Part 2 of the UN Convention on Biological Diversity COP15 in Kunming, China
Apr 29-May 5 Japan’s Golden Week
May 3-4 FOMC Meeting
May 9 Philippine Presidential election
Jun 14-15 FOMC Meeting
Jun 26-28 G7 Summit scheduled in Schloss Elmau, Germany
Jul 1 Czech Republic assumes rotating 6-month Presidency of the European Council
Jul 26-27 FOMC Meeting
Aug 9 Kenyan Presidential election
Aug 14 Pakistan celebrates 75 years of independence
Aug 15 India celebrates 75 years of independence
Sep 7 Brazil celebrates 200 years of independence
Sep 13 77th UN General Assembly meeting
Sep 21-22 FOMC Meeting
Oct China’s 20th National Party Congress where Xi Jinping is expected to win a third term as President
Oct 1 US Government fiscal 2023 year begins
Oct 2 Brazilian general election
Oct 14-16 IMF / World Bank Annual Meeting
Nov 1-2 FOMC Meeting
Nov 7-18 UN COP27 in Egypt
Nov 8 US Mid-term elections (all seats in the US House of Representatives, roughly 1/3 of seats in US Senate, and several State and local seats will be up for election)
Dec 6 100 years since the founding of the Irish Free State
Dec 13-14 FOMC Meeting
Dec 18 Final of the FIFA World Cup in Doha, Qatar
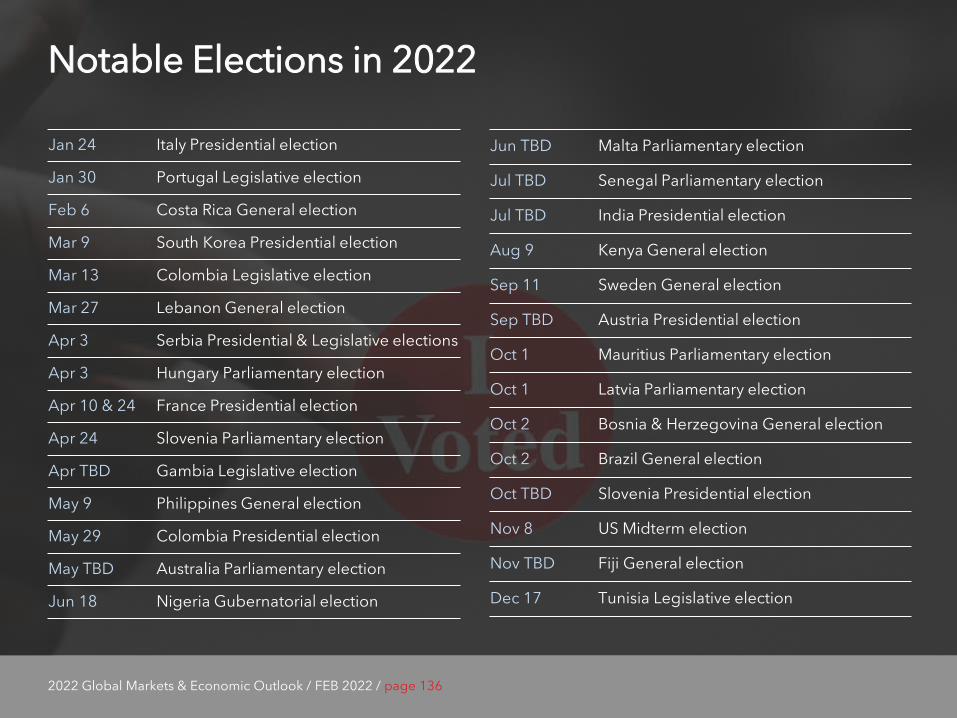
2022 Global Markets & Economic Outlook / FEB 2022 / page 136
Notable Elections in 2022
Jan 24 Italy Presidential election
Jan 30 Portugal Legislative election
Feb 6 Costa Rica General election
Mar 9 South Korea Presidential election
Mar 13 Colombia Legislative election
Mar 27 Lebanon General election
Apr 3 Serbia Presidential & Legislative elections
Apr 3 Hungary Parliamentary election
Apr 10 & 24 France Presidential election
Apr 24 Slovenia Parliamentary election
Apr TBD Gambia Legislative election
May 9 Philippines General election
May 29 Colombia Presidential election
May TBD Australia Parliamentary election
Jun 18 Nigeria Gubernatorial election
Jun TBD Malta Parliamentary election
Jul TBD Senegal Parliamentary election
Jul TBD India Presidential election
Aug 9 Kenya General election
Sep 11 Sweden General election
Sep TBD Austria Presidential election
Oct 1 Mauritius Parliamentary election
Oct 1 Latvia Parliamentary election
Oct 2 Bosnia & Herzegovina General election
Oct 2 Brazil General election
Oct TBD Slovenia Presidential election
Nov 8 US Midterm election
Nov TBD Fiji General election
Dec 17 Tunisia Legislative election
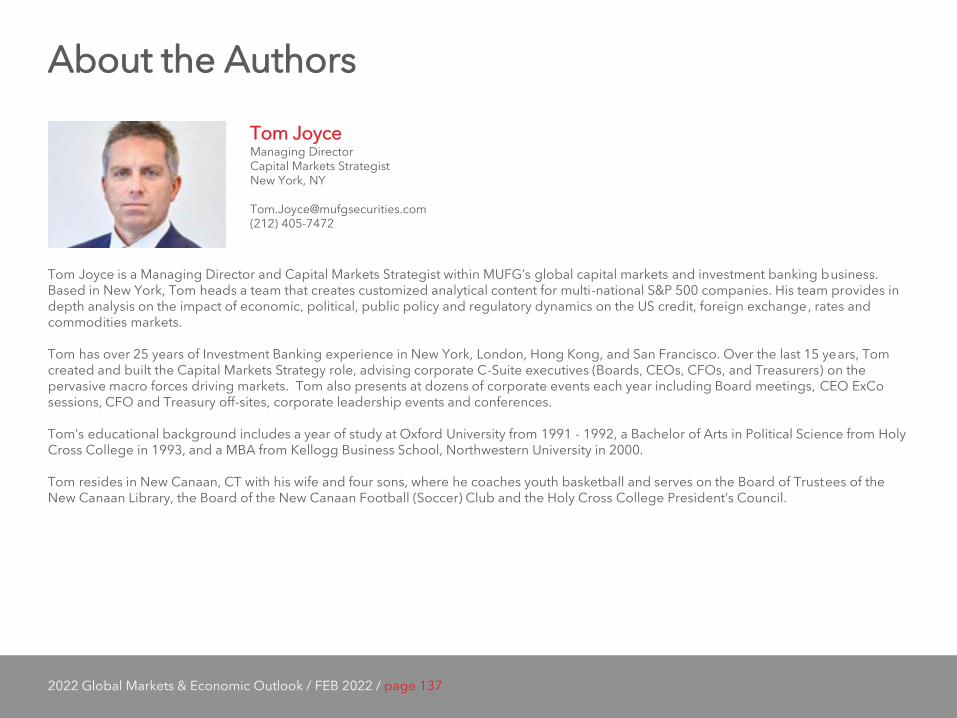
2022 Global Markets & Economic Outlook / FEB 2022 / page 137
About the Authors
Tom Joyce Managing Director Capital Markets Strategist New York, NY [email protected] (212) 405-7472
Tom Joyce is a Managing Director and Capital Markets Strategist within MUFG’s global capital markets and investment banking business. Based in New York, Tom heads a team that creates customized analytical content for multi-national S&P 500 companies. His team provides in depth analysis on the impact of economic, political, public policy and regulatory dynamics on the US credit, foreign exchange, rates and commodities markets. Tom has over 25 years of Investment Banking experience in New York, London, Hong Kong, and San Francisco. Over the last 15 years, Tom created and built the Capital Markets Strategy role, advising corporate C-Suite executives (Boards, CEOs, CFOs, and Treasurers) on the pervasive macro forces driving markets. Tom also presents at dozens of corporate events each year including Board meetings, CEO ExCo sessions, CFO and Treasury off-sites, corporate leadership events and conferences. Tom’s educational background includes a year of study at Oxford University from 1991 - 1992, a Bachelor of Arts in Political Science from Holy Cross College in 1993, and a MBA from Kellogg Business School, Northwestern University in 2000. Tom resides in New Canaan, CT with his wife and four sons, where he coaches youth basketball and serves on the Board of Trustees of the New Canaan Library, the Board of the New Canaan Football (Soccer) Club and the Holy Cross College President’s Council.
2022 Global Markets & Economic Outlook / FEB 2022 / page 138
About the Authors
Hailey Orr Director Capital Markets Strategist New York, NY [email protected] (212) 405-7429
Stephanie Kendal Associate Capital Markets Strategist New York, NY [email protected] (212) 405-7443
Hailey Orr is a Director in MUFG’s Capital Markets Strategy group within the global capital markets and investment banking business. The team provides market based content for corporate clients to assist in strategic decision making. Focus areas include the impact of economic, political, public policy and regulatory dynamics on the US credit, foreign exchange, rates and commodities markets.
Hailey has a decade of Wall Street experience, including three years as a Consumer Sector Specialist in Equity Sales and seven years as a Capital Markets Strategist. Hailey is also a member of MUFG’s Inclusion & Diversity Council and has devoted years to participating in and developing Wall Street recruiting programs.
Hailey graduated with honors from the University of Michigan’s Ross School of Business with a BBA and a minor in International Studies.
In March 2020, Crain’s New York Business Magazine named Hailey one of the “Rising Stars in Banking and Finance”.
Stephanie Kendal is an associate in MUFG’s Capital Markets Strategy group within the global capital markets and investment banking business. The team provides market based content for corporate clients to assist in strategic decision making. Focus areas include the impact of economic, political, public policy and regulatory dynamics on the US credit, foreign exchange, rates and commodities markets.
Stephanie has spent over three years as a Capital Markets Strategist. At her prior firm, Stephanie was a part of the Americas Women’s Network Junior Council and was an active member of the University of Michigan recruiting team.
Stephanie graduated with honors from the University of Michigan’s Ross School of Business with a BBA .
2022 Global Markets & Economic Outlook / FEB 2022 / page 139
MUFG’s Capital Markets Strategy Team The MUFG Capital Markets Strategy team provides monthly publications and weekly policy notes, presenting to Boards and C-Suite executives, on a broad range of transformative themes driving the FX, rates and credit markets including: the COVID-19 recovery, ESG’s acceleration, tax code policy changes, US-China decoupling, corporate strategy, geopolitical risk and central bank monetary policy.
2022 Global Markets & Economic Outlook / FEB 2022 / page 140
MUFG’s Capital Markets Strategy Team
2022 Global Markets & Economic Outlook / FEB 2022 / page 141
Disclaimer The information herein provided is for information purposes only, and is not to be used or considered as investment research, a proposal or the solicitation of an offer to sell or to buy or subscribe for securities or other financial instruments. Neither this nor any other communication prepared by MUFG Bank, Ltd. (“MUFG Bank”), MUFG Union Bank, N.A., MUFG Securities Americas Inc. (“MUFG Securities”), or other MUFG Group Company (collectively, "MUFG") is or should be construed as investment advice, a recommendation or proposal to enter into a particular transaction or pursue a particular strategy, or any statement as to the likelihood that a particular transaction or strategy will be effective in light of your business objectives or operations. Before entering into any particular transaction, you are advised to obtain such independent financial, legal, accounting and other advice as may be appropriate under the circumstances. In any event, any decision to enter into a transaction will be yours alone, not based on information prepared or provided by MUFG. MUFG hereby disclaims any responsibility to you concerning the characterization or identification of terms, conditions, and legal or accounting or other issues or risks that may arise in connection with any particular transaction or business strategy. MUFG is not acting and does not purport to act in any way as an advisor or in a fiduciary capacity.
Certain information contained in this presentation has been obtained or derived from third party sources and such information is believed to be correct and reliable but has not been independently verified. While MUFG believes that factual statements herein and any assumptions on which information herein are based, are in each case accurate, MUFG makes no representation or warranty regarding such accuracy and shall not be responsible for any inaccuracy in such statements or assumptions. Note that MUFG may have issued, and may in the future issue, other reports that are inconsistent with or that reach conclusions different from the information set forth herein. Such other reports, if any, reflect the different assumptions, views and/or analytical methods of the analysts who prepared them, and MUFG is under no obligation to ensure that such other reports are brought to your attention. Furthermore, the information may not be current due to, among other things, changes in the financial markets or economic environment and MUFG has no obligation to update any such information contained in this presentation. This presentation is not intended to forecast or predict future events. Past performance is not a guarantee or indication of future results. Any prices provided herein (other than those identified as being historical) are indicative only and do not represent firm quotes as to either price or size. This presentation has been prepared by members of our capital markets strategy team and does not necessarily represent the MUFG “house” view.
This presentation is proprietary to MUFG Securities and may not be quoted, circulated or otherwise referred to without our prior written consent. Notwithstanding this, MUFG Securities shall not be liable in any manner whatsoever for any consequences or loss (including but not limited to any direct, indirect or consequential loss, loss of profits and damages) arising from any reliance on or usage of this presentation and accepts no legal responsibility to any investor who directly or indirectly receives this material.
IRS Circular 230 Disclosure: MUFG Securities does not provide tax advice. Accordingly, any discussion of U.S. tax matters included herein (including any attachments) is not intended or written to be used, and cannot be used, in connection with the promotion, marketing or recommendation by anyone not affiliated with MUFG Securities of any of the matters addressed herein or for the purpose of avoiding U.S. tax-related penalties.
The MUFG logo and name is a service mark of Mitsubishi UFJ Financial Group, Inc., and may be used by it or other Group companies for branding or marketing purposes. Group companies include MUFG Bank, MUFG Americas Capital Leasing & Finance, LLC, Mitsubishi UFJ Trust and Banking Corporation, MUFG Securities Americas Inc., and MUFG Union Bank, N.A. ("MUB”). Corporate or commercial lending or deposit activities are performed by banking affiliates of MUFG, including, in the United States, MUFG Bank and MUB.
FLOES™ is a service mark of MUFG Securities Americas Inc.
© 2022 Mitsubishi UFJ Financial Group Inc. All rights reserved.
Related Documents