2018 Municipal Affairs Population List | Cities 1

Welcome message from author
This document is posted to help you gain knowledge. Please leave a comment to let me know what you think about it! Share it to your friends and learn new things together.
Transcript
2018 Municipal Affairs Population List | Cities 1
Alberta Municipal Affairs, Government of Alberta November 2018 2018 Municipal Affairs Population List ISBN 978-1-4601-4254-7 ISSN 2368-7320 Data for this publication are from the 2016 federal census of Canada, or from the 2018 municipal census conducted by municipalities. For more detailed data on the census conducted by Alberta municipalities, please contact the municipalities directly. © Government of Alberta 2018 The publication is released under the Open Government Licence. This publication and previous editions of the Municipal Affairs Population List are available in pdf and excel version at http://www.municipalaffairs.alberta.ca/municipal-population-list and https://open.alberta.ca/publications/2368-7320. Strategic Policy and Planning Branch Alberta Municipal Affairs 17th Floor, Commerce Place 10155 - 102 Street Edmonton, Alberta T5J 4L4 Phone: (780) 427-2225 Fax: (780) 420-1016 E-mail: [email protected] Fax: 780-420-1016 Toll-free in Alberta, first dial 310-0000.
2018 Municipal Affairs Population List 3
Table of Contents
Introduction ..................................................................................................................................... 4
2018 Municipal Census Participation List .................................................................................... 5
Municipal Population Summary ................................................................................................... 5
2018 Municipal Affairs Population List ........................................................................................ 6
Cities ......................................................................................................................................... 6
Special Areas ........................................................................................................................... 6
Specialized Municipalities ........................................................................................................ 6
Municipal Districts .................................................................................................................... 7
Towns ....................................................................................................................................... 8
Villages ................................................................................................................................... 11
Summer Villages .................................................................................................................... 13
Improvement Districts ............................................................................................................. 14
Alberta First Nations Population ............................................................................................. 14
Métis Settlements ................................................................................................................... 15
Shadow Population ................................................................................................................ 16
Additional Information ............................................................................................................. 16

2018 Municipal Affairs Population List 4
Introduction Each year the ministry publishes a population list of all Alberta municipalities based on the most recent municipal census or latest federal census. This list contains municipal census population figures submitted to Alberta Municipal Affairs as of September 1 of the current year, in accordance with Sections 57 and 604 of the Municipal Government Act and the Municipal Census Manual. Municipalities completing their own census must follow mandatory requirements as specified in the Determination of Population Regulation (63/2001) and the Municipal Census Manual.
Conducting a municipal census is at the discretion of the municipality. Most municipalities rely on the information provided by the federal census prepared by Statistics Canada once every five years. The most recent federal census was completed in 2016 and released on February 8, 2017.
If a municipality has not completed a municipal census, the 2016 federal census numbers have been used in the 2018 Municipal Affairs Population List.
This publication also contains the population counts for all First Nation Reserves and all Métis Settlements in Alberta. The population counts for First Nation Reserves were obtained from Alberta Indigenous Relations.

2018 Municipal Affairs Population List | Municipal Population Summary 5
2018 Municipal Census Participation List The following 29 municipalities conducted a municipal census in 2018.
Municipality
City City of Airdrie City of Leduc City of Calgary City of Lethbridge City of Chestermere City of Spruce Grove City of Fort Saskatchewan City of St. Albert City of Grande Prairie Municipal District Municipal District of Greenview No. 16 Town Town of Beaumont Town of Cochrane Town of Blackfalds Town of Eckville Town of Bruderheim Town of Okotoks Town of Cardston Town of Raymond Town of Coalhurst Town of Strathmore Town of Cochrane Village Village of Boyle Village of Stirling Village of Empress Village of Waskatenau Specialized Municipality Mackenzie County Regional Municipality of Wood Buffalo Strathcona County Improvement District Improvement District No. 04
(Waterton) * For more information on types of municipalities, please refer to Municipalities in Alberta.
Municipal Population Summary The table provides population figures for each type of municipality, First Nations and Métis Settlements in Alberta. The population counts include shadow populations as approved by the Minister of Municipal Affairs.
The unofficial Alberta population total may differ from the Official Alberta Population Estimate published by the Office of Statistics and Information due to differences in methodology.
Population (by Municipality Type) 2018
Population of Alberta Municipalities 4,118,245 City (18) 2,875,383 Specialized Municipality (6) 242,290 Municipal District (63) 467,163 Town (109) 484,977 Village (86) 36,585 Summer Village (51) 5,200 Improvement District (8) 2,463 Special Areas (1) 4,184
Indian Register Population (on reserve and crownland) 78,274 Métis Settlements 5,632 UNOFFICIAL ALBERTA POPULATION - TOTAL 4,202,151

2018 Municipal Affairs Population List | Specialized Municipalities 6
2018 Municipal Affairs Population List For most municipalities, only “usual residents” are included in their population counts. The shadow population counts are included with the usual resident count if the municipality has been given approval from the Minister of Municipal Affairs prior to conducting a census. The Regional Municipality of Wood Buffalo and the Improvement District No. 04 (Waterton) had a shadow population included with its regular census.
Cities
City Population Municipal Census Date
Federal Census Date
Airdrie 68,091 01-Apr-18 Brooks 14,451 10-May-16 Calgary 1,267,344 01-Apr-18 Camrose 18,742 10-May-16 Chestermere 20,732 01-May-18 Cold Lake 14,961 10-May-16 Edmonton 932,546 10-May-16 Fort Saskatchewan 26,328 02-Apr-18 Grande Prairie 69,088 16-Apr-18 Lacombe 13,057 10-May-16 Leduc 32,448 01-Apr-18 Lethbridge 99,769 01-Apr-18 Lloydminster * 19,645 10-May-16 Medicine Hat 63,260 10-May-16 Red Deer 100,418 10-May-16 Spruce Grove 35,766 04-Apr-18 St. Albert 66,082 01-May-18 Wetaskiwin 12,655 10-May-16 CITIES (18) - TOTAL 2,875,383
*The population of Lloydminster refers to the Alberta portion only, for the complete population refer to the section Additional Information.
Special Areas
Special Areas Population Municipal Census Date
Federal Census Date
Special Areas 4,184 10-May-16 SPECIAL AREAS (1) - TOTAL 4,184
Specialized Municipalities
Specialized Municipality Population Municipal Census Date
Federal Census Date
Lac La Biche County 9,531 11-May-16 Mackenzie County 12,512 18-Apr-18 Municipality of Crowsnest Pass 5,589 10-May-16

2018 Municipal Affairs Population List | Municipal Districts 7
Municipality of Jasper 4,590 10-May-16 Regional Municipality of Wood Buffalo * 111,687 09-Apr-18 Strathcona County 98,381 01-May-18 SPECIALIZED MUNICIPALITY (6) - TOTAL 242,290
*The population of the Regional Municipality of Wood Buffalo includes a shadow population count.
Municipal Districts
Municipal Districts Population Municipal Census Date
Federal Census
Date Athabasca County 7,869 10-May-16 Beaver County 5,905 10-May-16 Big Lakes County 4,103 10-May-16 Birch Hills County 1,553 10-May-16 Brazeau County 7,771 10-May-16 Camrose County 8,458 10-May-16 Cardston County 4,481 10-May-16 Clear Hills County 3,023 10-May-16 Clearwater County 11,947 10-May-16 County of Barrhead No. 11 6,288 10-May-16 County of Forty Mile No. 8 3,581 10-May-16 County of Grande Prairie No. 1 * 22,502 10-May-16 County of Minburn No. 27 3,188 10-May-16 County of Newell 7,524 10-May-16 County of Northern Lights 3,656 10-May-16 County of Paintearth No. 18 2,102 10-May-16 County of St. Paul No. 19 6,468 18-Apr-17 County of Stettler No. 6 5,526 10-May-16 County of Two Hills No. 21 3,641 10-May-16 County of Vermilion River 8,267 10-May-16 County of Warner No. 5 * 3,947 10-May-16 County of Wetaskiwin No. 10 11,181 10-May-16 Cypress County 7,662 10-May-16 Flagstaff County 3,738 10-May-16 Kneehill County 5,001 10-May-16 Lac Ste. Anne County 10,899 10-May-16 Lacombe County 10,343 10-May-16 Lamont County 3,899 10-May-16 Leduc County 13,780 10-May-16 Lethbridge County 10,353 10-May-16 Mountain View County 13,074 10-May-16 Municipal District of Acadia No. 34 493 10-May-16 Municipal District of Bighorn No. 8 1,334 10-May-16 Municipal District of Bonnyville No. 87 * 11,661 10-May-16 Municipal District of Fairview No. 136 1,604 10-May-16 Municipal District of Foothills No. 31 22,766 10-May-16 Municipal District of Greenview No. 16 6,044 30-Apr-18 Municipal District of Lesser Slave River No. 124 2,803 10-May-16 Municipal District of Opportunity No. 17 3,181 10-May-16 Municipal District of Peace No. 135 1,747 10-May-16
8 2018 Municipal Affairs Population List | Towns
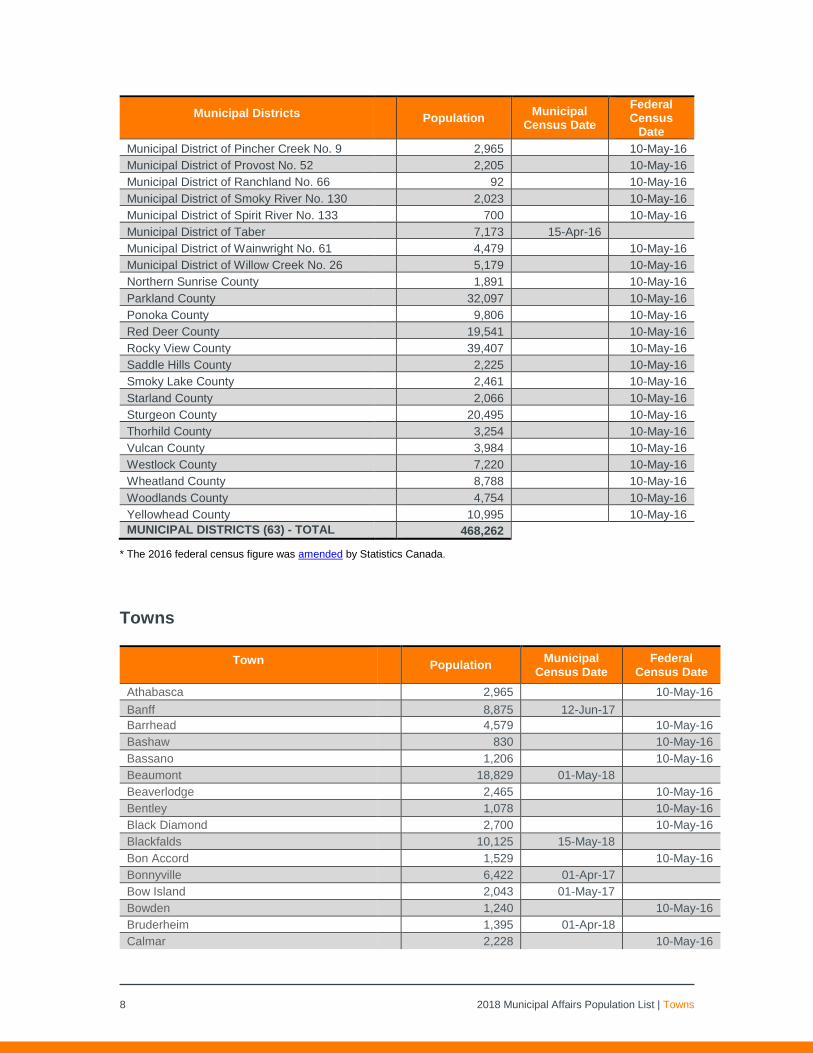
Municipal Districts Population Municipal Census Date
Federal Census
Date Municipal District of Pincher Creek No. 9 2,965 10-May-16 Municipal District of Provost No. 52 2,205 10-May-16 Municipal District of Ranchland No. 66 92 10-May-16 Municipal District of Smoky River No. 130 2,023 10-May-16 Municipal District of Spirit River No. 133 700 10-May-16 Municipal District of Taber 7,173 15-Apr-16 Municipal District of Wainwright No. 61 4,479 10-May-16 Municipal District of Willow Creek No. 26 5,179 10-May-16 Northern Sunrise County 1,891 10-May-16 Parkland County 32,097 10-May-16 Ponoka County 9,806 10-May-16 Red Deer County 19,541 10-May-16 Rocky View County 39,407 10-May-16 Saddle Hills County 2,225 10-May-16 Smoky Lake County 2,461 10-May-16 Starland County 2,066 10-May-16 Sturgeon County 20,495 10-May-16 Thorhild County 3,254 10-May-16 Vulcan County 3,984 10-May-16 Westlock County 7,220 10-May-16 Wheatland County 8,788 10-May-16 Woodlands County 4,754 10-May-16 Yellowhead County 10,995 10-May-16 MUNICIPAL DISTRICTS (63) - TOTAL 468,262
* The 2016 federal census figure was amended by Statistics Canada.
Towns
Town Population Municipal Census Date
Federal Census Date
Athabasca 2,965 10-May-16 Banff 8,875 12-Jun-17 Barrhead 4,579 10-May-16 Bashaw 830 10-May-16 Bassano 1,206 10-May-16 Beaumont 18,829 01-May-18 Beaverlodge 2,465 10-May-16 Bentley 1,078 10-May-16 Black Diamond 2,700 10-May-16 Blackfalds 10,125 15-May-18 Bon Accord 1,529 10-May-16 Bonnyville 6,422 01-Apr-17 Bow Island 2,043 01-May-17 Bowden 1,240 10-May-16 Bruderheim 1,395 01-Apr-18 Calmar 2,228 10-May-16

2018 Municipal Affairs Population List | Towns 9
Town Population Municipal Census Date
Federal Census Date
Canmore 13,992 10-May-16 Cardston 3,909 18-Jun-18 Carstairs 4,077 10-May-16 Castor 929 10-May-16 Claresholm 3,780 10-May-16 Coaldale 8,215 10-May-16 Coalhurst 2,767 22-May-18 Cochrane 27,960 03-Apr-18 Coronation 940 10-May-16 Crossfield 3,308 01-May-18 Daysland 824 10-May-16 Devon 6,578 10-May-16 Didsbury 5,268 10-May-16 Drayton Valley 7,235 10-May-16 Drumheller 7,982 10-May-16 Eckville 1,163 24-May-18 Edson 8,414 10-May-16 Elk Point 1,452 10-May-16 Fairview 2,998 10-May-16 Falher 1,047 10-May-16 Fort Macleod 2,967 10-May-16 Fox Creek 1,971 10-May-16 Gibbons 3,159 10-May-16 Grande Cache 3,571 10-May-16 Granum 406 10-May-16 Grimshaw 2,718 10-May-16 Hanna 2,559 10-May-16 Hardisty 554 10-May-16 High Level 3,992 01-May-17 High Prairie 2,564 10-May-16 High River 13,584 10-May-16 Hinton 9,882 10-May-16 Innisfail 7,847 10-May-16 Irricana 1,216 10-May-16 Killam 989 10-May-16 Lamont 1,774 10-May-16 Legal 1,345 10-May-16 Magrath 2,435 24-Apr-17 Manning 1,183 10-May-16 Mayerthorpe 1,320 10-May-16 McLennan 791 01-May-17 Milk River 827 10-May-16 Millet 1,945 10-May-16 Morinville 9,893 01-Apr-16 Mundare 852 10-May-16 Nanton * 2,181 10-May-16 Nobleford 1,278 10-May-16 Okotoks 29,002 02-May-18 Olds 9,184 10-May-16

10 2018 Municipal Affairs Population List | Towns
Town Population Municipal Census Date
Federal Census Date
Onoway 1,029 10-May-16 Oyen 1,022 05-Jun-17 Peace River 6,842 10-May-16 Penhold 3,277 10-May-16 Picture Butte 1,810 10-May-16 Pincher Creek 3,642 10-May-16 Ponoka 7,229 10-May-16 Provost 1,998 10-May-16 Rainbow Lake 795 10-May-16 Raymond 4,252 01-May-18 Redcliff 5,600 10-May-16 Redwater 2,053 10-May-16 Rimbey 2,567 10-May-16 Rocky Mountain House 6,635 10-May-16 Sedgewick 811 10-May-16 Sexsmith 2,620 10-May-16 Slave Lake 6,651 10-May-16 Smoky Lake 964 10-May-16 Spirit River 995 10-May-16 St. Paul 5,963 10-Apr-17 Stavely 541 10-May-16 Stettler 5,952 10-May-16 Stony Plain 17,189 10-May-16 Strathmore 13,528 01-Apr-18 Sundre 2,729 10-May-16 Swan Hills 1,301 10-May-16 Sylvan Lake 14,816 10-May-16 Taber 8,428 10-May-16 Thorsby 1,015 01-Apr-17 Three Hills 3,212 10-May-16 Tofield 2,081 10-May-16 Trochu 1,058 10-May-16 Turner Valley 2,559 10-May-16 Two Hills 1,443 15-May-17 Valleyview 1,863 10-May-16 Vauxhall 1,222 10-May-16 Vegreville 5,708 10-May-16 Vermilion 4,150 01-Apr-17 Viking 1,083 10-May-16 Vulcan 1,917 10-May-16 Wainwright 6,270 10-May-16 Wembley 1,516 10-May-16 Westlock 5,101 10-May-16 Whitecourt 10,204 10-May-16 TOWNS (109) - TOTAL 484,977
* The 2016 federal census figure was amended by Statistics Canada.

2018 Municipal Affairs Population List | Villages 11
Villages
Village Population Municipal Census Date
Federal Census Date
Acme 653 10-May-16 Alberta Beach 1,018 10-May-16 Alix 734 10-May-16 Alliance 154 10-May-16 Amisk 204 10-May-16 Andrew 425 10-May-16 Arrowwood 207 10-May-16 Barnwell 947 10-May-16 Barons 341 10-May-16 Bawlf 422 10-May-16 Beiseker 819 10-May-16 Berwyn 538 10-May-16 Big Valley 349 01-May-17 Bittern Lake 220 10-May-16 Boyle 925 04-Jun-18 Breton 574 10-May-16 Carbon 500 01-May-17 Carmangay 250 19-May-17 Caroline 512 10-May-16 Cereal 111 10-May-16 Champion 317 10-May-16 Chauvin 345 19-May-16 Chipman 274 10-May-16 Clive 715 10-May-16 Clyde 430 10-May-16 Consort 729 10-May-16 Coutts 245 10-May-16 Cowley 209 10-May-16 Cremona 444 10-May-16 Czar 202 10-May-16 Delburne 892 10-May-16 Delia 216 10-May-16 Dewberry 186 10-May-16 Donalda 219 10-May-16 Donnelly 342 10-May-16 Duchess 1,085 10-May-16 Edberg 151 10-May-16 Edgerton 425 10-May-17 Elnora 298 10-May-16 Empress 155 01-Jun-18 Ferintosh 202 10-May-16 Foremost 541 10-May-16 Forestburg 875 10-May-16 Gadsby 40 10-May-16 Girouxville 289 01-May-17 Glendon 493 10-May-16 Glenwood 316 10-May-16

12 2018 Municipal Affairs Population List | Villages
Village Population Municipal Census Date
Federal Census Date
Halkirk 112 10-May-16 Hay Lakes 495 10-May-16 Heisler 160 10-May-16 Hill Spring 162 10-May-16 Hines Creek 346 10-May-16 Holden 350 10-May-16 Hughenden 243 10-May-16 Hussar 190 10-May-16 Hythe 827 10-May-16 Innisfree 223 15-May-17 Irma 521 10-May-16 Kitscoty 976 01-Apr-16 Linden 828 10-May-16 Lomond 166 10-May-16 Longview 307 10-May-16 Lougheed 256 10-May-16 Mannville 828 10-May-16 Marwayne 606 15-May-17 Milo 91 10-May-16 Morrin 240 10-May-16 Munson 192 10-May-16 Myrnam 339 10-May-16 Nampa 364 10-May-16 Paradise Valley 179 10-May-16 Rockyford 316 10-May-16 Rosalind 188 10-May-16 Rosemary 396 10-May-16 Rycroft 612 10-May-16 Ryley 483 10-May-16 Spring Lake 699 10-May-16 Standard 353 10-May-16 Stirling 1,269 01-Jun-18 Veteran 238 29-May-17 Vilna 290 10-May-16 Wabamun 682 10-May-16 Warburg 766 10-May-16 Warner 373 10-May-16 Waskatenau 227 30-Apr-18 Youngstown 154 10-May-16 VILLAGES (86) - TOTAL 36,585

2018 Municipal Affairs Population List | Summer Villages 13
Summer Villages
Summer Villages Population Municipal Census Date
Federal Census Date
Argentia Beach 27 10-May-16 Betula Beach 16 10-May-16 Birch Cove 45 10-May-16 Birchcliff 117 10-May-16 Bondiss 110 10-May-16 Bonnyville Beach 84 10-May-16 Burnstick Lake * 15 10-May-16 Castle Island 10 10-May-16 Crystal Springs 51 10-May-16 Ghost Lake 82 10-May-16 Golden Days 160 10-May-16 Grandview 114 10-May-16 Gull Lake 176 10-May-16 Half Moon Bay 42 10-May-16 Horseshoe Bay 73 01-May-17 Island Lake 228 10-May-16 Island Lake South 61 10-May-16 Itaska Beach 23 10-May-16 Jarvis Bay 213 10-May-16 Kapasiwin 10 10-May-16 Lakeview 30 10-May-16 Larkspur 44 10-May-16 Ma-Me-O Beach 110 10-May-16 Mewatha Beach 90 10-May-16 Nakamun Park 96 10-May-16 Norglenwold 273 10-May-16 Norris Beach 38 10-May-16 Parkland Beach 153 10-May-16 Pelican Narrows 151 10-May-16 Point Alison 10 10-May-16 Poplar Bay 103 10-May-16 Rochon Sands 86 10-May-16 Ross Haven 160 10-May-16 Sandy Beach 278 10-May-16 Seba Beach 169 10-May-16 Silver Beach 65 10-May-16 Silver Sands 160 10-May-16 South Baptiste 66 10-May-16 South View 67 10-May-16 Sunbreaker Cove 81 10-May-16 Sundance Beach 73 10-May-16 Sunrise Beach 135 10-May-16 Sunset Beach 49 10-May-16 Sunset Point 169 10-May-16 Val Quentin 252 10-May-16 Waiparous 49 10-May-16 West Baptiste 38 10-May-16

14 2018 Municipal Affairs Population List | Alberta First Nations Population
Summer Villages Population Municipal Census Date
Federal Census Date
West Cove 149 10-May-16 Whispering Hills 142 10-May-16 White Sands 120 10-May-16 Yellowstone 137 10-May-16 SUMMER VILLAGES (51) - TOTAL 5,200
* The 2016 federal census figure was amended by Statistics Canada.
Improvement Districts
Improvement Districts Population Municipal Census
Date
Federal Census
Date Improvement District No. 04 (Waterton) * 513 22-Jun-18 Improvement District No. 09 (Banff) 1,028 10-May-16 Improvement District No. 12 (Jasper National Park) 53 10-May-16 Improvement District No. 13 (Elk Island) - Improvement District No. 24 (Wood Buffalo) 648 10-May-16 Kananaskis Improvement District 221 10-May-16 Improvement District No. 25 (Willmore Wilderness) - Improvement District No. 349 - IMPROVEMENT DISTRICT (8) - TOTAL 2,463
*The population of the Improvement District No. 04 (Waterton) includes a shadow population count. Alberta First Nations Population
The population figures for First Nation people in Alberta are as of December, 2017 as supplied by Alberta Indigenous Relations. The data reflects First Nations people that are members of a First Nation living on- or off-reserve.
First Nation On-Reserve & Crown Land
(MAPL) Off-Reserve Total
Federal Census
Date Alexander First Nation 1,135 1,105 2,240 1-Dec-17 Alexis Nakota Sioux Nation 1,237 811 2,048 1-Dec-17 Athabasca Chipewyan First Nation 255 994 1,249 1-Dec-17 Beaver First Nation 477 627 1,104 1-Dec-17 Beaver Lake Cree Nation 427 759 1,186 1-Dec-17 Bigstone Cree Nation 3,448 4,631 8,079 1-Dec-17 Blood Tribe 8,587 3,853 12,440 1-Dec-17 Chipewyan Prairie First Nation 402 555 957 1-Dec-17 Cold Lake First Nations 1,418 1,548 2,966 1-Dec-17 Dene Tha' First Nation 2,148 970 3,118 1-Dec-17 Driftpile Cree Nation 995 1,821 2,816 1-Dec-17 Duncan's First Nation 147 166 313 1-Dec-17 Enoch Cree Nation #440 1,768 892 2,660 1-Dec-17 Ermineskin Tribe 3,668 1,095 4,763 1-Dec-17 Fort McKay First Nation 431 441 872 1-Dec-17 Fort McMurray #468 First Nation 293 513 806 1-Dec-17

2018 Municipal Affairs Population List | Métis Settlements 15
First Nation On-Reserve & Crown Land
(MAPL) Off-Reserve Total
Federal Census
Date Frog Lake First Nation 2,123 1,226 3,349 1-Dec-17 General List * 4 928 932 1-Dec-17 Heart Lake First Nation 219 138 357 1-Dec-17 Horse Lake First Nation 506 705 1,211 1-Dec-17 Kapawe'no First Nation 138 247 385 1-Dec-17 Kehewin Cree Nation 1,261 924 2,185 1-Dec-17 Little Red River Cree Nation 5,093 677 5,770 1-Dec-17 Loon River Cree 535 113 648 1-Dec-17 Louis Bull Tribe 1,873 477 2,350 1-Dec-17 Lubicon Lake Band 389 273 662 1-Dec-17 Mikisew Cree First Nation 813 2,343 3,156 1-Dec-17 Montana First Nation 784 258 1,042 1-Dec-17 O'Chiese First Nation 976 433 1,409 1-Dec-17 Paul First Nation 1,442 698 2,140 1-Dec-17 Peerless Trout First Nation 836 113 949 1-Dec-17 Piikani Nation 2,475 1,362 3,837 1-Dec-17 Saddle Lake Cree Nation ** 6,777 4,013 10,790 1-Dec-17 Samson Cree Nation 6,673 2,109 8,782 1-Dec-17 Sawridge First Nation 49 458 507 1-Dec-17 Siksika Nation 4,291 3,198 7,489 1-Dec-17 Smith's Landing First Nation 162 201 363 1-Dec-17 Stoney (Bearspaw) First Nation 1,859 162 2,021 1-Dec-17 Stoney (Chiniki) First Nation 1,649 155 1,804 1-Dec-17 Stoney (Wesley) First Nation 1,626 196 1,822 1-Dec-17 Sturgeon Lake Cree Nation 1,540 1,871 3,411 1-Dec-17 Sucker Creek First Nation 792 2,068 2,860 1-Dec-17 Sunchild First Nation 916 472 1,388 1-Dec-17 Swan River First Nation 438 949 1,387 1-Dec-17 Tallcree Tribal Government 583 786 1,369 1-Dec-17 Tsuut'ina Nation 2,150 197 2,347 1-Dec-17 Whitefish Lake First Nation 1,618 1,243 2,861 1-Dec-17 Woodland Cree First Nation 848 303 1,151 1-Dec-17 FIRST NATIONS (48) - TOTAL 78,274 50,077 128,351
*General list contains the names of those who are listed in the Indian Register but are not registered with a First Nation. **Includes members of the Whitefish (Goodfish) Lake First Nation.
Métis Settlements
Métis Settlements Population Municipal Census Date
Federal Census Date
Buffalo Lake Metis Settlement 715 05-Jun-18 East Prairie Metis Settlement 586 05-Jun-18 Elizabeth Metis Settlement 644 05-Jun-18 Fishing Lake Metis Settlement 595 05-Jun-18 Gift Lake Metis Settlement 892 05-Jun-18 Kikino Metis Settlement 1,018 05-Jun-18 Paddle Prairie Metis Settlement 577 05-Jun-18 Peavine Metis Settlement 605 05-Jun-18 MÉTIS SETTLEMENTS (8) - TOTAL 5,632
16 2018 Municipal Affairs Population List | Additional Information
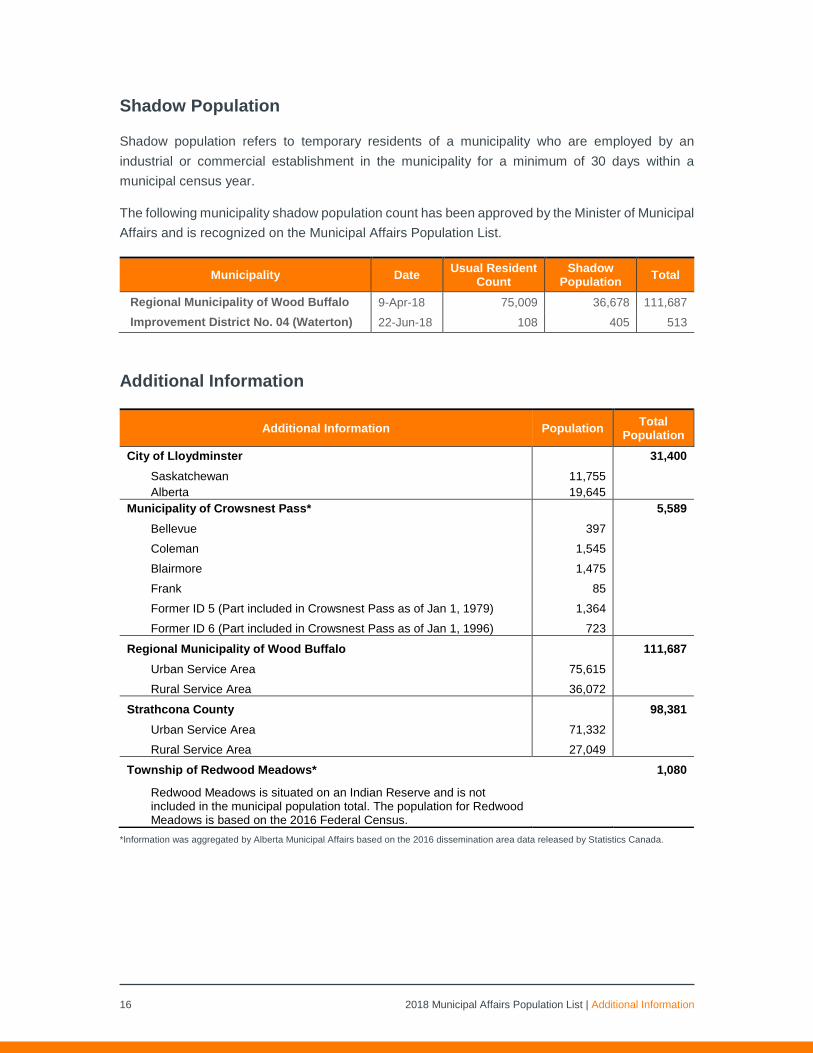
Shadow Population
Shadow population refers to temporary residents of a municipality who are employed by an industrial or commercial establishment in the municipality for a minimum of 30 days within a municipal census year.
The following municipality shadow population count has been approved by the Minister of Municipal Affairs and is recognized on the Municipal Affairs Population List.
Municipality Date Usual Resident Count
Shadow Population Total
Regional Municipality of Wood Buffalo 9-Apr-18 75,009 36,678 111,687 Improvement District No. 04 (Waterton) 22-Jun-18 108 405 513
Additional Information
Additional Information Population Total Population
City of Lloydminster 31,400 Saskatchewan 11,755 Alberta 19,645
Municipality of Crowsnest Pass* 5,589 Bellevue 397 Coleman 1,545 Blairmore 1,475 Frank 85 Former ID 5 (Part included in Crowsnest Pass as of Jan 1, 1979) 1,364 Former ID 6 (Part included in Crowsnest Pass as of Jan 1, 1996) 723
Regional Municipality of Wood Buffalo 111,687 Urban Service Area 75,615 Rural Service Area 36,072
Strathcona County 98,381 Urban Service Area 71,332 Rural Service Area 27,049
Township of Redwood Meadows* 1,080
Redwood Meadows is situated on an Indian Reserve and is not included in the municipal population total. The population for Redwood Meadows is based on the 2016 Federal Census.
*Information was aggregated by Alberta Municipal Affairs based on the 2016 dissemination area data released by Statistics Canada.
Related Documents