2015 URBAN WATER MANAGEMENT PLAN FINAL DRAFT April 2016 ,

Welcome message from author
This document is posted to help you gain knowledge. Please leave a comment to let me know what you think about it! Share it to your friends and learn new things together.
Transcript
2015
URBAN WATER MANAGEMENT PLAN
FINAL DRAFT
April 2016
,

2015 URBAN WATER MANAGEMENT PLAN
2015 URBAN WATER MANAGEMENT PLAN City of Santa Ana
Prepared for:
City of Santa Ana
Public Works Agency
Water Resources Division
20 Civic Center Plaza
Santa Ana, CA 92701
Prepared by:
Arcadis U.S., Inc.
445 South Figueroa Street
Suite 3650
Los Angeles
California 90071
Tel 213 486 9884
Fax 213 486 9894
Our Ref.:
4109039.0000
Date:
April 2016
FINAL DRAFT
arcadis.com
2015 URBAN WATER MANAGEMENT PLAN
CONTENTS Acronyms and Abbreviations ....................................................................................................................... vii
1 Introduction .......................................................................................................................................... 1-1
1.1 Urban Water Management Plan Requirements ........................................................................... 1-1
1.2 Agency Overview ......................................................................................................................... 1-3
1.3 Service Area and Facilities .......................................................................................................... 1-6
1.3.1 City of Santa Ana Service Area ........................................................................................ 1-6
1.3.2 City of Santa Ana Water Facilities .................................................................................... 1-7
2 Demands .............................................................................................................................................. 2-1
2.1 Overview ...................................................................................................................................... 2-1
2.2 Factors Affecting Demand ........................................................................................................... 2-1
2.2.1 Climate Characteristics .................................................................................................... 2-2
2.2.2 Demographics .................................................................................................................. 2-2
2.2.3 Land Use .......................................................................................................................... 2-2
2.3 Water Use by Customer Type ..................................................................................................... 2-3
2.3.1 Overview ........................................................................................................................... 2-3
2.3.2 Non-Residential ................................................................................................................ 2-4
2.3.3 Sales to Other Agencies ................................................................................................... 2-4
2.3.4 Non-Revenue Water ......................................................................................................... 2-4
2.3.4.1 AWWA Water Audit Methodology ........................................................................... 2-4
2.4 Demand Projections..................................................................................................................... 2-6
2.4.1 Demand Projection Methodology ..................................................................................... 2-7
2.4.2 Agency Refinement .......................................................................................................... 2-7
2.4.3 25 Year Projections .......................................................................................................... 2-7
2.4.4 Total Water Demand Projections ..................................................................................... 2-9
2.4.5 Water Use for Lower Income Households ....................................................................... 2-9
2.5 SBx7-7 Requirements ................................................................................................................2-10
2.5.1 Baseline Water Use ........................................................................................................2-11
2.5.1.1 Ten to 15-Year Baseline Period (Baseline GPCD) ...............................................2-11
2.5.1.2 Five-Year Baseline Period (Target Confirmation) ................................................2-12
arcadis.com i
2015 URBAN WATER MANAGEMENT PLAN
2.5.1.3 Service Area Population .......................................................................................2-12
2.5.2 SBx7-7 Water Use Targets ............................................................................................2-12
2.5.2.1 SBx7-7 Target Methods ........................................................................................2-12
2.5.2.2 2015 and 2020 Targets ........................................................................................2-13
2.5.3 Regional Alliance ............................................................................................................2-14
3 Water Sources and Supply Reliability .................................................................................................. 3-1
3.1 Overview ...................................................................................................................................... 3-1
3.2 Imported Water ............................................................................................................................ 3-2
3.2.1 Colorado River Supplies ................................................................................................... 3-2
3.2.2 State Water Project Supplies ........................................................................................... 3-4
3.2.3 Storage ............................................................................................................................. 3-8
3.3 Groundwater ................................................................................................................................ 3-8
3.3.1 Basin Characteristics ........................................................................................................ 3-8
3.3.2 Basin Production Percentage .........................................................................................3-10
3.3.2.1 2015 OCWD Groundwater Management Plan .....................................................3-10
3.3.2.2 OCWD Engineer’s Report ....................................................................................3-11
3.3.3 Groundwater Recharge Facilities ...................................................................................3-12
3.3.4 Metropolitan Groundwater Replenishment Program ......................................................3-12
3.3.5 Metropolitan Conjunctive Use Program .........................................................................3-13
3.3.6 Groundwater Historical Extraction ..................................................................................3-13
3.3.7 Overdraft Conditions.......................................................................................................3-13
3.4 Summary of Existing and Planned Sources of Water ................................................................3-14
3.5 Recycled Water ..........................................................................................................................3-16
3.6 Supply Reliability........................................................................................................................3-16
3.6.1 Overview .........................................................................................................................3-16
3.6.2 Factors Impacting Reliability ..........................................................................................3-16
3.6.2.1 Environment ..........................................................................................................3-16
3.6.2.2 Legal .....................................................................................................................3-16
3.6.2.3 Water Quality ........................................................................................................3-17
3.6.2.3.1 Imported Water ...........................................................................................3-17
3.6.2.3.2 Groundwater ...............................................................................................3-17
arcadis.com ii

2015 URBAN WATER MANAGEMENT PLAN
3.6.2.4 Climate Change ....................................................................................................3-19
3.6.3 Normal-Year Reliability Comparison ..............................................................................3-19
3.6.4 Single-Dry Year Reliability Comparison .........................................................................3-19
3.6.5 Multiple-Dry Year Period Reliability Comparison ...........................................................3-20
3.7 Supply and Demand Assessment ..............................................................................................3-20
4 Demand Management Measures......................................................................................................... 4-1
4.1 Water Waste Prevention Ordinances .......................................................................................... 4-1
4.2 Metering ....................................................................................................................................... 4-2
4.3 Conservation Pricing .................................................................................................................... 4-3
4.4 Public Education and Outreach ................................................................................................... 4-3
4.5 Programs to Assess and Manage Distribution System Real Loss .............................................. 4-5
4.6 Water Conservation Program Coordination and Staffing Support ............................................... 4-5
5 Water Shortage Contingency Plan....................................................................................................... 5-1
5.1 Overview ...................................................................................................................................... 5-1
5.2 Shortage Actions.......................................................................................................................... 5-1
5.2.1 Metropolitan Water Surplus and Drought Management Plan .......................................... 5-1
5.2.2 Metropolitan Water Supply Allocation Plan ...................................................................... 5-3
5.2.3 City of Santa Ana.............................................................................................................. 5-4
5.3 Three-Year Minimum Water Supply ............................................................................................ 5-5
5.4 Catastrophic Supply Interruption ................................................................................................. 5-5
5.4.1 Metropolitan ...................................................................................................................... 5-5
5.4.2 Water Emergency Response of Orange County .............................................................. 5-6
5.4.3 City of Santa Ana.............................................................................................................. 5-6
5.5 Prohibitions, Penalties and Consumption Reduction Methods .................................................... 5-7
5.5.1 Prohibitions ....................................................................................................................... 5-7
5.5.2 Penalties .........................................................................................................................5-12
5.5.3 Consumption Reduction Methods ..................................................................................5-12
5.6 Impacts to Revenue ...................................................................................................................5-13
5.7 Reduction Measuring Mechanism .............................................................................................5-15
6 Recycled Water .................................................................................................................................... 6-1
6.1 Agency Coordination ................................................................................................................... 6-1
arcadis.com iii

2015 URBAN WATER MANAGEMENT PLAN
6.1.1 OCWD Green Acres Project ............................................................................................. 6-1
6.1.2 OCWD Groundwater Replenishment System .................................................................. 6-1
6.2 Wastewater Description and Disposal ......................................................................................... 6-2
6.3 Current Recycled Water Uses ..................................................................................................... 6-4
6.4 Potential Recycled Water Uses ................................................................................................... 6-6
6.4.1 Direct Non-Potable Reuse ................................................................................................ 6-6
6.4.2 Indirect Potable Reuse ..................................................................................................... 6-6
6.5 Optimization Plan ......................................................................................................................... 6-7
7 Future Water Supply Projects and Programs ...................................................................................... 7-1
7.1 Water Management Tools ........................................................................................................... 7-1
7.2 Transfer or Exchange Opportunities ............................................................................................ 7-1
7.3 Planned Water Supply Projects and Programs ........................................................................... 7-1
7.4 Desalination Opportunities ........................................................................................................... 7-1
7.4.1 Groundwater ..................................................................................................................... 7-2
7.4.2 Ocean Water .................................................................................................................... 7-2
8 UWMP Adoption Process .................................................................................................................... 8-1
8.1 Public Participation ...................................................................................................................... 8-2
8.2 Agency Coordination ................................................................................................................... 8-2
8.3 UWMP Submittal .......................................................................................................................... 8-2
8.3.1 Review of 2010 UWMP Implementation........................................................................... 8-2
8.3.2 Comparison of 2010 Planned Water Conservation Programs with 2015 Actual Programs8-3
8.3.3 Filing of 2015 UWMP........................................................................................................ 8-3
References ................................................................................................................................................. 8-4
TABLES Table 1-1: Plan Identification ...................................................................................................................... 1-2
Table 1-2: Agency Identification ................................................................................................................. 1-3
Table 1-3: Public Water Systems ............................................................................................................... 1-7
Table 1-4: Water Supplier Information Exchange ...................................................................................... 1-8
arcadis.com iv

2015 URBAN WATER MANAGEMENT PLAN
Table 2-1: Population – Current and Projected .......................................................................................... 2-2
Table 2-2: Demands for Potable and Raw Water - Actual (AF) ................................................................. 2-3
Table 2-3: Water Loss Audit Summary (AF) .............................................................................................. 2-6
Table 2-4: Demands for Potable and Raw Water - Projected (AF) ............................................................ 2-8
Table 2-5: Inclusion in Water Use Projections ........................................................................................... 2-8
Table 2-6: Total Water Demands (AF) ....................................................................................................... 2-9
Table 2-7: Household Distribution Based on Median Household Income ................................................2-10
Table 2-8: Projected Water Demands for Housing Needed for Low Income Households (AF) ...............2-10
Table 2-9: Baselines and Targets Summary ............................................................................................2-13
Table 2-10: 2015 Compliance ..................................................................................................................2-14
Table 3-1: Metropolitan Colorado River Aqueduct Program Capabilities .................................................. 3-6
Table 3-2: Groundwater Volume Pumped (AF) ........................................................................................3-13
Table 3-3: Water Supplies, Actual (AF) ....................................................................................................3-14
Table 3-4: Water Supplies, Projected (AF) ...............................................................................................3-15
Table 3-5: Basis of Water Year Data (AF) ................................................................................................3-20
Table 3-6: Normal Year Supply and Demand Comparison (AF) ..............................................................3-21
Table 3-7: Single Dry Year Supply and Demand Comparison (AF) .........................................................3-21
Table 3-8: Multiple Dry Years Supply and Demand Comparison (AF) ....................................................3-22
Table 4-1: Water Waste Prohibition ........................................................................................................... 4-2
Table 4-2: Water Rates Effective July 1, 2015 ........................................................................................... 4-3
Table 5-1: Stages of Water Shortage Contingency Plan ........................................................................... 5-4
Table 5-2: Minimum Supply Next Three Years (AF) .................................................................................. 5-5
Table 5-3: Restrictions and Prohibitions on End Uses ............................................................................... 5-7
Table 5-4: Stages of Water Shortage Contingency Plan - Consumption Reduction Methods .................5-13
Table 5-5: Revenue Impact Analysis ........................................................................................................5-13
Table 6-1: Wastewater Collected Within Service Area in 2015 .................................................................. 6-3
Table 6-2: 2010 UWMP Recycled Water Use Projection Compared to 2015 Actual (AF) ......................... 6-5
Table 6-3: 2010 UWMP Recycled Water Use Projection Compared to 2015 Actual (AF) ......................... 6-6
Table 8-1: External Coordination and Outreach ......................................................................................... 8-1
Table 8-2: Notification to Cities and Counties ............................................................................................ 8-2
arcadis.com v

2015 URBAN WATER MANAGEMENT PLAN
FIGURES Figure 1-1: Regional Location of Urban Water Supplier ............................................................................ 1-5
Figure 1-2: City of Santa Ana Service Area ............................................................................................... 1-6
Figure 3-1: Water Supply Sources in the City (AF) .................................................................................... 3-1
Figure 3-2: Map of the Orange County Groundwater Basin and its Major Aquifer Systems ..................... 3-9
Figure 5-1: Resource Stages, Anticipated Actions, and Supply Declarations ........................................... 5-2
APPENDICES A UWMP Checklist
B Standardized Tables
C Groundwater Management Plan
D City Ordinance
E Notification of Public and Service Area Suppliers
F Adopted UWMP Resolution
G Bump Methodology
H AWWA Water Loss Audit Worksheet
I Water Use Efficiency Implementation Report
arcadis.com vi

2015 URBAN WATER MANAGEMENT PLAN
ACRONYMS AND ABBREVIATIONS 20x2020 20% water use reduction in GPCD by year 2020 Act Urban Water Management Planning Act AF Acre-Feet AFY Acre-Feet per Year AMI Advanced Metering Infrastructure AWWA American Water Works Association BEA Basin Equity Assessment Biops Biological Opinions BMP Best Management Practice BPP Basin Production Percentage CCC California Coastal Commission CDR Center for Demographic Research CECs Constituents of Emerging Concern CII Commercial/Industrial/Institutional City City of Santa Ana CRA Colorado River Aqueduct CUP Conjunctive Use Program CVP Central Valley Project Delta Sacramento-San Joaquin River Delta DMM Demand Management Measure DOF Department of Finance DWR Department of Water Resources EIR Environmental Impact Report EOC Emergency Operation Center FY Fiscal Year GAP Green Acres Project GCM General Circulation Model GPCD Gallons per Capita per Day GPM Gallons per Minute GWRS Groundwater Replenishment System HCF Hundred Cubic Feet IPR Indirect Potable Reuse IRP Integrated Water Resource Plan IWA International Water Association LBCWD Laguna Beach County Water District LRP Local Resources Program LTFP Long-Term Facilities Plan MAF Million Acre-Feet MARS Member Agency Response System
arcadis.com vii
2015 URBAN WATER MANAGEMENT PLAN
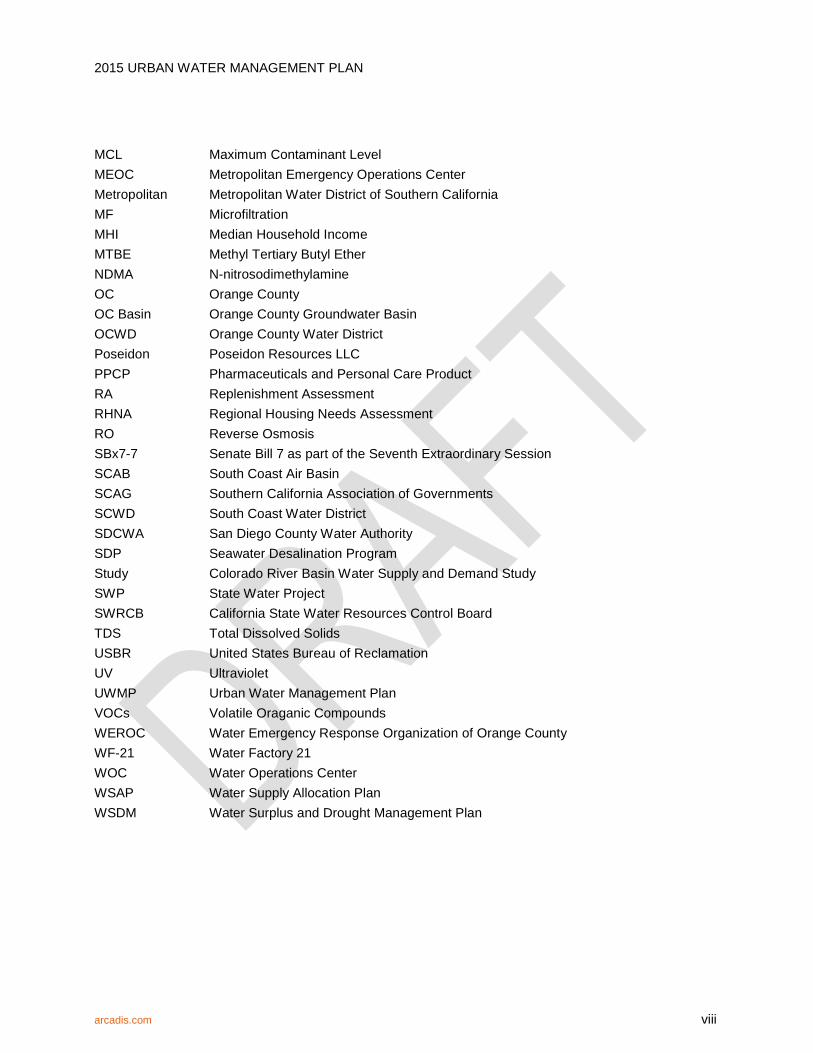
MCL Maximum Contaminant Level MEOC Metropolitan Emergency Operations Center Metropolitan Metropolitan Water District of Southern California MF Microfiltration MHI Median Household Income MTBE Methyl Tertiary Butyl Ether NDMA N-nitrosodimethylamine OC Orange County OC Basin Orange County Groundwater Basin OCWD Orange County Water District Poseidon Poseidon Resources LLC PPCP Pharmaceuticals and Personal Care Product RA Replenishment Assessment RHNA Regional Housing Needs Assessment RO Reverse Osmosis SBx7-7 Senate Bill 7 as part of the Seventh Extraordinary Session SCAB South Coast Air Basin SCAG Southern California Association of Governments SCWD South Coast Water District SDCWA San Diego County Water Authority SDP Seawater Desalination Program Study Colorado River Basin Water Supply and Demand Study SWP State Water Project SWRCB California State Water Resources Control Board TDS Total Dissolved Solids USBR United States Bureau of Reclamation UV Ultraviolet UWMP Urban Water Management Plan VOCs Volatile Oraganic Compounds WEROC Water Emergency Response Organization of Orange County WF-21 Water Factory 21 WOC Water Operations Center WSAP Water Supply Allocation Plan WSDM Water Surplus and Drought Management Plan
arcadis.com viii

2015 URBAN WATER MANAGEMENT PLAN
1 INTRODUCTION
1.1 Urban Water Management Plan Requirements Water Code Sections 10610 through 10656 of the Urban Water Management Planning Act (Act) require every urban water supplier providing water for municipal purposes to more than 3,000 customers or supplying more than 3,000 acre-feet (AF) of water annually to prepare, adopt, and file an Urban Water Management Plan (UWMP) with the California Department of Water Resources (DWR) every five years in the years ending in zero and five. The 2015 UWMP updates are due to DWR by July 1, 2016.
This 2015 UWMP provides a detailed summary of present and future water resources and demands and provides an assessment of the City of Santa Ana's (City) water resource needs. Specifically, the UWMP provides water supply planning for a 25-year planning period in five-year increments and identifies water supplies needed to meet existing and future demands. The demand analysis must identify supply reliability under three hydrologic conditions: a normal year, a single-dry year, and multiple-dry years. The City’s 2015 UWMP updates the 2010 UWMP in compliance with the requirements of the Act as amended in 2009, and includes a discussion of:
• Water Service Area and Facilities
• Water Sources and Supplies
• Water Use by Customer Type
• Demand Management Measures
• Water Supply Reliability
• Planned Water Supply Projects and Programs
• Water Shortage Contingency Plan
• Recycled Water Use
Since the original Act's passage in 1983, several amendments have been added. The most recent changes affecting the 2015 UWMP include Senate Bill 7 as part of the Seventh Extraordinary Session (SBx7-7) and SB 1087. SBx7-7, or the Water Conservation Act of 2009, is part of the Delta Action Plan that stemmed from the Governor’s goal to achieve a 20 percent statewide reduction in urban per capita water use by 2020 (20x2020). Reduction in water use is an important part of this plan that aims to sustainably manage the Bay Delta and reduce conflicts between environmental conservation and water supply; it is detailed in Section 3.2.2. SBx7-7 requires each urban retail water supplier to develop urban water use targets to achieve the 20x2020 goal and the interim ten percent goal by 2015. Each urban retail water supplier must include in its 2015 UWMPs the following information from its target-setting process:
• Baseline daily per capita water use
• 2020 Urban water use target
• 2015 Interim water use target compliance
arcadis.com 1-1

2015 URBAN WATER MANAGEMENT PLAN
• Compliance method being used along with calculation method and support data
• An implementation plan to meet the targets
The other recent amendment, made to the UWMP on September 19, 2014, is set forth by SB 1420, Distribution System Water Losses. SB 1420 requires water purveyors to quantify distribution system losses for the most recent 12-month period available. The water loss quantification is based on the water system balance methodology developed by the American Water Works Association (AWWA).
The sections in this UWMP correspond to the outline of the Act, specifically Article 2, Contents of Plans, Sections 10631, 10632, and 10633. The sequence used for the required information, however, differs slightly in order to present information in a manner reflecting the unique characteristics of the City’s water utility. The UWMP Checklist has been completed, which identifies the location of Act requirements in this Plan and is included in Appendix A. This is an individual UWMP for a retail agency, as shown in Tables 1-1 and 1-2. Table 1-2 also indicates the units that will be used throughout this document.
Table 1-1: Plan Identification
Plan Identification
Select Only One
Type of Plan Name of RUWMP or Regional Alliance
Individual UWMP
Water Supplier is also a member of a RUWMP
Water Supplier is also a member of a Regional Alliance Orange County 20x2020 Regional Alliance
Regional Urban Water Management Plan (RUWMP)
NOTES:
arcadis.com 1-2

2015 URBAN WATER MANAGEMENT PLAN
Table 1-2: Agency Identification
Agency Identification
Type of Agency Agency is a wholesaler
Agency is a retailer
Fiscal or Calendar Year
UWMP Tables Are in Calendar Years
UWMP Tables Are in Fiscal Years
If Using Fiscal Years Provide Month and Date that the Fiscal Year Begins (mm/dd)
7/1
Units of Measure Used in UWMP
Unit AF
NOTES:
1.2 Agency Overview The City was, for many years, a ranching community with some farming. To serve this growing agricultural and domestic community, a municipal water system was formed in 1886. The original source of water supply for the City was from shallow irrigation wells. As the City continued to grow and change from agriculture to an urban community, the need for additional sources of water was recognized if economic development were to continue.
To tap into water sources from outside the area, the City joined with 12 other southern California cities to form and be an original member agency of the Metropolitan Water District of Southern California (Metropolitan) on February 27, 1931. Metropolitan, as a regional wholesaler, supplies imported water to Southern California from the Colorado River and from the State Water Project from Northern California. Metropolitan’s primary purpose is to develop, store and distribute water at wholesale rates to its member public agencies for domestic and municipal uses.
In 1933, the Orange County Water District (OCWD) was formed by a special act of the State Legislature to manage Orange County’s groundwater supply and protection of the County’s rights to water in the Santa Ana River. In 1953, the City became a member of OCWD.
The City is governed by a non-partisan seven-member City Council, elected to serve staggered four-year terms, except for the Mayor, who serves a two-year term. The City Council appoints the City Manager and various members of commissions, committees, and citizen advisory groups, all of which may weigh in on water management issues and decisions for the City. The current Council members are
arcadis.com 1-3
2015 URBAN WATER MANAGEMENT PLAN
• Miguel Pulido, Mayor
• Vicente Sarmiento, Mayor Pro Tem (Ward 1)
• Michele Martinez (Ward 2)
• Angelica Amezcua (Ward 3)
• David Benavides (Ward 4)
• Roman A. Reyna (Ward 5)
• Sal Tinajero (Ward 6)
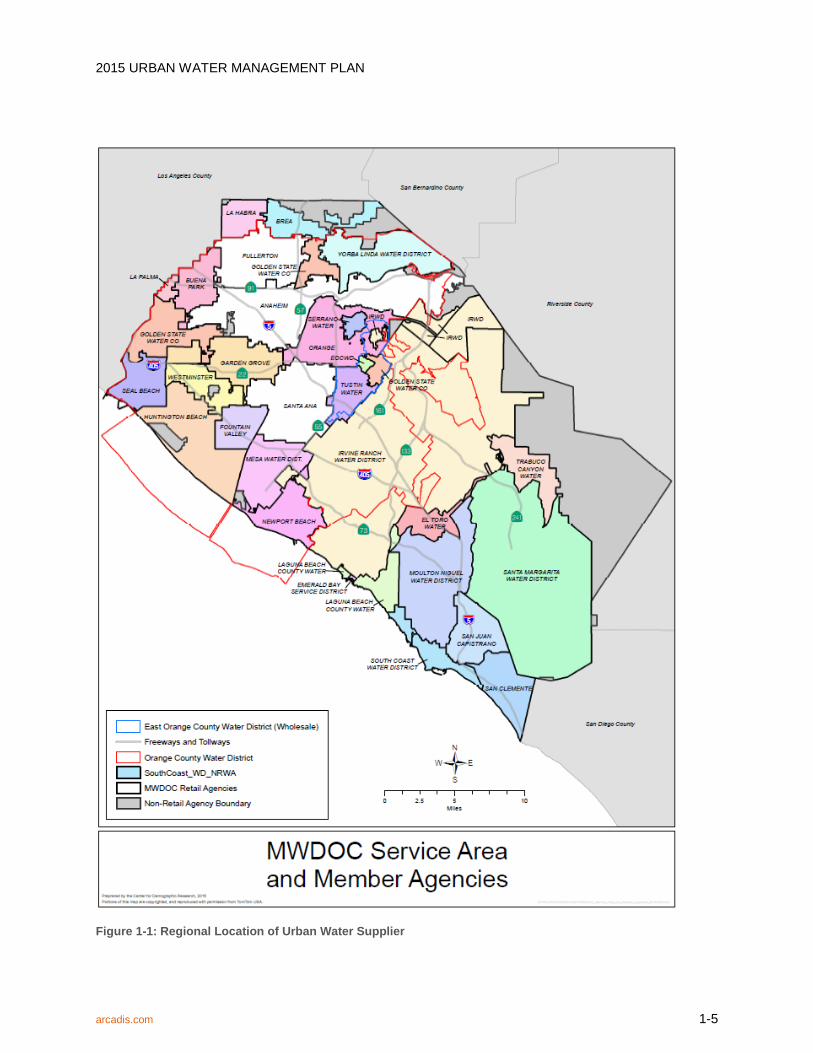
The City receives its water from two main sources, local well water from the Lower Santa Ana River Groundwater Basin, also known as the Orange County Groundwater Basin (OC Basin), which is managed by OCWD, and imported water from Metropolitan. The City is a member agency of Metropolitan. The City’s location is shown on Figure 1-1.
arcadis.com 1-4
2015 URBAN WATER MANAGEMENT PLAN
Figure 1-1: Regional Location of Urban Water Supplier
arcadis.com 1-5

2015 URBAN WATER MANAGEMENT PLAN
1.3 Service Area and Facilities
1.3.1 City of Santa Ana Service Area The City is in the heart of Orange County and rated eleventh largest in California. The City’s Water Utility provides water service within a 27-square mile service area. The service area includes the City of Santa Ana and a small neighborhood in the City of Orange, near Tustin Avenue and Fairhaven by the northeast corner of Santa Ana. A map of the City’s service area is shown in Figure 1-2.
Figure 1-2: City of Santa Ana Service Area
arcadis.com 1-6

2015 URBAN WATER MANAGEMENT PLAN
1.3.2 City of Santa Ana Water Facilities The City maintains 444 miles of transmission and distribution mains, nine reservoirs with a storage capacity of 49.3 million gallons, seven pumping stations, 20 wells, and seven import water connections.
Thirteen of the City wells pump into surface reservoirs with booster stations pumping the water into the distribution system. The remaining wells pump directly into the City’s distribution system. Water pumped from these wells has been naturally filtered as it passes through underlying aquifers of sand, gravel, and soil. This well water only requires disinfectant treatment for system distribution.
The City maintains seven imported water connections to receive water through Metropolitan’s Orange County and East Orange County Feeder pipelines. Seven metered connections with a total capacity of 60,580 gallons per minute (gpm) transfer water into the City’s distribution system.
System Pressures – Reducing distribution system pressures will, to a certain degree, conserve water and pumping energy by reducing leaking in water and plumbing systems, as well as reducing waste or water when turning water fixtures on and off. The City continually reviews the pressure zones to determine the feasibility of reducing system pressures by lowering settings on distribution system pressure regulators. The reviews have indicated that potential fire protection requirement deficiencies occur when pressures are reduced. Therefore, the City maintains safe yet efficient system pressures.
Peak Demand – Water system demand patterns are a result of climatological, land use, sociological, and institutional factors, all of which affect the amount of water consumed. Reduction in peak demands can reduce the need for construction of new water storage and conveyance facilities and, in certain instances, the development of new water sources. The City’s computerized telemetry system allows water system operators to operate the system more efficiently through the ability to stage and prioritize water production facilities usage to meet these ever changing demand patterns.
The system connections and water volume supplied are summarized in Table 1-3, and the wholesalers informed of this water use as required are displayed in Table 1-4.
Table 1-3: Public Water Systems
Retail Only: Public Water Systems
Public Water System Number
Public Water System Name
Number of Municipal Connections 2015
Volume of Water Supplied
2015
CA3010038 City of Santa Ana 44,610 36,656
TOTAL 44,610 36,656 NOTES:
arcadis.com 1-7
2015 URBAN WATER MANAGEMENT PLAN
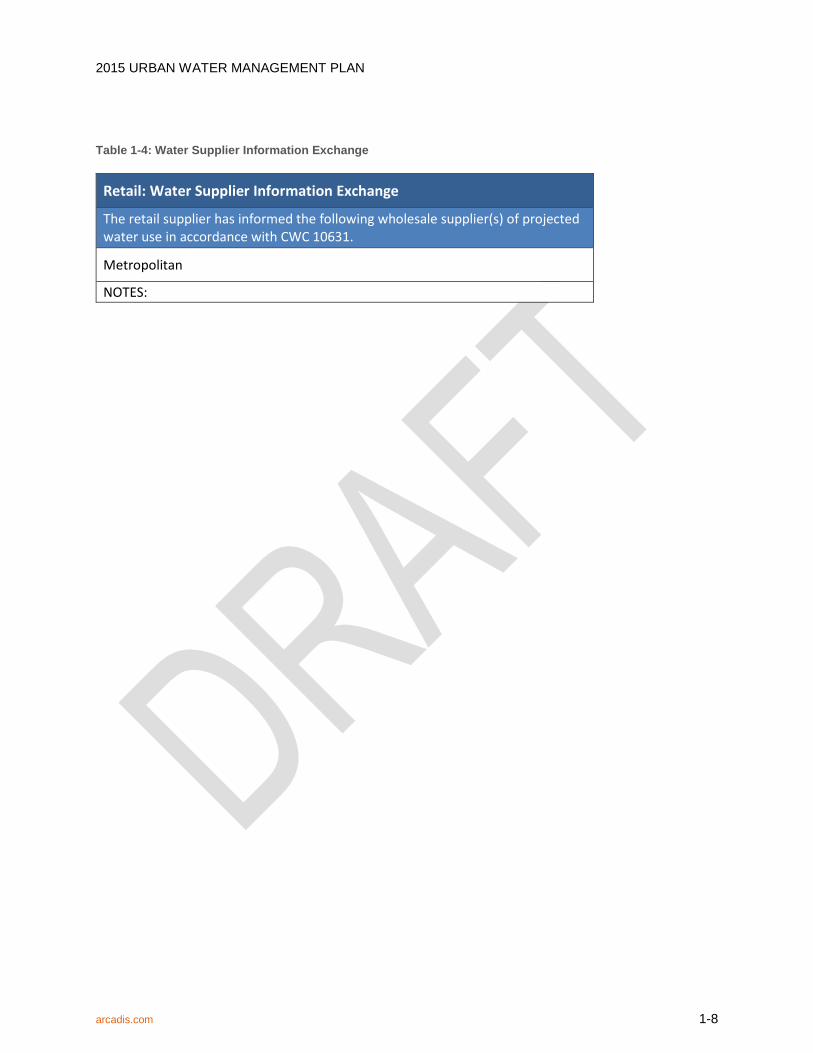
Table 1-4: Water Supplier Information Exchange
Retail: Water Supplier Information Exchange
The retail supplier has informed the following wholesale supplier(s) of projected water use in accordance with CWC 10631.
Metropolitan
NOTES:
arcadis.com 1-8
2015 URBAN WATER MANAGEMENT PLAN
2 DEMANDS
2.1 Overview Since the last UWMP update, southern California’s urban water demand has been largely shaped by the efforts to comply with SBx7-7. This law requires all California retail urban water suppliers serving more than 3,000 acre-feet per year (AFY) or 3,000 service connections to achieve a 20 percent water demand reduction (from a historical baseline) by 2020. The City has been actively engaged in efforts to reduce water use in its service area to meet the 2015 interim 10 percent reduction and the 2020 final water use target. Meeting this target is critical to ensure the City’s eligibility to receive future state water grants and loans.
In April 2015 Governor Brown issued an Emergency Drought Mandate as a result of one of the most severe droughts in California’s history, requiring a collective reduction in statewide urban water use of 25 percent by February 2016, with each agency in the state given a specific reduction target by DWR. In response to the Governor’s mandate, the City is carrying out more aggressive conservation efforts. It is also implementing higher (more restrictive) stages of its water conservation ordinance in order to achieve its demand reduction target of 12 percent set for the City itself and the Regional Alliance of all participating MWDOC utility agencies (discussed later in Section 2.5).
In addition to local water conservation ordinances, the City partnered with Metropolitan on educational programs, indoor retrofits and training. The City has implemented turf removal, an art contest, pole banners, lawn signs, and neighborhood association meetings to promote water conservation, as detailed in Section 4.
These efforts have been part of statewide water conservation ordinances that require watering landscape watering, serving water in restaurants and bars, and reducing the amount of laundry cleaned by hotels. Further discussion on the City’s water conservation ordinance is covered in Section 5 Water Supplies Contingency Plan.
This section analyzes the City’s current water demands by customer type, factors that influence those demands, and projections of future water demands for the next 20 years. In addition, to satisfy SBx7-7 requirements, this section provides details of the City’s SBx7-7 compliance method selection, baseline water use calculation, and 2015 and 2020 water use targets.
2.2 Factors Affecting Demand Water demands within the City’s service area are dependent on many factors such as local climate conditions and the evolving hydrology of the region, demographics, land use characteristics, and economics. In addition to local factors, southern California’s imported water sources are also experiencing drought conditions that impact availability of current and future water supplies.
arcadis.com 2-1

2015 URBAN WATER MANAGEMENT PLAN
2.2.1 Climate Characteristics The City is located within the South Coast Air Basin (SCAB) that encompasses all of Orange County, and the urban areas of Los Angeles, San Bernardino, and Riverside counties. The SCAB climate is characterized by southern California’s “Mediterranean” climate: a semi-arid environment with mild winters, warm summers and moderate rainfall.
Local rainfall has limited impacts on reducing demand for the City. Water that infiltrates into the soil may enter groundwater supplies depending on the local geography. However, due to the large extent of impervious cover in southern California, rainfall runoff quickly flows to a system of concrete storm drains and channels that lead directly to the ocean. OCWD is one agency that has successfully captured stormwater along the Santa Ana River and in recharge basins for years and used it as an additional source of supply for groundwater recharge.
Metropolitan's water supplies come from the State Water Project (SWP) and the Colorado River Aqueduct (CRA), influenced by climate conditions in northern California and the Colorado River Basin, respectively. Both regions have been suffering from multi-year drought conditions with record low precipitation which directly impact water supplies to southern California.
2.2.2 Demographics The City has a 2015 population of 335,299 according to the California State University at Fullerton’s Center of Demographics Research (CDR). The City is almost completely built-out, and its population is projected to increase only 0.9 percent by 2040, representing an average growth rate of 0.005 percent every five years.
Growth projections have decreased slightly since the 2010 UWMP. Vacant land within the City is very limited while existing housing is becoming denser and new residential units are multi-storied. Table 2-1 shows the population projections in five-year increments out to 2040 within the City’s service area.
Table 2-1: Population – Current and Projected
Retail: Population - Current and Projected
Population Served 2015 2020 2025 2030 2035 2040
335,299 336,975 338,660 340,354 342,055 343,766
NOTES: Center for Demographic Research, California State University, Fullerton 2015
2.2.3 Land Use The City’s service area can best be described as a predominately residential single and multi-family community located in central Orange County.
arcadis.com 2-2
2015 URBAN WATER MANAGEMENT PLAN
2.3 Water Use by Customer Type An agency’s water consumption can be projected by understanding the type of use and customer type creating the demand. Developing local water use profiles helps to identify quantity of water used as well as when, where, how, and by whom water is used within the agency’s service area. A comprehensive profile of the agency’s service area enables the impacts of water conservation efforts to be assessed and to project the future benefit of water conservation programs.
The following sections of this UWMP provide an overview of the City’s water consumption by customer account type as follows:
• Single-family Residential
• Multi-family Residential
• Commercial
• Institutional/ Government
Other water uses including non-revenue water are also discussed in this section.
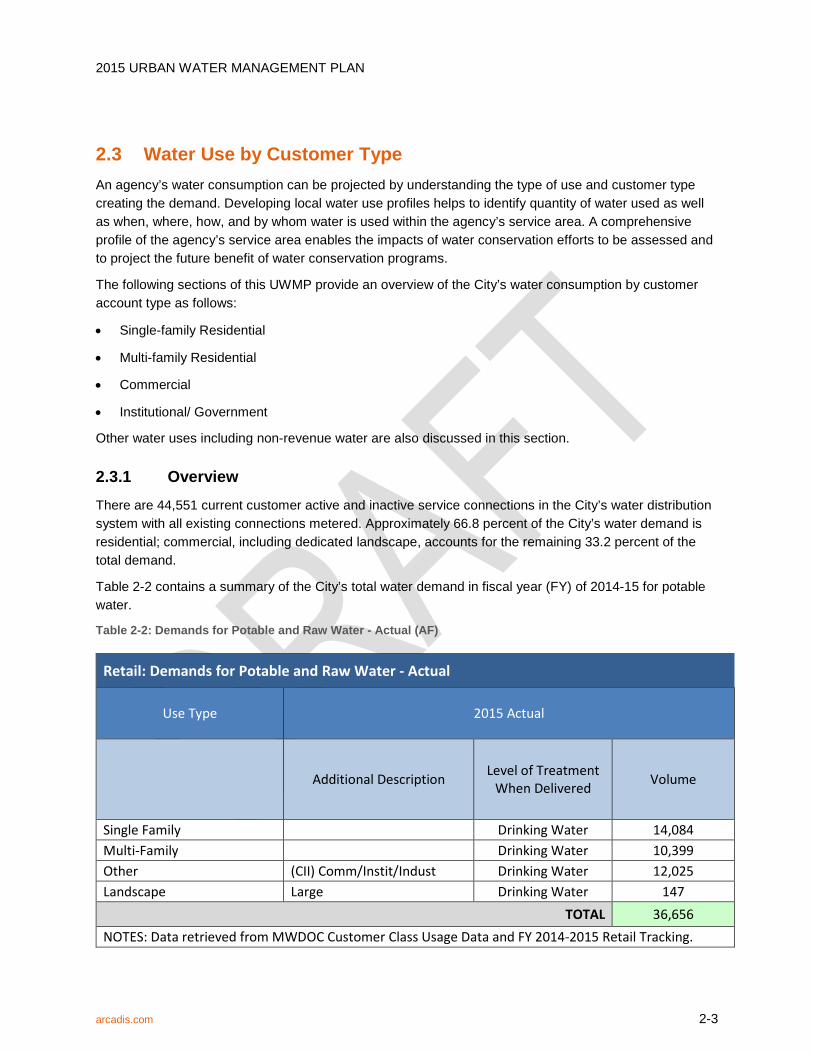
2.3.1 Overview There are 44,551 current customer active and inactive service connections in the City’s water distribution system with all existing connections metered. Approximately 66.8 percent of the City’s water demand is residential; commercial, including dedicated landscape, accounts for the remaining 33.2 percent of the total demand.
Table 2-2 contains a summary of the City’s total water demand in fiscal year (FY) of 2014-15 for potable water.
Table 2-2: Demands for Potable and Raw Water - Actual (AF)
Retail: Demands for Potable and Raw Water - Actual
Use Type 2015 Actual
Additional Description Level of Treatment When Delivered Volume
Single Family Drinking Water 14,084 Multi-Family Drinking Water 10,399 Other (CII) Comm/Instit/Indust Drinking Water 12,025 Landscape Large Drinking Water 147
TOTAL 36,656 NOTES: Data retrieved from MWDOC Customer Class Usage Data and FY 2014-2015 Retail Tracking.
arcadis.com 2-3

2015 URBAN WATER MANAGEMENT PLAN
2.3.2 Non-Residential Non-residential use includes commercial, industrial, institutional water demands. Institutional water use accounts for 4 percent of total non-residential water demands and commercial accounts for 52.3 percent of total non-residential water demand. The City has a mix of commercial uses (markets, restaurants, etc.), public entities (schools, fire stations and government offices), office complexes, light industrial and warehouses.
2.3.3 Sales to Other Agencies The City does not sell water to other agencies although it does maintain emergency interconnections with neighboring cities and water districts.
2.3.4 Non-Revenue Water Non-revenue water is defined by the International Water Association (IWA) as the difference between distribution systems input volume (i.e. production) and billed authorized consumption. Non-revenue water consists of three components: unbilled authorized consumption (e.g. hydrant flushing, firefighting, and blow-off water from well start-ups), real losses (e.g. leakage in mains and service lines, and storage tank overflows), and apparent losses (unauthorized consumption, customer metering inaccuracies and systematic data handling errors).
A water loss audit was conducted per AWWA methodology for the City to understand the relationship between water loss, operating costs and revenue losses. This audit was developed by the IWA Water Loss Task Force as a universal methodology that could be applied to any water distribution system. This audit meets the requirements of SB 1420 that was signed into law in September 2014. Understanding and controlling water loss from a distribution system is an effective way for the City to achieve regulatory standards and manage their existing resources.
2.3.4.1 AWWA Water Audit Methodology
There are five data categories that are part of the AWWA Water Audit: 1) Water Supplied 2) Authorized Consumption 3) Water Losses 4) System Data and 5) Cost Data. Data was compiled from questionnaires, invoices, meter test results, and discussion with the City. Each data value has a corresponding validation score that evaluates the City’s internal processes associated with that data entry. The scoring scale is 1-10 with 10 representing best practice.
The Water Supplied section represents the volume of water the City delivered from its own sources, purchased imported water, or water that was either exported or sold to another agency. Validation scores for each supply source correspond to meter accuracy and how often the meters are calibrated. If the calibration results of supply meters were provided, a weighted average of errors was calculated for master meter adjustment. This adjustment factor was applied to reported supply volumes for meters that were found to register either over or under the true volume. Validity scores for meter adjustment are based on how often the meter is read and what method is used.
The Authorized Consumption section breaks down consumption of the volume of Water Supplied. Billed metered water is billed and delivered to customers and makes up the majority of an agency’s
arcadis.com 2-4
2015 URBAN WATER MANAGEMENT PLAN
consumption. Billed unmetered water is water that is delivered to a customer for a set fee but the actual quantity of water is not metered. Customer accounts for this type of use are typically determined by utility policy. Unbilled metered water is the volume used and recorded, but the customer is not charged. This volume is typically used for City facilities per City policy. Unbilled unmetered water is authorized use that is neither billed nor metered which typically includes activities such as firefighting, flushing of water mains and sewers, street cleaning, and fire flow testing. The AWWA Water Audit recommends using the default value of 1.25 percent to represent this use, as calculating an accurate volume is often tedious due to the many different components involved and it represents a small portion of the City’s overall use. For each consumption type listed above the associated validation score reflects utility policy for customer accounts, frequency of meter testing and replacement, computer-based billing and transition to electronic metering systems.
Water Losses are defined as the difference between the volume of water supplied and the volume of authorized consumption. Water losses are further broken down into apparent and real losses. Apparent losses include unauthorized consumption, customer meter inaccuracies and systematic data handling errors. Default percentages were provided for the Audit by AWWA for unauthorized consumption and systematic data handling error as this data is not often available. The corresponding default validation score assigned is 5 out of 10. A discrete validation score was included for customer meter inaccuracies to represent quality of meter testing records, testing procedures for meter accuracy, meter replacement cycles, and inclusion of new meter technology.
System Data includes information about the City’s physical distribution system and customer accounts. The information included is: length of mains, number of active and inactive service connections, location of customer meters in relation to the property line, and the average operating pressure of the system. The number of service connections is automatically divided by the length of mains to find the service connection density of the system. The calculated service connection density determines which performance indicators best represent a water system’s real loss performance. The validity scores in this section relate to the water system’s policies and procedures for calculating and documenting the required system data, quality of records kept, integration with an electronic database including GIS and SCADA, and how often this data is verified.
The final section is Cost Data and contains three important financial values related to system operation, customer cost and water production. The total annual cost of operating the water system, customer retail unit cost and the variable production cost per AF are included. The customer retail unit value is applied to the apparent losses to determine lost revenue, while the variable production cost is typically applied to real losses. In water systems with scarce water supplies, a case can be made for real losses to be valued at the retail rate, as this volume of water could be sold to additional customers if it were not lost.] Validity scores for these items consider how often audits of the financial data and supporting documents are compiled and if third-party accounting professionals are part of the process.
Calculations based on the entered and sufficiently valid data produce a series of results that help the City quantify the volume and financial impacts of water loss and facilitate comparison of the City’s water loss performance with that of other water systems who have also performed water loss audits using the AWWA methodology. The City’s Data Validity Score was 74 out of 100, with a total water loss volume of 677 AFY. The Non-Revenue Water volume represents 1.9 percent of the total water supplied by the City. The value of non-revenue water is calculated to be $814,980 per year.
arcadis.com 2-5

2015 URBAN WATER MANAGEMENT PLAN
The Infrastructure Leakage Index (ILI) is a performance indicator developed from the ratio of Current Annual Real Losses (CARL) to the Unavoidable Annual Real Losses (UARL). CARL was developed as part of the workbook and explained as real losses above. UARL is developed on a per system basis with an equation based on empirical data, developed by IWA that factors in the length of mains (including fire hydrant laterals), number of service connections, average distance of customer service connection piping between the curb stop and the customer meter and the total length of customer service piping, all multiplied by average system pressure. The City received an ILI score of 0.15 which taken at face value is a very high score and indicates that real losses are well managed. This value suggests that the City’s real loss volume is beneath the technically achievable minimum, which is possible but unlikely. This requires further field investigation of leakage if leakage detection and control practices are not extensively implemented and/or, given the Data Validity Score for some components in the Audit, further investigation/confirmation of entries such as water supplied/accuracy of supply meters, accuracy of customer meters, systematic data handling errors, and applicability of the default percentages applied in the audit.
Apparent losses make up a significant portion of the City’s total water loss at 80 percent; most of this was developed from default percentages provided by the AWWA Water Audit. Based on this information, the City can improve water loss by taking a closer look at apparent losses and developing a strategy to better quantify this data in the future. The overall Water Audit score can also be improved by meeting the standards AWWA has developed for each data point through clear City procedures and reliable data.
The result of the AWWA Water Audit completed for the City as required by the 2015 UWMP is summarized in Table 2-4. The water loss summary was calculated over a one-year period from available data and the methodology explained above.
Table 2-3: Water Loss Audit Summary (AF)
Retail: 12 Month Water Loss Audit Reporting
Reporting Period Start Date (mm/yyyy) Volume of Water Loss
07/2014 677
NOTES:
2.4 Demand Projections Demand projections were developed by MWDOC for each agency within the Regional Alliance based on available data as well as land use, population and economic growth. Three trajectories were developed representing three levels of conservation: 1) continued with existing levels of conservation (lowest conservation), 2) addition of future passive measures and active measures (baseline conservation), and 3) aggressive turf removal program - 20 percent removal by 2040 (aggressive conservation). The baseline demand projection was selected for the 2015 UWMP. The baseline scenario assumes the implementation of future passive measures affecting new developments, including the Model Water Efficient Landscape, plumbing code efficiencies for toilets, and expected plumbing code for high-
arcadis.com 2-6
2015 URBAN WATER MANAGEMENT PLAN
efficiency clothes washers. It also assumes the implementation of future active measures, assuming the implementation of Metropolitan incentive programs at historical annual levels seen in Orange County.
2.4.1 Demand Projection Methodology The water demand projections were an outcome of the Orange County (OC) Reliability Study led by MWDOC where demand projections were divided into three regions within Orange County: Brea/La Habra, OC Basin, and South County. The demand projections were obtained based on multiplying a unit water use factor and a demographic factor for three water use sectors, including single-family and multi-family residential (in gallons per day per household), and non-residential (in gallons per day per employee). The unit water use factors were based on the survey of Orange County water agencies (FY 2013-14) and represent a normal weather, normal economy, and non-drought condition. The demographic factors are future demographic projections, including the number of housing units for single and multi-family residential sectors and the total employment (number of employees) for the non-residential sector, as provided by CDR.
The OC Reliability Study accounted for drought impacts on 2016 demands by applying the assumption that water demands will bounce back to 85 percent of 2014 levels (i.e. pre-drought levels) by 2020 and 90 percent by 2025 without future conservation, and continue at 90 percent of unit water use through 2040. The unit water use factor multiplied by a demographic factor yields demand projections without new conservation. To account for new implementation of conservation, projected savings from new passive and active conservation as a result of plumbing codes, water model efficiency landscape ordinance, and rebates from Metropolitan were excluded from these demands.
As described above, the OC Reliability Study provided demand projections for three regions within Orange County: Brea/La Habra, OC Basin, and South County. The City’s water demand represents a portion of the OC Basin region total demand. The City’s portion was estimated as the percentage of the City’s five-year (FY 2010-11 to FY 2014-15) average usage compared to the OC Basin region total demand for the same period.
2.4.2 Agency Refinement Demand projections were developed by MWDOC for the City as part of the OC Reliability Study. The future demand projections were reviewed and accepted by the City as a basis for the 2015 UWMP.
2.4.3 25 Year Projections A key component of the 2015 UWMP is to provide insight into the City’s future water demand outlook. The City’s current total water demand is 36,655 AFY, met through locally pumped groundwater and purchased imported water from Metropolitan. Table 2-4 is a projection of the City’s water demand for the next 25 years.
arcadis.com 2-7

2015 URBAN WATER MANAGEMENT PLAN
Table 2-4: Demands for Potable and Raw Water - Projected (AF)
Retail: Demands for Potable and Raw Water - Projected
Use Type
Additional Description
Projected Water Use
2020 2025 2030 2035 2040
Single Family 14,092 15,137 15,241 15,237 15,259
Multi-Family 10,405 11,177 11,254 11,251 11,267
Other (CII) Comm/Instit/Indust 12,033 12,925 13,014 13,010 13,030
Landscape Large 148 158 160 160 160
TOTAL 36,678 39,397 39,669 39,658 39,716 NOTES: Data retrieved from MWDOC Customer Class Usage Data and FY 2014-2015 Retail Tracking.
The above demand values were provided by MWDOC and reviewed by the City as part of the UWMP effort. The City will aim to decrease its reliance on imported water by pursuing a variety of water conservation strategies, the City’s per capita water use is projected to decrease as detailed in section 2.5 below.
Table 2-5: Inclusion in Water Use Projections
Retail Only: Inclusion in Water Use Projections
Are Future Water Savings Included in Projections? (Refer to Appendix K of UWMP Guidebook Yes
If "Yes" to above, state the section or page number, in the cell to the right, where citations of the codes, ordinances, etc… utilized in demand projections are found.
Location in UWMP: Section 4.1
Are Lower Income Residential Demands Included In Projections? Yes
NOTES:
The demand data presented in this section accounts for passive savings in the future. Passive savings are water savings as a result of Codes, Standards, Ordinances, or Transportation and Land Use Plans as well as public outreach on water conservation and higher efficiency fixtures. Passive savings are
arcadis.com 2-8

2015 URBAN WATER MANAGEMENT PLAN
anticipated to continue for the next 25 years and will result in continued water saving and reduced consumption levels.
2.4.4 Total Water Demand Projections Based on the information provided above, the total demand for potable water is listed below in Table 2-6 below. Recycled water demand is projected to remain constant through the planning horizon.
Table 2-6: Total Water Demands (AF)
Retail: Total Water Demands
2015 2020 2025 2030 2035 2040
Potable and Raw Water 36,656 36,678 39,397 39,669 39,658 39,716
Recycled Water Demand 352 320 320 320 320 320
TOTAL WATER DEMAND 37,008 36,998 39,717 39,989 39,978 40,036
NOTES:
2.4.5 Water Use for Lower Income Households Since 2010, the UWMP Act has required retail water suppliers to include water use projections for single-family and multi-family residential housing for lower income and affordable households. This will assist the City in complying with the requirement under Government Code Section 65589.7 granting priority for providing water service to lower income households. A lower income household is defined as a household earning below 80 percent of the median household income (MHI).
DWR recommends retail suppliers rely on the housing elements of city or county general plans to quantify planned lower income housing with the City's service area (DWR, 2015 UWMP Guidebook, February 2016). The Regional Housing Needs Assessment (RHNA) assists jurisdictions in updating general plan's housing elements section. The RHNA identifies housing needs and assesses households by income level for the City through 2010 decennial Census and 2005-2009 American Community Survey data. The fifth cycle of the RHNA covers the planning period of October 2013 to October 2021. The Southern California Association of Governments (SCAG) adopted the RHNA Allocation Plan for this cycle on October 4, 2012 requiring housing elements updates by October 15, 2013. The California Department of Housing and Community Development reviewed the housing elements data submitted by jurisdictions in the SCAG region and concluded the data meets statutory requirements for the assessment of current housing needs.
The housing elements from the RHNA includes low income housing broken down into three categories: extremely low (less than 30 percent MHI), very low (31 percent - 50 percent MHI), and lower income (51
arcadis.com 2-9
2015 URBAN WATER MANAGEMENT PLAN
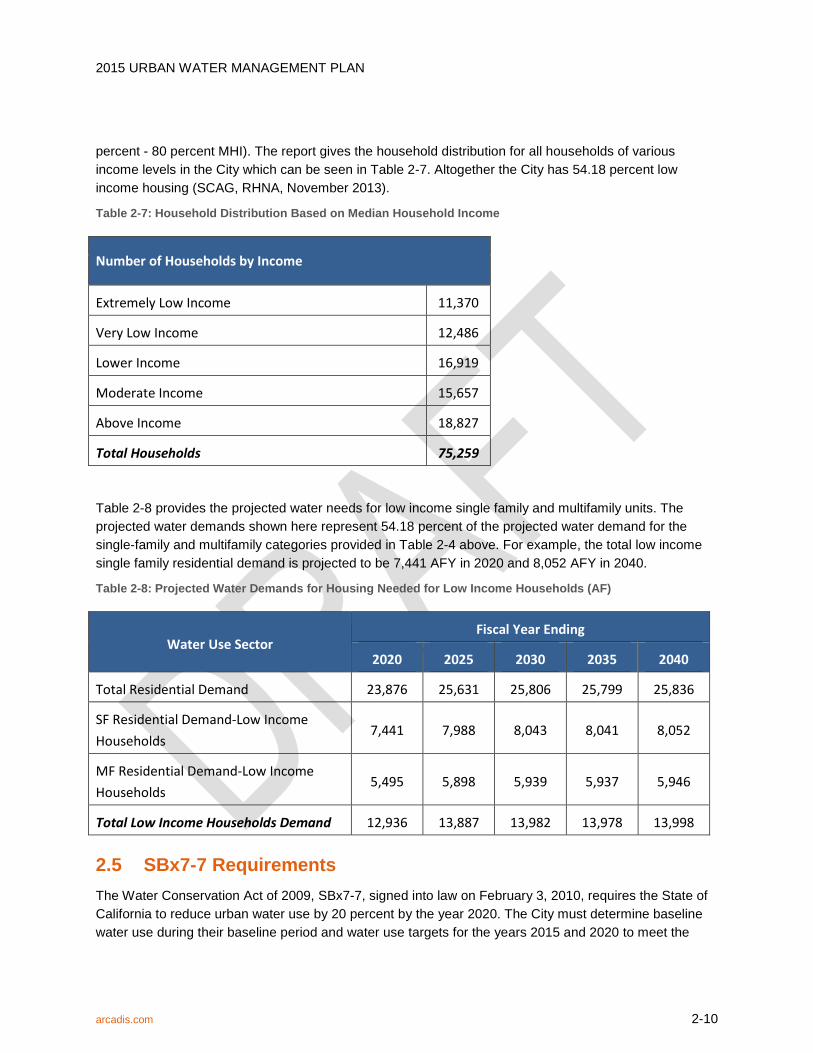
percent - 80 percent MHI). The report gives the household distribution for all households of various income levels in the City which can be seen in Table 2-7. Altogether the City has 54.18 percent low income housing (SCAG, RHNA, November 2013).
Table 2-7: Household Distribution Based on Median Household Income
Number of Households by Income
Extremely Low Income 11,370
Very Low Income 12,486
Lower Income 16,919
Moderate Income 15,657
Above Income 18,827
Total Households 75,259
Table 2-8 provides the projected water needs for low income single family and multifamily units. The projected water demands shown here represent 54.18 percent of the projected water demand for the single-family and multifamily categories provided in Table 2-4 above. For example, the total low income single family residential demand is projected to be 7,441 AFY in 2020 and 8,052 AFY in 2040.
Table 2-8: Projected Water Demands for Housing Needed for Low Income Households (AF)
Water Use Sector Fiscal Year Ending
2020 2025 2030 2035 2040
Total Residential Demand 23,876 25,631 25,806 25,799 25,836
SF Residential Demand-Low Income Households
7,441 7,988 8,043 8,041 8,052
MF Residential Demand-Low Income Households
5,495 5,898 5,939 5,937 5,946
Total Low Income Households Demand 12,936 13,887 13,982 13,978 13,998
2.5 SBx7-7 Requirements The Water Conservation Act of 2009, SBx7-7, signed into law on February 3, 2010, requires the State of California to reduce urban water use by 20 percent by the year 2020. The City must determine baseline water use during their baseline period and water use targets for the years 2015 and 2020 to meet the
arcadis.com 2-10

2015 URBAN WATER MANAGEMENT PLAN
state’s water reduction goal. The City may choose to comply with SBx7-7 individually or as a region in collaboration with other retail water suppliers. Under the regional compliance option, the City is still required to report its individual water use targets. The City is required to be in compliance with SBx7-7 either individually or as part of the alliance, or demonstrate they have a plan or have secured funding to be in compliance, in order to be eligible for water related state grants and loans on and after July 16, 2016.
For the 2015 UWMP, the City must demonstrate compliance with its 2015 water use target to indicate whether or not they are on track to meeting the 2020 water use target. The City also revised their baseline per capita water use calculations using 2010 U.S. Census data. Changes in the baseline calculations also result in updated per capita water use targets.
DWR also requires the submittal of SBx7-7 Verification Forms, a set of standardized tables to demonstrate compliance with the Water Conservation Act in this 2015 UWMP. This form is included as Appendix B.
2.5.1 Baseline Water Use The baseline water use is the City’s gross water use divided by its service area population, reported in gallons per capita per day (GPCD). Gross water use is a measure of water that enters the distribution system of the supplier over a 12-month period with certain allowable exclusions. These exclusions are:
• Recycled water delivered within the service area
• Indirect recycled water
• Water placed in long term storage
• Water conveyed to another urban supplier
• Water delivered for agricultural use
• Process water
Water suppliers within the OC Basin, including the City, have the option of choosing to deduct recycled water used for indirect potable reuse from their gross water use to account for the recharge of recycled water into the OC Basin by OCWD, historically through Water Factory 21, and now by the Groundwater Replenishment System (GWRS).
Water suppliers must report baseline water use for two baseline periods, the 10- to 15-year baseline (baseline GPCD) and the five-year baseline (target confirmation) as described below.
2.5.1.1 Ten to 15-Year Baseline Period (Baseline GPCD)
The first step to calculating the City’s water use targets is to determine its base daily per capita water use (baseline water use). This baseline water use is essentially the City’s gross water use divided by its service area population, reported in GPCD. The baseline water use is calculated as a continuous (rolling) 10-year average during a period, which ends no earlier than December 31, 2004 and no later than December 31, 2010. Water suppliers whose recycled water made up 10 percent or more of their 2008
arcadis.com 2-11
2015 URBAN WATER MANAGEMENT PLAN
retail water delivery can use up to a 15-year average for the calculation. The City did not have recycled water use in 2008; therefore, a 10-year baseline period is used.
The City’s baseline water use is 130 GPCD, obtained from the 10-year period July 1, 1995 to June 30, 2005.
2.5.1.2 Five-Year Baseline Period (Target Confirmation)
Water suppliers are required to calculate water use, in GPCD, for a five-year baseline period. This number is used to confirm that the selected 2020 target meets the minimum water use reduction requirements. Regardless of the compliance option adopted by the City, it will need to meet a minimum water use target of 5 percent reduction from the five-year baseline water use. This five-year baseline water use is calculated as a continuous five-year average during a period, which ends no earlier than December 31, 2007 and no later than December 31, 2010. The City’s five-year baseline water use is 122 GPCD, obtained from the five-year period July 1, 2003 to June 30, 2008.
2.5.1.3 Service Area Population
The City’s service area boundaries correspond with the boundaries for a city or census designated place. This allows the City to use service area population estimates prepared by the Department of Finance (DOF). The CDR at California State University, Fullerton is the entity which compiles population data for Orange County based on DOF data. The calculation of the City’s baseline water use and water use targets in the 2010 UWMP was based on the 2000 U.S. Census population numbers obtained from CDR. The baseline water use and water use targets in this 2015 UWMP have been revised based on the 2010 U.S. Census population obtained from CDR in 2012.
2.5.2 SBx7-7 Water Use Targets In the 2015 UWMP, the City may update its 2020 water use target by selecting a different target method than what was used in 2010. The target methods and determination of the 2015 and 2020 targets are described below.
2.5.2.1 SBx7-7 Target Methods
DWR has established four target calculation methods for urban retail water suppliers to choose from. The City is required to adopt one of the four options to comply with SBx7-7 requirements. The four options include:
• Option 1 requires a simple 20 percent reduction from the baseline by 2020 and 10 percent by 2015.
• Option 2 employs a budget-based approach by requiring an agency to achieve a performance standard based on three metrics
o Residential indoor water use of 55 GPCD
o Landscape water use commensurate with the Model Landscape Ordinance
o 10 percent reduction in baseline commercial/industrial/institutional (CII) water use
arcadis.com 2-12

2015 URBAN WATER MANAGEMENT PLAN
• Option 3 is to achieve 95 percent of the applicable state hydrologic region target as set forth in the State’s 20x2020 Water Conservation Plan.
• Option 4 requires the subtraction of Total Savings from the baseline GPCD:
o Total savings includes indoor residential savings, meter savings, CII savings, and landscape and water loss savings.
With MWDOC’s assistance in the calculation of the City’s base daily per capita use and water use targets, the City selected to comply with Option 3 consistent with the option selected in 2010.
2.5.2.2 2015 and 2020 Targets
Under Compliance Option 3, to achieve 95 percent of the South Coast Hydrologic Region target as set forth in the State’s 20x2020 Water Conservation Plan, the City’s 2015 target is 123 GPCD and the 2020 target is 116 GPCD as summarized in Table 2-9. The 2015 target is the midway value between the 10-year baseline and the confirmed 2020 target. In addition, the confirmed 2020 target needs to meet a minimum of five percent reduction from the five-year baseline water use. In this case, the confirmed 2020 target is the five percent reduction from the five-year baseline.
Table 2-9: Baselines and Targets Summary
Baselines and Targets Summary Retail Agency or Regional Alliance Only
Baseline Period Start Year End Year
Average Baseline GPCD*
2015 Interim Target *
Confirmed 2020
Target*
10-15 year 1996 2005 130 123 116
5 Year 2004 2008 122 *All values are in Gallons per Capita per Day (GPCD) NOTES:
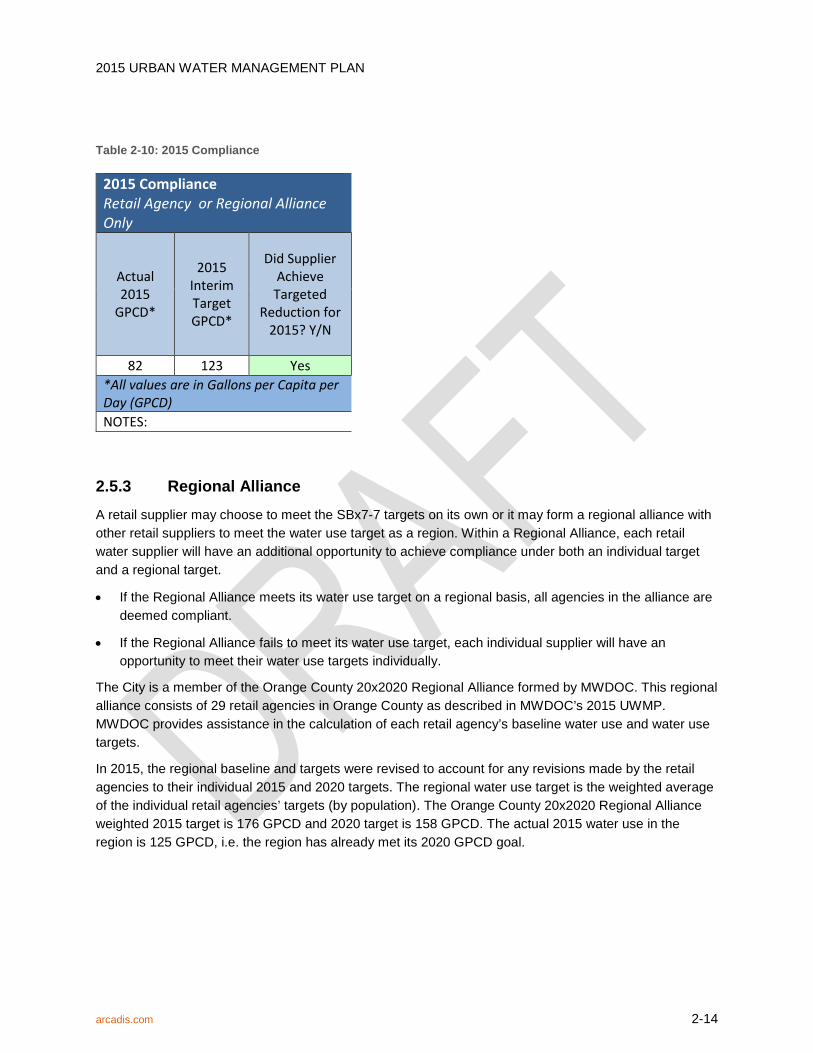
Table 2-10 compares the City’s 2015 water use target to its actual 2015 consumption. Based on this comparison, the City is in compliance with its 2015 interim target and has also already met the 2020 water use target.
arcadis.com 2-13
2015 URBAN WATER MANAGEMENT PLAN
Table 2-10: 2015 Compliance
2015 Compliance Retail Agency or Regional Alliance Only
Actual 2015
GPCD*
2015 Interim Target GPCD*
Did Supplier Achieve
Targeted Reduction for
2015? Y/N
82 123 Yes *All values are in Gallons per Capita per Day (GPCD) NOTES:
2.5.3 Regional Alliance A retail supplier may choose to meet the SBx7-7 targets on its own or it may form a regional alliance with other retail suppliers to meet the water use target as a region. Within a Regional Alliance, each retail water supplier will have an additional opportunity to achieve compliance under both an individual target and a regional target.
• If the Regional Alliance meets its water use target on a regional basis, all agencies in the alliance are deemed compliant.
• If the Regional Alliance fails to meet its water use target, each individual supplier will have an opportunity to meet their water use targets individually.
The City is a member of the Orange County 20x2020 Regional Alliance formed by MWDOC. This regional alliance consists of 29 retail agencies in Orange County as described in MWDOC’s 2015 UWMP. MWDOC provides assistance in the calculation of each retail agency’s baseline water use and water use targets.
In 2015, the regional baseline and targets were revised to account for any revisions made by the retail agencies to their individual 2015 and 2020 targets. The regional water use target is the weighted average of the individual retail agencies’ targets (by population). The Orange County 20x2020 Regional Alliance weighted 2015 target is 176 GPCD and 2020 target is 158 GPCD. The actual 2015 water use in the region is 125 GPCD, i.e. the region has already met its 2020 GPCD goal.
arcadis.com 2-14
2015 URBAN WATER MANAGEMENT PLAN
3 WATER SOURCES AND SUPPLY RELIABILITY
3.1 Overview The City relies on a combination of imported water, local groundwater, and recycled water to meet its water needs. The City works together with two primary agencies, Metropolitan and OCWD to ensure a safe and reliable water supply that will continue to serve the community in periods of drought and shortage. The sources of imported water supplies include water from the Colorado River and the SWP provided by Metropolitan.
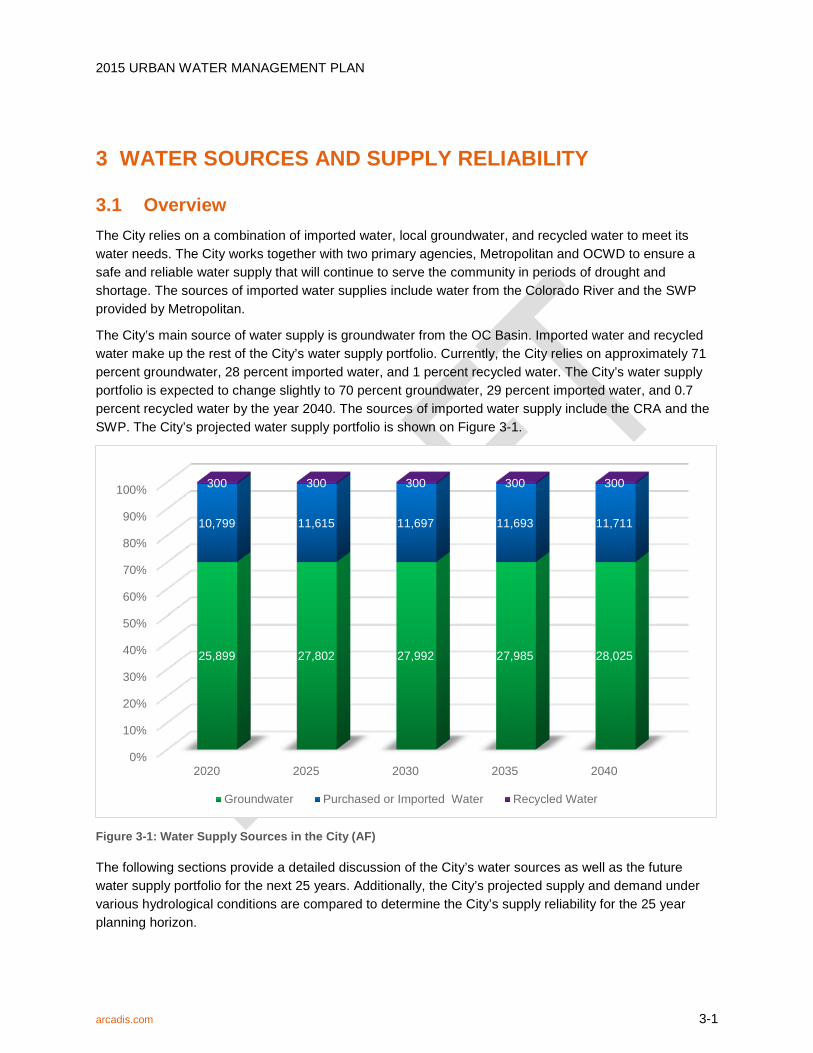
The City’s main source of water supply is groundwater from the OC Basin. Imported water and recycled water make up the rest of the City’s water supply portfolio. Currently, the City relies on approximately 71 percent groundwater, 28 percent imported water, and 1 percent recycled water. The City’s water supply portfolio is expected to change slightly to 70 percent groundwater, 29 percent imported water, and 0.7 percent recycled water by the year 2040. The sources of imported water supply include the CRA and the SWP. The City’s projected water supply portfolio is shown on Figure 3-1.
Figure 3-1: Water Supply Sources in the City (AF)
The following sections provide a detailed discussion of the City’s water sources as well as the future water supply portfolio for the next 25 years. Additionally, the City’s projected supply and demand under various hydrological conditions are compared to determine the City’s supply reliability for the 25 year planning horizon.
0%
10%
20%
30%
40%
50%
60%
70%
80%
90%
100%
2020 2025 2030 2035 2040
25,899 27,802 27,992 27,985 28,025
10,799 11,615 11,697 11,693 11,711
300 300 300 300 300
Groundwater Purchased or Imported Water Recycled Water
arcadis.com 3-1

2015 URBAN WATER MANAGEMENT PLAN
3.2 Imported Water The City supplements its water supply with imported water purchased from Metropolitan. Metropolitan’s principal sources of water are the Colorado River via the CRA and the Lake Oroville watershed in Northern California through the SWP. The water obtained from these sources is treated at the Robert B. Diemer Filtration Plant located north of Yorba Linda. Typically, the Diemer Filtration Plant receives a blend of Colorado River water from Lake Mathews through the Metropolitan Lower Feeder and SWP water through the Yorba Linda Feeder. The City currently maintains seven imported water connections to the Metropolitan system.
3.2.1 Colorado River Supplies The Colorado River was Metropolitan’s original source of water after Metropolitan’s establishment in 1928. The CRA, which is owned and operated by Metropolitan, transports water from the Colorado River to its terminus at Lake Mathews in Riverside County. The actual amount of water per year that may be conveyed through the CRA to Metropolitan’s member agencies is subject to the availability of Colorado River water for delivery.
The CRA includes supplies from the implementation of the Quantification Settlement Agreement and related agreements to transfer water from agricultural agencies to urban uses. The 2003 Quantification Settlement Agreement enabled California to implement major Colorado River water conservation and transfer programs, stabilizing water supplies for 75 years and reducing the state’s demand on the river to its 4.4 MAF entitlement. Colorado River transactions are potentially available to supply additional water up to the CRA capacity of 1.25 million acre-feet (MAF) on an as-needed basis. Water from the Colorado River or its tributaries is available to users in California, Arizona, Colorado, Nevada, New Mexico, Utah, and Wyoming, as well as to Mexico. California is apportioned the use of 4.4 MAF of water from the Colorado River each year plus one-half of any surplus that may be available for use collectively in Arizona, California, and Nevada. In addition, California has historically been allowed to use Colorado River water apportioned to but not used by Arizona or Nevada. Metropolitan has a basic entitlement of 550,000 AFY of Colorado River water, plus surplus water up to an additional 662,000 AFY when the following conditions exists (Metropolitan, 2015 Draft UWMP, March 2016):
• Water unused by the California holders of priorities 1 through 3
• Water saved by the Palo Verde land management, crop rotation, and water supply program
• When the U.S. Secretary of the Interior makes available either one or both:
o Surplus water is available
o Colorado River water is apportioned to but unused by Arizona and/or Nevada
Unfortunately, Metropolitan has not received surplus water for a number of years. The Colorado River supply faces current and future imbalances between water supply and demand in the Colorado River Basin due to long term drought conditions. Over the past 16 years (2000-2015), there have only been three years when the Colorado River flow has been above average (Metropolitan, 2015 Draft UWMP, March 2016). The long-term imbalance in future supply and demand is projected to be approximately 3.2 MAF by the year 2060.
arcadis.com 3-2

2015 URBAN WATER MANAGEMENT PLAN
Approximately 40 million people rely on the Colorado River and its tributaries for water with 5.5 million acres of land using Colorado River water for irrigation. Climate change will affect future supply and demand as increasing temperatures may increase evapotranspiration from vegetation along with an increase in water loss due to evaporation in reservoirs, therefore reducing the available amount of supply from the Colorado River and exacerbating imbalances between increasing demands from rapid growth and decreasing supplies.
Four water supply scenarios were developed around these uncertainties, each representing possible water supply conditions. These four scenarios are as follow:
• Observed Resampled: future hydrologic trends and variability are similar to the past approximately 100 years.
• Paleo Resampled: future hydrologic trends and variability are represented by reconstructions of streamflow for a much longer period in the past (approximately 1,250 years) that show expanded variability.
• Paleo Conditioned: future hydrologic trends and variability are represented by a blend of the wet-dry states of the longer paleo-reconstructed period.
• Downscaled General Circulation Model (GCM) Projected: future climate will continue to warm, with regional precipitation and temperature trends represented through an ensemble of future downscaled GCM projections.
The Colorado River Basin Water Supply and Demand Study (Study) assessed the historical water supply in the Colorado River Basin through two historical streamflow data sets, from the year 1906 through 2007 and the paleo-reconstructed record from 762 through 2005. The following are findings from the study:
• Increased temperatures in both the Upper and Lower Colorado River Basins since the 1970s has been observed.
• Loss of springtime snowpack was observed with consistent results across the lower elevation northern latitudes of the western United States. The large loss of snow at lower elevations strongly suggest the cause is due to shifts in temperature.
• The deficit between the two year running average flow and the long-term mean annual flow that started in the year 2000 is more severe than any other deficit in the observed period, at nine years and 28 MAF deficit.
• There are deficits of greater severity from the longer paleo record compared to the period from 1906 through 2005. One deficit amounted to 35 MAF through a span of 16 years.
• A summary of the trends from the observed period suggest declining stream flows, increases in variability, and seasonal shifts in streamflow that may be related to shifts in temperature.
Findings concerning the future projected supply were obtained from the Downscaled GCM Projected scenario as the other methods did not consider the impacts of a changing climate beyond what has occurred historically. These findings include:
arcadis.com 3-3
2015 URBAN WATER MANAGEMENT PLAN
• Increased temperatures are projected across the Colorado River Basin with larger changes in the Upper Basin than in the Lower Basin. Annual Basin-wide average temperature is projected to increase by 1.3 degrees Celsius over the period through 2040.
• Projected seasonal trends toward drying are significant in certain regions. A general trend towards drying is present in the Colorado River Basin, although increases in precipitation are projected for some higher elevation and hydrologically productive regions. Consistent and expansive drying conditions are projected for the spring and summer months throughout the Colorado River Basin, although some areas in the Lower Basin are projected to experience slight increases in precipitation, which is thought to be attributed to monsoonal influence in the region. Upper Basin precipitation is projected to increase in the fall and winter, and Lower Basin precipitation is projected to decrease.
• Snowpack is projected to decrease due to precipitation falling as rain rather than snow and warmer temperatures melting the snowpack earlier. Areas where precipitation does not change or increase is projected to have decreased snowpack in the fall and early winter. Substantial decreases in spring snowpack are projected to be widespread due to earlier melt or sublimation of snowpack.
• Runoff (both direct and base flow) is spatially diverse, but is generally projected to decrease, except in the northern Rockies. Runoff is projected to increase significantly in the higher elevation Upper Basin during winter but is projected to decrease during spring and summer.
The following future actions must be taken to implement solutions and help resolve the imbalance between water supply and demand in areas that use Colorado River water (U.S. Department of the Interior Bureau of Reclamation, Colorado River Basin Water Supply and Demand Study, December 2012):
• Resolution of significant uncertainties related to water conservation, reuse, water banking, and weather modification concepts.
• Costs, permitting issues, and energy availability issues relating to large-capacity augmentation projects need to be identified and investigated.
• Opportunities to advance and improve the resolution of future climate projections should be pursued.
• Consideration should be given to projects, policies, and programs that provide a wide-range of benefits to water users and healthy rivers for all users.
3.2.2 State Water Project Supplies The SWP consists of a series of pump stations, reservoirs, aqueducts, tunnels, and power plants operated by DWR and is an integral part of the effort to ensure that business and industry, urban and suburban residents, and farmers throughout much of California have sufficient water. The SWP is the largest state-built, multipurpose, user-financed water project in the United States. Nearly two-thirds of residents in California receive at least part of their water from the SWP with approximately 70 percent of SWP’s contracted water supply going to urban users and 30 percent to agricultural users. The primary purpose of the SWP is to divert and store water during wet periods in Northern and Central California and distribute it to areas of need in Northern California, the San Francisco Bay area, the San Joaquin Valley, the Central Coast, and southern California.
arcadis.com 3-4
2015 URBAN WATER MANAGEMENT PLAN
The availability of water supplies from the SWP can be highly variable. A wet water year may be followed by a dry or critically dry year and fisheries issues can restrict the operations of the export pumps even when water supplies are available.
The Sacramento-San Joaquin River Delta (Delta) is key to the SWP’s ability to deliver water to its agricultural and urban contractors. All but five of the 29 SWP contractors receive water deliveries below the Delta (pumped via the Harvey O. Banks or Barker Slough pumping plants). However, the Delta faces many challenges concerning its long-term sustainability such as climate change posing a threat of increased variability in floods and droughts. Sea level rise complicates efforts in managing salinity levels and preserving water quality in the Delta to ensure a suitable water supply for urban and agricultural use. Furthermore, other challenges include continued subsidence of Delta islands, many of which are below sea level, and the related threat of a catastrophic levee failure as the water pressure increases, or as a result of a major seismic event.
Ongoing regulatory restrictions, such as those imposed by federal biological opinions (Biops) on the effects of SWP and the federal Central Valley Project (CVP) operations on certain marine life, also contributes to the challenge of determining the SWP’s water delivery reliability. In dry, below-normal conditions, Metropolitan has increased the supplies delivered through the California Aqueduct by developing flexible CVP/SWP storage and transfer programs. The goal of the storage/transfer programs is to develop additional dry-year supplies that can be conveyed through the available Harvey O. Banks pumping plant capacity to maximize deliveries through the California Aqueduct during dry hydrologic conditions and regulatory restrictions. In addition, the California State Water Resources Control Board (SWRCB) has set water quality objectives that must be met by the SWP including minimum Delta outflows, limits on SWP and CVP Delta exports, and maximum allowable salinity level.
Metropolitan’s Board approved a Delta Action Plan in June 2007 that provides a framework for staff to pursue actions with other agencies and stakeholders to build a sustainable Delta and reduce conflicts between water supply conveyance and the environment. The Delta action plan aims to prioritize immediate short-term actions to stabilize the Delta while an ultimate solution is selected, and mid-term steps to maintain the Delta while a long-term solution is implemented. Currently, Metropolitan is working towards addressing three basin elements: Delta ecosystem restoration, water supply conveyance, and flood control protection and storage development.
“Table A” water is the maximum entitlement of SWP water for each water contracting agency. Currently, the combined maximum Table A amount is 4.17 million AFY. Of this amount, 4.13 million AFY is the maximum Table A water available for delivery from the Delta pumps as stated in the State Water Contract. However, deliveries commonly are less than 50 percent of the Table A.
SWP contractors may receive Article 21 water on a short-term basis in addition to Table A water if requested. Article 21 of SWP contracts allows contractors to receive additional water deliveries only under specific conditions, generally during wet months of the year (December through March). Because an SWP contractor must have an immediate use for Article 21 supply or a place to store it outside of the SWP, there are few contractors like Metropolitan that can access such supplies. .
Carryover water is SWP water allocated to an SWP contractor and approved for delivery to the contractor in a given year but not used by the end of the year. The unused water is stored in the SWP’s share of San Luis Reservoir, when space is available, for the contractor to use in the following year.
arcadis.com 3-5
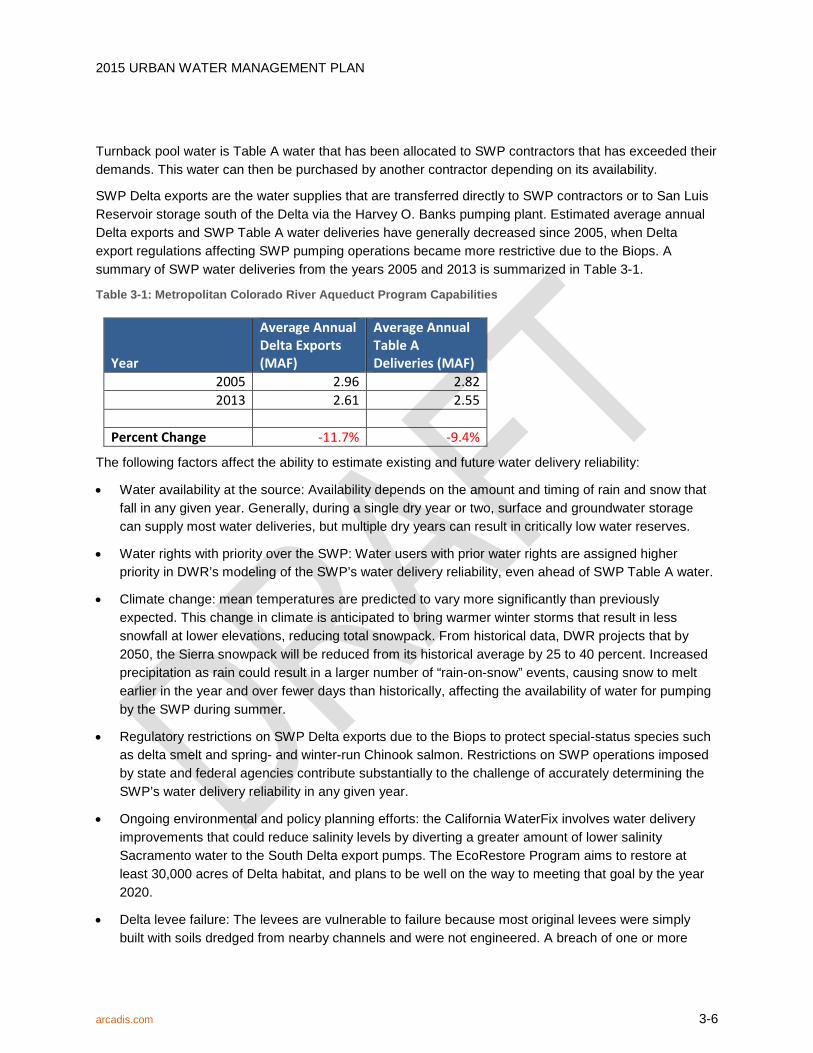
2015 URBAN WATER MANAGEMENT PLAN
Turnback pool water is Table A water that has been allocated to SWP contractors that has exceeded their demands. This water can then be purchased by another contractor depending on its availability.
SWP Delta exports are the water supplies that are transferred directly to SWP contractors or to San Luis Reservoir storage south of the Delta via the Harvey O. Banks pumping plant. Estimated average annual Delta exports and SWP Table A water deliveries have generally decreased since 2005, when Delta export regulations affecting SWP pumping operations became more restrictive due to the Biops. A summary of SWP water deliveries from the years 2005 and 2013 is summarized in Table 3-1.
Table 3-1: Metropolitan Colorado River Aqueduct Program Capabilities
Year
Average Annual Delta Exports (MAF)
Average Annual Table A Deliveries (MAF)
2005 2.96 2.82 2013 2.61 2.55
Percent Change -11.7% -9.4%
The following factors affect the ability to estimate existing and future water delivery reliability:
• Water availability at the source: Availability depends on the amount and timing of rain and snow that fall in any given year. Generally, during a single dry year or two, surface and groundwater storage can supply most water deliveries, but multiple dry years can result in critically low water reserves.
• Water rights with priority over the SWP: Water users with prior water rights are assigned higher priority in DWR’s modeling of the SWP’s water delivery reliability, even ahead of SWP Table A water.
• Climate change: mean temperatures are predicted to vary more significantly than previously expected. This change in climate is anticipated to bring warmer winter storms that result in less snowfall at lower elevations, reducing total snowpack. From historical data, DWR projects that by 2050, the Sierra snowpack will be reduced from its historical average by 25 to 40 percent. Increased precipitation as rain could result in a larger number of “rain-on-snow” events, causing snow to melt earlier in the year and over fewer days than historically, affecting the availability of water for pumping by the SWP during summer.
• Regulatory restrictions on SWP Delta exports due to the Biops to protect special-status species such as delta smelt and spring- and winter-run Chinook salmon. Restrictions on SWP operations imposed by state and federal agencies contribute substantially to the challenge of accurately determining the SWP’s water delivery reliability in any given year.
• Ongoing environmental and policy planning efforts: the California WaterFix involves water delivery improvements that could reduce salinity levels by diverting a greater amount of lower salinity Sacramento water to the South Delta export pumps. The EcoRestore Program aims to restore at least 30,000 acres of Delta habitat, and plans to be well on the way to meeting that goal by the year 2020.
• Delta levee failure: The levees are vulnerable to failure because most original levees were simply built with soils dredged from nearby channels and were not engineered. A breach of one or more
arcadis.com 3-6
2015 URBAN WATER MANAGEMENT PLAN
levees and island flooding could affect Delta water quality and SWP operations for several months. When islands are flooded, DWR may need to drastically decrease or even cease SWP Delta exports to evaluate damage caused by salinity in the Delta.
The Delta Risk Management Strategy addresses the problem of Delta levee failure and evaluates alternatives to reduce the risk to the Delta. Four scenarios were developed to represent a range of possible risk reduction strategies (Department of Water Resources, The State Water Project Final Delivery Capability Report 2015, July 2015). They are:
• Trial Scenario 1 Improved Levees: This scenario looks at improving the reliability of Delta levees against flood-induced failures by providing up to 100-year flood protection. The report found that improved levees would not reduce the risk of potential water export interruptions, nor would it change the seismic risk of most levees.
• Trial Scenario 2 Armored Pathway: This scenario looks at improving the reliability of water conveyance by creating a route through the Delta that has high reliability and the ability to minimize saltwater intrusion into the south Delta. The report found that this scenario would have the joint benefit of reducing the likelihood of levee failures from flood events and earthquakes, and of significantly reducing the likelihood of export disruptions.
• Trial Scenario 3 Isolated Conveyance: This scenario looks to provide high reliability for conveyance of export water by building an isolated conveyance facility on the east side of the Delta. The effects of this scenario are similar to those for Trial Scenario 2 but with the added consequence of seismic risk of levee failure on islands that are not part of the isolated conveyance facility.
• Trial Scenario 4 Dual Conveyance: This scenario is a combination of Scenarios 2 and 3 as it looks to improve reliability and flexibility for conveyance of export water by constructing an isolated conveyance facility and through-Delta conveyance. It would mitigate the vulnerability of water exports associated with Delta levee failure and offer flexibility in water exports from the Delta and the isolated conveyance facility. However, seismic risk would not be reduced on islands not part of the export conveyance system or infrastructure pathway.
DWR has altered the SWP operations to accommodate species of fish listed under the Biops, and these changes have adversely impacted SWP deliveries. DWR’s Water Allocation Analysis indicated that export restrictions are currently reducing deliveries to Metropolitan as much as 150 TAF to 200 TAF under median hydrologic conditions.
Operational constraints likely will continue until a long-term solution to the problems in the Bay-Delta is identified and implemented. New biological opinions for listed species under the Federal ESA or by the California Department of Fish and Game’s issuance of incidental take authorizations under the Federal ESA and California ESA might further adversely affect SWP and CVP operations. Additionally, new litigation, listings of additional species or new regulatory requirements could further adversely affect SWP operations in the future by requiring additional export reductions, releases of additional water from storage or other operational changes impacting water supply operations.
arcadis.com 3-7
2015 URBAN WATER MANAGEMENT PLAN
3.2.3 Storage Storage is a major component of Metropolitan’s dry year resource management strategy. Metropolitan’s likelihood of having adequate supply capability to meet projected demands, without implementing its Water Supply Allocation Plan, is dependent on its storage resources.
Lake Oroville is the SWP’s largest storage facility, with a capacity of about 3.5 MAF. The water is released from Oroville Dam into the Feather River as needed, which converges with the Sacramento River while some of the water at Bethany Reservoir is diverted from the California Aqueduct into the South Bay Aqueduct. The primary pumping plant, the Harvey O. Banks pumping plant, pumps Delta water into the California Aqueduct, which is the longest water conveyance system in California.
3.3 Groundwater Historically, local groundwater has been the cheapest and most reliable source of supply for the City. The City draws water from the OC Basin. This source of water meets approximately 71 percent of the City’s total annual demand.
3.3.1 Basin Characteristics The OC Basin underlies the northerly half of Orange County beneath broad lowlands. The OC Basin managed by OCWD covers an area of approximately 350 square miles, bordered by the Coyote and Chino Hills to the north, the Santa Ana Mountains to the northeast, and the Pacific Ocean to the southwest. The OC Basin boundary extends to the Orange County-Los Angeles Line to the northwest, where groundwater flows across the county line into the Central Groundwater Basin of Los Angeles County. The total thickness of sedimentary rocks in the OC Basin is over 20,000 feet, with only the upper 2,000 to 4,000 feet containing fresh water. The Pleistocene or younger aquifers comprising this OC Basin are over 2,000 feet deep and form a complex series of interconnected sand and gravel deposits. The OC Basin’s full volume is approximately 66 MAF.
There are three major aquifer systems that have been subdivided by OCWD, the Shallow Aquifer System, the Principal Aquifer System, and the Deep Aquifer System. These three aquifer systems are hydraulically connected as groundwater is able to flow between each other through intervening aquitards or discontinuities in the aquitards. The Shall Aquifer system occurs from the surface to approximately 250 feet below ground surface. Most of the groundwater from this aquifer system is pumped by small water systems for industrial and agricultural use. The Principal Aquifer system occurs at depths between 200 and 1,300 feet below ground surface. Over 90 percent of groundwater production is from wells that are screened within the Principal Aquifer system. Only a minor amount of groundwater is pumped from the Deep Aquifer system, which underlies the Principal Aquifer system and is up to 2,000 feet deep in the center of the OC Basin. The three major aquifer systems are shown on Figure 3-2.
arcadis.com 3-8
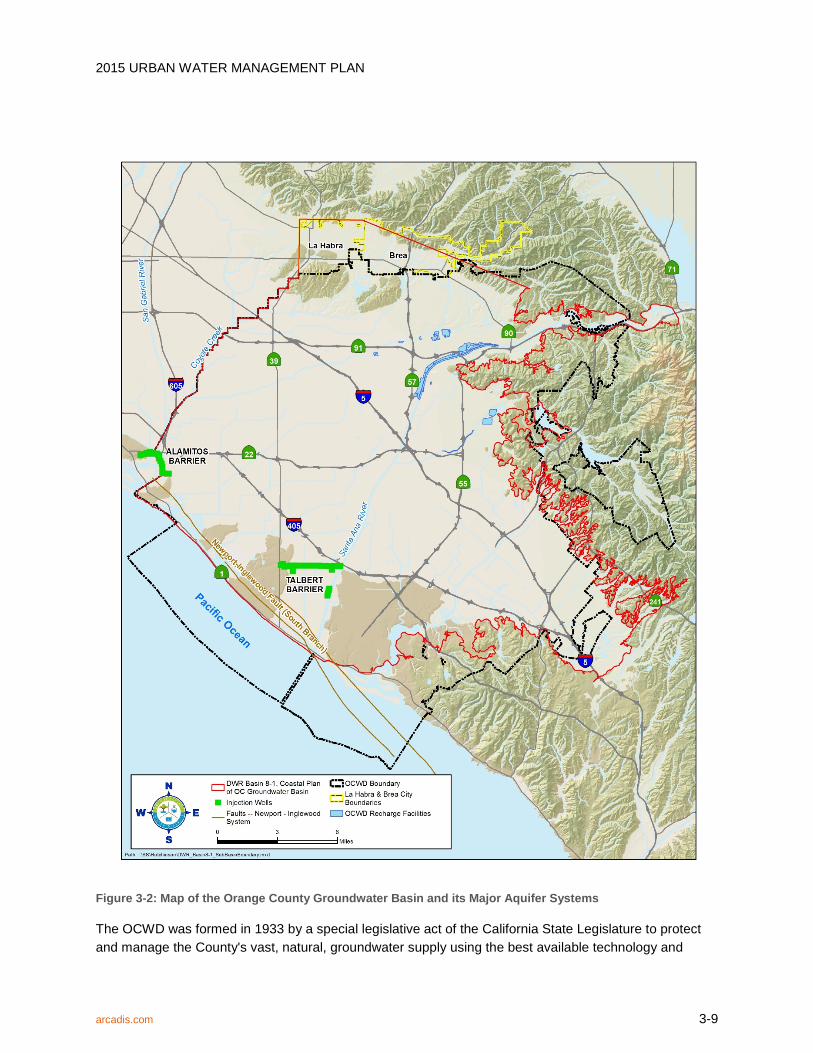
2015 URBAN WATER MANAGEMENT PLAN
Figure 3-2: Map of the Orange County Groundwater Basin and its Major Aquifer Systems
The OCWD was formed in 1933 by a special legislative act of the California State Legislature to protect and manage the County's vast, natural, groundwater supply using the best available technology and
arcadis.com 3-9

2015 URBAN WATER MANAGEMENT PLAN
defend its water rights to the OC Basin. This legislation is found in the State of California Statutes, Water – Uncodified Acts, Act 5683, as amended. The OC Basin is managed by OCWD under the Act, which functions as a statutorily-imposed physical solution.
Groundwater levels are managed within a safe basin operating range to protect the long-term sustainability of the OC Basin and to protect against land subsidence. OCWD regulates groundwater levels in the OC Basin by regulating the annual amount of pumping (OCWD, Groundwater Management Plan 2015 Update, June 2015).
3.3.2 Basin Production Percentage The OC Basin is not adjudicated and as such, pumping from the OC Basin is managed through a process that uses financial incentives to encourage groundwater producers to pump a sustainable amount of water. The framework for the financial incentives is based on establishing the basin production percentage (BPP), the percentage of each Producer’s total water supply that comes from groundwater pumped from the OC Basin. Groundwater production at or below the BPP is assessed a Replenishment Assessment (RA). While there is no legal limit as to how much an agency pumps from the OC Basin, there is a financial disincentive to pump above the BPP. Agencies that pump above the BPP are charged the RA plus the Basin Equity Assessment (BEA), which is calculated so that the cost of groundwater production is greater than MWDOC’s full service rate. The BEA can be increased to discourage production above the BPP. The BPP is set uniformly for all Producers by OCWD on an annual basis.
The BPP is set based on groundwater conditions, availability of imported water supplies, and basin management objectives. The supplies available for recharge must be estimated for a given year. The supplies of recharge water that are estimated are: 1) Santa Ana River stormflow, 2) Natural incidental recharge, 3) Santa Ana River baseflow, 4) GWRS supplies, and 5) other supplies such as imported water and recycled water purchased for the Alamitos Barrier. The BPP is a major factor in determining the cost of groundwater production from the OC Basin for that year.
In some cases, OCWD encourages treating and pumping groundwater that does not meet drinking water standards in order to protect water quality. This is achieved by using a financial incentive called the BEA Exemption. A BEA Exemption is used to clean up and contain the spread of poor quality water. OCWD uses a partial or total exemption of the BEA to compensate a qualified participating agency or Producer for the costs of treating poor quality groundwater. When OCWD authorizes a BEA exemption for a project, it is obligated to provide the replenishment water for the production above the BPP and forgoes the BEA revenue that OCWD would otherwise receive from the producer (OCWD, Groundwater Management Plan 2015 Update, June 2015).
3.3.2.1 2015 OCWD Groundwater Management Plan
OCWD was formed in 1933 by the California legislature to manage and operate the OC Basin in order to protect and increase the OC Basin’s sustainable yield in a cost-effective manner. As previously mentioned, the BPP is the primary mechanism used by OCWD to manage pumping in the OC Basin. In 2013, OCWD’s Board of Directors adopted a policy to establish a stable BPP with the intention to work toward achieving and maintaining a 75 percent BPP by FY 2015-16. Although BPP is set at 75 percent,
arcadis.com 3-10

2015 URBAN WATER MANAGEMENT PLAN
based on discussions with OCWD a conservative BPP of 70 percent is assumed through 2040. Principles of this policy include:
• OCWD’s goal is to achieve a stable 75 percent BPP, while maintaining the same process of setting the BPP on an annual basis, with the BPP set in April of each year after a public hearing has been held and based upon the public hearing testimony, presented data, and reports provided at that time.
• OCWD would endeavor to transition to the 75 percent BPP between 2013 and 2015 as construction of the GWRS Initial Expansion Project is completed. This expansion will provide an additional 31,000 AFY of water for recharging the groundwater basin.
• OCWD must manage the OC Basin in a sustainable manner for future generations. The BPP will be reduced if future conditions warrant the change.
• Each project and program to achieve the 75 percent BPP goal will be reviewed individually and assessed for their economic viability.
The OC Basin’s storage levels would be managed in accordance to the 75 percent BPP policy. It is presumed that the BPP will not decrease as long as the storage levels are between 100,000 and 300,000 AF from full capacity. If the OC Basin is less than 100,000 AF below full capacity, the BPP will be raised. If the OC Basin is over 350,000 AF below full capacity, additional supplies will be sought after to refill the OC Basin and the BPP will be lowered.
The OC Basin is managed to maintain water storage levels of not more than 500,000 AF below full condition to avoid permanent and significant negative or adverse impacts. Operating the OC Basin in this manner enables OCWD to encourage reduced pumping during wet years when surface water supplies are plentiful and increase pumping during dry years to provide additional local water supplies during droughts.
OCWD determines the optimum level of storage for the following year when it sets the BPP each year. Factors that affect this determination include the current storage level, regional water availability, and hydrologic conditions. When the OC Basin’s storage approaches the lower end of the operating range, immediate issues that must be addressed include seawater intrusion, increased risk of land subsidence, and potential for shallow wells to become inoperable due to lower water levels (OCWD, Groundwater Management Plan 2015 Update, June 2015).
3.3.2.2 OCWD Engineer’s Report
The OCWD Engineer’s Report reports on the groundwater conditions and investigates information related to water supply and OC Basin usage within OCWD’s service area.
The overall BPP achieved in the 2013 to 2014 water year within OCWD for non-irrigation use was 75.2 percent. However, a BPP level above 75 percent may be difficult to achieve. Therefore, a BPP ranging from 65 percent to 70 percent is currently being proposed for the ensuing FY 2015-16. Analysis of the OC Basin’s projected accumulated overdraft, the available supplies to the OC Basin (assuming average hydrology) and the projected pumping demands indicate that this level of pumping can be sustained for 2015-16 without harming the OC Basin.
arcadis.com 3-11
2015 URBAN WATER MANAGEMENT PLAN
A BPP of 70 percent corresponds to approximately 320,000 AF of groundwater production including 22,000 AF of groundwater production above the BPP to account for several groundwater quality enhancement projects discussed earlier.
In FY 2015-16 additional production of approximately 22,000 AF above the BPP will be undertaken by the City of Tustin, City of Garden Grove, Mesa Water District, and Irvine Ranch Water District. These agencies use the additional pumping allowance in order to accommodate groundwater quality improvement projects. As in prior years, production above the BPP from these projects would be partially or fully exempt from the BEA as a result of the benefit provided to the OC Basin by removing poor-quality groundwater and treating it for beneficial use (OCWD, 2013-2014 Engineer’s Report, February 2015).
3.3.3 Groundwater Recharge Facilities Recharging water into the OC Basin through natural and artificial means is essential to support pumping from the OC Basin. Active recharge of groundwater began in 1949, in response to increasing drawdown of the OC Basin and consequently the threat of seawater intrusion. The OC Basin’s primary source of recharge is flow from the Santa Ana River, which is diverted into recharge basins and its main Orange County tributary, Santiago Creek. Other sources of recharge water include natural infiltration, recycled water, and imported water. Natural recharge consists of subsurface inflow from local hills and mountains, infiltration of precipitation and irrigation water, recharge in small flood control channels, and groundwater underflow to and from Los Angeles County and the ocean.
Recycled water for the OC Basin is from two sources. The main source of recycled water is from the GWRS and is recharged in the surface water system and the Talbert Seawater Barrier. The second source of recycled water is the Leo J. Vander Lans Treatment Facility which supplies water to the Alamitos Seawater Barrier. Injection of recycled water into these barriers is an effort by OCWD to control seawater intrusion into the OC Basin. Operation of the injection wells forms a hydraulic barrier to seawater intrusion.
Untreated imported water can be used to recharge the OC Basin through the surface water recharge system in multiple locations, such as Anaheim Lake, Santa Ana River, Irvine Lake, and San Antonio Creek. Treated imported water can be used for in-lieu recharge, as was performed extensively from 1977 to 2007 (OCWD, Groundwater Management Plan 2015 Update, June 2015).
3.3.4 Metropolitan Groundwater Replenishment Program OCWD, MWDOC, and Metropolitan have developed a successful and efficient groundwater replenishment program to increase storage in the OC Basin. The Groundwater Replenishment Program allows Metropolitan to sell groundwater replenishment water to OCWD and make direct deliveries to agency distribution systems in lieu of producing water from the groundwater basin when surplus surface water is available. This program indirectly replenishes the OC Basin by avoiding pumping. In the in-lieu program, OCWD requests an agency to halt pumping from specified wells. The agency then takes replacement water through its import connections, which is purchased by OCWD from Metropolitan. OCWD purchases the water at a reduced rate, and then bills the agency for the amount it would have had to pay for energy and the RA if it had produced the water from its wells. The deferred local production results in water being left in local storage for future use.
arcadis.com 3-12
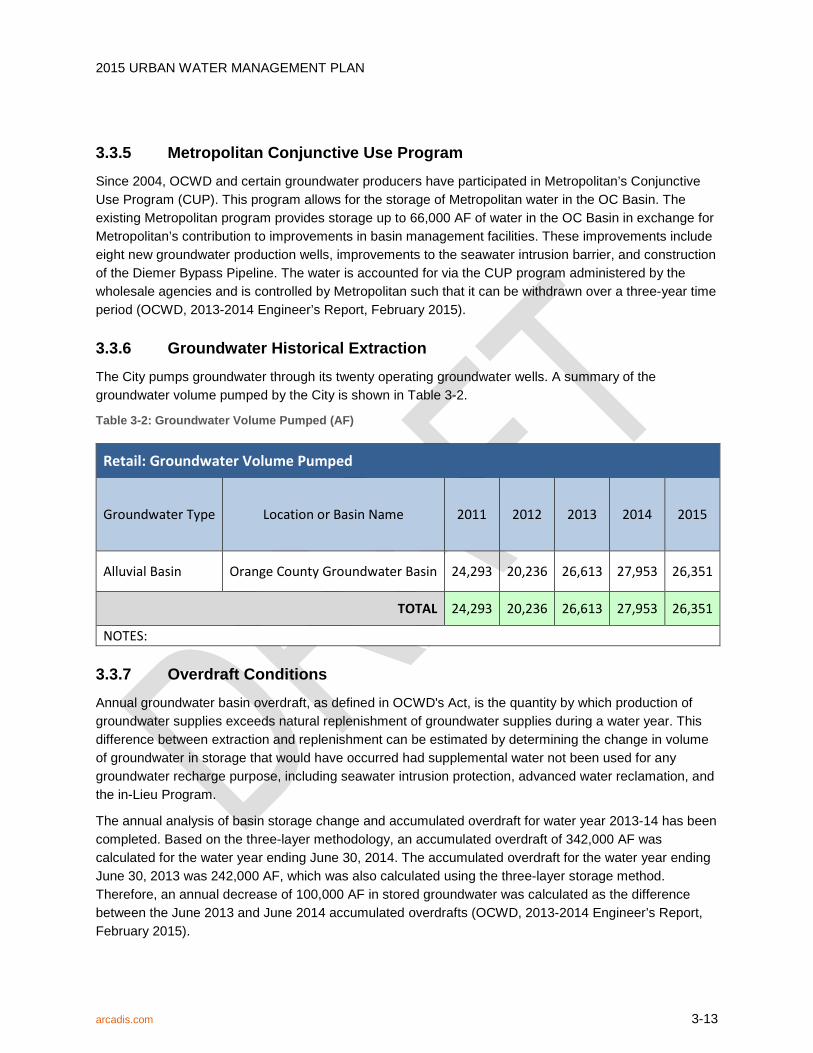
2015 URBAN WATER MANAGEMENT PLAN
3.3.5 Metropolitan Conjunctive Use Program Since 2004, OCWD and certain groundwater producers have participated in Metropolitan’s Conjunctive Use Program (CUP). This program allows for the storage of Metropolitan water in the OC Basin. The existing Metropolitan program provides storage up to 66,000 AF of water in the OC Basin in exchange for Metropolitan’s contribution to improvements in basin management facilities. These improvements include eight new groundwater production wells, improvements to the seawater intrusion barrier, and construction of the Diemer Bypass Pipeline. The water is accounted for via the CUP program administered by the wholesale agencies and is controlled by Metropolitan such that it can be withdrawn over a three-year time period (OCWD, 2013-2014 Engineer’s Report, February 2015).
3.3.6 Groundwater Historical Extraction The City pumps groundwater through its twenty operating groundwater wells. A summary of the groundwater volume pumped by the City is shown in Table 3-2.
Table 3-2: Groundwater Volume Pumped (AF)
Retail: Groundwater Volume Pumped
Groundwater Type Location or Basin Name 2011 2012 2013 2014 2015
Alluvial Basin Orange County Groundwater Basin 24,293 20,236 26,613 27,953 26,351
TOTAL 24,293 20,236 26,613 27,953 26,351
NOTES:
3.3.7 Overdraft Conditions Annual groundwater basin overdraft, as defined in OCWD's Act, is the quantity by which production of groundwater supplies exceeds natural replenishment of groundwater supplies during a water year. This difference between extraction and replenishment can be estimated by determining the change in volume of groundwater in storage that would have occurred had supplemental water not been used for any groundwater recharge purpose, including seawater intrusion protection, advanced water reclamation, and the in-Lieu Program.
The annual analysis of basin storage change and accumulated overdraft for water year 2013-14 has been completed. Based on the three-layer methodology, an accumulated overdraft of 342,000 AF was calculated for the water year ending June 30, 2014. The accumulated overdraft for the water year ending June 30, 2013 was 242,000 AF, which was also calculated using the three-layer storage method. Therefore, an annual decrease of 100,000 AF in stored groundwater was calculated as the difference between the June 2013 and June 2014 accumulated overdrafts (OCWD, 2013-2014 Engineer’s Report, February 2015).
arcadis.com 3-13

2015 URBAN WATER MANAGEMENT PLAN
3.4 Summary of Existing and Planned Sources of Water The actual sources and volume of water for the year 2015 is displayed in Table 3-3.
Table 3-3: Water Supplies, Actual (AF)
Retail: Water Supplies — Actual
Water Supply
Additional Detail on Water Supply
2015
Actual Volume Water Quality
Groundwater Orange County Groundwater Basin 26,351 Drinking
Water
Purchased or Imported Water Metropolitan 10,305 Drinking Water
Recycled Water Green Acres Project (OCWD) 352 Recycled
Water
Total 37,008
NOTES:
arcadis.com 3-14
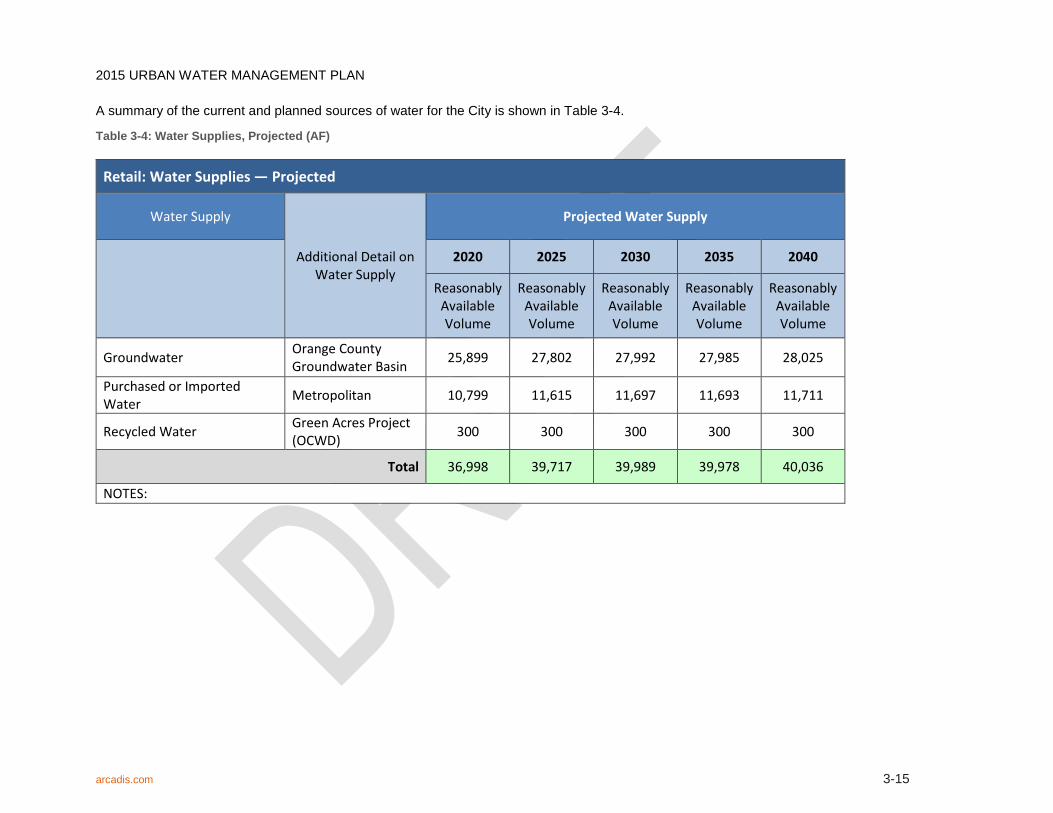
2015 URBAN WATER MANAGEMENT PLAN
A summary of the current and planned sources of water for the City is shown in Table 3-4.
Table 3-4: Water Supplies, Projected (AF)
Retail: Water Supplies — Projected
Water Supply
Additional Detail on Water Supply
Projected Water Supply
2020 2025 2030 2035 2040
Reasonably Available Volume
Reasonably Available Volume
Reasonably Available Volume
Reasonably Available Volume
Reasonably Available Volume
Groundwater Orange County Groundwater Basin 25,899 27,802 27,992 27,985 28,025
Purchased or Imported Water Metropolitan 10,799 11,615 11,697 11,693 11,711
Recycled Water Green Acres Project (OCWD) 300 300 300 300 300
Total 36,998 39,717 39,989 39,978 40,036
NOTES:
arcadis.com 3-15

2015 URBAN WATER MANAGEMENT PLAN
3.5 Recycled Water The City receives recycled water from the Green Acres Project (GAP) that is used for non-potable applications. More information concerning the City's recycled water usage can be found in Section 6.
3.6 Supply Reliability
3.6.1 Overview Every urban water supplier is required to assess the reliability of their water service to its customers under normal, dry, and multiple dry water years. The City depends on a combination of imported and local supplies to meet its water demands and has taken numerous steps to ensure it has adequate supplies. Development of numerous local augment the reliability of the imported water system. There are various factors that may impact reliability of supplies such as legal, environmental, water quality and climatic which are discussed below. The water supplies are projected to meet full-service demands; Metropolitan’s 2015 UWMP finds that Metropolitan is able to meet, full-service demands of its member agencies starting 2020 through 2040 during normal years, single dry year, and multiple dry years.
Metropolitan’s 2015 Integrated Water Resources Plan (IRP) update describes the core water resources that will be used to meet full-service demands at the retail level under all foreseeable hydrologic conditions from 2020 through 2040. The foundation of Metropolitan’s resource strategy for achieving regional water supply reliability has been to develop and implement water resources programs and activities through its IRP preferred resource mix. This preferred resource mix includes conservation, local resources such as water recycling and groundwater recovery, Colorado River supplies and transfers, SWP supplies and transfers, in-region surface reservoir storage, in-region groundwater storage, out-of-region banking, treatment, conveyance and infrastructure improvements.
3.6.2 Factors Impacting Reliability The Act requires a description of water supply reliability and vulnerability to seasonal or climatic shortage. The City’s ability to meet supply demands is contingent upon its ability to maintain its water production assets in proper working order. In addition, the following are some of the factors identified by Metropolitan that may have an impact on the reliability of Metropolitan supplies.
3.6.2.1 Environment
Endangered species protection needs in the Delta have resulted in operational constraints to the SWP system, as mentioned previously in the State Water Project Supplies section.
3.6.2.2 Legal
The addition of more species under the Endangered Species Act and new regulatory requirements could impact SWP operations by requiring additional export reductions, releases of additional water from storage or other operational changes impacting water supply operations.
arcadis.com 3-16

2015 URBAN WATER MANAGEMENT PLAN
3.6.2.3 Water Quality
3.6.2.3.1 Imported Water
Metropolitan is responsible for providing high quality potable water throughout its service area. Over 300,000 water quality tests are performed per year on Metropolitan’s water to test for regulated contaminants and additional contaminants of concern to ensure the safety of its waters. Metropolitan’s supplies originate primarily from the CRA and from the SWP. A blend of these two sources, proportional to each year’s availability of the source, is then delivered throughout Metropolitan’s service area.
Metropolitan’s primary water sources face individual water quality issues of concern. The CRA water source contains higher total dissolved solids (TDS) and the SWP contains higher levels of organic matter, lending to the formation of disinfection byproducts. To remediate the CRA’s high level of salinity and the SWP’s high level of organic matter, Metropolitan blends CRA and SWP supplies and has upgraded all of its treatment facilities to include ozone treatment processes. In addition, Metropolitan has been engaged in efforts to protect its Colorado River supplies from threats of uranium, perchlorate, and chromium VI while also investigating the potential water quality impact of emerging contaminants, N-nitrosodimethylamine (NDMA), and pharmaceuticals and personal care products (PPCPs). While unforeseeable water quality issues could alter reliability, Metropolitan’s current strategies ensure the deliverability of high quality water.
The presence of Quagga Mussels in water sources is a water quality concern. Quagga Mussels are an invasive species that was first discovered in 2007 at Lake Mead, on the Colorado River. This species of mussels form massive colonies in short periods of time, disrupting ecosystems and blocking water intakes. They are capable of causing significant disruption and damage to water distribution systems. Controlling the spread and impacts of this invasive species within the CRA requires extensive maintenance and results in reduced operational flexibility. It also resulted in Metropolitan eliminating deliveries of CRA water into Diamond Valley Lake to keep the reservoir free from Quagga Mussels.
3.6.2.3.2 Groundwater
OCWD is responsible for managing the OC Basin. To maintain groundwater quality, OCWD conducts an extensive monitoring program that serves to manage the OC Basin’s groundwater production, control groundwater contamination, and comply with all required laws and regulations. A network of nearly 700 wells provides OCWD a source for samples, which are tested for a variety of purposes. OCWD collects 600 to 1,700 samples each month to monitor OC Basin water quality. These samples are collected and tested according to approved federal and state procedures as well as industry-recognized quality assurance and control protocols.
Salinity is a significant water quality problem in many parts of southern California, including Orange County. Salinity is a measure of the dissolved minerals in water including both TDS and nitrates.
OCWD continuously monitors the levels of TDS in wells throughout the OC Basin. TDS currently has a California Secondary Maximum Contaminant Level (MCL) of 500 mg/L. The portions of the OC Basin with the highest levels are generally located in the Cites of Irvine, Tustin, Yorba Linda, Anaheim, and Fullerton. There is also a broad area in the central portion of the OC Basin where TDS ranges from 500 to 700 mg/L. Sources of TDS include the water supplies used to recharge the OC Basin and from onsite
arcadis.com 3-17

2015 URBAN WATER MANAGEMENT PLAN
wastewater treatment systems, also known as septic systems. The TDS concentration in the OC Basin is expected to decrease over time as the TDS concentration of GWRS water used to recharge the OC Basin is approximately 50 mg/L.
Nitrates are one of the most common and widespread contaminants in groundwater supplies, originating from fertilizer use, animal feedlots, wastewater disposal systems, and other sources. The MCL for nitrate in drinking water is set at 10 mg/L. OCWD regularly monitors nitrate levels in groundwater and works with producers to treat wells that have exceeded safe levels of nitrate concentrations. OCWD manages the nitrate concentration of water recharged by its facilities to reduce nitrate concentrations in groundwater. This includes the operation of the Prado Wetlands, which was designed to remove nitrogen and other pollutants from the Santa Ana River before the water is diverted to be percolated into OCWD’s surface water recharge system.
Although water from the Deep Aquifer System is of very high quality, it is amber-colored and contains a sulfuric odor due to buried natural organic material. These negative aesthetic qualities require treatment before use as a source of drinking water. The total volume of the amber-colored groundwater is estimated to be approximately 1 MAF.
Other contaminants that OCWD monitors within the OC Basin include:
• Methyl Tertiary Butyl Ether (MTBE) – MTBE is an additive to gasoline that increases octane ratings but became a widespread contaminant in groundwater supplies. The greatest source of MTBE contamination comes from underground fuel tank releases. The primary MCL for MTBE in drinking water is 13 µg/L.
• Volatile Organic Compounds (VOCs) – VOCs come from a variety of sources including industrial degreasers, paint thinners, and dry cleaning solvents. Locations of VOC contamination within the OC Basin include the former El Toro marine Corps Air Station, the Shall Aquifer System, and portions of the Principal Aquifer System in the Cities of Fullerton and Anaheim.
• N-Nitrosodimethylamine (NDMA) – NDMA is a compound that can occur in wastewater that contains its precursors and is disinfected via chlorination and/or chloramination. It is also found in food products such as cured meat, fish, beer, milk, and tobacco smoke. The California Notification Level for NDMA is 10 ng/L and the Response Level is 300 ng/L. In the past, NDMA has been found in groundwater near the Talbert Barrier, which was traced to industrial wastewater dischargers.
• 1,4-Dioxane – 1,4-Dioxane is a suspected human carcinogen. It is used as a solvent in various industrial processes such as the manufacture of adhesive products and membranes.
• Perchlorate – Perchlorate enters groundwater through application of fertilizer containing perchlorate, water imported from the Colorado River, industrial or military sites that have perchlorate, and natural occurrence. Perchlorate was not detected in 84 percent of the 219 production wells tested between the years 2010 through 2014.
• Selenium – Selenium is a naturally occurring micronutrient found in soils and groundwater in the Newport Bay watershed. The bio-accumulation of selenium in the food chain may result in deformities, stunted growth, reduced hatching success, and suppression of immune systems in fish and wildlife. Management of selenium is difficult as there is no off-the-shelf treatment technology available.
arcadis.com 3-18

2015 URBAN WATER MANAGEMENT PLAN
• Constituents of Emerging Concern (CECs) – CECs are either synthetic or naturally occurring substances that are not currently regulated in water supplies or wastewater discharged but can be detected using very sensitive analytical techniques. The newest group of CECs include pharmaceuticals, personal care products, and endocrine disruptors. OCWD’s laboratory is one of a few in the state of California that continuously develops capabilities to analyze for new compounds (OCWD, Groundwater Management Plan 2015 Update, June 2015).
3.6.2.4 Climate Change
Changing climate patterns are expected to shift precipitation patterns and affect water supply. Unpredictable weather patterns will make water supply planning more challenging. The areas of concern for California include a reduction in Sierra Nevada Mountain snowpack, increased intensity and frequency of extreme weather events, and rising sea levels causing increased risk of Delta levee failure, seawater intrusion of coastal groundwater basins, and potential cutbacks on the SWP and CVP. The major impact in California is that without additional surface storage, the earlier and heavier runoff (rather than snowpack retaining water in storage in the mountains), will result in more water being lost to the oceans. A heavy emphases on storage is needed in the State of California.
In addition, the Colorado River Basin supplies have been inconsistent since about the year 2000, resulting in 13 of the last 16 years of the upper basin runoff being below normal. Climate models are predicting a continuation of this pattern whereby hotter and drier weather conditions will result in continuing lower runoff.
Legal, environmental, and water quality issues may have impacts on Metropolitan supplies. It is felt, however, that climatic factors would have more of an impact than legal, water quality, and environmental factors. Climatic conditions have been projected based on historical patterns but severe pattern changes are still a possibility in the future.
3.6.3 Normal-Year Reliability Comparison The City has entitlements to receive imported water from Metropolitan via the regional distribution system. Although pipeline and connection capacity rights do not guarantee the availability of water, per se, they do guarantee the ability to convey water when it is available to the Metropolitan distribution system. All imported water supplies are assumed available to the City from existing water transmission facilities. The demand and supplies listed below also include local groundwater supplies that are available to the City through OCWD by a pre-determined pumping percentage.
For the 2015 UWMP, the normal dry year was selected as the City’s 2015 demand. Due to ongoing drought conditions within California and the increased implementation of mitigation measures, 2015 was determined to represent an average water demand for this UWMP.
3.6.4 Single-Dry Year Reliability Comparison A Single-dry year is defined as a single year of no to minimal rainfall within a period that average precipitation is expected to occur. The City has documented that it is 100 percent reliable for single dry year demands from 2020 through 2040 with a demand increase of 6 percent using FY 2013-14 as the
arcadis.com 3-19
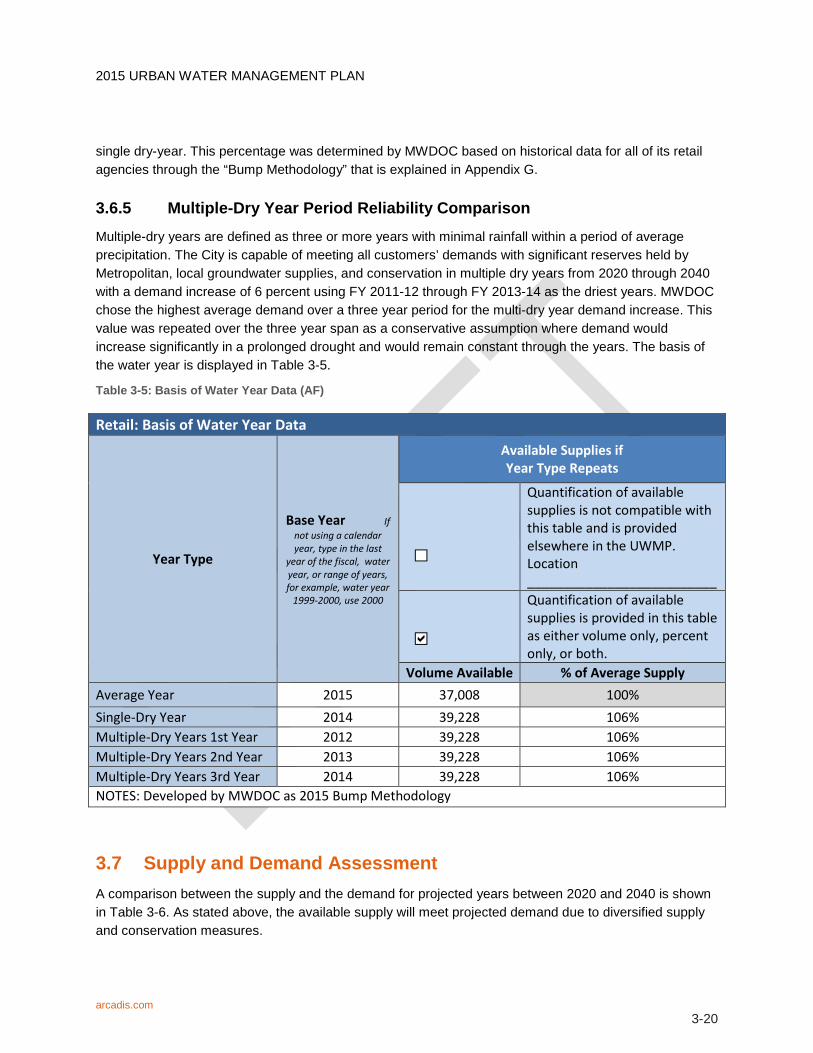
2015 URBAN WATER MANAGEMENT PLAN
single dry-year. This percentage was determined by MWDOC based on historical data for all of its retail agencies through the “Bump Methodology” that is explained in Appendix G.
3.6.5 Multiple-Dry Year Period Reliability Comparison Multiple-dry years are defined as three or more years with minimal rainfall within a period of average precipitation. The City is capable of meeting all customers’ demands with significant reserves held by Metropolitan, local groundwater supplies, and conservation in multiple dry years from 2020 through 2040 with a demand increase of 6 percent using FY 2011-12 through FY 2013-14 as the driest years. MWDOC chose the highest average demand over a three year period for the multi-dry year demand increase. This value was repeated over the three year span as a conservative assumption where demand would increase significantly in a prolonged drought and would remain constant through the years. The basis of the water year is displayed in Table 3-5.
Table 3-5: Basis of Water Year Data (AF)
Retail: Basis of Water Year Data
Year Type
Base Year If not using a calendar year, type in the last
year of the fiscal, water year, or range of years, for example, water year
1999-2000, use 2000
Available Supplies if Year Type Repeats
Quantification of available supplies is not compatible with this table and is provided elsewhere in the UWMP. Location __________________________
Quantification of available supplies is provided in this table as either volume only, percent only, or both.
Volume Available % of Average Supply Average Year 2015 37,008 100% Single-Dry Year 2014 39,228 106% Multiple-Dry Years 1st Year 2012 39,228 106% Multiple-Dry Years 2nd Year 2013 39,228 106% Multiple-Dry Years 3rd Year 2014 39,228 106% NOTES: Developed by MWDOC as 2015 Bump Methodology
3.7 Supply and Demand Assessment A comparison between the supply and the demand for projected years between 2020 and 2040 is shown in Table 3-6. As stated above, the available supply will meet projected demand due to diversified supply and conservation measures.
arcadis.com 3-20
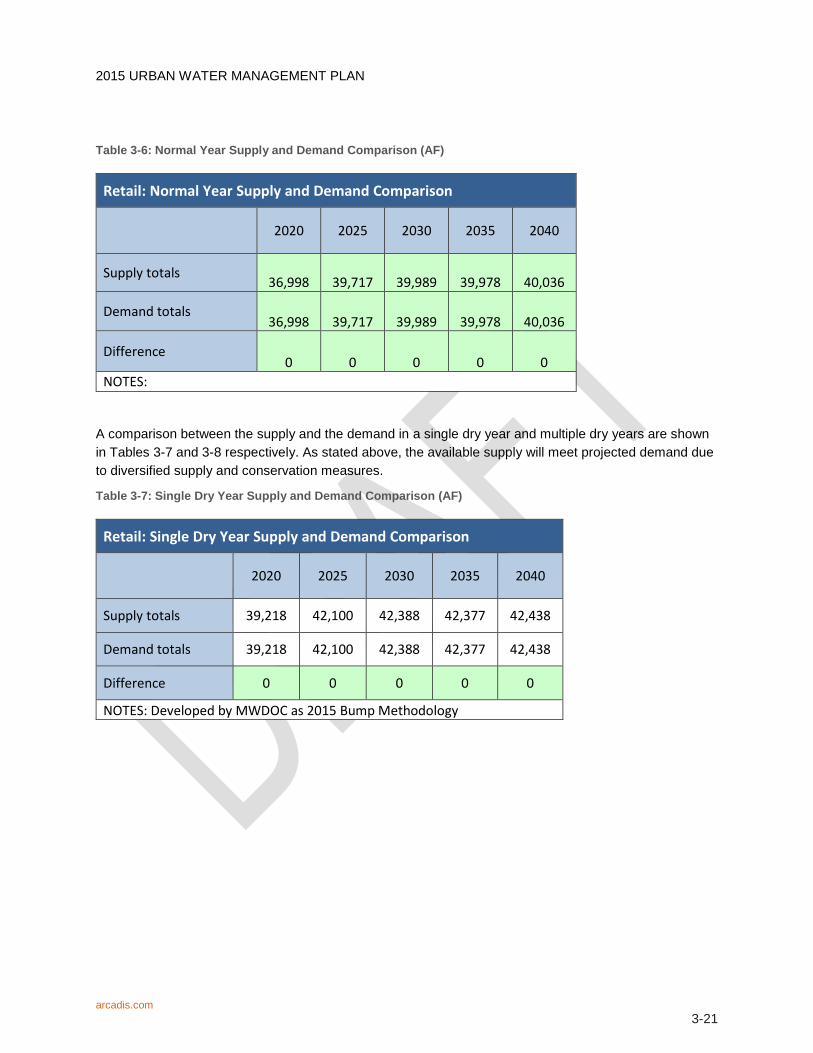
2015 URBAN WATER MANAGEMENT PLAN
Table 3-6: Normal Year Supply and Demand Comparison (AF)
Retail: Normal Year Supply and Demand Comparison
2020 2025 2030 2035 2040
Supply totals 36,998 39,717 39,989 39,978 40,036
Demand totals 36,998 39,717 39,989 39,978 40,036
Difference 0 0 0 0 0
NOTES:
A comparison between the supply and the demand in a single dry year and multiple dry years are shown in Tables 3-7 and 3-8 respectively. As stated above, the available supply will meet projected demand due to diversified supply and conservation measures.
Table 3-7: Single Dry Year Supply and Demand Comparison (AF)
Retail: Single Dry Year Supply and Demand Comparison
2020 2025 2030 2035 2040
Supply totals 39,218 42,100 42,388 42,377 42,438
Demand totals 39,218 42,100 42,388 42,377 42,438
Difference 0 0 0 0 0
NOTES: Developed by MWDOC as 2015 Bump Methodology
arcadis.com 3-21

2015 URBAN WATER MANAGEMENT PLAN
Table 3-8: Multiple Dry Years Supply and Demand Comparison (AF)
Retail: Multiple Dry Years Supply and Demand Comparison
2020 2025 2030 2035 2040
First year
Supply totals 39,218 42,100 42,388 42,377 42,438
Demand totals 39,218 42,100 42,388 42,377 42,438
Difference 0 0 0 0 0
Second year
Supply totals 39,218 42,100 42,388 42,377 42,438
Demand totals 39,218 42,100 42,388 42,377 42,438
Difference 0 0 0 0 0
Third year
Supply totals 39,218 42,100 42,388 42,377 42,438
Demand totals 39,218 42,100 42,388 42,377 42,438
Difference 0 0 0 0 0
NOTES: Developed by MWDOC as 2015 Bump Methodology
arcadis.com 3-22

2015 URBAN WATER MANAGEMENT PLAN
4 DEMAND MANAGEMENT MEASURES The Demand Management Measures (DMM) section provides a comprehensive description of the water conservation programs that a supplier has implemented, is currently implementing, and plans to implement in order to meet its urban water use reduction targets. The reporting requirements for DMM were significantly modified and streamlined in 2014 by Assembly Bill 2067. For a retail agency such as the City the requirements changed from having 14 specific measures to six more general requirements plus an “other” category.
4.1 Water Waste Prevention Ordinances The City Council adopted the Water Conservation and Supply Shortage Program Ordinance No. NS-2877 on May 19, 2015. Ordinance No. NS-2877 establishes permanent water conservation requirements and prohibition against waste that are effective at all times and is not dependent upon a water shortage for implementation, as follows:
• No washing down hard or paved surfaces
• Limit on watering hours
• Re-circulating water required for water fountains and decorative water features
• Drinking water served upon request only
• Limits on washing vehicles
• Commercial lodging establishments must provide guests option to decline daily linen services
• Restaurants required to use water conserving dish wash spray valves
• Obligation to fix leaks, break, or malfunctions
• No installation of single pass cooling systems
• Commercial car wash systems
• No excessive water flow or runoff
• No installation of non-recirculating water systems in commercial car wash and laundry systems
• No watering during or within 48 hours of measurable rainfall
• No irrigation of ornamental turf on public street medians with potable water
• Limit on irrigation with potable water of landscapes outside of new construction
In an event of a water supply shortage, the ordinance further establishes three levels of water supply shortage response actions to be implemented during times of declared water shortage or declared water shortage emergency, with increasing restrictions on water use in response to worsening drought or emergency conditions and decreasing supplies. The provisions and water conservation measures to be implemented in response to each shortage level are described in Section 5 of the UWMP. The City’s Water Conservation and Supply Shortage Program Ordinance is included in Appendix D.
arcadis.com 4-1

2015 URBAN WATER MANAGEMENT PLAN
Table 4-1 summarizes the City’s water waste prohibition efforts in the past five years and the projected number of sit visits and expenditures related to the Water Conservation and Supply Shortage Program.
Table 4-1: Water Waste Prohibition
Actual 2011 2012 2013 2014 2015
Waste Ordinance in Effect Y Y Y Y Y
# of On-Site Visits 0 0 0 0 199
Actual Expenditures ($) 0 0 0 0 $452,000
Planned 2016 2017 2018 2019 2020
Waste Ordinance in Effect Y Y Y Y Y
# of On-Site Visits 100 100 100 100 100
Planned Expenditures ($) $200,000 $200,000 $200,000 $200,000 $200,000
The City maintains active water wasting prohibition measures at all times and has the ability to implement additional measures as water conservation needs dictate (see Table 5.3 in Section 5-5). In 2015, as a result of the Governor’s drought mandates, the City began to track its water wasting prohibition enforcement activities. On June 2, 2015 the City declared a Phase 2 water supply shortage in Resolution No. 2015-025 by formally requiring all water consumers to reduce use by 12 percent relative to their 2013 consumption. Additionally, on August 4, 2015, a water wasting penalty rate was established by Resolution No. 2015-047. This new penalty rate permits City staff to penalize those users not meeting their water use reduction targets of 12 percent. The City of Santa Ana as a whole has been meeting its State mandated target; as a result the City has yet to impose any monetary penalties on any of its users.
The City has communicated the water wasting prohibitions and water conservation measures via various communication outlets available including messaging on water bills, bill inserts, bill envelopes, the City website, bus shelter advertisements, City newsletters, pole banners across the City, and a water conservation booth at community events. As a result, in 2015 the City received 1,064 water waster complaints: a dramatic increase from prior years. The City intends to continue both its water waste enforcement efforts and water conservation messaging in the future; however, the intensity of both activities will be directly related to the level of water conservation required to meet stated use reductions.
4.2 Metering The City requires individual metering for all new connections and bills by volume-of-use. All existing connections are metered.
arcadis.com 4-2

2015 URBAN WATER MANAGEMENT PLAN
The City has a meter replacement and calibration program in place. The program is focused on replacing aging meters and those with high use. The City’s meter calibration program is customer driven and is focused on testing meters at the request of customers. The City plans to expand the meter replacement and calibration program in the next five years by the implementing and deploying Automated Meter Infrastructure (AMI) and a proactive calibration and testing program focused on periodically testing high use meters.
In accordance with the City’s municipal code, all new development with over 1,000 square feet of landscape requires the installation of dedicated landscape meters. The City has also adopted a policy requiring individual metering of all users such as individual tenants of commercial plazas, residential condominiums, and apartments.
4.3 Conservation Pricing There are two parts to the City’s water service charges: a fixed Basic Service Charge and a variable Commodity Charge. The Basic Service Charge is a fixed amount based on the connection’s meter size and is billed bi-monthly. The Commodity Charge is determined by the amount of water served to the property and is measured in hundred cubic feet (HCF). The City also provides private fire water service and recycled water to specific customers and also has a Private Fire Service Charge and a Recycled Water Commodity Charge.
The City’s current Commodity Charge rates, effective from July 1, 2015 until July 1, 2016, were approved on February 17, 2015 and are shown in Table 4-2.
Table 4-2: Water Rates Effective July 1, 2015
Tier Units of Water
(1 Unit = 100 cubic feet) Unit Rate
1 0-44 $2.79
2 45 or over $3.36
Recycled Water N/A $2.23
4.4 Public Education and Outreach Part of the City’s public education and outreach program is administered by MWDOC, although the City is not one of its retail agencies. MWDOC has established an extensive public education and outreach program to assist retail agencies in Orange County to promote water use efficiency awareness within their service areas. MWDOC’s public education and outreach programs consist of five primary activities as described below.
In addition to the primary programs it administers, MWDOC also maintains a vibrant public website (www.mwdoc.com) as well as a social media presence on Facebook, Twitter and Instagram. MWDOC’s Facebook page has more than 1,200 followers. The social media channels are used to educate the public about water-efficiency, rates and other water-related issues.
arcadis.com 4-3

2015 URBAN WATER MANAGEMENT PLAN
MWDOC's public education and outreach programs are described below:
School Education Programs
MWDOC school education programs reach more than 100,000 students per year. The program is broken into elementary and high school components.
• Elementary School Program reaches 60,000 students throughout Orange County through assemblies hosted by the Discovery Science Center. MWDOC holds a $220,000 contract with the Discovery Science Center, funded proportionally by the participating MWDOC retail agencies.
• High School Program is new in 2015-16 and will reach students in 20 high schools in Orange County. The program is administered by MWDOC and operated by two contractors, the OC Department of Education and the Ecology Center. Through the three-year contract, those agencies will train more than 100 county teachers on water education on topics such as, water sources, water conservation, water recycling, watersheds, and ecological solutions for the benefit of their current and future students. Teachers will learn a variety of water conservation methods, such as irrigation technology, rainwater harvesting, water recycling, and water foot-printing through a tour at the Ecology Center facility. These trainings allow teachers to support student -led conservation efforts. The program will reach a minimum of 25,000 students by providing in-classroom water education and helping students plan and implement campus wide “Water Expos” that will allow peer-to-peer instruction on water issues. The $80,000 program is funded by participating agencies.
Value of Water Communication Program
MWDOC administers this program on behalf of 14 agencies. The $190,000 program involves the water agencies developing 30 full news pages that will appear weekly in the Orange County Register, the largest newspaper in the county, with a Sunday readership of 798,000. The campaign will educate OC residents and business leaders on water infrastructure issues and water efficiency measures, as well as advertise water related events and other pertinent information.
Quarterly Water Policy Dinners
The Water Policy Dinner events attract 225 to 300 water and civic leaders every quarter. The programs host speakers topical to the OC water industry, with recent addresses from Felicia Marcus of the state water board and Dr. Lucy Jones, a noted expert on earthquakes and their potential impact on infrastructure.
Annual Water Summit
The annual Water Summit brings together 300 Orange County water and civic leaders with state and national experts on water infrastructure and governance issues. The half-day event has a budget of $80,000 per year. Portions of the cost are covered by attendance and sponsorships, while MWDOC splits a portion with its event partner, OCWD.
Water Inspection Trips
Water Inspection trips take stakeholders on tours of the CRA, California Delta and other key water infrastructure sites. The public trips are required under Metropolitan’s regulations. Metropolitan covers the cost of the trips. In the past years, the City participated in trips, each taking an average of 30 residents.
arcadis.com 4-4

2015 URBAN WATER MANAGEMENT PLAN
Organized Community Events
The City participates in many organized community events including the farmer’s market, neighborhood association meetings and various cultural and holiday celebrations such as the Cinco de Mayo and Independence Day festivals. The City promotes water quality and conservation efforts via the City’s Water Conservation Booth. Staff from the City’s water resources division interacts with community members and provides educational and promotional materials that both promote the high quality of the City’s drinking water and conservation measures.
4.5 Programs to Assess and Manage Distribution System Real Loss Senate Bill 1420 signed into law in September 2014 requires urban water suppliers that submit UWMPs to calculate annual system water losses using the water audit methodology developed by the AWWA. SB 1420 requires the water loss audit be submitted to DWR every five years as part of the urban water supplier’s UWMP. Water auditing is the basis for effective water loss control. DWR’s UWMP Guidebook include a water audit manual intended to help water utilities complete the AWWA Water Audit on an annual basis. A Water Loss Audit was completed for the City which identified areas for improvement and quantified total loss. Based on the data presented, the three priority areas identified were water imported, billed metered, and unauthorized consumption. Multiple criteria are a part of each validity score and a system wide approach will need to be implemented for the City’s improvement. Quantified water loss for the FY 2014-15 was 677 AF which is a significant volume and presents opportunities for improvement. The City completes a system water audit to calculate water losses on an annual basis.
The City’s leak prevention and repair program includes an annual commitment to replace aging water main infrastructure. Leak detection will be a part of the AMI project.
4.6 Water Conservation Program Coordination and Staffing Support The City’s Water Service Quality Coordinator, a position created in 1991, acts as the water conservation coordinator. The conservation coordinator is responsible for conservation program activities and acts as a liaison with MWDOC, Metropolitan, California Urban Water Conservation Council, and others.
The City’s conservation coordinator’s duties include the following:
• Administer the contracts that the City has with Metropolitan and MWDOC regarding rebate programs.
• Conduct surveys at the request of residential and business customers (or designate a staff member to do so).
• Coordinate with other agencies and public groups’ displays on conservation information and provide free water conservation materials to the public.
• Monitor the recycled water program for the City.
• Administer the City’s education program using contractors or staff to educate children of City schools or other locations.
The City’s water conservation programs are funded by the water ratepayers. The conservation program efforts are factored into the City’s existing and future water rates as currently adopted.
arcadis.com 4-5

2015 URBAN WATER MANAGEMENT PLAN
5 WATER SHORTAGE CONTINGENCY PLAN
5.1 Overview In connection with recent water supply challenges, the State Water Resources Control Board found that California has been subject to multi-year droughts in the past, and the Southwest is becoming drier, increasing the probability of prolonged droughts in the future. Due to current and potential future water supply shortages, Governor Brown issued a drought emergency proclamation on January 2014 and signed the 2014 Executive Order that directs urban water suppliers to implement drought response plans to limit outdoor irrigation and wasteful water practices if they are not already in place. Pursuant to California Water Code Section 106, it is the declared policy of the state that domestic water use is the highest use of water and the next highest use is irrigation. This section describes the water supply shortage policies Metropolitan and the City have in place to respond to events including catastrophic interruption and reduction in water supply.
5.2 Shortage Actions
5.2.1 Metropolitan Water Surplus and Drought Management Plan Metropolitan evaluates the level of supplies available and existing levels of water in storage to determine the appropriate management stage annually. Each stage is associated with specific resource management actions to avoid extreme shortages to the extent possible and minimize adverse impacts to retail customers should an extreme shortage occur. The sequencing outlined in the Water Surplus and Drought Management (WSDM) Plan reflects anticipated responses towards Metropolitan’s existing and expected resource mix.
Surplus stages occur when net annual deliveries can be made to water storage programs. Under the WSDM Plan, there are four surplus management stages that provides a framework for actions to take for surplus supplies. Deliveries in DVL and in SWP terminal reservoirs continue through each surplus stage provided there is available storage capacity. Withdrawals from DVL for regulatory purposes or to meet seasonal demands may occur in any stage.
The WSDM Plan distinguishes between shortages, severe shortages, and extreme shortages. The differences between each term is listed below.
• Shortage: Metropolitan can meet full-service demands and partially meet or fully meet interruptible demands using stored water or water transfers as necessary.
• Severe Shortage: Metropolitan can meet full-service demands only by using stored water, transfers, and possibly calling for extraordinary conservation.
• Extreme Shortage: Metropolitan must allocate available supply to full-service customers.
There are six shortage management stages to guide resource management activities. These stages are defined by shortfalls in imported supply and water balances in Metropolitan’s storage programs. When Metropolitan must make net withdrawals from storage to meet demands, it is considered to be in a shortage condition. Figure 5-1 gives a summary of actions under each surplus and shortage stages when
arcadis.com 5-1
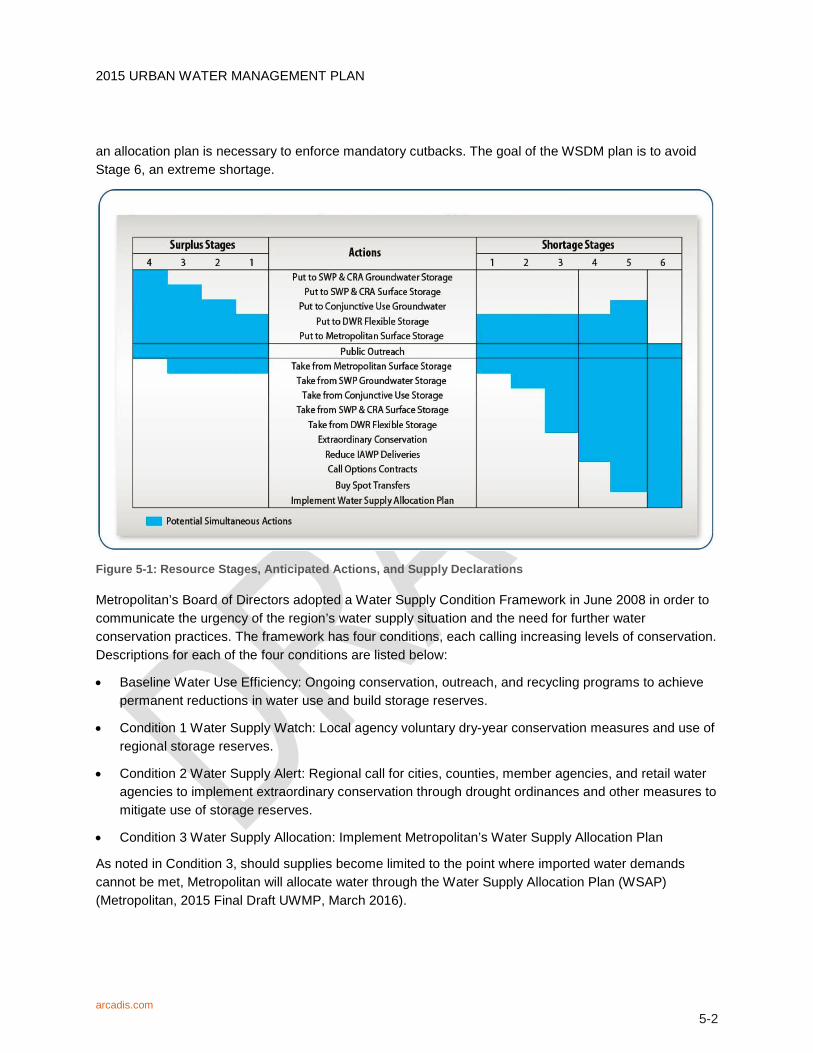
2015 URBAN WATER MANAGEMENT PLAN
an allocation plan is necessary to enforce mandatory cutbacks. The goal of the WSDM plan is to avoid Stage 6, an extreme shortage.
Figure 5-1: Resource Stages, Anticipated Actions, and Supply Declarations
Metropolitan’s Board of Directors adopted a Water Supply Condition Framework in June 2008 in order to communicate the urgency of the region’s water supply situation and the need for further water conservation practices. The framework has four conditions, each calling increasing levels of conservation. Descriptions for each of the four conditions are listed below:
• Baseline Water Use Efficiency: Ongoing conservation, outreach, and recycling programs to achieve permanent reductions in water use and build storage reserves.
• Condition 1 Water Supply Watch: Local agency voluntary dry-year conservation measures and use of regional storage reserves.
• Condition 2 Water Supply Alert: Regional call for cities, counties, member agencies, and retail water agencies to implement extraordinary conservation through drought ordinances and other measures to mitigate use of storage reserves.
• Condition 3 Water Supply Allocation: Implement Metropolitan’s Water Supply Allocation Plan
As noted in Condition 3, should supplies become limited to the point where imported water demands cannot be met, Metropolitan will allocate water through the Water Supply Allocation Plan (WSAP) (Metropolitan, 2015 Final Draft UWMP, March 2016).
arcadis.com 5-2
2015 URBAN WATER MANAGEMENT PLAN
5.2.2 Metropolitan Water Supply Allocation Plan Metropolitan’s imported supplies have been impacted by a number of water supply challenges as noted earlier. In case of extreme water shortage within the Metropolitan service area is the implementation of its Water Supply Allocation Plan.
Metropolitan’s Board of Directors adopted the WSAP in February 2008 to fairly distribute a limited amount of water supply and applies it through a detailed methodology to reflect a range of local conditions and needs of the region’s retail water consumers.
The WSAP includes the specific formula for calculating member agency supply allocations and the key implementation elements needed for administering an allocation. Metropolitan’s WSAP is the foundation for the urban water shortage contingency analysis required under Water Code Section 10632 and is part of Metropolitan’s 2015 UWMP.
Metropolitan’s WSAP was developed in consideration of the principles and guidelines in Metropolitan’s 1999 WSDM with the core objective of creating an equitable “needs-based allocation”. The WSAP’s formula seeks to balance the impacts of a shortage at the retail level while maintaining equity on the wholesale level for shortages of Metropolitan supplies of up to 50 percent. The formula takes into account a number of factors, such as the impact on retail customers, growth in population, changes in supply conditions, investments in local resources, demand hardening aspects of water conservation savings, recycled water, extraordinary storage and transfer actions, and groundwater imported water needs.
The formula is calculated in three steps: 1) based period calculations, 2) allocation year calculations, and 3) supply allocation calculations. The first two steps involve standard computations, while the third step contains specific methodology developed for the WSAP.
Step 1: Base Period Calculations – The first step in calculating a member agency’s water supply allocation is to estimate their water supply and demand using a historical based period with established water supply and delivery data. The base period for each of the different categories of supply and demand is calculated using data from the two most recent non-shortage fiscal years ending 2013 and 2014.
Step 2: Allocation Year Calculations – The next step in calculating the member agency’s water supply allocation is estimating water needs in the allocation year. This is done by adjusting the base period estimates of retail demand for population growth and changes in local supplies.
Step 3: Supply Allocation Calculations – The final step is calculating the water supply allocation for each member agency based on the allocation year water needs identified in Step 2.
In order to implement the WSAP, Metropolitan’s Board of Directors makes a determination on the level of the regional shortage, based on specific criteria, typically in April. The criteria used by Metropolitan includes, current levels of storage, estimated water supplies conditions, and projected imported water demands. The allocations, if deemed necessary, go into effect in July of the same year and remain in effect for a 12-month period. The schedule is made at the discretion of the Board of Directors.
Although Metropolitan’s 2015 UWMP forecasts that Metropolitan will be able to meet projected imported demands throughout the projected period from 2020 to 2040, uncertainty in supply conditions can result
arcadis.com 5-3
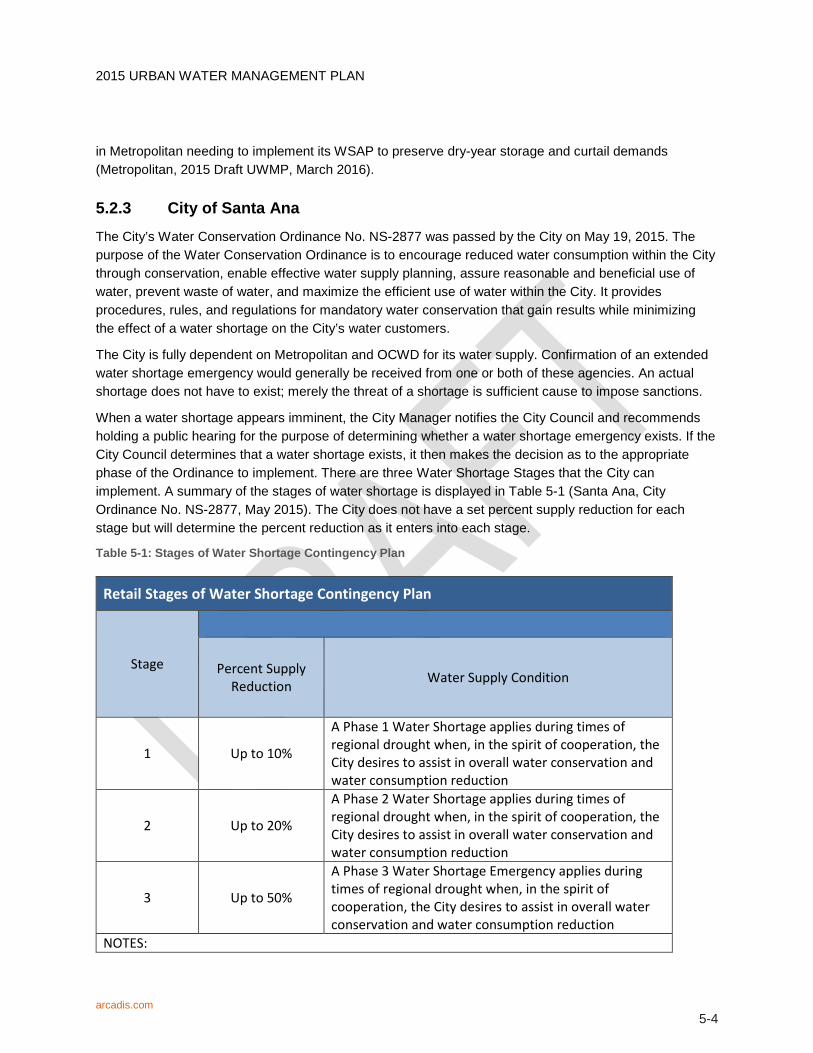
2015 URBAN WATER MANAGEMENT PLAN
in Metropolitan needing to implement its WSAP to preserve dry-year storage and curtail demands (Metropolitan, 2015 Draft UWMP, March 2016).
5.2.3 City of Santa Ana The City’s Water Conservation Ordinance No. NS-2877 was passed by the City on May 19, 2015. The purpose of the Water Conservation Ordinance is to encourage reduced water consumption within the City through conservation, enable effective water supply planning, assure reasonable and beneficial use of water, prevent waste of water, and maximize the efficient use of water within the City. It provides procedures, rules, and regulations for mandatory water conservation that gain results while minimizing the effect of a water shortage on the City’s water customers.
The City is fully dependent on Metropolitan and OCWD for its water supply. Confirmation of an extended water shortage emergency would generally be received from one or both of these agencies. An actual shortage does not have to exist; merely the threat of a shortage is sufficient cause to impose sanctions.
When a water shortage appears imminent, the City Manager notifies the City Council and recommends holding a public hearing for the purpose of determining whether a water shortage emergency exists. If the City Council determines that a water shortage exists, it then makes the decision as to the appropriate phase of the Ordinance to implement. There are three Water Shortage Stages that the City can implement. A summary of the stages of water shortage is displayed in Table 5-1 (Santa Ana, City Ordinance No. NS-2877, May 2015). The City does not have a set percent supply reduction for each stage but will determine the percent reduction as it enters into each stage.
Table 5-1: Stages of Water Shortage Contingency Plan
Retail Stages of Water Shortage Contingency Plan
Stage
Percent Supply Reduction Water Supply Condition
1 Up to 10%
A Phase 1 Water Shortage applies during times of regional drought when, in the spirit of cooperation, the City desires to assist in overall water conservation and water consumption reduction
2 Up to 20%
A Phase 2 Water Shortage applies during times of regional drought when, in the spirit of cooperation, the City desires to assist in overall water conservation and water consumption reduction
3 Up to 50%
A Phase 3 Water Shortage Emergency applies during times of regional drought when, in the spirit of cooperation, the City desires to assist in overall water conservation and water consumption reduction
NOTES:
arcadis.com 5-4

2015 URBAN WATER MANAGEMENT PLAN
5.3 Three-Year Minimum Water Supply As a matter of practice, Metropolitan does not provide annual estimates of the minimum supplies available to its member agencies. As such, Metropolitan member agencies must develop their own estimates for the purposes of meeting the requirements of the Act.
Section 135 of the Metropolitan Water District Act declares that a member agency has the right to invoke its “preferential right” to water, which grants each member agency a preferential right to purchase a percentage of Metropolitan’s available supplies based on specified, cumulative financial contributions to Metropolitan. Each year, Metropolitan calculates and distributes each member agency’s percentage of preferential rights. However, since Metropolitan’s creation in 1927, no member agency has ever invoked these rights as a means of acquiring limited supplies from Metropolitan.
As captured in its 2015 UWMP, Metropolitan believes that the water supply and demand management actions it is undertaking will increase its reliability throughout the 25-year period addressed in its plan. Thus for purposes of this estimate, it is assumed that Metropolitan will be able to maintain the identified supply amounts throughout the three-year period.
Metropolitan projects reliability for full service demands through the year 2040. Additionally, through a variety of groundwater reliability programs conducted by OCWD and participated in by the City, local supplies are projected to be maintained at demand levels. Based on Metropolitan's WSAP, the City is expected to fully meet demands for the next three years assuming Metropolitan is not in shortage, a BPP of 70 percent for Local Supplies, and zero allocations are imposed for Imported Supplies. The Three Year Estimated Minimum Water Supply is listed in Table 5-2.
Table 5-2: Minimum Supply Next Three Years (AF)
Retail: Minimum Supply Next Three Years
2016 2017 2018
Available Water Supply 38,642 38,642 38,642
NOTES:
5.4 Catastrophic Supply Interruption Given the great distances that imported supplies travel to reach Orange County, the region is vulnerable to interruptions along hundreds of miles aqueducts, pipelines and other facilities associated with delivering the supplies to the region. Additionally, the infrastructure in place to deliver supplies are susceptible to damage from earthquakes and other disasters.
5.4.1 Metropolitan Metropolitan has comprehensive plans for stages of actions it would undertake to address a catastrophic interruption in water supplies through its WSDM and WSAP. Metropolitan also developed an Emergency Storage Requirement to mitigate against potential interruption in water supplies resulting from
arcadis.com 5-5
2015 URBAN WATER MANAGEMENT PLAN
catastrophic occurrences within the southern California region, including seismic events along the San Andreas Fault. In addition, Metropolitan is working with the state to implement a comprehensive improvement plan to address catastrophic occurrences outside of the southern California region, such as a maximum probable seismic event in the Delta that would cause levee failure and disruption of SWP deliveries. For greater detail on Metropolitan’s planned responses to catastrophic interruption, please refer to Metropolitan’s 2015 UWMP.
5.4.2 Water Emergency Response of Orange County In 1983, the Orange County water community identified a need to develop a plan on how agencies would respond effectively to disasters impacting the regional water distribution system. The collective efforts of these agencies resulted in the formation of the Water Emergency Response Organization of Orange County (WEROC) to coordinate emergency response on behalf of all Orange County water and wastewater agencies, develop an emergency plan to respond to disasters, and conduct disaster training exercises for the Orange County water community. WEROC was established with the creation of an indemnification agreement between its member agencies to protect each other against civil liabilities and to facilitate the exchange of resources. WEROC is unique in its ability to provide a single point of contact for representation of all water and wastewater utilities in Orange County during a disaster. This representation is to the county, state, and federal disaster coordination agencies. Within the Orange County Operational Area, WEROC is the recognized contact for emergency response for the water community, including the City.
5.4.3 City of Santa Ana The Water Utility’s Emergency Response Plan (ERP) identifies the immediate actions that the City will take to respond, in coordination with the City’s Emergency Response Plan, to a declared water shortage. The City will work in close cooperation with Metropolitan and the Metropolitan Area Radio System (MARS) Network, an organization of water utilities within the service area of Metropolitan to immediately contact its customer agencies during an emergency about potential interruption of services. MARS is an emergency communications system to facilitate the flow of information, control, and exchange of materials and mutual aid within Metropolitan’s service area. Metropolitan and its member agencies formed MARS to improve emergency response, provide alternate means of communication in emergencies, and expedite mutual aid. In the case that the Metropolitan Emergency Operations Center (MEOC) is activated, the MEOC will direct all coordination with member agencies.
The Water Utility’s ERP describes the organizational and operational policies and procedures required to meet the needs of sufficient water for firefighting operations and safe drinking water and provide a system for organizing and prioritizing water repairs. It also cites authorities and specifies the public and private organizations responsible for providing water service.
The Water Utility will operate under normal operating procedures until a situation is beyond its control. This includes implementation of any allocation plan passed on by Metropolitan, and water shortage contingency plans of OCWD.
If the situation is the Water Utility’s control, the Water Operations Center (WOC) may be activated to better manage the situation. If the situation warrants, the City Emergency Operations Center (EOC) may
arcadis.com 5-6
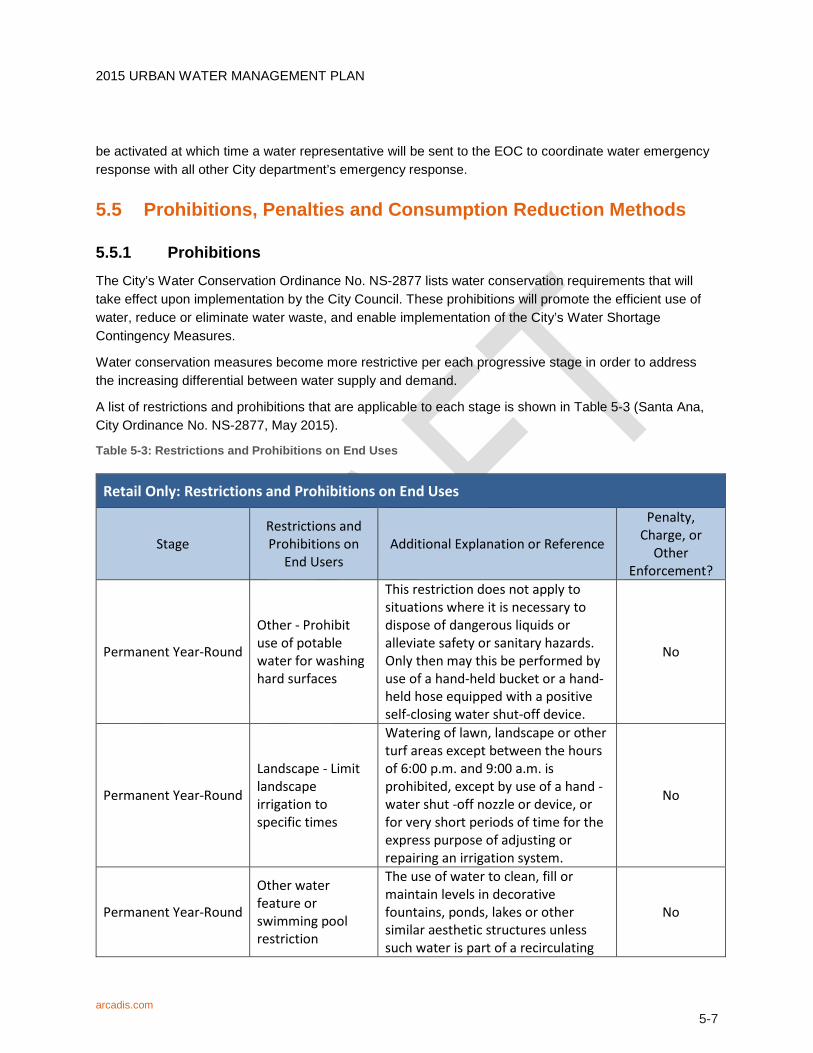
2015 URBAN WATER MANAGEMENT PLAN
be activated at which time a water representative will be sent to the EOC to coordinate water emergency response with all other City department’s emergency response.
5.5 Prohibitions, Penalties and Consumption Reduction Methods
5.5.1 Prohibitions The City’s Water Conservation Ordinance No. NS-2877 lists water conservation requirements that will take effect upon implementation by the City Council. These prohibitions will promote the efficient use of water, reduce or eliminate water waste, and enable implementation of the City’s Water Shortage Contingency Measures.
Water conservation measures become more restrictive per each progressive stage in order to address the increasing differential between water supply and demand.
A list of restrictions and prohibitions that are applicable to each stage is shown in Table 5-3 (Santa Ana, City Ordinance No. NS-2877, May 2015).
Table 5-3: Restrictions and Prohibitions on End Uses
Retail Only: Restrictions and Prohibitions on End Uses
Stage Restrictions and Prohibitions on
End Users Additional Explanation or Reference
Penalty, Charge, or
Other Enforcement?
Permanent Year-Round
Other - Prohibit use of potable water for washing hard surfaces
This restriction does not apply to situations where it is necessary to dispose of dangerous liquids or alleviate safety or sanitary hazards. Only then may this be performed by use of a hand-held bucket or a hand-held hose equipped with a positive self-closing water shut-off device.
No
Permanent Year-Round
Landscape - Limit landscape irrigation to specific times
Watering of lawn, landscape or other turf areas except between the hours of 6:00 p.m. and 9:00 a.m. is prohibited, except by use of a hand -water shut -off nozzle or device, or for very short periods of time for the express purpose of adjusting or repairing an irrigation system.
No
Permanent Year-Round
Other water feature or swimming pool restriction
The use of water to clean, fill or maintain levels in decorative fountains, ponds, lakes or other similar aesthetic structures unless such water is part of a recirculating
No
arcadis.com 5-7

2015 URBAN WATER MANAGEMENT PLAN
Retail Only: Restrictions and Prohibitions on End Uses
Stage Restrictions and Prohibitions on
End Users Additional Explanation or Reference
Penalty, Charge, or
Other Enforcement?
system is prohibited.
Permanent Year-Round
CII - Restaurants may only serve water upon request
- No
Permanent Year-Round
Other - Prohibit vehicle washing except at facilities using recycled or recirculating water
- No
Permanent Year-Round
CII - Lodging establishment must offer opt out of linen service
- No
Permanent Year-Round
CII - Commercial kitchens required to use pre-rinse spray valves
- No
Permanent Year-Round
Other - Customers must repair leaks, breaks, and malfunctions in a timely manner
All leaks, breaks, or other malfunctions in the water user's plumbing or distribution system must be repaired within seventy-two (72) hours of notification by the City, unless other arrangements are made with the City.
No
Permanent Year-Round Other Installation of single pass cooling systems is prohibited in buildings requesting new water service.
No
Permanent Year-Round Other
All commercial conveyor car wash systems must have installed operational recirculating water systems, or must have secured a waiver of this requirement from the City.
No
Permanent Year-Round
Landscape - Restrict or prohibit runoff from landscape
- No
arcadis.com 5-8
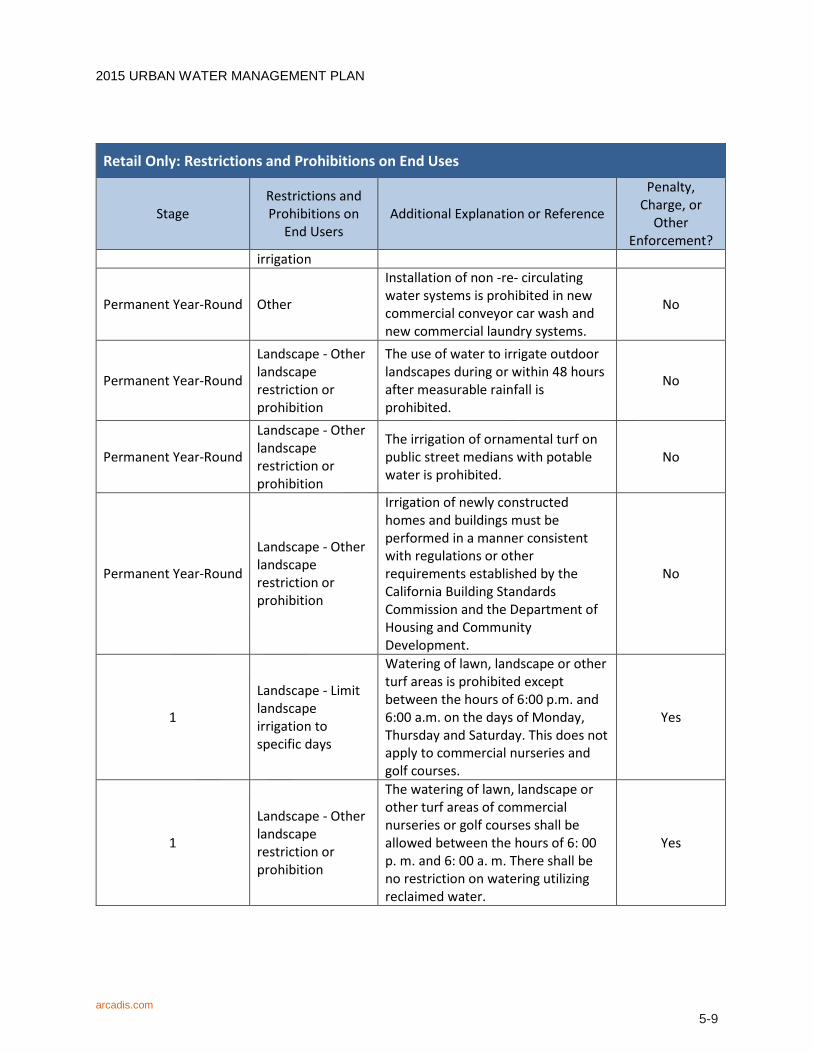
2015 URBAN WATER MANAGEMENT PLAN
Retail Only: Restrictions and Prohibitions on End Uses
Stage Restrictions and Prohibitions on
End Users Additional Explanation or Reference
Penalty, Charge, or
Other Enforcement?
irrigation
Permanent Year-Round Other
Installation of non -re- circulating water systems is prohibited in new commercial conveyor car wash and new commercial laundry systems.
No
Permanent Year-Round
Landscape - Other landscape restriction or prohibition
The use of water to irrigate outdoor landscapes during or within 48 hours after measurable rainfall is prohibited.
No
Permanent Year-Round
Landscape - Other landscape restriction or prohibition
The irrigation of ornamental turf on public street medians with potable water is prohibited.
No
Permanent Year-Round
Landscape - Other landscape restriction or prohibition
Irrigation of newly constructed homes and buildings must be performed in a manner consistent with regulations or other requirements established by the California Building Standards Commission and the Department of Housing and Community Development.
No
1
Landscape - Limit landscape irrigation to specific days
Watering of lawn, landscape or other turf areas is prohibited except between the hours of 6:00 p.m. and 6:00 a.m. on the days of Monday, Thursday and Saturday. This does not apply to commercial nurseries and golf courses.
Yes
1
Landscape - Other landscape restriction or prohibition
The watering of lawn, landscape or other turf areas of commercial nurseries or golf courses shall be allowed between the hours of 6: 00 p. m. and 6: 00 a. m. There shall be no restriction on watering utilizing reclaimed water.
Yes
arcadis.com 5-9
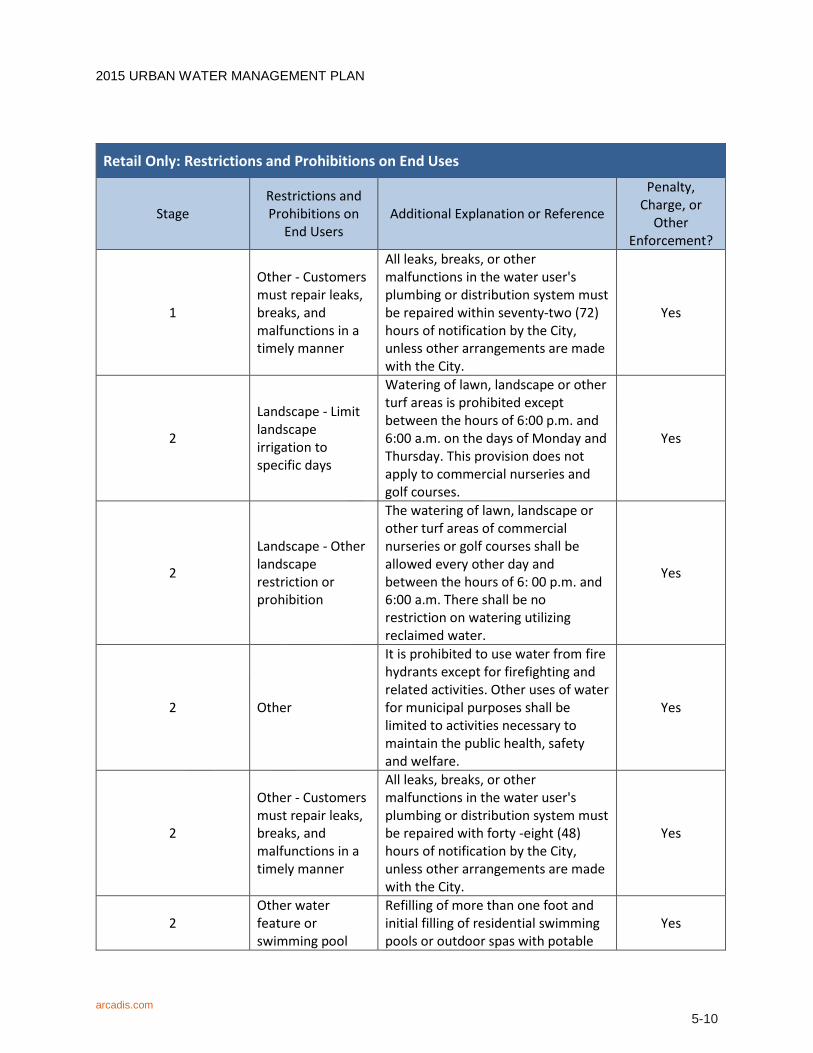
2015 URBAN WATER MANAGEMENT PLAN
Retail Only: Restrictions and Prohibitions on End Uses
Stage Restrictions and Prohibitions on
End Users Additional Explanation or Reference
Penalty, Charge, or
Other Enforcement?
1
Other - Customers must repair leaks, breaks, and malfunctions in a timely manner
All leaks, breaks, or other malfunctions in the water user's plumbing or distribution system must be repaired within seventy-two (72) hours of notification by the City, unless other arrangements are made with the City.
Yes
2
Landscape - Limit landscape irrigation to specific days
Watering of lawn, landscape or other turf areas is prohibited except between the hours of 6:00 p.m. and 6:00 a.m. on the days of Monday and Thursday. This provision does not apply to commercial nurseries and golf courses.
Yes
2
Landscape - Other landscape restriction or prohibition
The watering of lawn, landscape or other turf areas of commercial nurseries or golf courses shall be allowed every other day and between the hours of 6: 00 p.m. and 6:00 a.m. There shall be no restriction on watering utilizing reclaimed water.
Yes
2 Other
It is prohibited to use water from fire hydrants except for firefighting and related activities. Other uses of water for municipal purposes shall be limited to activities necessary to maintain the public health, safety and welfare.
Yes
2
Other - Customers must repair leaks, breaks, and malfunctions in a timely manner
All leaks, breaks, or other malfunctions in the water user's plumbing or distribution system must be repaired with forty -eight (48) hours of notification by the City, unless other arrangements are made with the City.
Yes
2 Other water feature or swimming pool
Refilling of more than one foot and initial filling of residential swimming pools or outdoor spas with potable
Yes
arcadis.com 5-10
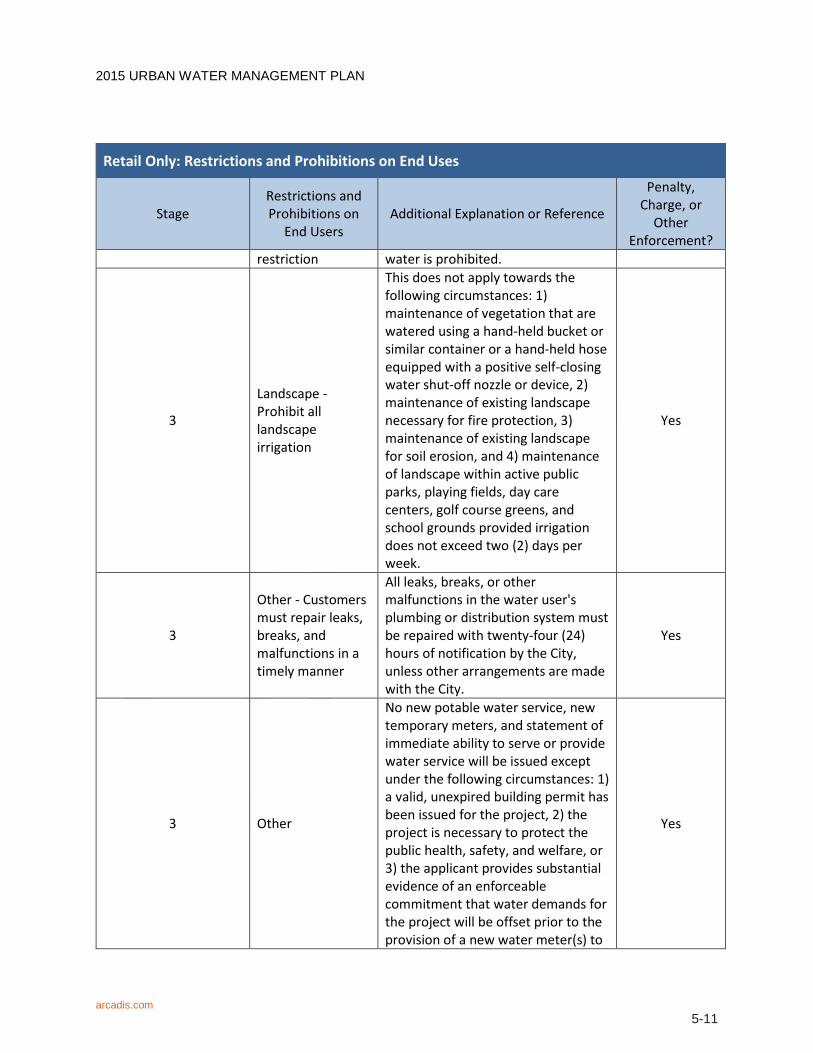
2015 URBAN WATER MANAGEMENT PLAN
Retail Only: Restrictions and Prohibitions on End Uses
Stage Restrictions and Prohibitions on
End Users Additional Explanation or Reference
Penalty, Charge, or
Other Enforcement?
restriction water is prohibited.
3
Landscape - Prohibit all landscape irrigation
This does not apply towards the following circumstances: 1) maintenance of vegetation that are watered using a hand-held bucket or similar container or a hand-held hose equipped with a positive self-closing water shut-off nozzle or device, 2) maintenance of existing landscape necessary for fire protection, 3) maintenance of existing landscape for soil erosion, and 4) maintenance of landscape within active public parks, playing fields, day care centers, golf course greens, and school grounds provided irrigation does not exceed two (2) days per week.
Yes
3
Other - Customers must repair leaks, breaks, and malfunctions in a timely manner
All leaks, breaks, or other malfunctions in the water user's plumbing or distribution system must be repaired with twenty-four (24) hours of notification by the City, unless other arrangements are made with the City.
Yes
3 Other
No new potable water service, new temporary meters, and statement of immediate ability to serve or provide water service will be issued except under the following circumstances: 1) a valid, unexpired building permit has been issued for the project, 2) the project is necessary to protect the public health, safety, and welfare, or 3) the applicant provides substantial evidence of an enforceable commitment that water demands for the project will be offset prior to the provision of a new water meter(s) to
Yes
arcadis.com 5-11

2015 URBAN WATER MANAGEMENT PLAN
Retail Only: Restrictions and Prohibitions on End Uses
Stage Restrictions and Prohibitions on
End Users Additional Explanation or Reference
Penalty, Charge, or
Other Enforcement?
the satisfaction of the City. NOTES:
5.5.2 Penalties Any customer who violates any of the Water Shortage provisions will be subject to written warnings, fine, and possible disconnection of service. The first violation will result in a written notice in the utility bill of the customer in violation. The second and subsequent violations will result in a written notice and a surcharge in an amount set by the City Council on the water use in excess of the water allocation requirements. Customers who have three violations within a 12-month period shall be deemed gross violators and will be subject to the installation of a flow restrictor device by the City. The charge for installing and removing a flow-restricting device and any other penalties and charges due to the City shall be paid before normal service can be restored (Santa Ana, City Ordinance No. NS-2877, May 2015).
5.5.3 Consumption Reduction Methods Table 5-4 lists the consumption reduction methods that will be used to reduce water use in restrictive stages.
arcadis.com 5-12
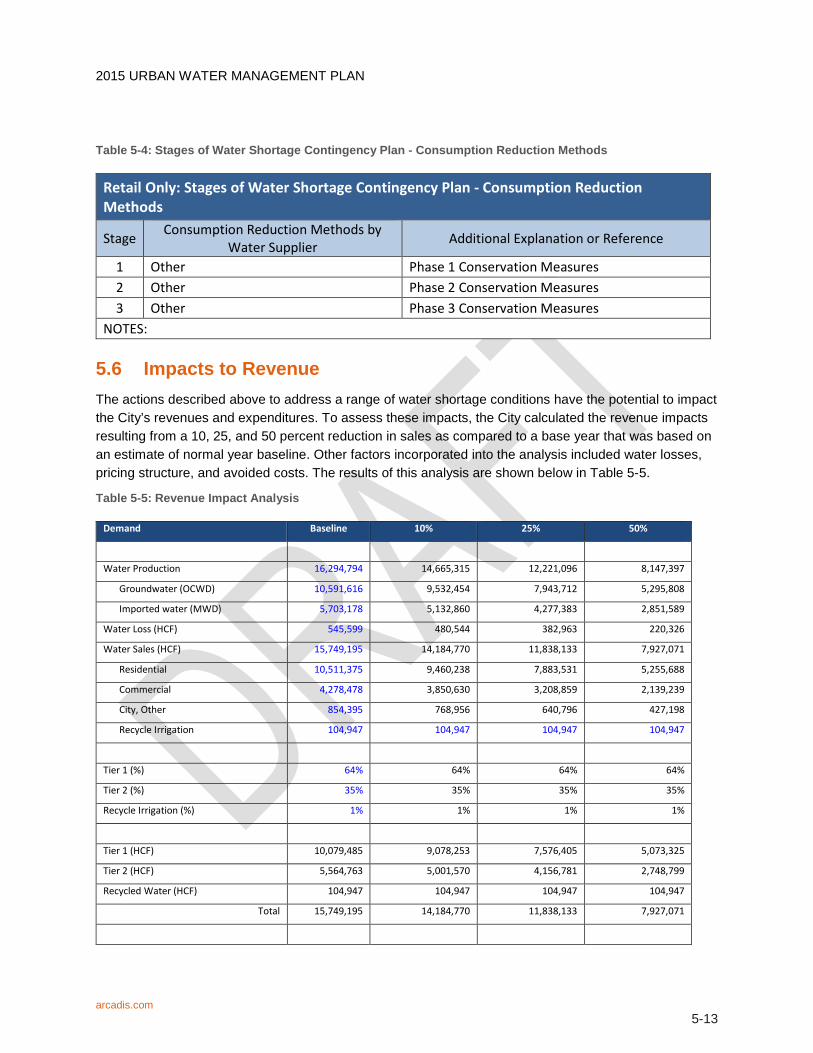
2015 URBAN WATER MANAGEMENT PLAN
Table 5-4: Stages of Water Shortage Contingency Plan - Consumption Reduction Methods
Retail Only: Stages of Water Shortage Contingency Plan - Consumption Reduction Methods
Stage Consumption Reduction Methods by Water Supplier Additional Explanation or Reference
1 Other Phase 1 Conservation Measures 2 Other Phase 2 Conservation Measures 3 Other Phase 3 Conservation Measures
NOTES:
5.6 Impacts to Revenue The actions described above to address a range of water shortage conditions have the potential to impact the City’s revenues and expenditures. To assess these impacts, the City calculated the revenue impacts resulting from a 10, 25, and 50 percent reduction in sales as compared to a base year that was based on an estimate of normal year baseline. Other factors incorporated into the analysis included water losses, pricing structure, and avoided costs. The results of this analysis are shown below in Table 5-5.
Table 5-5: Revenue Impact Analysis
Demand Baseline 10% 25% 50%
Water Production 16,294,794 14,665,315 12,221,096 8,147,397
Groundwater (OCWD) 10,591,616 9,532,454 7,943,712 5,295,808
Imported water (MWD) 5,703,178 5,132,860 4,277,383 2,851,589
Water Loss (HCF) 545,599 480,544 382,963 220,326
Water Sales (HCF) 15,749,195 14,184,770 11,838,133 7,927,071
Residential 10,511,375 9,460,238 7,883,531 5,255,688
Commercial 4,278,478 3,850,630 3,208,859 2,139,239
City, Other 854,395 768,956 640,796 427,198
Recycle Irrigation 104,947 104,947 104,947 104,947
Tier 1 (%) 64% 64% 64% 64%
Tier 2 (%) 35% 35% 35% 35%
Recycle Irrigation (%) 1% 1% 1% 1%
Tier 1 (HCF) 10,079,485 9,078,253 7,576,405 5,073,325
Tier 2 (HCF) 5,564,763 5,001,570 4,156,781 2,748,799
Recycled Water (HCF) 104,947 104,947 104,947 104,947
Total 15,749,195 14,184,770 11,838,133 7,927,071
arcadis.com 5-13
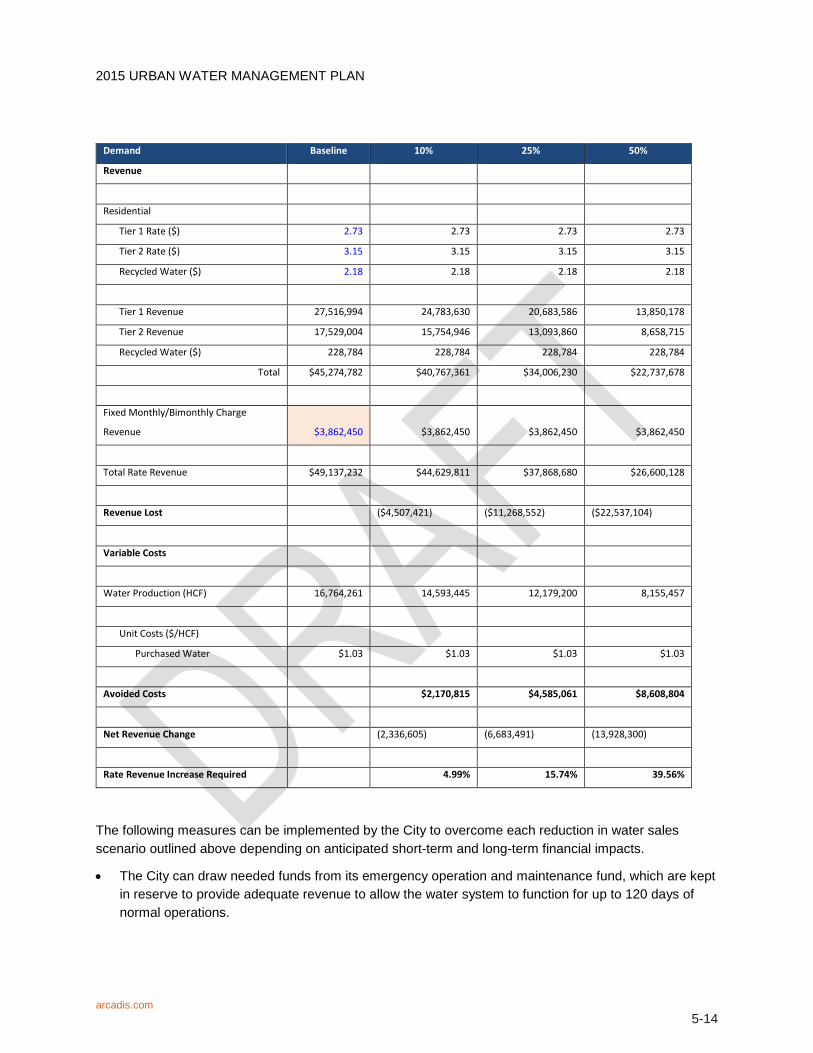
2015 URBAN WATER MANAGEMENT PLAN
Demand Baseline 10% 25% 50%
Revenue
Residential
Tier 1 Rate ($) 2.73 2.73 2.73 2.73
Tier 2 Rate ($) 3.15 3.15 3.15 3.15
Recycled Water ($) 2.18 2.18 2.18 2.18
Tier 1 Revenue 27,516,994 24,783,630 20,683,586 13,850,178
Tier 2 Revenue 17,529,004 15,754,946 13,093,860 8,658,715
Recycled Water ($) 228,784 228,784 228,784 228,784
Total $45,274,782 $40,767,361 $34,006,230 $22,737,678
Fixed Monthly/Bimonthly Charge
Revenue $3,862,450 $3,862,450 $3,862,450 $3,862,450
Total Rate Revenue $49,137,232 $44,629,811 $37,868,680 $26,600,128
Revenue Lost ($4,507,421) ($11,268,552) ($22,537,104)
Variable Costs
Water Production (HCF) 16,764,261 14,593,445 12,179,200 8,155,457
Unit Costs ($/HCF)
Purchased Water $1.03 $1.03 $1.03 $1.03
Avoided Costs $2,170,815 $4,585,061 $8,608,804
Net Revenue Change (2,336,605) (6,683,491) (13,928,300)
Rate Revenue Increase Required 4.99% 15.74% 39.56%
The following measures can be implemented by the City to overcome each reduction in water sales scenario outlined above depending on anticipated short-term and long-term financial impacts.
• The City can draw needed funds from its emergency operation and maintenance fund, which are kept in reserve to provide adequate revenue to allow the water system to function for up to 120 days of normal operations.
arcadis.com 5-14
2015 URBAN WATER MANAGEMENT PLAN
• The City can defer non-mission critical capital improvement projects and reallocate the funds to cover the cost of operations and critical maintenance.
• The City Manager can recommend the City Council to declare a water shortage and implement the City’s Water Shortage Contingency Plan. Depending on the severity of the shortage and impact on revenue, the City Council may increase water rates, other than Tier 1 Lifeline rates, by an amount necessary as determined by the City Council. The subsequent rate increases enacted will remain in effect until such time the City Council declares a water shortage no longer exists.
5.7 Reduction Measuring Mechanism Under normal conditions, potable water production figures are recorded daily. Weekly and monthly reports are prepared and monitored. This data will be used to measure the effectiveness of any water shortage contingency stage that may be implemented.
arcadis.com 5-15

2015 URBAN WATER MANAGEMENT PLAN
6 RECYCLED WATER Recycled water opportunities have continued to grow in southern California as public acceptance and the need to expand local water resources continues to be a priority. Recycled water also provides a degree of flexibility and added reliability during drought conditions when imported water supplies are restricted.
Recycled water is wastewater that is treated through primary, secondary and tertiary processes and is acceptable for most non-potable water purposes such as irrigation, and commercial and industrial process water per Title 22 requirements.
6.1 Agency Coordination The City does not own or operate wastewater treatment facilities and sends all collected wastewater to OCSD for treatment and disposal. OCWD is the manager of the OC Basin and strives to maintain and increase the reliability of the OC Basin through replenishment with imported water, stormwater, and advanced treated wastewater. OCWD and OCSD have jointly constructed and expanded two water recycling projects to meet this goal that include: 1) OCWD GAP and 2) OCWD GWRS.
6.1.1 OCWD Green Acres Project OCWD owns and operates the GAP, a water recycling system that provides up to 8,400 AFY of recycled water for irrigation and industrial uses. GAP provides an alternate source of water that is mainly delivered to parks, golf courses, greenbelts, cemeteries, and nurseries in the cities of Costa Mesa, Fountain Valley, Newport Beach, and Santa Ana. Approximately 100 sites use GAP water, current recycled water users include Mile Square Park and Golf Courses in Fountain Valley, Costa Mesa Country Club, Chroma Systems carpet dyeing, Kaiser Permanente, and Caltrans. The City maintains an agreement with OCWD to supply GAP water to customers where available.
6.1.2 OCWD Groundwater Replenishment System OCWD’s GWRS receives secondary treated wastewater from OCSD and purifies it to levels that meet and exceed all state and federal drinking water standards. The GWRS Phase I plant has been operational since January 2008, and uses a three-step advanced treatment process consisting of microfiltration (MF), reverse osmosis (RO), and ultraviolet (UV) light with hydrogen peroxide. A portion of the treated water is injected into the seawater barrier to prevent seawater intrusion into the groundwater basin. The other portion of the water is pumped to ponds where the water percolates into deep aquifers and becomes part of Orange County’s water supply. The treatment process described on OCWD’s website is provided below (OCWD, GWRS, 2015).
GWRS Treatment Process
The first step of the treatment process after receiving the secondary treated wastewater is a separation process called MF that uses hollow polypropylene fibers with 0.2 micron diameter holes in the sides. Suspended solids, protozoa, bacteria and some viruses are filtered out when drawing water through the holes to the center of the fibers.
arcadis.com 6-1

2015 URBAN WATER MANAGEMENT PLAN
The second step of the process consists of RO, semi-permeable polyamide polymer (plastic) membranes that water is forced through under high pressure. RO removes dissolved chemicals, viruses and pharmaceuticals in the water resulting in near-distilled-quality water that requires minerals be added back in to stabilize the water. This process was used by OCWD from 1975 to 2004 at their Water Factory 21 (WF-21) to purify treated wastewater from OCSD for injection into the seawater intrusion barrier.
The third step of the process involves water being exposed to high-intensity UV light with hydrogen peroxide (H2O2) for disinfection and removal of any trace organic compounds that may have passed through the RO membranes. The trace organic compounds may include NDMA and 1-4 Dioxane, which have been removed to the parts-per trillion level. UV disinfection with H2O2 is an effective disinfection/advanced oxidation process that keeps these compounds from reaching drinking water supplies.
OCWD’s GWRS has a current production capacity of 112,100 AFY with the expansion that was completed in 2015. Approximately 39,200 AFY of the highly purified water is pumped into the injection wells and 72,900 AFY is pumped to the percolation ponds in the city of Anaheim where the water is naturally filtered through sand and gravel to deep aquifers of the groundwater basin. The OC Basin provides approximately 72 percent of the potable water supply for north and central Orange County.
The design and construction of the first phase (78,500 AFY) of the GWRS project was jointly funded by OCWD and OCSD; Phase 2 expansion (33,600 AFY) was funded solely by OCWD. Expansion beyond this is currently in discussion and could provide an additional 33,600 AFY of water, increasing total GWRS production to 145,700 AFY. The GWRS is the world’s largest water purification system for indirect potable reuse (IPR).
6.2 Wastewater Description and Disposal The City operates and maintains the local sewer system consisting of over 390 miles of pipeline, 7,630 manholes, and two lift stations that connect to OCSD's trunk system to convey wastewater to OCSD's treatment plants. OCSD has an extensive system of gravity flow sewers, pump stations, and pressurized sewers. Collected wastewater is sent to OCSD's plants located in the cities of Huntington Beach and Fountain Valley. OCSD’s Plant No. 1 in Fountain Valley has a capacity of 320 million gallons per day (MGD) and Plant No. 2 in Huntington Beach has a capacity of 312 MGD. Both plants share a common ocean outfall, but Plant No. 1 currently provides all of its secondary treated wastewater to OCWD’s GWRS for beneficial reuse. The 120-inch diameter ocean outfall extends 4 miles off the coast of Huntington Beach. A 78-inch diameter emergency outfall also extends 1.3 miles off the coast.
Table 6-1 summarizes the wastewater collected by the City and transported to OCSD's system in 2015. No wastewater is treated or disposed in the City’s service area as OCSD treats and disposes all of the City's wastewater.
arcadis.com 6-2
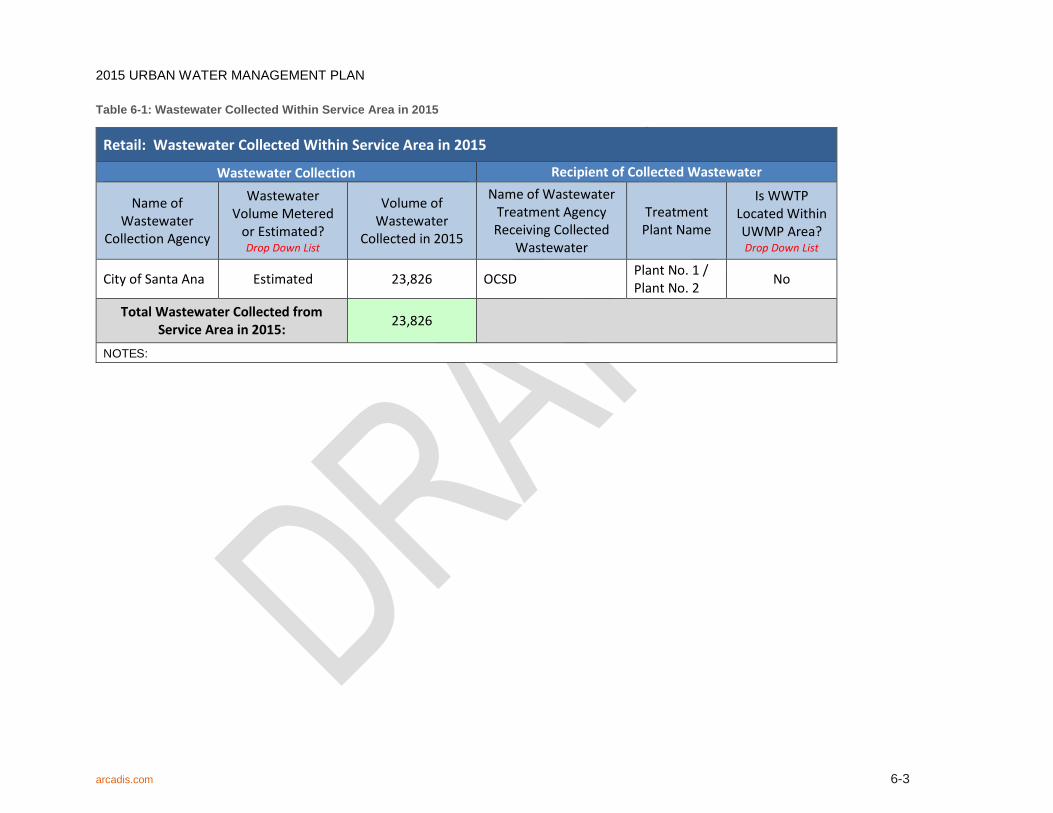
2015 URBAN WATER MANAGEMENT PLAN
Table 6-1: Wastewater Collected Within Service Area in 2015
Retail: Wastewater Collected Within Service Area in 2015
Wastewater Collection Recipient of Collected Wastewater
Name of Wastewater
Collection Agency
Wastewater Volume Metered
or Estimated? Drop Down List
Volume of Wastewater
Collected in 2015
Name of Wastewater Treatment Agency Receiving Collected
Wastewater
Treatment Plant Name
Is WWTP Located Within UWMP Area? Drop Down List
City of Santa Ana Estimated 23,826 OCSD Plant No. 1 / Plant No. 2 No
Total Wastewater Collected from Service Area in 2015: 23,826
NOTES:
arcadis.com 6-3

2015 URBAN WATER MANAGEMENT PLAN
6.3 Current Recycled Water Uses The City provides OCWD GAP recycled water to the southern part of the City. In FY 2014-15, approximately 352 AF of GAP water was used in the City’s service area. The current users/uses of recycled water are as follows:
• Centennial Soccer Fields
• Bomo Koral Park
• Flower Street Bike Trail
• McFadden Intermediate School
• Adams Park
• Chroma Systems- Carpet Dyeing
• Chroma Systems- Landscape
• Kaiser Medical Office Landscape
• Chick-fil-A Landscape
• Santa Ana River Trail Landscape
• Godinez High School Landscape
• MacArthur Boulevard Median Lanscape
• Bear Street Median Landscape
• Thornton Park
• Harbor Boulevard Median Landscape
• Santa Ana Valley High School Sports Complex Landscape
Current and projected recycled water use through 2040 are shown in Table 6-2 and are expected to remain constant. The projected 2015 recycled water use from the City's 2010 UWMP are compared to the 2015 actual use in Table 6-3, where the actual use is higher than the projected.
arcadis.com 6-4
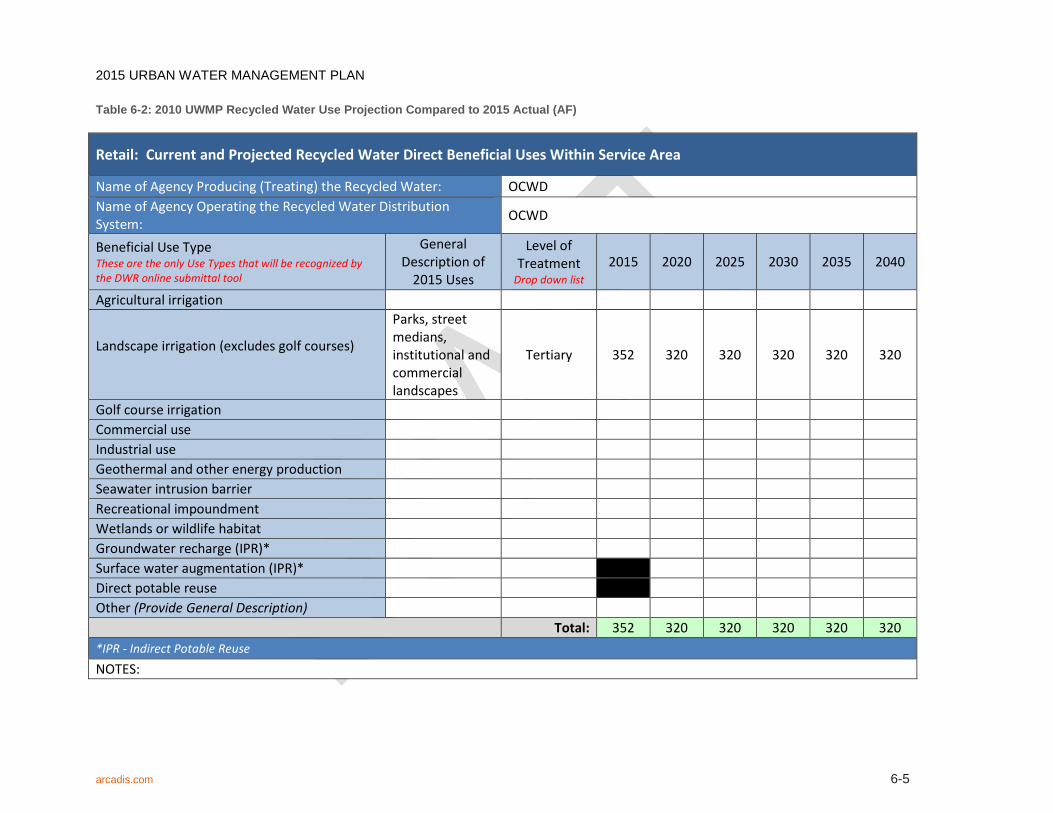
2015 URBAN WATER MANAGEMENT PLAN
Table 6-2: 2010 UWMP Recycled Water Use Projection Compared to 2015 Actual (AF)
Retail: Current and Projected Recycled Water Direct Beneficial Uses Within Service Area
Name of Agency Producing (Treating) the Recycled Water: OCWD Name of Agency Operating the Recycled Water Distribution System: OCWD
Beneficial Use Type These are the only Use Types that will be recognized by the DWR online submittal tool
General Description of
2015 Uses
Level of Treatment
Drop down list 2015 2020 2025 2030 2035 2040
Agricultural irrigation
Landscape irrigation (excludes golf courses)
Parks, street medians, institutional and commercial landscapes
Tertiary 352 320 320 320 320 320
Golf course irrigation Commercial use Industrial use Geothermal and other energy production Seawater intrusion barrier Recreational impoundment Wetlands or wildlife habitat Groundwater recharge (IPR)* Surface water augmentation (IPR)* Direct potable reuse Other (Provide General Description)
Total: 352 320 320 320 320 320 *IPR - Indirect Potable Reuse NOTES:
arcadis.com 6-5
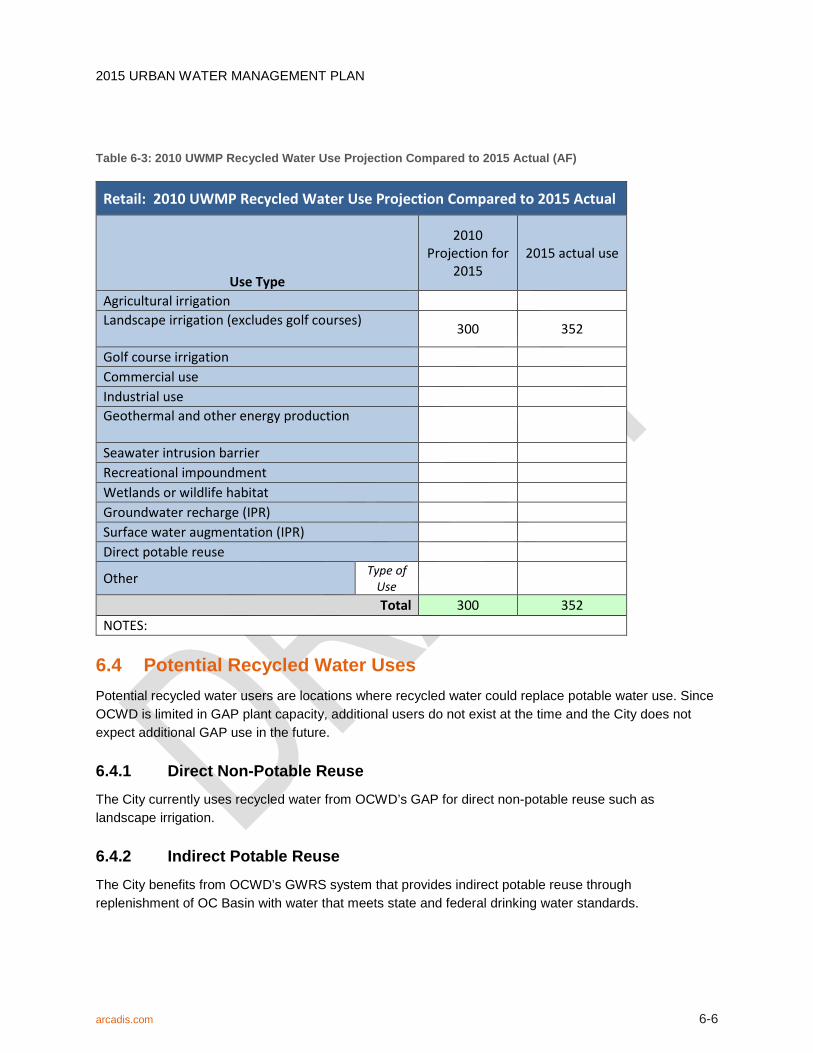
2015 URBAN WATER MANAGEMENT PLAN
Table 6-3: 2010 UWMP Recycled Water Use Projection Compared to 2015 Actual (AF)
Retail: 2010 UWMP Recycled Water Use Projection Compared to 2015 Actual
Use Type
2010 Projection for
2015 2015 actual use
Agricultural irrigation Landscape irrigation (excludes golf courses) 300 352
Golf course irrigation Commercial use Industrial use Geothermal and other energy production
Seawater intrusion barrier Recreational impoundment Wetlands or wildlife habitat Groundwater recharge (IPR) Surface water augmentation (IPR) Direct potable reuse
Other Type of Use
Total 300 352 NOTES:
6.4 Potential Recycled Water Uses Potential recycled water users are locations where recycled water could replace potable water use. Since OCWD is limited in GAP plant capacity, additional users do not exist at the time and the City does not expect additional GAP use in the future.
6.4.1 Direct Non-Potable Reuse The City currently uses recycled water from OCWD’s GAP for direct non-potable reuse such as landscape irrigation.
6.4.2 Indirect Potable Reuse The City benefits from OCWD’s GWRS system that provides indirect potable reuse through replenishment of OC Basin with water that meets state and federal drinking water standards.
arcadis.com 6-6

2015 URBAN WATER MANAGEMENT PLAN
6.5 Optimization Plan Studies of water recycling opportunities within southern California provide a context for promoting the development of water recycling plans. It is recognized that broad public acceptance of recycled water requires continued education and public involvement. Currently, most of the recycled water available is being directed toward replenishment of the groundwater basin and improvements in groundwater quality. As a groundwater user, the City supports the efforts of OCWD and OCSD to use recycled water as a primary resource for groundwater recharge in Orange County.
Public Education
The City participates in the MWDOC public education and school education programs that include extensive sections on water recycling. MWDOC's water use efficiency public information programs are a partnership with agencies throughout the county.
Through a variety of public information programs, MWDOC reaches the public, including those in the City, with information regarding present and future water supplies, the demands for a suitable quantity and quality of water, including recycled water, and the importance of implementing water efficient techniques and behaviors. Water education programs through MWDOC have reached thousands of students in the City with grade-specific programs that include information on recycled water.
Financial Incentives
The implementation of recycled water projects involves a substantial upfront capital investment for planning studies, Environmental Impact Reports (EIRs), engineering design and construction before there is any recycled water to market. For some water agencies, these capital costs exceed the short-term expense of purchasing additional imported water supplies from Metropolitan.
The establishment of new supplemental funding sources through federal, state and regional programs now provides significant financial incentives for water agencies to develop and make use of recycled water locally. Potential sources of funding include federal, state and local funding opportunities. These funding sources include the U.S. Department of Interior Bureau of Reclamation (USBR), California Proposition 13 Water Bond, Proposition 84 and Metropolitan LRP. These funding opportunities may be sought by the City or possibly more appropriately by regional agencies. The City will continue to support seeking funding for regional water recycling projects and programs.
Optimization Recycled Water Use
In Orange County, recycled water is used for irrigating golf courses, parks, schools, businesses, and communal landscaping, as well as for groundwater recharge. Recycled water users in the City receive their water from OCWD’s GAP. Analyses have indicated that present worth costs to expand recycled water within other areas of the City are not cost effective as compared to purchasing imported water from Metropolitan, or using groundwater. The City will continue to conduct feasibility studies for recycled water and seek out creative solutions such as funding, regulatory requirements, institutional arrangement and public acceptance for recycled water use with OCWD, Metropolitan, and other cooperative agencies.
arcadis.com 6-7

2015 URBAN WATER MANAGEMENT PLAN
7 FUTURE WATER SUPPLY PROJECTS AND PROGRAMS
7.1 Water Management Tools Resource optimization such as desalination and IPR minimize the City's and region's reliance on imported water. Optimization efforts are typically led by regional agencies in collaboration with local/retail agencies.
7.2 Transfer or Exchange Opportunities Interconnections with other agencies result in the ability to share water supplies during short term emergency situations or planned shutdowns of major imported systems. The City maintains seven connections to Metropolitan's system and nine emergency connections with surrounding agencies. These connections can provide a total supply of 60,580 gpm into the City's distribution system. The Metropolitan connections are typically operating as constant flow sources.
The City relies on its wholesalers, Metropolitan and OCWD, to be the responsible parties for negotiating water transfers and exchanges. Currently, there are no transfer or exchange opportunities.
7.3 Planned Water Supply Projects and Programs The City continually reviews practices that will provide its customers with adequate and reliable supplies. Trained staff ensures the water is safe and the supply will meet present and future needs in an environmentally and economically responsible manner. The City coordinates its long-term and water shortage planning with Metropolitan and OCWD.
Water use efficiency measures described in Section 4 and use of recycled water described in Section 6 have the potential to reduce overall demand. Any new water sources developed will primarily be to better manage the groundwater basin and replace or upgrade inefficient wells, rather than support population growth and new development.
The City’s Fiscal Year 2015/2016 Capital Improvement Program identifies planned design and construction projects as described below.
Advanced Meter Infrastructure – replace existing aging meters with new, more accurate meters and incorporate technological advances in metering technology that allows City personnel and customers to access real time water consumption data preventing future O&M involved with manual meter readings.
7.4 Desalination Opportunities In 2001, Metropolitan developed a Seawater Desalination Program (SDP) to provide incentives for developing new seawater desalination projects in Metropolitan’s service area. In 2014, Metropolitan modified the provisions of their Local Resources Program (LRP) to include incentives for locally produced seawater desalination projects that reduce the need for imported supplies. To qualify for the incentive, proposed projects must replace an existing demand or prevent new demand on Metropolitan’s imported water supplies. In return, Metropolitan offers two incentive formulas under the program:
arcadis.com 7-1

2015 URBAN WATER MANAGEMENT PLAN
• Up to $340 per AF for 25 years, depending on the unit cost of seawater produced compared to the cost of Metropolitan supplies
• Up to $475 per AF for 15 years, depending on the unit cost of seawater produced compared to the cost of Metropolitan supplies
Developing local supplies within Metropolitan's service area is part of their IRP goal of improving water supply reliability in the region. Creating new local supplies reduce pressure on imported supplies from the SWP and Colorado River.
On May 6th, 2015, the SWRCB approved an amendment to the state’s Water Quality Control Plan for the Ocean Waters of California (California Ocean Plan) to address effects associated with the construction and operation of seawater desalination facilities (Desalination Amendment). The amendment supports the use of ocean water as a reliable supplement to traditional water supplies while protecting marine life and water quality. The California Ocean Plan now formally acknowledges seawater desalination as a beneficial use of the Pacific Ocean and the Desalination Amendment provides a uniform, consistent process for permitting seawater desalination facilities statewide.
If the following projects are developed, Metropolitan's imported water deliveries to Orange County could be reduced. These projects include the Huntington Beach Seawater Desalination Project, the Doheny Desalination Project, and the Camp Pendleton Seawater Desalination Project.
The City has not investigated seawater desalination as a result of economic and physical impediments.
Brackish groundwater is groundwater with a salinity higher than freshwater, but lower than seawater. Brackish groundwater typically requires treatment using desalters.
7.4.1 Groundwater There are currently no brackish groundwater opportunities within the City’s service area.
7.4.2 Ocean Water Huntington Beach Seawater Desalination Project – Poseidon Resources LLC (Poseidon), a private company, is developing the Huntington Beach Seawater Desalination Project to be co-located at the AES Power Plant in the City of Huntington Beach along Pacific Coast Highway and Newland Street. The proposed project would produce up to 50 MGD (56,000 AFY) of drinking water to provide approximately 10 percent of Orange County’s water supply needs.
Over the past several years, Poseidon has been working with OCWD on the general terms and conditions for selling the water to OCWD. OCWD and MWDOC have proposed a few distribution options to agencies in Orange County. The northern option proposes the water be distributed to the northern agencies closer to the plant within OCWD’s service area with the possibility of recharging/injecting a portion of the product water into the OC Basin. The southern option builds on the northern option by delivering a portion of the product water through the existing OC-44 pipeline for conveyance to the south Orange County water agencies. A third option is also being explored that includes all of the product water to be recharged into the OC Basin. Currently, a combination of these options could be pursued.
arcadis.com 7-2

2015 URBAN WATER MANAGEMENT PLAN
OCWD’s current Long-Term Facilities Plan (LTFP) identifies the Huntington Beach Seawater Desalination project as a priority project and determined the plant capacity of 56,000 AFY as the single largest source of new, local drinking water available to the region. In addition to offsetting imported demand, water from this project could provide OCWD with management flexibility in the OC Basin by augmenting supplies into the Talbert Seawater Barrier to prevent seawater intrusion.
In May 2015, OCWD and Poseidon entered into a Term Sheet that provided the overall partner structure in order to advance the project. Based on the initial Term Sheet, Poseidon would be responsible for permitting, financing, design, construction, and operations of the treatment plant while OCWD would purchase the production volume, assuming the product water quality and quantity meet specific contract parameters and criteria. Furthermore, OCWD would then distribute the water in Orange County using one of the proposed distribution options described above.
Currently, the project is in the late-stages of the regulatory permit approval process and Poseidon hopes to obtain the last discretionary permit necessary to construct the plant from the California Coastal Commission (CCC) in 2016. If the CCC permit is obtained, the plant could be operational as early as 2019.
Doheny Desalination Project – In 2013, after five years and $6.2 million to investigate use of a slant well intake for the Doheny Desalination Project, it was concluded the project was feasible and could produce 15 MGD (16,800 AFY) of new potable water supplies to five participating agencies. These agencies consist of: South Coast Water District (SCWD), City of San Clemente, City of San Juan Capistrano, Laguna Beach County Water District (LBCWD) and Moulton Niguel Water District.
Only SCWD and LBCWD expressed interest in moving forward after work was completed, with the other agencies electing to monitor the work and consider options to subsequently come back into the project while considering other water supply investments.
More recently, LBCWD has had success in using previously held water rights in the OC Basin and may elect to move forward with that project instead of ocean desalination. A final decision is pending based on securing the necessary approvals on the groundwater agreement.
SCWD has taken the lead on the desalination project and has hired a consulting team to proceed with project development for the Doheny Desalination Project. Major items scheduled over the next year include:
• Preliminary Design Report and Cost Estimate
• Brine Outfall Analysis
• EIR Process
• Environmental Permitting Approvals
• Public Outreach
• Project Funding
• Project Delivery Method
• Economic Analysis
arcadis.com 7-3

2015 URBAN WATER MANAGEMENT PLAN
The schedule for this project includes start-up and operation of up to a 5 MGD (5,600 AFY) facility by the end of 2019. SCWD anticipates leaving the option open for other agencies to participate in a larger, 15 MGD facility, with subsequent permitting and construction of additional slant wells and treatment capacity.
Camp Pendleton Seawater Desalination Project – San Diego County Water Authority (SDCWA) is studying a desalination project to be located at the southwest corner of Camp Pendleton Marine Corps Base adjacent to the Santa Margarita River. The initial project would be a 50 (56,000 AFY) or 100 (112,100) MGD plant with expansions in 50 MGD increments to a maximum capacity of 150 MGD (168,100 AFY), making this the largest proposed desalination plant in the US.
The project is currently in the feasibility study stage and SDCWA is conducting geological surveys, analyzing intake options, and studying the effect on ocean life and routes to bring desalinated water to SDCWA’s delivery system. MWDOC and south Orange County agencies are maintaining an interest in the project.
arcadis.com 7-4
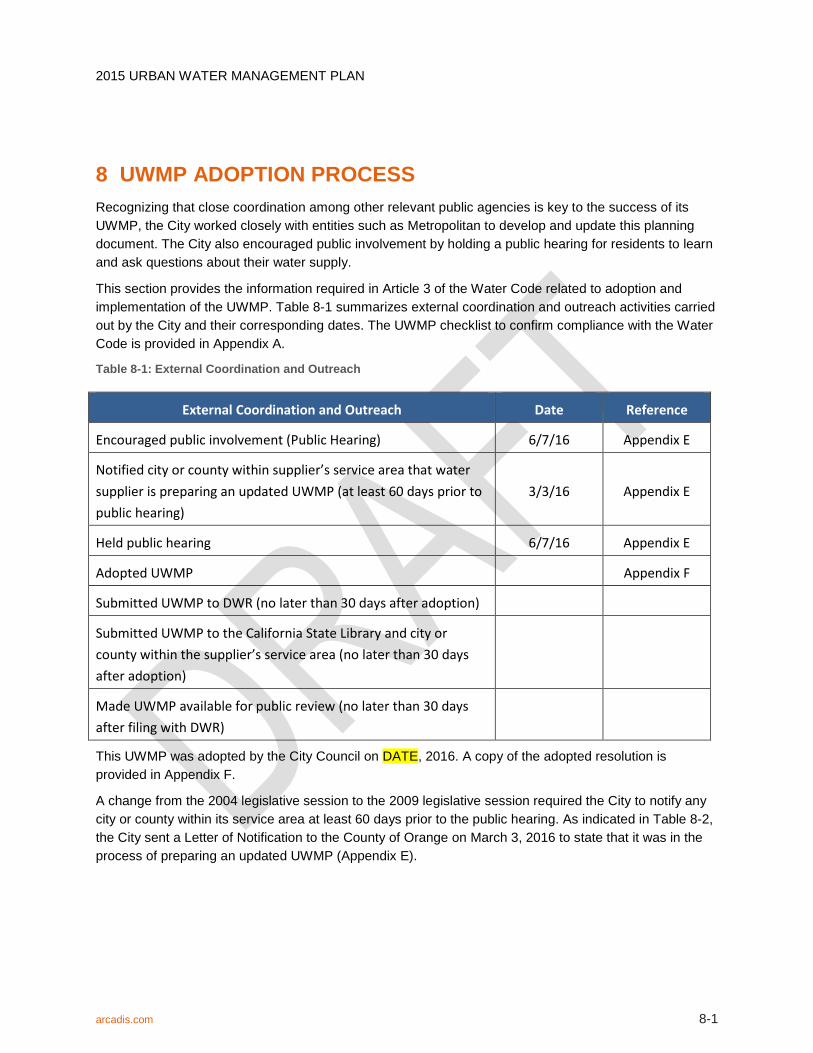
2015 URBAN WATER MANAGEMENT PLAN
8 UWMP ADOPTION PROCESS Recognizing that close coordination among other relevant public agencies is key to the success of its UWMP, the City worked closely with entities such as Metropolitan to develop and update this planning document. The City also encouraged public involvement by holding a public hearing for residents to learn and ask questions about their water supply.
This section provides the information required in Article 3 of the Water Code related to adoption and implementation of the UWMP. Table 8-1 summarizes external coordination and outreach activities carried out by the City and their corresponding dates. The UWMP checklist to confirm compliance with the Water Code is provided in Appendix A.
Table 8-1: External Coordination and Outreach
External Coordination and Outreach Date Reference
Encouraged public involvement (Public Hearing) 6/7/16 Appendix E
Notified city or county within supplier’s service area that water supplier is preparing an updated UWMP (at least 60 days prior to public hearing)
3/3/16 Appendix E
Held public hearing 6/7/16 Appendix E
Adopted UWMP
Appendix F
Submitted UWMP to DWR (no later than 30 days after adoption)
Submitted UWMP to the California State Library and city or county within the supplier’s service area (no later than 30 days after adoption)
Made UWMP available for public review (no later than 30 days after filing with DWR)
This UWMP was adopted by the City Council on DATE, 2016. A copy of the adopted resolution is provided in Appendix F.
A change from the 2004 legislative session to the 2009 legislative session required the City to notify any city or county within its service area at least 60 days prior to the public hearing. As indicated in Table 8-2, the City sent a Letter of Notification to the County of Orange on March 3, 2016 to state that it was in the process of preparing an updated UWMP (Appendix E).
arcadis.com 8-1

2015 URBAN WATER MANAGEMENT PLAN
Table 8-2: Notification to Cities and Counties
Retail: Notification to Cities and Counties
City Name 60 Day Notice Notice of Public Hearing
Orange
County Name Drop Down List 60 Day Notice Notice of Public
Hearing
Orange County
NOTES:
8.1 Public Participation The City encouraged community and public interest involvement in the plan update through a public hearing and inspection of the draft document on DATE. Public hearing notifications were published in local newspapers. A copy of the published Notice of Public Hearing is included in Appendix E. The hearing provided an opportunity for all residents and employees in the service area to learn and ask questions about their water supply in addition to the City’s plans for providing a reliable, safe, high-quality water supply. Copies of the draft plan were made available for public inspection at the City Clerk’s and Utilities Department offices.
8.2 Agency Coordination The City's water supply planning relates to the policies, rules, and regulations of its regional and local water providers. The City is dependent on imported water from Metropolitan, its regional wholesaler. The City is also dependent on groundwater from OCWD, the agency that manages the OC Basin as well as provides recycled water in partnership with OCSD.
While the City is not a member agency of MWDOC, it contracts and joins with it in conducting water education, conservation programs, and other activities as discussed elsewhere in the Plan. MWDOC provided assistance to the City's 2015 UWMP by providing data and analysis such as population projections, demand projections, and SBx7-7 modeling.
8.3 UWMP Submittal
8.3.1 Review of 2010 UWMP Implementation As required by California Water Code, the City summarized Water Conservation Programs implemented to date, and compared them to those planned in its 2010 UWMP.
arcadis.com 8-2

2015 URBAN WATER MANAGEMENT PLAN
8.3.2 Comparison of 2010 Planned Water Conservation Programs with 2015 Actual Programs
As a signatory to the Memorandum of Understanding Regarding Urban Water Conservation in California, the City’s commitment to implement Best Management Practice (BMP)-based water use efficiency program continues today. For the City’s specific achievements in the area of conservation, please see Section 4 of this Plan.
Comparison of 2010 Projected Recycled Water Use with 2015 Actual Use
Recycled water use for the City in 2015 was about 17 percent higher than previously forecasted for 2015 in the 2010 UWMP, as illustrated in Table 6-3.
8.3.3 Filing of 2015 UWMP The City Council reviewed the Final Draft Plan on DATE, 2016. The seven-member City Council approved the 2015 UWMP on DATE, 2016. See Appendix F for the resolution approving the Plan.
By July 1, 2016, the City’s Adopted 2015 UWMP was filed with DWR, California State Library, County of Orange, and cities within its service area, if applicable.
arcadis.com 8-3
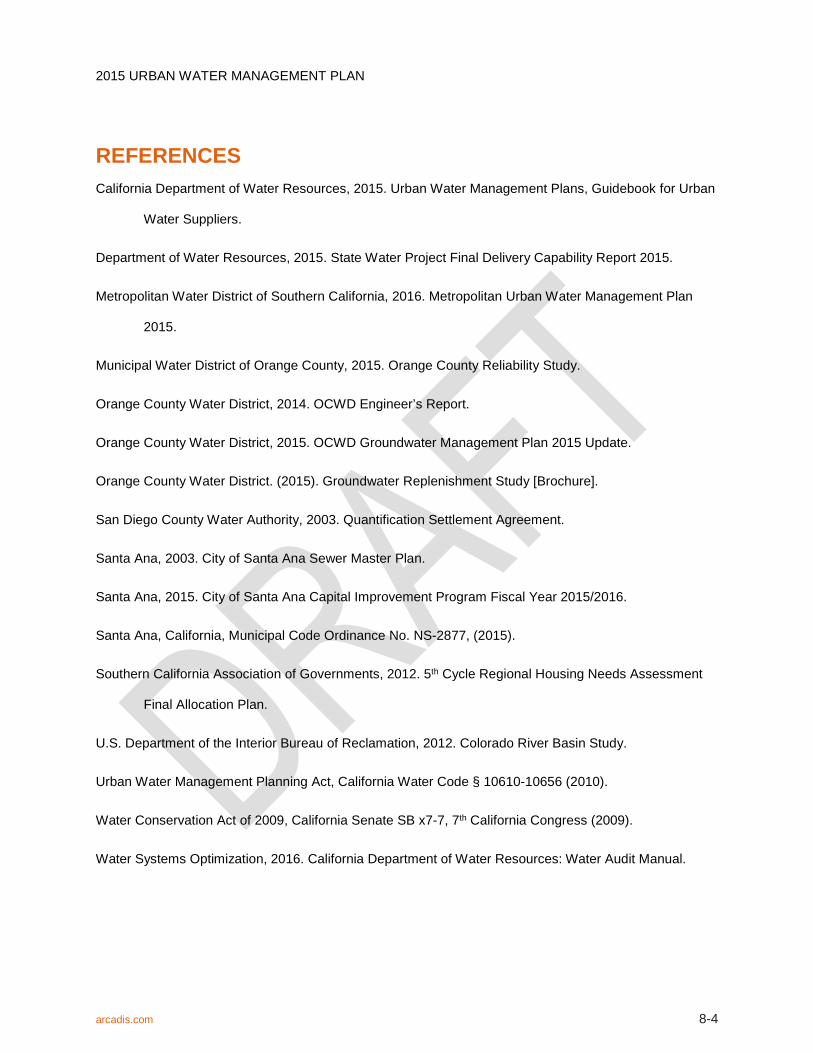
2015 URBAN WATER MANAGEMENT PLAN
REFERENCES California Department of Water Resources, 2015. Urban Water Management Plans, Guidebook for Urban
Water Suppliers.
Department of Water Resources, 2015. State Water Project Final Delivery Capability Report 2015.
Metropolitan Water District of Southern California, 2016. Metropolitan Urban Water Management Plan
2015.
Municipal Water District of Orange County, 2015. Orange County Reliability Study.
Orange County Water District, 2014. OCWD Engineer’s Report.
Orange County Water District, 2015. OCWD Groundwater Management Plan 2015 Update.
Orange County Water District. (2015). Groundwater Replenishment Study [Brochure].
San Diego County Water Authority, 2003. Quantification Settlement Agreement.
Santa Ana, 2003. City of Santa Ana Sewer Master Plan.
Santa Ana, 2015. City of Santa Ana Capital Improvement Program Fiscal Year 2015/2016.
Santa Ana, California, Municipal Code Ordinance No. NS-2877, (2015).
Southern California Association of Governments, 2012. 5th Cycle Regional Housing Needs Assessment
Final Allocation Plan.
U.S. Department of the Interior Bureau of Reclamation, 2012. Colorado River Basin Study.
Urban Water Management Planning Act, California Water Code § 10610-10656 (2010).
Water Conservation Act of 2009, California Senate SB x7-7, 7th California Congress (2009).
Water Systems Optimization, 2016. California Department of Water Resources: Water Audit Manual.
arcadis.com 8-4
APPENDIX A UWMP Checklist

APPENDIX B Standardized Tables

APPENDIX C Groundwater Management Plan

APPENDIX D City Ordinance

APPENDIX E Notification of Public and Service Area Suppliers

APPENDIX F Adopted UWMP Resolution

APPENDIX G Bump Methodology

APPENDIX H AWWA Water Loss Audit Worksheet

APPENDIX I Water Use Efficiency Implementation Report
Arcadis U.S., Inc.
445 South Figueroa Street
Suite 3650
Los Angeles, California 90071
Tel 213 486 9884
Fax 213 486 9894
www.arcadis.com
Related Documents