2015 economic and market outlook Bob Robbins Managing Principal [Robbins Farley, LLC Wells Fargo Advisors Financial Network Please see slides 30 and 31 for disclosures.

2015 economic and market outlook Bob Robbins Managing Principal [Robbins Farley, LLC Wells Fargo Advisors Financial Network Please see slides 30 and 31.
Dec 24, 2015
Welcome message from author
This document is posted to help you gain knowledge. Please leave a comment to let me know what you think about it! Share it to your friends and learn new things together.
Transcript
2015 economic and market outlookBob Robbins
Managing Principal
[Robbins Farley, LLC
Wells Fargo Advisors Financial Network
Please see slides 30 and 31 for disclosures.
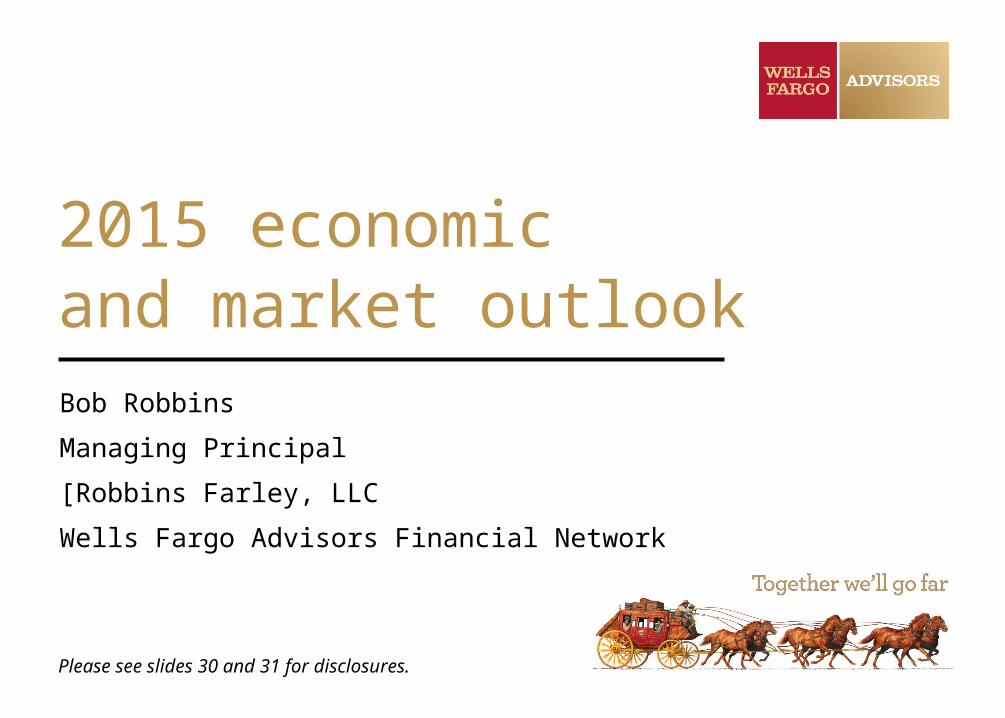
Investment Strategy Committee
U.S. equities
Stuart Freeman, CFA
Chief Equity Strategist
Economy
Gary Thayer
Chief Macro Strategist
International
Paul Christopher, CFA
Chief International Strategist
Fixed income
Brian Rehling, CFA
Chief Fixed Income Strategist
A complimentary report for you
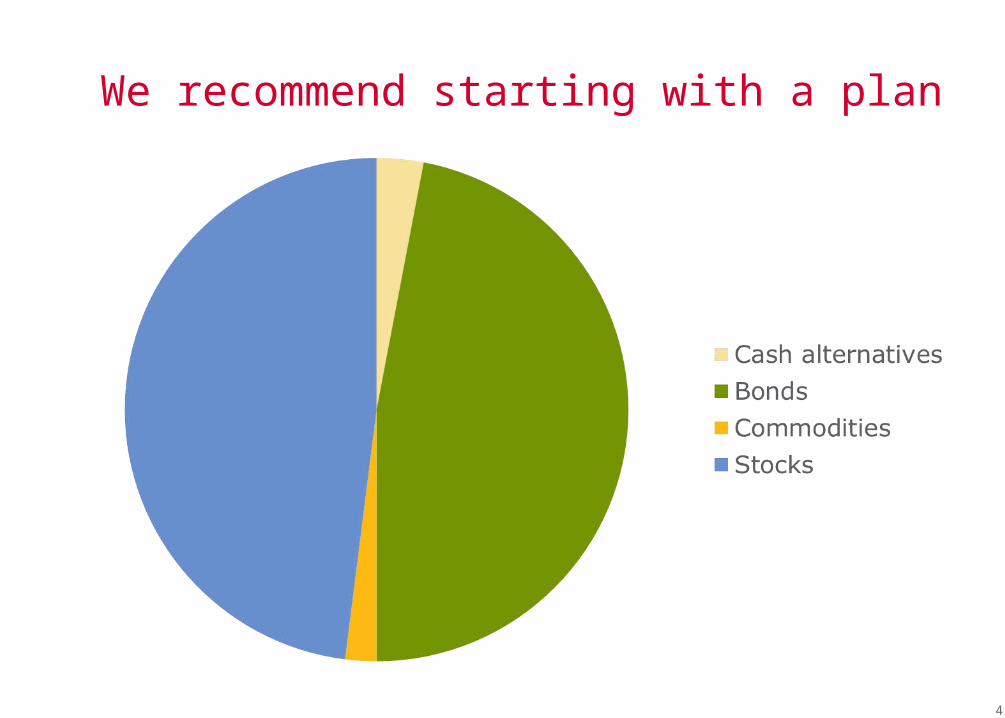
We recommend starting with a plan
4

What’s ahead for the economy?
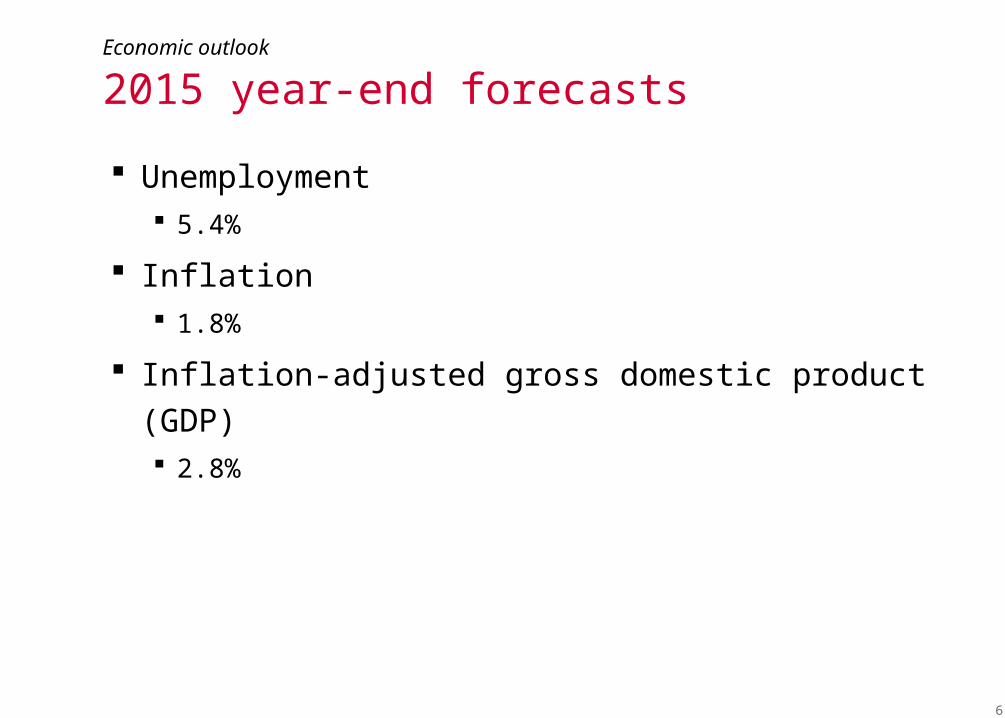
Economic outlook
2015 year-end forecasts
Unemployment 5.4%
Inflation 1.8%
Inflation-adjusted gross domestic product (GDP) 2.8%
6
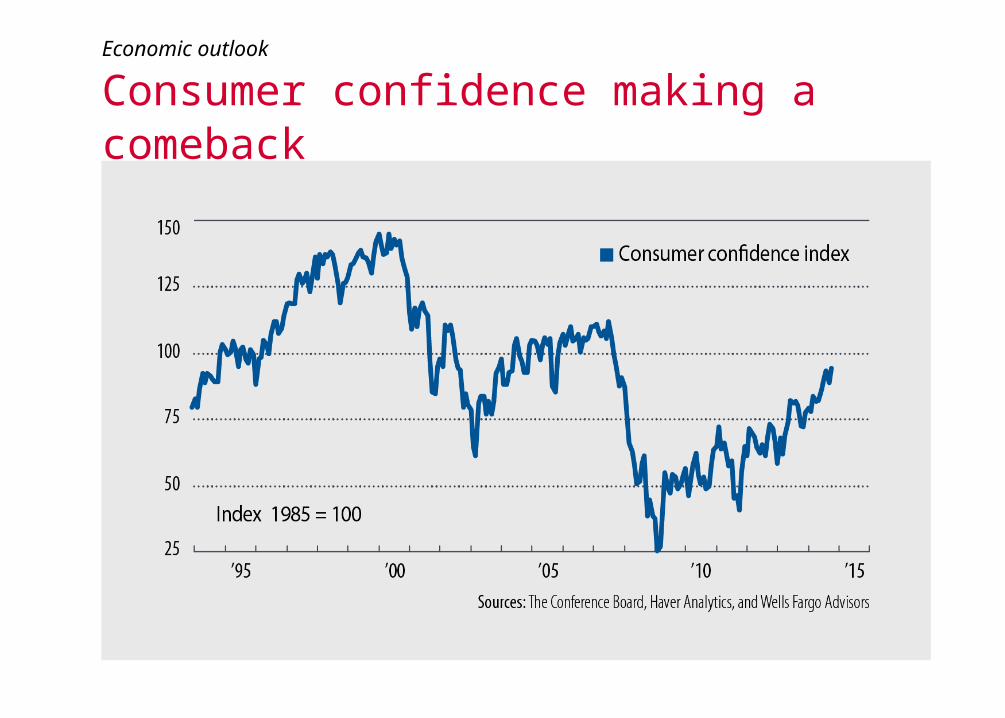
Economic outlook
Consumer confidence making a comeback
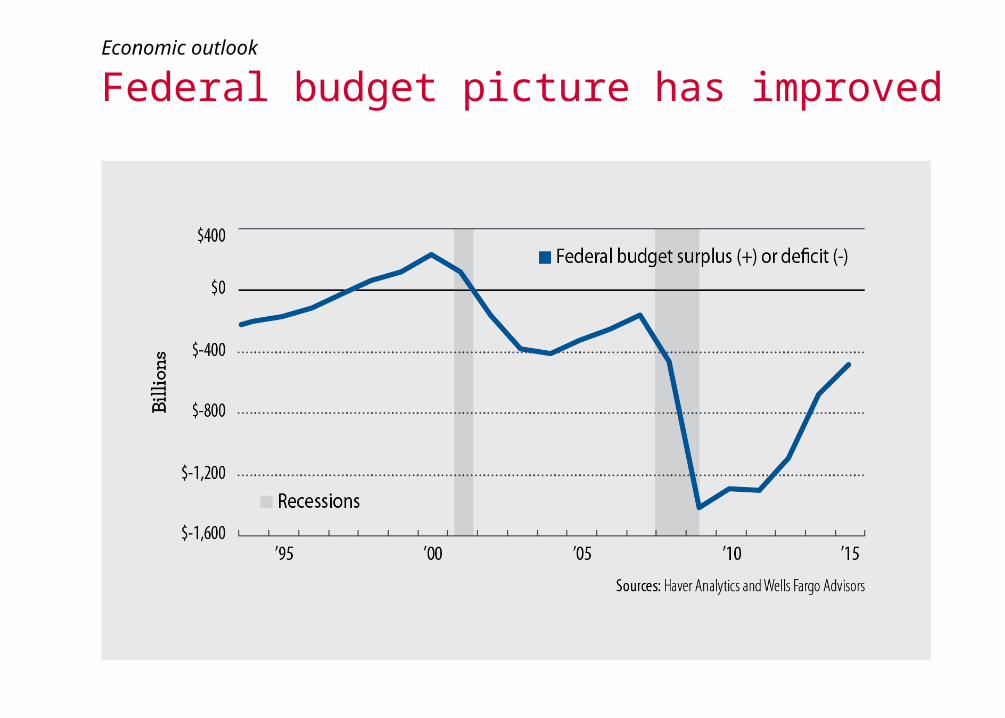
Economic outlook
Federal budget picture has improved
Where does the stock market go from here?
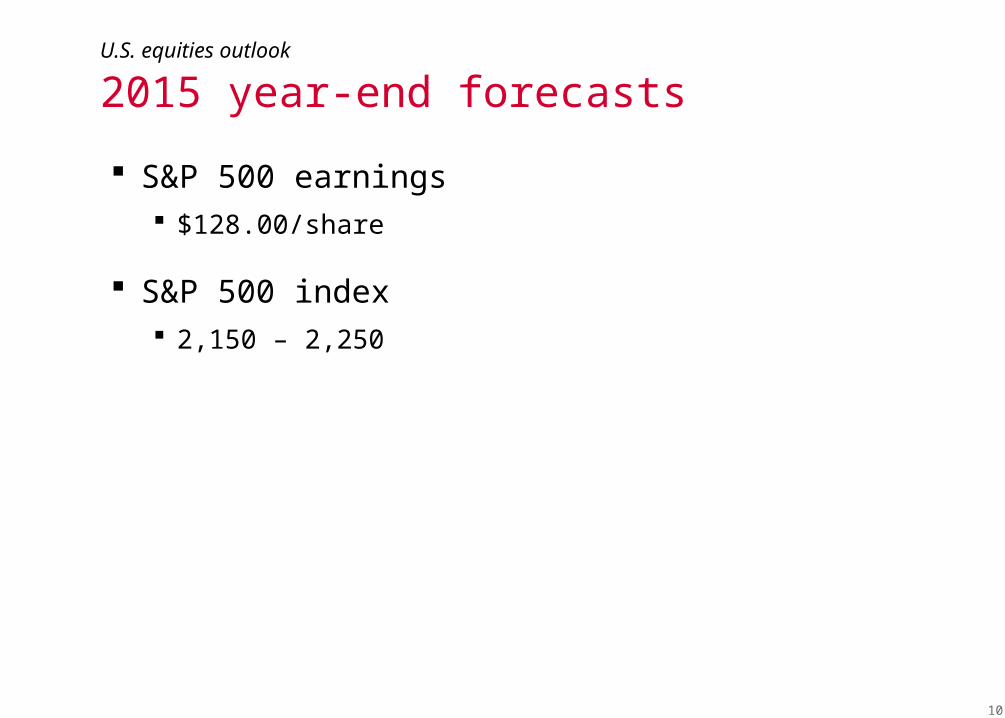
U.S. equities outlook
2015 year-end forecasts
S&P 500 earnings $128.00/share
S&P 500 index 2,150 – 2,250
10
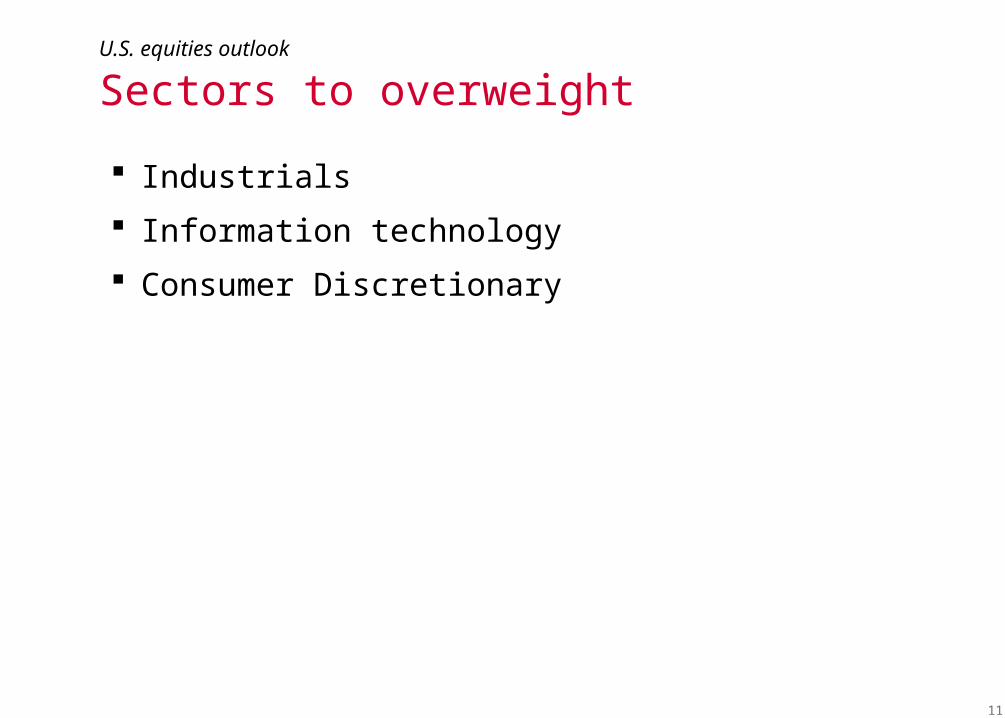
U.S. equities outlook
Sectors to overweight
Industrials
Information technology
Consumer Discretionary
11
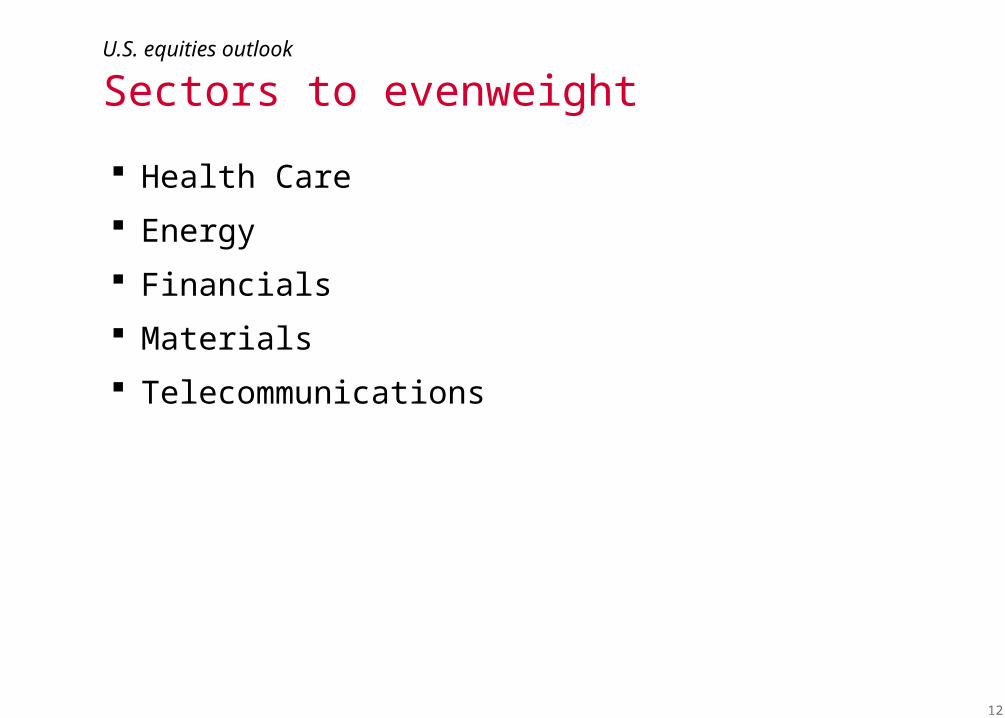
U.S. equities outlook
Sectors to evenweight
Health Care
Energy
Financials
Materials
Telecommunications
12
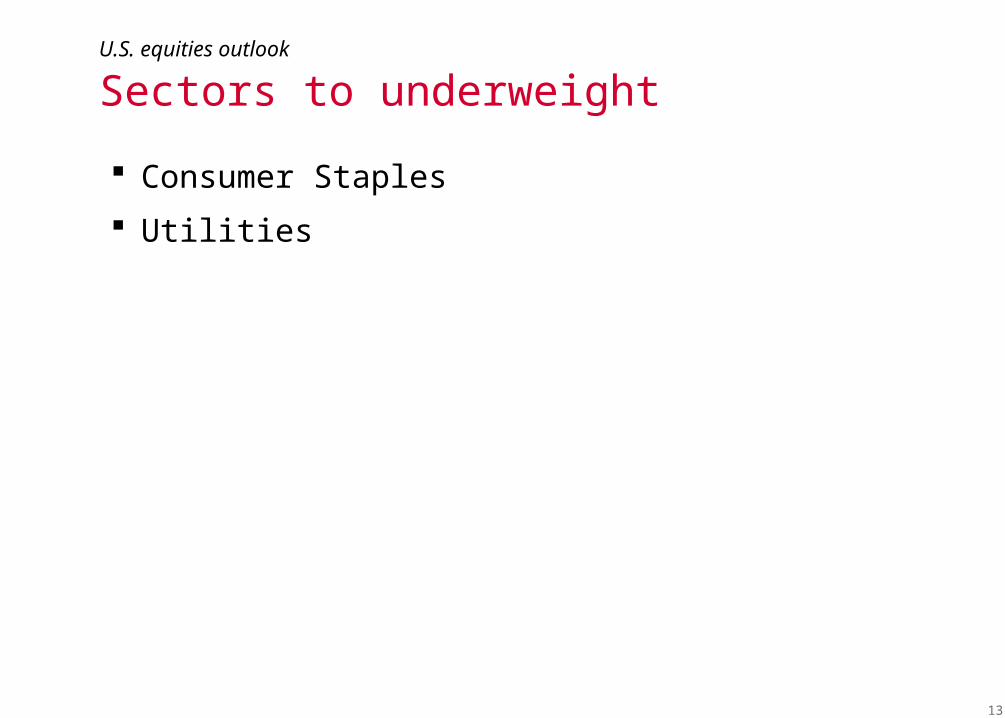
U.S. equities outlook
Sectors to underweight
Consumer Staples
Utilities
13
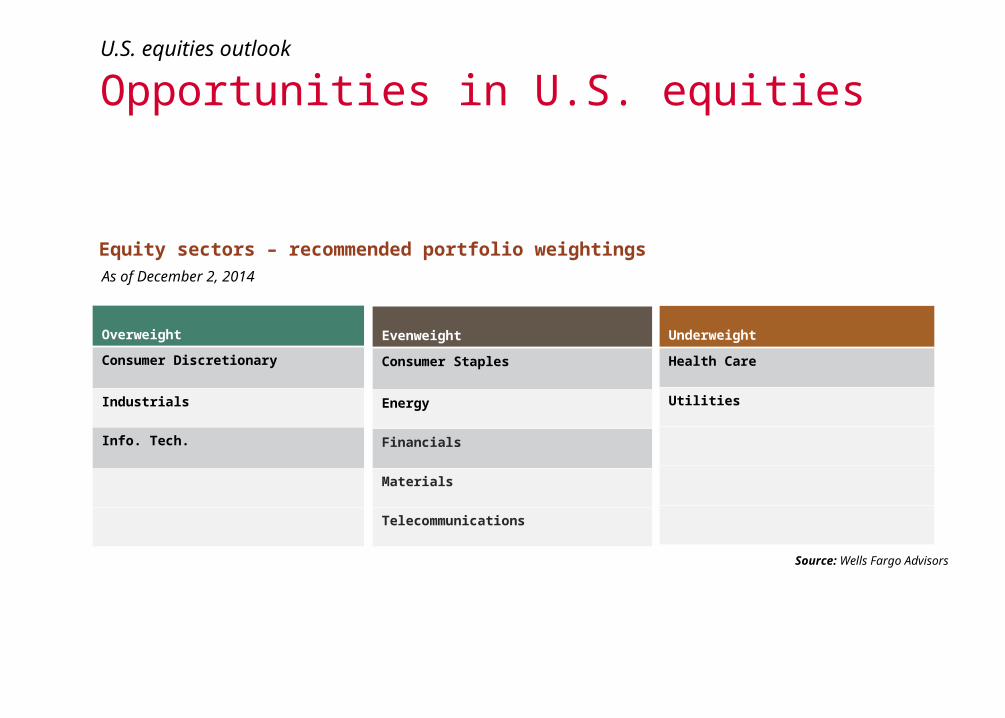
As of December 2, 2014
Overweight
Consumer Discretionary
Industrials
Info. Tech.
Source: Wells Fargo Advisors
Equity sectors – recommended portfolio weightings
Evenweight
Consumer Staples
Energy
Financials
Materials
Telecommunications
Underweight
Health Care
Utilities
U.S. equities outlook
Opportunities in U.S. equities
What’s ahead for fixed income?
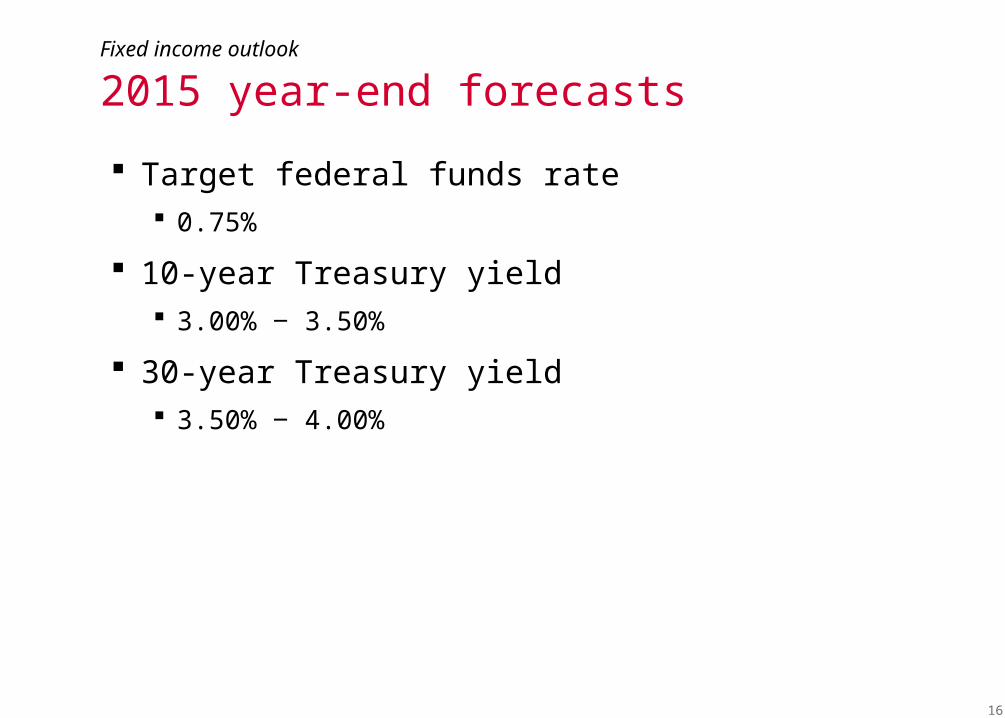
Fixed income outlook
2015 year-end forecasts
Target federal funds rate 0.75%
10-year Treasury yield 3.00% ‒ 3.50%
30-year Treasury yield 3.50% ‒ 4.00%
16
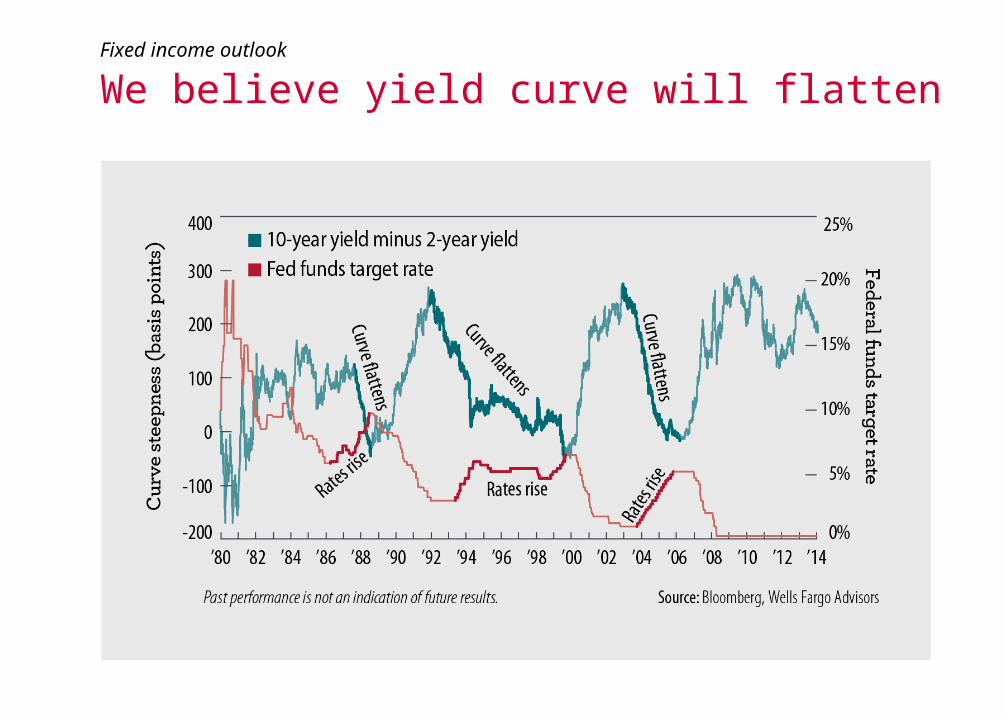
Fixed income outlook
We believe yield curve will flatten

What about international investments?
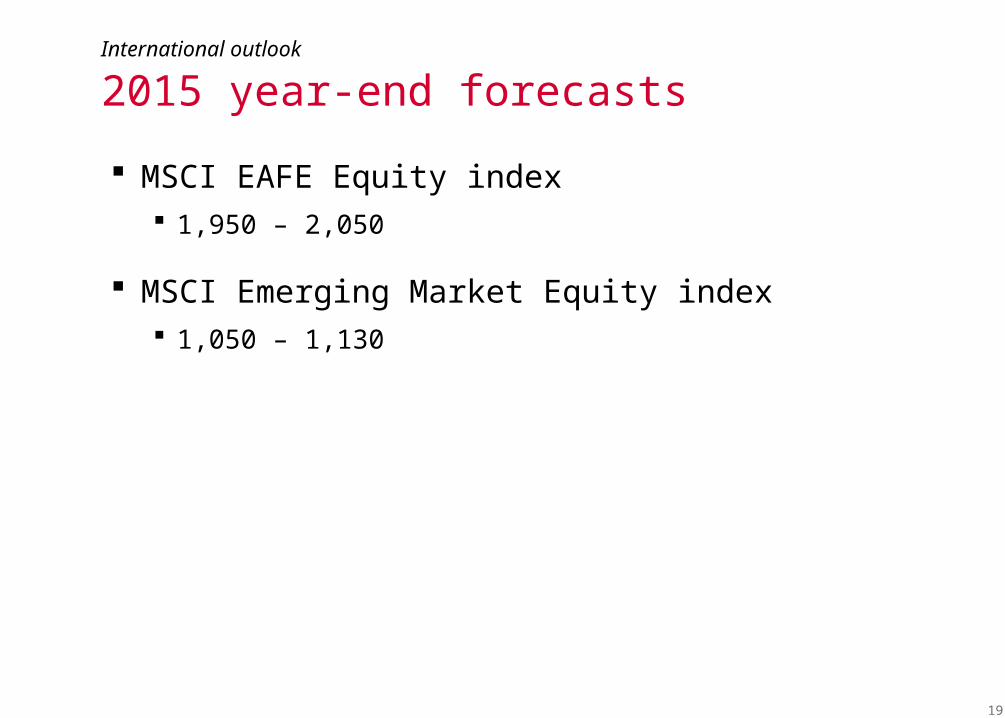
International outlook
2015 year-end forecasts
MSCI EAFE Equity index 1,950 – 2,050
MSCI Emerging Market Equity index 1,050 – 1,130
19
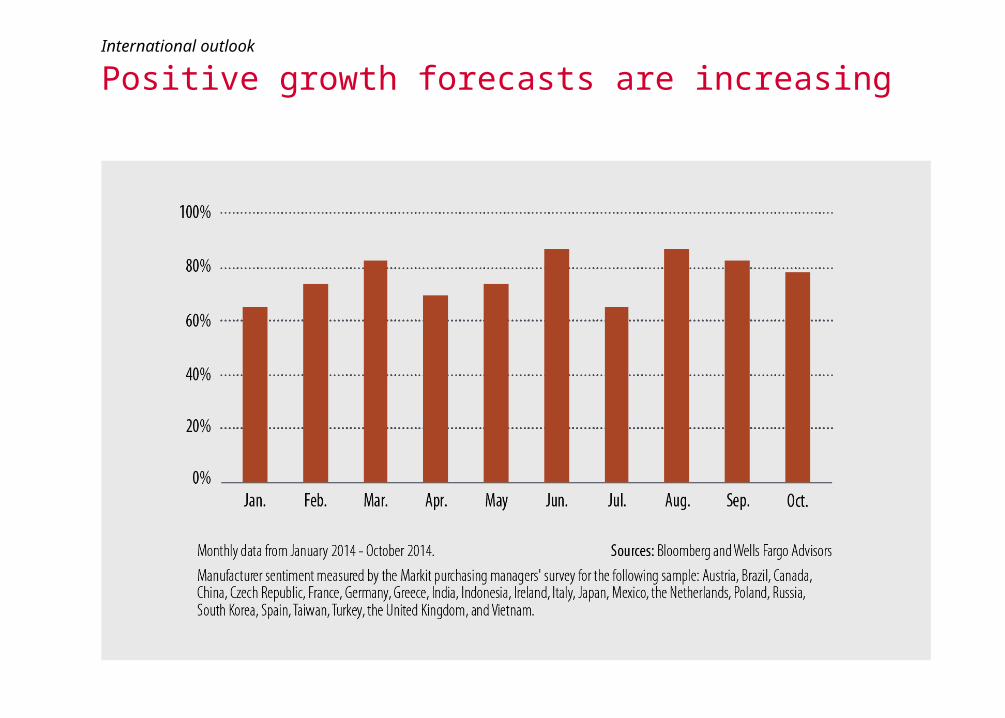
International outlook
Positive growth forecasts are increasing
International outlook
What we see ahead
International equities
International bonds
Currency
Precious metals
21

What does it all mean?
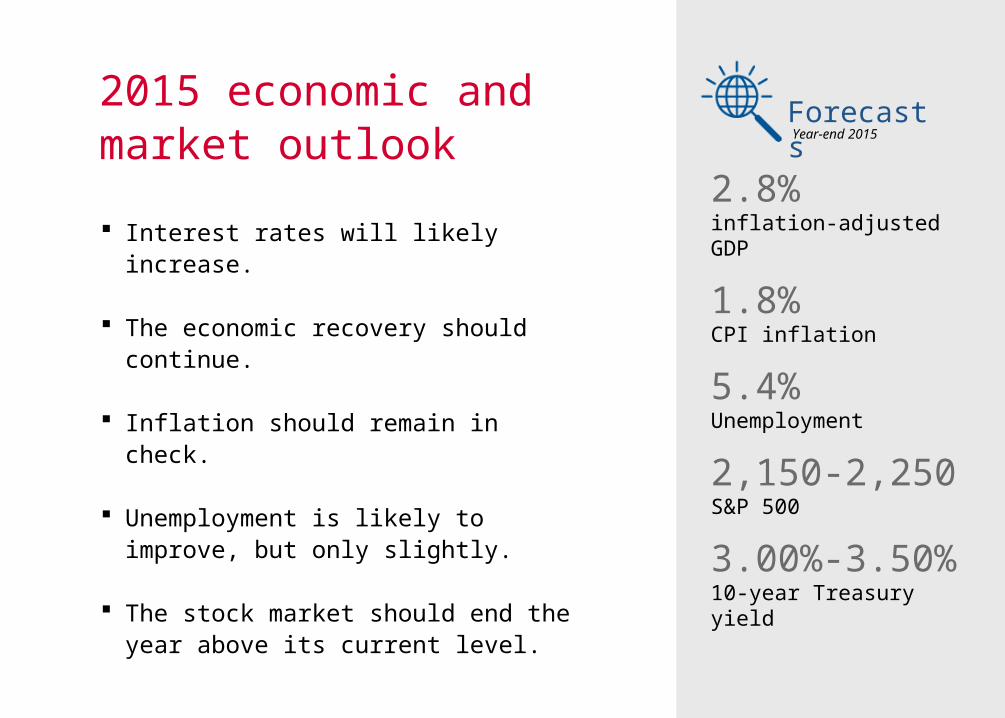
2015 economic and market outlook
Interest rates will likely increase.
The economic recovery should continue.
Inflation should remain in check.
Unemployment is likely to improve, but only slightly.
The stock market should end the year above its current level.
2.8%inflation-adjusted GDP
1.8%CPI inflation
5.4%Unemployment
2,150-2,250S&P 500
3.00%-3.50%10-year Treasury yield
ForecastsYear-end 2015

What should you do?
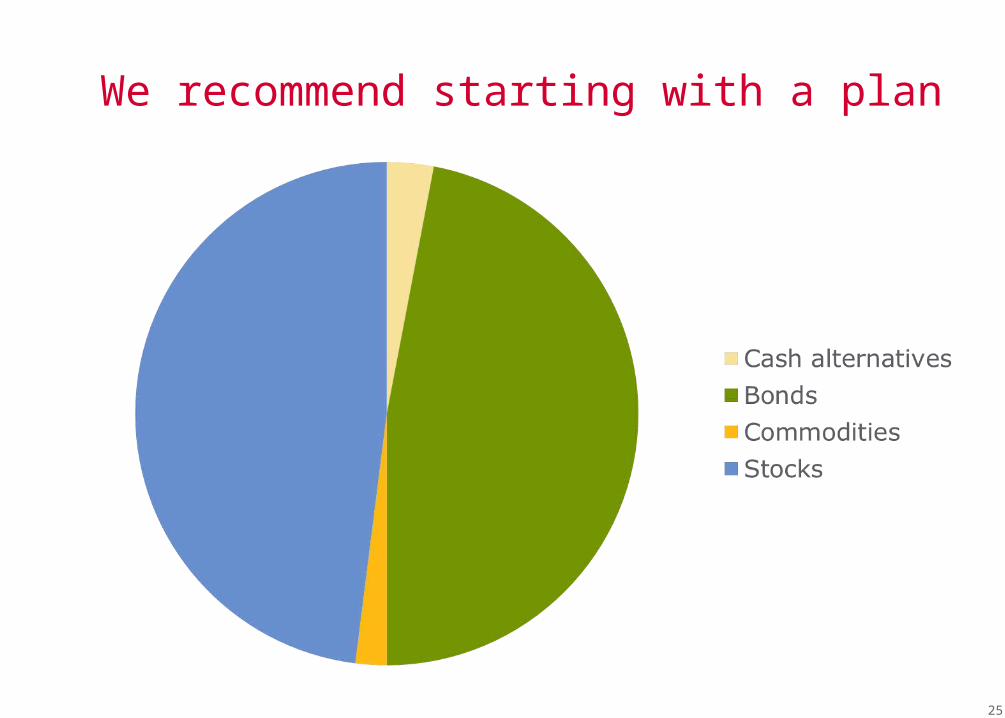
We recommend starting with a plan
25
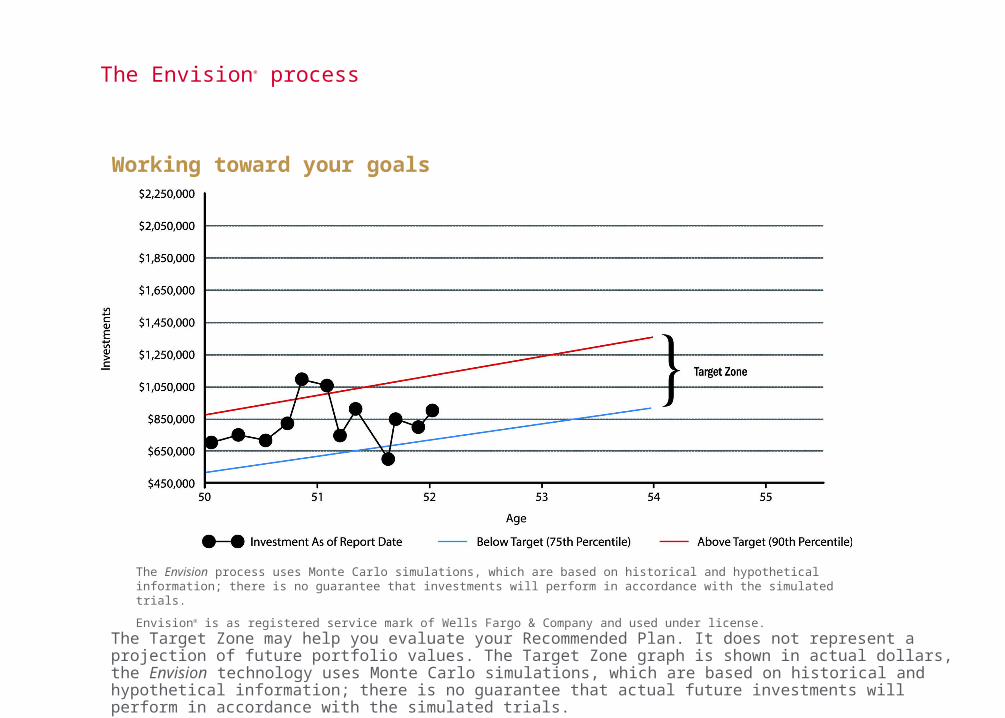
The Target Zone may help you evaluate your Recommended Plan. It does not represent a projection of future portfolio values. The Target Zone graph is shown in actual dollars, the Envision technology uses Monte Carlo simulations, which are based on historical and hypothetical information; there is no guarantee that actual future investments will perform in accordance with the simulated trials.
The Envision® process
Working toward your goals
73 74 75 76 77 78
The Envision process uses Monte Carlo simulations, which are based on historical and hypothetical information; there is no guarantee that investments will perform in accordance with the simulated trials.
Envision® is as registered service mark of Wells Fargo & Company and used under license.
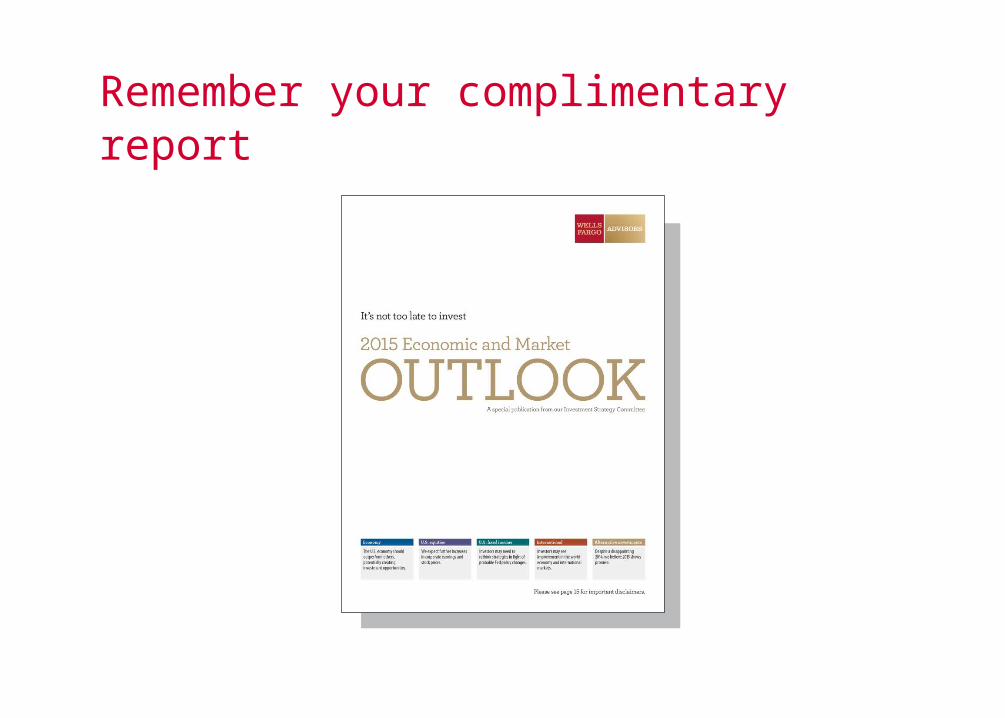
Remember your complimentary report
How can I help?
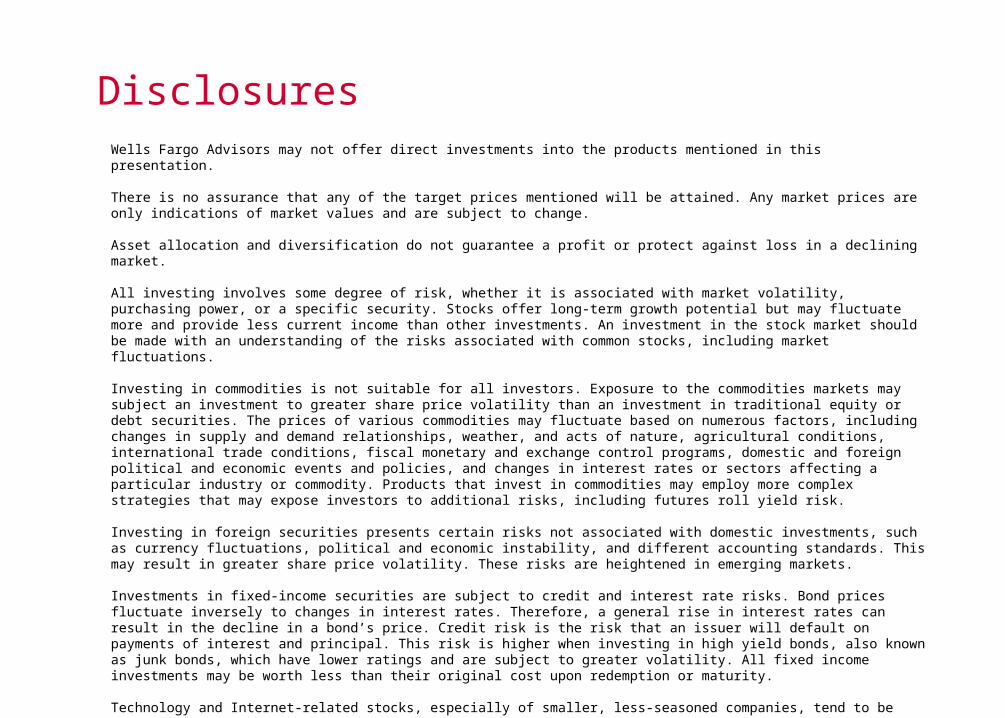
DisclosuresWells Fargo Advisors may not offer direct investments into the products mentioned in this presentation. There is no assurance that any of the target prices mentioned will be attained. Any market prices are only indications of market values and are subject to change. Asset allocation and diversification do not guarantee a profit or protect against loss in a declining market. All investing involves some degree of risk, whether it is associated with market volatility, purchasing power, or a specific security. Stocks offer long-term growth potential but may fluctuate more and provide less current income than other investments. An investment in the stock market should be made with an understanding of the risks associated with common stocks, including market fluctuations.
Investing in commodities is not suitable for all investors. Exposure to the commodities markets may subject an investment to greater share price volatility than an investment in traditional equity or debt securities. The prices of various commodities may fluctuate based on numerous factors, including changes in supply and demand relationships, weather, and acts of nature, agricultural conditions, international trade conditions, fiscal monetary and exchange control programs, domestic and foreign political and economic events and policies, and changes in interest rates or sectors affecting a particular industry or commodity. Products that invest in commodities may employ more complex strategies that may expose investors to additional risks, including futures roll yield risk. Investing in foreign securities presents certain risks not associated with domestic investments, such as currency fluctuations, political and economic instability, and different accounting standards. This may result in greater share price volatility. These risks are heightened in emerging markets.
Investments in fixed-income securities are subject to credit and interest rate risks. Bond prices fluctuate inversely to changes in interest rates. Therefore, a general rise in interest rates can result in the decline in a bond’s price. Credit risk is the risk that an issuer will default on payments of interest and principal. This risk is higher when investing in high yield bonds, also known as junk bonds, which have lower ratings and are subject to greater volatility. All fixed income investments may be worth less than their original cost upon redemption or maturity. Technology and Internet-related stocks, especially of smaller, less-seasoned companies, tend to be more volatile than the overall market.
30
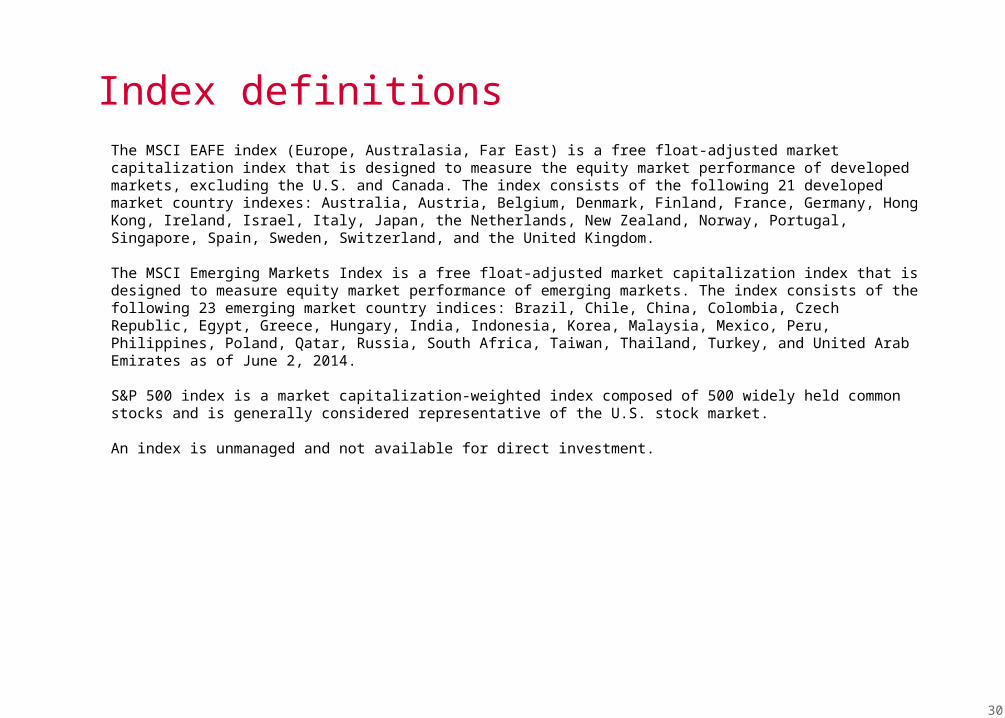
Index definitionsThe MSCI EAFE index (Europe, Australasia, Far East) is a free float-adjusted market capitalization index that is designed to measure the equity market performance of developed markets, excluding the U.S. and Canada. The index consists of the following 21 developed market country indexes: Australia, Austria, Belgium, Denmark, Finland, France, Germany, Hong Kong, Ireland, Israel, Italy, Japan, the Netherlands, New Zealand, Norway, Portugal, Singapore, Spain, Sweden, Switzerland, and the United Kingdom. The MSCI Emerging Markets Index is a free float-adjusted market capitalization index that is designed to measure equity market performance of emerging markets. The index consists of the following 23 emerging market country indices: Brazil, Chile, China, Colombia, Czech Republic, Egypt, Greece, Hungary, India, Indonesia, Korea, Malaysia, Mexico, Peru, Philippines, Poland, Qatar, Russia, South Africa, Taiwan, Thailand, Turkey, and United Arab Emirates as of June 2, 2014. S&P 500 index is a market capitalization-weighted index composed of 500 widely held common stocks and is generally considered representative of the U.S. stock market. An index is unmanaged and not available for direct investment.
©2014 Wells Fargo Advisors, LLC. All rights reserved. 1114-04204 [90256-v4] e7173
Securities and Insurance Products:
Wells Fargo Advisors is the trade name used by two separate, registered broker-dealers: Wells Fargo Advisors, LLC and Wells Fargo Advisors Financial Network, LLC, Members SIPC, non-bank affiliates of Wells Fargo & Company.
NOT INSURED BY FDIC OR ANYFEDERAL GOVERNMENT AGENCY
MAY LOSEVALUE
NOT A DEPOSIT OF OR GUARANTEED BY A BANK OR ANY BANK AFFILIATE
Remember to Complete the Speaker Survey:sm15.bfbootcamp.net / ‘click’ on speakers / select your speaker
Related Documents