M i d - S e a s o n R e p o r t 2 0 1 4 S e a t t l e M a r in e r s ROBINSON CANO KYLE SEAGER FERNANDO RODNEY FELIX HERNANDEZ

Welcome message from author
This document is posted to help you gain knowledge. Please leave a comment to let me know what you think about it! Share it to your friends and learn new things together.
Transcript

8/12/2019 2014 Mid-Season Report
http://slidepdf.com/reader/full/2014-mid-season-report 1/80
M i d - S e a s o n R e p o r t
2 014 S e a t t l e M a r in e r s
ROBINSON CANO KYLE SEAGER
FERNANDO RODNEY FELIX HERNANDEZ
8/12/2019 2014 Mid-Season Report
http://slidepdf.com/reader/full/2014-mid-season-report 2/80
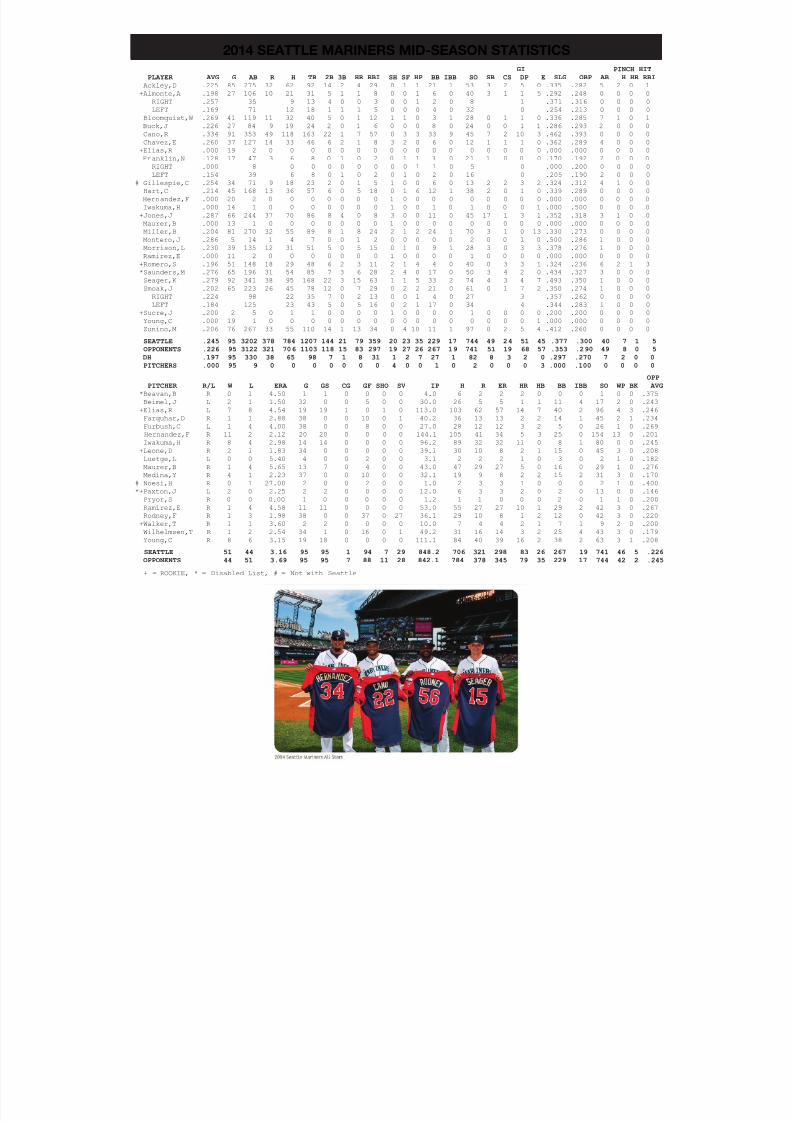
2014 SEATTLE MARINERS MID-SEASON STATISTICS
GI PINCH HIT
PLAYER AVG G AB R H TB 2B 3B HR RBI SH SF HP BB IBB SO SB CS DP E SLG OBP AB H HR RBI
Ackley,D .225 85 275 32 62 92 14 2 4 29 0 1 1 21 1 53 3 2 5 0 .335 .282 5 2 0 1
+Almonte,A .198 27 106 10 21 31 5 1 1 8 0 0 1 6 0 40 3 1 1 5 .292 .248 0 0 0 0
RIGHT .257 35 9 13 4 0 0 3 0 0 1 2 0 8 1 .371 .316 0 0 0 0
LEFT .169 71 12 18 1 1 1 5 0 0 0 4 0 32 0 .254 .213 0 0 0 0
Bloomquist,W .269 41 119 11 32 40 5 0 1 12 1 1 0 3 1 28 0 1 1 0 .336 .285 7 1 0 1
Buck,J .226 27 84 9 19 24 2 0 1 6 0 0 0 8 0 24 0 0 1 1 .286 .293 2 0 0 0
Cano,R .334 91 353 49 118 163 22 1 7 57 0 3 3 33 9 45 7 2 10 3 .462 .393 0 0 0 0
Chavez,E .260 37 127 14 33 46 6 2 1 8 3 2 0 6 0 12 1 1 1 0 .362 .289 4 0 0 0
+Elias,R .000 19 2 0 0 0 0 0 0 0 0 0 0 0 0 0 0 0 0 0 .000 .000 0 0 0 0 Franklin,N .128 17 47 3 6 8 0 1 0 2 0 1 1 3 0 21 1 0 0 0 .170 .192 2 0 0 0
RIGHT .000 8 0 0 0 0 0 0 0 0 1 1 0 5 0 .000 .200 0 0 0 0
LEFT .154 39 6 8 0 1 0 2 0 1 0 2 0 16 0 .205 .190 2 0 0 0
# Gillespie,C .254 34 71 9 18 23 2 0 1 5 1 0 0 6 0 13 2 2 3 2 .324 .312 4 1 0 0
Hart,C .214 45 168 13 36 57 6 0 5 18 0 1 6 12 1 38 2 0 1 0 .339 .289 0 0 0 0
Hernandez,F .000 20 2 0 0 0 0 0 0 0 1 0 0 0 0 0 0 0 0 0 .000 .000 0 0 0 0
Iwakuma,H .000 14 1 0 0 0 0 0 0 0 1 0 0 1 0 1 0 0 0 1 .000 .500 0 0 0 0
+Jones,J .287 66 244 37 70 86 8 4 0 8 3 0 0 11 0 45 17 1 3 1 .352 .318 3 1 0 0
Maurer,B .000 13 1 0 0 0 0 0 0 0 1 0 0 0 0 0 0 0 0 0 .000 .000 0 0 0 0
Miller,B .204 81 270 32 55 89 8 1 8 24 2 1 2 24 1 70 3 1 0 13 .330 .273 0 0 0 0
Montero,J .286 5 14 1 4 7 0 0 1 2 0 0 0 0 0 2 0 0 1 0 .500 .286 1 0 0 0
Morrison,L .230 39 135 12 31 51 5 0 5 15 0 1 0 9 1 28 3 0 3 3 .378 .276 1 0 0 0
Ramirez,E .000 11 2 0 0 0 0 0 0 0 1 0 0 0 0 1 0 0 0 0 .000 .000 0 0 0 0
+Romero,S .196 51 148 18 29 48 6 2 3 11 2 1 4 4 0 40 0 3 3 1 .324 .236 6 2 1 3
*Saunders,M .276 65 196 31 54 85 7 3 6 28 2 4 0 17 0 50 3 4 2 0 .434 .327 3 0 0 0
Seager,K .279 92 341 38 95 168 22 3 15 63 1 1 5 33 2 74 4 3 4 7 .493 .350 1 0 0 0
Smoak,J .202 65 223 26 45 78 12 0 7 29 0 2 2 21 0 61 0 1 7 2 .350 .274 1 0 0 0
RIGHT .224 98 22 35 7 0 2 13 0 0 1 4 0 27 3 .357 .262 0 0 0 0
LEFT .184 125 23 43 5 0 5 16 0 2 1 17 0 34 4 .344 .283 1 0 0 0
+Sucre,J .200 2 5 0 1 1 0 0 0 0 1 0 0 0 0 1 0 0 0 0 .200 .200 0 0 0 0
Young,C .000 19 1 0 0 0 0 0 0 0 0 0 0 0 0 0 0 0 0 1 .000 .000 0 0 0 0
Zunino,M .206 76 267 33 55 110 14 1 13 34 0 4 10 11 1 97 0 2 5 4 .412 .260 0 0 0 0
SEATTLE .245 95 3202 378 784 1207 144 21 79 359 20 23 35 229 17 744 49 24 51 45 .377 .300 40 7 1 5
OPPONENTS .226 95 3122 321 706 1103 118 15 83 297 19 27 26 267 19 741 51 19 68 57 .353 .290 49 8 0 5
DH .197 95 330 38 65 98 7 1 8 31 1 2 7 27 1 82 8 3 2 0 .297 .270 7 2 0 0
PITCHERS .000 95 9 0 0 0 0 0 0 0 4 0 0 1 0 2 0 0 0 3 .000 .100 0 0 0 0
OPP
PITCHER R/L W L ERA G GS CG GF SHO SV IP H R ER HR HB BB IBB SO WP BK AVG
*Beavan,B R 0 1 4.50 1 1 0 0 0 0 4.0 6 2 2 2 0 0 0 1 0 0 .375
Beimel,J L 2 1 1.50 32 0 0 5 0 0 30.0 26 5 5 1 1 11 4 17 2 0 .243
+Elias,R L 7 8 4.54 19 19 1 0 1 0 113.0 103 62 57 14 7 40 2 96 4 3 .246
Farquhar,D R 1 1 2.88 38 0 0 10 0 1 40.2 36 13 13 2 2 14 1 45 2 1 .234
Furbush,C L 1 4 4.00 38 0 0 8 0 0 27.0 28 12 12 3 2 5 0 26 1 0 .269
Hernandez,F R 11 2 2.12 20 20 0 0 0 0 144.1 105 41 34 5 3 25 0 154 13 0 .201
Iwakuma,H R 8 4 2.98 14 14 0 0 0 0 96.2 89 32 32 11 0 8 1 80 0 0 .245
+Leone,D R 2 1 1.83 34 0 0 0 0 0 39.1 30 10 8 2 1 15 0 45 3 0 .208 Luetge,L L 0 0 5.40 4 0 0 2 0 0 3.1 2 2 2 1 0 3 0 2 1 0 .182
Maurer,B R 1 4 5.65 13 7 0 4 0 0 43.0 47 29 27 5 0 16 0 29 1 0 .276
Medina,Y R 4 1 2.23 37 0 0 10 0 0 32.1 19 9 8 2 2 15 2 31 3 0 .170
# Noesi,H R 0 1 27.00 2 0 0 2 0 0 1.0 2 3 3 1 0 0 0 2 1 0 .400
*+Paxton,J L 2 0 2.25 2 2 0 0 0 0 12.0 6 3 3 2 0 2 0 13 0 0 .146
Pryor,S R 0 0 0.00 1 0 0 0 0 0 1.2 1 1 0 0 0 2 0 1 1 0 .200
Ramirez,E R 1 4 4.58 11 11 0 0 0 0 53.0 55 27 27 10 1 29 2 42 3 0 .267
Rodney,F R 1 3 1.98 38 0 0 37 0 27 36.1 29 10 8 1 2 12 0 42 3 0 .220
+Walker,T R 1 1 3.60 2 2 0 0 0 0 10.0 7 4 4 2 1 7 1 9 2 0 .200
Wilhelmsen,T R 1 2 2.54 34 1 0 16 0 1 49.2 31 16 14 3 2 25 4 43 3 0 .179
Young,C R 8 6 3.15 19 18 0 0 0 0 111.1 84 40 39 16 2 38 2 63 3 1 .208
SEATTLE 51 44 3.16 95 95 1 94 7 29 848.2 706 321 298 83 26 267 19 741 46 5 .226
OPPONENTS 44 51 3.69 95 95 7 88 11 28 842.1 784 378 345 79 35 229 17 744 42 2 .245
+ = ROOKIE, * = Disabled List, # = Not with Seattle

8/12/2019 2014 Mid-Season Report
http://slidepdf.com/reader/full/2014-mid-season-report 3/80

8/12/2019 2014 Mid-Season Report
http://slidepdf.com/reader/full/2014-mid-season-report 4/80
2 - 2014 SEATTLE MARINERS MID-SEASON REPORT
THE RECORD…the Mariners reached the All-Star break with a 51-44 (.537) record, the 5th-best winningpercentage in the American League…are 3rd in the AL West, 8.0 games back of first-place Oakland and 6.5back of second-place LAA…hold the second wild card spot 2.5 games up on Toronto and Kansas City …went 27-18 (.600) on the road, the 2nd-best road winning percentage in the AL (DET - 28-16/.636)…were 24-26(.480) at Safeco Field…25 of 44 losses (56.8%) were by 2 or fewer runs…recorded a series record of 15-12-5going 10-5-3 over final 18 series leading up to the break…recorded a trio of 5-game winning streaks: May 3-7May 31-June 4 and June 20-24…season-high 8-game losing streak April 15-22…posted back-to-back winning
months in May (16-14) and June (18-10).
FIRST-HALF IMPROVEMENT (AGAIN)…the Mariners are 51-44 (.537) at the break, the 5th-best winningpercentage in the American League…marks a 8-win improvement from where the Mariners were last All-Stabreak (43-52/.453) and a 15-win improvement from 2012 (36-51/.414).
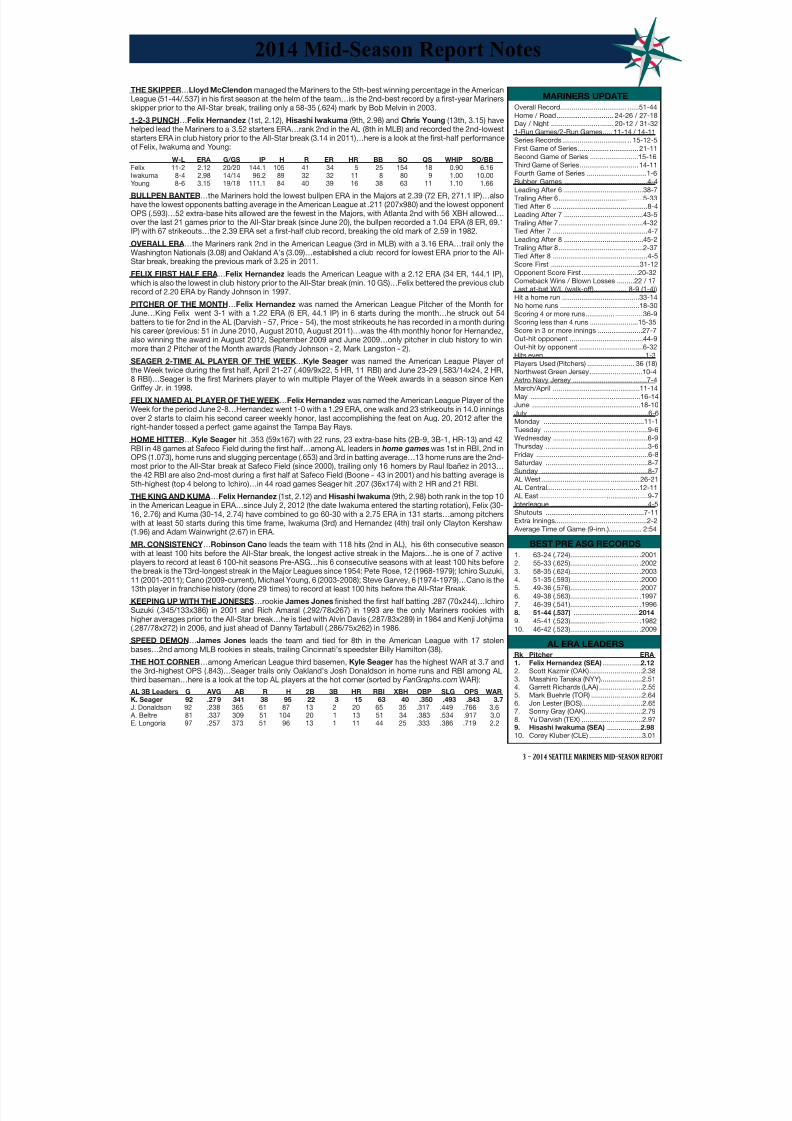
4 ALL-STARS…Felix Hernandez (5th ASG), Robinson Cano (6th ASG), Fernando Rodney (2nd ASGand Kyle Seager ( 1st ASG) are representing the Mariners in the 85th Midsummer Classic at Target Field inMinneapolis…marks the first time since 2003 that the Mariners have had at least four players selected to play inthe All-Star game…also the first time since 2006 (Ichiro & Jose Lopez) to have a pair of position player All-Stars
FELIX NAMED ALL-STAR STARTER…Felix Hernandez was selected as the starting pitcher for the AmericanLeague…is the second Mariners pitcher to start the All-Star game, joining Randy Johnson in 1995 and 1997…this is Felix’s 5th selection to the Midsummer Classic, having been named to the 2009, 2011, 2012 and 2013 ASG…Felix is the 5th player in club history to be selected to at least 5 All-Star games, and just the secondpitcher…joins Ken Griffey Jr. (10; 1990, ‘91, ‘92-MVP, ‘93, ‘94, ‘95, ‘96, ‘97, ‘98, ‘99), Ichiro (10; 2001, ‘02, ‘03‘04, ‘05, ‘06, ‘07-MVP, ‘08, ‘09, ‘10), Edgar Martinez (7; 1992, ‘95, ‘96, ‘97, 2000, ‘01, ‘03) and Randy Johnson(5; 1990, ‘93, ‘94, ‘95, ‘97).
CANO 5-TIME ALL-STAR STARTER…Robinson Cano started his 5th straight All-Star game for the AmericanLeague (6th overall selection)…Cano joins Hall of Famers Rod Carew (6 straight, 1970-75) & Roberto Alomar (5straight, 1996-2000) as only second basemen in AL history to earn five straight fan elections.
PLAYING THE TOUGH GUYS TOUGH…Mariners are 25-14 (.641) against teams with a .500-or-better record(at the time they played) and 26-30 (.464) against teams that are below .500…Seattle is 15-10 (.600) against American League teams that are currently in playoff position: 7-6 vs. Oakland, 6-3 vs. Los Angeles & 2-1 vsDetroit…have yet to play against Baltimore this season.
SINCE APRIL 23…since April 23, starting with Kyle Seager’s walk-off 3-run home run vs. Houston to snapa season-high 8-game losing streak, the Mariners are 44-31 (.587), the 3rd-best winning percentage in theMajors (and AL West) during this stretch, trailing only LAA (47-27/.635) and OAK (46-29/.613).
THE KING IS STREAKING…Felix Hernandez has recorded 11 consecutive starts where he has pitched atleast 7.0 innings and allowed 2 or fewer runs, going 7-1, 1.48 ERA, 94 SO, 13 BB since May 18…the streak isthe longest by an AL pitcher dating back to 1974 when Gaylord Perry had a 11-start streak for the Indians…dating back to 1914, it is the tied for the 3rd-longest streak in MLB history:
Name Strk Start End Games TmTom Seaver 7/17/1971 9/16/1971 13 NYM
Mike Scott 5/17/1986 7/7/1986 12 HOUFelix Hernandez 5/18/2014 Current 11 SEA Gaylord Perry 4/23/1974 6/12/1974 11 CLELarry Dierker 8/3/1969 9/17/1969 11 HOUBob Gibson 6/6/1968 7/30/1968 11 STLJim Merritt 6/25/1967 8/13/1967 11 MINPete Alexander 6/2/1919 8/14/1919 11 CHC
KING FELIX …Felix Hernandez finished the first half 11-2 with an American League-leading 2.12 ERA…second straight season to lead the AL in ERA at the break (2.53 in 2013)…the 11 wins set a career-high beforethe All-Star break, besting his previous high of 10 in 2013…ranked amongst AL leaders in several pitchingcategories including ERA (1st), quality starts (1st, 18), WHIP (1st, .901), games started (T1st, 20), strikeouts(2nd, 154), innings pitched (2nd, 144.2) and wins (T3rd, 11).
CANO CAN HIT…Robinson Cano finished the first half with a .334 batting average (118x353), 3rd-best in the American League…also 2nd in the AL in hits (118) and T2nd in multi-hit games (37)…recorded at least one hiin 73 of 91 games and reached base safely in all but 10 games (81 of 91)…since 2009, Cano leads MLB in hits(1,096), multi-hit games (327) and ranks 2nd in extra-base hits (409).
BEST IS YET TO COME…Robinson Cano ranks 3rd in the American League with a .334 (118x353) battingaverage…his .334 average is the 2nd-best average he has taken into the All-Star Break in his career…he hit.336 (115x342) in 2010 and .325 (88x271) in 2006…in his career before the break is hitting .302 (980x3240)…in the 2nd half is a career .321 (786x2446) hitter.
SIMPLY SEAGER…Kyle Seager led the team in the first half with 15 home runs, 63 RBI and 40 extra-basehits…among AL leaders was T6th in extra-base hits, T10th in RBI and T16th in home runs…selected to play inhis first All-Star game…since the start of the 2012 season has combined to bat .264 with 89 doubles, 6 triples57 home runs and 218 RBI…152 extra-base hits during this span are 13th-most in the American League.
AL SAVES LEADER…Fernando Rodney leads the American League with 27 saves (in 29 opportunities)…2nd-most saves in club history prior to the All-Star break, trailing only 29 saves by Kazahiro Sasaski in 2001…reached 25 saves in 87 team games, 3rd-fastest in club history.
CLOSING IN ON 200 SAVES…Fernando Rodney is one save away from 200 for his career…since the starof the 2012 season Rodney has recorded 112 saves (with 200 strikeouts), 2nd-most in the Majors (most in AL) behind Atlanta’s Craig Kimbrel (121)…Rodney’s 199 career saves are 6th-most among active pitchers: JNathan (360), F. Rodriguez (331), J. Papelbon (308), J. Valverde (288) & H. Street (258).
AT THE BREAK…Overall .................. . 51-44 .................. .... .537Home ................ ...... 24-26 .................. .... .480Road ................. ...... 27-18 .................. .... .600Day ................ ......... 20-12 .................. .... .625Night ................. ...... 31-32 ............... ....... .4921-Run ................ ...... 11-14 ...................... .4402-Run ................ ...... 14-11 ...................... .5603-Run ................ .......... 5-9 ...................... .357vs. Left .................. .. 21-12 ...................... .636vs. Right ................. 30-32 ................ ...... .484Come-From-Behind Wins............................22Lineups Used (Batting) ................................86Lineups Used (Defense) ..............................69
AL WEST
AT THE BREAK (2014)Oakland 59-36 --Los Angeles 57-37 1.5Seattle 51-44 8.0Houston 40-56 19.5Texas 38-57 21.0
AL WILD CARD STANDINGSTeam Rec. GB
Los Angeles 44-49 +6.5Seattle 43-52 --Kansas City 48-46 2.5Toronto 49-47 2.5Cleveland 47-47 3.5New York 47-47 3.5
OFFENSIVE LEADERSBatting Average ................. ...........Cano - .334Hits ................................................Cano - 118Runs ................................................Cano - 492B .......................................Cano/Seager - 223B ................. .................. ................. Jones - 4HR ................................................Seager - 15RBI ................................................Seager - 63BB .......................................Cano/Seager - 33SO ................ .................. .............. Zunino - 97OBP ..............................................Cano - .393SLG ...........................................Seager - .493
XBH ................................ ..............Seager - 40SB ................. .................. ............... Jones - 17TB ...............................................Seager - 168Multi-Hit Games ..............................Cano - 37
PITCHING LEADERSW (starter) ...............................Hernandez - 11W (reliever) ................ .................. ... Medina - 4L (starter) ............................................Elias - 8L (reliever) .....................................Furbush - 4Saves ...........................................Rodney - 27Holds ............... .................. .......... Medina - 13GS ..........................................Hernandez - 20G ................. ...Farquhar/Furbush/Rodney - 38IP .......................................Hernandez - 144.1CG ......................................................Elias - 1BB .....................................................Elias - 40SO ........................................Hernandez - 154ERA (starter) ........................Hernandez - 2.12ERA (reliever) .................. ........... Beimel - 1.50Quality Starts .................. ........Hernandez - 18
AL TEAM ERA LEADERS
RK TEAM (overall) ERA 1. Oakland ................. .................. ....... 3.092. Seattle ...........................................3.163. Kansas City ................. .................. . 3.76
RK TEAM (bullpen) ERA 1. Seattle ...........................................2.392. Oakland .................. ................. ....... 3.003. Cleveland ................. .................. .... 3.03
RK TEAM (starters) ERA 1. Oakland .................. ................. ....... 3.132. Seattle ...........................................3.523. LA Angels .................. ................. .... 3.81
2014 Mid-Season Report Notes
8/12/2019 2014 Mid-Season Report
http://slidepdf.com/reader/full/2014-mid-season-report 5/80
3 - 2014 SEATTLE MARINERS MID-SEASON REPORT
2014 Mid-Season Report Notes
THE SKIPPER…Lloyd McClendon managed the Mariners to the 5th-best winning percentage in the AmericanLeague (51-44/.537) in his first season at the helm of the team…is the 2nd-best record by a first-year Marinersskipper prior to the All-Star break, trailing only a 58-35 (.624) mark by Bob Melvin in 2003.
1-2-3 PUNCH…Felix Hernandez (1st, 2.12), Hisashi Iwakuma (9th, 2.98) and Chris Young (13th, 3.15) havehelped lead the Mariners to a 3.52 starters ERA…rank 2nd in the AL (8th in MLB) and recorded the 2nd-loweststarters ERA in club history prior to the All-Star break (3.14 in 2011)…here is a look at the first-half performance
of Felix, Iwakuma and Young: W-L ERA G/GS IP H R ER HR BB SO QS WHIP SO/BBFelix 11-2 2.12 20/20 144.1 105 41 34 5 25 154 18 0.90 6.16Iwakuma 8-4 2.98 14/14 96.2 89 32 32 11 8 80 9 1.00 10.00Young 8-6 3.15 19/18 111.1 84 40 39 16 38 63 11 1.10 1.66
BULLPEN BANTER…the Mariners hold the lowest bullpen ERA in the Majors at 2.39 (72 ER, 271.1 IP)…alsohave the lowest opponents batting average in the American League at .211 (207x980) and the lowest opponentOPS (.593)…52 extra-base hits allowed are the fewest in the Majors, with Atlanta 2nd with 56 XBH allowed…over the last 21 games prior to the All-Star break (since June 20), the bullpen recorded a 1.04 ERA (8 ER, 69.1IP) with 67 strikeouts…the 2.39 ERA set a first-half club record, breaking the old mark of 2.59 in 1982.
OVERALL ERA …the Mariners rank 2nd in the American League (3rd in MLB) with a 3.16 ERA…trail only theWashington Nationals (3.08) and Oakland A’s (3.09)…established a club record for lowest ERA prior to the All-Star break, breaking the previous mark of 3.25 in 2011.
FELIX FIRST HALF ERA …Felix Hernandez leads the American League with a 2.12 ERA (34 ER, 144.1 IP),which is also the lowest in club history prior to the All-Star break (min. 10 GS)…Felix bettered the previous clubrecord of 2.20 ERA by Randy Johnson in 1997.
PITCHER OF THE MONTH…Felix Hernandez was named the American League Pitcher of the Month forJune…King Felix went 3-1 with a 1.22 ERA (6 ER, 44.1 IP) in 6 starts during the month…he struck out 54batters to tie for 2nd in the AL (Darvish - 57, Price - 54), the most strikeouts he has recorded in a month duringhis career (previous: 51 in June 2010, August 2010, August 2011)…was the 4th monthly honor for Hernandez,also winning the award in August 2012, September 2009 and June 2009…only pitcher in club history to winmore than 2 Pitcher of the Month awards (Randy Johnson - 2, Mark Langston - 2).
SEAGER 2-TIME AL PLAYER OF THE WEEK …Kyle Seager was named the American League Player ofthe Week twice during the first half, April 21-27 (.409/9x22, 5 HR, 11 RBI) and June 23-29 (.583/14x24, 2 HR,8 RBI)…Seager is the first Mariners player to win multiple Player of the Week awards in a season since KenGriffey Jr. in 1998.
FELIX NAMED AL PLAYER OF THE WEEK …Felix Hernandez was named the American League Player of theWeek for the period June 2-8…Hernandez went 1-0 with a 1.29 ERA, one walk and 23 strikeouts in 14.0 inningsover 2 starts to claim his second career weekly honor, last accomplishing the feat on Aug. 20, 2012 after theright-hander tossed a perfect game against the Tampa Bay Rays.
HOME HITTER…Kyle Seager hit .353 (59x167) with 22 runs, 23 extra-base hits (2B-9, 3B-1, HR-13) and 42
RBI in 48 games at Safeco Field during the first half…among AL leaders in home games was 1st in RBI, 2nd inOPS (1.073), home runs and slugging percentage (.653) and 3rd in batting average…13 home runs are the 2nd-most prior to the All-Star break at Safeco Field (since 2000), trailing only 16 homers by Raul Ibañez in 2013…the 42 RBI are also 2nd-most during a first half at Safeco Field (Boone - 43 in 2001) and his batting average is5th-highest (top 4 belong to Ichiro)…in 44 road games Seager hit .207 (36x174) with 2 HR and 21 RBI.
THE KING AND KUMA …Felix Hernandez (1st, 2.12) and Hisashi Iwakuma (9th, 2.98) both rank in the top 10in the American League in ERA…since July 2, 2012 (the date Iwakuma entered the starting rotation), Felix (30-16, 2.76) and Kuma (30-14, 2.74) have combined to go 60-30 with a 2.75 ERA in 131 starts…among pitcherswith at least 50 starts during this time frame, Iwakuma (3rd) and Hernandez (4th) trail only Clayton Kershaw(1.96) and Adam Wainwright (2.67) in ERA.
MR. CONSISTENCY …Robinson Cano leads the team with 118 hits (2nd in AL), his 6th consecutive seasonwith at least 100 hits before the All-Star break, the longest active streak in the Majors…he is one of 7 activeplayers to record at least 6 100-hit seasons Pre-ASG…his 6 consecutive seasons with at least 100 hits beforethe break is the T3rd-longest streak in the Major Leagues since 1954: Pete Rose, 12 (1968-1979); Ichiro Suzuki,11 (2001-2011); Cano (2009-current), Michael Young, 6 (2003-2008); Steve Garvey, 6 (1974-1979)…Cano is the13th player in franchise history (done 29 times) to record at least 100 hits before the All-Star Break.
KEEPING UP WITH THE JONESES…rookie James Jones finished the first half batting .287 (70x244)…IchiroSuzuki (.345/133x386) in 2001 and Rich Amaral (.292/78x267) in 1993 are the only Mariners rookies withhigher averages prior to the All-Star break…he is tied with Alvin Davis (.287/83x289) in 1984 and Kenji Johjima(.287/78x272) in 2006, and just ahead of Danny Tartabull (.286/75x262) in 1986.
SPEED DEMON…James Jones leads the team and tied for 8th in the American League with 17 stolenbases…2nd among MLB rookies in steals, trailing Cincinnati’s speedster Billy Hamilton (38).
THE HOT CORNER…among American League third basemen, Kyle Seager has the highest WAR at 3.7 andthe 3rd-highest OPS (.843)…Seager trails only Oakland’s Josh Donaldson in home runs and RBI among ALthird baseman…here is a look at the top AL players at the hot corner (sorted by FanGraphs.com WAR):
AL 3B Leaders G AVG AB R H 2B 3B HR RBI XBH OBP SLG OPS WARK. Seager 92 .279 341 38 95 22 3 15 63 40 .350 .493 .843 3.7J. Donaldson 92 .238 365 61 87 13 2 20 65 35 .317 .449 .766 3.6 A. Beltre 81 .337 309 51 104 20 1 13 51 34 .383 .534 .917 3.0E. Longoria 97 .257 373 51 96 13 1 11 44 25 .333 .386 .719 2.2
MARINERS UPDATEOverall Record ................. ................. ......51-44
Home / Road ................ ............. 24-26 / 27-18Day / Night ......................... ....... 20-12 / 31-32
1-Run Games/2-Run Games ..... 11-14 / 14-11
Series Records ................ ................. .. 15-12-5
First Game of Series ................ ...............21-11Second Game of Series .........................15-16
Third Game of Series ............... ...............14-11
Fourth Game of Series ...............................1-6
Rubber Games ...........................................4-4
Leading After 6 .........................................38-7
Trailing After 6 .................. ................. ........5-33Tied After 6 .................................................8-4
Leading After 7 .........................................43-5
Trailing After 7 .................. ................. ........4-32
Tied After 7 .................................................4-7
Leading After 8 .........................................45-2
Trailing After 8 .................. ................. ........2-37
Tied After 8 .................................................4-5
Score First ..............................................31-12
Opponent Score First ................. ............20-32
Comeback Wins / Blown Losses .........22 / 17Last at-bat W/L (walk-off) ................. 8-9 (1-4))
Hit a home run ........................................33-14No home runs .........................................18-30
Scoring 4 or more runs ............... ..............36-9
Scoring less than 4 runs .........................15-35
Score in 3 or more innings .......................27-7
Out-hit opponent ......................................44-9
Out-hit by opponent .................................6-32
Hits even.....................................................1-3
Players Used (Pitchers) ................. ....... 36 (18)Northwest Green Jersey ................ ...........10-4
Astro Navy Jersey ............................... .......7-4
March/April .............................................11-14
May .........................................................16-14
June ........................................................18-10
July .............................................................6-6
Monday ....................................................11-1
Tuesday ......................................................9-6
Wednesday .................................................6-9
Thursday .....................................................3-6
Friday ..........................................................6-8Saturday .....................................................8-7
Sunday .......................................................8-7
AL West .................. ................. ...............26-21
AL Central .................. ................. ............12-11
AL East ................ .................. ................. ....9-7
Interleague ..................................................4-5
Shutouts ...................................................7-11
Extra Innings ................. ................. .............2-2
Average Time of Game (9-inn.) ................. 2:54
BEST PRE ASG RECORDS1. 63-24 (.724).................. ................. .2001
2. 55-33 (.625).................. ................. .2002
3. 58-35 (.624).................. ................. .20034. 51-35 (.593).................. ................. .2000
5. 49-36 (.576).................. ................. .2007
6. 49-38 (.563).................. ................. .1997
7. 46-39 (.541).................. ................. .1996
8. 51-44 (.537) ...................................2014
9. 45-41 (.523).................. ................. .1982
10. 46-42 (.523).................. ................. .2009
AL ERA LEADERSRk Pitcher ERA
1. Felix Hernandez (SEA) ............... .....2.12
2. Scott Kazmir (OAK) ................ ...........2.383. Masahiro Tanaka (NYY) ................ .....2.514. Garrett Richards (LAA) ................. .....2.555. Mark Buehrle (TOR) ............... ...........2.646. Jon Lester (BOS).................... ...........2.657. Sonny Gray (OAK) ............... ..............2.798. Yu Darvish (TEX) ................. ..............2.979. Hisashi Iwakuma (SEA) ..................2.98
10. Corey Kluber (CLE) ................ ...........3.01

8/12/2019 2014 Mid-Season Report
http://slidepdf.com/reader/full/2014-mid-season-report 6/80
4 - 2014 SEATTLE MARINERS MID-SEASON REPORT
2014 Mid-Season Report Notes
ODDS & ENDS…• High Water Mark - Mariners were as many as 9 games over .500, last after beating Minnesota on July 7 to
move to 49-40…first time to be at least 9 G over .500 since the end of 2007 season (+14, 88-74).• AL West - Seattle is 26-21 against the American League West division, winning 6 of last 7.• Lots of Games - 95 games before the All-Star break tied a club record (also: 1977, 2008, 2013).• Triples - Mariners lead the American League with 21 triples…last lead the AL in triples in 2006.• Monday - Mariners are 11-1 on Monday’s (.917), the best record by a team on any day of the week.
• 10+ Hits - When recording 10+ hits the Mariners are 29-6 (.829).• The Closer - Fernando Rodney is 1st in the AL with 27 saves (27-for-29 in save opps).• Maurer Power - Brandon Maurer has not allowed a run in 5 games in relief (9.2 IP, 4 H, 11 K, 2 BB).• HBP - The Mariners are 5th in AL with 35 HBP…had only 31 HBP last season.• Starting Things Right - Mariners are 21-11 in the first game of a series this season.• RBI Leaders - Kyle Seager (T10th, 63) and Robinson Cano (12th, 57) are among AL RBI leaders.• Interleague - Went 4-5 vs. in Interleague play, including first April games vs. an NL opponent.• NW Green - Mariners are 10-4 when wearing their Northwest Green jerseys.• Defense - Mariners ranked 2nd in the AL with a .987 FLD%…played error-free in 61 of 95 games.• No Double-Digits Here - Mariners have not allowed an opponent to score 10+ runs since Sept. 15, 2013 a
St. Louis (12-2 loss), a club-record streak of 108 consecutive games.• Comeback Wins - Mariners have 22 come-from-behind wins, 6th-most in the AL.• Leading Off - Endy Chavez is batting .458 (11x24) with 4 doubles in his first PA in 26 games batting leadoff
STRIKEOUTS BEFORE TURNING 29…Felix Hernandez has recorded 1,857 strikeouts in his 10 Major Leagueseasons, all before turning 29 years old (turns 29 April 8, 2015)…the 1,857 strikeouts are 5th-most in basebalhistory before turning 29 years old:
Most Strikeouts - Before Turning 292,156 Sam McDowell2,117 Walter Johnson2,082 Bert Blyleven1,951 Amos Rusie1,857 Felix Hernandez1,855 Don Drysdale1,836 Bob Feller1,835 Dwight Gooden1,818 Pedro Martinez
15 STRIKEOUTS…Felix Hernandez struck out a career-high 15 batters June 8 at Tampa Bay…tied for most in theMajors this season (Jon Lester, BOS on May 3 vs. OAK)…was the 21st time in Mariners history that a pitcher hadat least 15 strikeouts in a game, the first since Randy Johnson had 15 on July 11, 1998 vs. Angels…Felix recorded4 starts with 10+ strikeouts during the first half, tied for 4th-most in the Majors (Price - 8).
WORKHORSES…the Mariners have 7 relief pitchers who have appeared in 30 or more games…Seattle is the onlyteam in the American League with 7 pitchers with 30+ relief appearances (one of 2 in MLB), but ranks T11th with264 relief appearances and 13th in total bullpen innings (271.1)…Fernando Rodney , Danny Farquhar and Charlie
Furbush are tied for the team lead with 38 appearances.
PROJECTING SEAGER…Kyle Seager leads the team with 15 home runs and 63 RBI…is on pace for a 26-homer107 RBI season, which would mark the first 25+ HR, 100+ RBI season by a Mariners player since Richie Sexson(24 HR, 107 RBI) and Raul Ibañez (33 HR, 123 RBI) in 2006…he is already the first Mariners player with 15+ HR and60+ RBI at the All-Star break since Ibañez in 2006 (20 HR, 70 RBI).
CANO ON-BASE STREAK …Robinson Cano reached base safely in 31 consecutive games April 20-May 24, the3rd-longest on-base streak among AL players in the first half of the season…Cano batted .372 (45x121) with a .414on-base percentage during his career-high on-base streak.
CANO ROAD HITTING STREAK …Robinson Cano recorded a 21-game road hitting streak May 3-June 20…wasthe longest road hitting streak in the AL in the first half of the season…batted .419 (36x86) with 13 runs, 6 doubles1 triple, 1 home run and 15 RBI during the streak (.485 OBP).
MAKING THE MOST OF HIS HOMERS…Robinson Cano has hit 7 home runs this season, with runners on baseduring each longball…has hit three 3-run homers and four 2-run home runs, driving in a combined 17 runs with the7 home runs.
DAY BASEBALL…Seattle is 20-12 (.625) in day games, the 2nd-best winning percentage among American League
teams (OAK: 24-13/.649)…won 13 of the last 16 day games heading into the All-Star break…Robinson Cano ranks7th in the AL batting .347 (42x121) with 4 of his 7 home runs (22 RBI) in day games.
BACK-TO-BACK SHUTOUTS…recorded back-to-back shutouts June 8 (5-0) and June 9 (3-0) at Tampa Bay…18thtime with shutouts in consecutive games (last: Sept. 24-25, 2013 vs. KC)…recorded consecutive road shutouts fothe 5th time in club history, first since July 4-5, 1999 (at TEX and at ANA).
CHICKS DIG THE 3-RUN HR…Kyle Seager hit five 3-run home runs, 2nd-most in MLB behind Toronto’s EdwinEncarnacion (6)…10 of 15 Seager’s home runs came with runners on base…30 of his team-leading 63 RBIs camevia the home run.
KEEP IT IN THE YARD…Felix Hernandez did not allow a home run in 11 consecutive starts April 26-June 18…marked the longest single-season streak in club history and 2nd-longest overall streak by a Mariners pitcher…ErikHanson did not allow a homer in 12 straight starts Sept. 20, 1989-May 23, 1990.
ROAD WARRIORS…the Mariners head into the second half of the season with the 2nd-best road winningpercentage in the American League with a 27-18 mark (.600)…trail only the Tigers (28-16/.636) and Dodgers (29-19/.604) for the Major League lead.
INSIDE THE NUMBERS
.334Robinson Cano is 3rd in the American
League in batting average (.334/118x353).
.353Kyle Seager is batting .353 (59x167) with
13 HR & 42 RBI in 48 games at Safeco.
.429Robinson Cano is batting .429 (24x56)with 5 doubles, 3 home runs, 14 RBI overhis last 14 games (since 6/29) headinginto the break.
2.12Felix Hernandez leads the AL with a 2.12ERA and set a Mariners record for lowest
ERA prior to the All-Star break.
2.39The Mariners have the best bullpen ERA
in the Majors at 2.39 (72 ER, 271.1 IP).
4The Mariners have 4 All-Stars for the first
time since 2003 - Felix Hernandez, Rob-
inson Cano, Fernando Rodney , Kyle
Seager.
11Felix Hernandez has a current streak of11 consecutive starts of 7.0+ innings with2 or fewer runs allowed…streak is tied forlongest by AL pitcher since 1974 whenGaylord Perry had 11-start streak.
15Kyle Seager leads the team with 15 homeruns (T16th in AL)…13 of 15 HR hit atSafeco Field.
27Fernando Rodney leads the AmericanLeague with 27 saves, 2nd-most in clubhistory prior to the All-Star break (Sasaki- 29 in 2001).
51The Mariners have 51 wins before the All-Star break, the 5th time in club history torecord 50+ wins pre-ASG (first since 2003- 58-35).
118Hits by Robinson Cano to rank 2nd in the American League.

8/12/2019 2014 Mid-Season Report
http://slidepdf.com/reader/full/2014-mid-season-report 7/80
5 - 2014 SEATTLE MARINERS MID-SEASON REPORT
2014 Mid-Season Report Notes
WINNING STREAKS…the Mariners recorded a pair of 5-game winning streaks during the first half of theseason: May 3-7, May 31-June 4 and June 20-24…first time the Mariners have had three separate winningstreaks of at least 5 games before the All-Star break since 2003.
A NIGHT FOR THE RECORD BOOKS…Kyle Seager tied club record (7th time) with 4 extra base hits June2 at New York (2B, 2 3B, HR), last done by Adrian Beltre (July 6, 2007 vs. OAK)…also tied club record with2 triples, becoming 14th player in club history to do so, last done by Brad Miller (July 5, 2013 at CIN)… he
became the first Major Leaguer to hit 2 triples and at least one homer and 1 double since Hal Breeden forMontreal in 1973…last AL player to do it was Hoot Evers for Detroit in 1950.
LOGAN’S BIG NIGHT…Logan Morrison went 4-for-4 with his first career multi-home run game and recorded4 RBI June 23 vs. Boston (also had a walk)…he became the 9th player in club history (11th time) to reach basesafely at least 5 times in a game, while hitting 2 or more home runs and recording at least 4 RBI…he is thefirst Mariners player to do this since Mike Cameron’s 4-home run game May 2, 2002 at Chicago (AL)…alsobecame the first Mariners 1B to reach base 5+ times while scoring 3+ runs and knocking in 4+ runs in a game.
YANKEE STADIUM DEBUT…Mike Zunino went 4-for-5 in his Yankee Stadium debut April 29 setting a career-high in hits…he became just the 15th player to get 4+ hits in his first game at Yankee Stadium (new or old)…ofthe previous 14, only one was younger than Zunino (23 years, 35 days)…Wayne Ambler of the Philadelphia A’swas 22 years, 186 days old when he went 5-for-5 in his Yankee Stadium debut on May 13, 1938.
JONES STREAKING TO OPEN CAREER…James Jones recorded at least one hit in each of his first 15 MajorLeague starts, setting a Mariners record (had 2 hitless pinch-hitting appearances)…Edgar Martinez recorded ahit in each of his first 10 starts in 1987 and Alvin Davis had a hit in his first 9 starts in 1984.
WELCOME TO THE SHOW…four players made their Major League debut with the Mariners in the first half:Stefen Romero (4/1 at LAA), Roenis Elias (4/3 at OAK), Dominic Leone (4/6 at OAK) and James Jones (4/18at MIA)…8 rookies saw action on the field during the first half of the season.
WHAT A GAME…the Mariners beat the White Sox 3-2 in 14 innings on July 5 at Cellular Field…marked theMariners first win in a game of at least 14.0 innings since Sept. 17, 2009 vs. the White Sox (at Safeco Field)and the first road win in a game of at least 14.0 innings since a 4-3 win in 16 innings Sept. 25, 1992 at Texas.
OPENING DAY FELIX …Felix Hernandez made his club-record 7th career Opening Day start, earning the winby allowing 2 ER (3 runs total) in 6.0 innings…was his 6th consecutive OD start (2007 vs. OAK, 2009 at MIN,2010 at OAK, 2011 at OAK, 2012 at OAK-Tokyo, 2013 at OAK)…Felix is 5-0, 1.52 ERA (9 ER, 53.1 IP) with 52strikeouts in his 7 career Opening Day starts.
YOUNG OPENING DAY STARTS…Felix Hernandez is the first pitcher in Major League history (since 1900)to make 7 Opening Day starts prior to turning 28…only four other pitchers have made 6 Opening Day startsas a pitcher before turning 28:
Most Career Opening Day Starts by Pitcher Before Turning 28:Felix Hernandez 7 2007, 2009, 2010, 2011, 2012, 2013, 2014Bert Blyleven 6 1972, 1973, 1974, 1975, 1976, 1977Dennis Eckersley 6 1976, 1977, 1979, 1980, 1981, 1982
Fernando Valenzuela 6 1981, 1983, 1984, 1985, 1986, 1988Dwight Gooden 6 1985, 1986, 1988, 1989, 1990, 1991
LOTS OF STRIKEOUTS IN OPENER…Felix Hernandez recorded 11 strikeouts on Opening Night March31 at LAA, the 4th-most in an Opening Day start in club history: Randy Johnson (14 in 1993 & 1996), FelixHernandez (12 in 2007), Mark Langston (10 in 1988) and Floyd Bannister (10 in 1982)…Felix’s 52 strikeouts inhis 7 Opening Day starts are the most in club history, passing Randy Johnson, who had 50 in his 6 OD starts…Felix’s 7 Opening Day starts are the most by a starting pitcher in club history (previous: Johnson - 6) and his 5wins are also the most (previous: Johnson - 3).
OPENING DAY WIN STREAK …the Mariners extended their Opening Day winning streak to 8 consecutivegames with a 10-3 win vs. the Angels (old record was 5 straight from 1982-86)…it is the longest OD winningstreak since the Cincinnati Reds posted 9 straight wins on Opening Day from 1983-1991, and is the 2nd-longest American League Opening Day win streak trailing only the St. Louis Browns (9 straight, 1937-45).
3-0 START…the Mariners opened the season going 3-0 for the third time in club history, joining the 1995 (3)& 1985 clubs (6)…Seattle’s sweep of the Angels to open the season was its first in Anaheim since 2006 andit was just the second time in club history to complete a season-opening sweep, joining the 1985 club whoswept the Tigers and Twins in the first two series…new manager Lloyd McClendon became the second
Mariners manager to win each of their first 3 games at the helm, joining Rene Lachemann (4, 1981), and thefirst skipper to win his first 3 games on the road.
ADD IT TO THE LIST…Marlins Park became the 47th ballpark the franchise has appeared in (regular seasongames)…the Mariners have debuted a new stadium in 6 of the last 7 seasons (Great American Ball Park - 2013,Nationals Park - 2011, Busch Stadium/Target Field - 2010, Yankee Stadium - 2009, Turner Field - 2008, WrigleyField - 2007)…Seattle is 16-31 all-time in their first ever game in a park…Seattle has played in 25 different AL parks (including County Stadium in Milwaukee and both the Kingdome and Safeco Field) and 21 differentNL parks…the only current ballparks the Mariners have not played (after crossing Marlins Park off the list)are Citizens Bank Park (Philadelphia) and Citi Field (New York)…the Mariners will travel to Philadelphia andCitizens Bank Park Aug. 18-20.
DRAFT RECAP…the Mariners signed 36 of the 40 players that were selected in the 2014 MLB First-YearPlayer Draft…outfielder Alex Jackson, who was the 6th overall pick in the draft, was the Mariners first-rounddraft pick…the Mariners selected 21 pitchers, including 9 left-handers, 5 catchers, 9 infielders (1 1B, 2 2B, 5SS, 1 3B), and 5 outfielders…Seattle selected 31 college players and 9 high school players.
CANO HIT PARADE
Robinson Cano is 3rd in the American Leaguewith a .334 batting average, 2nd with 118 hits
and T2nd with 37 multi-hit games…here arethe AL leaders in all three categories:
AL Player Batting Avg
1. Adrian Beltre (TEX) ............. .337 (104x309)2. Jose Altuve (HOU) .............. .335 (130x388)
3. Robinson Cano (SEA) ...... .334 (118x353)
4. Lonnie Chisenhall (CLE) ....... .328 (86x262)
5. Victor Martinez (DET).............328 (99x302)
AL Player Hits
1. Jose Altuve (HOU) ................. ...............130
2. Robinson Cano (SEA) ................ .........118
3. Melky Cabrera (TOR) ................ ............117
4. Adam Jones (BAL) ................. ...............116
5. Ian Kinsler (DET) ................. ..................115
AL Player Multi-Hit Games
1. Jose Altuve (HOU) ................. .................402. Robinson Cano (SEA) ................ ...........37
Ian Kinsler (DET) ................. .................. ..37
4. Nick Markakis (BAL) ................. ..............36
5. Melky Cabrera (TOR) ................ ..............34
Adam Jones (BAL) ................. .................34
AL SAVES LEADER
Fernando Rodney leads the American League
with 27 saves:
AL Pitcher Saves
1. Fernando Rodney (SEA) .................. .....27
2. Greg Holland (KC) ................. .................25
3. David Robertson (NYY) .................. ........23
4. Glen Perkins (MIN)................. .................22
5. Joe Nathan (DET) ............... .................. ..19
RUN DIFFERENTIAL
The Mariners have the 4th-best run differentialin the Majors:
MLB Team Run Differential
1. Oakland ................ ............. +145 (466-321)2. LA Angels ................ ............ +89 (478-389)3. Washington ................ ......... +61 (387-326)
4. Seattle ................................+57 (378-321)
5. Detroit ................ ................. ..+50 (437-387
LA Dodgers ................ ......... +50 (404-354)
ULTRA QUALITY STARTS
Felix Hernandez leads the American Leguewith 18 quality starts, and is also pacing the
league with 14 “Ultra Quality” starts…NL All-Star starting pitcher Adam Wainwright leads
the Majors with 15 UQS…a QS is defined as6.0 or more IP, allowing 3 or less ER, while a
UQS is 7.0 or more IP, 2 or less runs allowed:
Pitcher UQS
Adam Wainwright (STL) ..........................15
Felix Hernandez (SEA) ................ ..........14Julio Teheran (ATL) .................................11Johnny Cueto (CIN) ................................11
POSITION HR LEADERS
Mike Zunino leads all American League
catchers with 13 home runs and Brad Miller istied for the lead among AL shortstops:
AL Catcher HR
1. Mike Zunino (SEA) ................................13
2. Yan Gomes (CLE) ............... .................. ..12
3. Salvador Perez (KC) ................. ..............11
AL Shortstop HR
1. Brad Miller (SEA) ....................................8
Asdrubal Cabrera (CLE) .................. ..........8
Alexei Ramirez (CWS) .................. .............8

8/12/2019 2014 Mid-Season Report
http://slidepdf.com/reader/full/2014-mid-season-report 8/80
6 - 2014 SEATTLE MARINERS MID-SEASON REPORT
-- Here is a look at the Mariners hitters in the first half --
#13 - DUSTIN ACKLEY, OF• The Totals - Appeared in 85 games, making 74 starts (LF-70, DH-4), hitting .225 (62x275) with 32 runs, 14 doubles, 2 triples, 4 home runs and 29 RBI.• Finishing Strong - Hit .313 (10x32) with 2 runs, 2 doubles, and 2 RBI over his last 11 games before the All-Star Break.
• Tailing Off - Began the season hitting .293 (17x58) in the first 16 games before hitting .207 (45x217) over his final 69 games of the first half.• On The Road Again - Hit .264 (37x140) on the road but just .185 (25x135) at Safeco Field.• Twice the Fun - Recorded his first career multi-home run game May 11 vs. Kansas City.• Three In A Row - Hit a home run in three consecutive plate appearances May 10-11.
Mid-Season Splits AVG G AB R H 2B 3B HR RBI BB IBB SO HBP SB CS OBP SLG OPS
Total .225 85 275 32 62 14 2 4 29 21 1 53 1 3 2 .282 .335 .616vs. Left .274 - 73 - 20 6 2 0 11 1 0 16 0 1 0 .284 .411 .695vs. Right .208 - 202 - 42 8 0 4 18 20 1 37 1 2 2 .281 .307 .588Home .185 44 135 13 25 7 0 3 7 9 0 29 1 2 0 .241 .304 .545 Away .264 41 140 19 37 7 2 1 22 12 1 24 0 1 2 .320 .364 .685RISP .206 - 68 - 14 3 2 1 24 8 1 13 0 0 0 .286 .353 .639Bases Loaded .400 - 5 - 2 1 1 0 8 1 0 0 0 0 0 .500 1.000 1.500March .500 1 4 1 2 0 1 0 3 1 0 1 0 0 0 .600 1.000 1.600 April .243 23 74 11 18 4 0 1 8 4 0 16 0 1 0 .278 .338 .616May .221 25 86 11 19 4 1 3 8 8 1 15 0 1 1 .287 .395 .683June .165 25 79 7 13 4 0 0 8 6 0 13 1 1 1 .233 .215 .448July .313 11 32 2 10 2 0 0 2 2 0 8 0 0 0 .353 .375 .728
#8 - WILLIE BLOOMQUIST, UTL• The Totals - Appeared in 41 games, making 29 starts (SS-10, 3B-5, 2B-5, 1B-5, LF-3, DH-1), hitting .269 (32x119) with 11 runs, 5 doubles, 1 HR, 12 RBI
• Glove Man - Appeared defensively at all four infield positions and both corner outfield positions.• Strong Finish - Hit .324 (24x74) with 7 runs, 4 doubles, 1 home run and 10 RBI in 24 games from May 23-All-Star Break; hit .178 (8x45) in his first 17 games• Clutch - Hit .414 (12x29) with runners in scoring position and .404 (19x47) with runners on base; hit .181 (13x72) with none on.• About Time - Hit a 2-run home run in the 6th inning May 23 vs. Houston, his first HR since Aug. 10, 2011 vs. Houston, a span of 663 plate appearances.• Round Number - Appeared in his 1,000th career game on June 10 vs. New York, leading off and playing first base.
Mid-Season Splits AVG G AB R H 2B 3B HR RBI BB IBB SO HBP SB CS OBP SLG OPS
Total .269 41 119 11 32 5 0 1 12 3 1 28 0 0 1 .285 .336 .621vs. Left .254 - 63 - 16 1 0 1 7 2 1 12 0 0 0 .273 .317 .590vs. Right .286 - 56 - 16 4 0 0 5 1 0 16 0 0 1 .298 .357 .655Home .274 22 62 5 17 1 0 1 6 0 0 16 0 0 1 .270 .339 .609 Away .263 19 57 6 15 4 0 0 6 3 1 12 0 0 0 .300 .333 .633RISP .414 - 29 - 12 4 0 1 12 2 1 6 0 0 1 .438 .655 1.093 April .259 8 27 3 7 0 0 0 0 1 0 7 0 0 0 .286 .259 .545May .172 12 29 2 5 1 0 1 7 0 0 5 0 0 0 .167 .310 .477June .348 14 46 5 16 4 0 0 4 2 1 12 0 0 1 .375 .435 .810July .235 7 17 1 4 0 0 0 1 0 0 4 0 0 0 .235 .235 .471
#22 - ROBINSON CANO, 2B• First Half - Appeared in 91 games, all starts (2B-85, DH-6), hitting .334 (118x353) with 49 runs, 22 doubles, 1
triple, 7 home runs, 57 RBI and an .855 OPS.• All-Star - Elected by the fans as the American League starting second baseman…it is the 5th consecutive
Midsummer Classic he will start for the AL and his 6th All-Star selection…is the first AL second baseman tostart 5 consecutive All-Star games since Roberto Alomar (1996-2000).
• AL Leaders - Among American Leaguers ranked 2nd in hits, T2nd in multi-hit games (37), 3rd in average andT12th in RBI (57).
• Hot Heading into the Break - .334 (118x353) batting average is the 2nd highest average taken in to the All-Star Break (.336 in 2010).
• The Big Picture – Hit at a .362 (79x218) clip with 33 runs scored , 16 doubles, 6 home runs, 38 RBI and a .940OPS in his final 57 games since May 9.
• Heating Up - Hit 5 home runs in his final 31 games (116 AB) before the break; hit 2 home runs in his first 60games of the season.
• Lighting up RHP - Led the AL and ranked 2nd in the Majors by hitting .350 (76x217) against right-handedpitchers (Matt Adams, STL, .364).
• Southpaws - Hit .309 (42x136) vs. LHP, the most hits by a left-handed batter against LHP (Ellsbury, NYY - 39).• RISP - Ranked 3rd in the AL with a .368 (28x76) average with runners in scoring position and T7th with a .350
(50x143) average with runners on base.
TEAM BATTING BREAKDOWN AVG G AB R H 2B 3B HR RBI BB IBB SO HBP SB CS OBP SLG OPS
Total .245 95 3202 378 784 144 21 79 359 229 17 744 35 49 24 .300 .377 .677vs. Left .247 - 1118 - 276 54 7 15 118 61 5 269 17 14 7 .294 .348 .642vs. Right .244 - 2084 - 508 90 14 64 241 168 12 475 18 35 17 .304 .393 .696Home .235 50 1604 173 377 65 4 47 162 105 6 395 19 20 11 .288 .368 .657 Away .255 45 1598 205 407 79 17 32 197 124 11 349 16 29 13 .312 .385 .698Day .237 32 1074 119 255 50 8 21 114 79 7 236 8 19 5 .293 .358 .650Night .249 63 2128 259 529 94 13 58 245 150 10 508 27 30 19 .304 .387 .691RISP .256 - 727 - 186 41 7 21 269 73 17 182 7 10 3 .320 .418 .739Bases Loaded .273 - 55 - 15 7 2 0 43 2 0 13 0 0 0 .279 .473 .751vs. AL .245 86 2905 350 713 131 19 73 333 205 13 677 32 43 22 .300 .379 .679vs. NL .239 9 297 28 71 13 2 6 26 24 4 67 3 6 2 .301 .357 .658March .306 1 36 10 11 4 2 1 10 8 1 11 0 1 1 .422 .611 1.033 April .229 24 818 87 187 37 3 21 80 51 4 213 13 7 6 .283 .358 .641May .233 30 978 127 228 43 8 21 119 86 6 217 12 19 8 .300 .358 .658June .261 28 944 117 246 41 7 29 114 58 4 215 8 18 9 .308 .411 .719July .263 12 426 37 112 19 1 7 36 26 2 88 2 4 0 .306 .362 .667
Hitters Notes
AL BATTING LEADERS
Player AVG
1. Adrian Beltre (TEX) ............. .337 (104x309)2. Jose Altuve (HOU) .............. .335 (130x388)3. Robinson Cano (SEA) ....... .334 (118x353)
4. Lonnie Chisenhall (CLE) ....... .328 (86x262)5. Victor Martinez (DET)............ .328 (99x302)
AL HITS LEADERS
Player HITS
1. Jose Altuve (HOU) .................................1302. Robinson Cano (SEA) ..........................118
3. Melky Cabrera (TOR) .............................1174. Adam Jones (BAL).................................1165. Ian Kinsler (DET) ....................................115

8/12/2019 2014 Mid-Season Report
http://slidepdf.com/reader/full/2014-mid-season-report 9/80
7 - 2014 SEATTLE MARINERS MID-SEASON REPORT
• Road Hitting Streak - Had a 21-game road hitting streak May 3-June 20; hitting .419 (36x86) with 13 runs, 6doubles, 1 triple, 1 home runs and 15 RBI.
• On Base Streak - Reached base safely (via hit or walk) in 31 straight games (27 via hit), April 20-May 24; hit.368 (45x121) with 18 runs, 9 doubles, a home run and 20 RBI…was tied for the 20th-longest streak in clubhistory.
• Hitting Streaks - Had two hitting streaks of 9+ games: 10 game streak June 2-12, hitting .368 (14x38) with 6
runs, 3 doubles, 1 home run and 4 RBI and a 9-game streak April 20-May 1, hitting .371 (13x35) with 5 runs,4 doubles and 6 RBI.• Unfinished Business - Went into the break with an active 7-game hitting streak, hitting .500 (14x28) with 2
runs, 2 doubles, one home run and 6 RBI.• Mariners Wins - Hit .372 (70x188) with 39 runs, 14 doubles, 1 triple, 4 home runs, 41 RBI and a .966 OPS in
Mariners wins; .291 (48x165) in losses.• First Mariners Homers - Hit his first Mariners home run on April 17 at Texas (3-run HR off Tanner Scheppers);
hit his first Safeco Field home run on June 11 vs. New York’s Masahiro Tanaka (2-run HR in bottom of 9th in-ning).
• Can’t Keep Him Down - Missed four games (May 29-June 1) with a left hand contusion…first time since 2006to not start in four consecutive team.
• Mariners Debut - Went 2-for-4 in his Mariners debut and scored his 800th career run on March 31 at Los Angeles-AL (Opening Day).
Mid-Season Splits AVG G AB R H 2B 3B HR RBI BB IBB SO HBP SB CS OBP SLG OPS
Total .334 91 353 49 118 22 1 7 57 33 9 45 3 7 2 .393 .462 .855vs. Left .309 - 136 - 42 8 0 2 22 11 3 17 0 1 0 .356 .412 .767vs. Right .350 - 217 - 76 14 1 5 35 22 6 28 3 6 2 .416 .493 .909Home .333 46 171 22 57 9 0 4 27 13 4 22 1 2 0 .380 .456 .836 Away .335 45 182 27 61 13 1 3 30 20 5 23 2 5 2 .405 .467 .872RISP .368 - 76 - 28 8 1 5 49 13 9 9 2 1 0 .457 .697 1.155Bases Loaded .333 - 6 - 2 1 0 0 5 0 0 0 0 0 0 .286 .500 .786March .500 1 4 1 2 1 0 0 0 1 1 0 0 0 0 .600 .750 1.350 April .287 24 94 10 27 4 0 1 12 7 2 16 0 2 1 .333 .362 .695May .355 27 107 13 38 6 1 1 19 8 4 10 0 2 0 .393 .458 .851June .307 27 101 19 31 6 0 4 17 12 1 14 2 1 1 .391 .485 .876July .426 12 47 6 20 5 0 1 9 5 1 5 1 2 0 .491 .596 1.086
#9 - ENDY CHAVEZ, OF• Moving On Up - Began the season with AAA Tacoma, appearing in 37 games before being selected by Seattle on May 30.• Helping Hand - Appeared in 37 games with Seattle, making 29 starts (RF-13, LF-6, CF-3, DH-7), hitting .260 (33x127) with 14 runs, 6 doubles, 2 triples, 1
home run and 8 RBI.• Finishing Strong - Hit .300 (18x60) with 9 runs, 1 double, 2 triples, 1 HR and 6 RBI in his final 16 games of the first half; hit .224 (15x67) in his first 21 games• Put Him In - Seattle was 22-15 when he appeared in a game, 18-11 in games that he started, 15-11 in 26 starts batting leadoff.• Mini Streak - Had a season-high 5-game hitting streak June 15-20, hitting .333 (7x21).• The Igniter - Reached safely in first plate appearance in 13 of 26 starts batting leadoff (.458/11x24, 2 BB, 4 2B).• One-Time Pop - Hit a home run on June 27 vs. Cleveland, his first home run in 265 plate appearances (since May 30, 2013 at SD).• Minors - AAA Tacoma: Hit .272 (31x114) with 2 doubles and 6 RBI in 37 games, appearing at all 3 outfield positions (LF-5, CF-10, RF-8) and DH (11 G).
Mid-Season Splits AVG G AB R H 2B 3B HR RBI BB IBB SO HBP SB CS OBP SLG OPS
Total .260 37 127 14 33 6 2 1 8 6 0 12 0 1 1 .289 .362 .651vs. Left .000 - 17 - 0 0 0 0 0 1 0 0 0 0 0 .056 .000 .056vs. Right .300 - 110 - 33 6 2 1 8 5 0 12 0 1 1 .325 .418 .743Home .288 21 73 7 21 3 2 1 6 3 0 6 0 1 0 .312 .425 .736 Away .222 16 54 7 12 3 0 0 2 3 0 6 0 0 1 .259 .278 .536RISP .138 - 29 - 4 0 1 0 6 1 0 5 0 0 0 .156 .207 .363Bases Loaded .500 - 2 - 1 0 1 0 3 0 0 1 0 0 0 .500 1.500 2.000May .125 2 8 0 1 1 0 0 0 0 0 0 0 0 0 .125 .250 .375June .277 25 83 9 23 4 2 1 7 3 0 8 0 1 1 .299 .410 .708July .250 10 36 5 9 1 0 0 1 3 0 4 0 0 0 .300 .278 .578
#27 - COREY HART, DH• The Basics - Appeared in 45 games, all starts (DH-42, RF-2, 1B-1) while hitting .214 (36x168) with 13 runs, 6 doubles, 5 home runs and 18 RBI.• Missed Time - Spent time on the 15-day disabled list May 20-July 3 with a strained left hamstring.• Getting Healthy - In a rehab assignment with AAA Tacoma, hit .297 (11x37) with 3 doubles, 1 triple, 1 home run and 4 RBI.• Multi-Pop - Had his 15th career multi-home run game on April 8 vs. Los Angeles-AL, including a season-high 4 RBI.• Mini Streak - Had a season-high 7-game hitting streak April 15-23, batting .407 (11x27) with 2 runs, 3 doubles, 1 home run and 2 RBI.
Mid-Season Splits AVG G AB R H 2B 3B HR RBI BB IBB SO HBP SB CS OBP SLG OPS
Total .214 45 168 13 36 6 0 5 18 12 1 38 6 2 0 .289 .339 .628vs. Left .190 - 58 - 11 1 0 1 10 4 1 14 6 0 0 .304 .259 .563
vs. Right .227 - 110 - 25 5 0 4 8 8 0 24 0 2 0 .280 .382 .661Home .213 22 75 5 16 1 0 2 8 6 1 18 4 0 0 .306 .307 .613 Away .215 23 93 8 20 5 0 3 10 6 0 20 2 2 0 .275 .366 .640RISP .256 - 39 - 10 1 0 1 14 5 1 9 2 2 0 .362 .359 .721Bases Loaded .000 - 3 - 0 0 0 0 1 0 0 1 0 0 0 .000 .000 .000 April .240 20 75 8 18 4 0 4 9 7 1 17 4 0 0 .337 .453 .791May .172 17 64 4 11 1 0 1 8 4 0 14 2 2 0 .243 .234 .477July .241 8 29 1 7 1 0 0 1 1 0 7 0 0 0 .258 .276 .534
Hitters Notes
AL MULTI-HIT GAMES
Player MULTI-HIT G
1. Jose Altuve (HOU) ...................................402. Robinson Cano (SEA) ............................37
Ian Kinsler (DET) ......................................374. Nick Markakis (BAL) ................................36
5. Mekly Cabrera (TOR) ...............................34 Adam Jones (BAL)...................................347. Adrian Beltre (TEX) ..................................33 Alex Rios (TEX) ........................................339. Michael Brantley (CLE) ............................3110. Kyle Seager (SEA)..................................30
J.J. Hardy (BAL) ......................................30 Howie Kendrick (LAA) .............................30 Victor Martinez (DET)...............................30 Albert Pujols (LAA)...................................30 Mike Trout (LAA) ......................................30
8/12/2019 2014 Mid-Season Report
http://slidepdf.com/reader/full/2014-mid-season-report 10/80
8 - 2014 SEATTLE MARINERS MID-SEASON REPORT
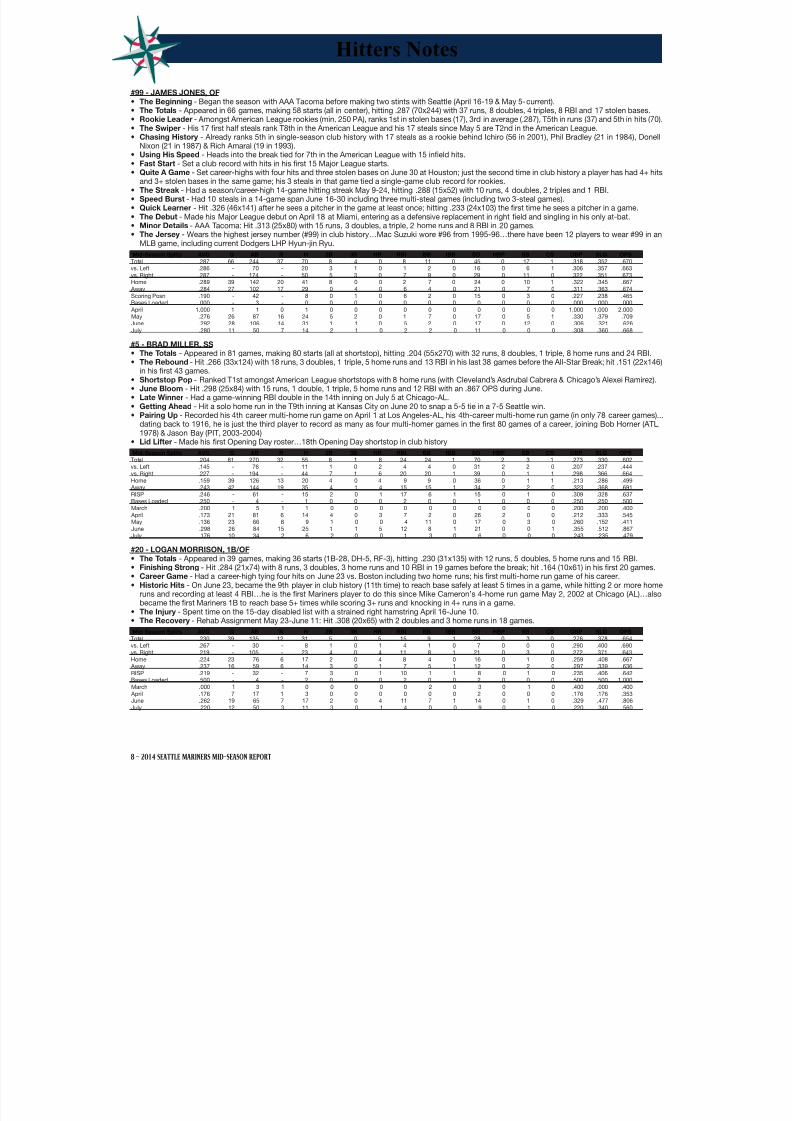
#99 - JAMES JONES, OF• The Beginning - Began the season with AAA Tacoma before making two stints with Seattle (April 16-19 & May 5-current).• The Totals - Appeared in 66 games, making 58 starts (all in center), hitting .287 (70x244) with 37 runs, 8 doubles, 4 triples, 8 RBI and 17 stolen bases.• Rookie Leader - Amongst American League rookies (min. 250 PA), ranks 1st in stolen bases (17), 3rd in average (.287), T5th in runs (37) and 5th in hits (70)• The Swiper - His 17 first half steals rank T8th in the American League and his 17 steals since May 5 are T2nd in the American League.• Chasing History - Already ranks 5th in single-season club history with 17 steals as a rookie behind Ichiro (56 in 2001), Phil Bradley (21 in 1984), Donell
Nixon (21 in 1987) & Rich Amaral (19 in 1993).• Using His Speed - Heads into the break tied for 7th in the American League with 15 infield hits.• Fast Start - Set a club record with hits in his first 15 Major League starts.• Quite A Game - Set career-highs with four hits and three stolen bases on June 30 at Houston; just the second time in club history a player has had 4+ hits
and 3+ stolen bases in the same game; his 3 steals in that game tied a single-game club record for rookies.• The Streak - Had a season/career-high 14-game hitting streak May 9-24, hitting .288 (15x52) with 10 runs, 4 doubles, 2 triples and 1 RBI.• Speed Burst - Had 10 steals in a 14-game span June 16-30 including three multi-steal games (including two 3-steal games).• Quick Learner - Hit .326 (46x141) after he sees a pitcher in the game at least once; hitting .233 (24x103) the first time he sees a pitcher in a game.• The Debut - Made his Major League debut on April 18 at Miami, entering as a defensive replacement in right field and singling in his only at-bat.• Minor Details - AAA Tacoma: Hit .313 (25x80) with 15 runs, 3 doubles, a triple, 2 home runs and 8 RBI in 20 games.• The Jersey - Wears the highest jersey number (#99) in club history…Mac Suzuki wore #96 from 1995-96…there have been 12 players to wear #99 in an
MLB game, including current Dodgers LHP Hyun-jin Ryu.
Mid-Season Splits AVG G AB R H 2B 3B HR RBI BB IBB SO HBP SB CS OBP SLG OPS
Total .287 66 244 37 70 8 4 0 8 11 0 45 0 17 1 .318 .352 .670vs. Left .286 - 70 - 20 3 1 0 1 2 0 16 0 6 1 .306 .357 .663vs. Right .287 - 174 - 50 5 3 0 7 9 0 29 0 11 0 .322 .351 .673Home .289 39 142 20 41 8 0 0 2 7 0 24 0 10 1 .322 .345 .667 Away .284 27 102 17 29 0 4 0 6 4 0 21 0 7 0 .311 .363 .674Scoring Posn .190 - 42 - 8 0 1 0 6 2 0 15 0 3 0 .227 .238 .465
Bases Loaded .000 - 3 - 0 0 0 0 0 0 0 0 0 0 0 .000 .000 .000 April 1.000 1 1 0 1 0 0 0 0 0 0 0 0 0 0 1.000 1.000 2.000May .276 26 87 16 24 5 2 0 1 7 0 17 0 5 1 .330 .379 .709June .292 28 106 14 31 1 1 0 5 2 0 17 0 12 0 .306 .321 .626July .280 11 50 7 14 2 1 0 2 2 0 11 0 0 0 .308 .360 .668
#5 - BRAD MILLER, SS• The Totals - Appeared in 81 games, making 80 starts (all at shortstop), hitting .204 (55x270) with 32 runs, 8 doubles, 1 triple, 8 home runs and 24 RBI.• The Rebound - Hit .266 (33x124) with 18 runs, 3 doubles, 1 triple, 5 home runs and 13 RBI in his last 38 games before the All-Star Break; hit .151 (22x146
in his first 43 games.• Shortstop Pop - Ranked T1st amongst American League shortstops with 8 home runs (with Cleveland’s Asdrubal Cabrera & Chicago’s Alexei Ramirez).• June Bloom - Hit .298 (25x84) with 15 runs, 1 double, 1 triple, 5 home runs and 12 RBI with an .867 OPS during June.• Late Winner - Had a game-winning RBI double in the 14th inning on July 5 at Chicago-AL.• Getting Ahead - Hit a solo home run in the T9th inning at Kansas City on June 20 to snap a 5-5 tie in a 7-5 Seattle win.• Pairing Up - Recorded his 4th career multi-home run game on April 1 at Los Angeles-AL, his 4th-career multi-home run game (in only 78 career games)..
dating back to 1916, he is just the third player to record as many as four multi-homer games in the first 80 games of a career, joining Bob Horner (ATL,1978) & Jason Bay (PIT, 2003-2004)
• Lid Lifter - Made his first Opening Day roster…18th Opening Day shortstop in club history
Mid-Season Splits AVG G AB R H 2B 3B HR RBI BB IBB SO HBP SB CS OBP SLG OPSTotal .204 81 270 32 55 8 1 8 24 24 1 70 2 3 1 .273 .330 .602vs. Left .145 - 76 - 11 1 0 2 4 4 0 31 2 2 0 .207 .237 .444vs. Right .227 - 194 - 44 7 1 6 20 20 1 39 0 1 1 .298 .366 .664Home .159 39 126 13 20 4 0 4 9 9 0 36 0 1 1 .213 .286 .499 Away .243 42 144 19 35 4 1 4 15 15 1 34 2 2 0 .323 .368 .691RISP .246 - 61 - 15 2 0 1 17 6 1 15 0 1 0 .309 .328 .637Bases Loaded .250 - 4 - 1 0 0 0 2 0 0 1 0 0 0 .250 .250 .500March .200 1 5 1 1 0 0 0 0 0 0 0 0 0 0 .200 .200 .400 April .173 21 81 6 14 4 0 3 7 2 0 26 2 0 0 .212 .333 .545May .136 23 66 8 9 1 0 0 4 11 0 17 0 3 0 .260 .152 .411June .298 26 84 15 25 1 1 5 12 8 1 21 0 0 1 .355 .512 .867July .176 10 34 2 6 2 0 0 1 3 0 6 0 0 0 .243 .235 .479
#20 - LOGAN MORRISON, 1B/OF• The Totals - Appeared in 39 games, making 36 starts (1B-28, DH-5, RF-3), hitting .230 (31x135) with 12 runs, 5 doubles, 5 home runs and 15 RBI.• Finishing Strong - Hit .284 (21x74) with 8 runs, 3 doubles, 3 home runs and 10 RBI in 19 games before the break; hit .164 (10x61) in his first 20 games.• Career Game - Had a career-high tying four hits on June 23 vs. Boston including two home runs; his first multi-home run game of his career.• Historic Hits - On June 23, became the 9th player in club history (11th time) to reach base safely at least 5 times in a game, while hitting 2 or more home
runs and recording at least 4 RBI…he is the first Mariners player to do this since Mike Cameron’s 4-home run game May 2, 2002 at Chicago (AL)…also
became the first Mariners 1B to reach base 5+ times while scoring 3+ runs and knocking in 4+ runs in a game.• The Injury - Spent time on the 15-day disabled list with a strained right hamstring April 16-June 10.• The Recovery - Rehab Assignment May 23-June 11: Hit .308 (20x65) with 2 doubles and 3 home runs in 18 games.
Mid-Season Splits AVG G AB R H 2B 3B HR RBI BB IBB SO HBP SB CS OBP SLG OPS
Total .230 39 135 12 31 5 0 5 15 9 1 28 0 3 0 .276 .378 .654vs. Left .267 - 30 - 8 1 0 1 4 1 0 7 0 0 0 .290 .400 .690vs. Right .219 - 105 - 23 4 0 4 11 8 1 21 0 3 0 .272 .371 .643Home .224 23 76 6 17 2 0 4 8 4 0 16 0 1 0 .259 .408 .667 Away .237 16 59 6 14 3 0 1 7 5 1 12 0 2 0 .297 .339 .636RISP .219 - 32 - 7 3 0 1 10 1 1 8 0 1 0 .235 .406 .642Bases Loaded .500 - 4 - 2 0 0 0 2 0 0 2 0 0 0 .500 .500 1.000March .000 1 3 1 0 0 0 0 0 2 0 3 0 1 0 .400 .000 .400 April .176 7 17 1 3 0 0 0 0 0 0 2 0 0 0 .176 .176 .353June .262 19 65 7 17 2 0 4 11 7 1 14 0 1 0 .329 .477 .806July .220 12 50 3 11 3 0 1 4 0 0 9 0 1 0 .220 .340 .560
Hitters Notes
8/12/2019 2014 Mid-Season Report
http://slidepdf.com/reader/full/2014-mid-season-report 11/80
9 - 2014 SEATTLE MARINERS MID-SEASON REPORT
#55 - MICHAEL SAUNDERS, OF• The Totals - Appeared in 65 games, making 51 starts (RF-42, CF-9) while hitting .276 (54x196) with 31 runs, 7 doubles, 3 triples, 6 home runs and 28 RB• The Injuries - Had two stints on the disabled list: June 12-27 (right AC joint inflammation) and July 11-current (strained left oblique).• Bad Break - Hit .385 (10x26) in the seven games prior to being placed on the 15-day disabled list (July 4-10).• The Producer - From May 16-current, hit .313 (35x112) with 17 runs, 4 doubles, 2 triples, 5 home runs, 21 RBI & an .873 OPS in 31 games.• Man of May - Hit .318 (28x88) with 17 runs, 4 doubles, 2 triples, 2 home runs, 18 RBI and an .834 OPS in 26 games in May.
• Historic Versatility - Started May 5 vs. Oakland in center field, moved to left in the 8th, then to right field in the 9th…he’s just the third Mariners player eveto play all three outfield spots in one game…he joined Rich Amaral (Sept. 11, 1992 vs. MIN) and Stan Javier (April 21, 2001 vs. LAA).• Getting Close - During rehab assignment with AAA Tacoma hit .450 (9x20) with 5 runs, 2 doubles, a triple, a home run and 7 RBI in 5 games.• Blastoff - Hit a leadoff home run against Texas’ Colby Lewis on April 26.
Mid-Season Splits AVG G AB R H 2B 3B HR RBI BB IBB SO HBP SB CS OBP SLG OPS
Total .276 65 196 31 54 7 3 6 28 17 0 50 0 3 4 .327 .434 .761vs. Left .278 - 54 - 15 1 1 0 7 7 0 16 0 0 0 .355 .333 .688vs. Right .275 - 142 - 39 6 2 6 21 10 0 34 0 3 4 .316 .472 .788Home .241 30 79 11 19 3 1 3 11 7 0 29 0 0 1 .299 .418 .717 Away .299 35 117 20 35 4 2 3 17 10 0 21 0 3 3 .346 .444 .791RISP .295 - 44 - 13 4 2 1 21 2 0 13 0 0 0 .300 .545 .845Bases Loaded .500 - 4 - 2 1 0 0 6 0 0 1 0 0 0 .400 .750 1.150March .000 1 3 1 0 0 0 0 1 1 0 1 0 0 0 .200 .000 .200 April .194 20 36 6 7 1 1 1 2 4 0 9 0 1 2 .275 .361 .636May .318 26 88 17 28 4 2 2 18 7 0 18 0 1 1 .357 .477 .834June .200 9 35 4 7 2 0 2 4 1 0 13 0 0 1 .222 .429 .651July .353 9 34 3 12 0 0 1 3 4 0 9 0 1 0 .421 .441 .862
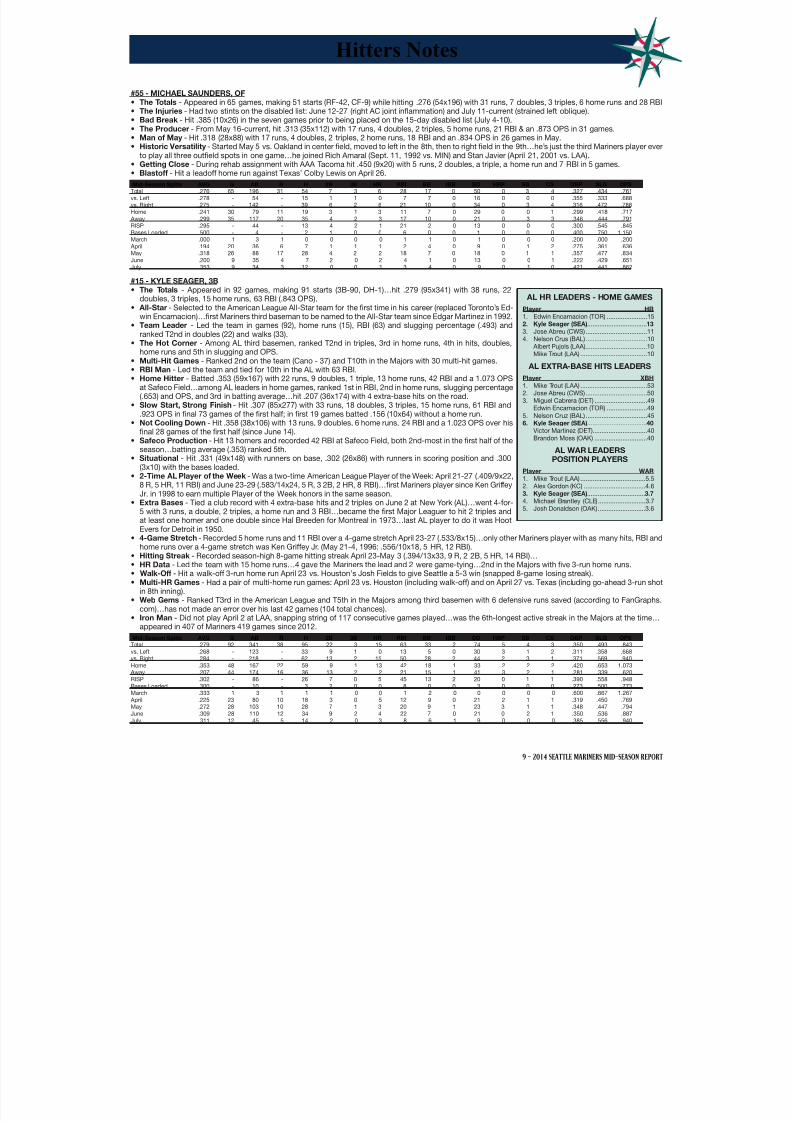
#15 - KYLE SEAGER, 3B• The Totals - Appeared in 92 games, making 91 starts (3B-90, DH-1)…hit .279 (95x341) with 38 runs, 22
doubles, 3 triples, 15 home runs, 63 RBI (.843 OPS).• All-Star - Selected to the American League All-Star team for the first time in his career (replaced Toronto’s Ed-
win Encarnacion)…first Mariners third baseman to be named to the All-Star team since Edgar Martinez in 1992.• Team Leader - Led the team in games (92), home runs (15), RBI (63) and slugging percentage (.493) and
ranked T2nd in doubles (22) and walks (33).• The Hot Corner - Among AL third basemen, ranked T2nd in triples, 3rd in home runs, 4th in hits, doubles,
home runs and 5th in slugging and OPS.• Multi-Hit Games - Ranked 2nd on the team (Cano - 37) and T10th in the Majors with 30 multi-hit games.• RBI Man - Led the team and tied for 10th in the AL with 63 RBI.• Home Hitter - Batted .353 (59x167) with 22 runs, 9 doubles, 1 triple, 13 home runs, 42 RBI and a 1.073 OPS
at Safeco Field…among AL leaders in home games, ranked 1st in RBI, 2nd in home runs, slugging percentage(.653) and OPS, and 3rd in batting average…hit .207 (36x174) with 4 extra-base hits on the road.
• Slow Start, Strong Finish - Hit .307 (85x277) with 33 runs, 18 doubles, 3 triples, 15 home runs, 61 RBI and.923 OPS in final 73 games of the first half; in first 19 games batted .156 (10x64) without a home run.
• Not Cooling Down - Hit .358 (38x106) with 13 runs, 9 doubles, 6 home runs, 24 RBI and a 1.023 OPS over hisfinal 28 games of the first half (since June 14).
• Safeco Production - Hit 13 homers and recorded 42 RBI at Safeco Field, both 2nd-most in the first half of the
season…batting average (.353) ranked 5th.• Situational - Hit .331 (49x148) with runners on base, .302 (26x86) with runners in scoring position and .300
(3x10) with the bases loaded.• 2-Time AL Player of the Week - Was a two-time American League Player of the Week: April 21-27 (.409/9x22,
8 R, 5 HR, 11 RBI) and June 23-29 (.583/14x24, 5 R, 3 2B, 2 HR, 8 RBI)…first Mariners player since Ken GriffeyJr. in 1998 to earn multiple Player of the Week honors in the same season.
• Extra Bases - Tied a club record with 4 extra-base hits and 2 triples on June 2 at New York (AL)…went 4-for-5 with 3 runs, a double, 2 triples, a home run and 3 RBI…became the first Major Leaguer to hit 2 triples andat least one homer and one double since Hal Breeden for Montreal in 1973…last AL player to do it was HootEvers for Detroit in 1950.
• 4-Game Stretch - Recorded 5 home runs and 11 RBI over a 4-game stretch April 23-27 (.533/8x15)…only other Mariners player with as many hits, RBI andhome runs over a 4-game stretch was Ken Griffey Jr. (May 21-4, 1996: .556/10x18, 5 HR, 12 RBI).
• Hitting Streak - Recorded season-high 8-game hitting streak April 23-May 3 (.394/13x33, 9 R, 2 2B, 5 HR, 14 RBI)…• HR Data - Led the team with 15 home runs…4 gave the Mariners the lead and 2 were game-tying…2nd in the Majors with five 3-run home runs.• Walk-Off - Hit a walk-off 3-run home run April 23 vs. Houston’s Josh Fields to give Seattle a 5-3 win (snapped 8-game losing streak).• Multi-HR Games - Had a pair of multi-home run games: April 23 vs. Houston (including walk-off) and on April 27 vs. Texas (including go-ahead 3-run sho
in 8th inning).
• Web Gems - Ranked T3rd in the American League and T5th in the Majors among third basemen with 6 defensive runs saved (according to FanGraphscom)…has not made an error over his last 42 games (104 total chances).
• Iron Man - Did not play April 2 at LAA, snapping string of 117 consecutive games played…was the 6th-longest active streak in the Majors at the time…appeared in 407 of Mariners 419 games since 2012.
Mid-Season Splits AVG G AB R H 2B 3B HR RBI BB IBB SO HBP SB CS OBP SLG OPS
Total .279 92 341 38 95 22 3 15 63 33 2 74 5 4 3 .350 .493 .843vs. Left .268 - 123 - 33 9 1 0 13 5 0 30 3 1 2 .311 .358 .668vs. Right .284 - 218 - 62 13 2 15 50 28 2 44 2 3 1 .371 .569 .940Home .353 48 167 22 59 9 1 13 42 18 1 33 2 2 2 .420 .653 1.073 Away .207 44 174 16 36 13 2 2 21 15 1 41 3 2 1 .281 .339 .620RISP .302 - 86 - 26 7 0 5 45 13 2 20 0 1 1 .390 .558 .948Bases Loaded .300 - 10 - 3 2 0 0 8 0 0 3 0 0 0 .273 .500 .773March .333 1 3 1 1 1 0 0 1 2 0 0 0 0 0 .600 .667 1.267 April .225 23 80 10 18 3 0 5 12 9 0 21 2 1 1 .319 .450 .769May .272 28 103 10 28 7 1 3 20 9 1 23 3 1 1 .348 .447 .794June .309 28 110 12 34 9 2 4 22 7 0 21 0 2 1 .350 .536 .887July .311 12 45 5 14 2 0 3 8 6 1 9 0 0 0 .385 .556 .940
Hitters Notes
AL HR LEADERS - HOME GAMES
Player HR
1. Edwin Encarnacion (TOR) .......................152. Kyle Seager (SEA)..................................13
3. Jose Abreu (CWS) ...................................114. Nelson Crus (BAL) ...................................10 Albert Pujols (LAA)...................................10 Mike Trout (LAA) ......................................10
AL EXTRA-BASE HITS LEADERS
Player XBH
1. Mike Trout (LAA) ......................................532. Jose Abreu (CWS) ...................................503. Miguel Cabrera (DET) ..............................49 Edwin Encarnacion (TOR) .......................495. Nelson Cruz (BAL) ...................................456. Kyle Seager (SEA)..................................40
Victor Martinez (DET)...............................40 Brandon Moss (OAK) ..............................40
AL WAR LEADERSPOSITION PLAYERS
Player WAR
1. Mike Trout (LAA) .....................................5.52. Alex Gordon (KC) ...................................4.63. Kyle Seager (SEA).................................3.7
4. Michael Brantley (CLE) ...........................3.75. Josh Donaldson (OAK) ...........................3.6
8/12/2019 2014 Mid-Season Report
http://slidepdf.com/reader/full/2014-mid-season-report 12/80
10 - 2014 SEATTLE MARINERS MID-SEASON REPORT
#17 - JUSTIN SMOAK, 1B• Wrap Up - Appeared in 65 games, making 60 starts (all at first base), hitting .202 (45x223) with 26 runs, 12 doubles, 7 home runs and 29 RBI.• Early Iron Man - Appeared in the first 63 games (58 starts) before appearing in just 2 of the final 32 games due to injury, rehab assignment & option to AAA• Fast Start - In his first 38 games hit .246 (34x138) with 19 runs, 9 doubles, 6 home runs and 26 RBI in his first 38 games; .129 (11x85) with 3 doubles & 1
home run in final 27.• RISP - Hit .323 (10x31) with 3 doubles, 2 home runs and 19 RBI with runners in scoring position in his first 22 games; .040 (1x25) in his final 19 games.
• Getting Healthy - Was recalled from his rehab assignment, removed from the disabled list and optioned to AAA Tacoma on July 4.• The Injury - Placed on the 15-day disabled list with a strained left quad from June 11 (retro to June 10) through July 11.• The Opener - Went 2-for-4 with 3 runs, double, a home run & 3 RBI on Opening Night March 31 at Los Angeles-AL…he is the only Mariners player in club
history with 3+ runs & RBI in an Opening Day.• Minor Numbers - AAA Tacoma: .284 (21x74) with 13 runs, 4 doubles, 3 home runs and 11 RBI in 19 games between rehab assignment and option.
Mid-Season Splits AVG G AB R H 2B 3B HR RBI BB IBB SO HBP SB CS OBP SLG OPS
Total .202 65 223 26 45 12 0 7 29 21 0 61 2 0 1 .274 .350 .624vs. Left .224 - 98 - 22 7 0 2 13 4 0 27 1 0 1 .262 .357 .619vs. Right .184 - 125 - 23 5 0 5 16 17 0 34 1 0 0 .283 .344 .627Home .156 31 109 13 17 4 0 4 11 9 0 32 1 0 0 .227 .303 .530 Away .246 34 114 13 28 8 0 3 18 12 0 29 1 0 1 .318 .395 .713RISP .196 - 56 - 11 3 0 2 20 6 0 18 0 0 0 .266 .357 .623Bases Loaded .667 - 3 - 2 2 0 0 5 0 0 1 0 0 0 .667 1.333 2.000March .500 1 4 3 2 1 0 1 3 1 0 1 0 0 0 .600 1.500 2.100 April .238 24 84 9 20 5 0 2 12 6 0 25 1 0 1 .293 .369 .663May .200 30 110 13 22 6 0 4 14 13 0 26 1 0 0 .288 .364 .652June .056 8 18 1 1 0 0 0 0 1 0 8 0 0 0 .105 .056 .161July .000 2 7 0 0 0 0 0 0 0 0 1 0 0 0 .000 .000 .000
#2 - JESUS SUCRE, C
• Just Got Here - Began the season with AAA Tacoma before being recalled on July 8 (John Buck DFA).• A Taste - Appeared in two games at catcher, including one start with Seattle, with one hit in five at-bats.• His Start - AAA Tacoma: Hit .274 (48x175) with 13 runs, 7 doubles, 1 triple, 2 home runs and 16 RBI in 48 games.• Opening Eyes - In his final 10 games with Tacoma, hit .375 (15x40) with 5 doubles, a home run and 2 RBI.• Thou Shall Not Steal - Threw out 21 of the 41 attempted base stealers during his time in the minors.
Mid-Season Splits AVG G AB R H 2B 3B HR RBI BB IBB SO HBP SB CS OBP SLG OPS
Total .200 2 5 0 1 0 0 0 0 0 0 1 0 0 0 .200 .200 .400vs. Left -- - - - - - - - - - - - - - - -- -- --vs. Right .200 - 5 - 1 0 0 0 0 0 0 1 0 0 0 .200 .200 .400Home .200 2 5 0 1 0 0 0 0 0 0 1 0 0 0 .200 .200 .400 Away -- - - - - - - - - - - - - - - -- -- --RISP .000 - 1 - 0 0 0 0 0 0 0 1 0 0 0 .000 .000 .000Bases Loaded -- - - - - - - - - - - - - - - -- -- --July .200 2 5 0 1 0 0 0 0 0 0 1 0 0 0 .200 .200 .400
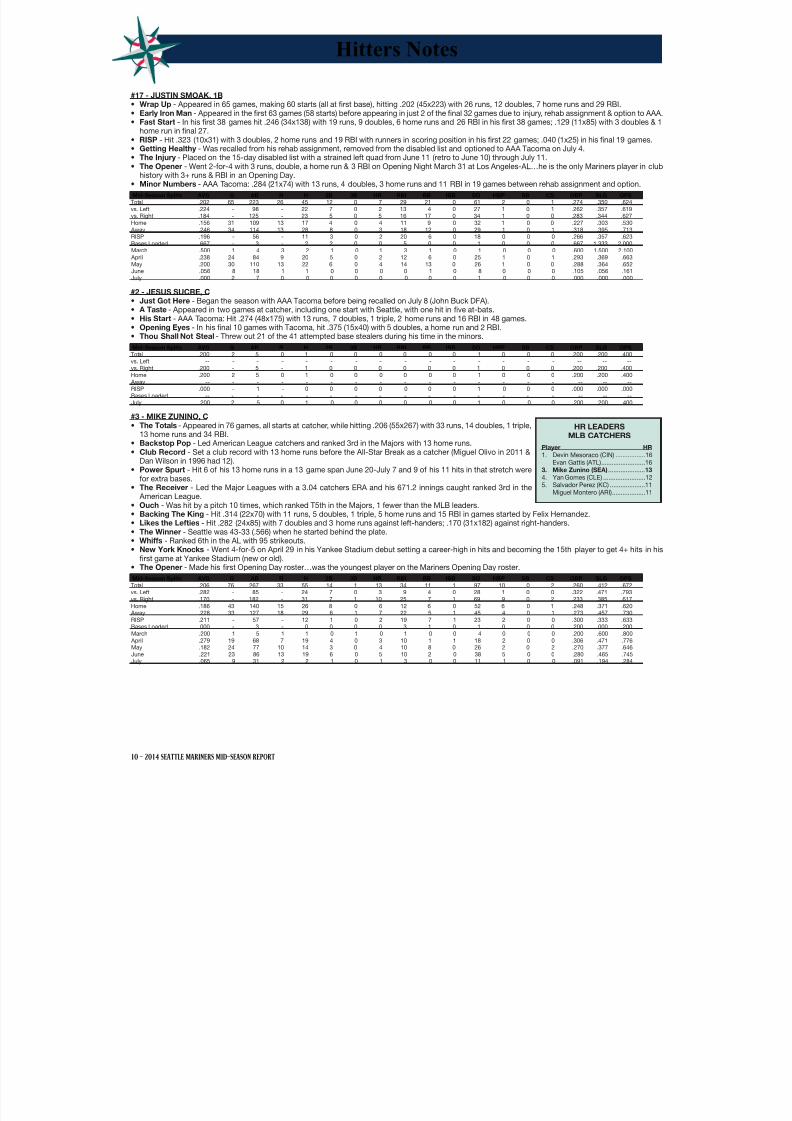
#3 - MIKE ZUNINO, C• The Totals - Appeared in 76 games, all starts at catcher, while hitting .206 (55x267) with 33 runs, 14 doubles, 1 triple,
13 home runs and 34 RBI.• Backstop Pop - Led American League catchers and ranked 3rd in the Majors with 13 home runs.
• Club Record - Set a club record with 13 home runs before the All-Star Break as a catcher (Miguel Olivo in 2011 &Dan Wilson in 1996 had 12).
• Power Spurt - Hit 6 of his 13 home runs in a 13 game span June 20-July 7 and 9 of his 11 hits in that stretch werefor extra bases.
• The Receiver - Led the Major Leagues with a 3.04 catchers ERA and his 671.2 innings caught ranked 3rd in the American League.
• Ouch - Was hit by a pitch 10 times, which ranked T5th in the Majors, 1 fewer than the MLB leaders.• Backing The King - Hit .314 (22x70) with 11 runs, 5 doubles, 1 triple, 5 home runs and 15 RBI in games started by Felix Hernandez.• Likes the Lefties - Hit .282 (24x85) with 7 doubles and 3 home runs against left-handers; .170 (31x182) against right-handers.• The Winner - Seattle was 43-33 (.566) when he started behind the plate.• Whiffs - Ranked 6th in the AL with 95 strikeouts.• New York Knocks - Went 4-for-5 on April 29 in his Yankee Stadium debut setting a career-high in hits and becoming the 15th player to get 4+ hits in his
first game at Yankee Stadium (new or old).• The Opener - Made his first Opening Day roster…was the youngest player on the Mariners Opening Day roster.
Mid-Season Splits AVG G AB R H 2B 3B HR RBI BB IBB SO HBP SB CS OBP SLG OPS
Total .206 76 267 33 55 14 1 13 34 11 1 97 10 0 2 .260 .412 .672vs. Left .282 - 85 - 24 7 0 3 9 4 0 28 1 0 0 .322 .471 .793
vs. Right .170 - 182 - 31 7 1 10 25 7 1 69 9 0 2 .233 .385 .617Home .186 43 140 15 26 8 0 6 12 6 0 52 6 0 1 .248 .371 .620 Away .228 33 127 18 29 6 1 7 22 5 1 45 4 0 1 .273 .457 .730RISP .211 - 57 - 12 1 0 2 19 7 1 23 2 0 0 .300 .333 .633Bases Loaded .000 - 3 - 0 0 0 0 3 1 0 1 0 0 0 .200 .000 .200March .200 1 5 1 1 0 1 0 1 0 0 4 0 0 0 .200 .600 .800 April .279 19 68 7 19 4 0 3 10 1 1 18 2 0 0 .306 .471 .776May .182 24 77 10 14 3 0 4 10 8 0 26 2 0 2 .270 .377 .646June .221 23 86 13 19 6 0 5 10 2 0 38 5 0 0 .280 .465 .745July .065 9 31 2 2 1 0 1 3 0 0 11 1 0 0 .091 .194 .284
Hitters Notes
HR LEADERSMLB CATCHERS
Player HR
1. Devin Mesoraco (CIN) .................16 Evan Gattis (ATL) .........................163. Mike Zunino (SEA) .....................13
4. Yan Gomes (CLE) ........................125. Salvador Perez (KC) ....................11 Miguel Montero (ARI) ...................11

8/12/2019 2014 Mid-Season Report
http://slidepdf.com/reader/full/2014-mid-season-report 13/80
11 - 2014 SEATTLE MARINERS MID-SEASON REPORT
Hitters Notes
Additional Position Players:
ABRAHAM ALMONTE, OF• The Beginning - Appeared in 27 games, making 25 starts, all in center field and appeared in one game as a pinch-runner/designated hitter.• The Opener - Made his first Opening Day roster, starting in center field and batting leadoff on Opening Day in Anaheim March 31.• Slow Start - Hit .198 (21x106) with 10 runs, 5 doubles, 1 triple, 1 home run, 8 RBI and 40 strikeouts.• Whiffs
- His 40 strikeouts from the start of the season until May 4th ranked T3rd in the Majors before being optioned.• The Reset Button - Was optioned to AAA Tacoma post-game on May 4th.• The Minors - AAA Tacoma: Hit .255 (59x231) with 33 runs, 6 doubles, 3 triples, 5 home run and 25 RBI in 59 games.• Getting Up To Speed - With Tacoma, hit .302 (38x126) in the final 33 games before the break; hit .200 (21x105) during his first 26 games with the Rainiers
JOHN BUCK, C• Goodbye - Designated for assignment (Jesus Sucre recalled) on July 8…released on July 15.• Wrap-Up - Appeared in 27 games, making 24 starts (C-19, DH-5) and hitting .226 (19x84) with 9 runs, 2 doubles, 1 home run and 6 RBI.• Solid Stretch - Hit .381 (8x21) with 6 runs, 1 home run and 3 RBI in seven games between May 31-June 15.• Top Game - Had 3 hits, including game-winning 2-run home run in the 7th inning and scored three runs on June 3 at Atlanta.• Hits In Bunches - Recorded 3 hits including two doubles on May 4 at Houston.• Lid Lifter - Made the Mariners Opening Day roster after signing with Seattle as a free agent on Jan. 16, 2014.
NICK FRANKLIN, INF• Up And Down - Began the season with AAA Tacoma but had two stints with Seattle (April 16-23 & May 20-June 2).• Seattle Stint - Appeared in 17 games with Seattle, making 13 starts (SS-5, 2B-5, DH-2, RF-1).• The Totals - Hit .128 (6x47) with 3 runs, 1 triple, 2 RBI and 21 strikeouts in 17 games.• Slow Start - Recorded hits in four of his 17 games including a triple in his first at-bat against the Rangers after being recalled the first time.
• The Minors - AAA Tacoma: Hit .306 (71x232) with 36 runs, 14 doubles, 1 triple, 9 home runs and 41 RBI in 62 games.• Solid Start - With the Rainiers hit .376 (41x109) with 21 runs, 7 doubles, 7 home runs and 26 RBI in April-May; .244 (30x123) from June 1-July 7.• Versatility - With Rainiers appeared in games at second base (30), shortstop (26), designated hitter (3), right field (1) and left field (1).
COLE GILLESPIE, OF• Departure - Claimed off waivers by Toronto on July 5 after being designated for assignment by Seattle on July 4.• The Totals - Appeared in 34 games, making 22 starts (LF-15, RF-5, DH-2), hitting .254 (18x71) with 9 runs, 2 doubles, 1 home run and 5 RBI.• Heating Up - Hit .341 (15x44) with 7 runs, 2 doubles, 1 home run and 3 RBI in his first 22 games with Seattle; hit .111 (3x27) in his final 12 games.• The Call-Up - Was selected from AAA Tacoma on April 24 (Nick Franklin optioned).• The Start - Began the season with AAA Tacoma batting .362 (21x58) with 5 doubles, 1 triple, 5 home runs and 14 RBI in 16 games before being called up• Oregon Native - One of 11 players from Oregon to appear for the Mariners…joined Stefen Romero as the second and third Oregon State University playe
to appear for Seattle (also: Jamie Burke).
JESUS MONTERO, DH• Cup of Coffee - Appeared in 5 games in only stint with Seattle (June 12-25) and hit .286 (4x14) with a run, a home run and 2 RBI in 4 starts (DH-3, 1B-1).• Come On Up - Recalled from AAA Tacoma on June 12 and optioned back to the minors on June 25.• Getting Ahead - Hit a go-ahead two-run home run June 17 vs. San Diego, his first Major League home run since May 8, 2013 at Pittsburgh.• The Minors - AAA Tacoma: Hit .298 (81x272) with 43 runs, 20 doubles, 1 triple, 11 home runs and 56 RBI in 72 games
STEFEN ROMERO, OF• Taste of Majors - Appeared in 51 games, making 39 starts (RF-29, DH-9, LF-1) while hitting .196 (29x148) with 18 R, 6 2B, 2 3B, 3 HR and 11 RBI.• Going Down - Optioned to AAA Tacoma on June 30 (Taijuan Walker recalled).• Longballs - Of the three home runs hit, one was a game-tying pinch-hit 3-run home run in Atlanta on June 3 and another was a go-head home run (1st
MLB home run) on May 5 against Oakland’s Scott Kazmir.• First Hit - Recorded his first Major League hit in the 4th inning on April 2 at Los Angeles-AL against left-hander Hector Santiago.• Home & Away - He hit .263 (15x57) on the road, and .154 (14x91) at Safeco Field.• Making The Team - Made the Mariners Opening Day roster for the first time in his career…made his MLB debut April 1 at LAA (0x4).• The Minors - AAA Tacoma: Hit .283 (13x46) with 5 runs, 2 doubles, 3 home runs and 9 RBI in 11 games, all in right field.

8/12/2019 2014 Mid-Season Report
http://slidepdf.com/reader/full/2014-mid-season-report 14/80
12 - 2014 SEATTLE MARINERS MID-SEASON REPORT
-- Here is a look at the Mariners pitchers in the first half --#97 - JOE BEIMEL, LHP• The First Half - Heads into the break with a 2-1, 1.50 mark in 32 relief appearances (30.0 IP, 5 ER, 26 H, 11 BB, 17 SO).• League Leaders - Ranks 5th among all American League relief pitchers with a 1.50 ERA (5 ER, 30.0 IP).• The Streak - Did not allow a run in 19.0 consecutive innings pitched from May 2 - July 10 (21 games).• One Up, One Down - Has retired 26 of 31 first batters faced (83.9 %).
• Leave ‘Em Where They Are - Stranded 13 of 17 inherited runners this season (76.5 %).• Clean Sheet - Has allowed runs in just 3 of 32 games this season (2 runs on 4/17 @TEX, 2 runs on 4/26 vs. TEX, 1 run on 7/13 vs. OAK).• Welcome Back - Made his Seattle debut April 1 at Los Angeles (AL), his first big league game since Aug. 22, 2011 (951 days between appearances).• One Out, Zero Batters Faced - Picked David Freese off first base to end the 8th inning prior to throwing a pitch in his debut (4/1/14 at LAA), recording 1/3
of an inning pitched and two stranded runners with no batters faced, and no pitches thrown.• Shut Down the Running Game - Has picked off two runners and had one caught stealing while he was pitching, compared to just one stolen base allowed• Welcome to the Club - Signed by Seattle as a minor league free agent on Jan. 24, 2014.
Mid-Season Splits W L ERA SV SVO G GS CG IP H R ER HR BB SO AVG OBP SLG OPS
Total 2 1 1.50 0 0 32 0 0 30.0 26 5 5 1 11 17 .243 .319 .336 .656
Home 1 0 1.76 0 0 14 0 0 15.1 16 3 3 0 6 6 .276 .344 .379 .723
Away 1 1 1.23 0 0 18 0 0 14.2 10 2 2 0 5 11 .204 .291 .286 .577
Interleague 0 0 0.00 0 0 4 0 0 4.0 3 0 0 0 3 4 .231 .412 .308 .719
April 0 1 3.60 0 0 10 0 0 10.0 11 4 4 0 4 7 .306 .390 .389 .779
May 0 0 0.00 0 0 8 0 0 6.2 6 0 0 0 1 3 .250 .280 .292 .572
June 2 0 0.00 0 0 10 0 0 9.0 5 0 0 0 4 6 .161 .257 .226 .483
July 0 0 2.08 0 0 4 0 0 4.1 4 1 1 1 2 1 .250 .333 .500 .833
#29 - ROENIS ELIAS, LHP• The Totals - Went 7-8 with a 4.54 ERA (57 ER, 113.0 IP) in 19 starts.
• Rookie Record - Set a Mariners rookie club record for most games started (19) before the All-Star break…113.0 IP were tied for 3rd-most before the breakmost since Michael Pineda also recorded 113.0 IP in 2011.
• Good Time for a Break - Was 0-3 with a 10.05 ERA (16 ER, 14.1 IP) over his final 3 starts before the All-Star break…was 7-5, 3.74 ERA in first 16 starts.• 10 K’s in the Bronx - Struck out career-high 10 batters May 1 at New York (AL)…became just the 2nd opposing rookie pitcher to strike out 10 or more in
his Yankee Stadium debut in the past 45 seasons (also: Matt Moore, 9/22/11, 11 K).• Daylight - Went 4-0 with a 2.29 ERA (9 ER, 35.1 IP) in 5 starts in day games.• Shutout - Tossed 3-hit shutout June 1 vs. Detroit…first Mariners rookie pitcher to throw a shutout since Freddy Garcia on Aug. 24, 1999 vs. Detroit.• MLB Debut - Made his Major League debut April 3 at Oakland (5.0,2,1,1,2,4)…had a no-hitter through 4.2 innings…became the 6th starting pitcher in
Mariners history to allow 1 or fewer runs in a MLB debut (Taijuan Walker-8/30/13 at HOU, Blake Beavan-7/3/11 vs. SD, Pat Rice-5/18/91 at NYY, RichDelucia-9/8/90 at BOS, Brian Snyder-5/25/85 vs. DET).
• The Jump - Jumped from Double-A to the Major Leagues making his first career Opening Day roster.
Mid-Season Splits W L ERA SV SVO G GS CG IP H R ER HR BB SO AVG OBP SLG OPS
Total 7 8 4.54 0 0 19 19 1 113.0 103 62 57 14 40 96 .246 .319 .408 .727
Home 2 5 5.14 0 0 10 10 1 56.0 54 35 32 6 19 47 .254 .324 .418 .741
Away 5 3 3.95 0 0 9 9 0 57.0 49 27 25 8 21 49 .238 .315 .398 .713
Day 4 0 2.29 0 0 5 5 1 35.1 25 11 9 4 6 29 .198 .250 .317 .567
Night 3 8 5.56 0 0 14 14 0 77.2 78 51 48 10 34 67 .266 .347 .447 .794
vs. AL 6 7 4.66 0 0 17 17 1 100.1 92 55 52 12 35 85 .247 .318 .408 .726
vs. NL 1 1 3.55 0 0 2 2 0 12.2 11 7 5 2 5 11 .239 .327 .413 .740 April 1 2 3.54 0 0 5 5 0 28.0 24 13 11 2 14 21 .242 .342 .384 .726
May 2 2 4.38 0 0 6 6 0 37.0 37 20 18 5 12 36 .257 .323 .410 .733
June 4 2 3.86 0 0 6 6 1 39.2 28 17 17 5 10 30 .201 .266 .353 .619
July 0 2 11.88 0 0 2 2 0 8.1 14 12 11 2 4 9 .378 .432 .676 1.107
TEAM PITCHING W L ERA SV SVO G CG IP H R ER HR BB SO AVG OBP SLG OPS
Total 51 44 3.16 29 38 95 1 848.2 706 321 298 83 267 741 .226 .290 .353 .644Home 24 26 3.16 13 16 50 1 450.0 367 169 158 42 136 388 .222 .284 .341 .624 Away 27 18 3.16 16 22 45 0 398.2 339 152 140 41 131 353 .230 .298 .368 .665Day 20 12 2.79 13 16 32 1 287.0 205 93 89 28 90 244 .199 .268 .327 .594
Night 31 32 3.35 16 22 63 0 561.2 501 228 209 55 177 497 .239 .301 .366 .668Starter 39 31 3.52 0 0 95 1 577.1 499 242 226 67 166 476 .233 .290 .376 .667Reliever 12 13 2.39 29 38 94 0 271.1 207 79 72 16 101 265 .211 .290 .303 .593vs. AL 47 39 3.14 27 34 86 1 772.2 642 290 270 76 242 672 .226 .289 .354 .643vs. NL 4 5 3.32 2 4 9 0 76.0 64 31 28 7 25 69 .232 .298 .348 .646March 1 0 2.00 0 0 1 0 9.0 6 3 2 1 1 13 .176 .222 .294 .516 April 10 14 3.74 5 8 24 0 211.2 186 99 88 24 92 184 .238 .321 .392 .712May 16 14 3.56 10 13 30 0 268.0 246 113 106 29 76 211 .244 .299 .377 .676June 18 10 2.53 10 13 28 1 249.0 191 70 70 19 68 226 .214 .274 .315 .589July 6 6 2.59 4 4 12 0 111.0 77 36 32 10 30 107 .191 .249 .308 .557
Pitchers Notes
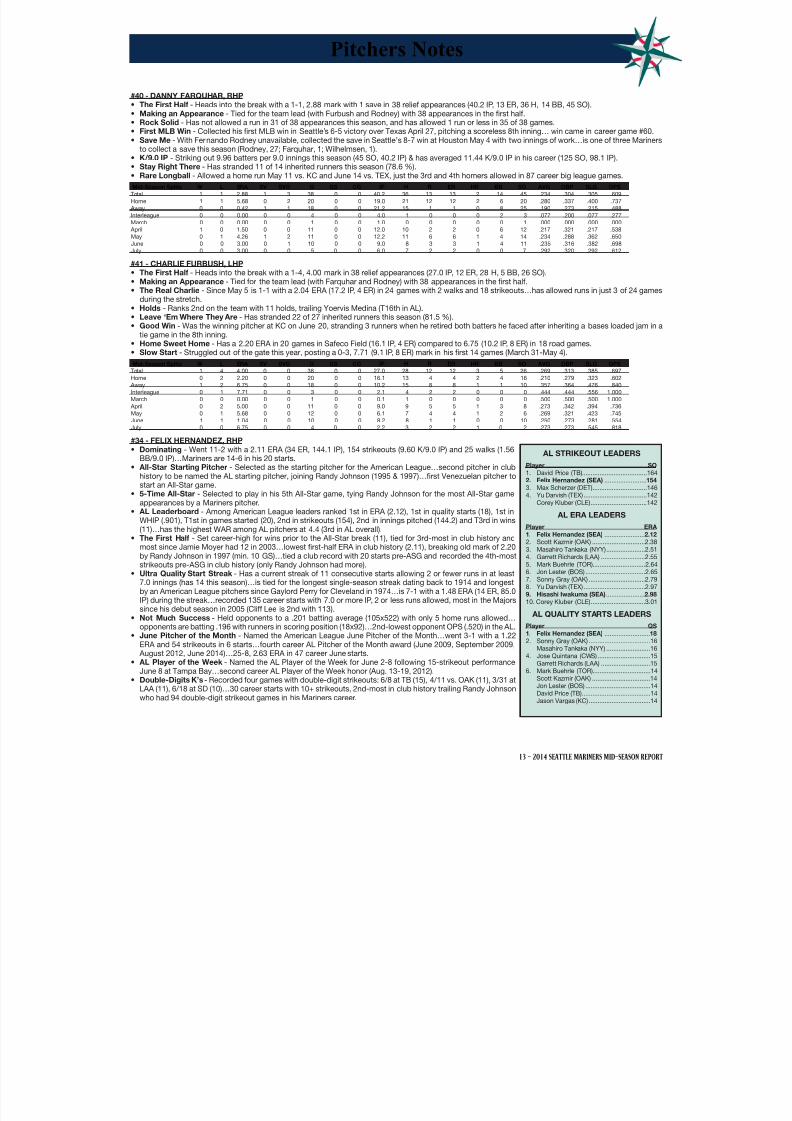
8/12/2019 2014 Mid-Season Report
http://slidepdf.com/reader/full/2014-mid-season-report 15/80
13 - 2014 SEATTLE MARINERS MID-SEASON REPORT
#40 - DANNY FARQUHAR, RHP• The First Half - Heads into the break with a 1-1, 2.88 mark with 1 save in 38 relief appearances (40.2 IP, 13 ER, 36 H, 14 BB, 45 SO).• Making an Appearance - Tied for the team lead (with Furbush and Rodney) with 38 appearances in the first half.• Rock Solid - Has not allowed a run in 31 of 38 appearances this season, and has allowed 1 run or less in 35 of 38 games.• First MLB Win - Collected his first MLB win in Seattle’s 6-5 victory over Texas April 27, pitching a scoreless 8th inning… win came in career game #60.• Save Me - With Fernando Rodney unavailable, collected the save in Seattle’s 8-7 win at Houston May 4 with two innings of work…is one of three Mariners
to collect a save this season (Rodney, 27; Farquhar, 1; Wilhelmsen, 1).• K/9.0 IP - Striking out 9.96 batters per 9.0 innings this season (45 SO, 40.2 IP) & has averaged 11.44 K/9.0 IP in his career (125 SO, 98.1 IP).• Stay Right There - Has stranded 11 of 14 inherited runners this season (78.6 %).• Rare Longball - Allowed a home run May 11 vs. KC and June 14 vs. TEX, just the 3rd and 4th homers allowed in 87 career big league games.
Mid-Season Splits W L ERA SV SVO G GS CG IP H R ER HR BB SO AVG OBP SLG OPS
Total 1 1 2.88 1 3 38 0 0 40.2 36 13 13 2 14 45 .234 .304 .305 .609
Home 1 1 5.68 0 2 20 0 0 19.0 21 12 12 2 6 20 .280 .337 .400 .737
Away 0 0 0.42 1 1 18 0 0 21.2 15 1 1 0 8 25 .190 .273 .215 .488
Interleague 0 0 0.00 0 0 4 0 0 4.0 1 0 0 0 2 3 .077 .200 .077 .277
March 0 0 0.00 0 0 1 0 0 1.0 0 0 0 0 0 1 .000 .000 .000 .000
April 1 0 1.50 0 0 11 0 0 12.0 10 2 2 0 6 12 .217 .321 .217 .538
May 0 1 4.26 1 2 11 0 0 12.2 11 6 6 1 4 14 .234 .288 .362 .650
June 0 0 3.00 0 1 10 0 0 9.0 8 3 3 1 4 11 .235 .316 .382 .698
July 0 0 3.00 0 0 5 0 0 6.0 7 2 2 0 0 7 .292 .320 .292 .612
#41 - CHARLIE FURBUSH, LHP• The First Half - Heads into the break with a 1-4, 4.00 mark in 38 relief appearances (27.0 IP, 12 ER, 28 H, 5 BB, 26 SO).• Making an Appearance - Tied for the team lead (with Farquhar and Rodney) with 38 appearances in the first half.• The Real Charlie - Since May 5 is 1-1 with a 2.04 ERA (17.2 IP, 4 ER) in 24 games with 2 walks and 18 strikeouts…has allowed runs in just 3 of 24 games
during the stretch.• Holds - Ranks 2nd on the team with 11 holds, trailing Yoervis Medina (T16th in AL).• Leave ‘Em Where They Are - Has stranded 22 of 27 inherited runners this season (81.5 %).• Good Win - Was the winning pitcher at KC on June 20, stranding 3 runners when he retired both batters he faced after inheriting a bases loaded jam in a
tie game in the 8th inning.• Home Sweet Home - Has a 2.20 ERA in 20 games in Safeco Field (16.1 IP, 4 ER) compared to 6.75 (10.2 IP, 8 ER) in 18 road games.• Slow Start - Struggled out of the gate this year, posting a 0-3, 7.71 (9.1 IP, 8 ER) mark in his first 14 games (March 31-May 4).
Mid-Season Splits W L ERA SV SVO G GS CG IP H R ER HR BB SO AVG OBP SLG OPS
Total 1 4 4.00 0 0 38 0 0 27.0 28 12 12 3 5 26 .269 .313 .385 .697
Home 0 2 2.20 0 0 20 0 0 16.1 13 4 4 2 4 16 .210 .279 .323 .602
Away 1 2 6.75 0 0 18 0 0 10.2 15 8 8 1 1 10 .357 .364 .476 .840
Interleague 0 1 7.71 0 0 3 0 0 2.1 4 2 2 0 0 0 .444 .444 .556 1.000
March 0 0 0.00 0 0 1 0 0 0.1 1 0 0 0 0 0 .500 .500 .500 1.000
April 0 2 5.00 0 0 11 0 0 9.0 9 5 5 1 3 8 .273 .342 .394 .736
May 0 1 5.68 0 0 12 0 0 6.1 7 4 4 1 2 6 .269 .321 .423 .745
June 1 1 1.04 0 0 10 0 0 8.2 8 1 1 0 0 10 .250 .273 .281 .554
July 0 0 6.75 0 0 4 0 0 2.2 3 2 2 1 0 2 .273 .273 .545 .818
#34 - FELIX HERNANDEZ, RHP
• Dominating - Went 11-2 with a 2.11 ERA (34 ER, 144.1 IP), 154 strikeouts (9.60 K/9.0 IP) and 25 walks (1.56BB/9.0 IP)…Mariners are 14-6 in his 20 starts.
• All-Star Starting Pitcher - Selected as the starting pitcher for the American League…second pitcher in clubhistory to be named the AL starting pitcher, joining Randy Johnson (1995 & 1997)…first Venezuelan pitcher tostart an All-Star game.
• 5-Time All-Star - Selected to play in his 5th All-Star game, tying Randy Johnson for the most All-Star gameappearances by a Mariners pitcher.
• AL Leaderboard - Among American League leaders ranked 1st in ERA (2.12), 1st in quality starts (18), 1st inWHIP (.901), T1st in games started (20), 2nd in strikeouts (154), 2nd in innings pitched (144.2) and T3rd in wins(11)…has the highest WAR among AL pitchers at 4.4 (3rd in AL overall).
• The First Half - Set career-high for wins prior to the All-Star break (11), tied for 3rd-most in club history andmost since Jamie Moyer had 12 in 2003…lowest first-half ERA in club history (2.11), breaking old mark of 2.20by Randy Johnson in 1997 (min. 10 GS)…tied a club record with 20 starts pre-ASG and recorded the 4th-moststrikeouts pre-ASG in club history (only Randy Johnson had more).
• Ultra Quality Start Streak - Has a current streak of 11 consecutive starts allowing 2 or fewer runs in at least7.0 innings (has 14 this season)…is tied for the longest single-season streak dating back to 1914 and longestby an American League pitchers since Gaylord Perry for Cleveland in 1974…is 7-1 with a 1.48 ERA (14 ER, 85.0
IP) during the streak…recorded 135 career starts with 7.0 or more IP, 2 or less runs allowed, most in the Majorssince his debut season in 2005 (Cliff Lee is 2nd with 113).
• Not Much Success - Held opponents to a .201 batting average (105x522) with only 5 home runs allowed…opponents are batting .196 with runners in scoring position (18x92)…2nd-lowest opponent OPS (.520) in the AL.
• June Pitcher of the Month - Named the American League June Pitcher of the Month…went 3-1 with a 1.22ERA and 54 strikeouts in 6 starts…fourth career AL Pitcher of the Month award (June 2009, September 2009, August 2012, June 2014)…25-8, 2.63 ERA in 47 career June starts.
• AL Player of the Week - Named the AL Player of the Week for June 2-8 following 15-strikeout performanceJune 8 at Tampa Bay…second career AL Player of the Week honor (Aug. 13-19, 2012).
• Double-Digits K’s - Recorded four games with double-digit strikeouts: 6/8 at TB (15), 4/11 vs. OAK (11), 3/31 atLAA (11), 6/18 at SD (10)…30 career starts with 10+ strikeouts, 2nd-most in club history trailing Randy Johnsonwho had 94 double-digit strikeout games in his Mariners career.
Pitchers Notes
AL STRIKEOUT LEADERS
Player SO
1. David Price (TB) .....................................1642. Felix Hernandez (SEA) ........................154
3. Max Scherzer (DET)...............................1464. Yu Darvish (TEX) ....................................142 Corey Kluber (CLE) ................................142
AL ERA LEADERS
Player ERA 1. Felix Hernandez (SEA) .......................2.12
2. Scott Kazmir (OAK) ..............................2.383. Masahiro Tankaka (NYY) ......................2.514. Garrett Richards (LAA) .........................2.555. Mark Buehrle (TOR) ..............................2.646. Jon Lester (BOS) ..................................2.657. Sonny Gray (OAK) ................................2.798. Yu Darvish (TEX) ...................................2.979. Hisashi Iwakuma (SEA) ......................2.98
10. Corey Kluber (CLE) ...............................3.01
AL QUALITY STARTS LEADERS
Player QS1. Felix Hernandez (SEA) ..........................18
2. Sonny Gray (OAK) ...................................16 Masahiro Tankaka (NYY) .........................164. Jose Quintana (CWS) ..............................15 Garrett Richards (LAA) ............................156. Mark Buehrle (TOR) .................................14 Scott Kazmir (OAK) .................................14 Jon Lester (BOS) .....................................14 David Price (TB) .......................................14 Jason Vargas (KC) ...................................14

8/12/2019 2014 Mid-Season Report
http://slidepdf.com/reader/full/2014-mid-season-report 16/80
14 - 2014 SEATTLE MARINERS MID-SEASON REPORT
• 15 Strikeouts - Struck out a career-high 15 batters June 8 at Tampa Bay, tied for most in the Majors this season (Jon Lester, BOS on May 3 vs. OAK)…12stime in club history that a pitcher had at least 15 strikeouts in a game, first since Randy Johnson had 15 on July 11, 1998 vs. Angels…Johnson (17), MarkLangston (2x) and Mike Moore (1).
• Quality Starts - Recorded his 189th career quality start May 23 vs. Houston, breaking the Mariners all-time record (Jamie Moyer, 188)…has 198 careequality starts, including AL-leading 18 (out of 20 starts) this season.
• Well Rested - When pitching on an extra day of rest (5 days since last start), is 4-0 with a 1.76 ERA and 63 strikeouts in 7 starts (51.0 IP).
• AL West - Made 12 of 20 starts vs. AL West opponents, going 6-2 with a 2.21 ERA (21 ER, 85.2 IP)…3-0, 2.43 ERA in 4 starts vs. Oakland.• Ejection - Ejected for the first time in his career following his start May 12 vs. Tampa Bay (Mark Ripperger).• Young Strikeouts - Turned 28 on April 8 with 1,722 career strikeouts, 4th-most in MLB history by a pitcher before a 28th birthday trailing only Sam McDow
ell (1,956), Bert Blyleven (1,910) & Walter Johnson (1,886)…currently has 1,857 strikeouts, 5th-most by a pitcher before turning 29 (Sam McDowell-2,156Walter Johnson-2,117, Bert Blyleven-2,082, Amos Rusie-1,951)…recorded career strikeout #1,800 June 8 at Tampa Bay.
• Opening Day Start - Made 7th career Opening Day start March 31 at LA Angels…allowed 3 runs (2 ER) and struck out 11 in 6.0 innings to earn the win…6thtime in club history a starter recorded 10+ strikeouts on Opening Day (2nd time by Felix).
• Opening Day Record - Improved to 5-0, 1.52 ERA in his 7 career Opening Day starts (2007, 2009-14)…holds club Opening Day records for starts (7),consecutive starts (6), wins (5) and strikeouts (52).
• Lid Lifters at Young Age - Is the only pitcher in MLB history (since 1900) with 7 Opening Day starts as a pitcher before turning 28…there are 4 pitcherswith 6 Opening Day starts before turning 28: Bert Blyleven, Dennis Eckersley, Dwight Gooden, and Fernando Valenzuela.
• 10th MLB Season - In his 10th Major League season…since making his debut on Aug. 4, 2005, he is 121-88 with a 3.12 ERA and 1,857 strikeouts.
Mid-Season Splits W L ERA SV SVO G GS CG IP H R ER HR BB SO AVG OBP SLG OPS
Total 11 2 2.12 0 0 20 20 0 144.1 105 41 34 5 25 154 .201 .240 .280 .520
Home 7 2 2.17 0 0 10 10 0 74.2 50 22 18 3 14 74 .189 .231 .261 .493
Away 4 0 2.07 0 0 10 10 0 69.2 55 19 16 2 11 80 .213 .249 .298 .548
Day 3 0 1.58 0 0 6 6 0 45.2 32 9 8 1 9 45 .195 .234 .274 .509
Night 8 2 2.37 0 0 14 14 0 98.2 73 32 26 4 16 109 .204 .243 .282 .525
Interleague 0 0 1.29 0 0 1 1 0 7.0 3 1 1 0 0 10 .130 .130 .130 .261March 1 0 3.00 0 0 1 1 0 6.0 4 3 2 1 1 11 .174 .240 .348 .588
April 2 1 2.29 0 0 5 5 0 35.1 26 13 9 2 6 36 .200 .237 .331 .568
May 4 0 2.74 0 0 6 6 0 42.2 40 15 13 0 9 36 .250 .292 .294 .586
June 3 1 1.22 0 0 6 6 0 44.1 26 6 6 1 6 54 .170 .201 .209 .410
July 1 0 2.25 0 0 2 2 0 16.0 9 4 4 1 3 17 .161 .200 .286 .486
#18 - HISASHI IWAKUMA, RHP• First Half - Went 8-4 with a 2.98 ERA (32 ER, 96.2 IP) in 14 starts…Mariners went 9-5 in his starts.• AL Rankings - Ranks 9th in the American League with a 2.98 ERA…also 4th with a 1.003 WHIP.• Control Freak - Leads the AL with a 0.74 BB/9.0 IP ratio and 10.00 strikeout-to-walk ratio (80 K’s, 8 BB)…did not walk a batter in 8 of 14 starts.• Strong Finish - Heads into the All-Star break 3-0 with a 1.25 ERA (3 ER, 21.2 IP) over his last 3 starts.• At Safeco - Went 4-4, but posted a 2.81 ERA (20 ER, 64.0 IP) in 9 starts at Safeco Field…owns a career 2.74 ERA in 43 G/36 GS at Safeco Field.• Career-high - Career-high 8.2 innings July 12 vs. Oakland…held the A’s scoreless until a 2-out, 2-run home run by Brandon Moss in the top of the 9th inn• Double-Digit K’s - Struck out season-high 10 batters July 7 vs. Minnesota…third career double-digit strikeout performance.• Season Debut - Made his season debut May 3 at Houston, earning the win (6.2,6,4,4,1,3,HR).• Twin Killing - Tossed 7.0 scoreless innings July 7 vs. Minnesota…in 5 career starts vs. the Twins is 5-0 with a 0.00 ERA (0 ER, 33.2 IP)…the only other
pitcher who did not allow an ER in his first 5 starts against a team was Larry Jaster (STL), who threw a shutout in each of his 5 starts against the Dodg-
ers in 1966…Kuma is the first pitcher not to allow an ER over any 5 starts against a team since Britt Burns (CWS) against the Yankees in 1981 and 1982.• Road Scoreless Streak - Set a club record for consecutive scoreless innings on the road by not allowing a run in the first 2.0 innings in his start May 3at Houston...recorded 27.0 consecutive scoreless road innings dating back to Aug. 21, 2013...previous record was 25.0 innings, shared by Brian Holman(6/27-7/19/84) and Randy Johnson (5/25-6/15/94).
• DL - Opened the season on the disabled list with a strained tendon in his right middle finger…made one rehab start with AAA Tacoma.• As a Starter - Since making his first MLB start July 2, 2012 has gone 30-14 with a 2.74 ERA (125 ER, 411.1 IP) in 63 starts…among pitchers with at leas
50 starts during this stretch, ERA trails only Clayton Kershaw (1.96) and Adam Wainwright (2.67).
Mid-Season Splits W L ERA SV SVO G GS CG IP H R ER HR BB SO AVG OBP SLG OPS
Total 8 4 2.98 0 0 14 14 0 96.2 89 32 32 11 8 80 .245 .261 .366 .627
Home 4 4 2.81 0 0 9 9 0 64.0 55 20 20 7 5 55 .231 .247 .349 .596
Away 4 0 3.31 0 0 5 5 0 32.2 34 12 12 4 3 25 .272 .287 .400 .687
Day 3 1 2.83 0 0 4 4 0 28.2 27 9 9 4 1 22 .255 .259 .406 .665
Night 5 3 3.04 0 0 10 10 0 68.0 62 23 23 7 7 58 .241 .261 .350 .612
Interleague 1 0 0.00 0 0 1 1 0 7.0 6 0 0 0 0 7 .231 .231 .231 .462
May 3 2 3.09 0 0 6 6 0 43.2 37 15 15 6 4 29 .236 .253 .389 .642
June 2 2 4.02 0 0 5 5 0 31.1 36 14 14 4 4 26 .290 .313 .419 .732
July 3 0 1.25 0 0 3 3 0 21.2 16 3 3 1 0 25 .195 .195 .244 .439
#52 - DOMINIC LEONE, RHP
• The First Half - Heads into the break with a 2-1, 1.83 mark in 34 relief appearances (39.1 IP, 8 ER, 30 H, 15 BB, 45 SO).• Rookie Rankings - Among AL rookie relievers, ranks 2nd in ERA (1.83), 2nd in strikeouts (45), 6th in Opponent Batting Average (.208), 7th in innings (39.1and T8th in games (34).
• K’s Per 9.0 IP - Averaging 10.30 strikeouts per 9.0 innings pitched (45 SO, 39.1 IP).• Rock Solid - Has not allowed a run in 28 of 34 appearances this season, and has allowed 1 earned run or less in 33 of 34 games.• MLB Win #1 - Collected his first MLB win in Seattle’s 3-1 victory at Houston May 22, tossing 1.2 scoreless innings (1 H, 2 SO).• MLB Debut - Made MLB debut on April 6 at OAK with a scoreless IP…allowed a double to first batter faced but pitched out of jam without allowing a run• The Minors - Selected from AAA Tacoma on April 4; had reported to Rainiers but had not appeared in a game.
Mid-Season Splits W L ERA SV SVO G GS CG IP H R ER HR BB SO AVG OBP SLG OPS
Total 2 1 1.83 0 2 34 0 0 39.1 30 10 8 2 15 45 .208 .286 .333 .619
Home 1 0 0.78 0 0 17 0 0 23.0 15 2 2 1 6 25 .185 .239 .284 .523
Away 1 1 3.31 0 2 17 0 0 16.1 15 8 6 1 9 20 .238 .342 .397 .739
Interleague 1 1 7.71 0 1 4 0 0 4.2 5 4 4 0 2 7 .263 .333 .474 .807
April 0 0 1.50 0 0 8 0 0 12.0 8 2 2 1 5 11 .190 .277 .310 .586
May 1 0 1.54 0 0 12 0 0 11.2 11 3 2 1 5 15 .250 .320 .386 .706
June 1 1 3.86 0 2 9 0 0 9.1 8 4 4 0 2 10 .229 .270 .371 .642
July 0 0 0.00 0 0 5 0 0 6.1 3 1 0 0 3 9 .130 .259 .217 .477
Pitchers Notes
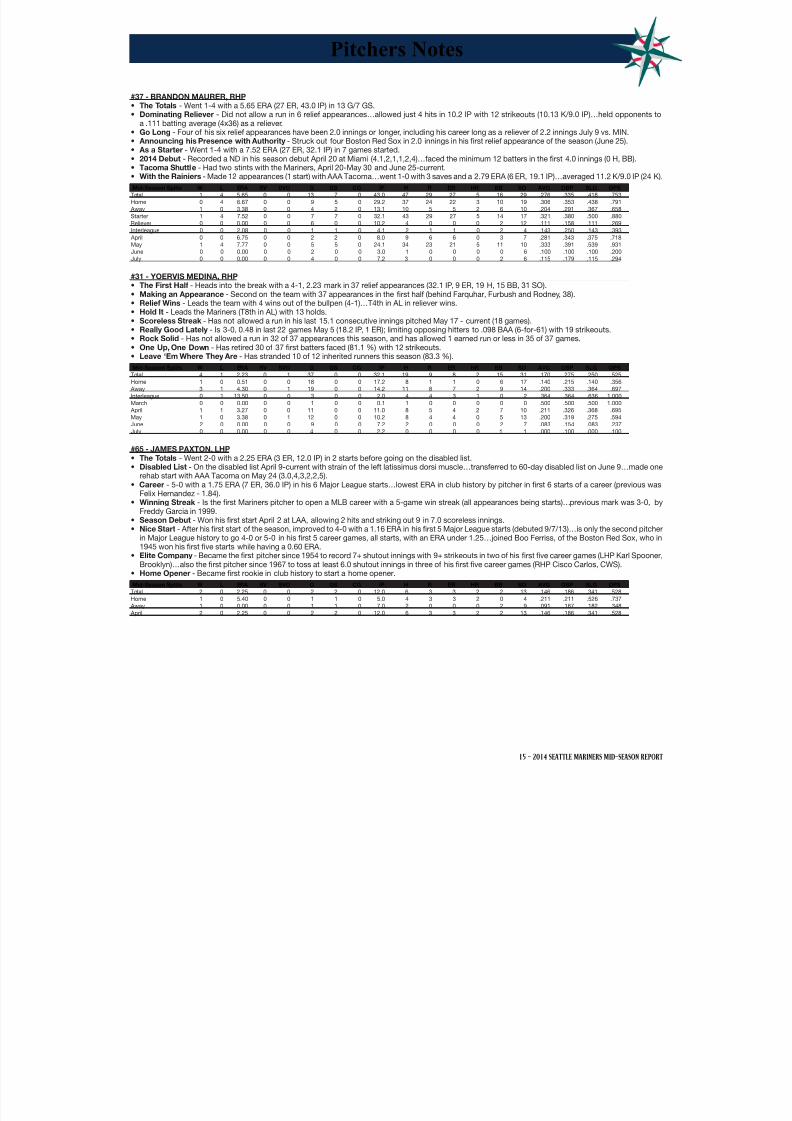
8/12/2019 2014 Mid-Season Report
http://slidepdf.com/reader/full/2014-mid-season-report 17/80
15 - 2014 SEATTLE MARINERS MID-SEASON REPORT
#37 - BRANDON MAURER, RHP• The Totals - Went 1-4 with a 5.65 ERA (27 ER, 43.0 IP) in 13 G/7 GS.• Dominating Reliever - Did not allow a run in 6 relief appearances…allowed just 4 hits in 10.2 IP with 12 strikeouts (10.13 K/9.0 IP)…held opponents to
a .111 batting average (4x36) as a reliever.• Go Long - Four of his six relief appearances have been 2.0 innings or longer, including his career long as a reliever of 2.2 innings July 9 vs. MIN.• Announcing his Presence with Authority - Struck out four Boston Red Sox in 2.0 innings in his first relief appearance of the season (June 25).
• As a Starter - Went 1-4 with a 7.52 ERA (27 ER, 32.1 IP) in 7 games started.• 2014 Debut - Recorded a ND in his season debut April 20 at Miami (4.1,2,1,1,2,4)…faced the minimum 12 batters in the first 4.0 innings (0 H, BB).• Tacoma Shuttle - Had two stints with the Mariners, April 20-May 30 and June 25-current.• With the Rainiers - Made 12 appearances (1 start) with AAA Tacoma…went 1-0 with 3 saves and a 2.79 ERA (6 ER, 19.1 IP)…averaged 11.2 K/9.0 IP (24 K)
Mid-Season Splits W L ERA SV SVO G GS CG IP H R ER HR BB SO AVG OBP SLG OPS
Total 1 4 5.65 0 0 13 7 0 43.0 47 29 27 5 16 29 .276 .335 .418 .753
Home 0 4 6.67 0 0 9 5 0 29.2 37 24 22 3 10 19 .306 .353 .438 .791
Away 1 0 3.38 0 0 4 2 0 13.1 10 5 5 2 6 10 .204 .291 .367 .658
Starter 1 4 7.52 0 0 7 7 0 32.1 43 29 27 5 14 17 .321 .380 .500 .880
Reliever 0 0 0.00 0 0 6 0 0 10.2 4 0 0 0 2 12 .111 .158 .111 .269
Interleague 0 0 2.08 0 0 1 1 0 4.1 2 1 1 0 2 4 .143 .250 .143 .393
April 0 0 6.75 0 0 2 2 0 8.0 9 6 6 0 3 7 .281 .343 .375 .718
May 1 4 7.77 0 0 5 5 0 24.1 34 23 21 5 11 10 .333 .391 .539 .931
June 0 0 0.00 0 0 2 0 0 3.0 1 0 0 0 0 6 .100 .100 .100 .200
July 0 0 0.00 0 0 4 0 0 7.2 3 0 0 0 2 6 .115 .179 .115 .294
#31 - YOERVIS MEDINA, RHP• The First Half - Heads into the break with a 4-1, 2.23 mark in 37 relief appearances (32.1 IP, 9 ER, 19 H, 15 BB, 31 SO).• Making an Appearance - Second on the team with 37 appearances in the first half (behind Farquhar, Furbush and Rodney, 38).
• Relief Wins - Leads the team with 4 wins out of the bullpen (4-1)…T4th in AL in reliever wins.• Hold It - Leads the Mariners (T8th in AL) with 13 holds.• Scoreless Streak - Has not allowed a run in his last 15.1 consecutive innings pitched May 17 - current (18 games).• Really Good Lately - Is 3-0, 0.48 in last 22 games May 5 (18.2 IP, 1 ER); limiting opposing hitters to .098 BAA (6-for-61) with 19 strikeouts.• Rock Solid - Has not allowed a run in 32 of 37 appearances this season, and has allowed 1 earned run or less in 35 of 37 games.• One Up, One Down - Has retired 30 of 37 first batters faced (81.1 %) with 12 strikeouts.• Leave ‘Em Where They Are - Has stranded 10 of 12 inherited runners this season (83.3 %).
Mid-Season Splits W L ERA SV SVO G GS CG IP H R ER HR BB SO AVG OBP SLG OPS
Total 4 1 2.23 0 1 37 0 0 32.1 19 9 8 2 15 31 .170 .275 .250 .525
Home 1 0 0.51 0 0 18 0 0 17.2 8 1 1 0 6 17 .140 .215 .140 .356
Away 3 1 4.30 0 1 19 0 0 14.2 11 8 7 2 9 14 .200 .333 .364 .697
Interleague 0 1 13.50 0 0 3 0 0 2.0 4 4 3 1 0 2 .364 .364 .636 1.000
March 0 0 0.00 0 0 1 0 0 0.1 1 0 0 0 0 0 .500 .500 .500 1.000
April 1 1 3.27 0 0 11 0 0 11.0 8 5 4 2 7 10 .211 .326 .368 .695
May 1 0 3.38 0 1 12 0 0 10.2 8 4 4 0 5 13 .200 .319 .275 .594
June 2 0 0.00 0 0 9 0 0 7.2 2 0 0 0 2 7 .083 .154 .083 .237
July 0 0 0.00 0 0 4 0 0 2.2 0 0 0 0 1 1 .000 .100 .000 .100
#65 - JAMES PAXTON, LHP• The Totals - Went 2-0 with a 2.25 ERA (3 ER, 12.0 IP) in 2 starts before going on the disabled list.• Disabled List - On the disabled list April 9-current with strain of the left latissimus dorsi muscle…transferred to 60-day disabled list on June 9…made one
rehab start with AAA Tacoma on May 24 (3.0,4,3,2,2,5).• Career - 5-0 with a 1.75 ERA (7 ER, 36.0 IP) in his 6 Major League starts…lowest ERA in club history by pitcher in first 6 starts of a career (previous was
Felix Hernandez - 1.84).• Winning Streak - Is the first Mariners pitcher to open a MLB career with a 5-game win streak (all appearances being starts)…previous mark was 3-0, by
Freddy Garcia in 1999.• Season Debut - Won his first start April 2 at LAA, allowing 2 hits and striking out 9 in 7.0 scoreless innings.• Nice Start - After his first start of the season, improved to 4-0 with a 1.16 ERA in his first 5 Major League starts (debuted 9/7/13)…is only the second pitche
in Major League history to go 4-0 or 5-0 in his first 5 career games, all starts, with an ERA under 1.25…joined Boo Ferriss, of the Boston Red Sox, who in1945 won his first five starts while having a 0.60 ERA.
• Elite Company - Became the first pitcher since 1954 to record 7+ shutout innings with 9+ strikeouts in two of his first five career games (LHP Karl SpoonerBrooklyn)…also the first pitcher since 1967 to toss at least 6.0 shutout innings in three of his first five career games (RHP Cisco Carlos, CWS).
• Home Opener - Became first rookie in club history to start a home opener.
Mid-Season Splits W L ERA SV SVO G GS CG IP H R ER HR BB SO AVG OBP SLG OPS
Total 2 0 2.25 0 0 2 2 0 12.0 6 3 3 2 2 13 .146 .186 .341 .528
Home 1 0 5.40 0 0 1 1 0 5.0 4 3 3 2 0 4 .211 .211 .526 .737 Away 1 0 0.00 0 0 1 1 0 7.0 2 0 0 0 2 9 .091 .167 .182 .348
April 2 0 2.25 0 0 2 2 0 12.0 6 3 3 2 2 13 .146 .186 .341 .528
Pitchers Notes

8/12/2019 2014 Mid-Season Report
http://slidepdf.com/reader/full/2014-mid-season-report 18/80
16 - 2014 SEATTLE MARINERS MID-SEASON REPORT
#56 - FERNANDO RODNEY, RHP• AL Saves Leader - Leads the American League with 27 saves, going 27-for-29 in save opportunities (93.1%)…2nd-
best save percentage in the AL.• All-Star - Added to the AL All-Star team when David Price was not able to pitch…also an All-Star in 2012.• Sub 2.00 ERA - One 14 AL relievers with a sub 2.00 ERA (min. 30.0 IP).• K/9.0 IP - Averaging 10.40 K/9.0 IP (42 K’s, 36.1 IP)…recorded at least one strikeout in 31 of 38 appearances.
• Are you Experienced - After allowing at least 1 base runner in 10 of his first 13 save opportunities, has allowed arunner in just 6 of last 16 save opps.
• Approaching 200 Saves - Next save will be #200 of his career…199 career saves are 6th-most among active pitch-ers: J. Nathan (360), F. Rodriguez (331), J. Papelbon (308), J. Valverde (288) & H. Street (258)
• Since 2012 - Recorded 112 saves since the 2012 season, 2nd-most in MLB behind Craig Kimbrel.• 16 in a Row - Converted his last 16 save opportunities (since 5/18), going 0-1 with a 0.90 ERA (2 ER, 20.0 IP) in his last 21 appearances.• Saving the Series - Recorded a save in all three games of the Mariners 3-game series sweep at Kansas City June 20-22…fourth Seattle pitcher (5 times
to save all three games in a 3-game sweep: Mike Schooler (2x: 7/4-6/89 vs. MIN & 9/11-13/89 vs. BOS), Jose Mesa (7/30-8/1/99 vs. BAL) and J.J. Putz(6/8-10/07 at SD).
• 20-Save Seasons - Recorded his fourth 20-save season in the Majors: 37 in 2009 w/DET, 48 in 2012 & 37 in 2013 w/TB and 27 {and counting} w/SEA.
Mid-Season Splits W L ERA SV SVO G GS CG IP H R ER HR BB SO AVG OBP SLG OPS
Total 1 3 1.98 27 29 38 0 0 36.1 29 10 8 1 12 42 .220 .295 .265 .560
Home 1 2 3.24 13 14 18 0 0 16.2 15 6 6 1 10 17 .246 .361 .311 .673
Away 0 1 0.92 14 15 20 0 0 19.2 14 4 2 0 2 25 .197 .230 .225 .455
Interleague 0 0 2.25 2 2 4 0 0 4.0 2 1 1 0 0 5 .154 .154 .154 .308
April 1 1 3.86 5 6 10 0 0 9.1 12 6 4 0 6 15 .324 .432 .378 .810
May 0 1 1.59 9 10 12 0 0 11.1 10 2 2 1 4 10 .238 .319 .333 .652
June 0 1 1.54 9 9 12 0 0 11.2 7 2 2 0 1 12 .171 .190 .171 .361
July 0 0 0.00 4 4 4 0 0 4.0 0 0 0 0 1 5 .000 .077 .000 .077
#54 - TOM WILHELMSEN, RHP• The First Half - Heads into the break with a 1-2, 2.54 mark with 1 save in 34 games, 1 GS (49.2 IP, 14 ER, 31 H, 25 BB, 43 SO).• Workhorse - Leads Mariners relievers with 47.0 innings pitched in 33 relief appearances (tossed an additional 2.2 innings in a spot start)…47.0 innings is
8th most in the AL (among relievers) and 49.2 innings (his first half total counting the spot start) would be tied for 3rd in the AL.• Multi Innings - Worked more than 1.0 inning in 16 of 34 games, and more than 2.0 IP 12 times…worked 2.0+ innings in 8 of last 12 games.• Out of the ‘Pen - Is 1-1, 2.49 with 1 save in 33 relief appearances (47.0 IP, 30 H, 14 R, 13 ER, 22 BB, 40 SO).• As a Starter - Is 0-1, 3.38 in 1 start (2.2 IP, 1 H, 2 R, 1 ER, 3 BB, 3 SO).• Tonight’s Starter - Made his first MLB start July 10 vs. MIN (a Johnny All-Staff Day), throwing a season-high 54 pitches in 2.2 innings…allowed 2 runs (1
earned run) and was tagged with the loss in a 4-2 game…had not started a game since 2011 at AA Jackson.• Good Win - Notched his only win this season July 5 at Chicago (AL) tossing shutout frames in the 13th and 14th innings.• Save Me - Collected a save the old fashioned way, tossing 3.0 innings in Seattle’s 10-4 win at Houston June 30…is one of three Mariners to collect a save
this season (Rodney, 27; Farquhar, 1; Wilhelmsen, 1).• Career High IP - Tossed 3.0 innings three separate times in the first half (June 30 at HOU, June 25 vs. BOS and June 11 vs. NYY), a career high.• Scoreless Streaks - Did not allow a run in 13.2 consecutive innings pitched from April 21 - May 21 (12 games)
Mid-Season Splits W L ERA SV SVO G GS CG IP H R ER HR BB SO AVG OBP SLG OPS
Total 1 2 2.54 1 3 34 1 0 49.2 31 16 14 3 25 43 .179 .286 .272 .557
Home 0 1 2.88 0 0 16 1 0 25.0 18 9 8 3 11 26 .202 .291 .315 .606 Away 1 1 2.19 1 3 18 0 0 24.2 13 7 6 0 14 17 .155 .280 .226 .506
Starter 0 1 3.38 0 0 1 1 0 2.2 1 2 1 0 3 3 .125 .333 .125 .458
Reliever 1 1 2.49 1 3 33 0 0 47.0 30 14 13 3 22 40 .182 .283 .279 .562
Interleague 0 1 3.00 0 1 4 0 0 6.0 2 2 2 1 4 3 .105 .250 .263 .513
March 0 0 0.00 0 0 1 0 0 1.1 0 0 0 0 0 1 .000 .000 .000 .000
April 0 1 4.50 0 2 10 0 0 10.0 9 6 5 1 9 6 .237 .375 .447 .822
May 0 0 2.35 0 0 12 0 0 15.1 11 4 4 1 7 18 .190 .277 .259 .536
June 0 0 1.96 1 1 9 0 0 18.1 10 4 4 1 6 13 .169 .265 .237 .502
July 1 1 1.93 0 0 2 1 0 4.2 1 2 1 0 3 5 .071 .222 .071 .294
#53 - CHRIS YOUNG, RHP• The Totals - Went 8-6 with a 3.15 ERA (39 ER, 111.1 IP) in 19 G/18 GS…Mariners went 10-8 in his 18 starts.• Opponent Avg - Held opponents to a .208 batting average (84x403), 4th-lowest in the AL…led the AL with a .207 BABIP (batting average on balls in play)• Top 15 ERA - Ranks 13th in the American League with a 3.15 ERA (39 ER, 111.1 IP).• Strong Finish - Closed out the first half going 3-2 with a 2.13 ERA (9 ER, 38.0 IP) over his last 6 starts (since 6/16).• The Longball - Led the team allowing 16 home runs (T5th in AL)…13 of 16 home runs allowed were solo HR.• Run Support - Had the 6th-lowest run support average among AL starters at 3.62…Mariners averaged 3.06 runs per game in his starts.• First Win - Recorded his first win April 29 at NYY…was his first ML victory since Sept. 9, 2012 at Miami (w/NYM), a span of 594 days between victories.
• Season Debut - Made Mariners debut out of the bullpen April 6 at Oakland with 2.0 perfect innings (2 K)…was his 160th MLB appearance, and first out othe bullpen in a regular-season game (2007 All-Star game)…was his first MLB appearance since Sept. 29, 2012 at Atlanta (with NYM), a span of 554 days
• Growth Chart - Listed at 6-10 is tied for the tallest player in club history with Randy Johnson.• Welcome to Seattle - Signed with Seattle as a free agent at the end of spring training (March 27)…made the Opening Day roster as the No. 5 starter, bu
did not make first start until April 13 vs. Oakland.
Mid-Season Splits W L ERA SV SVO G GS CG IP H R ER HR BB SO AVG OBP SLG OPS
Total 8 6 3.15 0 0 19 18 0 111.1 84 40 39 16 38 63 .208 .277 .382 .659
Home 5 3 2.45 0 0 10 10 0 62.1 42 17 17 6 19 42 .188 .253 .323 .576
Away 3 3 4.04 0 0 9 8 0 49.0 42 23 22 10 19 21 .233 .305 .456 .761
Day 2 2 2.64 0 0 8 7 0 47.2 27 14 14 8 17 28 .165 .246 .335 .581
Night 6 4 3.53 0 0 11 11 0 63.2 57 26 25 8 21 35 .238 .298 .414 .712
Starter 8 6 3.21 0 0 18 18 0 109.1 84 40 39 16 38 61 .211 .281 .387 .667
Reliever 0 0 0.00 0 0 1 0 0 2.0 0 0 0 0 0 2 .000 .000 .000 .000
vs. AL 7 6 3.08 0 0 17 16 0 102.1 73 36 35 15 34 57 .198 .267 .377 .643
vs. NL 1 0 4.00 0 0 2 2 0 9.0 11 4 4 1 4 6 .324 .385 .441 .826
April 1 0 3.04 0 0 5 4 0 23.2 18 9 8 3 14 13 .212 .317 .365 .682
May 4 2 3.40 0 0 6 6 0 39.2 28 15 15 7 11 17 .196 .256 .406 .662
June 2 2 2.89 0 0 5 5 0 28.0 25 9 9 2 10 17 .243 .310 .359 .670
July 1 2 3.15 0 0 3 3 0 20.0 13 7 7 4 3 16 .181 .213 .389 .602
Pitchers Notes
AL SAVES LEADERS
Player SV 1. Fernando Rodney (SEA) ............. 27
2. Greg Holland (KC) ........................ 253. David Robertson (NYY) ................ 234. Glen Perkins (MIN) ....................... 22
5. Joe Nathan (DET) ......................... 19
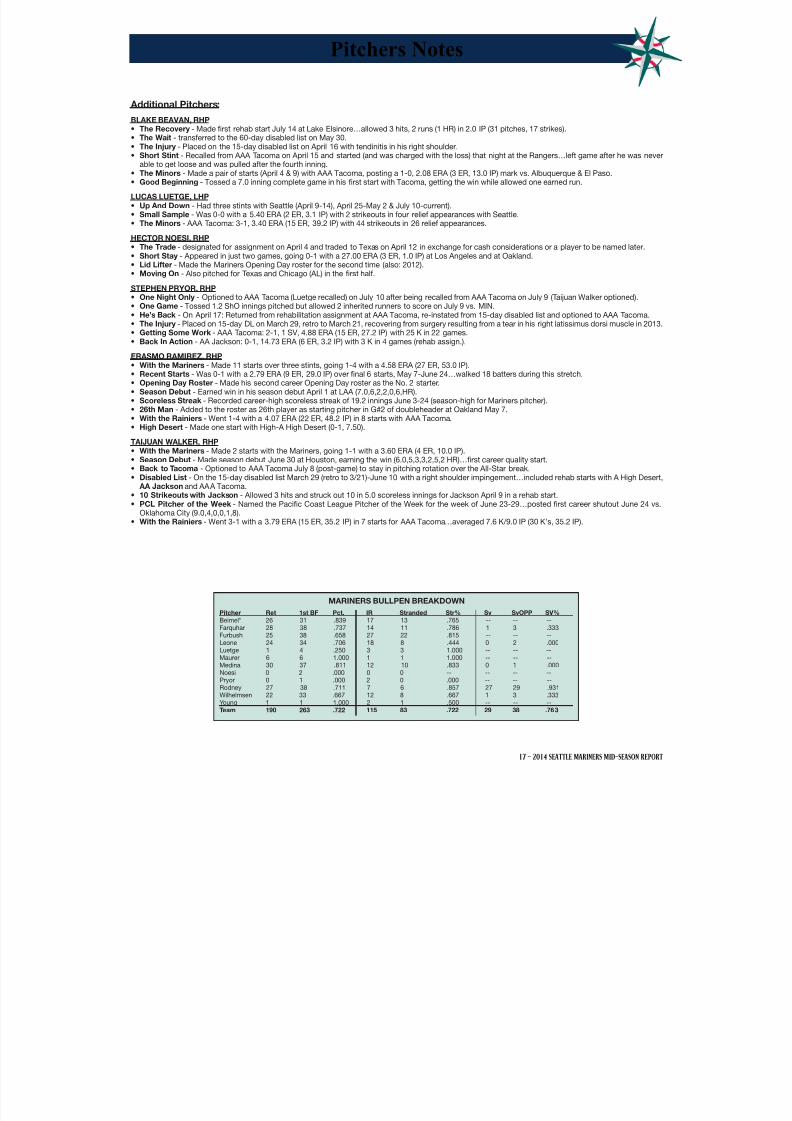
8/12/2019 2014 Mid-Season Report
http://slidepdf.com/reader/full/2014-mid-season-report 19/80
17 - 2014 SEATTLE MARINERS MID-SEASON REPORT
Pitchers Notes
Additional Pitchers:
BLAKE BEAVAN, RHP• The Recovery - Made first rehab start July 14 at Lake Elsinore…allowed 3 hits, 2 runs (1 HR) in 2.0 IP (31 pitches, 17 strikes).• The Wait - transferred to the 60-day disabled list on May 30.
• The Injury - Placed on the 15-day disabled list on April 16 with tendinitis in his right shoulder.• Short Stint - Recalled from AAA Tacoma on April 15 and started (and was charged with the loss) that night at the Rangers…left game after he was neveable to get loose and was pulled after the fourth inning.
• The Minors - Made a pair of starts (April 4 & 9) with AAA Tacoma, posting a 1-0, 2.08 ERA (3 ER, 13.0 IP) mark vs. Albuquerque & El Paso.• Good Beginning - Tossed a 7.0 inning complete game in his first start with Tacoma, getting the win while allowed one earned run.
LUCAS LUETGE, LHP• Up And Down - Had three stints with Seattle (April 9-14), April 25-May 2 & July 10-current).• Small Sample - Was 0-0 with a 5.40 ERA (2 ER, 3.1 IP) with 2 strikeouts in four relief appearances with Seattle.• The Minors - AAA Tacoma: 3-1, 3.40 ERA (15 ER, 39.2 IP) with 44 strikeouts in 26 relief appearances.
HECTOR NOESI, RHP• The Trade - designated for assignment on April 4 and traded to Texas on April 12 in exchange for cash considerations or a player to be named later.• Short Stay - Appeared in just two games, going 0-1 with a 27.00 ERA (3 ER, 1.0 IP) at Los Angeles and at Oakland.• Lid Lifter - Made the Mariners Opening Day roster for the second time (also: 2012).• Moving On - Also pitched for Texas and Chicago (AL) in the first half.
STEPHEN PRYOR, RHP
• One Night Only - Optioned to AAA Tacoma (Luetge recalled) on July 10 after being recalled from AAA Tacoma on July 9 (Taijuan Walker optioned).• One Game - Tossed 1.2 ShO innings pitched but allowed 2 inherited runners to score on July 9 vs. MIN.• He’s Back - On April 17: Returned from rehabilitation assignment at AAA Tacoma, re-instated from 15-day disabled list and optioned to AAA Tacoma.• The Injury - Placed on 15-day DL on March 29, retro to March 21, recovering from surgery resulting from a tear in his right latissimus dorsi muscle in 2013• Getting Some Work - AAA Tacoma: 2-1, 1 SV, 4.88 ERA (15 ER, 27.2 IP) with 25 K in 22 games.• Back In Action - AA Jackson: 0-1, 14.73 ERA (6 ER, 3.2 IP) with 3 K in 4 games (rehab assign.).
ERASMO RAMIREZ, RHP• With the Mariners - Made 11 starts over three stints, going 1-4 with a 4.58 ERA (27 ER, 53.0 IP).• Recent Starts - Was 0-1 with a 2.79 ERA (9 ER, 29.0 IP) over final 6 starts, May 7-June 24…walked 18 batters during this stretch.• Opening Day Roster - Made his second career Opening Day roster as the No. 2 starter.• Season Debut - Earned win in his season debut April 1 at LAA (7.0,6,2,2,0,6,HR).• Scoreless Streak - Recorded career-high scoreless streak of 19.2 innings June 3-24 (season-high for Mariners pitcher).• 26th Man - Added to the roster as 26th player as starting pitcher in G#2 of doubleheader at Oakland May 7.• With the Rainiers - Went 1-4 with a 4.07 ERA (22 ER, 48.2 IP) in 8 starts with AAA Tacoma.• High Desert - Made one start with High-A High Desert (0-1, 7.50).
TAIJUAN WALKER, RHP
• With the Mariners - Made 2 starts with the Mariners, going 1-1 with a 3.60 ERA (4 ER, 10.0 IP).• Season Debut - Made season debut June 30 at Houston, earning the win (6.0,5,3,3,2,5,2 HR)…first career quality start.• Back to Tacoma - Optioned to AAA Tacoma July 8 (post-game) to stay in pitching rotation over the All-Star break.• Disabled List - On the 15-day disabled list March 29 (retro to 3/21)-June 10 with a right shoulder impingement…included rehab starts with A High Desert
AA Jackson and AAA Tacoma.• 10 Strikeouts with Jackson - Allowed 3 hits and struck out 10 in 5.0 scoreless innings for Jackson April 9 in a rehab start.• PCL Pitcher of the Week - Named the Pacific Coast League Pitcher of the Week for the week of June 23-29…posted first career shutout June 24 vs.
Oklahoma City (9.0,4,0,0,1,8).• With the Rainiers - Went 3-1 with a 3.79 ERA (15 ER, 35.2 IP) in 7 starts for AAA Tacoma…averaged 7.6 K/9.0 IP (30 K’s, 35.2 IP).
MARINERS BULLPEN BREAKDOWN Pitcher Ret 1st BF Pct. IR Stranded Str% Sv SvOPP SV%
Beimel* 26 31 .839 17 13 .765 -- -- --Farquhar 28 38 .737 14 11 .786 1 3 .333Furbush 25 38 .658 27 22 .815 -- -- --Leone 24 34 .706 18 8 .444 0 2 .000Luetge 1 4 .250 3 3 1.000 -- -- --Maurer 6 6 1.000 1 1 1.000 -- -- --Medina 30 37 .811 12 10 .833 0 1 .000Noesi 0 2 .000 0 0 -- -- -- --Pryor 0 1 .000 2 0 .000 -- -- --Rodney 27 38 .711 7 6 .857 27 29 .931Wilhelmsen 22 33 .667 12 8 .667 1 3 .333Young 1 1 1.000 2 1 .500 -- -- --Team 190 263 .722 115 83 .722 29 38 .763

8/12/2019 2014 Mid-Season Report
http://slidepdf.com/reader/full/2014-mid-season-report 20/80
18 - 2014 SEATTLE MARINERS MID-SEASON REPORT
GI PINCH HIT
PLAYER AVG G AB R H TB 2B 3B HR RBI SH SF HP BB IBB SO SB CS DP E SLG OBP AB H HR RBI
Ackley,D .225 85 275 32 62 92 14 2 4 29 0 1 1 21 1 53 3 2 5 0 .335 .282 5 2 0 1
+Almonte,A .198 27 106 10 21 31 5 1 1 8 0 0 1 6 0 40 3 1 1 5 .292 .248 0 0 0 0
RIGHT .257 35 9 13 4 0 0 3 0 0 1 2 0 8 1 .371 .316 0 0 0 0
LEFT .169 71 12 18 1 1 1 5 0 0 0 4 0 32 0 .254 .213 0 0 0 0
Bloomquist,W .269 41 119 11 32 40 5 0 1 12 1 1 0 3 1 28 0 1 1 0 .336 .285 7 1 0 1
Buck,J .226 27 84 9 19 24 2 0 1 6 0 0 0 8 0 24 0 0 1 1 .286 .293 2 0 0 0
Cano,R .334 91 353 49 118 163 22 1 7 57 0 3 3 33 9 45 7 2 10 3 .462 .393 0 0 0 0
Chavez,E .260 37 127 14 33 46 6 2 1 8 3 2 0 6 0 12 1 1 1 0 .362 .289 4 0 0 0
+Elias,R .000 19 2 0 0 0 0 0 0 0 0 0 0 0 0 0 0 0 0 0 .000 .000 0 0 0 0
Franklin,N .128 17 47 3 6 8 0 1 0 2 0 1 1 3 0 21 1 0 0 0 .170 .192 2 0 0 0
RIGHT .000 8 0 0 0 0 0 0 0 0 1 1 0 5 0 .000 .200 0 0 0 0
LEFT .154 39 6 8 0 1 0 2 0 1 0 2 0 16 0 .205 .190 2 0 0 0
# Gillespie,C .243 35 74 9 18 23 2 0 1 5 1 0 0 6 0 13 2 2 3 2 .311 .300 4 1 0 0
SEA .254 34 71 9 18 23 2 0 1 5 1 0 0 6 0 13 2 2 3 2 .324 .312 4 1 0 0
Hart,C .214 45 168 13 36 57 6 0 5 18 0 1 6 12 1 38 2 0 1 0 .339 .289 0 0 0 0
Hernandez,F .000 20 2 0 0 0 0 0 0 0 1 0 0 0 0 0 0 0 0 0 .000 .000 0 0 0 0
Iwakuma,H .000 14 1 0 0 0 0 0 0 0 1 0 0 1 0 1 0 0 0 1 .000 .500 0 0 0 0
+Jones,J .287 66 244 37 70 86 8 4 0 8 3 0 0 11 0 45 17 1 3 1 .352 .318 3 1 0 0
Maurer,B .000 13 1 0 0 0 0 0 0 0 1 0 0 0 0 0 0 0 0 0 .000 .000 0 0 0 0
Miller,B .204 81 270 32 55 89 8 1 8 24 2 1 2 24 1 70 3 1 0 13 .330 .273 0 0 0 0
Montero,J .286 5 14 1 4 7 0 0 1 2 0 0 0 0 0 2 0 0 1 0 .500 .286 1 0 0 0
Morrison,L .230 39 135 12 31 51 5 0 5 15 0 1 0 9 1 28 3 0 3 3 .378 .276 1 0 0 0
# Noesi,H .000 20 4 0 0 0 0 0 0 0 0 0 0 0 0 1 0 0 0 0 .000 .000 0 0 0 0
SEA .000 2 0 0 0 0 0 0 0 0 0 0 0 0 0 0 0 0 0 0 .000 .000 0 0 0 0
Ramirez,E .000 11 2 0 0 0 0 0 0 0 1 0 0 0 0 1 0 0 0 0 .000 .000 0 0 0 0
+Romero,S .196 51 148 18 29 48 6 2 3 11 2 1 4 4 0 40 0 3 3 1 .324 .236 6 2 1 3
Saunders,M .276 65 196 31 54 85 7 3 6 28 2 4 0 17 0 50 3 4 2 0 .434 .327 3 0 0 0
Seager,K .279 92 341 38 95 168 22 3 15 63 1 1 5 33 2 74 4 3 4 7 .493 .350 1 0 0 0
Smoak,J .202 65 223 26 45 78 12 0 7 29 0 2 2 21 0 61 0 1 7 2 .350 .274 1 0 0 0
RIGHT .224 98 22 35 7 0 2 13 0 0 1 4 0 27 3 .357 .262 0 0 0 0
LEFT .184 125 23 43 5 0 5 16 0 2 1 17 0 34 4 .344 .283 1 0 0 0
+Sucre,J .200 2 5 0 1 1 0 0 0 0 1 0 0 0 0 1 0 0 0 0 .200 .200 0 0 0 0
Young,C .000 19 1 0 0 0 0 0 0 0 0 0 0 0 0 0 0 0 0 1 .000 .000 0 0 0 0
Zunino,M .206 76 267 33 55 110 14 1 13 34 0 4 10 11 1 97 0 2 5 4 .412 .260 0 0 0 0
SEATTLE .245 95 3202 378 784 1207 144 21 79 359 20 23 35 229 17 744 49 24 51 45 .377 .300 40 7 1 5
OPPONENTS .226 95 3122 321 706 1103 118 15 83 297 19 27 26 267 19 741 51 19 68 57 .353 .290 49 8 0 5
DH .197 95 330 38 65 98 7 1 8 31 1 2 7 27 1 82 8 3 2 0 .297 .270 7 2 0 0
PITCHERS .000 95 9 0 0 0 0 0 0 0 4 0 0 1 0 2 0 0 0 3 .000 .100 0 0 0 0
OPP
PITCHER R/L W L ERA G GS CG GF SHO SV IP H R ER HR HB BB IBB SO WP BK AVG
Beavan,B R 0 1 4.50 1 1 0 0 0 0 4.0 6 2 2 2 0 0 0 1 0 0 .375
Beimel,J L 2 1 1.50 32 0 0 5 0 0 30.0 26 5 5 1 1 11 4 17 2 0 .243
+Elias,R L 7 8 4.54 19 19 1 0 1 0 113.0 103 62 57 14 7 40 2 96 4 3 .246
Farquhar,D R 1 1 2.88 38 0 0 10 0 1 40.2 36 13 13 2 2 14 1 45 2 1 .234
Furbush,C L 1 4 4.00 38 0 0 8 0 0 27.0 28 12 12 3 2 5 0 26 1 0 .269
Hernandez,F R 11 2 2.12 20 20 0 0 0 0 144.1 105 41 34 5 3 25 0 154 13 0 .201
Iwakuma,H R 8 4 2.98 14 14 0 0 0 0 96.2 89 32 32 11 0 8 1 80 0 0 .245
+Leone,D R 2 1 1.83 34 0 0 0 0 0 39.1 30 10 8 2 1 15 0 45 3 0 .208
Luetge,L L 0 0 5.40 4 0 0 2 0 0 3.1 2 2 2 1 0 3 0 2 1 0 .182
Maurer,B R 1 4 5.65 13 7 0 4 0 0 43.0 47 29 27 5 0 16 0 29 1 0 .276
Medina,Y R 4 1 2.23 37 0 0 10 0 0 32.1 19 9 8 2 2 15 2 31 3 0 .170
# Noesi,H R 3 7 5.26 20 14 0 3 0 0 87.1 98 55 51 13 1 36 1 70 5 1 .283
SEA R 0 1 27.00 2 0 0 2 0 0 1.0 2 3 3 1 0 0 0 2 1 0 .400
+Paxton,J L 2 0 2.25 2 2 0 0 0 0 12.0 6 3 3 2 0 2 0 13 0 0 .146
Pryor,S R 0 0 0.00 1 0 0 0 0 0 1.2 1 1 0 0 0 2 0 1 1 0 .200
Ramirez,E R 1 4 4.58 11 11 0 0 0 0 53.0 55 27 27 10 1 29 2 42 3 0 .267
Rodney,F R 1 3 1.98 38 0 0 37 0 27 36.1 29 10 8 1 2 12 0 42 3 0 .220
+Walker,T R 1 1 3.60 2 2 0 0 0 0 10.0 7 4 4 2 1 7 1 9 2 0 .200
Wilhelmsen,T R 1 2 2.54 34 1 0 16 0 1 49.2 31 16 14 3 2 25 4 43 3 0 .179
Young,C R 8 6 3.15 19 18 0 0 0 0 111.1 84 40 39 16 2 38 2 63 3 1 .208
SEATTLE 51 44 3.16 95 95 1 94 7 29 848.2 706 321 298 83 26 267 19 741 46 5 .226
OPPONENTS 44 51 3.69 95 95 7 88 11 28 842.1 784 378 345 79 35 229 17 744 42 2 .245
Overall Statistics
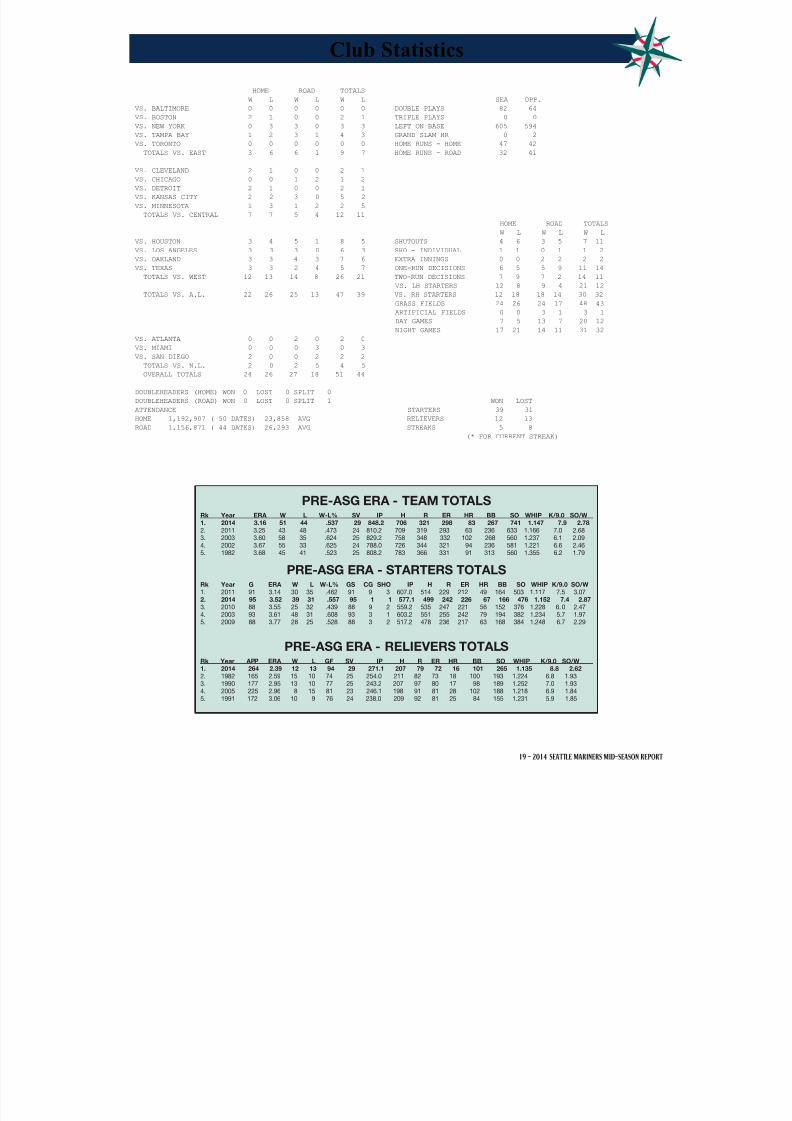
8/12/2019 2014 Mid-Season Report
http://slidepdf.com/reader/full/2014-mid-season-report 21/80
19 - 2014 SEATTLE MARINERS MID-SEASON REPORT
HOME ROAD TOTALS
W L W L W L SEA OPP.
VS. BALTIMORE 0 0 0 0 0 0 DOUBLE PLAYS 82 64
VS. BOSTON 2 1 0 0 2 1 TRIPLE PLAYS 0 0
VS. NEW YORK 0 3 3 0 3 3 LEFT ON BASE 605 594
VS. TAMPA BAY 1 2 3 1 4 3 GRAND SLAM HR 0 2
VS. TORONTO 0 0 0 0 0 0 HOME RUNS - HOME 47 42
TOTALS VS. EAST 3 6 6 1 9 7 HOME RUNS - ROAD 32 41
VS. CLEVELAND 2 1 0 0 2 1
VS. CHICAGO 0 0 1 2 1 2
VS. DETROIT 2 1 0 0 2 1
VS. KANSAS CITY 2 2 3 0 5 2
VS. MINNESOTA 1 3 1 2 2 5
TOTALS VS. CENTRAL 7 7 5 4 12 11
HOME ROAD TOTALS
W L W L W L
VS. HOUSTON 3 4 5 1 8 5 SHUTOUTS 4 6 3 5 7 11
VS. LOS ANGELES 3 3 3 0 6 3 SHO - INDIVIDUAL 1 1 0 1 1 2
VS. OAKLAND 3 3 4 3 7 6 EXTRA INNINGS 0 0 2 2 2 2
VS. TEXAS 3 3 2 4 5 7 ONE-RUN DECISIONS 6 5 5 9 11 14
TOTALS VS. WEST 12 13 14 8 26 21 TWO-RUN DECISIONS 7 9 7 2 14 11
VS. LH STARTERS 12 8 9 4 21 12
TOTALS VS. A.L. 22 26 25 13 47 39 VS. RH STARTERS 12 18 18 14 30 32
GRASS FIELDS 24 26 24 17 48 43
ARTIFICIAL FIELDS 0 0 3 1 3 1
DAY GAMES 7 5 13 7 20 12
NIGHT GAMES 17 21 14 11 31 32
VS. ATLANTA 0 0 2 0 2 0
VS. MIAMI 0 0 0 3 0 3
VS. SAN DIEGO 2 0 0 2 2 2
TOTALS VS. N.L. 2 0 2 5 4 5
OVERALL TOTALS 24 26 27 18 51 44
DOUBLEHEADERS (HOME) WON 0 LOST 0 SPLIT 0
DOUBLEHEADERS (ROAD) WON 0 LOST 0 SPLIT 1 WON LOST
ATTENDANCE STARTERS 39 31
HOME 1,192,907 ( 50 DATES) 23,858 AVG RELIEVERS 12 13
ROAD 1,156,871 ( 44 DATES) 26,293 AVG STREAKS 5 8
(* FOR CURRENT STREAK)
Club Statistics
PRE-ASG ERA - TEAM TOTALSRk Year ERA W L W-L% SV IP H R ER HR BB SO WHIP K/9.0 SO/W1. 2014 3.16 51 44 .537 29 848.2 706 321 298 83 267 741 1.147 7.9 2.78
2. 2011 3.25 43 48 .473 24 810.2 709 319 293 63 236 633 1.166 7.0 2.683. 2003 3.60 58 35 .624 25 829.2 758 348 332 102 268 560 1.237 6.1 2.094. 2002 3.67 55 33 .625 24 788.0 726 344 321 94 236 581 1.221 6.6 2.465. 1982 3.68 45 41 .523 25 808.2 783 366 331 91 313 560 1.355 6.2 1.79
PRE-ASG ERA - STARTERS TOTALSRk Year G ERA W L W-L% GS CG SHO IP H R ER HR BB SO WHIP K/9.0 SO/W
1. 2011 91 3.14 30 35 .462 91 9 3 607.0 514 229 212 49 164 503 1.117 7.5 3.07
2. 2014 95 3.52 39 31 .557 95 1 1 577.1 499 242 226 67 166 476 1.152 7.4 2.873. 2010 88 3.55 25 32 .439 88 9 2 559.2 535 247 221 56 152 376 1.228 6.0 2.474. 2003 93 3.61 48 31 .608 93 3 1 603.2 551 255 242 79 194 382 1.234 5.7 1.975. 2009 88 3.77 28 25 .528 88 3 2 517.2 478 236 217 63 168 384 1.248 6.7 2.29
PRE-ASG ERA - RELIEVERS TOTALSRk Year APP ERA W L GF SV IP H R ER HR BB SO WHIP K/9.0 SO/W1. 2014 264 2.39 12 13 94 29 271.1 207 79 72 16 101 265 1.135 8.8 2.62
2. 1982 165 2.59 15 10 74 25 254.0 211 82 73 18 100 193 1.224 6.8 1.933. 1990 177 2.95 13 10 77 25 243.2 207 97 80 17 98 189 1.252 7.0 1.934. 2005 225 2.96 8 15 81 23 246.1 198 91 81 28 102 188 1.218 6.9 1.845. 1991 172 3.06 10 9 76 24 238.0 209 92 81 25 84 155 1.231 5.9 1.85

8/12/2019 2014 Mid-Season Report
http://slidepdf.com/reader/full/2014-mid-season-report 22/80
20 - 2014 SEATTLE MARINERS MID-SEASON REPORT
BLAKE BEAVAN • #49 • RHPDate Opp Dec W L ERA GS CG IP H R ER BB SO HR BF P/K 4/15 @TEX L 0 1 4.50 1 0 4.0 6 2 2 0 1 2 16 63-38
JOE BEIMEL • #97 • LHPDate Opp Dec W L ERA GS CG IP H R ER BB SO HR BF P/K 4/1 @LAA H 0 0 0.00 0 0 0.1 0 0 0 0 0 0 0 0-0
4/2 @LAA -- 0 0 0.00 0 0 1.0 0 0 0 0 0 0 3 8-74/3 @OAK -- 0 0 0.00 0 0 1.1 1 0 0 0 1 0 5 14-94/9 LAA -- 0 0 0.00 0 0 0.1 2 0 0 0 1 0 3 14-114/12 OAK -- 0 0 0.00 0 0 2.0 0 0 0 1 0 0 7 28-184/15 @TEX -- 0 0 0.00 0 0 1.0 1 0 0 1 1 0 5 10-64/17 @TEX L 0 1 2.57 0 0 1.0 1 2 2 1 1 0 5 18-134/18 @MIA -- 0 1 2.00 0 0 2.0 2 0 0 1 3 0 9 23-164/20 @MIA H 0 1 1.93 0 0 0.1 0 0 0 0 0 0 1 1-14/26 TEX -- 0 1 3.60 0 0 0.2 4 2 2 0 0 0 6 13-95/2 @HOU H 0 1 3.48 0 0 0.1 0 0 0 0 1 0 1 3-35/3 @HOU H 0 1 3.27 0 0 0.2 0 0 0 0 0 0 1 10-65/5 @OAK H 0 1 3.00 0 0 1.0 1 0 0 0 0 0 4 12-75/11 KC -- 0 1 2.77 0 0 1.0 0 0 0 0 1 0 3 15-95/16 @MIN -- 0 1 2.63 0 0 0.2 2 0 0 0 0 0 4 12-95/21 @TEX -- 0 1 2.57 0 0 0.1 0 0 0 0 1 0 1 5-35/24 HOU -- 0 1 2.40 0 0 1.0 2 0 0 0 0 0 5 19-135/29 LAA -- 0 1 2.16 0 0 1.2 1 0 0 1 0 0 6 20-126/2 @NYY -- 0 1 2.04 0 0 1.0 0 0 0 0 1 0 3 12-86/6 @TB -- 0 1 1.93 0 0 1.0 1 0 0 2 0 0 6 15-66/9 @TB W 1 1 1.86 0 0 0.2 0 0 0 0 1 0 2 10-76/11 NYY -- 1 1 1.77 0 0 1.0 1 0 0 0 0 0 4 20-146/14 TEX -- 1 1 1.69 0 0 1.0 1 0 0 0 0 0 4 14-96/16 SD -- 1 1 1.61 0 0 1.0 0 0 0 2 0 0 4 20-106/19 @SD -- 1 1 1.57 0 0 0.2 1 0 0 0 1 0 3 10-76/20 @KC -- 1 1 1.54 0 0 0.1 0 0 0 0 0 0 1 1-16/24 BOS W 2 1 1.46 0 0 1.1 1 0 0 0 1 0 5 18-136/27 CLE H 2 1 1.40 0 0 1.0 0 0 0 0 2 0 3 12-77/4 @CWS -- 2 1 1.35 0 0 1.0 0 0 0 0 0 0 3 11-87/8 MIN -- 2 1 1.30 0 0 1.0 2 0 0 1 1 0 5 16-97/10 MIN -- 2 1 1.24 0 0 1.1 1 0 0 1 0 0 6 25-137/13 OAK -- 2 1 1.50 0 0 1.0 1 1 1 0 0 1 4 13-7Totals (32 G/0 GS) 2 1 1.50 0 0 30 26 5 5 11 17 1 -- --
ROENIS ELIAS • #29 • LHPDate Opp Dec W L ERA GS CG IP H R ER BB SO HR BF P/K 4/3 @OAK -- 0 0 1.80 1 0 5.0 2 1 1 3 3 0 18 80-464/9 LAA L 0 1 2.70 2 0 5.0 4 2 2 1 2 1 21 91-544/14 @TEX W 1 1 2.16 3 0 6.2 5 1 1 2 5 0 24 104-704/19 @MIA L 1 2 3.22 4 0 5.2 8 6 4 5 5 1 29 111-644/25 TEX -- 1 2 3.54 5 0 5.2 5 3 3 3 6 0 24 96-625/1 @NYY W 2 2 3.34 6 0 7.0 6 2 2 2 10 1 28 110-735/6 @OAK W 3 2 3.48 7 0 6.1 5 3 3 3 6 1 27 107-645/11 KC -- 3 2 3.69 8 0 5.0 9 5 3 1 5 1 25 87-615/17 @MIN L 3 3 3.88 9 0 7.0 6 4 4 1 4 1 27 92-625/22 HOU -- 3 3 3.68 10 0 5.1 3 1 1 4 6 1 23 100-535/27 LAA L 3 4 4.02 11 0 6.1 8 5 5 1 5 0 28 92-60
6/1 DET W 4 4 3.53 12 1 9.0 3 0 0 1 8 0 31 111-726/7 @TB W 5 4 3.64 13 0 7.2 5 4 4 2 5 2 30 99-606/12 NYY L 5 5 4.13 14 0 3.1 6 6 6 3 4 1 19 70-396/17 SD W 6 5 3.91 15 0 7.0 3 1 1 0 6 1 24 87-606/22 @KC W 7 5 3.74 16 0 6.2 5 1 1 2 5 0 27 92-596/28 CLE L 7 6 3.96 17 0 6.0 6 5 5 2 2 1 25 100-587/4 @CWS L 7 7 4.19 18 0 5.0 7 5 5 1 6 2 24 87-557/9 MIN L 7 8 4.54 19 0 3.1 7 7 6 3 3 0 20 83-51Totals (19 G/19 GS) 7 8 4.54 19 1 113.0 103 62 57 40 96 14 -- --
DANNY FARQUHAR • #40 • RHPDate Opp Dec W L ERA GS CG IP H R ER BB SO HR BF P/K 3/31 @LAA -- 0 0 0.00 0 0 1.0 0 0 0 0 1 0 3 17-114/3 @OAK -- 0 0 0.00 0 0 1.2 0 0 0 2 3 0 7 39-234/8 LAA H 0 0 0.00 0 0 1.2 0 0 0 1 1 0 6 19-124/11 OAK -- 0 0 1.93 0 0 0.1 0 1 1 1 1 0 2 12-64/14 @TEX -- 0 0 1.59 0 0 1.0 2 0 0 0 1 0 5 23-174/17 @TEX -- 0 0 1.17 0 0 2.0 2 0 0 0 0 0 8 30-204/19 @MIA -- 0 0 1.00 0 0 1.1 0 0 0 1 2 0 5 20-114/20 @MIA H 0 0 0.93 0 0 0.2 0 0 0 1 0 0 3 15-74/22 HOU -- 0 0 1.69 0 0 1.0 4 1 1 0 1 0 7 37-254/26 TEX -- 0 0 1.64 0 0 0.1 0 0 0 0 0 0 1 3-24/27 TEX W 1 0 1.50 0 0 1.0 1 0 0 0 1 0 4 20-13
4/29 @NYY -- 1 0 1.38 0 0 1.0 1 0 0 0 2 0 4 20-135/2 @HOU -- 1 0 1.20 0 0 2.0 1 0 0 1 4 0 8 34-225/4 @HOU S 1 0 1.59 0 0 2.0 3 1 1 0 2 0 9 33-225/7 @OAK-1 -- 1 0 1.45 0 0 1.2 0 0 0 1 2 0 6 26-165/11 KC BS/L 1 1 3.20 0 0 1.0 2 4 4 2 1 1 7 31-185/13 TB -- 1 1 3.15 0 0 0.1 0 0 0 0 1 0 1 3-35/14 TB -- 1 1 3.00 0 0 1.0 0 0 0 0 1 0 3 9-65/20 @TEX -- 1 1 2.91 0 0 0.2 0 0 0 0 0 0 2 11-85/23 HOU -- 1 1 2.82 0 0 0.2 0 0 0 0 1 0 2 8-75/25 HOU -- 1 1 2.70 0 0 1.0 1 0 0 0 1 0 3 11-85/26 LAA -- 1 1 2.59 0 0 1.0 0 0 0 0 1 0 3 12-75/29 LAA -- 1 1 2.81 0 0 1.1 4 1 1 0 0 0 8 20-146/3 @ATL H 1 1 2.70 0 0 1.0 1 0 0 0 1 0 4 15-86/7 @TB H 1 1 2.67 0 0 0.1 0 0 0 0 0 0 1 3-26/9 @TB H 1 1 2.48 0 0 2.0 1 0 0 1 2 0 7 27-176/12 NYY -- 1 1 2.40 0 0 1.0 0 0 0 0 2 0 3 16-106/14 TEX BS 1 1 3.19 0 0 1.0 3 3 3 0 3 1 6 27-166/17 SD -- 1 1 3.09 0 0 1.0 0 0 0 0 0 0 3 11-76/20 @KC -- 1 1 3.06 0 0 0.1 2 0 0 1 0 0 4 10-86/22 @KC H 1 1 3.00 0 0 0.2 0 0 0 0 1 0 2 6-46/24 BOS -- 1 1 2.94 0 0 0.2 1 0 0 1 1 0 4 19-116/27 CLE H 1 1 2.86 0 0 1.0 0 0 0 1 1 0 4 18-9
Danny Farquhar Continued:
7/2 @HOU H 1 1 2.80 0 0 0.2 1 0 0 0 1 0 3 14-107/5 @CWS -- 1 1 2.68 0 0 1.2 1 0 0 0 3 0 6 23-177/7 MIN H 1 1 2.61 0 0 1.0 0 0 0 0 2 0 3 11-97/10 MIN -- 1 1 2.93 0 0 2.0 4 2 2 0 0 0 9 26-167/13 OAK -- 1 1 2.88 0 0 0.2 1 0 0 0 1 0 4 14-8Totals (38 G/0 GS) 1 1 2.88 0 0 40.2 36 13 13 14 45 2 -- --
CHARLIE FURBUSH • #41 • LHPDate Opp Dec W L ERA GS CG IP H R ER BB SO HR BF P/K 3/31 @LAA H 0 0 0.00 0 0 0.1 1 0 0 0 0 0 2 5-44/3 @OAK H 0 0 9.00 0 0 0.2 1 1 1 1 1 0 4 18-114/9 LAA -- 0 0 4.50 0 0 1.0 1 0 0 0 1 0 4 15-94/11 OAK H 0 0 3.38 0 0 0.2 1 0 0 0 0 0 3 7-44/13 OAK L 0 1 7.36 0 0 1.0 2 2 2 1 1 1 6 22-144/16 @TEX H 0 1 6.23 0 0 0.2 0 0 0 0 1 0 2 12-74/18 @MIA -- 0 1 4.76 0 0 1.1 1 0 0 0 0 0 4 9-84/20 @MIA H 0 1 6.00 0 0 0.1 1 1 1 0 0 0 2 5-34/23 HOU -- 0 1 5.14 0 0 1.0 1 0 0 1 1 0 5 17-104/26 TEX L 0 2 6.43 0 0 0.0 0 1 1 0 0 0 1 3-14/27 TEX -- 0 2 5.63 0 0 1.0 0 0 0 0 2 0 3 13-94/29 @NYY H 0 2 4.82 0 0 1.1 1 0 0 0 1 0 4 21-115/2 @HOU L 0 3 5.79 0 0 0.0 3 1 1 0 0 0 4 13-85/4 @HOU -- 0 3 7.71 0 0 0.0 2 2 2 0 0 0 2 6-35/5 @OAK H 0 3 7.20 0 0 0.2 0 0 0 0 0 0 1 4-25/6 @OAK H 0 3 6.97 0 0 0.1 0 0 0 0 1 0 1 3-35/9 KC -- 0 3 6.55 0 0 0.2 0 0 0 1 0 0 3 20-135/14 TB -- 0 3 6.00 0 0 1.0 0 0 0 1 3 0 4 18-105/20 @TEX -- 0 3 5.84 0 0 0.1 0 0 0 0 0 0 1 2-25/23 HOU -- 0 3 5.68 0 0 0.1 0 0 0 0 0 0 1 5-35/24 HOU -- 0 3 5.27 0 0 1.0 1 0 0 0 1 0 5 21-15
5/26 LAA -- 0 3 5.02 0 0 0.2 0 0 0 0 0 0 2 7-45/30 DET -- 0 3 5.28 0 0 1.0 1 1 1 0 1 1 4 14-125/31 DET -- 0 3 5.17 0 0 0.1 0 0 0 0 0 0 1 2-26/2 @NYY -- 0 3 4.86 0 0 1.0 1 0 0 0 1 0 4 13-116/8 @TB -- 0 3 4.67 0 0 0.2 0 0 0 0 2 0 2 8-66/10 NYY -- 0 3 4.26 0 0 1.2 1 0 0 0 2 0 6 17-126/12 NYY -- 0 3 4.05 0 0 1.0 2 0 0 0 1 0 5 17-136/15 TEX -- 0 3 3.86 0 0 1.0 0 0 0 0 1 0 3 13-96/18 @SD L 0 4 4.15 0 0 0.2 2 1 1 0 0 0 4 19-136/20 @KC W 1 4 4.03 0 0 0.2 0 0 0 0 1 0 2 10-86/22 @KC H 1 4 3.97 0 0 0.1 0 0 0 0 0 0 1 1-16/24 BOS -- 1 4 3.75 0 0 1.1 1 0 0 0 2 0 5 18-146/27 CLE H 1 4 3.70 0 0 0.1 1 0 0 0 0 0 2 8-67/4 @CWS -- 1 4 4.26 0 0 1.0 2 2 2 0 2 0 5 16-127/5 @CWS -- 1 4 4.21 0 0 0.1 0 0 0 0 0 0 1 2-27/10 MIN -- 1 4 4.05 0 0 1.0 1 0 0 0 0 0 4 6-57/13 OAK -- 1 4 4.00 0 0 0.1 0 0 0 0 0 0 1 3-2Totals (38 G/0 GS) 1 4 4.00 0 0 27.0 28 12 12 5 26 2 -- --
FELIX HERNANDEZ • #34 • RHPDate Opp Dec W L ERA GS CG IP H R ER BB SO HR BF P/K 3/31 @LAA W 1 0 3.00 1 0 6.0 4 3 2 1 11 1 25 103-664/5 @OAK W 2 0 1.88 2 0 8.1 6 1 1 1 8 1 32 101-724/11 OAK W 3 0 2.11 3 0 7.0 4 2 2 0 11 0 27 104-714/16 @TEX -- 3 0 1.91 4 0 7.0 4 1 1 1 9 0 26 96-684/21 HOU L 3 1 2.04 5 0 7.0 7 6 2 1 4 1 29 96-604/26 TEX -- 3 1 2.40 6 0 6.0 5 3 3 3 4 0 25 107-665/2 @HOU -- 3 1 2.53 7 0 5.0 5 3 2 3 6 0 24 89-575/7 @OAK (1)-- 3 1 2.73 8 0 6.1 11 4 3 2 0 0 31 97-675/12 TB W 4 1 3.03 9 0 6.2 8 4 4 0 7 0 27 111-735/18 @MIN W 5 1 2.94 10 0 8.0 7 2 2 1 5 0 30 97-665/23 HOU W 6 1 2.75 11 0 8.0 5 1 1 1 9 0 29 102-745/28 LAA W 7 1 2.57 12 0 8.2 4 1 1 2 9 0 30 116-706/2 @NYY W 8 1 2.57 13 0 7.0 8 2 2 0 8 0 27 111-746/8 @TB -- 8 1 2.39 14 0 7.0 4 0 0 1 15 0 26 100-666/13 TEX L 8 2 2.29 15 0 8.1 4 1 1 2 6 0 30 114-776/18 @SD -- 8 2 2.22 16 0 7.0 3 1 1 0 10 0 24 97-636/23 BOS W 9 2 2.24 17 0 7.0 6 2 2 0 6 1 27 95-616/29 CLE W 10 2 2.10 18 0 8.0 1 0 0 3 9 0 27 107-647/5 @CWS -- 10 2 2.11 19 0 8.0 3 2 2 1 8 0 29 108-767/11 OAK W 11 2 2.12 20 0 8.0 6 2 2 2 9 1 31 101-73Totals (20 G/20 GS) 11 2 2.12 20 0 144.1 105 41 34 25 154 5 -- --
HISASHI IWAKUMA • #18 • RHPDate Opp Dec W L ERA GS CG IP H R ER BB SO HR BF P/K
5/3 @HOU W 1 0 5.40 1 0 6.2 6 4 4 1 3 1 26 81-565/8 KC W 2 0 2.45 2 0 8.0 4 0 0 0 7 0 26 93-615/13 TB -- 2 0 1.59 3 0 8.0 4 0 0 0 5 0 28 97-705/20 @TEX W 3 0 1.76 4 0 8.0 6 2 2 1 3 1 29 99-645/25 HOU L 3 1 2.39 5 0 7.0 9 4 4 0 6 2 27 94-665/30 DET L 3 2 3.09 6 0 6.0 8 5 5 2 5 2 26 98-696/4 @ATL W 4 2 2.66 7 0 7.0 6 0 0 0 7 0 26 96-716/10 NYY L 4 3 2.79 8 0 7.1 7 3 3 2 5 0 29 108-696/15 TEX W 5 3 2.59 9 0 8.0 6 1 1 0 6 1 29 106-686/20 @KC -- 5 3 3.04 10 0 5.0 9 5 5 1 5 2 23 76-546/25 BOS L 5 4 3.48 11 0 4.0 8 5 5 1 3 1 21 80-547/1 @HOU W 6 4 3.33 12 0 6.0 7 1 1 0 7 0 25 83-647/7 MIN W 7 4 3.07 13 0 7.0 4 0 0 0 10 0 26 105-727/12 OAK W 8 4 2.98 14 0 8.2 5 2 2 0 8 1 31 104-73Totals (14 G/14 GS) 8 4 2.98 14 0 96.2 89 32 32 8 80 11 -- --
Pitching Lines

8/12/2019 2014 Mid-Season Report
http://slidepdf.com/reader/full/2014-mid-season-report 23/80
21 - 2014 SEATTLE MARINERS MID-SEASON REPORT
DOMINIC LEONE • #52 • RHPDate Opp Dec W L ERA GS CG IP H R ER BB SO HR BF P/K 4/6 @OAK -- 0 0 0.00 0 0 1.0 1 0 0 1 1 0 5 27-154/9 LAA -- 0 0 0.00 0 0 1.1 0 0 0 0 1 0 4 17-104/12 OAK -- 0 0 0.00 0 0 2.0 1 0 0 1 1 0 8 44-274/15 @TEX -- 0 0 0.00 0 0 2.0 1 0 0 0 2 0 6 19-144/17 @TEX -- 0 0 1.08 0 0 2.0 2 1 1 1 2 0 9 34-224/20 @MIA -- 0 0 0.93 0 0 1.1 1 0 0 1 2 0 6 25-17
4/22 HOU -- 0 0 1.69 0 0 1.0 2 1 1 0 1 1 5 11-74/25 TEX -- 0 0 1.50 0 0 1.1 0 0 0 1 1 0 5 20-135/2 @HOU H 0 0 1.42 0 0 0.2 0 0 0 0 2 0 2 9-65/3 @HOU -- 0 0 2.13 0 0 0.0 2 2 2 1 0 1 3 15-75/5 @OAK -- 0 0 2.13 0 0 0.0 0 0 0 1 0 0 1 6-25/6 @OAK H 0 0 1.93 0 0 1.1 2 0 0 1 1 0 7 27-165/11 KC H 0 0 1.80 0 0 1.0 0 0 0 0 2 0 3 19-135/14 TB -- 0 0 1.56 0 0 2.1 1 0 0 0 5 0 7 35-225/21 @TEX -- 0 0 1.53 0 0 0.1 0 0 0 0 0 0 1 5-25/22 HOU W 1 0 1.40 0 0 1.2 1 0 0 0 2 0 6 21-175/24 HOU -- 1 0 1.33 0 0 1.0 0 0 0 0 0 0 3 9-55/27 LAA -- 1 0 1.29 0 0 0.2 0 0 0 1 1 0 3 15-75/29 LAA -- 1 0 1.57 0 0 2.0 4 1 1 0 2 0 10 36-265/31 DET H 1 0 1.52 0 0 0.2 1 0 0 1 0 0 4 15-76/3 @ATL W 2 0 1.40 0 0 2.0 0 0 0 0 4 0 6 28-206/8 @TB -- 2 0 1.38 0 0 0.1 0 0 0 0 0 0 1 3-26/9 @TB H 2 0 1.35 0 0 0.2 0 0 0 0 1 0 2 9-66/12 NYY -- 2 0 1.23 0 0 2.2 2 0 0 1 1 0 11 32-236/17 SD -- 2 0 1.19 0 0 1.0 1 0 0 0 1 0 3 19-136/19 @SD BS/L 2 1 2.35 0 0 0.1 3 4 4 1 0 0 5 15-86/20 @KC BS 2 1 2.32 0 0 0.1 1 0 0 0 0 0 2 10-76/23 BOS -- 2 1 2.25 0 0 1.0 0 0 0 0 2 0 3 18-136/28 CLE -- 2 1 2.18 0 0 1.0 1 0 0 0 1 0 3 12-87/1 @HOU -- 2 1 2.12 0 0 1.0 2 1 0 1 2 0 7 28-187/4 @CWS -- 2 1 2.06 0 0 1.0 0 0 0 0 0 0 3 17-127/6 @CWS -- 2 1 1.95 0 0 2.0 0 0 0 1 3 0 8 29-157/9 MIN -- 2 1 1.88 0 0 1.1 0 0 0 1 3 0 5 23-167/10 MIN -- 2 1 1.83 0 0 1.0 1 0 0 0 1 0 4 14-9Totals (34 G/0 GS) 2 1 1.83 0 0 39.2 30 10 8 15 45 2 -- --
LUCAS LUETGE • #44 • LHPDate Opp Dec W L ERA GS CG IP H R ER BB SO HR BF P/K 4/11 OAK -- 0 0 -.-- 0 0 0.0 0 1 1 1 0 0 1 4-04/13 OAK -- 0 0 18.00 0 0 1.0 1 1 1 0 1 1 4 12-94/27 TEX -- 0 0 7.71 0 0 1.1 0 0 0 1 1 0 5 24-157/10 MIN -- 0 0 5.40 0 0 1.0 1 0 0 1 0 0 4 14-7Totals (4 G/0 GS) 0 0 5.40 0 0 3.1 2 2 2 3 2 1 -- --
BRANDON MAURER • #37 • RHPDate Opp Dec W L ERA GS CG IP H R ER BB SO HR BF P/K 4/20 @MIA -- 0 0 2.08 1 0 4.1 2 1 1 2 4 0 16 63-564/27 TEX -- 0 0 6.75 2 0 3.2 7 5 5 1 3 0 19 77-495/4 @HOU W 1 0 6.92 3 0 5.0 6 4 4 2 3 2 23 88-535/9 KC L 1 1 6.20 4 0 7.1 14 6 4 0 0 0 34 97-715/14 TB L 1 2 6.00 5 0 3.2 2 2 2 4 3 0 17 84-46
5/24 HOU L 1 3 6.99 6 0 4.1 6 6 6 1 2 2 20 72-455/29 LAA L 1 4 7.52 7 0 4.0 6 5 5 4 2 1 22 85-506/25 BOS -- 1 4 7.08 0 0 2.0 1 0 0 0 4 0 7 24-196/28 CLE -- 1 4 6.88 0 0 1.0 0 0 0 0 2 0 3 12-97/1 @HOU -- 1 4 6.51 0 0 2.0 2 0 0 1 1 0 9 33-227/6 @CWS -- 1 4 6.18 0 0 2.0 0 0 0 1 2 0 7 24-167/9 MIN -- 1 4 5.79 0 0 2.2 1 0 0 0 2 0 9 34-237/13 OAK -- 1 4 5.65 0 0 1.0 0 0 0 0 1 0 3 16-11Totals (13 G/7 GS) 1 4 5.56 7 0 43.0 47 29 27 16 29 5 -- --
YOERVIS MEDINA • #31 • RHPDate Opp Dec W L ERA GS CG IP H R ER BB SO HR BF P/K 3/31 @LAA H 0 0 0.00 0 0 0.1 1 0 0 0 0 0 2 3-34/3 @OAK H 0 0 0.00 0 0 1.1 0 0 0 2 2 0 6 27-144/6 @OAK -- 0 0 3.38 0 0 1.0 1 1 1 0 2 1 4 11-84/8 LAA H 0 0 2.45 0 0 1.0 0 0 0 1 1 0 3 15-84/9 LAA -- 0 0 1.80 0 0 1.1 0 0 0 0 1 0 4 11-74/13 OAK -- 0 0 1.50 0 0 1.0 1 0 0 1 1 0 5 18-94/14 @TEX -- 0 0 1.23 0 0 1.1 0 0 0 2 0 0 5 22-104/16 @TEX H 0 0 1.17 0 0 0.1 0 0 0 0 0 0 1 5-34/18 @MIA L 0 1 4.32 0 0 0.2 3 4 3 0 1 1 6 20-144/22 HOU -- 0 1 3.86 0 0 1.0 1 0 0 1 1 0 5 18-94/25 TEX W 1 1 3.48 0 0 1.0 1 0 0 0 0 0 3 5-3
4/26 TEX -- 1 1 3.18 0 0 1.0 1 0 0 0 0 0 4 11-55/1 @NYY H 1 1 2.92 0 0 1.0 0 0 0 0 1 0 3 10-65/2 @HOU BS 1 1 3.38 0 0 1.0 1 1 1 1 1 0 5 17-105/3 @HOU H 1 1 4.61 0 0 0.1 3 2 2 1 0 0 6 17-75/5 @OAK H 1 1 4.50 0 0 0.1 0 0 0 0 0 0 1 3-25/7 @OAK-1 W 2 1 4.20 0 0 1.0 0 0 0 1 1 0 5 13-65/11 KC -- 2 1 3.94 0 0 1.0 1 0 0 0 2 0 4 13-105/12 TB -- 2 1 4.24 0 0 1.0 1 1 1 1 1 0 5 19-125/17 @MIN -- 2 1 4.00 0 0 1.0 0 0 0 0 1 0 3 13-95/23 HOU H 2 1 3.79 0 0 1.0 0 0 0 0 3 0 3 12-95/25 HOU -- 2 1 3.60 0 0 1.0 1 0 0 1 0 0 5 27-155/30 DET -- 2 1 3.43 0 0 1.0 0 0 0 0 1 0 3 11-85/31 DET H 2 1 3.27 0 0 1.0 1 0 0 0 2 0 4 13-96/4 @ATL H 2 1 3.13 0 0 1.0 0 0 0 0 1 0 3 14-76/8 @TB W 3 1 3.00 0 0 1.0 0 0 0 1 0 0 3 9-46/12 NYY -- 3 1 2.88 0 0 1.0 0 0 0 0 2 0 3 16-116/14 TEX -- 3 1 2.77 0 0 1.0 0 0 0 0 1 0 3 13-96/18 @SD -- 3 1 2.73 0 0 0.1 1 0 0 0 0 0 2 9-56/21 @KC W 4 1 2.63 0 0 1.0 0 0 0 0 2 0 3 14-106/22 @KC H 4 1 2.60 0 0 0.1 1 0 0 0 0 0 2 10-76/24 BOS -- 4 1 2.48 0 0 1.1 0 0 0 0 1 0 4 13-106/27 CLE H 4 1 2.43 0 0 0.2 0 0 0 1 0 0 3 11-6
Yoervis Medina Continued:
7/2 @HOU H 4 1 2.40 0 0 0.1 0 0 0 0 0 0 1 1-17/5 @CWS -- 4 1 2.32 0 0 1.0 0 0 0 1 1 0 5 24-107/8 MIN -- 4 1 2.25 0 0 1.0 0 0 0 0 0 0 3 14-97/12 OAK -- 4 1 2.23 0 0 0.1 0 0 0 0 0 0 1 1-1Totals (37 G/0 GS) 4 1 2.23 0 0 32.1 19 9 8 15 31 2 -- --
HECTOR NOESI • #45 • RHP
Date Opp Dec W L ERA GS CG IP H R ER BB SO HR BF P/K 4/2 @LAA -- 0 0 18.00 0 0 1.0 1 2 2 0 2 0 5 25-154/3 @OAK L 0 1 27.00 0 0 0.0 1 1 1 0 0 0 1 2-2
JAMES PAXTON • #65 • LHPDate Opp Dec W L ERA GS CG IP H R ER BB SO HR BF P/K 4/2 @LAA W 1 0 0.00 1 0 7.0 2 0 0 2 9 0 24 99-644/8 LAA W 2 0 2.25 2 0 5.0 4 3 3 0 4 2 19 60-40
STEPHEN PRYOR • #46 • RHPDate Opp Dec W L ERA GS CG IP H R ER BB SO HR BF P/K 7/9 MIN -- 0 0 0.00 0 0 1.2 1 1 0 2 1 0 8 35-17
ERASMO RAMIREZ • #50 • RHPDate Opp Dec W L ERA GS CG IP H R ER BB SO HR BF P/K 4/1 @LAA W 1 0 2.57 1 0 7.0 6 2 2 0 6 1 28 93-624/6 @OAK L 1 1 5.73 2 0 4.0 7 5 5 3 1 1 20 83-494/12 OAK L 1 2 5.63 3 0 5.0 6 3 3 3 3 1 22 94-534/17 @TEX -- 1 2 7.50 4 0 2.0 6 5 5 2 2 1 14 62-354/22 HOU L 1 3 6.75 5 0 6.0 3 3 3 3 8 2 24 98-635/7 @OAK-2 L 1 4 6.00 6 0 6.0 6 2 2 1 4 1 24 105-656/3 @ATL -- 1 4 6.82 7 0 3.0 8 5 5 1 4 2 18 60-376/9 @TB -- 1 4 5.97 8 0 4.2 4 0 0 5 5 0 23 88-506/14 TEX -- 1 4 5.27 9 0 5.0 3 0 0 4 4 0 20 89-556/19 @SD -- 1 4 4.62 10 0 6.0 2 0 0 2 3 0 22 70-496/24 BOS -- 1 4 4.58 11 0 4.1 5 2 2 5 2 1 23 93-49Totals (11 G/11 GS) 1 4 4.58 11 0 53.0 55 27 27 29 42 10 -- --
FERNANDO RODNEY • #56 • RHPDate Opp Dec W L ERA GS CG IP H R ER BB SO HR BF P/K 4/1 @LAA -- 0 0 0.00 0 0 1.0 1 0 0 0 1 0 3 10-74/5 @OAK S 0 0 0.00 0 0 0.2 0 0 0 0 2 0 2 12-74/8 LAA S 0 0 0.00 0 0 1.0 0 0 0 2 2 0 5 21-114/11 OAK S 0 0 0.00 0 0 1.0 1 0 0 0 2 0 4 13-94/16 @TEX BS/L 0 1 0.00 0 0 0.2 2 2 0 1 1 0 6 24-114/19 @MIA -- 0 1 1.69 0 0 1.0 2 1 1 0 1 0 5 16-94/23 HOU W 1 1 1.42 0 0 1.0 1 0 0 1 1 0 5 28-174/25 TEX S 1 1 3.68 0 0 1.0 2 2 2 2 0 0 7 27-134/27 TEX S 1 1 3.24 0 0 1.0 0 0 0 0 2 0 3 12-94/29 @NYY -- 1 1 3.86 0 0 1.0 3 1 1 0 3 0 6 26-165/1 @NYY S 1 1 3.48 0 0 1.0 1 0 0 0 1 0 4 18-105/3 @HOU S 1 1 3.09 0 0 1.1 0 0 0 0 2 0 5 25-155/5 @OAK S 1 1 2.84 0 0 1.0 0 0 0 0 1 0 3 9-8
5/7 @OAK-1 S 1 1 2.63 0 0 1.0 1 0 0 0 1 0 4 11-95/8 KC S 1 1 2.45 0 0 1.0 0 0 0 2 1 0 5 17-75/10 KC S 1 1 2.30 0 0 1.0 1 0 0 0 0 0 4 13-95/13 TB BS/L 1 2 3.31 0 0 0.2 4 2 2 1 1 1 7 26-165/18 @MIN -- 1 2 3.12 0 0 1.0 1 0 0 0 1 0 4 18-115/22 HOU S 1 2 2.95 0 0 1.0 0 0 0 0 0 0 3 13-75/26 LAA -- 1 2 2.79 0 0 1.0 1 0 0 0 0 0 3 10-75/28 LAA S 1 2 2.75 0 0 0.1 0 0 0 0 0 0 1 3-35/31 DET S 1 2 2.61 0 0 1.0 1 0 0 1 2 0 5 26-176/3 @ATL S 1 2 2.49 0 0 1.0 0 0 0 0 2 0 3 16-96/4 @ATL S 1 2 2.38 0 0 1.0 0 0 0 0 1 0 3 12-96/7 @TB S 1 2 2.28 0 0 1.0 0 0 0 0 1 0 3 8-66/9 @TB S 1 2 2.19 0 0 1.0 0 0 0 0 0 0 3 12-76/13 TEX -- 1 2 2.13 0 0 0.2 0 0 0 0 0 0 2 7-66/14 TEX L 1 3 2.39 0 0 1.0 2 1 1 0 1 0 5 22-176/19 @SD -- 1 3 2.30 0 0 1.0 0 0 0 0 1 0 3 12-106/20 @KC S 1 3 2.22 0 0 1.0 2 0 0 0 2 0 5 23-196/21 @KC S 1 3 2.15 0 0 1.0 0 0 0 1 1 0 3 11-56/22 @KC S 1 3 2.08 0 0 1.0 1 0 0 0 1 0 4 12-96/27 CLE S 1 3 2.30 0 0 1.0 2 1 1 0 1 0 5 15-126/29 CLE S 1 3 2.23 0 0 1.0 0 0 0 0 1 0 3 10-77/2 @HOU S 1 3 2.16 0 0 1.0 0 0 0 0 1 0 3 15-97/5 @CWS S 1 3 2.10 0 0 1.0 0 0 0 0 1 0 3 15-117/7 MIN S 1 3 2.04 0 0 1.0 0 0 0 0 2 0 3 15-107/11 OAK S 1 3 1.98 0 0 1.0 0 0 0 1 1 0 4 26-15Totals (38 G/0 GS) 1 3 1.98 0 0 36.1 29 10 8 12 42 1 -- --
TAIJUAN WALKER • #32 • RHPDate Opp Dec W L ERA GS CG IP H R ER BB SO HR BF P/K 6/30 @HOU W 1 0 4.50 1 0 6.0 5 3 3 2 6 2 24 94-587/6 @CWS L 1 1 3.60 2 0 4.0 2 1 1 5 3 0 19 83-49
Pitching Lines

8/12/2019 2014 Mid-Season Report
http://slidepdf.com/reader/full/2014-mid-season-report 24/80
22 - 2014 SEATTLE MARINERS MID-SEASON REPORT
Pitching Lines
TOM WILHELMSEN • #54 • RHPDate Opp Dec W L ERA GS CG IP H R ER BB SO HR BF P/K 3/31 @LAA H 0 0 0.00 0 0 1.1 0 0 0 0 1 0 4 17-94/1 @LAA -- 0 0 0.00 0 0 0.2 1 1 0 1 1 0 4 18-84/3 @OAK BS 0 0 0.00 0 0 1.0 1 0 0 2 0 0 5 19-104/8 LAA H 0 0 0.00 0 0 0.1 0 0 0 0 1 0 1 5-34/15 @TEX -- 0 0 6.23 0 0 1.0 3 3 3 1 1 0 7 23-12
4/17 @TEX -- 0 0 5.06 0 0 1.0 1 0 0 1 1 0 5 26-124/18 @MIA -- 0 0 4.26 0 0 1.0 0 0 0 0 0 0 3 12-64/20 @MIA L 0 1 4.91 0 0 1.0 0 1 1 2 0 0 6 26-114/21 HOU -- 0 1 4.82 0 0 2.0 2 1 1 1 0 1 9 26-164/26 TEX -- 0 1 4.35 0 0 1.0 1 0 0 0 2 0 4 18-135/2 @HOU H 0 1 3.65 0 0 1.0 1 0 0 1 1 0 5 19-105/4 @HOU H 0 1 3.14 0 0 2.0 0 0 0 0 2 0 6 30-195/6 @OAK -- 0 1 2.93 0 0 1.0 0 0 0 1 1 0 4 22-145/7 @OAK-2 -- 0 1 2.60 0 0 2.0 1 0 0 0 2 0 7 20-155/9 KC -- 0 1 2.45 0 0 1.0 2 0 0 0 2 0 5 14-105/12 TB -- 0 1 2.29 0 0 1.1 1 0 0 0 2 0 5 29-215/14 TB -- 0 1 2.18 0 0 1.0 0 0 0 1 1 0 5 18-95/16 @MIN -- 0 1 2.14 0 0 0.1 0 0 0 0 1 0 1 3-35/21 @TEX -- 0 1 2.05 0 0 1.0 1 0 0 0 0 0 4 19-135/24 HOU -- 0 1 3.04 0 0 1.2 2 3 3 4 1 0 11 52-275/27 LAA -- 0 1 3.16 0 0 2.0 3 1 1 0 3 1 9 26-195/30 DET -- 0 1 3.04 0 0 1.0 0 0 0 0 2 0 3 9-76/3 @ATL -- 0 1 2.83 0 0 2.0 1 0 0 2 2 0 8 30-196/6 @TB -- 0 1 2.93 0 0 2.0 2 1 1 1 1 0 10 36-206/11 NYY -- 0 1 2.67 0 0 3.0 2 0 0 1 3 0 11 38-256/16 SD -- 0 1 2.78 0 0 2.0 1 1 1 0 1 1 7 30-206/20 @KC -- 0 1 2.68 0 0 1.1 0 0 0 0 1 0 4 14-96/23 BOS -- 0 1 2.84 0 0 1.0 1 1 1 0 1 0 5 14-86/25 BOS -- 0 1 2.63 0 0 3.0 2 0 0 0 3 0 9 35-27
6/28 CLE -- 0 1 2.57 0 0 1.0 0 0 0 0 1 0 3 13-116/30 @HOU S 0 1 2.60 0 0 3.0 1 1 1 2 0 0 12 36-227/5 @CWS W 1 1 2.49 0 0 2.0 0 0 0 0 2 0 6 18-127/10 MIN L 1 2 2.54 1 0 2.2 1 2 1 3 3 0 12 54-32Totals (34 G/1 GS) 1 2 2.54 1 0 49.2 31 16 14 25 43 3 -- --
CHRIS YOUNG • #53 • RHPDate Opp Dec W L ERA GS CG IP H R ER BB SO HR BF P/K 4/6 @OAK -- 0 0 0.00 0 0 2.0 0 0 0 0 2 0 6 22-134/13 OAK -- 0 0 0.00 1 0 6.0 4 0 0 3 2 0 25 97-604/18 @MIA -- 0 0 3.27 2 0 3.0 7 4 4 3 0 1 17 73-384/23 HOU -- 0 0 3.50 3 0 7.0 4 3 3 5 6 1 29 113-634/29 @NYY W 1 0 3.04 4 0 5.2 3 2 1 3 3 1 24 105-63
5/5 @OAK W 2 0 3.03 5 0 6.0 3 2 2 2 2 1 22 82-575/10 KC W 3 0 2.63 6 0 8.0 3 1 1 0 3 0 27 93-605/16 @MIN L 3 1 3.22 7 0 7.0 10 5 5 1 0 2 32 101-675/21 @TEX L 3 2 3.53 8 0 6.1 7 4 4 3 1 2 29 99-585/26 LAA W 4 2 3.30 9 0 6.1 2 1 1 3 5 1 23 98-595/31 DET W 5 2 3.27 10 0 6.0 3 2 2 2 6 1 23 106-696/6 @TB L 5 3 3.42 11 0 5.0 7 3 3 5 3 0 27 102-616/11 NYY L 5 4 3.68 12 0 5.0 7 4 4 2 2 1 24 96-596/16 SD W 6 4 3.40 13 0 6.0 4 0 0 1 6 0 22 88-566/21 @KC -- 6 4 3.23 14 0 7.0 3 1 1 1 2 1 23 99-726/27 CLE W 7 4 3.15 15 0 5.0 4 1 1 1 4 0 21 91-617/2 @HOU W 8 4 3.11 16 0 7.0 2 2 2 1 8 2 24 99-707/8 MIN L 8 5 3.08 17 0 7.0 6 2 2 1 6 1 27 102-707/13 OAK L 8 6 3.15 18 0 6.0 5 3 3 1 2 1 24 90-56Totals (19 G/18 GS) 8 6 3.15 18 0 111.1 84 40 39 38 63 16 -- --
SEATTLE MARINERS PRE-ALL-STAR GAME RECORDS Category Pre-ASG Record 2014 Leaders
Batting Average Edgar Martinez, 1995 -- .363 Robinson Cano -- .334
Hits Ichiro Suzuki, 2003 -- 137 Robinson Cano -- 118
Runs Alex Rodriguez, 2000 -- 84 Robinson Cano -- 49
Home runs Ken Griffey Jr., 1998 -- 35 Kyle Seager -- 15
Doubles Edgar Martinez, 1996 -- 42 Cano/Seager -- 22
Triples Phil Bradley, 1987 -- 10 James Jones -- 4
RBI Edgar Martinez, 2000 -- 87 Kyle Seager -- 63
Stolen Bases Harold Reynolds, 1987 -- 32 James Jones -- 17
Walks Edgar Martinez, 1996 -- 74 Cano/Seager -- 33
Strikeouts J. Presley, 1986; M. Zunino, 2014 -- 97 Mike Zunino -- 97
Category Pre-ASG Record 2014 Leaders
Wins R. Johnson, 1997; J. Moyer, 2003 -- 12 Felix Hernandez -- 11
Losses Erik Hanson, 1992 -- 11 Roenis Elias -- 8
Low ERA (starter) Felix Hernandez, 2014 -- 2.12 Felix Hernandez -- 2.12
High ERA (starter) Mike Parrott, 1980 -- 7.53 Erasmo Ramirez -- 4.58
Low ERA (relief) S. Hasegawa, 2003, 0.77 Joe Beimel -- 1.50
High ERA (relief) Heathcliffe Slocumb, 1998 -- 8.15 Brandon Maurer -- 5.65
Strikeouts Randy Johnson, 1993 -- 164 Felix Hernandez -- 154
Walks Randy Johnson, 1991 -- 87 Roenis Elias-- 40
HR Allowed Jamie Moyer, 2004 -- 25 Chris Young -- 16
Saves Kazuhiro Sasaki, 2001 -- 29 Fernando Rodney -- 27

8/12/2019 2014 Mid-Season Report
http://slidepdf.com/reader/full/2014-mid-season-report 25/80
23 - 2014 SEATTLE MARINERS MID-SEASON REPORT
Mid-Season Report
SCORE BY INNINGS 1 2 3 4 5 6 7 8 9 X Total
Mariners 34 46 37 44 49 43 50 30 42 3 378
Opponent 44 30 38 38 48 26 30 35 30 2 321
HOME RUN BREAKDOWNRECORD BY HOME RUN… 0 1 2 3 4 5 6
18-30 13-9 16-3 3-2 1-0 0-0 0-0
HOME RUNS BY POSITION… Total C 1B 2B 3B SS LF CF RF DH PH P
79 14 12 5 15 9 4 1 10 8 1 0
Grand Slams (0): None
Back-to-Back (3): Smoak & Hart (4/2 @LAA, 9th inning), Cano & Hart (4/17 @TEX, 3rd inning),
Seager & Ackley (5/11 vs. KC, 4th inning)
Inside-the-Park (0): None
Pinch-Hit (1): Stefen Romero, 6/3 at ATL
Leadoff (1): Michael Saunders, 4/26 vs. TEX
Game-Ending (1): Kyle Seager, 4/23 vs. HOU
Game-Winning in Last AB on Road (1): Brad Miller, 6/20 at KC
Multi (6): Miller - 2 (4/1 @LAA), Hart - 2 (4/8 vs. LAA), Seager - 2 (4/23 vs. HOU) & (4/27 vs. TEX),
Ackley - 2 (5/11 vs. KC), Morrison - 2 (6/22 vs. BOS)
Player Solo 2R 3R GS Total Ackley 3 1 -- -- 4 Almonte 1 -- -- -- 1Bloomquist -- 1 -- -- 1Buck -- 1 -- -- 1Cano -- 4 3 -- 7Chavez 1 -- -- -- 1Gillespie 1 -- -- -- 1Hart 4 -- 1 -- 5Miller 7 1 -- -- 8Montero -- 1 -- -- 1Morrison 3 2 -- -- 5Romero 2 -- 1 -- 3Saunders 4 2 -- -- 6Seager 5 5 5 -- 15Smoak 2 4 1 -- 7Zunino 8 4 1 -- 13Team 41 26 12 0 79
Runs via HR: 129
STARTS BY POSITION (Team Record)
1B 2B SS 3B LF CF RF C DH Ackley -- -- -- -- 35-35 -- -- -- 3-1 Almonte -- -- -- -- -- 10-15 -- -- --Bloomquist 4-1 4-1 6-4 3-2 1-2 -- -- -- 1-0Buck -- -- -- -- -- -- -- 8-11 5-0Cano -- 47-38 -- -- -- -- -- -- 2-4Chavez -- -- -- -- 3-3 2-1 8-5 -- 5-2Franklin -- 0-5 4-1 -- -- -- 1-0 -- 1-1Gillespie -- -- -- -- 11-4 -- 4-1 -- 0-2Hart 0-1 -- -- -- -- -- 0-2 -- 23-19Jones -- -- -- -- -- 32-26 -- -- --Miller -- -- 41-39 -- -- -- -- -- --Morrison 15-13 -- -- -- -- -- 2-2 -- 2-3Montero 1-0 -- -- -- -- -- -- -- 2-1Romero -- -- -- -- 1-0 -- 19-10 -- 3-6Saunders -- -- -- -- -- 7-2 17-24 -- --Seager -- -- -- 48-42 -- -- -- -- 1-0Smoak 31-29 -- -- -- -- -- -- -- --Sucre -- -- -- -- -- -- -- 1-0 --Zunino -- -- -- -- -- -- -- 42-33 1-0
STARTS BY BATTING ORDER (Team Record) 1 2 3 4 5 6 7 8 9 Ackley -- 0-2 -- -- 0-1 5-4 18-20 15-8 0-1 Almonte 10-13 0-1 -- -- -- -- -- -- 0-1Bloomquist 4-2 3-1 -- -- -- 0-1 0-1 1-1 11-4Buck -- -- -- 1-1 1-0 3-3 2-1 3-4 3-2Cano -- -- 49-42 -- -- -- -- -- --Chavez 15-11 2-0 -- -- -- -- -- 1-0 --Franklin -- 0-1 -- -- -- 1-3 1-2 1-1 3-0Gillespie -- 1-1 -- 0-1 0-1 4-0 7-0 2-2 1-2Hart -- -- -- 17-17 5-3 1-2 -- -- --Jones 13-13 19-13 -- -- -- -- -- -- --Miller -- 9-12 -- -- -- -- -- 15-6 17-21Morrison -- -- -- 5-1 9-10 3-3 2-4 -- --Montero -- -- -- 0-1 1-0 -- -- 2-0 --Romero -- 10-6 -- 2-0 1-3 2-3 8-1 0-2 0-1Saunders 9-5 7-6 1-2 -- 0-3 -- 5-7 2-3 --Seager -- 0-1 -- 13-12 18-15 15-11 3-3 -- --Smoak -- -- -- 13-11 11-8 5-7 2-3 -- --Sucre -- -- -- -- -- -- -- -- 1-0Zunino -- -- 1-0 -- 5-0 12-7 3-2 9-17 13-7
STARTING PITCHER - Hernandez (14-6), Ramirez (4-7), Iwakuma (9-5), Paxton (2-0), Elias (9-10), Young (10-8), Beavan (0-1), Maurer (2-5), Walker (1-1), Wilhelmsen (0-1)
MARINERS MULTI-HIT GAMES:
Player 2 3 4 5 Total Ackley 11 4 -- -- 15 Almonte 4 -- -- -- 4Bloomquist 10 -- -- -- 10Buck 2 2 -- -- 4Cano 30 6 1 -- 37Chavez 10 1 -- -- 11Franklin 2 -- -- -- 2
Gillespie 4 -- -- -- 4Hart 9 -- -- -- 9Jones 9 5 1 -- 15Miller 13 -- -- -- 13Montero -- -- -- -- 0Morrison 4 1 1 -- 6Romero 8 1 -- -- 9Saunders 13 3 -- -- 16Seager 23 5 2 -- 30Smoak 10 -- -- -- 10Sucre -- -- -- -- --Zunino 12 -- 1 -- 13Team 174 28 6 0 208
MARINERS MULTI-RBI GAMES:
Player 2 3 4 5+ Total Ackley 4 2 -- -- 6 Almonte 1 -- -- -- 1Bloomquist 3 1 -- -- 4Buck 1 -- -- -- 1Cano 12 4 -- -- 16Chavez -- 1 -- -- 1Franklin -- -- -- -- 0
Gillespie -- -- -- -- 0Hart 2 -- 1 -- 3Jones 2 -- -- -- 2Miller 2 1 -- -- 3Montero 1 -- -- -- 1Morrison 2 1 1 -- 4Romero -- 2 -- -- 2Saunders 5 2 -- -- 6Seager 10 5 2 1 18Smoak 6 3 -- -- 9Sucre -- -- -- -- --Zunino 4 3 -- -- 7Team 55 24 4 1 84
GAME-WINNING/2-OUT RBI:Player GWRBICano ........................................................................9Seager .....................................................................7 Ackley/Saunders/Miller/Zunino ................. .............. 4Hart/Smoak .............................................................3Romero/Almonte .....................................................2Gillespie/Chavez......................................................2Bloomquist/Buck/Montero/Morrison.......................1
Player 2-Out RBISeager ...................................................................22Smoak ...................................................................19Cano ......................................................................16 Ackley .................. ................. .................. ............... 11Hart/Zunino ...........................................................10Saunders .................................................................9Miller ........................................................................8Jones .......................................................................6Chavez/Morrison .....................................................5Bloomquist ..............................................................4 Almonte / Buck ............... .................. .................. .....3Gillespie ...................................................................2Franklin / Romero ....................................................1

8/12/2019 2014 Mid-Season Report
http://slidepdf.com/reader/full/2014-mid-season-report 26/80
24 - 2014 SEATTLE MARINERS MID-SEASON REPORT
Mariners Starters / Relievers Breakdown STARTING PITCHERS
PITCHER T W L PCT ERA G GS CG IP H TBF R ER HR SH SF HB BB IBB SO WP BK AVG
Beavan,B R 0 1 .000 4.50 1 1 0 4.0 6 16 2 2 2 0 0 0 0 0 1 0 0 .375
Elias,R L 7 8 .467 4.54 19 19 1 113.0 103 474 62 57 14 4 4 7 40 2 96 4 3 .246
Hernandez,F R 11 2 .846 2.12 20 20 0 144.1 105 556 41 34 5 2 4 3 25 0 154 13 0 .201
Iwakuma,H R 8 4 .667 2.98 14 14 0 96.2 89 372 32 32 11 0 1 0 8 1 80 0 0 .245
Maurer,B R 1 4 .200 7.52 7 7 0 32.1 43 151 29 27 5 1 2 0 14 0 17 1 0 .321
Paxton,J L 2 0 1.000 2.25 2 2 0 12.0 6 43 3 3 2 0 0 0 2 0 13 0 0 .146
Ramirez,E R 1 4 .200 4.58 11 11 0 53.0 55 238 27 27 10 1 1 1 29 2 42 3 0 .267
Walker,T R 1 1 .500 3.60 2 2 0 10.0 7 43 4 4 2 0 0 1 7 1 9 2 0 .200
Wilhelmsen,T R 0 1 .000 3.38 1 1 0 2.2 1 12 2 1 0 0 1 0 3 0 3 0 0 .125
Young,C R 8 6 .571 3.21 18 18 0 109.1 84 443 40 39 16 1 4 2 38 2 61 3 1 .211
TOTALS 39 31 .557 3.52 95 95 1 577.1 499 2348 242 226 67 9 17 14 166 8 476 26 4 .233
RELIEF PITCHERS
PITCHER T W L PCT ERA APP GF SV IP H TBF R ER HR SH SF HB BB IBB SO WP BK AVG
Beimel,J L 2 1 .667 1.50 32 5 0 30.0 26 122 5 5 1 3 0 1 11 4 17 2 0 .243
Farquhar,D R 1 1 .500 2.88 38 10 1 40.2 36 171 13 13 2 0 1 2 14 1 45 2 1 .234
Furbush,C L 1 4 .200 4.00 38 8 0 27.0 28 114 12 12 3 2 1 2 5 0 26 1 0 .269
Leone,D R 2 1 .667 1.83 34 0 0 39.1 30 162 10 8 2 1 1 1 15 0 45 3 0 .208
Luetge,L L 0 0 .000 5.40 4 2 0 3.1 2 14 2 2 1 0 0 0 3 0 2 1 0 .182
Maurer,B R 0 0 .000 0.00 6 4 0 10.2 4 38 0 0 0 0 0 0 2 0 12 0 0 .111
Medina,Y R 4 1 .800 2.23 37 10 0 32.1 19 131 9 8 2 0 2 2 15 2 31 3 0 .170
Noesi,H R 0 1 .000 27.00 2 2 0 1.0 2 6 3 3 1 0 1 0 0 0 2 1 0 .400
Pryor,S R 0 0 .000 0.00 1 0 0 1.2 1 8 1 0 0 0 1 0 2 0 1 1 0 .200
Rodney,F R 1 3 .250 1.98 38 37 27 36.1 29 149 10 8 1 3 0 2 12 0 42 3 0 .220
Wilhelmsen,T R 1 1 .500 2.49 33 16 1 47.0 30 192 14 13 3 1 2 2 22 4 40 3 0 .182
Young,C R 0 0 .000 0.00 1 0 0 2.0 0 6 0 0 0 0 1 0 0 0 2 0 0 .000
TOTALS 12 13 .480 2.39 264 94 29 271.1 207 1113 79 72 16 10 10 12 101 11 265 20 1 .211
Mid-Season Report
DISABLED LISTName TYPE DL Dates Date Eligible Injury G Missed Team Record
Blake Beavan-rhp 60-Day April 16-current June 15 Right shoulder tendinitis 82 44-38
James Paxton-lhp 60-Day April 9-current June 8 Strained left latissimus dorsi muscle 88 46-42
Michael Saunders 15-Day July 11-current July 26 Strained left oblique 3 2-1
Corey Hart-dh 15-Day May 20 (retro 5/19)-July 3 --- Strained left hamstring 42 26-16
Hisashi Iwakuma-rhp 15-Day March 29 (retro 3/21)-May 2 --- Torn extensor tendon in his right middle finger 27 12-15
Logan Morrison-of/dh 15-Day April 16 (retro 4/15)-June 11 --- Strained right hamstring 52 27-25
Stephen Pryor-rhp 15-Day March 29 (retro 3/21)-April 17 --- Surgery to repair a torn tendon in right shoulder 14 7-8
Michael Saunders-of 15-Day June 11-June 26 --- Right AC joint inflammation 14 8-6
Justin Smoak-1b 15-Day June 11 (retro to 6/10)-July 3 --- Strained left quad 22 13-9
MARINERS STARTING PITCHERS BREAKDOWN W/L Team
Pitcher Last Start (IP,H,R,ER,BB,K) Result Streak GS IP/GS P/GS SB/CS K/9 BB/9 QS GIDP After Loss Record
49-Beavan, rhp 4/15 at TEX (4.0,6,2,2,0,1,2HR) L L2 1 4.0 63.0 0/1 2.25 0.00 0 1 0-0 0-1
29-Elias, lhp 7/9 vs. MIN (3.1,7,7,6,3,3) L L3 19 6.0 94.7 3/0 7.65 3.19 6 15 2-3 9-10
34-Hernandez, rhp 7/11 vs. OAK (8.0,6,2,2,2,9,HR) W W3 20 7.2 102.6 13/2 9.60 1.56 18 7 7-2 14-6
18-Iwakuma, rhp 7/12 vs. OAK (8.2,5,2,2,0,8,HR) W W3 14 6.9 94.3 0/6 7.45 0.74 9 10 4-2 9-537-Maurer, rhp 5/29 vs. LAA (4.0,6,5,5,4,2,HR) L4 L4 7 4.7 85.4 3/0 4.73 3.90 0 5 0-2 2-5
65-Paxton, lhp 4/8 vs. LAA (5.+,4,3,3,0,4) W W5 2 6.0 79.5 0/0 9.75 1.50 1 1 1-0 2-0
50-Ramirez, rhp 6/24 vs. BOS (4.1,5,2,2,5,2,HR) ND L4 11 4.8 85.0 5/2 7.13 4.92 4 2 0-1 4-7
32-Walker, rhp 7/6 at CWS (4.0,2,1,1,5,3,WP) L L1 2 5.0 88.5 1/0 8.10 6.30 1 2 0-0 1-1
54-Wilhelmsen, rhp 7/10 vs. MIN (2.2,1,2,1,3,3) L L1 1 2.2 54.0 2/0 10.13 10.13 0 0 0-1 0-1
53-Young, rhp 7/13 vs. OAK (6.0,5,3,3,1,2,HR) L L2 18 6.1 96.3 5/3 5.02 3.13 11 4 4-2 10-8
Team No. Hernandez Iwakuma Ramirez Paxton Elias Young Walker Beavan Maurer Wilhelmsen
INNINGS (Team Rec.) (Starter’s Rec.)
0.0-4.2 17 (4-13) 0 (0-0) 1 (0-1) 5 (0-1) 0 (0-0) 2 (0-2) 1 (0-0) 1 (0-1) 1 (0-1) 5 (0-3) 1 (0-1)
5.0-5.2 17 (7-10) 1 (0-0) 1 (0-0) 2 (0-1) 1 (1-0) 7 (0-3) 4 (2-2) 0 (0-0) 0 (0-0) 1 (1-0) 0 (0-0)
6.0-6.2 23 (13-10) 4 (2-0) 3 (2-1) 3 (0-2) 0 (0-0) 5 (3-2) 7 (4-2) 1 (1-0) 0 (0-0) 0 (0-0) 0 (0-0)
7.0-7.2 23 (14-9) 7 (3-1) 4 (2-2) 1 (1-0) 1 (1-0) 4 (3-1) 5 (1-2) 0 (0-0) 0 (0-0) 1 (0-1) 0 (0-0)
8.0-9.0 15 (13-2) 8 (6-1) 5 (5-0) 0 (0-0) 0 (0-0) 1 (1-0) 1 (1-0) 0 (0-0) 0 (0-0) 0 (0-0) 0 (0-0)
Total Starts 95 (51-44) 20 (11-2) 14 (8-4) 11 (1-4) 2 (2-0) 19 (7-8) 18 (8-6) 1 (1-0) 1 (0-1) 7 (1-4) 1 (0-1)
Runs scored/start: 3.98 (378 R) 5.00 (100 R) 4.43 (62 R) 3.82 (42 R) 6.50 (13 R) 3.58 (68 R) 3.06 (55 R) 5.00 (10 R) 0.00 (0 R) 3.71 (26 R) 2.00 (2 R)
Team Record: 50-43 14-6 9-5 4-7 2-0 9-10 10-8 1-1 0-1 2-5 0-1

8/12/2019 2014 Mid-Season Report
http://slidepdf.com/reader/full/2014-mid-season-report 27/80
25 - 2014 SEATTLE MARINERS MID-SEASON REPORT
CLUB
LONGEST WINNING STREAK .......................................5, 3x, last: June 20-24
LONGEST LOSING STREAK .......................................................8, April 15-22
MOST RUNS, GAME:
Mariners................ ................ ................. ................ ........... 13, July 1 at Houston
Opponent .......................................................................9, May 24 vs. Houston
MOST RUNS, INNING:
Mariners...........................................................8, May 3 at Houston (7th inning)
Opponent .................................................... 5, May 24 vs. Houston (5th inning)
MOST HITS, 9-INNING GAME:
Mariners................ ................ ................. ................ ........... 18, July 1 at Houston
Opponent ..................................................................16, May 9 vs. Kansas City
FEWEST HITS, 9-INNING GAME:
Mariners......................................................... 1, 2x, last: June 28 vs. Cleveland
Opponent ....................................................................1, June 29 vs. Cleveland
MOST HITS, INNING:
Mariners........................................................... 7, July 1 at Houston (6th inning)
Opponent ............................................5, 4x, last: June 3 at Atlanta (1st inning)
MOST DOUBLES, GAME:
Mariners................ ................ ................. ................ ............. 6, July 1 at Houston
Opponent ......................................................................6, May 16 at Minnesota
MOST TRIPLES, GAME:
Mariners...........................................................2, 3x, last: June 8 at Tampa Bay
Opponent .......................................................2, 3x, last: June 19 at San Diego
MOST HOME RUNS, GAME:
Mariners...........................................................................4, June 30 at Houston
Opponent .......................................................3, 4x, last: July 4 at Chicago (AL)
MOST STOLEN BASES, GAME:
Mariners...................................................................... 4, June 16 vs. San Diego
Opponent .........................................................3, 2x, last: July 8 vs. Minnesota
MOST ERRORS, GAME:
Mariners.....................................................................5, May 11 vs. Kansas City
Opponent ...................................................................4, May 12 vs. Tampa Bay
MOST DOUBLE PLAYS TURNED, GAME:
Mariners................................................................................4, April 14 at Texas
Opponent ........................................................ 2, 12x, last: July 11 vs. OaklandMOST STRIKEOUTS, 9-INNING GAME:
Mariners hitters................ ................ .............. 14, 3x, last: June 6 at Tampa Bay
Opponent hitters ........................................................ 17, June 8 at Tampa Bay
MOST WALKS, 9-INNING GAME:
Mariners hitters...........................................................8, March 31 at LA Angels
Opponent hitters .......................................................... 8, June 6 at Tampa Bay
MOST LEFT ON BASE, 9-INNING GAME:
Mariners....................................................................... 12, July 9 vs. Minnesota
Opponent ................................................................... 15, June 6 at Tampa Bay
LARGEST DEFICIT OVERCOME IN WIN:
5, April 27 vs. Texas (trailed 5-0, won 6-5)
LARGEST LEAD GIVEN UP IN LOSS:
3, 2x, last: April 26 vs. Texas (led 3-0, lost 6-3)
LARGEST WINNING MARGIN ..............................11, July 1 at Houston (13-2)
LARGEST LOSING MARGIN .....................................7, April 19 at Miami (0-7)LONGEST GAME, INNINGS, HOME .......... 9.0, 49x, last: July 12 vs. Oakland
LONGEST GAME, INNINGS, ROAD ..................... 14.0, July 5 at Chicago (AL)
SHORTEST GAME, 9-INNINGS, HOME ...............2:17, June 29 vs. Cleveland
SHORTEST GAME, 9-INNINGS, ROAD .......................2:20, April 19 at Miami
LONGEST GAME, 9-INNINGS, HOME ........................3:34, June 14 vs. Texas
LONGEST GAME, 9-INNINGS, ROAD ........................3:36, July 1 at Houston
LONGEST GAME, EXTRA-INNINGS, HOME ...........................................None
LONGEST GAME, EXTRA-INNINGS, ROAD .......4:38, July 5 at Chicago (AL)
LARGEST CROWD, HOME .................................45,662, April 8 vs. LA Angels
SMALLEST CROWD, HOME ...............................10,466, April 22 vs. Houston
LARGEST CROWD, ROAD ..............................44,152, March 31 at LA Angels
SMALLEST CROWD, ROAD .............................. 10,400, June 9 at Tampa Bay
# Club Record ^Ties Club Record *Safeco Field Record
INDIVIDUAL BATTING
LONGEST HITTING STREAK ..............................14, James Jones (May 9-24)
MOST HITS, GAME ...................4, 6x, last: James Jones, June 30 at Houston
MOST RUNS, GAME ................3, 7x, last: Chavez & Jones, July 1 at Houston
MOST DOUBLES, GAME ....... 2, 5x, last: Bloomquist, June 22 at Kansas City
MOST TRIPLES, GAME .....................2, Kyle Seager, June 2 at New York (AL)
MOST HOME RUNS, GAME .............2, 6x, last: Morrison, June 23 vs. Boston
MOST EXTRA-BASE HITS, GAME ....4, Kyle Seager, June 2 at New York (AL)
MOST RBI, 9-INNING GAME ...................5, Kyle Seager, April 23 vs. Houston
MOST RBI, EXTRA-INNING GAME .. 2, 3x, last: Smoak, May 7 #1 at Oakland
MOST STOLEN BASES, GAME ........3, 2x, James Jones, June 30 at Houston
GRAND SLAMS (0) ....................................................................................None
INDIVIDUAL PITCHING
FEWEST HITS ALLOWED (CG):
Mariners.........................................................3, Roenis Elias, June 1 vs. Detroit
Opponents ............... ................ ............... 1, Josh Tomlin, June 28 vs. Cleveland
MOST STRIKEOUTS, GAME (Starter):
Mariners.......................................... 15, Felix Hernandez, June 8 at Tampa BayOpponents ................................. 12, 2x, last: Chris Sale, July 4 at Chicago (AL)
MOST STRIKEOUTS, GAME (Reliever):
Mariners............................................5, Dominic Leone, May 14 vs. Tampa Bay
Opponents ............... ................ .......... 4, 3x, last: Neal Cotts, June 14 vs. Texas
MOST WALKS, GAME:
Mariners.................................5, 5x, last: Taijuan Walker, July 6 at Chicago (AL)
Opponents ............... ................ ............... 7, Tyson Ross, June 16 vs. San Diego
MOST INNINGS, GAME, STARTER:
Mariners......................................................9.0, Roenis Elias, June 1 vs. Detroit
Opponents ................................ 9.0, 5x, last: Chris Sale, July 4 at Chicago (AL)
MOST INNINGS, GAME, RELIEVER
Mariners..............................3.0, 3x, last: Tom Wilhelmsen, June 30 at Houston
Opponents .......................................... 4.0, Jerome Williams, May 4 at Houston
LONGEST WINNING STREAK: ................ 5, Felix Hernandez (May 12-June 8)
LONGEST LOSING STREAK: ...4, Erasmo Ramirez (April 6-current), Brandon
Maurer (May 9-current), Charlie Furbush (April 13-June 18)
MOST CONSECUTIVE SCORELESS INNINGS:
Overall .......................................................... 20.0, Hisashi Iwakuma (July 1-12)
Starter ........................................................... 20.0, Hisashi Iwakuma (July 1-12)
Reliever ...........................................................19.0, Joe Beimel (May 2-July 10)
THE CATCHER’S BOX:
Catcher GS SB CS CS% PB
Buck 19 11 3 21.4 1
Sucre 1 0 0 --- 0
Zunino 75 40 14 25.9 3
Team 95 51 17 25.0% 4
OUTFIELD ASSISTS:
Player A Ackley ................................................................ 3
Almonte ............................................................. 2Chavez............................................................... 1Jones .................................................................1Morrison ............................................................ 1
Romero .............................................................. 1Saunders ........................................................... 1
Mariners Highs & Lows

8/12/2019 2014 Mid-Season Report
http://slidepdf.com/reader/full/2014-mid-season-report 28/80
26 - 2014 SEATTLE MARINERS MID-SEASON REPORT
Mariners Day-by-Days
G D D/N OPP W / L SCORE WINNER/LOSER/SAVE REC. POS GA/GB CLUBS TIME ATT
1 3/31 N @LAA W 10-3 Hernandez (1-0)/Weaver 1-0 1 +0.5 -- 3:17 44,15
2 4/1 N @LAA W 8-3 Ramirez (1-0)/Wilson 2-0 1 +0.5 -- 3:05 43,56
3 4/2 N @LAA W 8-2 Paxton (1-0)/Santiago 3-0 1 +0.5 -- 2:39 38,00
4 4/3 N @OAK L 2-3 (12) Pomeranz/Noesi (0-1) 3-1 1 +0.5 -- 4:02 11,23
4/4 N @OAK Rained Out -- DH 5/7 1 +1.0 --
5 4/5 D @OAK W 3-1 Hernandez (2-0)/Straily/Rodney (1) 4-1 1 +2.0 -- 2:22 30,29
6 4/6 D @OAK L 3-6 Gray/Ramirez (1-1)/Johnson 4-2 1 +1.0 -- 2:57 32,85
4/7 Off Day 1 +0.5
7 4/8 N LAA W 5-3 Paxton (2-0)/Santiago/Rodney (2) 5-2 1 +1.0 -- 2:59 45,66
8 4/9 N LAA L 0-2 Richards/Elias (0-1)/Frieri 5-3 T1 - - - OAK 2:53 16,46
4/10 Off Day 2 -0.5 OAK
9 4/11 N OAK W 6-4 Hernandez (3-0)/Milone/Rodney (3) 6-3 1 +0.5 -- 3:09 38,97
10 4/12 N OAK L 1-3 Gray/Ramirez (1-2)/Gregerson 6-4 2 -0.5 OAK 3:08 22,07
11 4/13 D OAK L 0-3 Otero/Furbush (0-1)/Doolittle 6-5 2 -1.5 OAK 2:44 22,70
12 4/14 N @TEX W 7-1 Elias (1-1)/Lewis 7-5 2 -1.5 OAK 3:01 23,08
13 4/15 N @TEX L 0-5 Ross Jr./Beavan (0-1) 7-6 2 -2.5 OAK 2:22 26,62
14 4/16 N @TEX L 2-3 Figueroa/Rodney (0-1) 7-7 3 -2.5 OAK 2:47 27,39
15 4/17 D @TEX L 6-8 Figueroa/Beimel (0-1)/Soria 7-8 T3 -3.0 OAK 3:28 29,02
16 4/18 N @MIA L 4-8 Cishek/Medina (0-1) 7-9 4 -4.0 OAK 3:09 21,38
17 4/19 N @MIA L 0-7 ALVAREZ/Elias (1-2) 7-10 4 -5.0 OAK 2:20 24,00
18 4/20 D @MIA L 2-3 Dunn/Wilhelmsen (0-1)/Cishek 7-11 4 -6.0 OAK 2:58 20,2219 4/21 N HOU L 2-7 Keuchel/Hernandez (3-1) 7-12 4 -6.0 OAK 2:49 14,62
20 4/22 N HOU L 2-5 McHugh/Ramirez (1-3)/Fields 7-13 4 -6.0 OAK 3:02 10,46
21 4/23 D HOU W 5-3 Rodney (1-1)/Fields 8-13 4 -5.5 TEX 2:50 13,72
4/24 Off Day 4 -5.5 TEX/OAK
22 4/25 N TEX W 6-3 Medina (1-1)/Cotts/Rodney (4) 9-13 4 -5.5 OAK 2:55 31,14
23 4/26 N TEX L 3-6 Poreda/Furbush (0-2)/Soria 9-14 4 -5.5 TEX/OAK 3:13 30,04
24 4/27 D TEX W 6-5 Farquhar (1-0)/Ogando/Rodney (5) 10-14 4 -4.5 TEX/OAK 3:10 26,30
4/28 Off Day 4 -5.0 OAK
25 4/29 N @NYY W 6-3 Young (1-0)/Sabathia 11-14 4 -5.0 OAK 3:33 37,48
4/30 N @NYY Rained Out -- Re-scheduled 6/2 4 -5.5 OAK
March/April (11-14) Batting: .231 (197x854), 22 HR Pitching: 11-14, 5 SV, 3.67 ERA (90 ER, 220.2 IP)
26 5/1 N @NYY W 4-2 Elias (2-2)/Kuroda/Rodney (6) 12-14 4 -5.0 OAK 2:47 43,12
27 5/2 N @HOU L 4-5 (11) Bass/Furbush (0-3) 12-15 4 -5.0 OAK 4:02 15,77
28 5/3 D @HOU W 9-8 Iwakuma (1-0)/Keuchel/Rodney (7) 13-15 4 -4.0 OAK 3:24 15,79
29 5/4 D @HOU W 8-7 Maurer (1-0)/McHugh/Farquhar (1) 14-15 4 -4.0 OAK 3:30 24,99
30 5/5 N @OAK W 4-2 Young (2-0/Kazmir/Rodney (8) 15-15 4 -3.0 OAK 2:36 11,0131 5/6 N @OAK W 8-3 Elias (3-2)/Chavez 16-15 T2 -2.0 OAK 3:19 12,10
32 5/7 D @OAK #1 W 6-4 (10) Medina (2-1)/Cook/Rodney (9) 17-15 2 -1.0 OAK 3:24 - -
33 @OAK #2 L 0-2 Pomeranz/Ramirez (1-4)/Johnson 17-16 2 -2.0 OAK 2:21 17,33
34 5/8 N KC W 1-0 Iwakuma (2-0)/Duffy/Rodney (10) 18-16 2 -1.5 OAK 2:25 12,57
35 5/9 N KC L 1-6 Vargas/Maurer (1-1) 18-17 3 -2.5 OAK 2:45 20,87
36 5/10 N KC W 3-1 Young (3-0)/Ventura/Rodney (11) 19-17 2 -2.5 OAK 2:18 29,37
37 5/11 D KC L 7-9 Coleman/Farquhar (1-1)/Holland 19-18 3 -3.5 OAK 3:01 30,44
38 5/12 N TB W 12-5 Hernandez (4-1)/Ramos 20-18 2 -3.5 OAK 3:10 12,39
39 5/13 N TB L 1-2 PRICE (4-3)/Rodney (1-2) 20-19 3 -4.5 OAK 2:48 13,44
40 5/14 D TB L 0-2 Odorizzi/Maurer (1-2)/Balfour 20-20 3 -4.5 OAK 3:21 20,98
5/15 Off Day 3 -4.5
41 5/16 N @MIN L 4-5 Gibson/Young (3-1)/Perkins 20-21 3 -5.5 OAK 2:42 27,27
42 5/17 N @MIN L 3-4 Deduno/Elias (3-3)/Perkins 20-22 3 -6.5 OAK 2:26 29,71
43 5/18 D @MIN W 6-2 Hernandez (5-1)/Nolasco 21-22 3 -6.5 OAK 3:02 32,51
5/19 Off Day 3 -6.5 OAK
44 5/20 N @TEX W 6-2 Iwakuma (3-0)/Lewis 22-22 3 -6.5 OAK 2:54 43,70
45 5/21 D @TEX L 3-4 Tepesch/Young (3-2)/Soria 22-23 3 -7.5 OAK 2:47 43,65
46 5/22 N HOU W 3-1 Leone (1-0)/Cosart/Rodney (12) 23-23 3 -6.5 OAK 3:09 13,86
47 5/23 N HOU W 6-1 Hernandez (6-1)/Owens 24-23 3 -5.5 OAK 2:40 21,19
48 5/24 N HOU L 4-9 Oberholtzer/Maurer (1-3) 24-24 3 -5.5 OAK 3:18 21,58
49 5/25 D HOU L 1-4 KEUCHEL/Iwakuma (3-1) 24-25 4 -5.5 OAK 2:28 26,85
50 5/26 D LAA W Young (4-2)/Skaggs 25-25 4 -5.5 OAK 2:40 22,72
51 5/27 N LAA L 4-6 Weaver/Elias (3-4)/Frieri 25-26 4 -5.5 OAK 3:03 13,06
52 5/28 N LAA W 3-1 Hernandez (7-1)/Wilson/Rodney (13) 26-26 4 -5.5 OAK 2:30 13,90
53 5/29 N LAA L 5-7 Shoemaker/Maurer (1-4)/Frieri 26-27 4 -5.5 OAK 3:08 11,65
54 5/30 N DET L 3-6 Verlander/Iwakuma (3-2)/Chamberlain 26-28 4 -6.5 OAK 3:05 28,99
55 5/31 N DET W 3-2 Young (5-2)/Smyly/Rodney (14) 27-28 4 -6.5 OAK 3:18 37,14
May (16-14) Batting: .233 (228x978), 21 HR Pitching: 16-14, 10 SV, 3.56 ERA (106 ER, 268.0 IP)
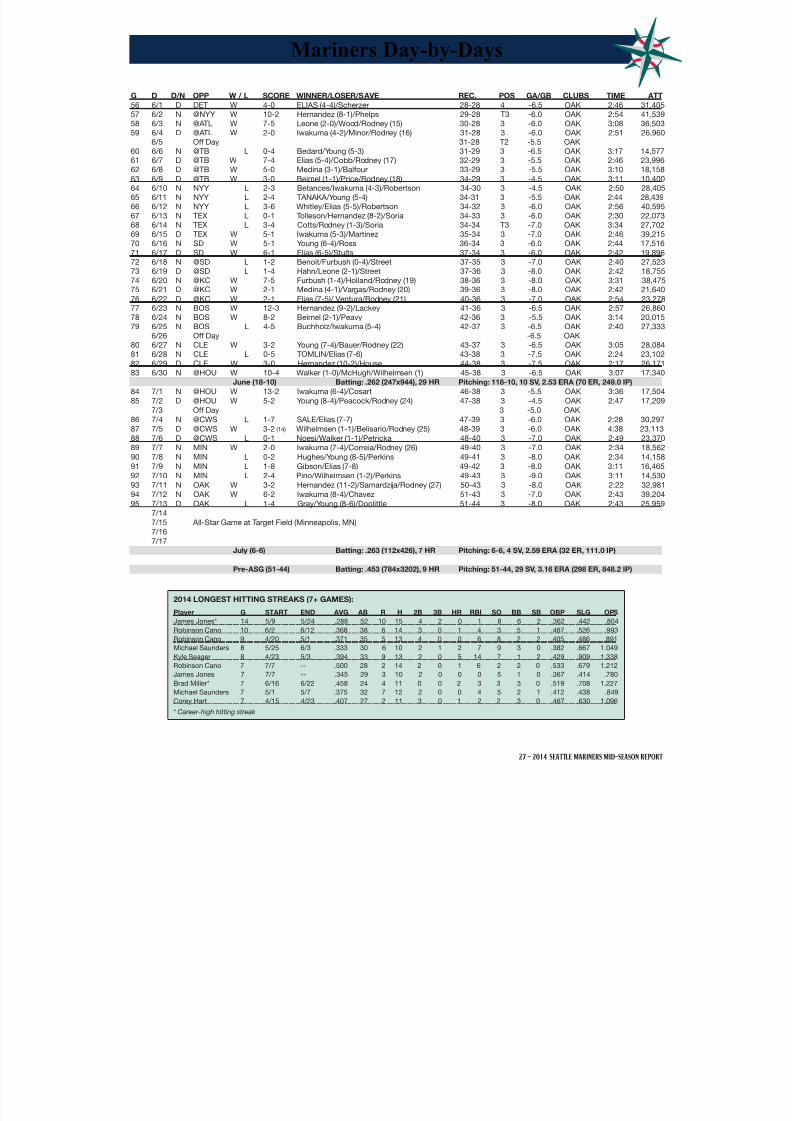
8/12/2019 2014 Mid-Season Report
http://slidepdf.com/reader/full/2014-mid-season-report 29/80
27 - 2014 SEATTLE MARINERS MID-SEASON REPORT
Mariners Day-by-Days
2014 LONGEST HITTING STREAKS (7+ GAMES):Player G START END AVG AB R H 2B 3B HR RBI SO BB SB OBP SLG OPS
James Jones* 14 5/9 5/24 .288 52 10 15 4 2 0 1 8 6 2 .362 .442 .804
Robinson Cano 10 6/2 6/12 .368 38 6 14 3 0 1 4 3 5 1 .467 .526 .993
Robinson Cano 9 4/20 5/1 .371 35 5 13 4 0 0 6 8 2 2 .405 .486 .891
Michael Saunders 8 5/25 6/3 .333 30 6 10 2 1 2 7 9 3 0 .382 .667 1.049
Kyle Seager 8 4/23 5/3 .394 33 9 13 2 0 5 14 7 1 2 .429 .909 1.338
Robinson Cano 7 7/7 -- .500 28 2 14 2 0 1 6 2 2 0 .533 .679 1.212
James Jones 7 7/7 -- .345 29 3 10 2 0 0 0 5 1 0 .367 .414 .780
Brad Miller* 7 6/16 6/22 .458 24 4 11 0 0 2 3 3 3 0 .519 .708 1.227
Michael Saunders 7 5/1 5/7 .375 32 7 12 2 0 0 4 5 2 1 .412 .438 .849
Corey Hart 7 4/15 4/23 .407 27 2 11 3 0 1 2 2 3 0 .467 .630 1.096
* Career-high hitting streak
G D D/N OPP W / L SCORE WINNER/LOSER/SAVE REC. POS GA/GB CLUBS TIME ATT
56 6/1 D DET W 4-0 ELIAS (4-4)/Scherzer 28-28 4 -6.5 OAK 2:46 31,40
57 6/2 N @NYY W 10-2 Hernandez (8-1)/Phelps 29-28 T3 -6.0 OAK 2:54 41,53
58 6/3 N @ATL W 7-5 Leone (2-0)/Wood/Rodney (15) 30-28 3 -6.0 OAK 3:08 36,50
59 6/4 D @ATL W 2-0 Iwakuma (4-2)/Minor/Rodney (16) 31-28 3 -6.0 OAK 2:51 26,96
6/5 Off Day 31-28 T2 -5.5 OAK
60 6/6 N @TB L 0-4 Bedard/Young (5-3) 31-29 3 -6.5 OAK 3:17 14,5761 6/7 D @TB W 7-4 Elias (5-4)/Cobb/Rodney (17) 32-29 3 -5.5 OAK 2:46 23,99
62 6/8 D @TB W 5-0 Medina (3-1)/Balfour 33-29 3 -5.5 OAK 3:10 18,15
63 6/9 D @TB W 3-0 Beimel (1-1)/Price/Rodney (18) 34-29 3 -4.5 OAK 3:11 10,40
64 6/10 N NYY L 2-3 Betances/Iwakuma (4-3)/Robertson 34-30 3 -4.5 OAK 2:50 28,40
65 6/11 N NYY L 2-4 TANAKA/Young (5-4) 34-31 3 -5.5 OAK 2:44 28,43
66 6/12 N NYY L 3-6 Whitley/Elias (5-5)/Robertson 34-32 3 -6.0 OAK 2:56 40,59
67 6/13 N TEX L 0-1 Tolleson/Hernandez (8-2)/Soria 34-33 3 -6.0 OAK 2:30 22,07
68 6/14 N TEX L 3-4 Cotts/Rodney (1-3)/Soria 34-34 T3 -7.0 OAK 3:34 27,70
69 6/15 D TEX W 5-1 Iwakuma (5-3)/Martinez 35-34 3 -7.0 OAK 2:46 39,21
70 6/16 N SD W 5-1 Young (6-4)/Ross 36-34 3 -6.0 OAK 2:44 17,51
71 6/17 D SD W 6-1 Elias (6-5)/Stults 37-34 3 -6.0 OAK 2:42 19,89
72 6/18 N @SD L 1-2 Benoit/Furbush (0-4)/Street 37-35 3 -7.0 OAK 2:40 27,52
73 6/19 D @SD L 1-4 Hahn/Leone (2-1)/Street 37-36 3 -8.0 OAK 2:42 18,75
74 6/20 N @KC W 7-5 Furbush (1-4)/Holland/Rodney (19) 38-36 3 -8.0 OAK 3:31 38,4775 6/21 D @KC W 2-1 Medina (4-1)/Vargas/Rodney (20) 39-36 3 -8.0 OAK 2:42 21,64
76 6/22 D @KC W 2-1 Elias (7-5)/ Ventura/Rodney (21) 40-36 3 -7.0 OAK 2:54 23,2777 6/23 N BOS W 12-3 Hernandez (9-2)/Lackey 41-36 3 -6.5 OAK 2:57 26,86
78 6/24 N BOS W 8-2 Beimel (2-1)/Peavy 42-36 3 -5.5 OAK 3:14 20,01
79 6/25 N BOS L 4-5 Buchholz/Iwakuma (5-4) 42-37 3 -6.5 OAK 2:40 27,33
6/26 Off Day -6.5 OAK
80 6/27 N CLE W 3-2 Young (7-4)/Bauer/Rodney (22) 43-37 3 -6.5 OAK 3:05 28,08
81 6/28 N CLE L 0-5 TOMLIN/Elias (7-6) 43-38 3 -7.5 OAK 2:24 23,10
82 6/29 D CLE W 3-0 Hernandez (10-2)/House 44-38 3 -7.5 OAK 2:17 26,17
83 6/30 N @HOU W 10-4 Walker (1-0)/McHugh/Wilhelmsen (1) 45-38 3 -6.5 OAK 3:07 17,34
June (18-10) Batting: .262 (247x944), 29 HR Pitching: 118-10, 10 SV, 2.53 ERA (70 ER, 249.0 IP)
84 7/1 N @HOU W 13-2 Iwakuma (6-4)/Cosart 46-38 3 -5.5 OAK 3:36 17,50
85 7/2 D @HOU W 5-2 Young (8-4)/Peacock/Rodney (24) 47-38 3 -4.5 OAK 2:47 17,20
7/3 Off Day 3 -5.0 OAK
86 7/4 N @CWS L 1-7 SALE/Elias (7-7) 47-39 3 -6.0 OAK 2:28 30,29
87 7/5 D @CWS W 3-2 (14) Wilhelmsen (1-1)/Belisario/Rodney (25) 48-39 3 -6.0 OAK 4:38 23,11
88 7/6 D @CWS L 0-1 Noesi/Walker (1-1)/Petricka 48-40 3 -7.0 OAK 2:49 23,37
89 7/7 N MIN W 2-0 Iwakuma (7-4)/Correia/Rodney (26) 49-40 3 -7.0 OAK 2:34 18,5690 7/8 N MIN L 0-2 Hughes/Young (8-5)/Perkins 49-41 3 -8.0 OAK 2:34 14,15
91 7/9 N MIN L 1-8 Gibson/Elias (7-8) 49-42 3 -8.0 OAK 3:11 16,46
92 7/10 N MIN L 2-4 Pino/Wilhelmsen (1-2)/Perkins 49-43 3 -9.0 OAK 3:11 14,53
93 7/11 N OAK W 3-2 Hernandez (11-2)/Samardzija/Rodney (27) 50-43 3 -8.0 OAK 2:22 32,98
94 7/12 N OAK W 6-2 Iwakuma (8-4)/Chavez 51-43 3 -7.0 OAK 2:43 39,20
95 7/13 D OAK L 1-4 Gray/Young (8-6)/Doolittle 51-44 3 -8.0 OAK 2:43 25,95
7/14
7/15 All-Star Game at Target Field (Minneapolis, MN)
7/16
7/17
July (6-6) Batting: .263 (112x426), 7 HR Pitching: 6-6, 4 SV, 2.59 ERA (32 ER, 111.0 IP)
Pre-ASG (51-44) Batting: .453 (784x3202), 9 HR Pitching: 51-44, 29 SV, 3.16 ERA (298 ER, 848.2 IP)
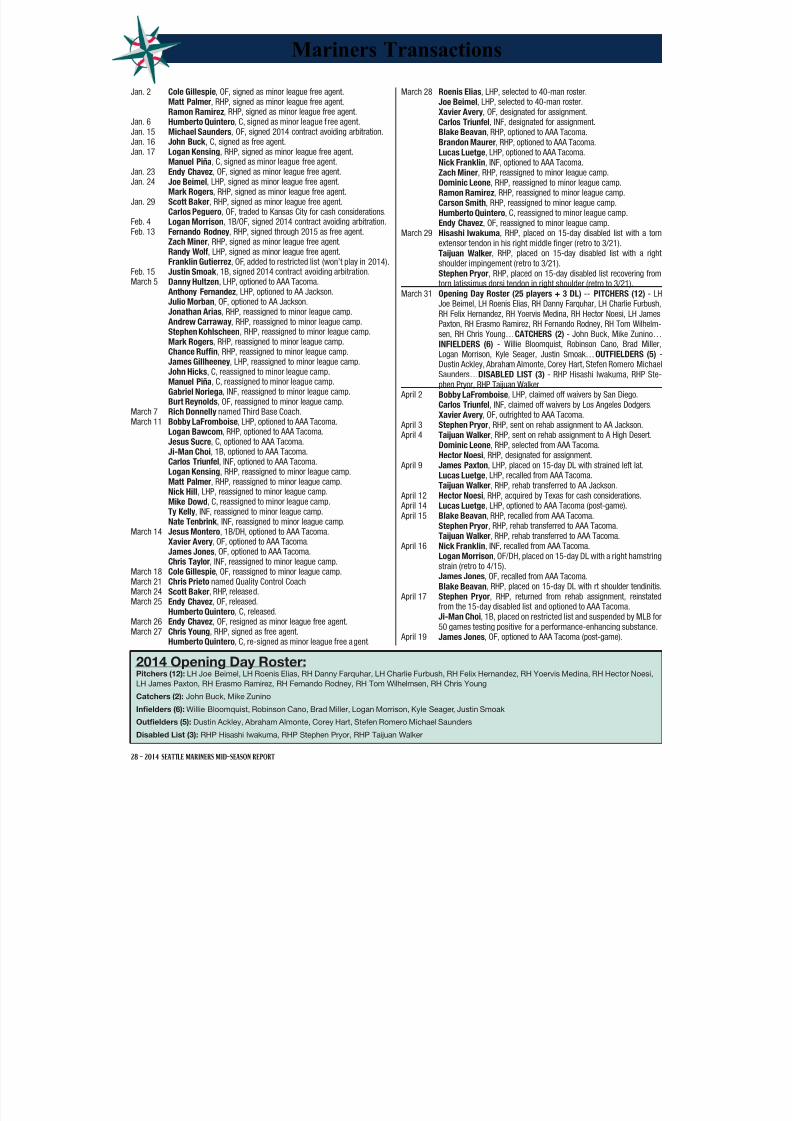
8/12/2019 2014 Mid-Season Report
http://slidepdf.com/reader/full/2014-mid-season-report 30/80
28 - 2014 SEATTLE MARINERS MID-SEASON REPORT
Mariners Transactions
Jan. 2 Cole Gillespie, OF, signed as minor league free agent. Matt Palmer, RHP, signed as minor league free agent. Ramon Ramirez, RHP, signed as minor league free agent.Jan. 6 Humberto Quintero, C, signed as minor league free agent.Jan. 15 Michael Saunders, OF, signed 2014 contract avoiding arbitration.Jan. 16 John Buck , C, signed as free agent.
Jan. 17 Logan Kensing, RHP, signed as minor league free agent. Manuel Piña, C, signed as minor league free agent.Jan. 23 Endy Chavez, OF, signed as minor league free agent.Jan. 24 Joe Beimel, LHP, signed as minor league free agent. Mark Rogers, RHP, signed as minor league free agent.Jan. 29 Scott Baker, RHP, signed as minor league free agent. Carlos Peguero, OF, traded to Kansas City for cash considerations.Feb. 4 Logan Morrison, 1B/OF, signed 2014 contract avoiding arbitration.Feb. 13 Fernando Rodney, RHP, signed through 2015 as free agent. Zach Miner, RHP, signed as minor league free agent. Randy Wolf, LHP, signed as minor league free agent. Franklin Gutierrez, OF, added to restricted list (won’t play in 2014).Feb. 15 Justin Smoak , 1B, signed 2014 contract avoiding arbitration.March 5 Danny Hultzen, LHP, optioned to AAA Tacoma. Anthony Fernandez, LHP, optioned to AA Jackson.
Julio Morban, OF, optioned to AA Jackson. Jonathan Arias, RHP, reassigned to minor league camp. Andrew Carraway, RHP, reassigned to minor league camp. Stephen Kohlscheen, RHP, reassigned to minor league camp. Mark Rogers, RHP, reassigned to minor league camp. Chance Ruffin, RHP, reassigned to minor league camp. James Gillheeney, LHP, reassigned to minor league camp. John Hicks, C, reassigned to minor league camp. Manuel Piña, C, reassigned to minor league camp. Gabriel Noriega, INF, reassigned to minor league camp. Burt Reynolds, OF, reassigned to minor league camp.March 7 Rich Donnelly named Third Base Coach.March 11 Bobby LaFromboise, LHP, optioned to AAA Tacoma. Logan Bawcom, RHP, optioned to AAA Tacoma. Jesus Sucre, C, optioned to AAA Tacoma.
Ji-Man Choi, 1B, optioned to AAA Tacoma. Carlos Triunfel, INF, optioned to AAA Tacoma. Logan Kensing, RHP, reassigned to minor league camp. Matt Palmer, RHP, reassigned to minor league camp. Nick Hill, LHP, reassigned to minor league camp. Mike Dowd, C, reassigned to minor league camp. Ty Kelly, INF, reassigned to minor league camp. Nate Tenbrink , INF, reassigned to minor league camp.March 14 Jesus Montero, 1B/DH, optioned to AAA Tacoma. Xavier Avery, OF, optioned to AAA Tacoma. James Jones, OF, optioned to AAA Tacoma. Chris Taylor, INF, reassigned to minor league camp.March 18 Cole Gillespie, OF, reassigned to minor league camp.March 21 Chris Prieto named Quality Control CoachMarch 24 Scott Baker, RHP, released.
March 25 Endy Chavez, OF, released. Humberto Quintero, C, released.March 26 Endy Chavez, OF, resigned as minor league free agent.March 27 Chris Young, RHP, signed as free agent. Humberto Quintero, C, re-signed as minor league free agent.
March 28 Roenis Elias, LHP, selected to 40-man roster. Joe Beimel, LHP, selected to 40-man roster. Xavier Avery, OF, designated for assignment. Carlos Triunfel, INF, designated for assignment. Blake Beavan, RHP, optioned to AAA Tacoma. Brandon Maurer, RHP, optioned to AAA Tacoma.
Lucas Luetge, LHP, optioned to AAA Tacoma. Nick Franklin, INF, optioned to AAA Tacoma. Zach Miner, RHP, reassigned to minor league camp. Dominic Leone, RHP, reassigned to minor league camp. Ramon Ramirez, RHP, reassigned to minor league camp. Carson Smith, RHP, reassigned to minor league camp. Humberto Quintero, C, reassigned to minor league camp. Endy Chavez, OF, reassigned to minor league camp.March 29 Hisashi Iwakuma, RHP, placed on 15-day disabled list with a torn
extensor tendon in his right middle finger (retro to 3/21). Taijuan Walker, RHP, placed on 15-day disabled list with a righ
shoulder impingement (retro to 3/21). Stephen Pryor, RHP, placed on 15-day disabled list recovering from
torn latissimus dorsi tendon in right shoulder (retro to 3/21).March 31 Opening Day Roster (25 players + 3 DL) -- PITCHERS (12) - LH
Joe Beimel, LH Roenis Elias, RH Danny Farquhar, LH Charlie FurbushRH Felix Hernandez, RH Yoervis Medina, RH Hector Noesi, LH JamesPaxton, RH Erasmo Ramirez, RH Fernando Rodney, RH Tom Wilhelmsen, RH Chris Young…CATCHERS (2) - John Buck, Mike Zunino…INFIELDERS (6) - Willie Bloomquist, Robinson Cano, Brad MillerLogan Morrison, Kyle Seager, Justin Smoak…OUTFIELDERS (5)Dustin Ackley, Abraham Almonte, Corey Hart, Stefen Romero MichaeSaunders…DISABLED LIST (3) - RHP Hisashi Iwakuma, RHP Stephen Pryor, RHP Taijuan Walker
April 2 Bobby LaFromboise, LHP, claimed off waivers by San Diego. Carlos Triunfel, INF, claimed off waivers by Los Angeles Dodgers. Xavier Avery, OF, outrighted to AAA Tacoma. April 3 Stephen Pryor, RHP, sent on rehab assignment to AA Jackson. April 4 Taijuan Walker, RHP, sent on rehab assignment to A High Desert. Dominic Leone, RHP, selected from AAA Tacoma. Hector Noesi, RHP, designated for assignment. April 9 James Paxton, LHP, placed on 15-day DL with strained left lat. Lucas Luetge, LHP, recalled from AAA Tacoma. Taijuan Walker, RHP, rehab transferred to AA Jackson. April 12 Hector Noesi, RHP, acquired by Texas for cash considerations. April 14 Lucas Luetge, LHP, optioned to AAA Tacoma (post-game). April 15 Blake Beavan, RHP, recalled from AAA Tacoma. Stephen Pryor, RHP, rehab transferred to AAA Tacoma. Taijuan Walker, RHP, rehab transferred to AAA Tacoma. April 16 Nick Franklin, INF, recalled from AAA Tacoma. Logan Morrison, OF/DH, placed on 15-day DL with a right hamstring
strain (retro to 4/15). James Jones, OF, recalled from AAA Tacoma. Blake Beavan, RHP, placed on 15-day DL with rt shoulder tendinitis April 17 Stephen Pryor, RHP, returned from rehab assignment, reinstated
from the 15-day disabled list and optioned to AAA Tacoma. Ji-Man Choi, 1B, placed on restricted list and suspended by MLB fo
50 games testing positive for a performance-enhancing substance. April 19 James Jones, OF, optioned to AAA Tacoma (post-game).
2014 Opening Day Roster:Pitchers (12): LH Joe Beimel, LH Roenis Elias, RH Danny Farquhar, LH Charlie Furbush, RH Felix Hernandez, RH Yoervis Medina, RH Hector Noesi,
LH James Paxton, RH Erasmo Ramirez, RH Fernando Rodney, RH Tom Wilhelmsen, RH Chris Young
Catchers (2): John Buck, Mike Zunino
Infielders (6): Willie Bloomquist, Robinson Cano, Brad Miller, Logan Morrison, Kyle Seager, Justin Smoak
Outfielders (5): Dustin Ackley, Abraham Almonte, Corey Hart, Stefen Romero Michael Saunders
Disabled List (3): RHP Hisashi Iwakuma, RHP Stephen Pryor, RHP Taijuan Walker
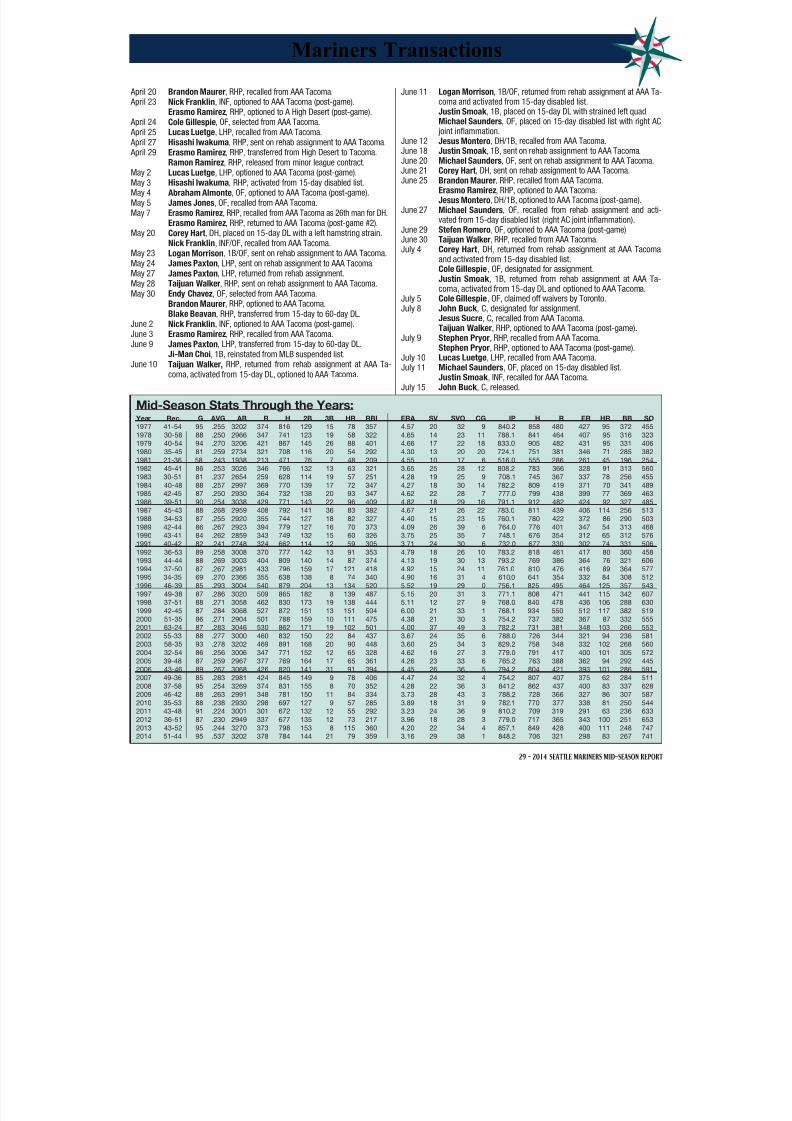
8/12/2019 2014 Mid-Season Report
http://slidepdf.com/reader/full/2014-mid-season-report 31/80
29 - 2014 SEATTLE MARINERS MID-SEASON REPORT
Mid-Season Stats Through the Years: Year Rec. G AVG AB R H 2B 3B HR RBI ERA SV SVO CG IP H R ER HR BB SO
1977 41-54 95 .255 3202 374 816 129 15 78 357 4.57 20 32 9 840.2 858 480 427 95 372 455
1978 30-58 88 .250 2966 347 741 123 19 58 322 4.65 14 23 11 788.1 841 464 407 95 316 323
1979 40-54 94 .270 3206 421 867 145 26 88 401 4.66 17 22 18 833.0 905 482 431 95 331 406
1980 35-45 81 .259 2734 321 708 116 20 54 292 4.30 13 20 20 724.1 751 381 346 71 285 3821981 21-36 58 .243 1938 213 471 76 7 48 209 4.55 10 17 6 516.0 555 286 261 45 196 254
1982 45-41 86 .253 3026 346 766 132 13 63 321 3.65 25 28 12 808.2 783 366 328 91 313 560
1983 30-51 81 .237 2654 259 628 114 19 57 251 4.28 19 25 9 708.1 745 367 337 78 256 455
1984 40-48 88 .257 2997 369 770 139 17 72 347 4.27 18 30 14 782.2 809 419 371 70 341 489
1985 42-45 87 .250 2930 364 732 138 20 93 347 4.62 22 28 7 777.0 799 438 399 77 369 463
1986 39-51 90 .254 3038 429 771 143 22 96 409 4.82 18 29 16 791.1 912 482 424 92 327 485
1987 45-43 88 .268 2959 408 792 141 36 83 382 4.67 21 26 22 783.0 811 439 406 114 256 513
1988 34-53 87 .255 2920 355 744 127 18 82 327 4.40 15 23 15 760.1 780 422 372 86 290 503
1989 42-44 86 .267 2923 394 779 127 16 70 373 4.09 26 39 6 764.0 776 401 347 54 313 468
1990 43-41 84 .262 2859 343 749 132 15 60 326 3.75 25 35 7 748.1 676 354 312 65 312 576
1991 40-42 82 .241 2748 324 662 114 12 59 305 3.71 24 30 6 732.0 677 330 302 74 331 506
1992 36-53 89 .258 3008 370 777 142 13 91 353 4.79 18 26 10 783.2 818 461 417 80 360 458
1993 44-44 88 .269 3003 404 809 140 14 87 374 4.13 19 30 13 793.2 769 386 364 76 321 606
1994 37-50 87 .267 2981 433 796 159 17 121 418 4.92 15 24 11 761.0 810 476 416 89 364 577
1995 34-35 69 .270 2366 355 638 138 8 74 340 4.90 16 31 4 610.0 641 354 332 84 308 512
1996 46-39 85 .293 3004 540 879 204 13 134 520 5.52 19 29 0 756.1 825 495 464 125 357 543
1997 49-38 87 .286 3020 509 865 182 8 139 487 5.15 20 31 3 771.1 808 471 441 115 342 607
1998 37-51 88 .271 3058 462 830 173 19 138 444 5.11 12 27 9 768.0 840 478 436 106 288 6301999 42-45 87 .284 3068 527 872 151 13 151 504 6.00 21 33 1 768.1 934 550 512 117 382 519
2000 51-35 86 .271 2904 501 788 159 10 111 475 4.38 21 30 3 754.2 737 382 367 87 332 555
2001 63-24 87 .283 3046 530 862 171 19 102 501 4.00 37 49 3 782.2 731 381 348 103 266 553
2002 55-33 88 .277 3000 460 832 150 22 84 437 3.67 24 35 6 788.0 726 344 321 94 236 581
2003 58-35 93 .278 3202 469 891 168 20 90 448 3.60 25 34 3 829.2 758 348 332 102 268 560
2004 32-54 86 .256 3006 347 771 152 12 65 328 4.62 16 27 3 779.0 791 417 400 101 305 572
2005 39-48 87 .259 2967 377 769 164 17 65 361 4.26 23 33 6 765.2 763 388 362 94 292 445
2006 43-46 89 .267 3068 426 820 141 31 91 394 4.45 26 36 5 794.2 804 421 393 101 286 591
2007 49-36 85 .283 2981 424 845 149 9 78 406 4.47 24 32 4 754.2 807 407 375 62 284 511
2008 37-58 95 .254 3269 374 831 155 8 70 352 4.28 22 36 3 841.2 862 437 400 83 337 628
2009 46-42 88 .263 2991 348 781 150 11 84 334 3.73 28 43 3 788.2 728 366 327 86 307 587
2010 35-53 88 .238 2930 298 697 127 9 57 285 3.89 18 31 9 782.1 770 377 338 81 250 544
2011 43-48 91 .224 3001 301 672 132 12 55 292 3.23 24 36 9 810.2 709 319 291 63 236 633
2012 36-51 87 .230 2949 337 677 135 12 73 217 3.96 18 28 3 779.0 717 365 343 100 251 653
2013 43-52 95 .244 3270 373 798 153 8 115 360 4.20 22 34 4 857.1 849 428 400 111 248 747
2014 51-44 95 .537 3202 378 784 144 21 79 359 3.16 29 38 1 848.2 706 321 298 83 267 741
Mariners Transactions
April 20 Brandon Maurer, RHP, recalled from AAA Tacoma. April 23 Nick Franklin, INF, optioned to AAA Tacoma (post-game). Erasmo Ramirez, RHP, optioned to A High Desert (post-game). April 24 Cole Gillespie, OF, selected from AAA Tacoma. April 25 Lucas Luetge, LHP, recalled from AAA Tacoma. April 27 Hisashi Iwakuma, RHP, sent on rehab assignment to AAA Tacoma.
April 29 Erasmo Ramirez, RHP, transferred from High Desert to Tacoma. Ramon Ramirez, RHP, released from minor league contract.May 2 Lucas Luetge, LHP, optioned to AAA Tacoma (post-game).May 3 Hisashi Iwakuma, RHP, activated from 15-day disabled list.May 4 Abraham Almonte, OF, optioned to AAA Tacoma (post-game).May 5 James Jones, OF, recalled from AAA Tacoma.May 7 Erasmo Ramirez, RHP, recalled from AAA Tacoma as 26th man for DH.
Erasmo Ramirez, RHP, returned to AAA Tacoma (post-game #2).May 20 Corey Hart, DH, placed on 15-day DL with a left hamstring strain. Nick Franklin, INF/OF, recalled from AAA Tacoma.May 23 Logan Morrison, 1B/OF, sent on rehab assignment to AAA Tacoma.May 24 James Paxton, LHP, sent on rehab assignment to AAA Tacoma.May 27 James Paxton, LHP, returned from rehab assignment.May 28 Taijuan Walker, RHP, sent on rehab assignment to AAA Tacoma.May 30 Endy Chavez, OF, selected from AAA Tacoma.
Brandon Maurer, RHP, optioned to AAA Tacoma. Blake Beavan, RHP, transferred from 15-day to 60-day DL.June 2 Nick Franklin, INF, optioned to AAA Tacoma (post-game).June 3 Erasmo Ramirez, RHP, recalled from AAA Tacoma.June 9 James Paxton, LHP, transferred from 15-day to 60-day DL. Ji-Man Choi, 1B, reinstated from MLB suspended list.June 10 Taijuan Walker, RHP, returned from rehab assignment at AAA Ta-
coma, activated from 15-day DL, optioned to AAA Tacoma.
June 11 Logan Morrison, 1B/OF, returned from rehab assignment at AAA Tacoma and activated from 15-day disabled list.
Justin Smoak , 1B, placed on 15-day DL with strained left quad. Michael Saunders, OF, placed on 15-day disabled list with right AC
joint inflammation.June 12 Jesus Montero, DH/1B, recalled from AAA Tacoma.
June 18 Justin Smoak , 1B, sent on rehab assignment to AAA Tacoma.June 20 Michael Saunders, OF, sent on rehab assignment to AAA Tacoma.June 21 Corey Hart, DH, sent on rehab assignment to AAA Tacoma.June 25 Brandon Maurer, RHP, recalled from AAA Tacoma. Erasmo Ramirez, RHP, optioned to AAA Tacoma. Jesus Montero, DH/1B, optioned to AAA Tacoma (post-game).June 27 Michael Saunders, OF, recalled from rehab assignment and acti
vated from 15-day disabled list (right AC joint inflammation).June 29 Stefen Romero, OF, optioned to AAA Tacoma (post-game)June 30 Taijuan Walker, RHP, recalled from AAA Tacoma.July 4 Corey Hart, DH, returned from rehab assignment at AAA Tacoma
and activated from 15-day disabled list. Cole Gillespie, OF, designated for assignment. Justin Smoak , 1B, returned from rehab assignment at AAA Ta
coma, activated from 15-day DL and optioned to AAA Tacoma.
July 5 Cole Gillespie, OF, claimed off waivers by Toronto.July 8 John Buck , C, designated for assignment. Jesus Sucre, C, recalled from AAA Tacoma. Taijuan Walker, RHP, optioned to AAA Tacoma (post-game).July 9 Stephen Pryor, RHP, recalled from AAA Tacoma.
Stephen Pryor, RHP, optioned to AAA Tacoma (post-game).July 10 Lucas Luetge, LHP, recalled from AAA Tacoma.July 11 Michael Saunders, OF, placed on 15-day disabled list. Justin Smoak , INF, recalled for AAA Tacoma.July 15 John Buck , C, released.

8/12/2019 2014 Mid-Season Report
http://slidepdf.com/reader/full/2014-mid-season-report 32/80
30 - 2014 SEATTLE MARINERS MID-SEASON REPORT
March/April in Review (11-14)
TEAM NOTES…the Mariners finished the opening month of the season with a 11-14 record,playing in the month of March for the 5th time in club history (4-2 record)…finished the month 4thin the AL West standings, 5.5 games back of the division-leading A’s…closed the month out on astrong note winning 4 of last 5 games…opened the season 5-2, but dropped 11 of 13 games from
April 9-22…dropped 8 consecutive games April 15-22…played Interleague games in the month of April for the first time in club history (went 0-3 at Miami)…12 of 25 games played were decided by 1
or 2 runs, going 2-3 in 1-run games and 4-3 in 2-run affairs…21 of 25 games played came against AL West opponents…Mariners used 32 players during the month (16 position, 16 pitchers).
ODDS AND ENDS…• Lloyd McClendon became the second manager in club history to win each of their first 3 games at
the helm, joining Rene Lachemann (4, 1981)…is the first to win his first 3 games on the road.• Felix Hernandez went 3-1 with a 2.40 ERA (11 ER, 41.1 IP)…tied for 2nd in the AL with 47 strikeouts.• Justin Smoak led the team in RBI (15), doubles (6) and tied for runs scored (12).• Abraham Almonte, Roenis Elias, Danny Farquhar, Yoervis Medina, Brad Miller, James Paxton,
Stefen Romero and Mike Zunino made their first career Opening Day rosters.• James Jones, Roenis Elias, Dominic Leone and Stefen Romero all made their MLB debuts.
THE NEW GUY …Robinson Cano hit .296 (29x98) with 5 doubles, 1 home run and 12 RBI in hisfirst 25 games with the Mariners…he recorded a hit in 21 of the 25 games…hit his first home runwith Seattle on April 17 at Texas against Tanner Scheppers…scored his 800th career run in the 9thinning on March 31 at LAA.
ALL HANDS ON DECK …the Mariners used 7 different starting pitchers in the first month of theseason (March 31-April 30)…Felix Hernandez (6), Roenis Elias (5), Erasmo Ramirez (5), Chris
Young (4), Brandon Maurer (2), James Paxton (2) and Blake Beavan (1) each made starts in April…starters who spent time on the disabled list in the first month include Hisashi Iwakuma (tornextensor tendon in right middle finger), James Paxton (strained left latissimus dorsal muscle) and Taijuan Walker (right shoulder impingement).
OPENING DAY WIN STREAK …the Mariners extended their Opening Day winning streak to 8consecutive games (old record was 5 straight from 1982-86) with a 10-3 win over the Angels onMarch 31…it is the longest OD winning streak since the Cincinnati Reds posted 9 straight OD winsfrom 1983-1991, and is the 2nd-longest American League Opening Day win streak trailing only theSt. Louis Browns (9 straight, 1937-45)…the Mariners are 23-15 in season openers, and won 9 ofthe last 10 season openers.
KING OF OPENING DAY …Felix Hernandez made his club-record 7th career Opening Day start
March 31 vs. the Angels, earning the win by allowing 2 ER (3 runs total) in 6.0 innings…was his 6thconsecutive OD start (2007 vs. OAK, 2009 at MIN, 2010 at OAK, 2011 at OAK, 2012 at OAK-Tokyo,2013 at OAK)…Felix is 5-0, 1.52 ERA (9 ER, 53.1 IP) with 52 strikeouts in his 7 career Opening Daystarts…Felix’s 5 career Opening Day wins are the most in Mariners history (R. Johnson - 2)…Felixbecame the first pitcher in Major League history to record 7 Opening Day starts prior to turning 28,passing four other pitchers who made 6 Opening Day starts as a pitcher before turning 28 datingback to 1900 (Bert Blyleven, Dennis Eckersley, Fernando Valenzuela, Dwight Gooden).
SLOW START, AWARD WORTHY FINISH…Kyle Seager began the season hitting .158 (9x57)with 4 doubles and 2 RBI in his first 17 games of the month, but finished strong in his last 7 gamesincluding being named the American League Co-Player of the Week for April 21-27…during theweek, he hit .409 (9x22) with 8 runs, 5 home runs, 11 RBI with a 1.549 OPS in 6 games.
ROTATION ROOKIES…the Mariners had two rookies in the starting rotation, James Paxton andRoenis Elias, to start the season…two rookies had not made starts in the first five Mariners gamesto start the season since 1977 in the inaugural season, when Enrique Romo started (and lost) thesecond game and then Gary Wheelock started (and won) the fourth game of the season…in 1993,the Mariners had rookies John Cummings and Mike Hampton in the rotation to start the year butdidn’t use a 5th starter until the 12th game.
THREE IN A ROW…by winning the first three games of the season, Seattle recorded its first sweepin Anaheim since June 9-11, 2006…also won three straight to start the season for the third time inclub history, joining the 1995 (3) & 1985 clubs (6)…Seattle completed a season-opening sweep for
just the second time in club history, joining the 1985 club who swept the Tigers and Twins in thefirst two series.
SOLID ERA …the pitching staff recorded a 3.67 ERA (90 ER, 220.2 IP) during the month, 6th-lowestin March/April club history…had the 3rd-lowest ERA in the AL in the opening month of theseason (OAK - 2.78, KC - 3.20)…3.82 ERA by the starters was 7th-lowest in club history in theopening month of a season and 3.42 mark by the bullpen was 12th-lowest.
RECORD BREAKDOWN
Overall ............................................ 11-14
Home .................................................. 5-6
Away ................................................... 6-8
Day ..................................................... 3-4
Night ................................................. 8-10
1-Run / 2-Run .............................2-3 / 4-3 AL West .......................................... 10-11
AL Central ........................................... 0-0
AL East ............................................... 1-0
Interleague .......................................... 0-3
AL WEST STANDINGS
Team W L GB
OAK 18 10 --
TEX 15 13 3.0
LAA 14 13 3.5
SEA 11 14 5.5
HOU 9 19 9.0
DAYS BY PLACE IN AL WEST
1st .........................................................11
2nd .........................................................5
3rd ..........................................................24th ........................................................12
BATTING LEADERS
Games ....................... Cano / Smoak - 25
Batting Average .................... Cano - .296
Hits ...........................................Cano - 29
Runs ........................Ackley / Smoak - 12
2B ............................................Smoak - 6
3B ....................................Five Players - 1
HR ...........................................Seager - 5
RBI ......................................... Smoak - 15
BB ..........................................Seager - 11
SO .......................................Almonte - 39
OBP .......................................Cano - .346
SLG ....................................Seager - .458
OPS ..........................Seager / Hart - .791
XBH .......................... Seager / Smoak - 9SB .............................. Almonte / Cano - 2
CS ........................................Saunders - 2
TB ..........................................Seager - 38
Multi-Hit ......................................Cano - 8
PITCHING LEADERS
W (starter) ..........................Hernandez - 3
W (reliever) .......Farquhar/Medina/Rodney - 1
L (starter) ...............................Ramirez - 3
L (reliever) .............................. Furbush - 2
Saves ......................................Rodney - 5
GS .....................................Hernandez - 6
G ......... Farquhar / Furbush / Medina - 12
IP ..................................Hernandez - 41.1
CG ................................................... None
BB ................................ Elias / Young - 14
SO ...................................Hernandez - 47
ERA (starter) .................Hernandez - 2.40
ERA (reliever) ...................Farquhar - 1.38
Quality Starts .....................Hernandez - 6
BEST MARCH/APRIL RECORDS
20-5 (.800) ........................................200118-8 (.692) ........................................200217-10 (.630) ......................................200316-10 (.615) ......................................199616-11 (.593) ......................................199713-9 (.591) ........................................200913-10 (.565) ......................................2000
Other .500+ March/April: 1980 (11-10),1984 (12-11), 1987 (12-11), 1993 (11-11),2005 (12-12), 2007 (10-10).

8/12/2019 2014 Mid-Season Report
http://slidepdf.com/reader/full/2014-mid-season-report 33/80
31 - 2014 SEATTLE MARINERS MID-SEASON REPORT
March/April in Review (11-14) PLAYER AVG G AB R H TB 2B 3B HR RBI SH SF HP BB IBB SO SB CS DP E SLG OBP AB H HR RBI Ackley,D .256 24 78 12 20 29 4 1 1 11 0 1 0 5 0 17 1 0 3 0 .372 .298 4 2 0 1
+Almonte,A .204 24 103 10 21 31 5 1 1 8 0 0 1 5 0 39 2 1 1 3 .301 .248 0 0 0 0 RIGHT .257 35 9 13 4 0 0 3 0 0 1 2 0 8 1 .371 .316 0 0 0 0
LEFT .176 68 12 18 1 1 1 5 0 0 0 3 0 31 0 .265 .211 0 0 0 0 Bloomquist .259 8 27 3 7 7 0 0 0 0 0 0 0 1 0 7 0 0 0 0 .259 .286 1 1 0 0
Buck,J .188 5 16 1 3 3 0 0 0 0 0 0 0 3 0 3 0 0 0 1 .188 .316 0 0 0 0 Cano,R .296 25 98 11 29 37 5 0 1 12 0 1 0 8 3 16 2 1 2 2 .378 .346 0 0 0 0
Franklin,N .125 7 16 2 2 4 0 1 0 0 0 0 0 2 0 6 0 0 0 0 .250 .222 2 0 0 0 RIGHT .000 0 0 0 0 0 0 0 0 0 0 1 0 0 0 .000 .000 0 0 0 0
LEFT .125 16 2 4 0 1 0 0 0 0 0 1 0 6 0 .250 .176 2 0 0 0 Gillespie, .222 3 9 0 2 3 1 0 0 0 0 0 0 0 0 0 0 1 0 0 .333 .222 0 0 0 0
Hart,C .240 20 75 8 18 34 4 0 4 9 0 0 4 7 1 17 0 0 0 0 .453 .337 0 0 0 0 +Jones,J 1.000 1 1 0 1 1 0 0 0 0 0 0 0 0 0 0 0 0 0 0 .000 1.000 0 0 0 0
Miller,B .174 22 86 7 15 28 4 0 3 7 0 0 2 2 0 26 0 0 0 2 .326 .211 0 0 0 0 Morrison,L .150 8 20 2 3 3 0 0 0 0 0 0 0 2 0 5 1 0 0 0 .150 .227 1 0 0 0
+Romero,S .211 14 38 3 8 11 3 0 0 1 0 0 1 0 0 9 0 0 0 1 .289 .231 2 1 0 0 Saunders,M .179 21 39 7 7 13 1 1 1 3 0 1 0 5 0 10 1 2 0 0 .333 .267 1 0 0 0
Seager,K .229 24 83 11 19 38 4 0 5 13 0 0 2 11 0 21 1 1 0 4 .458 .333 1 0 0 0 Smoak,J .250 25 88 12 22 37 6 0 3 15 0 1 1 7 0 26 0 1 2 1 .420 .309 0 0 0 0
RIGHT .250 40 10 16 3 0 1 9 0 0 1 0 0 13 0 .400 .268 0 0 0 0 LEFT .250 48 12 21 3 0 2 6 0 1 0 7 0 13 2 .438 .339 0 0 0 0
Zunino,M .274 20 73 8 20 35 4 1 3 11 0 1 2 1 1 22 0 0 1 1 .479 .299 0 0 0 0 +Elias,R .000 5 2 0 0 0 0 0 0 0 0 0 0 0 0 0 0 0 0 0 .000 .000 0 0 0 0
Maurer,B .000 2 1 0 0 0 0 0 0 0 1 0 0 0 0 0 0 0 0 0 .000 .000 0 0 0 0 Young,C .000 5 1 0 0 0 0 0 0 0 0 0 0 0 0 0 0 0 0 0 .000 .000 0 0 0 0
SEATTLE .231 25 854 97 197 314 41 5 22 90 1 5 13 59 5 224 8 7 9 16 .368 .289 12 4 0 1
OPPONENT .236 25 815 102 192 316 37 6 25 92 8 9 8 93 7 197 17 5 18 22 .388 .317 17 3 0 1 DH .193 25 83 11 16 31 1 1 4 10 0 0 4 7 1 23 1 0 0 0 .373 .287 1 1 0 0
PITCHERS .000 25 4 0 0 0 0 0 0 0 1 0 0 0 0 0 0 0 0 1 .000 .000 0 0 0 0 OPP
PITCHER R/L W L ERA G GS CG GF SHO SV IP H R ER HR HB BB IBB SO WP BK AVG Beavan,B R 0 1 4.50 1 1 0 0 0 0 4.0 6 2 2 2 0 0 0 1 0 0 .375
Beimel,J L 0 1 3.60 10 0 0 1 0 0 10.0 11 4 4 0 1 4 1 7 2 0 .306 +Elias,R L 1 2 3.54 5 5 0 0 0 0 28.0 24 13 11 2 1 14 1 21 1 1 .242
Farquhar, R 1 0 1.38 12 0 0 3 0 0 13.0 10 2 2 0 1 6 0 13 0 0 .204 Furbush,C L 0 2 4.82 12 0 0 1 0 0 9.1 10 5 5 1 1 3 0 8 1 0 .286
Hernandez R 3 1 2.40 6 6 0 0 0 0 41.1 30 16 11 3 2 7 0 47 3 0 .196 +Leone,D R 0 0 1.50 8 0 0 0 0 0 12.0 8 2 2 1 0 5 0 11 1 0 .190
Luetge,L L 0 0 7.71 3 0 0 1 0 0 2.1 1 2 2 1 0 2 0 2 1 0 .125 Maurer,B R 0 0 6.75 2 2 0 0 0 0 8.0 9 6 6 0 0 3 0 7 0 0 .281
Medina,Y R 1 1 3.18 12 0 0 3 0 0 11.1 9 5 4 2 0 7 0 10 1 0 .225 Noesi,H R 0 2 11.12 7 1 0 3 0 0 11.1 19 14 14 1 0 3 0 9 1 0 .380
SEA 0 1 27.00 2 0 0 2 0 0 1.0 2 3 3 1 0 0 0 2 1 0 .400 +Paxton,J L 2 0 2.25 2 2 0 0 0 0 12.0 6 3 3 2 0 2 0 13 0 0 .146
Ramirez,E R 1 3 6.75 5 5 0 0 0 0 24.0 27 18 18 6 1 11 1 20 1 0 .284
Rodney,F R 1 1 3.86 10 0 0 10 0 5 9.1 12 6 4 0 1 6 0 15 2 0 .324
Wilhelmsen R 0 1 3.97 11 0 0 4 0 0 11.1 9 6 5 1 0 9 3 7 0 0 .214
Young,C R 1 0 3.04 5 4 0 0 0 0 23.2 18 9 8 3 0 14 1 13 2 1 .212 SEATTLE 11 14 3.67 25 25 0 25 0 5 220.2 192 102 90 25 8 93 7 197 16 2 .236
OPPONENTS 14 11 3.43 25 25 1 24 4 8 223.1 197 97 85 22 13 59 5 224 7 0 .231
DATE D/N OPPONENT RESULT SCORE REC POS. GA/GB WINNING PITCHER LOSING PITCHER SAVE TIME ATT3/31 N @LAA W 10-3 1-0 1 +0.5 Hernandez (1-0) Weaver (0-1) -- 3:17 44,1524/1 N @LAA W 8-3 2-0 1 +0.5 Ramirez (1-0) Wilson (0-1) -- 3:05 43,5674/2 N @LAA W 8-2 3-0 1 +0.5 Paxton (1-0) Santiago (0-1) -- 2:39 38,0074/3 N @OAK L 2-3 (12) 3-1 1 +1.0 Pomeranz (1-0) Noesi (0-1) -- 4:02 11,2364/4 N @OAK Rained Out 1 +1.04/5 D @OAK W 3-1 4-1 1 +2.0 Hernandez (2-0) Straily (0-1) Rodney (1) 2:22 30,2904/6 D @OAK L 3-6 4-2 1 +1.0 Gray (1-0) Ramirez (1-1) Johnson (1) 2:57 32,8524/7 Off Day 1 +0.54/8 N LAA W 5-3 5-2 1 +1.0 Paxton (2-0) Santiago (0-2) Rodney (2) 2:59 45,6624/9 N LAA L 0-2 5-3 T1 -- Richards (2-0) Elias (0-1) Frieri (1) 2:53 16,4684/10 Off Day 2 -0.54/11 N OAK W 6-4 6-3 1 +0.5 Hernandez (3-0) Milone (0-1) Rodney (3) 3:09 38,9784/12 N OAK L 1-3 6-4 2 -0.5 Gray (2-0) Ramirez (1-2) Gregerson (1) 3:08 22,0734/13 D OAK L 0-3 6-5 2 -1.5 Otero (2-0) Furbush (0-1) Doolittle (1) 2:44 22,702
4/14 N @TEX W 7-1 7-5 2 -1.5 Elias (1-1) Lewis (0-1) -- 3:01 23,0814/15 N @TEX L 0-5 7-6 2 -2.5 Ross Jr. (1-0) Beavan (0-1) -- 2:22 26,6284/16 N @TEX L 2-3 7-7 3 -2.5 Figueroa (1-1) Rodney (0-1) -- 2:47 27,3964/17 D @TEX L 6-8 7-8 3 -3.0 Figueroa (2-1) Beimel (0-1) Soria (2) 3:28 29,0244/18 N @MIA L 4-8 7-9 4 -4.0 Cishek (1-0) Medina (0-1) -- 3:09 21,3884/19 N @MIA L 0-7 7-10 4 -5.0 ALVAREZ (1-2) Elias (1-2) -- 2:20 24,0034/20 D @MIA L 2-3 7-11 4 -6.0 Dunn (1-2) Wilhelmsen (0-1) Cishek (3) 2:58 20,2284/21 N HOU L 2-7 7-12 4 -6.0 Keuchel (2-1) Hernandez (3-1) -- 2:49 14,6284/22 N HOU L 2-5 7-13 4 -6.0 McHugh (1-0) Ramirez (1-3) Fields (2) 3:02 10,4674/23 D HOU W 5-3 8-13 4 -5.5 Rodney (1-1) Fields (0-1) -- 2:50 13,7294/24 Off Day 4 -5.54/25 N TEX W 6-5 9-13 4 -5.5 Medina (1-1) Cotts (1-2) Rodney (4) 2:55 31,1464/26 N TEX L 3-6 9-14 4 -5.5 Poreda (1-0) Furbush (0-2) Soria (6) 3:13 30,0424/27 D TEX W 6-5 10-14 4 -4.5 Farquhar (1-0) Ogando (1-2) Rodney (5) 3:10 26,3074/28 Off Day 4 -5.04/29 N @NYY W 6-3 11-14 4 -5.0 Young (1-0) Sabathia (3-3) -- 3:33 37,4844/30 N @NYY Rained Out 4 -5.5
MARCH/APRIL TOTALS Record: 11-14 Batting Average: .231 ERA: 3.67 FLD%: .982 Average Time of Game: 2:59

8/12/2019 2014 Mid-Season Report
http://slidepdf.com/reader/full/2014-mid-season-report 34/80
32 - 2014 SEATTLE MARINERS MID-SEASON REPORT
May Review (16-14)
TEAM NOTES…finished May 16-14, securing the first winning month of the season (last: July 201315-10)…most May wins since also going 16-14 in 2007…opened the month winning 6 of the firs7 games, including a 5-game winning streak May 3-7…went 8-9 at Safeco Field and 8-5 on theroad…played a pair of extra-inning games, going 1-1…17 of 31 games were played vs. the AL Westgoing 10-7…split a doubleheader at Oakland on May 7 (makeup of rainout on April 4)…20 of 31games were decided by 2 or less runs, going 10-10 in those games (4-5 in 1-run games, 6-5 in 2-run
games)…finished the month one game under .500 at 27-28…the Mariners used 29 players duringthe month: 16 position players, 13 pitchers (6 starters).
LOTS OF GAMES…the Mariners tied a club record for most gamesplayed in a single month with 30…the 30 games in the monthmatched August 1988 (14-16), August 1997 (15-15) and May 2007(16-14)…the Mariners (16-14), Orioles (15-15), Dodgers (15-15) andBlue Jays (21-9) all played 30 games in the 31 days of May.
RODNEY SAVES THE DAY …Fernando Rodney led the AmericanLeague with 9 saves during the month (9-for-10 in save opps)…posted a 1.59 ERA (2 ER, 11.1 IP) in 12 appearances…tied hismonthly career-high for saves in a month joining May 2012, August2012 and July 2013…is the 9th Mariners pitcher (13th time) to recordat least 9 saves in a month.
KING FELIX …Felix Hernandez was a perfect 4-0 in 6 starts duringthe month, posting a 2.74 ERA (13 ER, 42.2 IP)…among AL startingpitchers was T4th in wins (4), T5th in innings pitched (42.2), T8th instrikeouts (36) and 11th in ERA (2.74)…is 7-2 with a 2.81 ERA overthe last two seasons in May, after going 10-20, 4.68 ERA in previous7 May’s (2006-2012).
CANO’S BIG MONTH…Robinson Cano hit .355 (38x107) with 8extra-base hits (2B - 6, 3B - 1, HR - 1) in 27 games…7th-most hitshe has recorded in a month in his career, trailing 42 in July 2007, 41in August 2009, 41 in September 2006, 40 in September 2005, 39 in May 2010 and 39 in August2011…among AL leaders ranked T6th in hits and 9th in batting average…he recorded at least onehit in 21 of 27 games with 14 multi-hit games.
DYNAMITE…James Jones made his first Major League start May 6 at Oakland…he recorded atleast one hit in each of his first 15 Major League starts, setting a Mariners record (had 2 hitless
pinch-hitting appearances)…Edgar Martinez recorded a hit in each of his first 10 starts in 1987and Alvin Davis had a hit in his first 9 starts in 1984…Jones also recorded a 14-game hitting streak(.288/15x52), the first double-digit hitting streak by a Mariners rookie since 2011.
THE ARMS…Mariners pitchers combined for a 3.56 ERA, 4th-best in the American League (OAK- 3.08, HOU - 3.42, NYY - 3.51)…the starters led the AL with 193.1 innings pitched and ERA was6th-best at 3.91…the bullpen had the 2nd-lowest ERA among AL teams (3rd-lowest in MLB) with a2.65 mark…lowest monthly bullpen ERA since a 1.88 mark in June 2012.
THE BATS…Mariners hit .233 (228x978) during the month, ranking 13th in the American League…21home runs were 12th in the AL, and fewest in a month since hitting 19 home runs in July 2012 (26games)…tied for the league lead with 8 triples, the most since also hitting 8 in May 2012…recorded12 hit-by-pitch (2nd in AL)…recorded 10+ hits in 7 games and scored a season-high 12 runs May12 vs. Tampa Bay.
THE GLOVES…recorded a .985 fielding percentage during the month, committing 17 errors in 268.0
innings…played error-free in 19 of 30 games during the month, and had only 3 multi-error games…season-high 5 errors May 11 vs. Kansas City…Mike Zunino and John Buck combined to throw ou7 of 21 attempted base stealers (33.3%).
ODDS AND ENDS…• Kyle Seager tied for 10th in the AL with 20 RBI…he batted .272 (28x103) with 11 extra-base hits.• Roenis Elias ranked 3rd among MLB rookie pitchers with 36 strikeouts (Tanaka - 42, Odorizzi - 41).• Joe Beimel posted a 0.00 ERA (6.2 IP) in his 8 relief appearances during the month.• Michael Saunders batted .318 (28x88) with 17 runs scored in 26 games…most hits he has recorded in a
month during his career (previous: 25 in June 2012).• Dominic Leone posted a 1.54 ERA (2 ER, 11.2 IP) in 12 appearances.• Willie Bloomquist hit HR #1 May 23 vs. Houston, snapping a string of 663 consecutive plate appearances
without a home run (first homer since 8/10/11 vs. Houston w/Arizona).• Chris Young went 4-2, 3.40 ERA, tying his monthly career-high (went 4-1 in May 2007 with the Padres).• Dustin Ackley recorded his first career multi-HR game May 11 vs. Kansas City (3x4, 2 HR, 2 RBI).
RECORD BREAKDOWN
Overall ............................................ 16-14
Home .................................................. 8-9
Away ................................................... 8-5
Day ..................................................... 5-5
Night ................................................. 11-9
1-Run / 2-Run .............................4-5 / 6-5 AL West ............................................ 10-7
AL Central ........................................... 4-5
AL East ............................................... 2-2
Extra Inning ........................................ 1-1
Interleague .......................................... 0-0
AL WEST STANDINGS (THRU MAY)
Team W L GB
OAK 34 22 --
LAA 30 25 3.5
TEX 28 28 6.0
SEA 27 28 6.5
HOU 24 33 10.5
DAYS BY PLACE IN AL WEST
1st ...........................................................0
2nd .........................................................53rd ........................................................14
4th ........................................................12
5th ..........................................................0
BATTING LEADERS
Games ...................................Smoak - 30
Batting Average .....................Cano - .355
Hits ...........................................Cano - 38
Runs ..................................Saunders - 17
2B ............................................Seager - 7
3B ............................. Jones/Saunders - 2
HR ...............................Smoak/Zunino - 4
RBI .........................................Seager - 20
BB .......................................... Smoak - 13
SO .............................Smoak/Zunino - 26
OBP .......................................Cano - .393
SLG ................................Saunders - .477OPS .......................................Cano - .851
XBH .......................................Seager - 11
SB ..............................................Jones - 5
CS .............................. Romero/Zunino - 2
TB .............................................Cano - 49
Multi-Hit ....................................Cano - 14
PITCHING LEADERS
W (starter) .............. Hernandez/Young - 4
W (reliever) ................... Leone/Medina - 1
L (starter) .................................Maurer - 4
L (reliever) ........................... 4 pitchers - 1
Saves ......................................Rodney - 9
GS ...................................... 4 pitchers - 6
G ....................................... 4 pitchers - 12
IP .....................................Iwakuma - 43.2
CG ................................................... None
BB ..............................................Elias - 12
SO ..........................Elias/Hernandez - 36
ERA (starter) .................Hernandez - 2.74
ERA (reliever) ...................... Beimel - 0.00
Quality Starts ......... Hernandez/Young - 4
BEST MAY RECORDS
20-7 (.741) ........................................2001
19-8 (.704) ........................................2003
16-11 (.593) ......................................2002
15-11 (.577) ......................................2011
16-12 (.571) ......................................1995
Other .500+ May: 1999 (15-12), 1991 (15-12),
1987 (14-12), 2007 (16-14), 2014 (16-14), 1989
(14-13), 1990 (15-14), 1982 (14-14), 1998 (14-14).
MOST GAMES
IN A MONTH
May 2014 ...................................30May 2007 ....................................30 August 1997 ...............................30 August 1988 ...............................30
AMERICAN LEAGUE
MAY SAVES LEADERS
1. F. Rodney (SEA) ....................92. G. Holland (KC) ......................8 C. Janssen (TOR) ...................8 J. Nathan (DET) ......................8 G. Perkins (MIN) .....................8 D. Robertson (NYY) ................8
AMERICAN LEAGUE
MAY RUN DIFFERENTIAL
AL Team RS RA DiffOakland 142 89 +53Toronto 165 124 +41Seattle 127 113 +14Houston 124 110 +14Detroit 136 124 +12
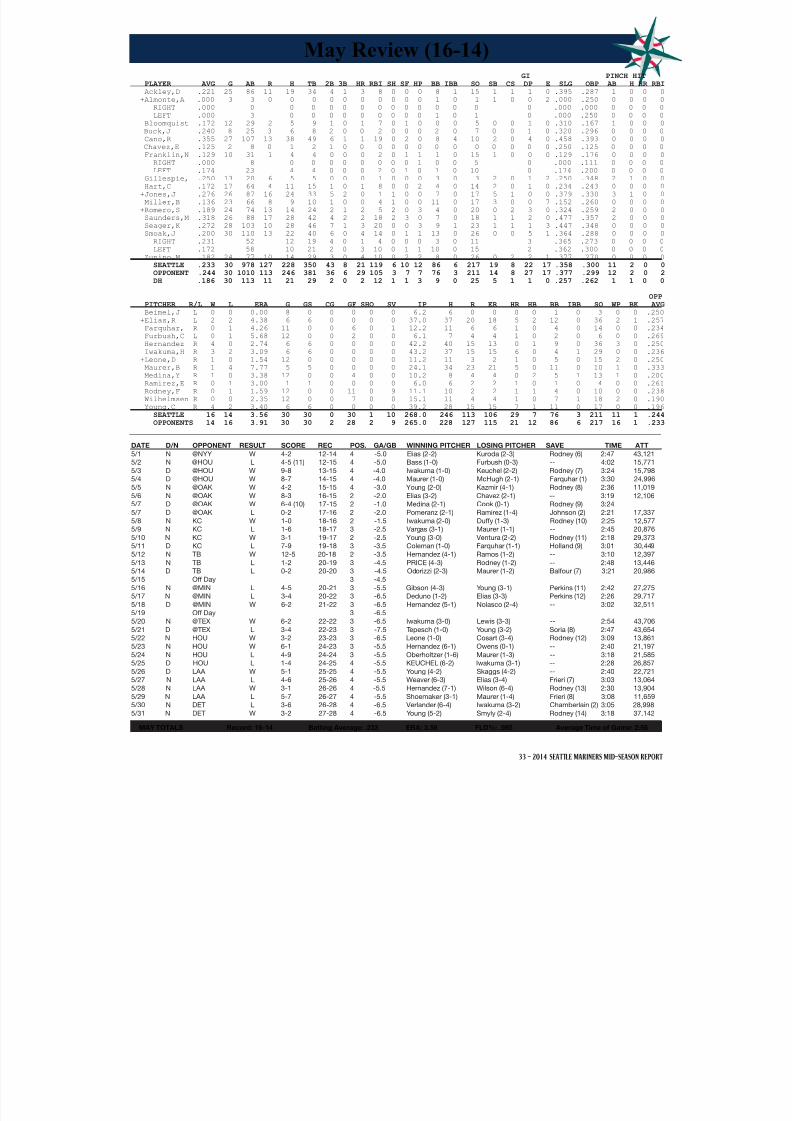
8/12/2019 2014 Mid-Season Report
http://slidepdf.com/reader/full/2014-mid-season-report 35/80
33 - 2014 SEATTLE MARINERS MID-SEASON REPORT
May Review (16-14) GI PINCH HIT PLAYER AVG G AB R H TB 2B 3B HR RBI SH SF HP BB IBB SO SB CS DP E SLG OBP AB H HR RBI
Ackley,D .221 25 86 11 19 34 4 1 3 8 0 0 0 8 1 15 1 1 1 0 .395 .287 1 0 0 0
+Almonte,A .000 3 3 0 0 0 0 0 0 0 0 0 0 1 0 1 1 0 0 2 .000 .250 0 0 0 0
RIGHT .000 0 0 0 0 0 0 0 0 0 0 0 0 0 0 .000 .000 0 0 0 0
LEFT .000 3 0 0 0 0 0 0 0 0 0 1 0 1 0 .000 .250 0 0 0 0
Bloomquist .172 12 29 2 5 9 1 0 1 7 0 1 0 0 0 5 0 0 1 0 .310 .167 1 0 0 0
Buck,J .240 8 25 3 6 8 2 0 0 2 0 0 0 2 0 7 0 0 1 0 .320 .296 0 0 0 0
Cano,R .355 27 107 13 38 49 6 1 1 19 0 2 0 8 4 10 2 0 4 0 .458 .393 0 0 0 0
Chavez,E .125 2 8 0 1 2 1 0 0 0 0 0 0 0 0 0 0 0 0 0 .250 .125 0 0 0 0 Franklin,N .129 10 31 1 4 4 0 0 0 2 0 1 1 1 0 15 1 0 0 0 .129 .176 0 0 0 0
RIGHT .000 8 0 0 0 0 0 0 0 0 1 0 0 5 0 .000 .111 0 0 0 0
LEFT .174 23 4 4 0 0 0 2 0 1 0 1 0 10 0 .174 .200 0 0 0 0
Gillespie, .250 13 20 6 5 5 0 0 0 1 0 0 0 3 0 3 2 0 1 2 .250 .348 2 1 0 0
Hart,C .172 17 64 4 11 15 1 0 1 8 0 0 2 4 0 14 2 0 1 0 .234 .243 0 0 0 0
+Jones,J .276 26 87 16 24 33 5 2 0 1 1 0 0 7 0 17 5 1 0 0 .379 .330 3 1 0 0
Miller,B .136 23 66 8 9 10 1 0 0 4 1 0 0 11 0 17 3 0 0 7 .152 .260 0 0 0 0
+Romero,S .189 24 74 13 14 24 2 1 2 5 2 0 3 4 0 20 0 2 3 0 .324 .259 2 0 0 0
Saunders,M .318 26 88 17 28 42 4 2 2 18 2 3 0 7 0 18 1 1 2 0 .477 .357 2 0 0 0
Seager,K .272 28 103 10 28 46 7 1 3 20 0 0 3 9 1 23 1 1 1 3 .447 .348 0 0 0 0
Smoak,J .200 30 110 13 22 40 6 0 4 14 0 1 1 13 0 26 0 0 5 1 .364 .288 0 0 0 0
RIGHT .231 52 12 19 4 0 1 4 0 0 0 3 0 11 3 .365 .273 0 0 0 0
LEFT .172 58 10 21 2 0 3 10 0 1 1 10 0 15 2 .362 .300 0 0 0 0
Zunino,M .182 24 77 10 14 29 3 0 4 10 0 2 2 8 0 26 0 2 2 1 .377 .270 0 0 0 0
SEATTLE .233 30 978 127 228 350 43 8 21 119 6 10 12 86 6 217 19 8 22 17 .358 .300 11 2 0 0
OPPONENT .244 30 1010 113 246 381 36 6 29 105 3 7 7 76 3 211 14 8 27 17 .377 .299 12 2 0 2
DH .186 30 113 11 21 29 2 0 2 12 1 1 3 9 0 25 5 1 1 0 .257 .262 1 1 0 0
OPP
PITCHER R/L W L ERA G GS CG GF SHO SV IP H R ER HR HB BB IBB SO WP BK AVG
Beimel,J L 0 0 0.00 8 0 0 0 0 0 6.2 6 0 0 0 0 1 0 3 0 0 .250
+Elias,R L 2 2 4.38 6 6 0 0 0 0 37.0 37 20 18 5 2 12 0 36 2 1 .257
Farquhar, R 0 1 4.26 11 0 0 6 0 1 12.2 11 6 6 1 0 4 0 14 0 0 .234
Furbush,C L 0 1 5.68 12 0 0 2 0 0 6.1 7 4 4 1 0 2 0 6 0 0 .269
Hernandez R 4 0 2.74 6 6 0 0 0 0 42.2 40 15 13 0 1 9 0 36 3 0 .250
Iwakuma,H R 3 2 3.09 6 6 0 0 0 0 43.2 37 15 15 6 0 4 1 29 0 0 .236
+Leone,D R 1 0 1.54 12 0 0 0 0 0 11.2 11 3 2 1 0 5 0 15 2 0 .250
Maurer,B R 1 4 7.77 5 5 0 0 0 0 24.1 34 23 21 5 0 11 0 10 1 0 .333
Medina,Y R 1 0 3.38 12 0 0 4 0 0 10.2 8 4 4 0 2 5 1 13 1 0 .200
Ramirez,E R 0 1 3.00 1 1 0 0 0 0 6.0 6 2 2 1 0 1 0 4 0 0 .261
Rodney,F R 0 1 1.59 12 0 0 11 0 9 11.1 10 2 2 1 1 4 0 10 0 0 .238
Wilhelmsen R 0 0 2.35 12 0 0 7 0 0 15.1 11 4 4 1 0 7 1 18 2 0 .190
Young,C R 4 2 3.40 6 6 0 0 0 0 39.2 28 15 15 7 1 11 0 17 0 0 .196
SEATTLE 16 14 3.56 30 30 0 30 1 10 268.0 246 113 106 29 7 76 3 211 11 1 .244
OPPONENTS 14 16 3.91 30 30 2 28 2 9 265.0 228 127 115 21 12 86 6 217 16 1 .233
DATE D/N OPPONENT RESULT SCORE REC POS. GA/GB WINNING PITCHER LOSING PITCHER SAVE TIME ATT
5/1 N @NYY W 4-2 12-14 4 -5.0 Elias (2-2) Kuroda (2-3) Rodney (6) 2:47 43,121
5/2 N @HOU L 4-5 (11) 12-15 4 -5.0 Bass (1-0) Furbush (0-3) -- 4:02 15,771
5/3 D @HOU W 9-8 13-15 4 -4.0 Iwakuma (1-0) Keuchel (2-2) Rodney (7) 3:24 15,798
5/4 D @HOU W 8-7 14-15 4 -4.0 Maurer (1-0) McHugh (2-1) Farquhar (1) 3:30 24,996
5/5 N @OAK W 4-2 15-15 4 -3.0 Young (2-0) Kazmir (4-1) Rodney (8) 2:36 11,019
5/6 N @OAK W 8-3 16-15 2 -2.0 Elias (3-2) Chavez (2-1) -- 3:19 12,106
5/7 D @OAK W 6-4 (10) 17-15 2 -1.0 Medina (2-1) Cook (0-1) Rodney (9) 3:24
5/7 D @OAK L 0-2 17-16 2 -2.0 Pomeranz (2-1) Ramirez (1-4) Johnson (2) 2:21 17,337
5/8 N KC W 1-0 18-16 2 -1.5 Iwakuma (2-0) Duffy (1-3) Rodney (10) 2:25 12,577
5/9 N KC L 1-6 18-17 3 -2.5 Vargas (3-1) Maurer (1-1) -- 2:45 20,876
5/10 N KC W 3-1 19-17 2 -2.5 Young (3-0) Ventura (2-2) Rodney (11) 2:18 29,373
5/11 D KC L 7-9 19-18 3 -3.5 Coleman (1-0) Farquhar (1-1) Holland (9) 3:01 30,449
5/12 N TB W 12-5 20-18 2 -3.5 Hernandez (4-1) Ramos (1-2) -- 3:10 12,397
5/13 N TB L 1-2 20-19 3 -4.5 PRICE (4-3) Rodney (1-2) -- 2:48 13,446
5/14 D TB L 0-2 20-20 3 -4.5 Odorizzi (2-3) Maurer (1-2) Balfour (7) 3:21 20,986
5/15 Off Day 3 -4.5
5/16 N @MIN L 4-5 20-21 3 -5.5 Gibson (4-3) Young (3-1) Perkins (11) 2:42 27,275
5/17 N @MIN L 3-4 20-22 3 -6.5 Deduno (1-2) Elias (3-3) Perkins (12) 2:26 29,717
5/18 D @MIN W 6-2 21-22 3 -6.5 Hernandez (5-1) Nolasco (2-4) -- 3:02 32,511
5/19 Off Day 3 -6.5
5/20 N @TEX W 6-2 22-22 3 -6.5 Iwakuma (3-0) Lewis (3-3) -- 2:54 43,706
5/21 D @TEX L 3-4 22-23 3 -7.5 Tepesch (1-0) Young (3-2) Soria (8) 2:47 43,654
5/22 N HOU W 3-2 23-23 3 -6.5 Leone (1-0) Cosart (3-4) Rodney (12) 3:09 13,861
5/23 N HOU W 6-1 24-23 3 -5.5 Hernandez (6-1) Owens (0-1) -- 2:40 21,197
5/24 N HOU L 4-9 24-24 3 -5.5 Oberholtzer (1-6) Maurer (1-3) -- 3:18 21,585
5/25 D HOU L 1-4 24-25 4 -5.5 KEUCHEL (6-2) Iwakuma (3-1) -- 2:28 26,857
5/26 D LAA W 5-1 25-25 4 -5.5 Young (4-2) Skaggs (4-2) -- 2:40 22,721
5/27 N LAA L 4-6 25-26 4 -5.5 Weaver (6-3) Elias (3-4) Frieri (7) 3:03 13,064
5/28 N LAA W 3-1 26-26 4 -5.5 Hernandez (7-1) Wilson (6-4) Rodney (13) 2:30 13,904
5/29 N LAA L 5-7 26-27 4 -5.5 Shoemaker (3-1) Maurer (1-4) Frieri (8) 3:08 11,659
5/30 N DET L 3-6 26-28 4 -6.5 Verlander (6-4) Iwakuma (3-2) Chamberlain (2) 3:05 28,998
5/31 N DET W 3-2 27-28 4 -6.5 Young (5-2) Smyly (2-4) Rodney (14) 3:18 37,142
MAY TOTALS Record: 16-14 Batting Average: .233 ERA: 3.56 FLD%: .985 Average Time of Game: 2:56

8/12/2019 2014 Mid-Season Report
http://slidepdf.com/reader/full/2014-mid-season-report 36/80
34 - 2014 SEATTLE MARINERS MID-SEASON REPORT
June Review (18-10)
TEAM NOTES…finished June with a 18-10 record, the 18 wins were tied for the most in the Majorsduring the month (also: CIN, LAD, MIL)…won 7 of first 8 games and 11 of the final 15 game afterdropping 5 straight games, June 10-14…played 15 of 28 games at Safeco Field, going 8-7 in homegames, and 10-3 on the road…longest winning streak was 5 games, June 20-24, and longest losingstreak was a 5-game streak…did not play an extra innings game…12 of 28 games were decidedby 2 or fewer runs, going 3-5 in 1-run games and 3-1 in 2-run contests…were a 8-9 team in night
games and 10-1 in day games.WINNING JUNE…the Mariners finished June with an 18-10 record (.643), the 2nd-best record in the
American League (OAK: 17-9/.654)…recorded back-to-back winning months (were 16-14 in Mayfor the first time since July-August, 2012… have not had a winning June since going 14-13 in 2010(were 11-16 in each of last 3 seasons in June).
ODDS AND ENDS…• Dustin Ackley & Kyle Seager were T4th with 7 defensive runs saved in June.• Endy Chavez batted leadoff in 17G in June, reaching base safely in his first PA 12, including 11 G with a hit• Seattle was one of 5 AL teams with a positive run differential in the month of June, while leading the Majors
for the month (+47, 117-70).• The Mariners recorded 5 shutouts, T4th-most in a month in franchise history (April, 1993 & June, 1987).• Willie Bloomquist played in his 1,000 career game on June 10 vs. the New York Yankees.• James Jones stole 12 bases in the month of June, becoming the 9th player in franchise history to record
at least 12 stolen base in a single month (done 20, last: Chone Figgins, 13 in 2010)…ranked T3rd in theMajors (2nd in AL) in steals for the month.
• Kyle Seager hit .464 (26x56) with 7 R, 6 2B, 3 HR and 16 RBI in 15 games at Safeco Field in June.• Fernando Rodney recorded 9 saves in back-to-back months (May & June).
JUNE ERA …the Mariners led the Majors with 2.53 ERA (70 ER,249.0 IP) in June, setting a monthly club record (old record was 2.80in July 1991)…the bullpen also set a monthly club record with a 1.64ERA (14 ER, 76.2 IP), bettering the 1.88 mark of June 2012.
KING OF JUNE…Felix Hernandez was named the AL Pitcher ofthe Month for June…went 3-1 with a 1.22 ERA (6 ER, 44.1 IP) in 6starts…struck out 54 batters during the month to T2nd in the AL(Darvish – 57, Price – 54), the most K’s he has recorded in a monthduring his career (previous: 51 in June 2010, August 2010, August2011)…his 1.22 ERA is 10th-lowest in a month in club history (min.5 GS), and the 4th-lowest of his career (0.82 – August 2010, 0.94– June 2009, 1.08 – August 2012)…this is the 4th monthly honorfor Hernandez, also winning the award in August 2012, September2009 and June 2009…only pitcher in club history to win more than 2Pitcher of the Month awards (Randy Johnson – 2, Mark Langston –2)…Felix was also named AL Player of the Week, June 2-8.
LOTS OF STRIKEOUTS…Felix Hernandez recorded a career-monthly-best 54 strikeouts in 6 starts during the month…moststrikeouts in a month by a Mariners pitcher since Randy Johnson in1998 (58 in June & 55 in July).
ROOKIE SHUTOUT…Roenis Elias tossed a 3-hit shutout on June 1 vs. Detroit at Safeco Fieldhis first career shutout…it was the 14th complete game shutout by a Mariners rookie and the firstsince Freddy Garcia blanked Detroit on Aug. 24, 1999…he’s just the 6th left-handed rookie to tossa shutout in club history…11 of the 14 shutouts by Mariners rookies have come from left-handers.
A FELIX DOZEN +3…Felix Hernandez struck out a career-high 15 batters on June 8 at TB.
• His 15 strikeouts are tied for most in the Majors this season (Jon Lester, BOS & Clayton Kershaw, LAD).• 21st time in club history that a pitcher had at least 15 strikeouts, 1st time since Randy Johnson had 15 on
July 11, 1998 vs. Angels…Johnson (17), Mark Langston (2x) and Mike Moore (1).• His strikeout of Evan Longoria to end the 3rd inning was the 1,800th of his career.• Reached double-digit strikeouts for the third time this season (April 11 vs. OAK, March 31 at LAA).• Marked the 29th time in his career, passing Mark Langston for sole possession of second place in club
history, trailing Randy Johnson who had 94 double-digit strikeout games in his Mariners career.• Struck out the side in the 3rd, 5th and 7th inning…struck out 2+ in the 1st, 3rd, 4th, 5th & 7th.
WHAT A GAME…Kyle Seager tied club record (7th time) with four extra base hits (2B, 2 3B, HRon June 2 at NYY, last done by Adrian Beltre (July 6, 2007 vs. OAK)…also tied club record with twotriples, becoming 14th player in club history to do so, last done by Brad Miller (July 5, 2013 at CIN)…he became the first Major Leaguer to hit two triples and at least one homer and one double since HaBreeden for Montreal in 1973 (STATS INC)…last AL player to do it was Hoot Evers for Detroit in 1950
RECORD BREAKDOWN
Overall ............................................ 18-10
Home .................................................. 8-7
Away ................................................. 10-3
Day ................................................... 10-1
Night ................................................... 8-9
1-Run / 2-Run .............................3-5 / 3-1
AL West .............................................. 2-2
AL Central ........................................... 6-1
AL East ............................................... 6-5
Interleague .......................................... 4-2
AL WEST STANDINGS
Team W L GB
OAK 51 31 -
LAA 45 35 5.0
SEA 45 38 6.5
TEX 37 45 14.0
HOU 36 48 16.0
DAYS BY PLACE IN AL WEST
1st ...........................................................0
2nd .........................................................1
3rd ........................................................284th ..........................................................1
5th ..........................................................0
BATTING LEADERS
Games ........................Jones/Seager - 28
Batting Average ..................Seager - .309
Hits ........................................Seager - 34
Runs .........................................Cano - 19
2B ............................................Seager - 9
3B ...............................Chavez/Seager - 2
HR .................................Miller/Zunino - 5
RBI .........................................Seager - 22
BB .............................................Cano - 12
SO .........................................Zunino - 38
OBP .......................................Cano - .391
SLG ....................................Seager - .536
OPS ....................................Seager - .887 XBH .......................................Seager - 15
SB ............................................Jones - 12
CS ........................................ 9 Players - 1
TB ..........................................Seager - 59
Multi-Hit .................................Seager - 10
PITCHING LEADERS
W (starter) ....................................Elias - 4
W (reliever) .................. Beimel/Medina - 2
L (starter) ..........Elias/Iwakuma/Young - 2
L (reliever) ..... Furbush/Leone/Rodney - 1
Saves ......................................Rodney - 9
GS ............................Elias/Hernandez - 6
G ...........................................Rodney - 12
IP ..................................Hernandez - 44.1
CG ...............................................Elias - 1
BB ........................................ Ramirez - 17
SO ...................................Hernandez - 54
ERA (starter) .................Hernandez - 1.22
ERA (reliever) ..................... Medina - 0.00
Quality Starts .....................Hernandez - 6
BEST JUNE RECORDS
20-7 (.741) ...................................................1997
19-8 (.704) ...................................................2000
18-8 (.692) ...................................................2006
18-10 (.643) .................................................2014
18-9 (.667) ...................................................2007
18-9 (.667) ...................................................2001
Other .500+ June: 2003 (17-10), 2002 (17-11),1982 (15-10), 2009 (15-10), 1985 (16-11), 1979(16-12), 1990 (16-12), 1996 (14-12), 1991 (14-13), 2010 (14-13).
LOWEST MONTHLY
ERA IN CLUB HISTORY
1. June 2014 ........................2.532. July 1991 ................. .........2.803. May 2011....................... ...2.824. July 2012 ................. .........2.825. June 2009.........................2.98
LOWEST MONTHLY
BULLPEN ERA
1. June 2014 ........................1.642. June 2012.........................1.883. July 2001 ................. .........1.974. June 1990.........................2.115. June 2009.........................2.20
MONTHLY SHUTOUTS
1. June 2002..............................6 July 2001 ................. ..............6 September 1998 .................. ..64. June 2014 .............................5 June 1987..............................5 April 1993 ................ ..............5

8/12/2019 2014 Mid-Season Report
http://slidepdf.com/reader/full/2014-mid-season-report 37/80
35 - 2014 SEATTLE MARINERS MID-SEASON REPORT
June Review (18-10) GI PINCH HIT PLAYER AVG G AB R H TB 2B 3B HR RBI SH SF HP BB IBB SO SB CS DP E SLG OBP AB H HR RBI
Ackley,D .165 25 79 7 13 17 4 0 0 8 0 0 1 6 0 13 1 1 0 0 .215 .233 0 0 0 0
Bloomquist .348 14 46 5 16 20 4 0 0 4 1 0 0 2 1 12 0 1 0 0 .435 .375 2 0 0 0
Buck,J .229 12 35 5 8 11 0 0 1 3 0 0 0 3 0 11 0 0 0 0 .314 .289 2 0 0 0
Cano,R .307 27 101 19 31 49 6 0 4 17 0 0 2 12 1 14 1 1 2 1 .485 .391 0 0 0 0
Chavez,E .277 25 83 9 23 34 4 2 1 7 2 1 0 3 0 8 1 1 0 0 .410 .299 3 0 0 0
Gillespie, .244 17 41 3 10 14 1 0 1 4 1 0 0 3 0 10 0 1 2 0 .341 .295 1 0 0 0
RIGHT .244 41 10 14 1 0 1 4 1 0 0 3 0 10 2 .341 .295 1 0 0 0
LEFT .000 0 0 0 0 0 0 0 0 0 0 0 0 0 0 .000 .000 0 0 0 0 +Jones,J .292 28 106 14 31 34 1 1 0 5 2 0 0 2 0 17 12 0 3 1 .321 .306 0 0 0 0
Miller,B .298 26 84 15 25 43 1 1 5 12 1 1 0 8 1 21 0 1 0 1 .512 .355 0 0 0 0
Montero,J .286 5 14 1 4 7 0 0 1 2 0 0 0 0 0 2 0 0 1 0 .500 .286 1 0 0 0
Morrison,L .262 19 65 7 17 31 2 0 4 11 0 1 0 7 1 14 1 0 3 1 .477 .329 0 0 0 0
+Romero,S .194 13 36 2 7 13 1 1 1 5 0 1 0 0 0 11 0 1 0 0 .361 .189 2 1 1 3
Saunders,M .200 9 35 4 7 16 2 0 2 4 0 0 0 1 0 13 0 1 0 0 .429 .222 0 0 0 0
Seager,K .309 28 110 12 34 59 9 2 4 22 1 0 0 7 0 21 2 1 2 0 .536 .350 0 0 0 0
Smoak,J .056 8 18 1 1 1 0 0 0 0 0 0 0 1 0 8 0 0 0 0 .056 .105 1 0 0 0
RIGHT .000 5 0 0 0 0 0 0 0 0 0 1 0 3 0 .000 .167 0 0 0 0
LEFT .077 13 1 1 0 0 0 0 0 0 0 0 0 5 0 .077 .077 1 0 0 0
Zunino,M .221 23 86 13 19 40 6 0 5 10 0 0 5 2 0 38 0 0 2 1 .465 .280 0 0 0 0
Beimel,J .000 10 0 0 0 0 0 0 0 0 0 0 0 0 0 0 0 0 0 0 .000 .000 0 0 0 0
Hernandez, .000 6 2 0 0 0 0 0 0 0 1 0 0 0 0 0 0 0 0 0 .000 .000 0 0 0 0
Iwakuma,H .000 5 1 0 0 0 0 0 0 0 1 0 0 1 0 1 0 0 0 0 .000 .500 0 0 0 0
Ramirez,E .000 5 2 0 0 0 0 0 0 0 1 0 0 0 0 1 0 0 0 0 .000 .000 0 0 0 0
SEATTLE .261 28 944 117 246 389 41 7 29 114 11 4 8 58 4 215 18 9 15 6 .411 .308 12 1 1 3
OPPONENT .214 28 894 70 191 282 30 2 19 67 8 5 8 68 4 226 14 5 17 15 .315 .274 16 3 0 2
DH .200 28 85 10 17 22 2 0 1 6 0 0 0 8 0 22 1 2 1 0 .259 .269 3 0 0 0
PITCHERS .000 28 5 0 0 0 0 0 0 0 3 0 0 1 0 2 0 0 0 1 .000 .167 0 0 0 0
OPP
PITCHER R/L W L ERA G GS CG GF SHO SV IP H R ER HR HB BB IBB SO WP BK AVG
Beimel,J L 2 0 0.00 10 0 0 2 0 0 9.0 5 0 0 0 0 4 1 6 0 0 .161
+Elias,R L 4 2 3.86 6 6 1 0 1 0 39.2 28 17 17 5 3 10 0 30 1 1 .201
Farquhar, R 0 0 3.00 10 0 0 1 0 0 9.0 8 3 3 1 0 4 1 11 2 1 .235
Furbush,C L 1 1 1.04 10 0 0 4 0 0 8.2 8 1 1 0 1 0 0 10 0 0 .250
Hernandez R 3 1 1.22 6 6 0 0 0 0 44.1 26 6 6 1 0 6 0 54 5 0 .170
Iwakuma,H R 2 2 4.02 5 5 0 0 0 0 31.1 36 14 14 4 0 4 0 26 0 0 .290
+Leone,D R 1 1 3.86 9 0 0 0 0 0 9.1 8 4 4 0 0 2 0 10 0 0 .229
Maurer,B R 0 0 0.00 2 0 0 1 0 0 3.0 1 0 0 0 0 0 0 6 0 0 .100
Medina,Y R 2 0 0.00 9 0 0 2 0 0 7.2 2 0 0 0 0 2 0 7 0 0 .083
Ramirez,E R 0 0 2.74 5 5 0 0 0 0 23.0 22 7 7 3 0 17 1 18 2 0 .250
Rodney,F R 0 1 1.54 12 0 0 12 0 9 11.2 7 2 2 0 0 1 0 12 0 0 .171
+Walker,T R 1 0 4.50 1 1 0 0 0 0 6.0 5 3 3 2 1 2 0 6 0 0 .238
Wilhelmsen R 0 0 1.96 9 0 0 5 0 1 18.1 10 4 4 1 2 6 0 13 1 0 .169
Young,C R 2 2 2.89 5 5 0 0 0 0 28.0 25 9 9 2 1 10 1 17 1 0 .243
SEATTLE 18 10 2.53 28 28 1 27 5 10 249.0 191 70 70 19 8 68 4 226 12 2 .214
OPPONENTS 10 18 4.06 28 28 2 26 3 7 244.0 247 117 110 29 8 58 4 215 12 1 .262
DATE D/N OPPONENT RESULT SCORE REC POS. GA/GB WINNING PITCHER LOSING PITCHER SAVE TIME ATT
6/1 D DET W 4-0 28-28 4 -6.5 ELIAS (4-4) Scherzer (6-2) -- 2:46 31,405
6/2 N @NYY W 10-2 29-28 T3 -6.0 Hernandez (8-1) Phelps (1-3) -- 2:54 41,539
6/3 N @ATL W 7-5 30-28 3 -6.0 Leone (2-0) Wood (5-6) Rodney (15) 3:08 36,503
6/4 D @ATL W 2-0 31-28 3 -6.0 Iwakuma (4-2) Minor (2-4) Rodney (16) 2:51 26,960
6/5 Off Day T2 -5.5
6/6 N @TB L 0-4 31-29 3 -6.5 Bedard (3-4) Young (5-3) -- 3:17 14,577
6/7 D @TB W 7-4 32-29 3 -5.5 Elias (5-4) Cobb (1-4) Rodney (17) 2:46 23,996
6/8 D @TB W 5-0 33-29 3 -5.5 Medina (3-1) Balfour (0-2) -- 3:10 18,158
6/9 D @TB W 3-0 34-29 3 -4.5 Beimel (1-1) Price (4-6) Rodney (18) 3:11 10,400
6/10 N NYY L 2-3 34-30 3 -4.5 Betances (4-0) Iwakuma (4-3) Robertson (15) 2:50 28,405
6/11 N NYY L 2-4 34-31 3 -5.5 TANAKA (10-1) Young (5-4) -- 2:44 28,439
6/12 N NYY L 3-6 34-32 3 -6.0 Whitley (2-0) Elias (5-5) Robertson (16) 2:56 40,595
6/13 N TEX L 0-1 34-33 3 -6.0 Tolleson (2-1) Hernandez (8-2) Soria (14) 2:30 22,073
6/14 N TEX L 3-4 34-34 T3 -7.0 Cotts (2-3) Rodney (1-3) Soria (15) 3:34 27,702
6/15 D TEX W 5-1 35-34 3 -7.0 Iwakuma (5-3) Martinez (1-4) -- 2:46 39,2156/16 N SD W 5-1 36-34 3 -6.0 Young (6-4) Ross (6-6) -- 2:44 17,516
6/17 D SD W 6-1 37-34 3 -6.0 Elias (6-5) Stults (2-9) -- 2:42 19,896
6/18 N @SD L 1-2 37-35 3 -7.0 Benoit (3-0) Furbush (0-4) Street (19) 2:40 27,523
6/19 D @SD L 1-4 37-36 3 -8.0 Hahn (2-1) Leone (2-1) Street (20) 2:42 18,755
6/20 N @KC W 7-5 38-36 3 -8.0 Furbush (1-4) Holland (0-2) Rodney (19) 3:31 38,475
6/21 D @KC W 2-1 39-36 3 -8.0 Medina (4-1) Vargas (7-3) Rodney (20) 2:42 21,640
6/22 D @KC W 2-1 40-36 3 -7.0 Elias (7-5) Ventura (5-6) Rodney (21) 2:54 23,278
6/23 N BOS W 12-3 41-36 3 -6.5 Hernandez (9-2) Lackey (8-5) -- 2:57 26,867
6/24 N BOS W 8-2 42-36 3 -5.5 Beimel (2-1) Peavy (1-6) -- 3:14 20,026
6/25 N BOS L 4-5 42-37 3 -6.5 Buchholz (3-4) Iwakuma (5-4) Uehara (16) 2:40 27,339
6/26 Off Day 3 -6.5
6/27 N CLE W 3-2 43-37 3 -6.5 Young (7-4) Bauer (2-4) Rodney (22) 3:05 28,114
6/28 N CLE L 0-5 43-38 3 -7.5 TOMLIN (5-5) Elias (7-6) -- 2:24 23,021
6/29 D CLE W 3-0 44-38 3 -7.5 Hernandez (10-2) House (0-2) Rodney (23) 2:17 26,174
6/30 N @HOU W 10-4 45-38 3 -6.5 Walker (1-0) McHugh (4-7) Wilhelmsen (1) 3:07 17,340
JUNE TOTALS Record: 18-10 Batting Average: .261 ERA: 2.53 FLD%: .994 Average Time of Game: 2:53

8/12/2019 2014 Mid-Season Report
http://slidepdf.com/reader/full/2014-mid-season-report 38/80
36 - 2014 SEATTLE MARINERS MID-SEASON REPORT
Spring Training Review
RECORD BREAKDOWN
Overall ........................................ 18-12-3
Home .............................................. 7-7-1Road ............................................. 11-5-2vs. LH Starter.................................. 7-2-2vs. RH Starter ............................. 11-10-1
Day .................................................14-11Night ............................................... 4-1-3
1-Run ..................................................4-5 X-Inn ...................................................1-0vs. AL ..................................................7-6vs. NL ........................................... 11-6-3
MOST SPRING WINS (SEA)
The Mariners 18 wins tied for 4th-most in
spring club history:
22..................................................... 201321..................................................... 199420..................................................... 199918..................................................... 2014
18..................................................... 200418..................................................... 1998
2014 SPRING WINS
The Mariners were tied for 3rd in the Ma- jors with 18 spring training wins:
Cleveland ...................................... 20-9-2
LA Angels ................................... 19-11-2Seattle ........................................ 18-12-3
Miami .......................................... 18-12-2
MARINERS SPRING
HITTING LEADERS
The Mariners have had only 27 instances of
a player recording at least 50 at-bats and
hitting .400…Robinson Cano and Brad
Miller joined the .400 club this spring:
Player Year Avg AB HMorse 2008 .492 65 32E. Martinez 1996 .491 55 27Bernhardt 1977 .490 51 25E. Martinez 1997 .485 68 33
Shelton 2009 .460 50 23Ibañez 2006 .443 61 27E. Martinez 2003 .441 68 30Ichiro 2005 .437 71 31Renteria 1988 .435 69 30Bragg 1996 .433 60 26Cameron 2003 .429 56 24Ichiro 2004 .429 56 24Cora 1998 .427 75 32Tuiasosopo 2009 .424 59 25Baez 1978 .424 59 25Zisk 1981 .424 59 25 A. Rodriguez 1997 .423 71 30Paciorek 1981 .419 74 31Bloomquist 2007 .419 62 26Ibañez 2004 .415 65 27Cano 2014 .412 51 21Miller 2014 .410 61 25Smoak 2013 .407 59 24
BY THE NUMBERS
.412Robinson Cano hit .412 (21x51) with hits
in 13 of 18 games.
14Extra-base hits by Brad Miller to lead all
players in spring training play.
26Dustin Ackley led the Cactus League
with 26 hits.
WINNING WAYS…the Mariners finished their 38th spring in the Cactus League with a 18-12-3record…have now recorded four consecutive winning springs (16-13-2 in ‘11, 16-9-1 in ‘12, 22-11 in ‘13)…first four-year streak of winning springs in club history…14th spring overall with a .500or better record (also: 2013, 2012, 2011, 2004, 1999, 1998, 1997, 1994, 1993, 1991, 1989, 1988,1984)…recorded the 6th-best best spring winning percentage (.591) in club history…finished 3rd inthe Cactus League standings, 2.5 games behind the Cleveland Indians (20-9-2).
CACTUS LEAGUE…the Mariners completed Cactus League play with an 18-12-3 record (.600)the 3rd-best winning percentage in the Cactus League and tied for the 4th-best winning percentageif you include the Grapefruit League…opened Cactus League play winning 14 of first 21 games (2ties), and and went 4-7-1 over final 12 games.
HITTING MACHINE…Robinson Cano recorded a hit in 13 of his 18 games this spring…overalCano hit .412 (21x51) with 5 doubles, 4 runs scored, 13 RBI and 4 walks (.455 OBP, .510 SLG, .964OPS)…Cano opened spring play batting .567 (17x30) in his first 11 games.
CACTUS MVP?…Brad Miller finished spring play batting .410 (25x61), the 4th-best batting averageamong qualifying Cactus League batters…Miller led all players in spring training play with 14 extrabase hits (HR - 4, 2B - 6, 3B - 4), and led the Cactus League in runs scored (17), slugging percentage(.836), total bases (51) and OPS (1.314)…Miller has recorded a hit in 13 of 21 games, including 9multi-hit games (three 3-hit games).
ACK ATTACK …Dustin Ackley recorded a hit in 20 of 24 games this spring, and finished Cactus
League play batting .382 (26x68) with 7 doubles, 1 triple, 2 home runs and 16 RBI…his 26 hits were2nd-most among all players in the Cactus and Grapefruit Leagues, trailing only Toronto’s MelkyCabrera (30)…among Cactus League leaders Ackley ranked 1st in hits (26), 6th in batting average(.382), T4th in doubles (7), T4th in RBI (16), 7th in total bases (41) and 10th in slugging pct (.603).
ROMERO LIKES THE CACTUS LEAGUE…Stefen Romero hit .304 (17x56) with 3 doubles, 2triples, 4 home runs and 13 RBI in 24 Cactus League games…after starting the spring 0-for-16Romero caught fire to go 17-for-40 (.425) to finish out the spring…over the last three spring trainingswith the Mariners, Romero has combined to bat .363 (29x80) with 5 doubles, 2 triples, 6 home runsand 23 RBI…Romero broke camp as a member of the 25-man roster.
SPRING SHUTOUTS…the Mariners blanked the Cubs 3-0 on March 20 at Cubs Park in Mesa… itwas the first spring shutout for the Mariners since a 16-0 blanking of the Reds on March 25, 2013 (inGoodyear)…previous spring shutout was a 6-0 win over the Dodgers on March 25, 2011.
CACTUS LEAGUE NUGGETS…
• Michael Saunders finished T10th in the Cactus League with 13 RBI (6 2-out RBI).• Minor leaguer Tyler Smith hit .571 (8x14) with 9 runs, 1 doules, 1 triple, 1 HR and 6 RBI in 13 games.• Abraham Almonte started 22 of the Mariners 33 games (all in CF).• Stolen Bases - Mariners were T2nd in the Cactus League with 27 stolen bases.• Innings Leaders - Dustin Ackley (131.0), Abraham Almonte (129.0), Michael Saunders (124.0), Kyle
Seager (124.0), Brad Miller (123.0) and Stefen Romero (115.0) were the Mariners leaders for inningsplayed in Cactus League play…Ackley started 23 games to lead the team.
2014 SPRING TRAINING GAME-BY-GAME
DATE OPPONENT W/L SCORE ATT2/27 SD W 7-1 4,8682/28 @SD W 12-1 3,2043/1 LAA W 5-3 (7) 5,9133/2 @CLE L 3-6 4,1993/3 COL (ss) W 8-1 3,527 @CIN W 6-5 2,2523/4 @LAD W 4-1 5,0273/5 CLE L 5-8 4,7043/6 @CWS W 7-4 2,9943/7 CIN (ss) L 9-10 5,7213/8 @SF W 18-3 12,123 @LAD (ss) W 8-5 13,4273/9 TEX W 9-8 10,2913/10 KC L 2-8 4,983 @ARI T 3-3 11,0713/11 @LAA W 10-6 6,2803/12 CHI W 8-7 (10) 8,9333/13 @ARI W 6-3 12,6113/14 @COL (ss) T 2-2 (10) 12,063
DATE OPPONENT W/L SCORE ATT3/15 SF (ss) L 6-13 11,7773/16 @LAA W 5-3 9,6283/17 Off Day3/18 SD T 5-5 8,0333/19 MIL L 7-9 9,1983/20 @CHI W 3-0 15,2433/21 SD L 2-7 12,0843/22 @OAK L 5-6 7,250 @COL (ss) L 3-4 12,5403/23 OAK (ss) W 6-4 9,5123/24 CWS L 6-7 7,5873/25 @KC W 9-6 8,2963/26 @TEX L 3-5 7,2613/27 Off Day3/28 COL W 3-2 9,4663/29 @COL L 1-2 12,617Overall: 18-12-3 Home: 7-7-1 Away: 11-5-2
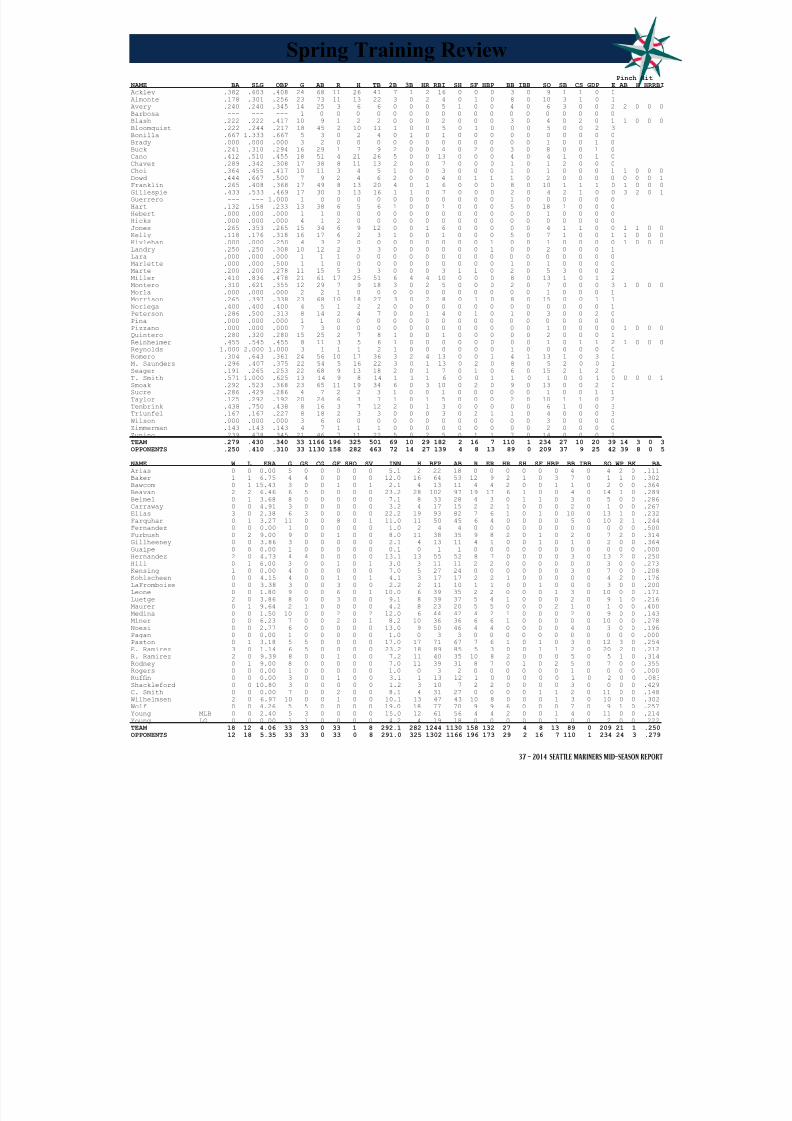
8/12/2019 2014 Mid-Season Report
http://slidepdf.com/reader/full/2014-mid-season-report 39/80
37 - 2014 SEATTLE MARINERS MID-SEASON REPORT
Spring Training Review Pinch Hit
NAME BA SLG OBP G AB R H TB 2B 3B HR RBI SH SF HBP BB IBB SO SB CS GDP E AB H HRRBI
Ackley .382 .603 .408 24 68 11 26 41 7 1 2 16 0 0 0 3 0 9 1 1 0 0
Almonte .178 .301 .256 23 73 11 13 22 3 0 2 4 0 1 0 8 0 10 3 1 0 1
Avery .240 .240 .345 14 25 3 6 6 0 0 0 5 1 0 0 4 0 6 3 0 0 2 2 0 0 0
Barbosa --- --- --- 1 0 0 0 0 0 0 0 0 0 0 0 0 0 0 0 0 0 0
Blash .222 .222 .417 10 9 1 2 2 0 0 0 2 0 0 0 3 0 4 0 2 0 1 1 0 0 0
Bloomquist .222 .244 .217 18 45 2 10 11 1 0 0 5 0 1 0 0 0 5 0 0 2 3
Bonilla .667 1.333 .667 5 3 0 2 4 0 1 0 1 0 0 0 0 0 0 0 0 0 0
Brady .000 .000 .000 3 2 0 0 0 0 0 0 0 0 0 0 0 0 1 0 0 1 0
Buck .241 .310 .294 16 29 1 7 9 2 0 0 4 0 2 0 3 0 8 0 0 1 0Cano .412 .510 .455 18 51 4 21 26 5 0 0 13 0 0 0 4 0 4 1 0 1 0
Chavez .289 .342 .308 17 38 8 11 13 2 0 0 7 0 0 0 1 0 1 2 0 0 0
Choi .364 .455 .417 10 11 3 4 5 1 0 0 3 0 0 0 1 0 1 0 0 0 1 1 0 0 0
Dowd .444 .667 .500 7 9 2 4 6 2 0 0 4 0 1 1 1 0 2 0 0 0 0 0 0 0 1
Franklin .265 .408 .368 17 49 8 13 20 4 0 1 6 0 0 0 8 0 10 1 1 1 0 1 0 0 0
Gillespie .433 .533 .469 17 30 3 13 16 1 1 0 7 0 0 0 2 0 4 2 1 0 0 3 2 0 1
Guerrero --- --- 1.000 1 0 0 0 0 0 0 0 0 0 0 0 1 0 0 0 0 0 0
Hart .132 .158 .233 13 38 6 5 6 1 0 0 1 0 0 0 5 0 18 1 0 0 0
Hebert .000 .000 .000 1 1 0 0 0 0 0 0 0 0 0 0 0 0 1 0 0 0 0
Hicks .000 .000 .000 4 1 2 0 0 0 0 0 0 0 0 0 0 0 0 0 0 0 0
Jones .265 .353 .265 15 34 6 9 12 0 0 1 6 0 0 0 0 0 4 1 1 0 0 1 1 0 0
Kelly .118 .176 .318 16 17 6 2 3 1 0 0 1 0 0 0 5 0 7 1 0 0 1 1 0 0 0
Kivlehan .000 .000 .250 4 3 2 0 0 0 0 0 0 0 0 1 0 0 1 0 0 0 0 1 0 0 0
Landry .250 .250 .308 10 12 2 3 3 0 0 0 0 0 0 1 0 0 2 0 0 0 1
Lara .000 .000 .000 1 1 1 0 0 0 0 0 0 0 0 0 0 0 0 0 0 0 0
Marlette .000 .000 .500 1 1 0 0 0 0 0 0 0 0 0 0 1 0 1 0 0 0 0
Marte .200 .200 .278 11 15 5 3 3 0 0 0 3 1 1 0 2 0 5 3 0 0 2
Miller .410 .836 .478 21 61 17 25 51 6 4 4 10 0 0 0 8 0 13 1 0 1 2
Montero .310 .621 .355 12 29 7 9 18 3 0 2 5 0 0 0 2 0 7 0 0 0 3 1 0 0 0
Morla .000 .000 .000 2 2 1 0 0 0 0 0 0 0 0 0 0 0 1 0 0 0 1
Morrison .265 .397 .338 23 68 10 18 27 3 0 2 8 0 1 0 8 0 15 0 0 1 1Noriega .400 .400 .400 4 5 1 2 2 0 0 0 0 0 0 0 0 0 0 0 0 0 1
Peterson .286 .500 .313 8 14 2 4 7 0 0 1 4 0 1 0 1 0 3 0 0 2 0
Pina .000 .000 .000 1 1 0 0 0 0 0 0 0 0 0 0 0 0 0 0 0 0 0
Pizzano .000 .000 .000 7 3 0 0 0 0 0 0 0 0 0 0 0 0 1 0 0 0 0 1 0 0 0
Quintero .280 .320 .280 15 25 2 7 8 1 0 0 1 0 0 0 0 0 2 0 0 0 1
Reinheimer .455 .545 .455 8 11 3 5 6 1 0 0 0 0 0 0 0 0 1 0 1 1 2 1 0 0 0
Reynolds 1.000 2.000 1.000 3 1 1 1 2 1 0 0 0 0 0 0 1 0 0 0 0 0 0
Romero .304 .643 .361 24 56 10 17 36 3 2 4 13 0 0 1 4 1 13 1 0 3 0
M. Saunders .296 .407 .375 22 54 5 16 22 3 0 1 13 0 2 0 8 0 5 2 0 0 1
Seager .191 .265 .253 22 68 9 13 18 2 0 1 7 0 1 0 6 0 15 2 1 2 0
T. Smith .571 1.000 .625 13 14 9 8 14 1 1 1 6 0 0 1 1 0 1 0 0 1 0 0 0 0 1
Smoak .292 .523 .368 23 65 11 19 34 6 0 3 10 0 2 0 9 0 13 0 0 2 0
Sucre .286 .429 .286 4 7 2 2 3 1 0 0 1 0 0 0 0 0 1 0 0 1 1
Taylor .125 .292 .192 20 24 6 3 7 1 0 1 5 0 0 0 2 0 10 1 1 0 2
Tenbrink .438 .750 .438 8 16 3 7 12 2 0 1 3 0 0 0 0 0 6 1 0 0 3
Triunfel .167 .167 .227 8 18 2 3 3 0 0 0 3 0 2 1 1 0 4 0 0 0 3
Wilson .000 .000 .000 3 6 0 0 0 0 0 0 0 0 0 0 0 0 3 0 0 0 0
Zimmerman .143 .143 .143 4 7 1 1 1 0 0 0 0 0 0 0 0 0 2 0 0 0 0
Zunino .239 .478 .345 21 46 7 11 22 5 0 2 5 0 1 1 7 0 14 0 0 0 2
TEAM .279 .430 .340 33 1166 196 325 501 69 10 29 182 2 16 7 110 1 234 27 10 20 39 14 3 0 3
OPPONENTS .250 .410 .310 33 1130 158 282 463 72 14 27 139 4 8 13 89 0 209 37 9 25 42 39 8 0 5
NAME W L ERA G GS CG GF SHO SV INN H BFP AB R ER HR SH SF HBP BB IBB SO WP BK BA
Arias 0 0 0.00 5 0 0 0 0 0 5.1 2 22 18 0 0 0 0 0 0 4 0 4 2 0 .111
Baker 1 1 6.75 4 4 0 0 0 0 12.0 16 64 53 12 9 2 1 0 3 7 0 1 1 0 .302
Bawcom 0 1 15.43 3 0 0 1 0 1 2.1 4 13 11 4 4 2 0 0 1 1 0 2 0 0 .364
Beavan 2 2 6.46 6 5 0 0 0 0 23.2 28 102 97 19 17 6 1 0 0 4 0 14 1 0 .289
Beimel 0 1 3.68 8 0 0 0 0 0 7.1 8 33 28 4 3 0 1 1 0 3 0 5 0 0 .286
Carraway 0 0 4.91 3 0 0 0 0 0 3.2 4 17 15 2 2 1 0 0 0 2 0 1 0 0 .267
Elias 3 0 2.38 6 3 0 0 0 0 22.2 19 93 82 7 6 1 0 1 0 10 0 13 1 0 .232
Farquhar 0 1 3.27 11 0 0 8 0 1 11.0 11 50 45 6 4 0 0 0 0 5 0 10 2 1 .244
Fernandez 0 0 0.00 1 0 0 0 0 0 1.0 2 4 4 0 0 0 0 0 0 0 0 0 0 0 .500
Furbush 0 2 9.00 9 0 0 1 0 0 8.0 11 38 35 9 8 2 0 1 0 2 0 7 2 0 .314
Gillheeney 0 0 3.86 3 0 0 0 0 0 2.1 4 13 11 4 1 0 0 1 0 1 0 2 0 0 .364
Guaipe 0 0 0.00 1 0 0 0 0 0 0.1 0 1 1 0 0 0 0 0 0 0 0 0 0 0 .000
Hernandez 2 0 4.73 4 4 0 0 0 0 13.1 13 55 52 8 7 0 0 0 0 3 0 13 2 0 .250
Hill 0 1 6.00 3 0 0 1 0 1 3.0 3 11 11 2 2 0 0 0 0 0 0 3 0 0 .273
Kensing 1 0 0.00 4 0 0 0 0 0 7.0 5 27 24 0 0 0 0 0 0 3 0 7 0 0 .208
Kohlscheen 0 0 4.15 4 0 0 1 0 1 4.1 3 17 17 2 2 1 0 0 0 0 0 4 2 0 .176
LaFromboise 0 0 3.38 3 0 0 3 0 0 2.2 2 11 10 1 1 0 0 1 0 0 0 3 0 0 .200
Leone 0 0 1.80 9 0 0 6 0 1 10.0 6 39 35 2 2 0 0 0 1 3 0 10 0 0 .171
Luetge 2 0 3.86 8 0 0 3 0 0 9.1 8 39 37 5 4 1 0 0 0 2 0 9 1 0 .216Maurer 0 1 9.64 2 1 0 0 0 0 4.2 8 23 20 5 5 0 0 0 2 1 0 1 0 0 .400
Medina 0 0 1.50 10 0 0 2 0 2 12.0 6 44 42 4 2 1 0 0 0 2 0 9 0 0 .143
Miner 0 0 6.23 7 0 0 2 0 1 8.2 10 36 36 6 6 1 0 0 0 0 0 10 0 0 .278
Noesi 0 0 2.77 6 0 0 0 0 0 13.0 9 50 46 4 4 0 0 0 0 4 0 3 0 0 .196
Pagan 0 0 0.00 1 0 0 0 0 0 1.0 0 3 3 0 0 0 0 0 0 0 0 0 0 0 .000
Paxton 0 1 3.18 5 5 0 0 0 0 17.0 17 71 67 7 6 1 0 1 0 3 0 12 3 0 .254
E. Ramirez 3 0 1.14 6 5 0 0 0 0 23.2 18 89 85 5 3 0 0 1 1 2 0 20 2 0 .212
R. Ramirez 2 0 9.39 8 0 0 1 0 0 7.2 11 40 35 10 8 2 0 0 0 5 0 5 1 0 .314
Rodney 0 1 9.00 8 0 0 0 0 0 7.0 11 39 31 8 7 0 1 0 2 5 0 7 0 0 .355
Rogers 0 0 0.00 1 0 0 0 0 0 1.0 0 3 2 0 0 0 0 0 0 1 0 0 0 0 .000
Rufn 0 0 0.00 3 0 0 1 0 0 3.1 1 13 12 1 0 0 0 0 0 1 0 2 0 0 .083
Shackleford 0 0 10.80 3 0 0 0 0 0 1.2 3 10 7 2 2 0 0 0 0 3 0 0 0 0 .429
C. Smith 0 0 0.00 7 0 0 2 0 0 8.1 4 31 27 0 0 0 0 1 1 2 0 11 0 0 .148
Wilhelmsen 2 0 6.97 10 0 0 1 0 0 10.1 13 47 43 10 8 0 0 0 1 3 0 10 0 0 .302
Wolf 0 0 4.26 5 5 0 0 0 0 19.0 18 77 70 9 9 6 0 0 0 7 0 9 1 0 .257
Young MLB 0 0 2.40 5 3 0 0 0 0 15.0 12 61 56 4 4 2 0 0 1 4 0 11 0 0 .214
Young LG 0 0 0.00 1 1 0 0 0 0 4.2 4 19 18 0 0 0 0 0 1 0 0 2 0 0 .222
TEAM 18 12 4.06 33 33 0 33 1 8 292.1 282 1244 1130 158 132 27 4 8 13 89 0 209 21 1 .250
OPPONENTS 12 18 5.35 33 33 0 33 0 8 291.0 325 1302 1166 196 173 29 2 16 7 110 1 234 24 3 .279

8/12/2019 2014 Mid-Season Report
http://slidepdf.com/reader/full/2014-mid-season-report 40/80
38 - 2014 SEATTLE MARINERS MID-SEASON REPORT
- PINCH HIT -
Category AVG G AB R H TB 2B 3B HR RBI SH SF HP BB IBB SO SB CS GIDP E SLG OBP AB H HR RBI
------------------------------------------------------------------------------------------------------------------------
Ackley D .225 83 275 32 62 92 14 2 4 29 0 1 1 21 1 53 3 2 5 0 .335 .282 5 2 0 1
Almonte A .198 26 106 10 21 31 5 1 1 8 0 0 1 6 0 40 3 1 1 5 .292 .248 0 0 0 0
Bloomquist W .269 39 119 11 32 40 5 0 1 12 1 1 0 3 1 28 0 1 1 0 .336 .285 7 1 0 1
Buck J .226 27 84 9 19 24 2 0 1 6 0 0 0 8 0 24 0 0 1 1 .286 .293 2 0 0 0
Cano R .334 91 353 49 118 163 22 1 7 57 0 3 3 33 9 45 7 2 10 3 .462 .393 0 0 0 0 Chavez E .260 34 127 14 33 46 6 2 1 8 3 2 0 6 0 12 1 1 1 0 .362 .289 4 0 0 0
Elias R .000 1 2 0 0 0 0 0 0 0 0 0 0 0 0 0 0 0 0 0 .000 .000 0 0 0 0
Franklin N .128 16 47 3 6 8 0 1 0 2 0 1 1 3 0 21 1 0 0 0 .170 .192 2 0 0 0
Gillespie C .254 30 71 9 18 23 2 0 1 5 1 0 0 6 0 13 2 2 3 0 .324 .312 4 1 0 0
Hart C .214 45 168 13 36 57 6 0 5 18 0 1 6 12 1 38 2 0 1 0 .339 .289 0 0 0 0
Hernandez F .000 1 2 0 0 0 0 0 0 0 1 0 0 0 0 0 0 0 0 0 .000 .000 0 0 0 0
Iwakuma H .000 1 1 0 0 0 0 0 0 0 1 0 0 1 0 1 0 0 0 0 .000 .500 0 0 0 0
Jones J .287 65 244 37 70 86 8 4 0 8 3 0 0 11 0 45 17 1 3 1 .352 .318 3 1 0 0
Maurer B .000 1 1 0 0 0 0 0 0 0 1 0 0 0 0 0 0 0 0 0 .000 .000 0 0 0 0
Miller B .204 80 270 32 55 89 8 1 8 24 2 1 2 24 1 70 3 1 0 13 .330 .273 0 0 0 0
Montero J .286 5 14 1 4 7 0 0 1 2 0 0 0 0 0 2 0 0 1 0 .500 .286 1 0 0 0
Morrison L .230 38 135 12 31 51 5 0 5 15 0 1 0 9 1 28 3 0 3 3 .378 .276 1 0 0 0
Ramirez E .000 2 2 0 0 0 0 0 0 0 1 0 0 0 0 1 0 0 0 0 .000 .000 0 0 0 0
Romero S .196 48 148 18 29 48 6 2 3 11 2 1 4 4 0 40 0 3 3 1 .324 .236 6 2 1 3
Saunders M .276 60 196 31 54 85 7 3 6 28 2 4 0 17 0 50 3 4 2 0 .434 .327 3 0 0 0
Seager K .279 92 341 38 95 168 22 3 15 63 1 1 5 33 2 74 4 3 4 7 .493 .350 1 0 0 0
Smoak J .202 61 223 26 45 78 12 0 7 29 0 2 2 21 0 61 0 1 7 2 .350 .274 1 0 0 0
Sucre J .200 2 5 0 1 1 0 0 0 0 1 0 0 0 0 1 0 0 0 0 .200 .200 0 0 0 0
Young C .000 1 1 0 0 0 0 0 0 0 0 0 0 0 0 0 0 0 0 0 .000 .000 0 0 0 0
Zunino M .206 76 267 33 55 110 14 1 13 34 0 4 10 11 1 97 0 2 5 4 .412 .260 0 0 0 0
TOTAL: .245 95 3202 378 784 1207 144 21 79 359 20 23 35 229 17 744 49 24 51 40 .377 .300 40 7 1 5
vs Left .247 1118 128 276 389 54 7 15 118 5 7 17 61 5 269 14 7 20 .348 .294 13 1 0 1
vs Right .244 2084 250 508 818 90 14 64 241 15 16 18 168 12 475 35 17 31 .393 .304 27 6 1 4
Home .235 50 1604 173 377 591 65 4 47 162 5 10 19 105 6 395 20 11 32 21 .368 .288 19 5 0 0
Road .255 45 1598 205 407 616 79 17 32 197 15 13 16 124 11 349 29 13 19 19 .385 .312 21 2 1 5
Day .237 32 1074 119 255 384 50 8 21 114 11 7 8 79 7 236 19 5 19 9 .358 .293 15 1 0 0
Night .249 63 2128 259 529 823 94 13 58 245 9 16 27 150 10 508 30 19 32 31 .387 .304 25 6 1 5
Grass .245 91 3063 363 751 1161 138 19 78 344 19 22 33 223 17 708 47 24 51 40 .379 .301 40 7 1 5
Turf .237 4 139 15 33 46 6 2 1 15 1 1 2 6 0 36 2 0 0 0 .331 .277 0 0 0 0
Runners on .264 95 1296 337 342 541 61 12 38 318 20 23 13 110 17 302 49 24 51 .417 .322 23 4 1 5
None on .232 95 1906 41 442 666 83 9 41 41 0 0 22 119 0 442 0 0 0 .349 .285 17 3 0 0
RISCP .256 95 727 285 186 304 41 7 21 269 8 23 7 73 17 182 10 3 16 .418 .320 18 3 1 5
RISCP 2OUT .246 95 353 118 87 141 19 4 9 108 0 0 2 47 14 89 4 0 0 .399 .338 8 2 0 1
Innings 1-6 .248 95 2186 253 543 814 98 13 49 239 8 18 25 144 7 492 37 19 34 .372 .300 3 1 1 3
Innings 7+ .237 95 1016 125 241 393 46 8 30 120 12 5 10 85 10 252 12 5 17 .387 .301 37 6 0 2
DH .197 88 330 38 65 98 7 1 8 31 1 2 7 27 1 82 8 3 2 .297 .270 7 2 0 0
vs A.L. .245 86 2905 350 713 1101 131 19 73 333 15 21 32 205 13 677 43 22 46 .379 .300 30 6 0 2
vs N.L. .239 9 297 28 71 106 13 2 6 26 5 2 3 24 4 67 6 2 5 .357 .301 10 1 1 3
ARI .000 0 0 0 0 0 0 0 0 0 0 0 0 0 0 0 0 0 0 0 .000 .000 0 0 0 0
ATL .301 2 73 9 22 31 1 1 2 9 3 0 0 5 1 21 0 0 0 1 .425 .346 3 1 1 3
BAL .000 0 0 0 0 0 0 0 0 0 0 0 0 0 0 0 0 0 0 0 .000 .000 0 0 0 0
BOS .308 3 104 24 32 62 5 2 7 23 0 1 0 8 0 18 2 0 2 1 .596 .354 2 0 0 0
CHI .000 0 0 0 0 0 0 0 0 0 0 0 0 0 0 0 0 0 0 0 .000 .000 0 0 0 0
CIN .000 0 0 0 0 0 0 0 0 0 0 0 0 0 0 0 0 0 0 0 .000 .000 0 0 0 0
CLE .228 3 92 6 21 29 2 0 2 6 1 0 0 3 0 24 1 0 2 1 .315 .253 0 0 0 0
CWS .193 3 114 4 22 24 2 0 0 4 1 2 0 7 1 32 3 0 1 1 .211 .236 1 0 0 0
COL .000 0 0 0 0 0 0 0 0 0 0 0 0 0 0 0 0 0 0 0 .000 .000 0 0 0 0
DET .258 3 97 10 25 37 6 0 2 10 0 0 1 3 0 29 4 2 2 0 .381 .287 0 0 0 0
MIA .200 3 95 6 19 28 7 1 0 4 1 2 0 5 1 19 0 1 2 3 .295 .235 4 0 0 0
HOU .257 13 451 72 116 180 23 4 11 69 0 2 3 39 2 111 6 4 8 8 .399 .319 4 0 0 1
KC .242 7 223 23 54 91 10 0 9 22 4 0 3 16 1 38 1 1 6 4 .408 .302 2 1 0 0
LA .000 0 0 0 0 0 0 0 0 0 0 0 0 0 0 0 0 0 0 0 .000 .000 0 0 0 0
LAA .237 9 295 48 70 125 13 3 12 46 0 2 2 37 3 82 6 4 8 5 .424 .324 0 0 0 0 MIL .000 0 0 0 0 0 0 0 0 0 0 0 0 0 0 0 0 0 0 0 .000 .000 0 0 0 0
MIN .264 7 239 18 63 89 8 3 4 17 2 4 0 18 0 39 2 0 3 4 .372 .310 2 0 0 0
NYY .257 6 210 27 54 82 12 2 4 25 2 0 5 8 0 52 2 5 1 3 .390 .300 3 1 0 1
NY .000 0 0 0 0 0 0 0 0 0 0 0 0 0 0 0 0 0 0 0 .000 .000 0 0 0 0
OAK .222 13 441 43 98 147 19 0 10 40 2 3 5 28 5 101 8 0 5 4 .333 .275 7 1 0 0
PHI .000 0 0 0 0 0 0 0 0 0 0 0 0 0 0 0 0 0 0 0 .000 .000 0 0 0 0
PIT .000 0 0 0 0 0 0 0 0 0 0 0 0 0 0 0 0 0 0 0 .000 .000 0 0 0 0
TB .233 7 236 28 55 85 14 2 4 27 1 2 2 12 0 64 2 1 2 1 .360 .274 2 1 0 0
SD .233 4 129 13 30 47 5 0 4 13 1 0 3 14 2 27 6 1 3 0 .364 .322 3 0 0 0
TEX .256 12 403 47 103 150 17 3 8 44 2 5 11 26 1 87 6 5 6 4 .372 .315 7 2 0 0
SF .000 0 0 0 0 0 0 0 0 0 0 0 0 0 0 0 0 0 0 0 .000 .000 0 0 0 0
TOR .000 0 0 0 0 0 0 0 0 0 0 0 0 0 0 0 0 0 0 0 .000 .000 0 0 0 0
STL .000 0 0 0 0 0 0 0 0 0 0 0 0 0 0 0 0 0 0 0 .000 .000 0 0 0 0
WSH .000 0 0 0 0 0 0 0 0 0 0 0 0 0 0 0 0 0 0 0 .000 .000 0 0 0 0
Batting Profle

8/12/2019 2014 Mid-Season Report
http://slidepdf.com/reader/full/2014-mid-season-report 41/80
39 - 2014 SEATTLE MARINERS MID-SEASON REPORT
Opponents
Category W L ERA G GS CG SHO GF SV IP H R ER HR SH SF HB BB IB SO WP BK AVG---SLG---OBP
------------------------------------------------------------------------------------------------------------------------
Beavan B 0 1 4.50 1 1 0 0 0 0 4.0 6 2 2 2 0 0 0 0 0 1 0 0 .375 .750 .375
Beimel J 2 1 1.50 32 0 0 0 5 0 30.0 26 5 5 1 3 0 1 11 4 17 2 0 .243 .336 .319
Elias R 7 8 4.54 19 19 1 1 0 0 113.0 103 62 57 14 4 4 7 40 2 96 4 3 .246 .408 .319
Farquhar D 1 1 2.88 38 0 0 0 10 1 40.2 36 13 13 2 0 1 2 14 1 45 2 1 .234 .305 .304
Furbush C 1 4 4.00 38 0 0 0 8 0 27.0 28 12 12 3 2 1 2 5 0 26 1 0 .269 .385 .313 Hernandez F 11 2 2.12 20 20 0 0 0 0 144.1 105 41 34 5 2 4 3 25 0 154 13 0 .201 .280 .240
Iwakuma H 8 4 2.98 14 14 0 0 0 0 96.2 89 32 32 11 0 1 0 8 1 80 0 0 .245 .366 .261
Leone D 2 1 1.83 34 0 0 0 0 0 39.1 30 10 8 2 1 1 1 15 0 45 3 0 .208 .333 .286
Luetge L 0 0 5.40 4 0 0 0 2 0 3.1 2 2 2 1 0 0 0 3 0 2 1 0 .182 .455 .357
Maurer B 1 4 5.65 13 7 0 0 4 0 43.0 47 29 27 5 1 2 0 16 0 29 1 0 .276 .418 .335
Medina Y 4 1 2.23 37 0 0 0 10 0 32.1 19 9 8 2 0 2 2 15 2 31 3 0 .170 .250 .275
Noesi H 0 1 27.00 2 0 0 0 2 0 1.0 2 3 3 1 0 1 0 0 0 2 1 0 .400 1.400 .333
Paxton J 2 0 2.25 2 2 0 0 0 0 12.0 6 3 3 2 0 0 0 2 0 13 0 0 .146 .341 .186
Pryor S 0 0 0.00 1 0 0 0 0 0 1.2 1 1 0 0 0 1 0 2 0 1 1 0 .200 .200 .375
Ramirez E 1 4 4.58 11 11 0 0 0 0 53.0 55 27 27 10 1 1 1 29 2 42 3 0 .267 .456 .359
Rodney F 1 3 1.98 38 0 0 0 37 27 36.1 29 10 8 1 3 0 2 12 0 42 3 0 .220 .265 .295
Walker T 1 1 3.60 2 2 0 0 0 0 10.0 7 4 4 2 0 0 1 7 1 9 2 0 .200 .400 .349
Wilhelmsen T 1 2 2.54 34 1 0 0 16 1 49.2 31 16 14 3 1 3 2 25 4 43 3 0 .179 .272 .286
Young C 8 6 3.15 19 18 0 0 0 0 111.1 84 40 39 16 1 5 2 38 2 63 3 1 .208 .382 .277
TOTAL: 51 44 3.16 95 95 1 1 94 29 848.2 706 321 298 83 19 27 26 267 19 741 46 5 .226 .353 .290
vs L 346 34 10 7 13 133 8 335 14 5 .233 .348 .300 vs R 360 49 9 20 13 134 11 406 32 5 .220 .358 .281
Home 24 26 3.16 50 50 1 1 49 13 450.0 367 169 158 42 7 16 11 136 5 388 18 2 .222 .341 .284
Road 27 18 3.16 45 45 0 0 45 16 398.2 339 152 140 41 12 11 15 131 14 353 28 3 .230 .368 .298
Day 20 12 2.79 32 32 1 1 31 13 287.0 205 93 89 28 5 7 9 90 7 244 18 2 .199 .327 .268
Night 31 32 3.35 63 63 0 0 63 16 561.2 501 228 209 55 14 20 17 177 12 497 28 3 .239 .366 .301
Grass 48 43 3.21 91 91 1 1 90 27 813.2 682 313 290 81 16 26 25 249 17 705 39 5 .227 .355 .290
Turf 3 1 2.06 4 4 0 0 4 2 35.0 24 8 8 2 3 1 1 18 2 36 7 0 .195 .317 .301
vs AL 47 39 3.14 86 86 1 1 85 27 772.2 642 290 270 76 14 25 24 242 14 672 41 4 .226 .354 .289
vs NL 4 5 3.32 9 9 0 0 9 2 76.0 64 31 28 7 5 2 2 25 5 69 5 1 .232 .348 .298
ARI 0 0 0.00 0 0 0 0 0 0 0.0 0 0 0 0 0 0 0 0 0 0 0 0 .000 .000 .000
ATL 2 0 2.50 2 2 0 0 2 2 18.0 16 5 5 2 0 0 0 3 1 22 2 0 .235 .353 .268
BAL 0 0 0.00 0 0 0 0 0 0 0.0 0 0 0 0 0 0 0 0 0 0 0 0 .000 .000 .000
BOS 2 1 3.33 3 3 0 0 3 0 27.0 26 10 10 3 0 1 1 7 0 26 1 0 .250 .365 .301
CHI 0 0 0.00 0 0 0 0 0 0 0.0 0 0 0 0 0 0 0 0 0 0 0 0 .000 .000 .000
CIN 0 0 0.00 0 0 0 0 0 0 0.0 0 0 0 0 0 0 0 0 0 0 0 0 .000 .000 .000
CLE 2 1 2.33 3 3 0 0 3 2 27.0 15 7 7 1 0 2 1 8 0 24 0 2 .165 .275 .235
CWS 1 2 3.00 3 3 0 0 3 1 30.0 15 10 10 3 0 2 2 10 2 31 4 0 .143 .276 .227
COL 0 0 0.00 0 0 0 0 0 0 0.0 0 0 0 0 0 0 0 0 0 0 0 0 .000 .000 .000
DET 2 1 2.67 3 3 1 1 2 1 27.0 18 8 8 4 0 0 1 7 1 27 1 0 .188 .344 .250
MIA 0 3 5.63 3 3 0 0 3 0 24.0 27 18 15 3 2 2 1 16 4 18 2 2 .297 .451 .400
HOU 8 5 3.89 13 13 0 0 13 5 118.0 109 58 51 19 2 2 4 42 0 108 2 2 .241 .416 .310
KC 5 2 2.71 7 7 0 0 7 5 63.0 60 23 19 5 2 4 1 12 1 45 1 2 .258 .343 .292
LA 0 0 0.00 0 0 0 0 0 0 0.0 0 0 0 0 0 0 0 0 0 0 0 0 .000 .000 .000
LAA 6 3 2.89 9 9 0 0 9 2 81.0 61 28 26 8 0 3 4 21 0 75 5 0 .208 .355 .268
MIL 0 0 0.00 0 0 0 0 0 0 0.0 0 0 0 0 0 0 0 0 0 0 0 0 .000 .000 .000
MIN 2 5 3.25 7 7 0 0 7 1 61.0 56 25 22 4 0 4 1 16 3 46 4 2 .246 .364 .293
NYY 3 3 3.17 6 6 0 0 6 1 54.0 52 20 19 4 1 0 2 14 0 53 0 0 .252 .345 .306
NY 0 0 0.00 0 0 0 0 0 0 0.0 0 0 0 0 0 0 0 0 0 0 0 0 .000 .000 .000
OAK 7 6 2.90 13 13 0 0 13 5 118.0 89 39 38 14 0 3 3 44 1 93 8 0 .207 .347 .283
PHI 0 0 0.00 0 0 0 0 0 0 0.0 0 0 0 0 0 0 0 0 0 0 0 0 .000 .000 .000
PIT 0 0 0.00 0 0 0 0 0 0 0.0 0 0 0 0 0 0 0 0 0 0 0 0 .000 .000 .000
TB 4 3 2.47 7 7 0 0 7 2 62.0 45 17 17 3 3 1 1 26 3 66 8 0 .201 .299 .286
SD 2 2 2.12 4 4 0 0 4 0 34.0 21 8 8 2 3 0 1 6 0 29 1 0 .179 .265 .226
TEX 5 7 3.70 12 12 0 0 12 2 104.2 96 45 43 8 6 3 3 35 3 78 7 0 .250 .365 .315
SF 0 0 0.00 0 0 0 0 0 0 0.0 0 0 0 0 0 0 0 0 0 0 0 0 .000 .000 .000
TOR 0 0 0.00 0 0 0 0 0 0 0.0 0 0 0 0 0 0 0 0 0 0 0 0 .000 .000 .000
STL 0 0 0.00 0 0 0 0 0 0 0.0 0 0 0 0 0 0 0 0 0 0 0 0 .000 .000 .000
WSH 0 0 0.00 0 0 0 0 0 0 0.0 0 0 0 0 0 0 0 0 0 0 0 0 .000 .000 .000
Pitching Profle

8/12/2019 2014 Mid-Season Report
http://slidepdf.com/reader/full/2014-mid-season-report 42/80
40 - 2014 SEATTLE MARINERS MID-SEASON REPORT
GI
BATTER AVG G AB R H 2B 3B HR RBI SH SF HP BB SO SB CS DP SLG OBP
Ackley,D .274 40 73 9 20 6 2 0 11 0 0 0 1 16 1 0 2 .411 .284
Almonte,A .257 17 35 4 9 4 0 0 3 0 0 1 2 8 2 0 1 .371 .316
Bloomquist,W .254 30 63 7 16 1 0 1 7 0 1 0 2 12 0 0 0 .317 .273
Buck,J .243 18 37 5 9 0 0 1 3 0 0 0 3 9 0 0 0 .324 .300
Cano,R .309 64 136 17 42 8 0 2 22 0 2 0 11 17 1 0 5 .412 .356 Chavez,E .000 14 17 3 0 0 0 0 0 1 0 0 1 0 0 0 0 .000 .056
Franklin,N .000 5 8 1 0 0 0 0 0 0 0 1 1 5 0 0 0 .000 .200
Gillespie,C .280 24 50 5 14 2 0 0 4 0 0 0 6 6 1 2 3 .320 .357
SEAS TOTAL .275 25 51 5 14 2 0 0 4 0 0 0 6 6 1 2 3 .314 .351
Hart,C .190 25 58 4 11 1 0 1 10 0 1 6 4 14 0 0 0 .259 .304
Jones,J .286 30 70 12 20 3 1 0 1 1 0 0 2 16 6 1 1 .357 .306
Miller,B .145 41 76 8 11 1 0 2 4 0 0 2 4 31 2 0 0 .237 .207
Montero,J .375 3 8 1 3 0 0 1 2 0 0 0 0 0 0 0 0 .750 .375
Morrison,L .267 16 30 3 8 1 0 1 4 0 0 0 1 7 0 0 2 .400 .290
Romero,S .198 36 96 11 19 3 2 1 5 0 1 2 2 26 0 1 2 .302 .228
Saunders,M .278 35 54 7 15 1 1 0 7 2 1 0 7 16 0 0 0 .333 .355
Seager,K .268 61 123 12 33 9 1 0 13 0 1 3 5 30 1 2 0 .358 .311
Smoak,J .224 45 98 8 22 7 0 2 13 0 0 1 4 27 0 1 3 .357 .262
Zunino,M .282 39 85 11 24 7 0 3 9 0 0 1 4 28 0 0 1 .471 .322
PITCHERS .000 1 0 0 0 0 0 0 1 0 0 1 1 0 0 0 .000 .500
TOTALS .247 1118 128 276 54 7 15 118 5 7 17 61 269 14 7 20 .348 .294
PITCHER AVG AB H HR HB BB SO
Beavan,B .429 7 3 1 0 0 1
Beimel,J .146 48 7 0 1 1 11
Elias,R .220 82 18 3 0 10 20
Farquhar,D .254 71 18 0 2 9 19
Furbush,C .286 49 14 0 1 0 13
Hernandez,F .210 305 64 2 2 16 82
Iwakuma,H .298 188 56 6 0 2 33
Leone,D .226 62 14 1 1 5 16
Luetge,L .000 5 0 0 0 2 2
Maurer,B .247 77 19 3 0 7 20
Medina,Y .167 42 7 0 2 10 12
Noesi,H .333 3 1 1 0 0 2
Paxton,J .133 15 2 0 0 0 7
Pryor,S .000 2 0 0 0 1 1
Ramirez,E .261 119 31 5 0 21 22
Rodney,F .282 78 22 1 1 5 22 Walker,T .250 16 4 1 0 6 2
Wilhelmsen,T .163 86 14 1 1 14 14
Young,C .225 231 52 9 2 24 36
TOTALS .233 1486 346 34 13 133 335
vs. Left (Batting / Pitching)
SEATTLE MARINERS LOGOS
AND COLORS THROUGH THE YEARS
1977-1980
Mariner bluetrident forming a
capital “M”
1981-1986
Stylized Marinerblue trident, “M”shape borderedin gold on a star
backgroundbordered in
blue.
1993-
“NauticalCompass Rose”in metallic silver
& Northwestgreen with
baseball middle,surrounded byreversed type
“Seattle Mariners”out of navy blue,
bordered byNorthwest green& metallic silver
rings.
1987-1992
“M’s” borderedin gold ona baseball
background.
COLORS1977-1992 Mariner blue, gold and white1993- Navy blue, metallic silver and Northwest green

8/12/2019 2014 Mid-Season Report
http://slidepdf.com/reader/full/2014-mid-season-report 43/80
41 - 2014 SEATTLE MARINERS MID-SEASON REPORT
GI
BATTER AVG G AB R H 2B 3B HR RBI SH SF HP BB SO SB CS DP SLG OBP
Ackley,D .208 77 202 23 42 8 0 4 18 0 1 1 20 37 2 2 3 .307 .281
Almonte,A .169 24 71 6 12 1 1 1 5 0 0 0 4 32 1 1 0 .254 .213
Bloomquist,W .286 30 56 4 16 4 0 0 5 1 0 0 1 16 0 1 1 .357 .298
Buck,J .213 22 47 4 10 2 0 0 3 0 0 0 5 15 0 0 1 .255 .288
Cano,R .350 75 217 32 76 14 1 5 35 0 1 3 22 28 6 2 5 .493 .416 Chavez,E .300 36 110 11 33 6 2 1 8 2 2 0 5 12 1 1 1 .418 .325
Franklin,N .154 15 39 2 6 0 1 0 2 0 1 0 2 16 1 0 0 .205 .190
Gillespie,C .190 17 21 4 4 0 0 1 1 1 0 0 0 7 1 0 0 .333 .190
SEAS TOTAL .174 18 23 4 4 0 0 1 1 1 0 0 0 7 1 0 0 .304 .174
Hart,C .227 37 110 9 25 5 0 4 8 0 0 0 8 24 2 0 1 .382 .280
Jones,J .287 57 174 25 50 5 3 0 7 2 0 0 9 29 11 0 2 .351 .322
Miller,B .227 75 194 24 44 7 1 6 20 2 1 0 20 39 1 1 0 .366 .298
Montero,J .167 3 6 0 1 0 0 0 0 0 0 0 0 2 0 0 1 .167 .167
Morrison,L .219 35 105 9 23 4 0 4 11 0 1 0 8 21 3 0 1 .371 .272
Romero,S .192 34 52 7 10 3 0 2 6 2 0 2 2 14 0 2 1 .365 .250
Saunders,M .275 58 142 24 39 6 2 6 21 0 3 0 10 34 3 4 2 .472 .316
Seager,K .284 79 218 26 62 13 2 15 50 1 0 2 28 44 3 1 4 .569 .371
Smoak,J .184 56 125 18 23 5 0 5 16 0 2 1 17 34 0 0 4 .344 .283
Sucre,J .200 2 5 0 1 0 0 0 0 1 0 0 0 1 0 0 0 .200 .200
Zunino,M .170 69 182 22 31 7 1 10 25 0 4 9 7 69 0 2 4 .385 .233
PITCHERS .000 8 0 0 0 0 0 0 3 0 0 0 1 0 0 0 .000 .000
TOTALS .244 2084 250 508 90 14 64 241 15 16 18 168 475 35 17 31 .393 .304
PITCHER AVG AB H HR HB BB SO
Beavan,B .333 9 3 1 0 0 0
Beimel,J .322 59 19 1 0 10 6
Elias,R .252 337 85 11 7 30 76
Farquhar,D .217 83 18 2 0 5 26
Furbush,C .255 55 14 3 1 5 13
Hernandez,F .189 217 41 3 1 9 72
Iwakuma,H .189 175 33 5 0 6 47
Leone,D .195 82 16 1 0 10 29
Luetge,L .333 6 2 1 0 1 0
Maurer,B .301 93 28 2 0 9 9
Medina,Y .171 70 12 2 0 5 19
Noesi,H .500 2 1 0 0 0 0
Paxton,J .154 26 4 2 0 2 6
Pryor,S .333 3 1 0 0 1 0
Ramirez,E .276 87 24 5 1 8 20 Rodney,F .130 54 7 0 1 7 20
Walker,T .158 19 3 1 1 1 7
Wilhelmsen,T .195 87 17 2 1 11 29
Young,C .186 172 32 7 0 14 27
TOTALS .220 1636 360 49 13 134 406
vs. Right (Batting / Pitching)
ALL-TIME SAFECO FIELD
HOME RUN LEADERSRaul Ibañez 82Bret Boone 62Richie Sexson 55Edgar Martinez 54
Ichiro Suzuki 53 Adrian Beltre 53John Olerud 42
Alex Rodriguez 40Jose Lopez 38Mike Cameron 30Ken Griffey Jr. 29Justin Smoak 27Kyle Seager 26

8/12/2019 2014 Mid-Season Report
http://slidepdf.com/reader/full/2014-mid-season-report 44/80
42 - 2014 SEATTLE MARINERS MID-SEASON REPORT
TOT SP
PLAYER OUTS AVG AB H 2B 3B HR RBI RBI MISP MOB BB IBB SO SH SF GIDP
MARINERS <2 .265 374 99 22 3 12 161 140 503 710 26 3 93 8 23 16
MARINERS =2 .246 353 87 19 4 9 108 87 458 642 47 14 89 0 0 0
MARINERS .256 727 186 41 7 21 269 227 961 1352 73 17 182 8 23 16
Ackley,D <2 .212 33 7 2 1 1 16 12 47 61 5 0 6 0 1 3
Ackley,D =2 .200 35 7 1 1 0 8 7 43 61 3 1 7 0 0 0
Ackley,D .206 68 14 3 2 1 24 19 90 122 8 1 13 0 1 3
Almonte,A <2 .375 16 6 3 0 0 5 5 17 26 0 0 4 0 0 1
Almonte,A =2 .222 9 2 0 0 0 2 2 9 14 0 0 2 0 0 0
Almonte,A .320 25 8 3 0 0 7 7 26 40 0 0 6 0 0 1
Bloomquist,W <2 .278 18 5 2 0 1 8 7 21 30 0 0 5 1 1 1
Bloomquist,W =2 .636 11 7 2 0 0 4 4 13 17 2 1 1 0 0 0
Bloomquist,W .414 29 12 4 0 1 12 11 34 47 2 1 6 1 1 1
Buck,J <2 .300 10 3 0 0 0 3 3 11 15 0 0 3 0 0 1
Buck,J =2 .200 5 1 0 0 0 1 1 9 14 4 0 1 0 0 0
Buck,J .267 15 4 0 0 0 4 4 20 29 4 0 4 0 0 1
Cano,R <2 .367 49 18 4 1 4 35 29 64 91 5 2 6 0 3 1
Cano,R =2 .370 27 10 4 0 1 14 10 42 57 8 7 3 0 0 0
Cano,R .368 76 28 8 1 5 49 39 106 148 13 9 9 0 3 1
Chavez,E <2 .167 12 2 0 0 0 2 2 16 26 0 0 2 2 2 0
Chavez,E =2 .118 17 2 0 1 0 4 3 22 30 1 0 3 0 0 0
Chavez,E .138 29 4 0 1 0 6 5 38 56 1 0 5 2 2 0
Franklin,N <2 .000 6 0 0 0 0 1 1 10 13 1 0 4 0 1 0
Franklin,N =2 .250 4 1 0 0 0 1 1 5 7 0 0 1 0 0 0
Franklin,N .100 10 1 0 0 0 2 2 15 20 1 0 5 0 1 0
Gillespie,C <2 .222 9 2 0 0 0 2 2 13 20 1 0 0 0 0 1
Gillespie,C =2 .444 9 4 0 0 0 2 2 11 17 1 0 1 0 0 0
Gillespie,C .333 18 6 0 0 0 4 4 24 37 2 0 1 0 0 1
Hart,C <2 .217 23 5 0 0 0 6 6 31 43 3 0 5 0 1 0
Hart,C =2 .313 16 5 1 0 1 8 6 21 31 2 1 4 0 0 0
Hart,C .256 39 10 1 0 1 14 12 52 74 5 1 9 0 1 0
Hernandez,F <2 .000 0 0 0 0 0 0 0 1 2 0 0 0 1 0 0
Hernandez,F =2 .000 2 0 0 0 0 0 0 2 4 0 0 0 0 0 0
Hernandez,F .000 2 0 0 0 0 0 0 3 6 0 0 0 1 0 0
Iwakuma,H <2 .000 1 0 0 0 0 0 0 1 1 0 0 1 0 0 0
Iwakuma,H =2 .000 0 0 0 0 0 0 0 0 0 0 0 0 0 0 0
Iwakuma,H .000 1 0 0 0 0 0 0 1 1 0 0 1 0 0 0
Jones,J <2 .111 18 2 0 0 0 0 0 25 36 1 0 8 2 0 0 Jones,J =2 .250 24 6 0 1 0 6 5 29 38 1 0 7 0 0 0
Jones,J .190 42 8 0 1 0 6 5 54 74 2 0 15 2 0 0
Miller,B <2 .294 34 10 2 0 0 11 11 45 56 2 0 8 0 1 0
Miller,B =2 .185 27 5 0 0 1 6 5 35 51 4 1 7 0 0 0
Miller,B .246 61 15 2 0 1 17 16 80 107 6 1 15 0 1 0
Montero,J <2 .000 1 0 0 0 0 0 0 1 2 0 0 0 0 0 1
Montero,J =2 .000 2 0 0 0 0 0 0 3 3 0 0 1 0 0 0
Montero,J .000 3 0 0 0 0 0 0 4 5 0 0 1 0 0 1
Morrison,L <2 .308 13 4 2 0 0 6 6 17 23 0 0 2 0 1 1
Morrison,L =2 .158 19 3 1 0 1 4 3 23 33 1 1 6 0 0 0
Morrison,L .219 32 7 3 0 1 10 9 40 56 1 1 8 0 1 1
Romero,S <2 .333 18 6 2 0 1 9 7 25 37 0 0 5 1 1 2
Romero,S =2 .067 15 1 0 0 0 0 0 17 26 0 0 4 0 0 0
Romero,S .212 33 7 2 0 1 9 7 42 63 0 0 9 1 1 2
Saunders,M <2 .350 20 7 2 1 1 14 13 32 43 0 0 7 1 4 0
Saunders,M =2 .250 24 6 2 1 0 7 7 30 40 2 0 6 0 0 0 Saunders,M .295 44 13 4 2 1 21 20 62 83 2 0 13 1 4 0
Seager,K <2 .394 33 13 2 0 3 25 19 46 68 4 1 4 0 1 2
Seager,K =2 .245 53 13 5 0 2 20 14 71 102 9 1 16 0 0 0
Seager,K .302 86 26 7 0 5 45 33 117 170 13 2 20 0 1 2
Smoak,J <2 .097 31 3 1 0 0 6 6 38 56 1 0 13 0 2 2
Smoak,J =2 .320 25 8 2 0 2 14 11 34 45 5 0 5 0 0 0
Smoak,J .196 56 11 3 0 2 20 17 72 101 6 0 18 0 2 2
Sucre,J <2 .000 1 0 0 0 0 0 0 1 2 0 0 1 0 0 0
Sucre,J =2 .000 0 0 0 0 0 0 0 0 0 0 0 0 0 0 0
Sucre,J .000 1 0 0 0 0 0 0 1 2 0 0 1 0 0 0
Zunino,M <2 .214 28 6 0 0 1 12 11 41 59 3 0 9 0 4 0
Zunino,M =2 .207 29 6 1 0 1 7 6 39 52 4 1 14 0 0 0
Zunino,M .211 57 12 1 0 2 19 17 80 111 7 1 23 0 4 0
Runners in Scoring Position

8/12/2019 2014 Mid-Season Report
http://slidepdf.com/reader/full/2014-mid-season-report 45/80
43 - 2014 SEATTLE MARINERS MID-SEASON REPORT
TOT SP
PLAYER OUTS AVG AB H 2B 3B HR RBI RBI MISP MOB BB IBB SO SH SF GIDP
MARINERS <2 .333 27 9 5 0 0 29 28 66 99 2 0 4 0 4 2
MARINERS =2 .214 28 6 2 2 0 14 11 56 84 0 0 9 0 0 0
MARINERS .273 55 15 7 2 0 43 39 122 183 2 0 13 0 4 2
Ackley,D <2 .333 3 1 1 0 0 5 4 8 12 1 0 0 0 0 0
Ackley,D =2 .500 2 1 0 1 0 3 2 4 6 0 0 0 0 0 0
Ackley,D .400 5 2 1 1 0 8 6 12 18 1 0 0 0 0 0
Buck,J <2 .000 1 0 0 0 0 0 0 2 3 0 0 0 0 0 1
Buck,J =2 .000 0 0 0 0 0 0 0 0 0 0 0 0 0 0 0
Buck,J .000 1 0 0 0 0 0 0 2 3 0 0 0 0 0 1
Cano,R <2 .667 3 2 1 0 0 5 5 8 12 0 0 0 0 1 0
Cano,R =2 .000 3 0 0 0 0 0 0 6 9 0 0 0 0 0 0
Cano,R .333 6 2 1 0 0 5 5 14 21 0 0 0 0 1 0
Chavez,E <2 .000 0 0 0 0 0 0 0 0 0 0 0 0 0 0 0
Chavez,E =2 .500 2 1 0 1 0 3 2 4 6 0 0 1 0 0 0
Chavez,E .500 2 1 0 1 0 3 2 4 6 0 0 1 0 0 0
Franklin,N <2 .000 0 0 0 0 0 0 0 0 0 0 0 0 0 0 0
Franklin,N =2 .000 1 0 0 0 0 0 0 2 3 0 0 0 0 0 0
Franklin,N .000 1 0 0 0 0 0 0 2 3 0 0 0 0 0 0
Gillespie,C <2 .000 2 0 0 0 0 0 0 4 6 0 0 0 0 0 1 Gillespie,C =2 .000 1 0 0 0 0 0 0 2 3 0 0 0 0 0 0
Gillespie,C .000 3 0 0 0 0 0 0 6 9 0 0 0 0 0 1
Hart,C <2 .000 1 0 0 0 0 1 1 2 3 0 0 0 0 0 0
Hart,C =2 .000 2 0 0 0 0 0 0 4 6 0 0 1 0 0 0
Hart,C .000 3 0 0 0 0 1 1 6 9 0 0 1 0 0 0
Jones,J <2 .000 1 0 0 0 0 0 0 2 3 0 0 0 0 0 0
Jones,J =2 .000 2 0 0 0 0 0 0 4 6 0 0 0 0 0 0
Jones,J .000 3 0 0 0 0 0 0 6 9 0 0 0 0 0 0
Miller,B <2 .500 2 1 0 0 0 2 2 4 6 0 0 0 0 0 0
Miller,B =2 .000 2 0 0 0 0 0 0 4 6 0 0 1 0 0 0
Miller,B .250 4 1 0 0 0 2 2 8 12 0 0 1 0 0 0
Morrison,L <2 1.000 1 1 0 0 0 1 1 2 3 0 0 0 0 0 0
Morrison,L =2 .333 3 1 0 0 0 1 1 6 9 0 0 2 0 0 0
Morrison,L .500 4 2 0 0 0 2 2 8 12 0 0 2 0 0 0
Romero,S <2 .000 2 0 0 0 0 0 0 4 6 0 0 1 0 0 0
Romero,S =2 .000 1 0 0 0 0 0 0 2 3 0 0 1 0 0 0
Romero,S .000 3 0 0 0 0 0 0 6 9 0 0 2 0 0 0
Saunders,M <2 .333 3 1 1 0 0 4 4 8 12 0 0 1 0 1 0
Saunders,M =2 1.000 1 1 0 0 0 2 2 2 3 0 0 0 0 0 0
Saunders,M .500 4 2 1 0 0 6 6 10 15 0 0 1 0 1 0
Seager,K <2 .500 4 2 1 0 0 6 6 10 15 0 0 0 0 1 0
Seager,K =2 .167 6 1 1 0 0 2 2 12 18 0 0 3 0 0 0
Seager,K .300 10 3 2 0 0 8 8 22 33 0 0 3 0 1 0
Smoak,J <2 .500 2 1 1 0 0 2 2 4 6 0 0 1 0 0 0
Smoak,J =2 1.000 1 1 1 0 0 3 2 2 3 0 0 0 0 0 0
Smoak,J .667 3 2 2 0 0 5 4 6 9 0 0 1 0 0 0
Zunino,M <2 .000 2 0 0 0 0 3 3 8 12 1 0 1 0 1 0
Zunino,M =2 .000 1 0 0 0 0 0 0 2 3 0 0 0 0 0 0
Zunino,M .000 3 0 0 0 0 3 3 10 15 1 0 1 0 1 0
Bases Loaded
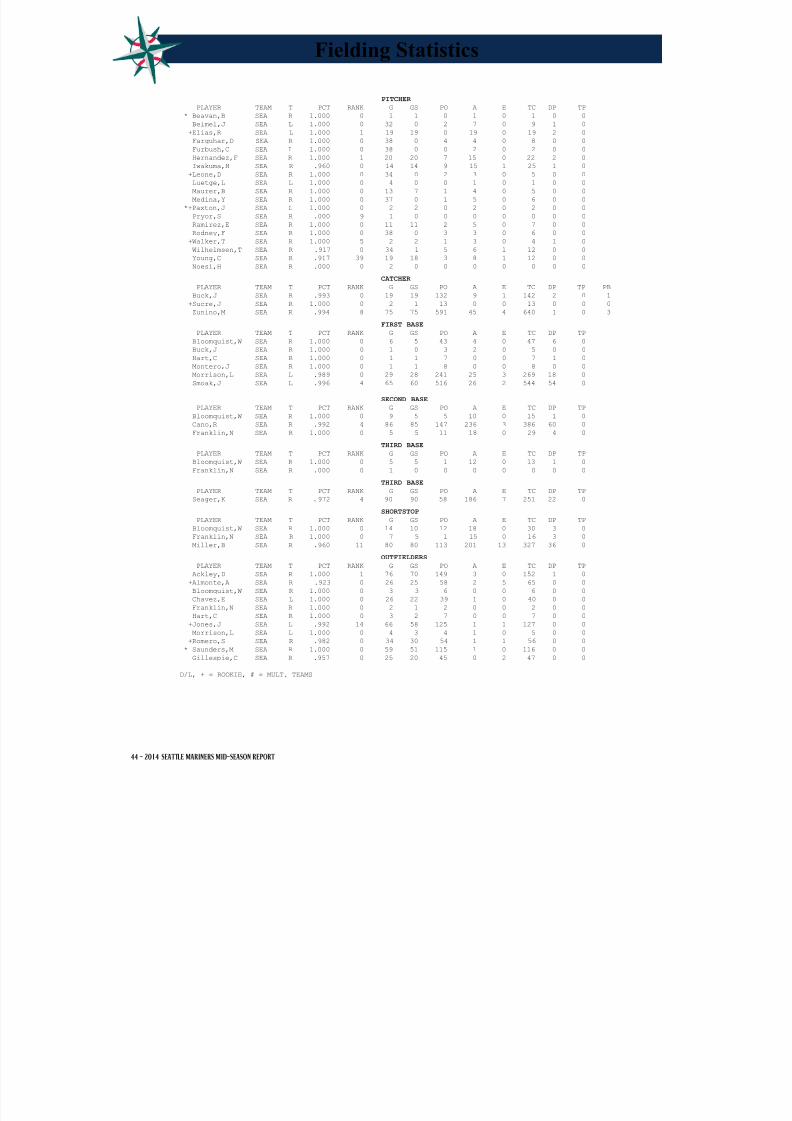
8/12/2019 2014 Mid-Season Report
http://slidepdf.com/reader/full/2014-mid-season-report 46/80
44 - 2014 SEATTLE MARINERS MID-SEASON REPORT
PITCHER
PLAYER TEAM T PCT RANK G GS PO A E TC DP TP
* Beavan,B SEA R 1.000 0 1 1 0 1 0 1 0 0
Beimel,J SEA L 1.000 0 32 0 2 7 0 9 1 0
+Elias,R SEA L 1.000 1 19 19 0 19 0 19 2 0
Farquhar,D SEA R 1.000 0 38 0 4 4 0 8 0 0
Furbush,C SEA L 1.000 0 38 0 0 2 0 2 0 0 Hernandez,F SEA R 1.000 1 20 20 7 15 0 22 2 0
Iwakuma,H SEA R .960 0 14 14 9 15 1 25 1 0
+Leone,D SEA R 1.000 0 34 0 2 3 0 5 0 0
Luetge,L SEA L 1.000 0 4 0 0 1 0 1 0 0
Maurer,B SEA R 1.000 0 13 7 1 4 0 5 0 0
Medina,Y SEA R 1.000 0 37 0 1 5 0 6 0 0
*+Paxton,J SEA L 1.000 0 2 2 0 2 0 2 0 0
Pryor,S SEA R .000 9 1 0 0 0 0 0 0 0
Ramirez,E SEA R 1.000 0 11 11 2 5 0 7 0 0
Rodney,F SEA R 1.000 0 38 0 3 3 0 6 0 0
+Walker,T SEA R 1.000 5 2 2 1 3 0 4 1 0
Wilhelmsen,T SEA R .917 0 34 1 5 6 1 12 0 0
Young,C SEA R .917 39 19 18 3 8 1 12 0 0
Noesi,H SEA R .000 0 2 0 0 0 0 0 0 0
CATCHER
PLAYER TEAM T PCT RANK G GS PO A E TC DP TP PB
Buck,J SEA R .993 0 19 19 132 9 1 142 2 0 1
+Sucre,J SEA R 1.000 0 2 1 13 0 0 13 0 0 0
Zunino,M SEA R .994 8 75 75 591 45 4 640 1 0 3
FIRST BASE
PLAYER TEAM T PCT RANK G GS PO A E TC DP TP
Bloomquist,W SEA R 1.000 0 6 5 43 4 0 47 6 0
Buck,J SEA R 1.000 0 1 0 3 2 0 5 0 0
Hart,C SEA R 1.000 0 1 1 7 0 0 7 1 0
Montero,J SEA R 1.000 0 1 1 8 0 0 8 0 0
Morrison,L SEA L .989 0 29 28 241 25 3 269 18 0
Smoak,J SEA L .996 4 65 60 516 26 2 544 54 0
SECOND BASE
PLAYER TEAM T PCT RANK G GS PO A E TC DP TP
Bloomquist,W SEA R 1.000 0 9 5 5 10 0 15 1 0
Cano,R SEA R .992 4 86 85 147 236 3 386 60 0
Franklin,N SEA R 1.000 0 5 5 11 18 0 29 4 0
THIRD BASE
PLAYER TEAM T PCT RANK G GS PO A E TC DP TP
Bloomquist,W SEA R 1.000 0 5 5 1 12 0 13 1 0
Franklin,N SEA R .000 0 1 0 0 0 0 0 0 0
THIRD BASE
PLAYER TEAM T PCT RANK G GS PO A E TC DP TP
Seager,K SEA R .972 4 90 90 58 186 7 251 22 0
SHORTSTOP
PLAYER TEAM T PCT RANK G GS PO A E TC DP TP
Bloomquist,W SEA R 1.000 0 14 10 12 18 0 30 3 0
Franklin,N SEA R 1.000 0 7 5 1 15 0 16 3 0
Miller,B SEA R .960 11 80 80 113 201 13 327 36 0
OUTFIELDERS
PLAYER TEAM T PCT RANK G GS PO A E TC DP TP
Ackley,D SEA R 1.000 1 76 70 149 3 0 152 1 0
+Almonte,A SEA R .923 0 26 25 58 2 5 65 0 0
Bloomquist,W SEA R 1.000 0 3 3 6 0 0 6 0 0
Chavez,E SEA L 1.000 0 26 22 39 1 0 40 0 0 Franklin,N SEA R 1.000 0 2 1 2 0 0 2 0 0
Hart,C SEA R 1.000 0 3 2 7 0 0 7 0 0
+Jones,J SEA L .992 14 66 58 125 1 1 127 0 0
Morrison,L SEA L 1.000 0 4 3 4 1 0 5 0 0
+Romero,S SEA R .982 0 34 30 54 1 1 56 0 0
* Saunders,M SEA R 1.000 0 59 51 115 1 0 116 0 0
Gillespie,C SEA R .957 0 25 20 45 0 2 47 0 0
D/L, + = ROOKIE, # = MULT. TEAMS
Fielding Statistics
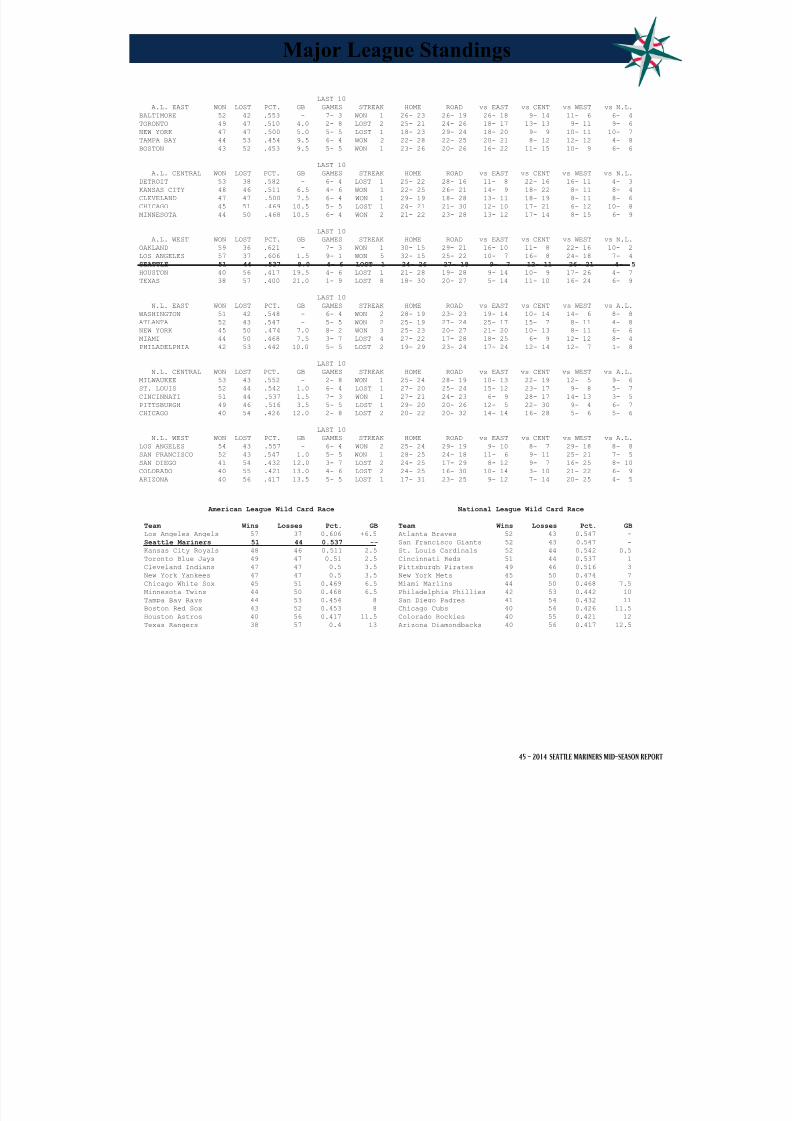
8/12/2019 2014 Mid-Season Report
http://slidepdf.com/reader/full/2014-mid-season-report 47/80
45 - 2014 SEATTLE MARINERS MID-SEASON REPORT
LAST 10
A.L. EAST WON LOST PCT. GB GAMES STREAK HOME ROAD vs EAST vs CENT vs WEST vs N.L.
BALTIMORE 52 42 .553 - 7- 3 WON 1 26- 23 26- 19 26- 18 9- 14 11- 6 6- 4
TORONTO 49 47 .510 4.0 2- 8 LOST 2 25- 21 24- 26 18- 17 13- 13 9- 11 9- 6
NEW YORK 47 47 .500 5.0 5- 5 LOST 1 18- 23 29- 24 18- 20 9- 9 10- 11 10- 7
TAMPA BAY 44 53 .454 9.5 6- 4 WON 2 22- 28 22- 25 20- 21 8- 12 12- 12 4- 8
BOSTON 43 52 .453 9.5 5- 5 WON 1 23- 26 20- 26 16- 22 11- 15 10- 9 6- 6
LAST 10
A.L. CENTRAL WON LOST PCT. GB GAMES STREAK HOME ROAD vs EAST vs CENT vs WEST vs N.L.
DETROIT 53 38 .582 - 6- 4 LOST 1 25- 22 28- 16 11- 8 22- 16 16- 11 4- 3
KANSAS CITY 48 46 .511 6.5 4- 6 WON 1 22- 25 26- 21 14- 9 18- 22 8- 11 8- 4
CLEVELAND 47 47 .500 7.5 6- 4 WON 1 29- 19 18- 28 13- 11 18- 19 8- 11 8- 6
CHICAGO 45 51 .469 10.5 5- 5 LOST 1 24- 21 21- 30 12- 10 17- 21 6- 12 10- 8
MINNESOTA 44 50 .468 10.5 6- 4 WON 2 21- 22 23- 28 13- 12 17- 14 8- 15 6- 9
LAST 10
A.L. WEST WON LOST PCT. GB GAMES STREAK HOME ROAD vs EAST vs CENT vs WEST vs N.L.
OAKLAND 59 36 .621 - 7- 3 WON 1 30- 15 29- 21 16- 10 11- 8 22- 16 10- 2
LOS ANGELES 57 37 .606 1.5 9- 1 WON 5 32- 15 25- 22 10- 7 16- 8 24- 18 7- 4
SEATTLE 51 44 .537 8.0 4- 6 LOST 1 24- 26 27- 18 9- 7 12- 11 26- 21 4- 5
HOUSTON 40 56 .417 19.5 4- 6 LOST 1 21- 28 19- 28 9- 14 10- 9 17- 26 4- 7
TEXAS 38 57 .400 21.0 1- 9 LOST 8 18- 30 20- 27 5- 14 11- 10 16- 24 6- 9
LAST 10
N.L. EAST WON LOST PCT. GB GAMES STREAK HOME ROAD vs EAST vs CENT vs WEST vs A.L.
WASHINGTON 51 42 .548 - 6- 4 WON 2 28- 19 23- 23 19- 14 10- 14 14- 6 8- 8
ATLANTA 52 43 .547 - 5- 5 WON 2 25- 19 27- 24 25- 17 15- 7 8- 11 4- 8
NEW YORK 45 50 .474 7.0 8- 2 WON 3 25- 23 20- 27 21- 20 10- 13 8- 11 6- 6
MIAMI 44 50 .468 7.5 3- 7 LOST 4 27- 22 17- 28 18- 25 6- 9 12- 12 8- 4
PHILADELPHIA 42 53 .442 10.0 5- 5 LOST 2 19- 29 23- 24 17- 24 12- 14 12- 7 1- 8
LAST 10
N.L. CENTRAL WON LOST PCT. GB GAMES STREAK HOME ROAD vs EAST vs CENT vs WEST vs A.L.
MILWAUKEE 53 43 .552 - 2- 8 WON 1 25- 24 28- 19 10- 13 22- 19 12- 5 9- 6
ST. LOUIS 52 44 .542 1.0 6- 4 LOST 1 27- 20 25- 24 15- 12 23- 17 9- 8 5- 7
CINCINNATI 51 44 .537 1.5 7- 3 WON 1 27- 21 24- 23 6- 9 28- 17 14- 13 3- 5
PITTSBURGH 49 46 .516 3.5 5- 5 LOST 1 29- 20 20- 26 12- 5 22- 30 9- 4 6- 7
CHICAGO 40 54 .426 12.0 2- 8 LOST 2 20- 22 20- 32 14- 14 16- 28 5- 6 5- 6
LAST 10
N.L. WEST WON LOST PCT. GB GAMES STREAK HOME ROAD vs EAST vs CENT vs WEST vs A.L.
LOS ANGELES 54 43 .557 - 6- 4 WON 2 25- 24 29- 19 9- 10 8- 7 29- 18 8- 8
SAN FRANCISCO 52 43 .547 1.0 5- 5 WON 1 28- 25 24- 18 11- 6 9- 11 25- 21 7- 5
SAN DIEGO 41 54 .432 12.0 3- 7 LOST 2 24- 25 17- 29 8- 12 9- 7 16- 25 8- 10
COLORADO 40 55 .421 13.0 4- 6 LOST 2 24- 25 16- 30 10- 14 3- 10 21- 22 6- 9
ARIZONA 40 56 .417 13.5 5- 5 LOST 1 17- 31 23- 25 9- 12 7- 14 20- 25 4- 5
American League Wild Card Race
Team Wins Losses Pct. GB
Los Angeles Angels 57 37 0.606 +6.5
Seattle Mariners 51 44 0.537 --
Kansas City Royals 48 46 0.511 2.5
Toronto Blue Jays 49 47 0.51 2.5
Cleveland Indians 47 47 0.5 3.5
New York Yankees 47 47 0.5 3.5
Chicago White Sox 45 51 0.469 6.5
Minnesota Twins 44 50 0.468 6.5
Tampa Bay Rays 44 53 0.454 8Boston Red Sox 43 52 0.453 8
Houston Astros 40 56 0.417 11.5
Texas Rangers 38 57 0.4 13
National League Wild Card Race
Team Wins Losses Pct. GB
Atlanta Braves 52 43 0.547 -
San Francisco Giants 52 43 0.547 -
St. Louis Cardinals 52 44 0.542 0.5
Cincinnati Reds 51 44 0.537 1
Pittsburgh Pirates 49 46 0.516 3
New York Mets 45 50 0.474 7
Miami Marlins 44 50 0.468 7.5
Philadelphia Phillies 42 53 0.442 10
San Diego Padres 41 54 0.432 11Chicago Cubs 40 54 0.426 11.5
Colorado Rockies 40 55 0.421 12
Arizona Diamondbacks 40 56 0.417 12.5
Major League Standings

8/12/2019 2014 Mid-Season Report
http://slidepdf.com/reader/full/2014-mid-season-report 48/80
46 - 2014 SEATTLE MARINERS MID-SEASON REPORT
CLUB HITTING
GI
CLUB AVG G AB R OR H TB 2B 3B HR GS RBI SH SF HP BB IBB SO SB CS DP LOB SHO SLG OBP
DETROIT .280 91 3128 437 387 875 1391 195 15 97 2 426 13 42 21 252 20 622 61 31 77 598 4 .445 .333
LOS ANGELES .269 94 3283 478 389 883 1403 179 19 101 1 454 14 32 33 301 17 720 57 21 70 660 2 .427 .334
BALTIMORE .265 94 3274 405 379 867 1376 151 8 114 4 391 23 27 36 232 22 702 26 9 74 665 7 .420 .318
KANSAS CITY .264 94 3247 383 379 858 1222 171 14 55 2 359 19 31 28 225 10 553 79 19 75 646 6 .376 .315
TEXAS .260 95 3199 391 499 832 1237 163 19 68 0 365 28 31 33 252 23 683 66 37 89 622 5 .387 .318
TORONTO .258 96 3277 431 412 844 1384 162 15 116 2 411 18 16 25 310 12 678 39 14 72 671 7 .422 .325
CLEVELAND .255 94 3241 417 425 828 1286 160 14 90 1 400 24 31 28 309 7 683 54 13 77 675 4 .397 .323
NEW YORK .252 94 3247 375 412 817 1236 142 17 81 1 351 16 27 31 275 10 666 64 19 69 664 3 .381 .314
OAKLAND .251 95 3305 466 321 831 1323 160 19 98 4 440 7 26 32 360 20 668 54 12 70 686 4 .400 .328
TAMPA BAY .251 97 3310 377 403 832 1262 171 14 77 1 363 20 33 37 335 21 678 36 19 81 733 12 .381 .324
CHICAGO .250 96 3298 411 434 826 1328 170 19 98 3 386 10 23 31 271 20 833 55 20 74 633 6 .403 .311
MINNESOTA .248 94 3228 402 418 800 1213 183 10 70 1 376 11 29 30 336 14 782 50 19 57 702 7 .376 .322
BOSTON .246 95 3248 367 405 800 1204 170 15 68 3 347 9 28 44 340 27 769 30 20 91 706 9 .371 .323
SEATTLE .245 95 3202 378 321 784 1207 144 21 79 0 359 20 23 35 229 17 744 49 24 51 605 11 .377 .300
HOUSTON .238 96 3212 368 456 764 1240 137 15 103 3 348 9 22 40 300 10 847 77 19 78 648 11 .386 .309
TOTALS .255 48699 6040 19312 234 28 241 484 250 797 1105 98 .320
710 6086 12441 2458 1315 5776 421 4327 10628 296 9914 .397
CLUB PITCHING
OPP
CLUB W L ERA G CG SHO REL SV IP H R ER HR HB BB IBB SO WP BK AVG
OAKLAND 59 36 3.09 95 3 9 271 22 869.1 750 321 298 80 29 257 17 728 33 1 .231
SEATTLE 51 44 3.16 95 1 7 264 29 848.2 706 321 298 83 26 267 19 741 46 5 .226 KANSAS CITY 48 46 3.76 94 0 7 245 26 842.2 829 379 352 83 39 260 7 683 37 4 .256
BOSTON 43 52 3.83 95 2 5 277 21 863.0 855 405 367 97 18 264 10 775 31 3 .258
BALTIMORE 52 42 3.83 94 2 7 271 28 848.1 827 379 361 97 44 298 20 641 23 2 .257
LOS ANGELES 57 37 3.84 94 2 5 286 26 851.2 750 389 363 82 41 307 20 789 50 3 .236
TAMPA BAY 44 53 3.84 97 2 10 289 21 872.0 809 403 372 92 35 299 15 842 34 2 .243
NEW YORK 47 47 3.95 94 3 7 264 31 847.2 836 412 372 104 43 245 16 799 28 4 .256
CLEVELAND 47 47 3.95 94 2 5 334 25 846.2 837 425 372 88 32 305 29 817 42 2 .258
DETROIT 53 38 3.97 91 3 5 267 24 816.1 812 387 360 77 25 255 11 681 25 6 .259
TORONTO 49 47 4.07 96 2 11 268 26 847.1 837 412 383 82 36 326 11 689 24 2 .257
CHICAGO 45 51 4.17 96 2 3 260 19 855.2 833 434 396 80 40 354 18 678 52 2 .255
MINNESOTA 44 50 4.26 94 2 7 275 24 835.2 888 418 396 76 19 233 10 570 26 4 .273
HOUSTON 40 56 4.42 96 3 2 263 16 849.2 874 456 417 84 39 309 20 691 27 4 .266
TEXAS 38 57 4.93 95 3 14 276 17 834.0 941 499 457 97 33 310 21 682 28 3 .285
TOTALS 717 703 3.93 710 32 104 4110 355 12728.2 12384 6040 5564 1302 499 4289 244 10806 506 47 .255
CLUB FIELDING
CLUB PCT G PO A E TC DP TP PBBALTIMORE .988 94 2545 1004 44 3593 104 0 4
SEATTLE .987 95 2546 920 45 3511 82 0 4
MINNESOTA .987 94 2507 957 45 3509 85 0 5
TAMPA BAY .987 97 2616 803 45 3464 53 0 5
LOS ANGELES .986 94 2555 865 49 3469 77 0 4
TORONTO .986 96 2542 873 50 3465 79 0 11
NEW YORK .985 94 2543 846 51 3440 68 1 9
KANSAS CITY .985 94 2528 879 52 3459 66 0 5
BOSTON .984 95 2589 904 57 3550 89 0 7
OAKLAND .983 95 2608 996 61 3665 88 0 5
DETROIT .983 91 2449 857 57 3363 95 0 4
HOUSTON .983 96 2549 1024 62 3635 89 0 6
CHICAGO .982 96 2567 1015 66 3648 96 0 11
TEXAS .980 95 2502 848 69 3419 91 0 8
CLEVELAND .979 94 2540 946 76 3562 90 1 7
TOTALS .984 710 38186 13737 829 52752 1252 2 95
AL Team Rankings

8/12/2019 2014 Mid-Season Report
http://slidepdf.com/reader/full/2014-mid-season-report 49/80
47 - 2014 SEATTLE MARINERS MID-SEASON REPORT
CLUB MISCELLANEOUS
DOUBLEHEADERS ATTENDANCE
CLUB VS LHS VS RHS GRASS ARTIF DAY NIGHT 1-RUN X-INN vs.N.L. W L S HOME ROAD
BALTIMORE 13-13 39-29 45- 40 7- 2 14-19 38-23 17-13 9- 3 6- 4 1 0 0 1,440,288 1,258,115
BOSTON 16-17 27-35 41- 48 2- 4 12-17 31-35 17-20 6- 8 6- 6 0 0 0 1,777,302 1,460,743
CHICAGO 12-13 33-38 42- 50 3- 1 15-21 30-30 17-16 2- 5 10- 8 0 1 0 908,913 1,406,397
CLEVELAND 13-16 34-31 44- 44 3- 3 19-18 28-29 15-13 6- 4 8- 6 0 0 1 864,896 1,296,762
DETROIT 20-10 33-28 53- 38 0- 0 20-16 33-22 16-10 3- 4 4- 3 0 0 0 1,621,180 1,250,997
HOUSTON 12-19 28-37 38- 51 2- 5 13-18 27-38 11-16 4- 3 4- 7 0 0 0 1,110,436 1,223,705
KANSAS CITY 12-13 36-33 44- 43 4- 3 18-17 30-29 10-18 4- 4 8- 4 0 0 0 1,066,099 1,217,650
LOS ANGELES 20-14 37-23 54- 36 3- 1 14-10 43-27 12-12 5- 4 7- 4 1 0 0 1,786,010 1,238,564
MINNESOTA 15-14 29-36 40- 48 4- 2 22-24 22-26 14-15 4- 4 6- 9 0 0 0 1,193,669 1,437,048
NEW YORK 14-15 33-32 42- 42 5- 5 18-12 29-35 11-12 5- 5 10- 7 0 0 1 1,704,143 1,842,555
OAKLAND 18- 8 41-28 57- 32 2- 4 24-13 35-23 14-12 10- 5 10- 2 0 0 1 1,062,053 1,469,596
SEATTLE 21-12 30-32 48- 43 3- 1 20-12 31-32 11-14 2- 2 4- 5 0 0 1 1,192,907 1,156,871
TAMPA BAY 11-16 33-37 22- 22 22-31 19-17 25-36 15-11 4- 3 4- 8 0 0 0 845,096 1,323,164
TEXAS 9-18 29-39 37- 55 1- 2 14-13 24-44 13-11 1- 2 6- 9 0 0 0 1,681,887 1,314,310
TORONTO 13-15 36-32 21- 22 28-25 14-21 35-26 7-10 1- 3 9- 6 0 0 0 1,249,746 1,413,491
CLUB RANK BATTING
GI
CLUB AVG G AB R OR H TB 2B 3B HR GS RBI SH SF HP BB IBB SO SB CS DP LOB SHO SLG OBP
BALTIMORE 3 9 6 7 3 3 4 12 15 2 1 6 3 9 4 13 3 9 15 1 7 9 9 4 9
BOSTON 13 5 7 15 8 12 15 6 7 13 3 15 13 8 1 2 1 12 14 10 15 14 12 15 6
CHICAGO 11 2 3 6 13 10 5 6 2 5 3 7 12 12 9 10 5 14 7 10 7 4 7 5 13
CLEVELAND 7 9 10 5 12 9 7 10 11 8 9 5 2 4 12 6 15 7 8 3 10 11 3 7 7
DETROIT 1 15 15 3 5 2 2 1 7 7 6 3 10 1 15 11 5 2 5 14 10 1 3 1 2
HOUSTON 15 2 12 14 14 15 9 15 7 3 3 14 13 14 2 8 12 15 2 5 12 6 13 9 14
KANSAS CITY 4 9 8 10 3 4 12 4 11 15 6 11 6 4 12 15 12 1 1 5 9 5 7 13 11
LOS ANGELES 2 9 4 1 6 1 1 3 2 4 9 1 9 3 6 7 8 10 6 12 4 7 1 2 1
MINNESOTA 12 9 11 8 11 12 13 2 14 12 9 8 11 7 11 3 10 13 10 5 2 13 9 14 8
NEW YORK 8 9 8 13 9 11 11 14 6 9 9 13 8 9 9 9 12 3 4 5 3 8 2 11 12
OAKLAND 9 5 2 2 1 8 6 10 2 5 1 2 15 11 8 1 5 4 8 2 4 12 3 6 3
SEATTLE 14 5 13 11 1 14 14 13 1 10 14 11 4 12 5 14 8 11 11 13 1 2 13 12 15
TAMPA BAY 10 1 1 12 7 6 8 4 11 11 9 10 4 2 3 4 4 5 13 5 13 15 15 10 5
TEXAS 5 5 14 9 15 6 10 8 2 13 14 9 1 4 6 11 2 7 3 15 14 3 6 8 10
TORONTO 6 2 5 4 9 5 3 9 7 1 6 4 7 15 14 5 11 5 12 4 6 10 9 3 4
CLUB RANK PITCHING
CLUB W L ERA G CG SHO REL SV IP H TBF R ER HR SH SF HB BB IBB SO WP BK
BALTIMORE 4 12 5 9 6 5 7 3 8 6 8 3 5 12 10 1 15 8 11 14 1 2
BOSTON 13 4 4 5 6 10 4 11 3 12 10 8 7 12 14 6 1 6 2 5 8 7 CHICAGO 10 5 12 2 6 14 14 13 4 8 15 13 12 3 10 9 12 15 9 13 15 2
CLEVELAND 8 7 9 9 6 10 1 7 11 10 9 12 8 10 14 11 6 10 15 2 12 2
DETROIT 3 13 10 15 1 10 10 8 15 5 1 5 4 2 1 4 3 3 4 12 3 15
HOUSTON 14 2 14 2 1 15 13 15 6 13 12 14 14 9 3 13 10 12 11 8 5 10
KANSAS CITY 7 10 3 9 15 5 15 4 12 7 6 3 3 7 6 3 10 5 1 10 11 10
LOS ANGELES 2 14 6 9 6 10 3 4 5 2 3 6 6 5 3 8 13 11 11 4 14 7
MINNESOTA 11 6 13 9 6 5 6 8 13 14 4 11 12 1 6 15 2 1 2 15 4 10
NEW YORK 8 7 8 9 1 5 11 1 9 9 7 9 8 15 13 5 14 2 7 3 6 10
OAKLAND 1 15 1 5 1 4 7 10 2 2 5 1 1 3 9 2 5 4 8 7 9 1
SEATTLE 5 11 2 5 14 5 11 2 7 1 2 1 1 7 10 6 4 7 10 6 13 14
TAMPA BAY 11 3 7 1 6 3 2 11 1 4 14 7 8 11 6 9 8 9 6 1 10 2
TEXAS 15 1 15 5 1 1 5 14 14 15 13 15 15 12 2 14 7 13 14 11 6 7
TORONTO 6 7 11 2 6 2 9 4 10 10 11 9 11 5 5 12 9 14 4 9 2 2
NOTE: “V.LHS/RHS” IS THE CLUB RECORD IN GAMES STARTED BY LEFT OR RIGHT
HANDED PITCHERS, NOT NECESSARILY VERSUS THAT INDIVIDUAL PITCHER.
AL Team Rankings
CAREER HR LEADERS BY POSITIONP - Felix Hernandez, 1 SS - Alex Rodriguez, 189C – Dan Wilson, 88 LF – Raul Ibañez, 1191B - Alvin Davis, 130 CF - Ken Griffey Jr., 3982B – Bret Boone, 143 RF - Jay Buhner, 3053B - Jim Presley, 115 DH - Edgar Martinez, 243
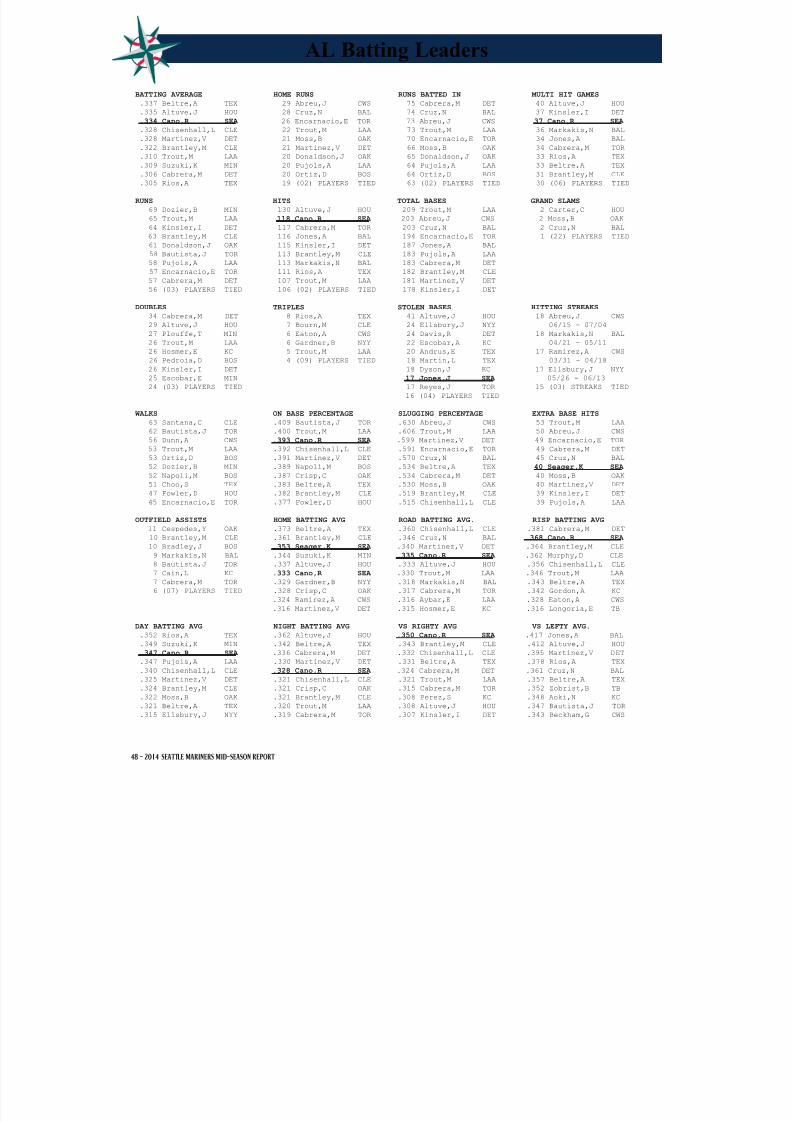
8/12/2019 2014 Mid-Season Report
http://slidepdf.com/reader/full/2014-mid-season-report 50/80
48 - 2014 SEATTLE MARINERS MID-SEASON REPORT
BATTING AVERAGE HOME RUNS RUNS BATTED IN MULTI HIT GAMES
.337 Beltre,A TEX 29 Abreu,J CWS 75 Cabrera,M DET 40 Altuve,J HOU
.335 Altuve,J HOU 28 Cruz,N BAL 74 Cruz,N BAL 37 Kinsler,I DET
.334 Cano,R SEA 26 Encarnacio,E TOR 73 Abreu,J CWS 37 Cano,R SEA
.328 Chisenhall,L CLE 22 Trout,M LAA 73 Trout,M LAA 36 Markakis,N BAL
.328 Martinez,V DET 21 Moss,B OAK 70 Encarnacio,E TOR 34 Jones,A BAL
.322 Brantley,M CLE 21 Martinez,V DET 66 Moss,B OAK 34 Cabrera,M TOR .310 Trout,M LAA 20 Donaldson,J OAK 65 Donaldson,J OAK 33 Rios,A TEX
.309 Suzuki,K MIN 20 Pujols,A LAA 64 Pujols,A LAA 33 Beltre,A TEX
.306 Cabrera,M DET 20 Ortiz,D BOS 64 Ortiz,D BOS 31 Brantley,M CLE
.305 Rios,A TEX 19 (02) PLAYERS TIED 63 (02) PLAYERS TIED 30 (06) PLAYERS TIED
RUNS HITS TOTAL BASES GRAND SLAMS
69 Dozier,B MIN 130 Altuve,J HOU 209 Trout,M LAA 2 Carter,C HOU
65 Trout,M LAA 118 Cano,R SEA 203 Abreu,J CWS 2 Moss,B OAK
64 Kinsler,I DET 117 Cabrera,M TOR 203 Cruz,N BAL 2 Cruz,N BAL
63 Brantley,M CLE 116 Jones,A BAL 194 Encarnacio,E TOR 1 (22) PLAYERS TIED
61 Donaldson,J OAK 115 Kinsler,I DET 187 Jones,A BAL
58 Bautista,J TOR 113 Brantley,M CLE 183 Pujols,A LAA
58 Pujols,A LAA 113 Markakis,N BAL 183 Cabrera,M DET
57 Encarnacio,E TOR 111 Rios,A TEX 182 Brantley,M CLE
57 Cabrera,M DET 107 Trout,M LAA 181 Martinez,V DET
56 (03) PLAYERS TIED 106 (02) PLAYERS TIED 178 Kinsler,I DET
DOUBLES TRIPLES STOLEN BASES HITTING STREAKS
34 Cabrera,M DET 8 Rios,A TEX 41 Altuve,J HOU 18 Abreu,J CWS
29 Altuve,J HOU 7 Bourn,M CLE 24 Ellsbury,J NYY 06/15 - 07/04
27 Plouffe,T MIN 6 Eaton,A CWS 24 Davis,R DET 18 Markakis,N BAL
26 Trout,M LAA 6 Gardner,B NYY 22 Escobar,A KC 04/21 - 05/11
26 Hosmer,E KC 5 Trout,M LAA 20 Andrus,E TEX 17 Ramirez,A CWS
26 Pedroia,D BOS 4 (09) PLAYERS TIED 18 Martin,L TEX 03/31 - 04/18
26 Kinsler,I DET 18 Dyson,J KC 17 Ellsbury,J NYY
25 Escobar,E MIN 17 Jones,J SEA 05/26 - 06/13
24 (03) PLAYERS TIED 17 Reyes,J TOR 15 (03) STREAKS TIED
16 (04) PLAYERS TIED
WALKS ON BASE PERCENTAGE SLUGGING PERCENTAGE EXTRA BASE HITS
63 Santana,C CLE .409 Bautista,J TOR .630 Abreu,J CWS 53 Trout,M LAA
62 Bautista,J TOR .400 Trout,M LAA .606 Trout,M LAA 50 Abreu,J CWS
56 Dunn,A CWS .393 Cano,R SEA .599 Martinez,V DET 49 Encarnacio,E TOR
53 Trout,M LAA .392 Chisenhall,L CLE .591 Encarnacio,E TOR 49 Cabrera,M DET 53 Ortiz,D BOS .391 Martinez,V DET .570 Cruz,N BAL 45 Cruz,N BAL
52 Dozier,B MIN .389 Napoli,M BOS .534 Beltre,A TEX 40 Seager,K SEA
52 Napoli,M BOS .387 Crisp,C OAK .534 Cabrera,M DET 40 Moss,B OAK
51 Choo,S TEX .383 Beltre,A TEX .530 Moss,B OAK 40 Martinez,V DET
47 Fowler,D HOU .382 Brantley,M CLE .519 Brantley,M CLE 39 Kinsler,I DET
45 Encarnacio,E TOR .377 Fowler,D HOU .515 Chisenhall,L CLE 39 Pujols,A LAA
OUTFIELD ASSISTS HOME BATTING AVG ROAD BATTING AVG. RISP BATTING AVG
11 Cespedes,Y OAK .373 Beltre,A TEX .360 Chisenhall,L CLE .381 Cabrera,M DET
10 Brantley,M CLE .361 Brantley,M CLE .346 Cruz,N BAL .368 Cano,R SEA
10 Bradley,J BOS .353 Seager,K SEA .340 Martinez,V DET .364 Brantley,M CLE
9 Markakis,N BAL .344 Suzuki,K MIN .335 Cano,R SEA .362 Murphy,D CLE
8 Bautista,J TOR .337 Altuve,J HOU .333 Altuve,J HOU .356 Chisenhall,L CLE
7 Cain,L KC .333 Cano,R SEA .330 Trout,M LAA .346 Trout,M LAA
7 Cabrera,M TOR .329 Gardner,B NYY .318 Markakis,N BAL .343 Beltre,A TEX
6 (07) PLAYERS TIED .328 Crisp,C OAK .317 Cabrera,M TOR .342 Gordon,A KC
.324 Ramirez,A CWS .316 Aybar,E LAA .328 Eaton,A CWS .316 Martinez,V DET .315 Hosmer,E KC .316 Longoria,E TB
DAY BATTING AVG NIGHT BATTING AVG VS RIGHTY AVG VS LEFTY AVG.
.352 Rios,A TEX .362 Altuve,J HOU .350 Cano,R SEA .417 Jones,A BAL
.349 Suzuki,K MIN .342 Beltre,A TEX .343 Brantley,M CLE .412 Altuve,J HOU
.347 Cano,R SEA .336 Cabrera,M DET .332 Chisenhall,L CLE .395 Martinez,V DET
.347 Pujols,A LAA .330 Martinez,V DET .331 Beltre,A TEX .378 Rios,A TEX
.340 Chisenhall,L CLE .328 Cano,R SEA .324 Cabrera,M DET .361 Cruz,N BAL
.325 Martinez,V DET .321 Chisenhall,L CLE .321 Trout,M LAA .357 Beltre,A TEX
.324 Brantley,M CLE .321 Crisp,C OAK .315 Cabrera,M TOR .352 Zobrist,B TB
.322 Moss,B OAK .321 Brantley,M CLE .308 Perez,S KC .348 Aoki,N KC
.321 Beltre,A TEX .320 Trout,M LAA .308 Altuve,J HOU .347 Bautista,J TOR
.315 Ellsbury,J NYY .319 Cabrera,M TOR .307 Kinsler,I DET .343 Beckham,G CWS
AL Batting Leaders

8/12/2019 2014 Mid-Season Report
http://slidepdf.com/reader/full/2014-mid-season-report 51/80
49 - 2014 SEATTLE MARINERS MID-SEASON REPORT
CAUGHT STEALING SACRIFICE BUNTS SACRIFICE FLIES STRIKEOUTS 9 Andrus,E TEX 6 Martin,L TEX 8 Jackson,A DET 112 Springer,G HOU
8 Martin,L TEX 6 Andrus,E TEX 8 Joyce,M TB 106 Davis,C BAL
8 Davis,R DET 6 Gardner,B NYY 8 Butler,B KC 102 Flowers,T CWS
8 Rios,A TEX 6 Aviles,M CLE 8 Cabrera,M DET 100 Dunn,A CWS
6 Eaton,A CWS 5 Jennings,D TB 7 Trout,M LAA 99 Carter,C HOU
6 Jennings,D TB 5 Guyer,B TB 7 Pujols,A LAA 97 Zunino,M SEA
6 Pedroia,D BOS 5 Escobar,A KC 6 Dozier,B MIN 95 Trout,M LAA
6 Aybar,E LAA 4 (10) PLAYERS TIED 6 Jones,A BAL 91 Castro,J HOU
6 De Aza,A CWS 5 (11) PLAYERS TIED 89 Bogaerts,X BOS
5 (02) PLAYERS TIED 87 (02) PLAYERS TIED
GROUNDED INTO DP INTENTIONAL WALKS HIT BY PITCH AT BATS 16 Andrus,E TEX 16 Ortiz,D BOS 11 Choo,S TEX 392 Markakis,N BAL
16 Rios,A TEX 13 Martinez,V DET 10 Zunino,M SEA 391 Cabrera,M TOR
15 Perez,S KC 11 Fielder,P TEX 9 Springer,G HOU 388 Altuve,J HOU
14 Viciedo,D CWS 9 Abreu,J CWS 8 Castro,J HOU 385 Hosmer,E KC
14 Cabrera,M TOR 9 Cano,R SEA 7 Bogaerts,X BOS 385 Jones,A BAL
14 Callaspo,A OAK 8 Longoria,E TB 7 Schoop,J BAL 379 Kinsler,I DET
14 Pujols,A LAA 7 Davis,C BAL 7 Cabrera,A CLE 378 Pedroia,D BOS
13 Butler,B KC 7 Pujols,A LAA 6 (08) PLAYERS TIED 373 Longoria,E TB
13 Cabrera,M DET 7 Cruz,N BAL 373 Pujols,A LAA
13 Hunter,T DET 5 (04) PLAYERS TIED 370 Andrus,E TEX
HARDEST TO FAN RBI RATIO HOME RUN RATIO HARDEST TO DOUBLE UP (PLATE APP. PER SO) (AT BATS PER RBI) (AT BATS PER HOME RUN) (AT BATS PER GIDP)
14.8 Martinez,V DET 4.4 Abreu,J CWS 11.1 Abreu,J CWS * 295 Martin,L TEX 14.4 Altuve,J HOU 4.6 Cabrera,M DET 12.6 Encarnacio,E TOR * 270 Miller,B SEA 12.4 Suzuki,K MIN 4.7 Encarnacio,E TOR 12.7 Cruz,N BAL 263.0 Dunn,A CWS
12.2 Brantley,M CLE 4.7 Trout,M LAA 14.4 Carter,C HOU 254.0 Crisp,C OAK
11.1 Aybar,E LAA 4.8 Cruz,N BAL 14.4 Martinez,V DET 172.0 Gardner,B NYY
10.5 Pujols,A LAA 4.9 Moss,B OAK 15.2 Springer,G HOU 166.5 Reyes,J TOR
10.2 Aoki,N KC 5.3 Ortiz,D BOS 15.3 Moss,B OAK 140.5 Davis,C BAL
9.9 Kinsler,I DET 5.4 Seager,K SEA 15.4 Teixeira,M NYY 131.0 Chisenhall,L CLE
9.4 Escobar,Y TB 5.4 Teixeira,M NYY 15.7 Trout,M LAA 100.7 Castellano,N DET
9.4 Callaspo,A OAK 5.5 Martinez,V DET 16.9 Ortiz,D BOS 98.7 Eaton,A CWS
GAMES PLAYED * Has not hit into GIDP
97 Longoria,E TB
95 Ramirez,A CWS
95 Dominguez,M HOU
95 Cabrera,M TOR
94 (07) PLAYERS TIED
American League DH/PH StatisticsDesignated Hitters
GI CLUB AVG AB R H TB 2B 3B HR RBI SH SF HP BB IBB SO SB CS DP SLG OBP DETROIT .321 336 53 108 197 18 1 23 59 0 3 1 35 12 35 2 1 13 .586 .384 BALTIMORE .289 342 46 99 165 13 1 17 61 1 3 4 28 7 74 1 2 10 .482 .347 LOS ANGELES .275 334 46 92 174 15 2 21 62 1 3 3 30 3 76 4 5 11 .521 .338 TORONTO .269 334 44 90 151 15 2 14 45 0 1 1 36 2 73 1 1 8 .452 .341 CHICAGO .269 327 45 88 165 17 0 20 57 0 2 4 39 2 107 3 1 7 .505 .352 KANSAS CITY .265 344 39 91 118 18 0 3 35 0 8 1 28 3 67 3 1 13 .343 .315 MINNESOTA .263 323 39 85 148 21 0 14 64 0 3 5 30 2 82 1 0 8 .458 .332 BOSTON .257 358 39 92 174 19 0 21 67 0 2 2 53 14 62 0 0 10 .486 .354 TEXAS .253 320 51 81 131 19 2 9 53 3 3 9 32 2 93 2 1 11 .409 .335 TAMPA BAY .246 350 41 86 147 28 3 9 42 1 4 5 41 1 75 0 1 16 .420 .330 OAKLAND .229 345 44 79 132 19 2 10 49 0 3 5 37 2 68 2 0 12 .383 .310 HOUSTON .223 337 42 75 162 14 2 23 51 0 2 7 27 1 113 1 2 7 .481 .292 CLEVELAND .222 324 31 72 117 12 0 11 40 2 1 4 29 3 90 3 0 12 .361 .293 NEW YORK .208 318 31 66 117 18 0 11 35 0 5 3 24 1 79 1 0 6 .368 .266 SEATTLE .197 330 38 65 98 7 1 8 31 1 2 7 27 1 82 8 3 2 .297 .270 TOTALS .253 5022 629 1269 2196 253 16 214 751 9 45 61 496 56 1176 32 18 146 .437 .325
Pinch Hitters GI CLUB AVG AB R H TB 2B 3B HR RBI SH SF HP BB IBB SO SB CS DP SLG OBP CHICAGO .372 43 7 16 22 3 0 1 8 0 1 1 5 1 11 0 0 1 .512 .440 BALTIMORE .351 37 7 13 24 2 0 3 12 1 0 0 3 1 11 0 0 1 .649 .400 TEXAS .276 58 5 16 20 1 0 1 7 1 1 0 3 0 20 0 0 1 .345 .306 OAKLAND .256 78 11 20 34 5 0 3 15 0 1 1 16 0 13 2 0 1 .436 .385 BOSTON .255 47 7 12 16 1 0 1 9 0 0 2 9 1 16 0 0 1 .340 .397 TAMPA BAY .241 87 7 21 31 4 0 2 14 1 1 2 8 0 28 0 0 2 .356 .316 NEW YORK .236 55 4 13 13 0 0 0 4 0 1 1 5 0 15 0 0 2 .236 .306 TORONTO .233 86 10 20 36 2 1 4 16 0 1 1 9 1 27 0 0 2 .419 .309 LOS ANGELES .220 59 6 13 18 2 0 1 7 1 0 0 8 0 17 0 0 1 .305 .313 SEATTLE .175 40 4 7 11 1 0 1 5 2 0 0 3 0 10 0 0 3 .275 .233 KANSAS CITY .158 19 1 3 4 1 0 0 1 1 0 0 3 1 4 0 2 1 .211 .273 CLEVELAND .149 47 6 7 10 0 0 1 4 0 0 1 7 1 12 0 0 2 .213 .273 MINNESOTA .143 49 3 7 8 1 0 0 6 0 1 0 4 0 13 0 0 4 .163 .204 DETROIT .138 29 3 4 8 1 0 1 2 0 0 0 4 0 12 0 0 0 .276 .242 HOUSTON .070 43 1 3 3 0 0 0 4 0 1 0 4 0 18 0 0 1 .070 .146 TOTALS .225 777 82 175 258 24 1 19 114 7 8 9 91 6 227 2 2 23 .332 .311
AL Batting Leaders
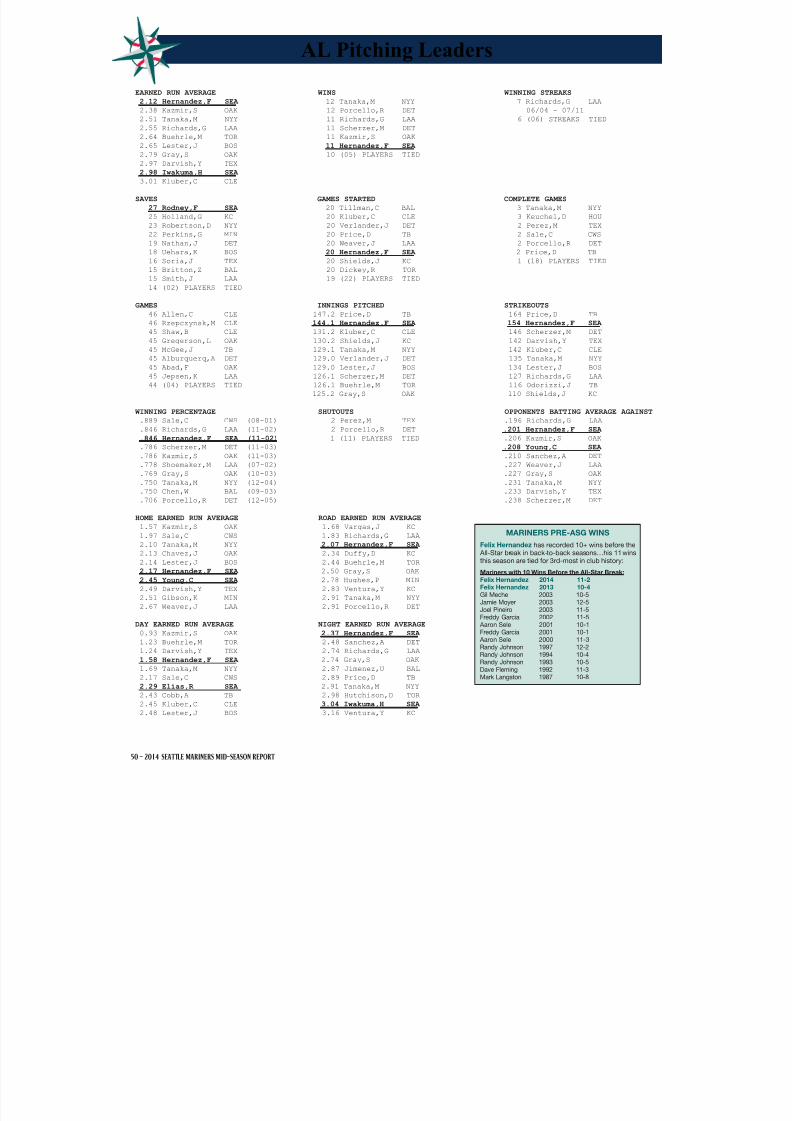
8/12/2019 2014 Mid-Season Report
http://slidepdf.com/reader/full/2014-mid-season-report 52/80
50 - 2014 SEATTLE MARINERS MID-SEASON REPORT
EARNED RUN AVERAGE WINS WINNING STREAKS
2.12 Hernandez,F SEA 12 Tanaka,M NYY 7 Richards,G LAA
2.38 Kazmir,S OAK 12 Porcello,R DET 06/04 - 07/11
2.51 Tanaka,M NYY 11 Richards,G LAA 6 (06) STREAKS TIED
2.55 Richards,G LAA 11 Scherzer,M DET
2.64 Buehrle,M TOR 11 Kazmir,S OAK
2.65 Lester,J BOS 11 Hernandez,F SEA
2.79 Gray,S OAK 10 (05) PLAYERS TIED
2.97 Darvish,Y TEX
2.98 Iwakuma,H SEA
3.01 Kluber,C CLE
SAVES GAMES STARTED COMPLETE GAMES
27 Rodney,F SEA 20 Tillman,C BAL 3 Tanaka,M NYY
25 Holland,G KC 20 Kluber,C CLE 3 Keuchel,D HOU
23 Robertson,D NYY 20 Verlander,J DET 2 Perez,M TEX
22 Perkins,G MIN 20 Price,D TB 2 Sale,C CWS
19 Nathan,J DET 20 Weaver,J LAA 2 Porcello,R DET
18 Uehara,K BOS 20 Hernandez,F SEA 2 Price,D TB
16 Soria,J TEX 20 Shields,J KC 1 (18) PLAYERS TIED
15 Britton,Z BAL 20 Dickey,R TOR
15 Smith,J LAA 19 (22) PLAYERS TIED
14 (02) PLAYERS TIED
GAMES INNINGS PITCHED STRIKEOUTS
46 Allen,C CLE 147.2 Price,D TB 164 Price,D TB
46 Rzepczynsk,M CLE 144.1 Hernandez,F SEA 154 Hernandez,F SEA
45 Shaw,B CLE 131.2 Kluber,C CLE 146 Scherzer,M DET
45 Gregerson,L OAK 130.2 Shields,J KC 142 Darvish,Y TEX
45 McGee,J TB 129.1 Tanaka,M NYY 142 Kluber,C CLE
45 Alburquerq,A DET 129.0 Verlander,J DET 135 Tanaka,M NYY
45 Abad,F OAK 129.0 Lester,J BOS 134 Lester,J BOS
45 Jepsen,K LAA 126.1 Scherzer,M DET 127 Richards,G LAA
44 (04) PLAYERS TIED 126.1 Buehrle,M TOR 116 Odorizzi,J TB
125.2 Gray,S OAK 110 Shields,J KC
WINNING PERCENTAGE SHUTOUTS OPPONENTS BATTING AVERAGE AGAINST
.889 Sale,C CWS (08-01) 2 Perez,M TEX .196 Richards,G LAA
.846 Richards,G LAA (11-02) 2 Porcello,R DET .201 Hernandez,F SEA
.846 Hernandez,F SEA (11-02) 1 (11) PLAYERS TIED .206 Kazmir,S OAK
.786 Scherzer,M DET (11-03) .208 Young,C SEA
.786 Kazmir,S OAK (11-03) .210 Sanchez,A DET
.778 Shoemaker,M LAA (07-02) .227 Weaver,J LAA
.769 Gray,S OAK (10-03) .227 Gray,S OAK
.750 Tanaka,M NYY (12-04) .231 Tanaka,M NYY
.750 Chen,W BAL (09-03) .233 Darvish,Y TEX
.706 Porcello,R DET (12-05) .238 Scherzer,M DET
HOME EARNED RUN AVERAGE ROAD EARNED RUN AVERAGE
1.57 Kazmir,S OAK 1.68 Vargas,J KC
1.97 Sale,C CWS 1.83 Richards,G LAA
2.10 Tanaka,M NYY 2.07 Hernandez,F SEA
2.13 Chavez,J OAK 2.34 Duffy,D KC
2.14 Lester,J BOS 2.44 Buehrle,M TOR
2.17 Hernandez,F SEA 2.50 Gray,S OAK
2.45 Young,C SEA 2.78 Hughes,P MIN
2.49 Darvish,Y TEX 2.83 Ventura,Y KC
2.51 Gibson,K MIN 2.91 Tanaka,M NYY
2.67 Weaver,J LAA 2.91 Porcello,R DET
DAY EARNED RUN AVERAGE NIGHT EARNED RUN AVERAGE
0.93 Kazmir,S OAK 2.37 Hernandez,F SEA
1.23 Buehrle,M TOR 2.48 Sanchez,A DET
1.24 Darvish,Y TEX 2.74 Richards,G LAA
1.58 Hernandez,F SEA 2.74 Gray,S OAK
1.69 Tanaka,M NYY 2.87 Jimenez,U BAL
2.17 Sale,C CWS 2.89 Price,D TB
2.29 Elias,R SEA 2.91 Tanaka,M NYY
2.43 Cobb,A TB 2.98 Hutchison,D TOR
2.45 Kluber,C CLE 3.04 Iwakuma,H SEA
2.48 Lester,J BOS 3.16 Ventura,Y KC
AL Pitching Leaders
MARINERS PRE-ASG WINS
Felix Hernandez has recorded 10+ wins before the All-Star break in back-to-back seasons…his 11 winsthis season are tied for 3rd-most in club history:
Mariners with 10 Wins Before the All-Star Break:Felix Hernandez 2014 11-2Felix Hernandez 2013 10-4
Gil Meche 2003 10-5
Jamie Moyer 2003 12-5Joel Pineiro 2003 11-5Freddy Garcia 2002 11-5 Aaron Sele 2001 10-1Freddy Garcia 2001 10-1 Aaron Sele 2000 11-3Randy Johnson 1997 12-2Randy Johnson 1994 10-4Randy Johnson 1993 10-5Dave Fleming 1992 11-3Mark Langston 1987 10-8
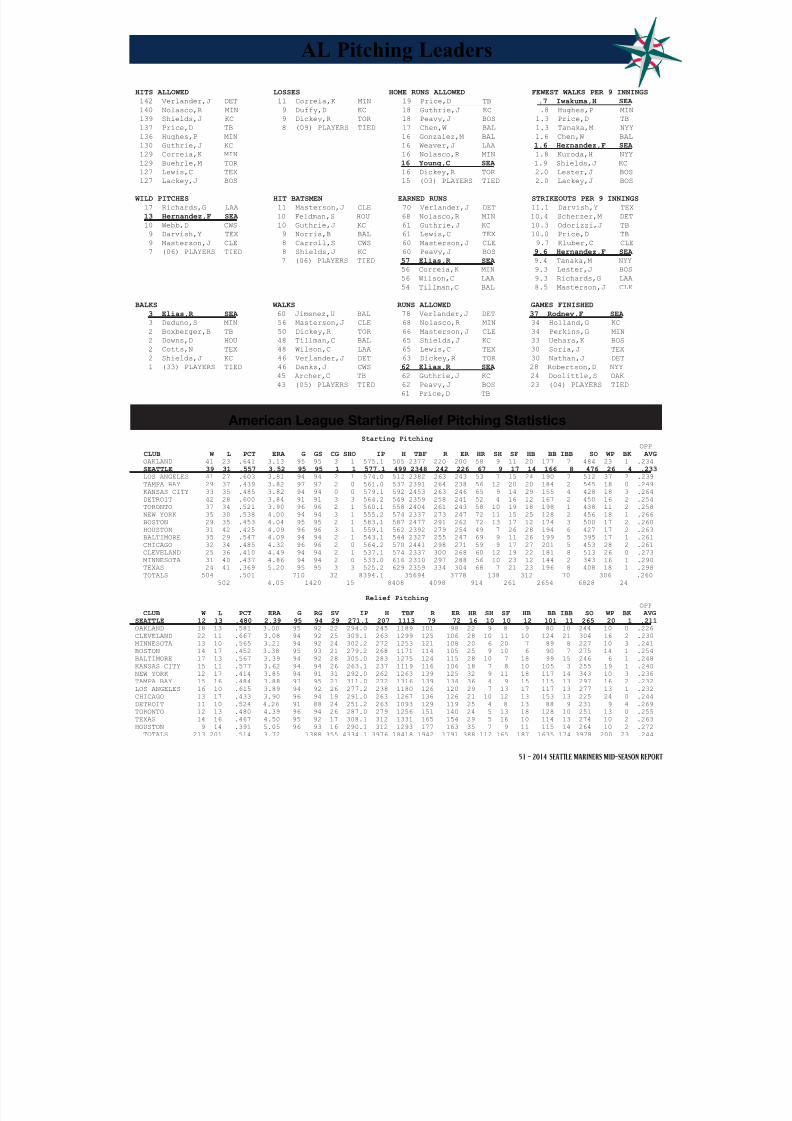
8/12/2019 2014 Mid-Season Report
http://slidepdf.com/reader/full/2014-mid-season-report 53/80
51 - 2014 SEATTLE MARINERS MID-SEASON REPORT
HITS ALLOWED LOSSES HOME RUNS ALLOWED FEWEST WALKS PER 9 INNINGS
142 Verlander,J DET 11 Correia,K MIN 19 Price,D TB .7 Iwakuma,H SEA
140 Nolasco,R MIN 9 Duffy,D KC 18 Guthrie,J KC .8 Hughes,P MIN
139 Shields,J KC 9 Dickey,R TOR 18 Peavy,J BOS 1.3 Price,D TB
137 Price,D TB 8 (09) PLAYERS TIED 17 Chen,W BAL 1.3 Tanaka,M NYY
136 Hughes,P MIN 16 Gonzalez,M BAL 1.6 Chen,W BAL
130 Guthrie,J KC 16 Weaver,J LAA 1.6 Hernandez,F SEA
129 Correia,K MIN 16 Nolasco,R MIN 1.8 Kuroda,H NYY
129 Buehrle,M TOR 16 Young,C SEA 1.9 Shields,J KC
127 Lewis,C TEX 16 Dickey,R TOR 2.0 Lester,J BOS
127 Lackey,J BOS 15 (03) PLAYERS TIED 2.0 Lackey,J BOS
WILD PITCHES HIT BATSMEN EARNED RUNS STRIKEOUTS PER 9 INNINGS
17 Richards,G LAA 11 Masterson,J CLE 70 Verlander,J DET 11.1 Darvish,Y TEX
13 Hernandez,F SEA 10 Feldman,S HOU 68 Nolasco,R MIN 10.4 Scherzer,M DET
10 Webb,D CWS 10 Guthrie,J KC 61 Guthrie,J KC 10.3 Odorizzi,J TB
9 Darvish,Y TEX 9 Norris,B BAL 61 Lewis,C TEX 10.0 Price,D TB
9 Masterson,J CLE 8 Carroll,S CWS 60 Masterson,J CLE 9.7 Kluber,C CLE
7 (06) PLAYERS TIED 8 Shields,J KC 60 Peavy,J BOS 9.6 Hernandez,F SEA
7 (06) PLAYERS TIED 57 Elias,R SEA 9.4 Tanaka,M NYY
56 Correia,K MIN 9.3 Lester,J BOS
56 Wilson,C LAA 9.3 Richards,G LAA
54 Tillman,C BAL 8.5 Masterson,J CLE
BALKS WALKS RUNS ALLOWED GAMES FINISHED
3 Elias,R SEA 60 Jimenez,U BAL 78 Verlander,J DET 37 Rodney,F SEA
3 Deduno,S MIN 56 Masterson,J CLE 68 Nolasco,R MIN 34 Holland,G KC
2 Boxberger,B TB 50 Dickey,R TOR 66 Masterson,J CLE 34 Perkins,G MIN
2 Downs,D HOU 48 Tillman,C BAL 65 Shields,J KC 33 Uehara,K BOS
2 Cotts,N TEX 48 Wilson,C LAA 65 Lewis,C TEX 30 Soria,J TEX
2 Shields,J KC 46 Verlander,J DET 63 Dickey,R TOR 30 Nathan,J DET
1 (33) PLAYERS TIED 46 Danks,J CWS 62 Elias,R SEA 28 Robertson,D NYY
45 Archer,C TB 62 Guthrie,J KC 24 Doolittle,S OAK
43 (05) PLAYERS TIED 62 Peavy,J BOS 23 (04) PLAYERS TIED
61 Price,D TB
American League Starting/Relief Pitching StatisticsStarting Pitching
OPP
CLUB W L PCT ERA G GS CG SHO IP H TBF R ER HR SH SF HB BB IBB SO WP BK AVG OAKLAND 41 23 .641 3.13 95 95 3 1 575.1 505 2377 220 200 58 9 11 20 177 7 484 23 1 .234
SEATTLE 39 31 .557 3.52 95 95 1 1 577.1 499 2348 242 226 67 9 17 14 166 8 476 26 4 .233 LOS ANGELES 41 27 .603 3.81 94 94 2 1 574.0 512 2382 263 243 53 7 15 24 190 7 512 37 2 .239
TAMPA BAY 29 37 .439 3.82 97 97 2 0 561.0 537 2391 264 238 56 12 20 20 184 2 545 18 0 .249
KANSAS CITY 33 35 .485 3.82 94 94 0 0 579.1 592 2453 263 246 65 9 14 29 155 4 428 18 3 .264
DETROIT 42 28 .600 3.84 91 91 3 3 564.2 549 2359 258 241 52 4 16 12 167 2 450 16 2 .254 TORONTO 37 34 .521 3.90 96 96 2 1 560.1 558 2404 261 243 58 10 19 18 198 1 438 11 2 .258
NEW YORK 35 30 .538 4.00 94 94 3 1 555.2 574 2337 273 247 72 11 15 25 128 2 456 18 1 .266
BOSTON 29 35 .453 4.04 95 95 2 1 583.1 587 2477 291 262 72 13 17 12 174 3 500 17 2 .260
HOUSTON 31 42 .425 4.09 96 96 3 1 559.1 562 2392 279 254 49 7 26 28 194 6 427 17 2 .263 BALTIMORE 35 29 .547 4.09 94 94 2 1 543.1 544 2327 255 247 69 9 11 26 199 5 395 17 1 .261
CHICAGO 32 34 .485 4.32 96 96 2 0 564.2 570 2441 298 271 59 9 17 27 201 5 453 28 2 .261
CLEVELAND 25 36 .410 4.49 94 94 2 1 537.1 574 2337 300 268 60 12 19 22 181 8 513 26 0 .273
MINNESOTA 31 40 .437 4.86 94 94 2 0 533.0 616 2310 297 288 56 10 23 12 144 2 343 16 1 .290 TEXAS 24 41 .369 5.20 95 95 3 3 525.2 629 2359 334 304 68 7 21 23 196 8 408 18 1 .298
TOTALS 504 .501 710 32 8394.1 35694 3778 138 312 70 306 .260
502 4.05 1420 15 8408 4098 914 261 2654 6828 24
Relief Pitching OPP
CLUB W L PCT ERA G RG SV IP H TBF R ER HR SH SF HB BB IBB SO WP BK AVG SEATTLE 12 13 .480 2.39 95 94 29 271.1 207 1113 79 72 16 10 10 12 101 11 265 20 1 .211 OAKLAND 18 13 .581 3.00 95 92 22 294.0 245 1189 101 98 22 9 8 9 80 10 244 10 0 .226
CLEVELAND 22 11 .667 3.08 94 92 25 309.1 263 1299 125 106 28 10 11 10 124 21 304 16 2 .230
MINNESOTA 13 10 .565 3.21 94 92 24 302.2 272 1253 121 108 20 6 20 7 89 8 227 10 3 .241 BOSTON 14 17 .452 3.38 95 93 21 279.2 268 1171 114 105 25 9 10 6 90 7 275 14 1 .254
BALTIMORE 17 13 .567 3.39 94 92 28 305.0 283 1275 124 115 28 10 7 18 99 15 246 6 1 .248
KANSAS CITY 15 11 .577 3.62 94 94 26 263.1 237 1119 116 106 18 7 8 10 105 3 255 19 1 .240
NEW YORK 12 17 .414 3.85 94 91 31 292.0 262 1263 139 125 32 9 11 18 117 14 343 10 3 .236 TAMPA BAY 15 16 .484 3.88 97 95 21 311.0 272 1316 139 134 36 4 9 15 115 13 297 16 2 .232
LOS ANGELES 16 10 .615 3.89 94 92 26 277.2 238 1180 126 120 29 7 13 17 117 13 277 13 1 .232
CHICAGO 13 17 .433 3.90 96 94 19 291.0 263 1267 136 126 21 10 12 13 153 13 225 24 0 .244
DETROIT 11 10 .524 4.26 91 88 24 251.2 263 1093 129 119 25 4 8 13 88 9 231 9 4 .269 TORONTO 12 13 .480 4.39 96 94 26 287.0 279 1256 151 140 24 5 13 18 128 10 251 13 0 .255
TEXAS 14 16 .467 4.50 95 92 17 308.1 312 1331 165 154 29 5 16 10 114 13 274 10 2 .263
HOUSTON 9 14 .391 5.05 96 93 16 290.1 312 1293 177 163 35 7 9 11 115 14 264 10 2 .272
TOTALS 213 201 .514 3.72 1388 355 4334.1 3976 18418 1942 1791 388 112 165 187 1635 174 3978 200 23 .244
AL Pitching Leaders
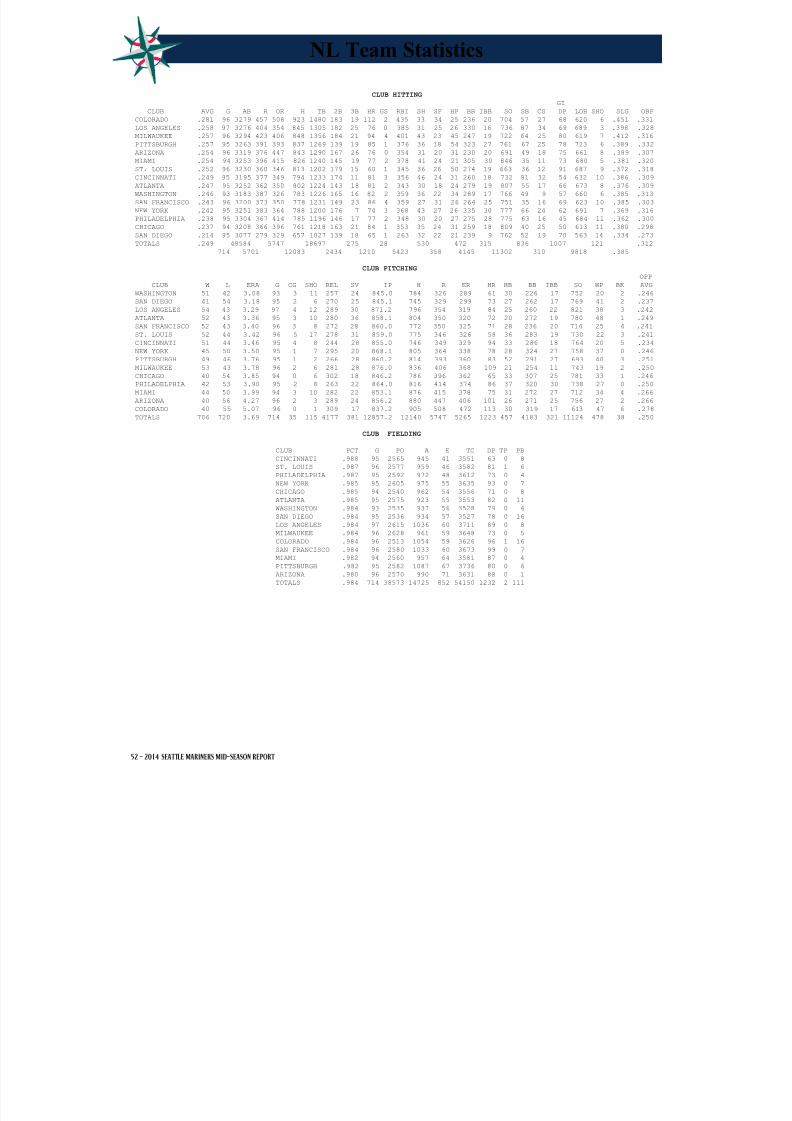
8/12/2019 2014 Mid-Season Report
http://slidepdf.com/reader/full/2014-mid-season-report 54/80
52 - 2014 SEATTLE MARINERS MID-SEASON REPORT
CLUB HITTING
GI
CLUB AVG G AB R OR H TB 2B 3B HR GS RBI SH SF HP BB IBB SO SB CS DP LOB SHO SLG OBP
COLORADO .281 96 3279 457 508 923 1480 183 19 112 2 435 33 34 25 236 20 704 57 27 68 620 6 .451 .331
LOS ANGELES .258 97 3276 404 354 845 1305 182 25 76 0 385 31 25 26 330 16 736 87 34 69 689 3 .398 .328
MILWAUKEE .257 96 3294 423 406 848 1356 184 21 94 4 401 43 23 45 247 19 722 64 25 80 619 7 .412 .316
PITTSBURGH .257 95 3263 391 393 837 1269 139 19 85 1 376 36 18 54 323 27 761 67 25 78 723 6 .389 .332
ARIZONA .254 96 3319 376 447 843 1290 167 26 76 0 354 31 20 31 230 20 691 49 18 75 661 8 .389 .307
MIAMI .254 94 3253 396 415 826 1240 145 19 77 2 378 41 24 21 305 30 846 35 11 73 680 5 .381 .320
ST. LOUIS .252 96 3230 360 346 813 1202 179 15 60 1 345 36 26 50 274 19 663 36 12 91 687 9 .372 .318
CINCINNATI .249 95 3195 377 349 794 1233 174 11 81 3 356 46 24 31 260 18 732 81 32 54 632 10 .386 .309
ATLANTA .247 95 3252 362 350 802 1224 143 18 81 2 343 30 18 24 279 19 807 55 17 66 673 8 .376 .309
WASHINGTON .246 93 3183 387 326 783 1226 165 16 82 2 359 36 22 34 289 17 766 49 9 57 660 6 .385 .313
SAN FRANCISCO .243 96 3200 373 350 778 1231 149 23 86 4 359 27 31 26 264 25 751 35 16 69 623 10 .385 .303
NEW YORK .242 95 3251 383 364 788 1200 176 7 74 3 368 43 27 26 335 30 777 66 24 62 691 7 .369 .316
PHILADELPHIA .238 95 3304 367 414 785 1196 146 17 77 2 348 30 20 27 275 28 775 63 16 45 684 11 .362 .300
CHICAGO .237 94 3208 366 396 761 1218 163 21 84 1 353 35 24 31 259 18 809 40 25 50 613 11 .380 .298
SAN DIEGO .214 95 3077 279 329 657 1027 139 18 65 1 263 32 22 21 239 9 762 52 19 70 563 14 .334 .273
TOTALS .249 48584 5747 18697 275 28 530 472 315 836 1007 121 .312
714 5701 12083 2434 1210 5423 358 4145 11302 310 9818 .385
CLUB PITCHING
OPP
CLUB W L ERA G CG SHO REL SV IP H R ER HR HB BB IBB SO WP BK AVG
WASHINGTON 51 42 3.08 93 3 11 257 24 845.0 784 326 289 61 30 226 17 752 20 2 .246
SAN DIEGO 41 54 3.18 95 2 6 270 25 845.1 745 329 299 73 27 262 17 769 41 2 .237 LOS ANGELES 54 43 3.29 97 4 12 289 30 871.2 796 354 319 84 25 260 22 821 38 3 .242
ATLANTA 52 43 3.36 95 3 10 280 36 858.1 804 350 320 72 20 272 19 780 48 1 .249
SAN FRANCISCO 52 43 3.40 96 3 8 272 28 860.0 772 350 325 71 28 236 20 714 25 4 .241
ST. LOUIS 52 44 3.42 96 5 17 278 31 859.0 775 346 326 58 36 283 19 730 22 3 .241
CINCINNATI 51 44 3.46 95 4 8 244 28 855.0 746 349 329 94 33 286 18 764 20 5 .234
NEW YORK 45 50 3.50 95 1 7 295 20 868.1 805 364 338 78 28 324 27 758 37 0 .246
PITTSBURGH 49 46 3.76 95 1 2 266 28 860.2 814 393 360 83 52 291 27 693 40 3 .251
MILWAUKEE 53 43 3.78 96 2 6 281 28 876.0 836 406 368 109 21 254 11 743 19 2 .250
CHICAGO 40 54 3.85 94 0 6 302 18 846.2 786 396 362 65 33 307 25 781 33 1 .246
PHILADELPHIA 42 53 3.90 95 2 8 263 22 864.0 816 414 374 86 37 320 30 738 27 0 .250
MIAMI 44 50 3.99 94 3 10 282 22 853.1 876 415 378 75 31 272 27 712 34 4 .266
ARIZONA 40 56 4.27 96 2 3 289 24 856.2 880 447 406 101 26 271 25 756 27 2 .266
COLORADO 40 55 5.07 96 0 1 309 17 837.2 905 508 472 113 30 319 17 613 47 6 .278
TOTALS 706 720 3.69 714 35 115 4177 381 12857.2 12140 5747 5265 1223 457 4183 321 11124 478 38 .250
CLUB FIELDING
CLUB PCT G PO A E TC DP TP PB CINCINNATI .988 95 2565 945 41 3551 63 0 8
ST. LOUIS .987 96 2577 959 46 3582 81 1 6
PHILADELPHIA .987 95 2592 972 48 3612 73 0 4
NEW YORK .985 95 2605 975 55 3635 93 0 7
CHICAGO .985 94 2540 962 54 3556 71 0 8
ATLANTA .985 95 2575 923 55 3553 82 0 11
WASHINGTON .984 93 2535 937 56 3528 79 0 4
SAN DIEGO .984 95 2536 934 57 3527 78 0 16
LOS ANGELES .984 97 2615 1036 60 3711 89 0 8
MILWAUKEE .984 96 2628 961 59 3648 73 0 5
COLORADO .984 96 2513 1054 59 3626 96 1 16
SAN FRANCISCO .984 96 2580 1033 60 3673 99 0 7
MIAMI .982 94 2560 957 64 3581 87 0 4
PITTSBURGH .982 95 2582 1087 67 3736 80 0 6
ARIZONA .980 96 2570 990 71 3631 88 0 1
TOTALS .984 714 38573 14725 852 54150 1232 2 111
NL Team Statistics
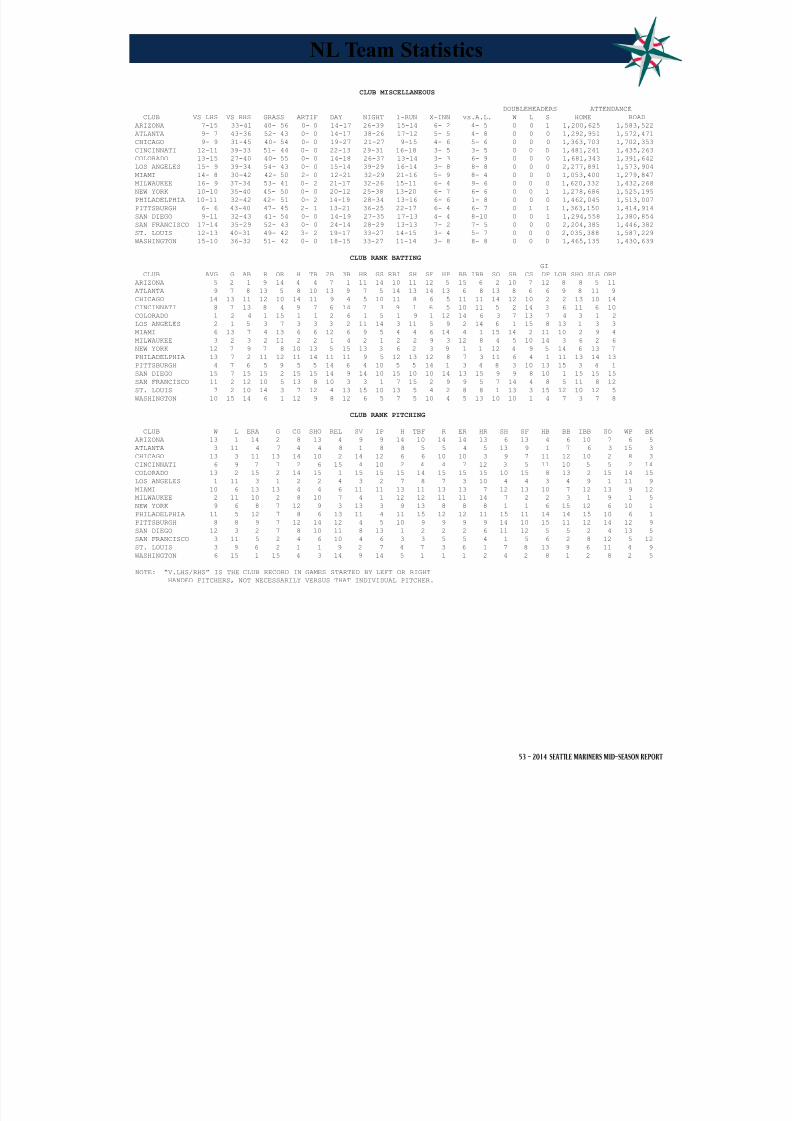
8/12/2019 2014 Mid-Season Report
http://slidepdf.com/reader/full/2014-mid-season-report 55/80
53 - 2014 SEATTLE MARINERS MID-SEASON REPORT
CLUB MISCELLANEOUS
DOUBLEHEADERS ATTENDANCE
CLUB VS LHS VS RHS GRASS ARTIF DAY NIGHT 1-RUN X-INN vs.A.L. W L S HOME ROAD
ARIZONA 7-15 33-41 40- 56 0- 0 14-17 26-39 15-14 6- 2 4- 5 0 0 1 1,200,625 1,583,522
ATLANTA 9- 7 43-36 52- 43 0- 0 14-17 38-26 17-12 5- 5 4- 8 0 0 0 1,292,951 1,572,471
CHICAGO 9- 9 31-45 40- 54 0- 0 19-27 21-27 9-15 4- 6 5- 6 0 0 0 1,363,703 1,702,353
CINCINNATI 12-11 39-33 51- 44 0- 0 22-13 29-31 16-18 3- 5 3- 5 0 0 0 1,481,241 1,435,263 COLORADO 13-15 27-40 40- 55 0- 0 14-18 26-37 13-14 3- 3 6- 9 0 0 0 1,681,343 1,391,642
LOS ANGELES 15- 9 39-34 54- 43 0- 0 15-14 39-29 16-14 3- 8 8- 8 0 0 0 2,277,891 1,573,904
MIAMI 14- 8 30-42 42- 50 2- 0 12-21 32-29 21-16 5- 9 8- 4 0 0 0 1,053,400 1,279,847
MILWAUKEE 16- 9 37-34 53- 41 0- 2 21-17 32-26 15-11 6- 4 9- 6 0 0 0 1,620,332 1,432,268
NEW YORK 10-10 35-40 45- 50 0- 0 20-12 25-38 13-20 6- 7 6- 6 0 0 1 1,278,686 1,525,195
PHILADELPHIA 10-11 32-42 42- 51 0- 2 14-19 28-34 13-16 6- 6 1- 8 0 0 0 1,462,045 1,513,007
PITTSBURGH 6- 6 43-40 47- 45 2- 1 13-21 36-25 22-17 6- 4 6- 7 0 1 1 1,363,150 1,414,914
SAN DIEGO 9-11 32-43 41- 54 0- 0 14-19 27-35 17-13 4- 4 8-10 0 0 1 1,294,558 1,380,854
SAN FRANCISCO 17-14 35-29 52- 43 0- 0 24-14 28-29 13-13 7- 2 7- 5 0 0 0 2,204,385 1,446,382
ST. LOUIS 12-13 40-31 49- 42 3- 2 19-17 33-27 14-15 3- 4 5- 7 0 0 0 2,035,388 1,587,229
WASHINGTON 15-10 36-32 51- 42 0- 0 18-15 33-27 11-14 3- 8 8- 8 0 0 0 1,465,135 1,430,639
CLUB RANK BATTING
GI
CLUB AVG G AB R OR H TB 2B 3B HR GS RBI SH SF HP BB IBB SO SB CS DP LOB SHO SLG OBP
ARIZONA 5 2 1 9 14 4 4 7 1 11 14 10 11 12 5 15 6 2 10 7 12 8 8 5 11
ATLANTA 9 7 8 13 5 8 10 13 9 7 5 14 13 14 13 6 8 13 8 6 6 9 8 11 9
CHICAGO 14 13 11 12 10 14 11 9 4 5 10 11 8 6 5 11 11 14 12 10 2 2 13 10 14 CINCINNATI 8 7 13 8 4 9 7 6 14 7 3 9 1 6 5 10 11 5 2 14 3 6 11 6 10
COLORADO 1 2 4 1 15 1 1 2 6 1 5 1 9 1 12 14 6 3 7 13 7 4 3 1 2
LOS ANGELES 2 1 5 3 7 3 3 3 2 11 14 3 11 5 9 2 14 6 1 15 8 13 1 3 3
MIAMI 6 13 7 4 13 6 6 12 6 9 5 4 4 6 14 4 1 15 14 2 11 10 2 9 4
MILWAUKEE 3 2 3 2 11 2 2 1 4 2 1 2 2 9 3 12 8 4 5 10 14 3 6 2 6
NEW YORK 12 7 9 7 8 10 13 5 15 13 3 6 2 3 9 1 1 12 4 9 5 14 6 13 7
PHILADELPHIA 13 7 2 11 12 11 14 11 11 9 5 12 13 12 8 7 3 11 6 4 1 11 13 14 13
PITTSBURGH 4 7 6 5 9 5 5 14 6 4 10 5 5 14 1 3 4 8 3 10 13 15 3 4 1
SAN DIEGO 15 7 15 15 2 15 15 14 9 14 10 15 10 10 14 13 15 9 9 8 10 1 15 15 15
SAN FRANCISCO 11 2 12 10 5 13 8 10 3 3 1 7 15 2 9 9 5 7 14 4 8 5 11 8 12
ST. LOUIS 7 2 10 14 3 7 12 4 13 15 10 13 5 4 2 8 8 1 13 3 15 12 10 12 5
WASHINGTON 10 15 14 6 1 12 9 8 12 6 5 7 5 10 4 5 13 10 10 1 4 7 3 7 8
CLUB RANK PITCHING
CLUB W L ERA G CG SHO REL SV IP H TBF R ER HR SH SF HB BB IBB SO WP BK
ARIZONA 13 1 14 2 8 13 4 9 9 14 10 14 14 13 6 13 4 6 10 7 6 5
ATLANTA 3 11 4 7 4 4 8 1 8 8 5 5 4 5 13 9 1 7 6 3 15 3 CHICAGO 13 3 11 13 14 10 2 14 12 6 6 10 10 3 9 7 11 12 10 2 8 3
CINCINNATI 6 9 7 7 2 6 15 4 10 2 4 4 7 12 3 5 11 10 5 5 2 14
COLORADO 13 2 15 2 14 15 1 15 15 15 14 15 15 15 10 15 8 13 2 15 14 15
LOS ANGELES 1 11 3 1 2 2 4 3 2 7 8 7 3 10 4 4 3 4 9 1 11 9
MIAMI 10 6 13 13 4 4 6 11 11 13 11 13 13 7 12 13 10 7 12 13 9 12
MILWAUKEE 2 11 10 2 8 10 7 4 1 12 12 11 11 14 7 2 2 3 1 9 1 5
NEW YORK 9 6 8 7 12 9 3 13 3 9 13 8 8 8 1 1 6 15 12 6 10 1
PHILADELPHIA 11 5 12 7 8 6 13 11 4 11 15 12 12 11 15 11 14 14 15 10 6 1
PITTSBURGH 8 8 9 7 12 14 12 4 5 10 9 9 9 9 14 10 15 11 12 14 12 9
SAN DIEGO 12 3 2 7 8 10 11 8 13 1 2 2 2 6 11 12 5 5 2 4 13 5
SAN FRANCISCO 3 11 5 2 4 6 10 4 6 3 3 5 5 4 1 5 6 2 8 12 5 12
ST. LOUIS 3 9 6 2 1 1 9 2 7 4 7 3 6 1 7 8 13 9 6 11 4 9
WASHINGTON 6 15 1 15 4 3 14 9 14 5 1 1 1 2 4 2 8 1 2 8 2 5
NOTE: “V.LHS/RHS” IS THE CLUB RECORD IN GAMES STARTED BY LEFT OR RIGHT
HANDED PITCHERS, NOT NECESSARILY VERSUS THAT INDIVIDUAL PITCHER.
NL Team Statistics
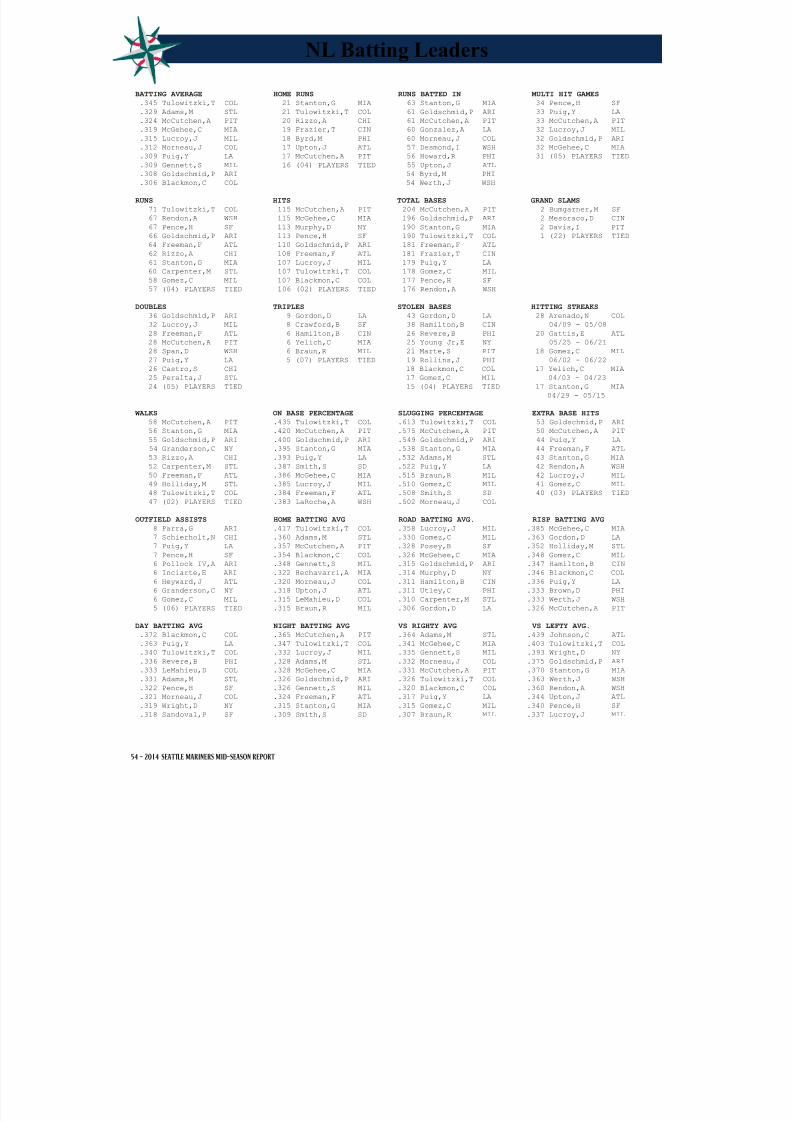
8/12/2019 2014 Mid-Season Report
http://slidepdf.com/reader/full/2014-mid-season-report 56/80
54 - 2014 SEATTLE MARINERS MID-SEASON REPORT
BATTING AVERAGE HOME RUNS RUNS BATTED IN MULTI HIT GAMES
.345 Tulowitzki,T COL 21 Stanton,G MIA 63 Stanton,G MIA 34 Pence,H SF
.329 Adams,M STL 21 Tulowitzki,T COL 61 Goldschmid,P ARI 33 Puig,Y LA
.324 McCutchen,A PIT 20 Rizzo,A CHI 61 McCutchen,A PIT 33 McCutchen,A PIT
.319 McGehee,C MIA 19 Frazier,T CIN 60 Gonzalez,A LA 32 Lucroy,J MIL
.315 Lucroy,J MIL 18 Byrd,M PHI 60 Morneau,J COL 32 Goldschmid,P ARI
.312 Morneau,J COL 17 Upton,J ATL 57 Desmond,I WSH 32 McGehee,C MIA .309 Puig,Y LA 17 McCutchen,A PIT 56 Howard,R PHI 31 (05) PLAYERS TIED
.309 Gennett,S MIL 16 (04) PLAYERS TIED 55 Upton,J ATL
.308 Goldschmid,P ARI 54 Byrd,M PHI
.306 Blackmon,C COL 54 Werth,J WSH
RUNS HITS TOTAL BASES GRAND SLAMS
71 Tulowitzki,T COL 115 McCutchen,A PIT 204 McCutchen,A PIT 2 Bumgarner,M SF
67 Rendon,A WSH 115 McGehee,C MIA 196 Goldschmid,P ARI 2 Mesoraco,D CIN
67 Pence,H SF 113 Murphy,D NY 190 Stanton,G MIA 2 Davis,I PIT
66 Goldschmid,P ARI 113 Pence,H SF 190 Tulowitzki,T COL 1 (22) PLAYERS TIED
64 Freeman,F ATL 110 Goldschmid,P ARI 181 Freeman,F ATL
62 Rizzo,A CHI 108 Freeman,F ATL 181 Frazier,T CIN
61 Stanton,G MIA 107 Lucroy,J MIL 179 Puig,Y LA
60 Carpenter,M STL 107 Tulowitzki,T COL 178 Gomez,C MIL
58 Gomez,C MIL 107 Blackmon,C COL 177 Pence,H SF
57 (04) PLAYERS TIED 106 (02) PLAYERS TIED 176 Rendon,A WSH
DOUBLES TRIPLES STOLEN BASES HITTING STREAKS
36 Goldschmid,P ARI 9 Gordon,D LA 43 Gordon,D LA 28 Arenado,N COL
32 Lucroy,J MIL 8 Crawford,B SF 38 Hamilton,B CIN 04/09 - 05/08
28 Freeman,F ATL 6 Hamilton,B CIN 26 Revere,B PHI 20 Gattis,E ATL
28 McCutchen,A PIT 6 Yelich,C MIA 25 Young Jr,E NY 05/25 - 06/21
28 Span,D WSH 6 Braun,R MIL 21 Marte,S PIT 18 Gomez,C MIL
27 Puig,Y LA 5 (07) PLAYERS TIED 19 Rollins,J PHI 06/02 - 06/22
26 Castro,S CHI 18 Blackmon,C COL 17 Yelich,C MIA
25 Peralta,J STL 17 Gomez,C MIL 04/03 - 04/23
24 (05) PLAYERS TIED 15 (04) PLAYERS TIED 17 Stanton,G MIA
04/29 - 05/15
WALKS ON BASE PERCENTAGE SLUGGING PERCENTAGE EXTRA BASE HITS
58 McCutchen,A PIT .435 Tulowitzki,T COL .613 Tulowitzki,T COL 53 Goldschmid,P ARI
56 Stanton,G MIA .420 McCutchen,A PIT .575 McCutchen,A PIT 50 McCutchen,A PIT
55 Goldschmid,P ARI .400 Goldschmid,P ARI .549 Goldschmid,P ARI 44 Puig,Y LA
54 Granderson,C NY .395 Stanton,G MIA .538 Stanton,G MIA 44 Freeman,F ATL 53 Rizzo,A CHI .393 Puig,Y LA .532 Adams,M STL 43 Stanton,G MIA
52 Carpenter,M STL .387 Smith,S SD .522 Puig,Y LA 42 Rendon,A WSH
50 Freeman,F ATL .386 McGehee,C MIA .515 Braun,R MIL 42 Lucroy,J MIL
49 Holliday,M STL .385 Lucroy,J MIL .510 Gomez,C MIL 41 Gomez,C MIL
48 Tulowitzki,T COL .384 Freeman,F ATL .508 Smith,S SD 40 (03) PLAYERS TIED
47 (02) PLAYERS TIED .383 LaRoche,A WSH .502 Morneau,J COL
OUTFIELD ASSISTS HOME BATTING AVG ROAD BATTING AVG. RISP BATTING AVG
8 Parra,G ARI .417 Tulowitzki,T COL .358 Lucroy,J MIL .385 McGehee,C MIA
7 Schierholt,N CHI .360 Adams,M STL .330 Gomez,C MIL .363 Gordon,D LA
7 Puig,Y LA .357 McCutchen,A PIT .328 Posey,B SF .352 Holliday,M STL
7 Pence,H SF .354 Blackmon,C COL .326 McGehee,C MIA .348 Gomez,C MIL
6 Pollock IV,A ARI .348 Gennett,S MIL .315 Goldschmid,P ARI .347 Hamilton,B CIN
6 Inciarte,E ARI .322 Hechavarri,A MIA .314 Murphy,D NY .346 Blackmon,C COL
6 Heyward,J ATL .320 Morneau,J COL .311 Hamilton,B CIN .336 Puig,Y LA
6 Granderson,C NY .318 Upton,J ATL .311 Utley,C PHI .333 Brown,D PHI
6 Gomez,C MIL .315 LeMahieu,D COL .310 Carpenter,M STL .333 Werth,J WSH 5 (06) PLAYERS TIED .315 Braun,R MIL .306 Gordon,D LA .326 McCutchen,A PIT
DAY BATTING AVG NIGHT BATTING AVG VS RIGHTY AVG VS LEFTY AVG.
.372 Blackmon,C COL .365 McCutchen,A PIT .364 Adams,M STL .439 Johnson,C ATL
.363 Puig,Y LA .347 Tulowitzki,T COL .341 McGehee,C MIA .403 Tulowitzki,T COL
.340 Tulowitzki,T COL .332 Lucroy,J MIL .335 Gennett,S MIL .393 Wright,D NY
.336 Revere,B PHI .328 Adams,M STL .332 Morneau,J COL .375 Goldschmid,P ARI
.333 LeMahieu,D COL .328 McGehee,C MIA .331 McCutchen,A PIT .370 Stanton,G MIA
.331 Adams,M STL .326 Goldschmid,P ARI .326 Tulowitzki,T COL .363 Werth,J WSH
.322 Pence,H SF .326 Gennett,S MIL .320 Blackmon,C COL .360 Rendon,A WSH
.321 Morneau,J COL .324 Freeman,F ATL .317 Puig,Y LA .344 Upton,J ATL
.319 Wright,D NY .315 Stanton,G MIA .315 Gomez,C MIL .340 Pence,H SF
.318 Sandoval,P SF .309 Smith,S SD .307 Braun,R MIL .337 Lucroy,J MIL
NL Batting Leaders

8/12/2019 2014 Mid-Season Report
http://slidepdf.com/reader/full/2014-mid-season-report 57/80
55 - 2014 SEATTLE MARINERS MID-SEASON REPORT
CAUGHT STEALING SACRIFICE BUNTS SACRIFICE FLIES STRIKEOUTS 15 Hamilton,B CIN 8 Roark,T WSH 7 Gonzalez,A LA 116 Upton,B ATL
9 Gordon,D LA 8 Segura,J MIL 6 Crawford,B SF 115 Howard,R PHI
8 Segura,J MIL 8 Morton,C PIT 6 Posey,B SF 114 Byrd,M PHI
7 Puig,Y LA 7 (08) PLAYERS TIED 6 Montero,M ARI 111 Desmond,I WSH
7 LeMahieu,D COL 6 Utley,C PHI 105 Stanton,G MIA
7 Cabrera,E SD 6 Phillips,B CIN 101 Upton,J ATL
6 Marte,S PIT 5 (08) PLAYERS TIED 99 Ozuna,M MIA 6 Bonifacio,E CHI 97 Espinosa,D WSH
5 (03) PLAYERS TIED 95 Johnson,C ATL
94 (02) PLAYERS TIED
GROUNDED INTO DP INTENTIONAL WALKS HIT BY PITCH AT BATS 16 Johnson,C ATL 15 Stanton,G MIA 11 Walker,N PIT 385 Murphy,D NY
16 McGehee,C MIA 9 Tejada,R NY 11 Gomez,C MIL 381 Pence,H SF
15 Prado,M ARI 8 Goldschmid,P ARI 11 Martin, Jr,R PIT 373 Castro,S CHI
15 Holliday,M STL 7 Rizzo,A CHI 10 Marte,S PIT 368 Parra,G ARI
14 Morse,M SF 7 Howard,R PHI 10 Dietrich,D MIA 366 Freeman,F ATL
13 Simmons,A ATL 6 LeMahieu,D COL 10 Holliday,M STL 365 Heyward,J ATL
13 Hill,A ARI 6 Mercer,J PIT 9 Ruiz,C PHI 364 Carpenter,M STL
13 Peralta,J STL 6 Montero,M ARI 8 Espinosa,D WSH 362 Frazier,T CIN
12 (03) PLAYERS TIED 5 (10) PLAYERS TIED 8 Ramirez,A MIL 361 McGehee,C MIA
7 (05) PLAYERS TIED 361 Byrd,M PHI
HARDEST TO FAN RBI RATIO HOME RUN RATIO HARDEST TO DOUBLE UP (PLATE APP. PER SO) (AT BATS PER RBI) (AT BATS PER HOME RUN) (AT BATS PER GIDP)
11.4 Simmons,A ATL 5.6 Morneau,J COL 14.8 Tulowitzki,T COL * 325 Granderson,C NY 11.3 Revere,B PHI 5.6 Stanton,G MIA 16.8 Stanton,G MIA 364.0 Carpenter,M STL
9.6 Span,D WSH 5.7 Braun,R MIL 17.3 Rizzo,A CHI 350.0 Blackmon,C COL
9.4 Morneau,J COL 5.7 LaRoche,A WSH 18.5 Reynolds,M MIL 333.0 Hamilton,B CIN
9.1 Lucroy,J MIL 5.7 Duda,L NY 19.1 Frazier,T CIN 182.5 Heyward,J ATL
8.5 Posey,B SF 5.8 McCutchen,A PIT 19.5 Upton,J ATL 179.5 Gordon,D LA
8.0 Segura,J MIL 5.9 Goldschmid,P ARI 20.1 Byrd,M PHI 132.0 Valbuena,L CHI
8.0 Molina,Y STL 5.9 Montero,M ARI 20.1 Duda,L NY 118.3 Utley,C PHI
7.9 Utley,C PHI 5.9 Gonzalez,A LA 20.9 McCutchen,A PIT 117.7 Span,D WSH
7.9 Murphy,D NY 6.0 Tulowitzki,T COL 21.7 (02) PLAYERS TIED 115.0 Werth,J WSH
GAMES PLAYED * Has not hit into GIDP
96 Pence,H SF
95 Goldschmid,P ARI
95 Freeman,F ATL
95 Carpenter,M STL
94 Castro,S CHI
94 Stanton,G MIA
94 Frazier,T CIN
94 Prado,M ARI 94 Gonzalez,A LA
94 Byrd,M PHI
National League Pinch-Hitting Statistics
Pinch Hitters GI CLUB AVG AB R H TB 2B 3B HR RBI SH SF HP BB IBB SO SB CS DP SLG OBP COLORADO .263 133 16 35 59 10 1 4 25 4 2 2 13 1 42 2 1 3 .444 .333 MILWAUKEE .243 111 14 27 38 2 0 3 18 1 0 4 14 4 37 2 0 3 .342 .349 LOS ANGELES .241 108 13 26 30 4 0 0 15 0 1 1 16 1 38 4 1 3 .278 .341 ARIZONA .241 133 12 32 49 9 1 2 7 1 0 2 11 0 38 3 1 2 .368 .308 SAN DIEGO .221 163 18 36 64 5 1 7 21 3 0 1 15 1 54 2 1 5 .393 .291 CINCINNATI .220 109 10 24 39 6 0 3 15 4 1 1 6 1 34 2 1 3 .358 .265 PITTSBURGH .217 166 15 36 54 9 0 3 22 0 1 4 20 2 50 1 1 4 .325 .314 ST. LOUIS .204 108 7 22 31 5 2 0 9 3 1 3 10 0 23 2 0 3 .287 .287 MIAMI .197 137 11 27 39 4 1 2 21 2 1 3 7 1 34 1 0 5 .285 .250 NEW YORK .190 137 8 26 43 8 0 3 16 2 1 1 13 1 41 3 0 0 .314 .263 PHILADELPHIA .173 133 10 23 37 5 0 3 19 5 1 0 12 1 37 1 0 2 .278 .240 ATLANTA .170 100 6 17 24 4 0 1 7 1 1 3 5 1 29 2 0 4 .240 .229 SAN FRANCISCO .169 118 11 20 31 3 1 2 15 3 1 0 12 2 34 1 0 1 .263 .244 WASHINGTON .157 115 12 18 31 1 0 4 12 0 3 3 19 1 29 0 0 1 .270 .286 CHICAGO .147 136 12 20 30 6 2 0 5 1 0 1 16 1 54 0 1 3 .221 .242 TOTALS .204 1907 175 389 599 81 9 37 227 30 14 29 189 18 574 26 7 42 .314 .284
NL Batting Leaders
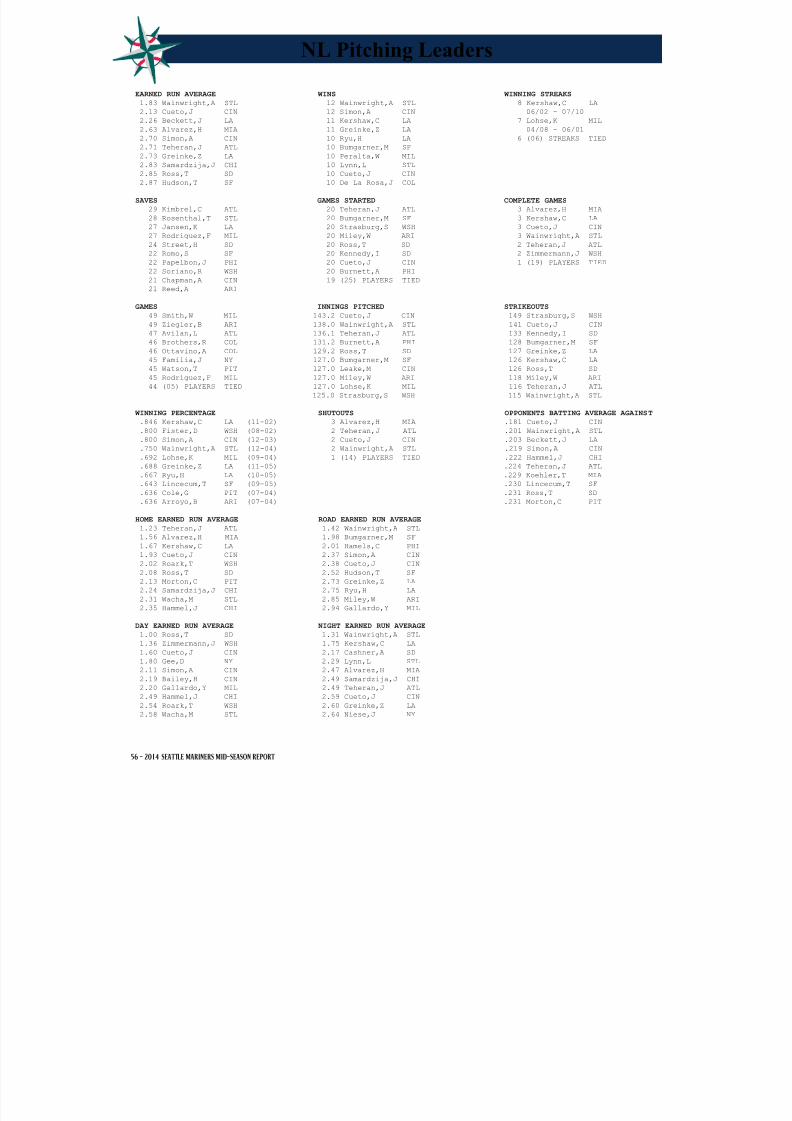
8/12/2019 2014 Mid-Season Report
http://slidepdf.com/reader/full/2014-mid-season-report 58/80
56 - 2014 SEATTLE MARINERS MID-SEASON REPORT
EARNED RUN AVERAGE WINS WINNING STREAKS
1.83 Wainwright,A STL 12 Wainwright,A STL 8 Kershaw,C LA
2.13 Cueto,J CIN 12 Simon,A CIN 06/02 - 07/10
2.26 Beckett,J LA 11 Kershaw,C LA 7 Lohse,K MIL
2.63 Alvarez,H MIA 11 Greinke,Z LA 04/08 - 06/01
2.70 Simon,A CIN 10 Ryu,H LA 6 (06) STREAKS TIED
2.71 Teheran,J ATL 10 Bumgarner,M SF 2.73 Greinke,Z LA 10 Peralta,W MIL
2.83 Samardzija,J CHI 10 Lynn,L STL
2.85 Ross,T SD 10 Cueto,J CIN
2.87 Hudson,T SF 10 De La Rosa,J COL
SAVES GAMES STARTED COMPLETE GAMES
29 Kimbrel,C ATL 20 Teheran,J ATL 3 Alvarez,H MIA
28 Rosenthal,T STL 20 Bumgarner,M SF 3 Kershaw,C LA
27 Jansen,K LA 20 Strasburg,S WSH 3 Cueto,J CIN
27 Rodriguez,F MIL 20 Miley,W ARI 3 Wainwright,A STL
24 Street,H SD 20 Ross,T SD 2 Teheran,J ATL
22 Romo,S SF 20 Kennedy,I SD 2 Zimmermann,J WSH
22 Papelbon,J PHI 20 Cueto,J CIN 1 (19) PLAYERS TIED
22 Soriano,R WSH 20 Burnett,A PHI
21 Chapman,A CIN 19 (25) PLAYERS TIED
21 Reed,A ARI
GAMES INNINGS PITCHED STRIKEOUTS
49 Smith,W MIL 143.2 Cueto,J CIN 149 Strasburg,S WSH
49 Ziegler,B ARI 138.0 Wainwright,A STL 141 Cueto,J CIN
47 Avilan,L ATL 136.1 Teheran,J ATL 133 Kennedy,I SD
46 Brothers,R COL 131.2 Burnett,A PHI 128 Bumgarner,M SF
46 Ottavino,A COL 129.2 Ross,T SD 127 Greinke,Z LA
45 Familia,J NY 127.0 Bumgarner,M SF 126 Kershaw,C LA
45 Watson,T PIT 127.0 Leake,M CIN 126 Ross,T SD
45 Rodriguez,F MIL 127.0 Miley,W ARI 118 Miley,W ARI
44 (05) PLAYERS TIED 127.0 Lohse,K MIL 116 Teheran,J ATL
125.0 Strasburg,S WSH 115 Wainwright,A STL
WINNING PERCENTAGE SHUTOUTS OPPONENTS BATTING AVERAGE AGAINST
.846 Kershaw,C LA (11-02) 3 Alvarez,H MIA .181 Cueto,J CIN
.800 Fister,D WSH (08-02) 2 Teheran,J ATL .201 Wainwright,A STL
.800 Simon,A CIN (12-03) 2 Cueto,J CIN .203 Beckett,J LA
.750 Wainwright,A STL (12-04) 2 Wainwright,A STL .219 Simon,A CIN .692 Lohse,K MIL (09-04) 1 (14) PLAYERS TIED .222 Hammel,J CHI
.688 Greinke,Z LA (11-05) .224 Teheran,J ATL
.667 Ryu,H LA (10-05) .229 Koehler,T MIA
.643 Lincecum,T SF (09-05) .230 Lincecum,T SF
.636 Cole,G PIT (07-04) .231 Ross,T SD
.636 Arroyo,B ARI (07-04) .231 Morton,C PIT
HOME EARNED RUN AVERAGE ROAD EARNED RUN AVERAGE
1.23 Teheran,J ATL 1.42 Wainwright,A STL
1.56 Alvarez,H MIA 1.98 Bumgarner,M SF
1.67 Kershaw,C LA 2.01 Hamels,C PHI
1.93 Cueto,J CIN 2.37 Simon,A CIN
2.02 Roark,T WSH 2.38 Cueto,J CIN
2.08 Ross,T SD 2.52 Hudson,T SF
2.13 Morton,C PIT 2.73 Greinke,Z LA
2.24 Samardzija,J CHI 2.75 Ryu,H LA
2.31 Wacha,M STL 2.85 Miley,W ARI 2.35 Hammel,J CHI 2.94 Gallardo,Y MIL
DAY EARNED RUN AVERAGE NIGHT EARNED RUN AVERAGE
1.00 Ross,T SD 1.31 Wainwright,A STL
1.36 Zimmermann,J WSH 1.75 Kershaw,C LA
1.60 Cueto,J CIN 2.17 Cashner,A SD
1.80 Gee,D NY 2.29 Lynn,L STL
2.11 Simon,A CIN 2.47 Alvarez,H MIA
2.19 Bailey,H CIN 2.49 Samardzija,J CHI
2.20 Gallardo,Y MIL 2.49 Teheran,J ATL
2.49 Hammel,J CHI 2.59 Cueto,J CIN
2.54 Roark,T WSH 2.60 Greinke,Z LA
2.58 Wacha,M STL 2.64 Niese,J NY
NL Pitching Leaders

8/12/2019 2014 Mid-Season Report
http://slidepdf.com/reader/full/2014-mid-season-report 59/80
57 - 2014 SEATTLE MARINERS MID-SEASON REPORT
HITS ALLOWED LOSSES HOME RUNS ALLOWED FEWEST WALKS PER 9 INNINGS
131 McCarthy,B ARI 11 Stults,E SD 27 Estrada,M MIL 1.3 Colon,B NY
130 Leake,M CIN 10 Ross,T SD 19 Stults,E SD 1.4 Hudson,T SF
130 Kendrick,K PHI 10 McCarthy,B ARI 19 Haren,D LA 1.6 Zimmermann,J WSH
129 Alvarez,H MIA 10 Jackson J,E CHI 18 Morales,F COL 1.6 Lohse,K MIL
127 Bumgarner,M SF 9 Kennedy,I SD 17 Miley,W ARI 1.6 McCarthy,B ARI
127 Strasburg,S WSH 9 Kendrick,K PHI 15 Nicasio,J COL 1.7 Alvarez,H MIA 127 Colon,B NY 9 Morton,C PIT 15 Peralta,W MIL 1.7 Greinke,Z LA
122 Eovaldi,N MIA 8 (07) PLAYERS TIED 15 Kendrick,K PHI 1.7 Haren,D LA
122 Peralta,W MIL 15 McCarthy,B ARI 1.7 Eovaldi,N MIA
122 Haren,D LA 14 (05) PLAYERS TIED 1.8 Wainwright,A STL
WILD PITCHES HIT BATSMEN EARNED RUNS STRIKEOUTS PER 9 INNINGS
10 Kennedy,I SD 16 Morton,C PIT 66 Jackson J,E CHI 10.7 Strasburg,S WSH
9 Ross,T SD 8 Cueto,J CIN 62 Kendrick,K PHI 9.6 Greinke,Z LA
9 Volquez,E PIT 8 Simon,A CIN 61 Wood,T CHI 9.6 Kennedy,I SD
8 Harang,A ATL 8 Burnett,A PHI 61 McCarthy,B ARI 9.1 Bumgarner,M SF
7 Wheeler,Z NY 7 Koehler,T MIA 60 Estrada,M MIL 8.9 Hamels,C PHI
7 Morris,B MIA 7 Hernandez,R PHI 59 Miley,W ARI 8.8 Cueto,J CIN
7 Lincecum,T SF 7 Vogelsong,R SF 56 Burnett,A PHI 8.7 Ross,T SD
7 Greinke,Z LA 6 (06) PLAYERS TIED 55 Bailey,H CIN 8.7 Wheeler,Z NY
7 De La Rosa,J COL 55 Stults,E SD 8.6 Hammel,J CHI
6 (09) PLAYERS TIED 54 Colon,B NY 8.6 Samardzija,J CHI
BALKS WALKS RUNS ALLOWED GAMES FINISHED
3 Morales,F COL 57 Burnett,A PHI 71 Jackson J,E CHI 43 Rodriguez,F MIL
2 Cingrani,A CIN 54 Miller,S STL 66 Kendrick,K PHI 36 Reed,A ARI
2 Hatcher,D MIA 51 Hernandez,R PHI 65 Wood,T CHI 35 Rosenthal,T STL
2 Martin,C COL 49 Jackson J,E CHI 65 McCarthy,B ARI 35 Jansen,K LA
1 (29) PLAYERS TIED 48 Wood,T CHI 64 Haren,D LA 33 Cishek,S MIA
46 Wheeler,Z NY 64 Burnett,A PHI 32 Kimbrel,C ATL
45 Koehler,T MIA 63 Miley,W ARI 31 Hawkins,L COL
44 Matsuzaka,D NY 62 Estrada,M MIL 30 Papelbon,J PHI
44 Lincecum,T SF 61 Garza,M MIL 30 Soriano,R WSH
44 Harang,A ATL 60 Stults,E SD 29 Romo,S SF
National League Starting/Relief Pitching StatisticsStarting Pitching
OPP
CLUB W L PCT ERA G GS CG SHO IP H TBF R ER HR SH SF HB BB IBB SO WP BK AVG LOS ANGELES 47 27 .635 3.08 97 97 4 2 590.1 549 2417 231 202 66 17 10 10 131 10 546 19 2 .244 WASHINGTON 36 30 .545 3.28 93 93 3 2 565.0 550 2343 231 206 47 19 12 21 129 6 494 10 0 .254 CINCINNATI 41 30 .577 3.31 95 95 4 3 611.0 531 2506 238 225 71 20 13 28 169 8 504 8 3 .233 ST. LOUIS 40 31 .563 3.35 96 96 5 4 578.1 524 2423 226 215 41 19 10 22 194 7 482 16 1 .241 ATLANTA 35 31 .530 3.42 95 95 3 2 600.0 576 2486 249 228 58 34 17 11 171 7 512 25 1 .256 SAN DIEGO 30 46 .395 3.50 95 95 2 2 560.2 531 2349 242 218 51 29 20 16 167 7 488 29 1 .251 NEW YORK 30 31 .492 3.67 95 95 1 1 570.2 540 2401 245 233 52 20 11 20 191 5 471 13 0 .250 SAN FRANCISCO 34 34 .500 3.67 96 96 3 1 585.1 552 2427 259 239 54 19 15 20 163 10 494 15 1 .250 MILWAUKEE 38 28 .576 3.86 96 96 2 2 602.0 571 2518 289 258 78 25 13 15 164 0 466 10 2 .248 PITTSBURGH 28 33 .459 3.93 95 95 1 0 561.2 534 2386 272 245 54 29 18 36 184 9 440 28 2 .252 PHILADELPHIA 26 41 .388 3.99 95 95 2 0 600.0 594 2583 294 266 59 41 19 27 207 14 466 15 0 .260 CHICAGO 28 37 .431 3.99 94 94 0 0 552.2 538 2346 268 245 45 20 18 22 187 12 509 21 0 .256 MIAMI 25 31 .446 4.12 94 94 3 3 548.1 572 2329 276 251 51 24 20 21 143 9 409 16 2 .270 ARIZONA 28 42 .400 4.58 96 96 2 1 564.0 616 2410 310 287 72 20 22 12 157 10 444 15 1 .280 COLORADO 27 39 .409 5.33 96 96 0 0 523.2 579 2308 333 310 75 22 19 17 201 9 356 27 4 .283 TOTALS 493 .491 714 35 8613.2 36232 3628 358 298 123 267 .255 511 3.79 1428 23 8357 3963 874 237 2558 7081 20
Relief Pitching OPP CLUB W L PCT ERA G RG SV IP H TBF R ER HR SH SF HB BB IBB SO WP BK AVG SAN DIEGO 11 8 .579 2.56 95 93 25 284.2 214 1149 87 81 22 7 8 11 95 10 281 12 1 .208 WASHINGTON 15 12 .556 2.67 93 90 24 280.0 234 1150 95 83 14 11 5 9 97 11 258 10 2 .228 SAN FRANCISCO 18 9 .667 2.82 96 92 28 274.2 220 1089 91 86 17 9 6 8 73 10 220 10 3 .222 NEW YORK 15 19 .441 3.17 95 94 20 297.2 265 1273 119 105 26 8 5 8 133 22 287 24 0 .237 ATLANTA 17 12 .586 3.21 95 92 36 258.1 228 1096 101 92 14 7 7 9 101 12 268 23 0 .235 PITTSBURGH 21 13 .618 3.46 95 94 28 299.0 280 1265 121 115 29 15 7 16 107 18 253 12 1 .250 ST. LOUIS 12 13 .480 3.56 96 91 31 280.2 251 1173 120 111 17 13 13 14 89 12 248 6 2 .240 CHICAGO 12 17 .414 3.61 94 94 18 294.0 248 1247 128 118 20 13 4 11 120 13 272 12 1 .226 MILWAUKEE 15 15 .500 3.61 96 94 28 274.0 265 1155 117 110 31 7 4 6 90 11 277 9 0 .253 ARIZONA 12 14 .462 3.66 96 94 24 292.2 264 1252 137 119 29 11 7 14 114 15 312 12 1 .239 PHILADELPHIA 16 12 .571 3.72 95 93 22 264.0 222 1120 120 109 27 13 7 10 113 16 272 12 0 .227 LOS ANGELES 7 16 .304 3.74 97 93 30 281.1 247 1204 123 117 18 13 9 15 129 12 275 19 1 .238 MIAMI 19 19 .500 3.75 94 91 22 305.0 304 1337 139 127 24 15 9 10 129 18 303 18 2 .259 CINCINNATI 10 14 .417 3.84 95 91 28 244.0 215 1056 111 104 23 9 8 5 117 10 260 12 2 .234 COLORADO 13 16 .448 4.70 96 95 17 314.0 326 1369 175 164 38 12 17 13 118 8 257 20 2 .270 TOTALS 213 209 .505 3.48 1391 381 4244.0 3783 17935 1784 1641 349 163 116 159 1625 198 4043 211 18 .238
NL Pitching Leaders
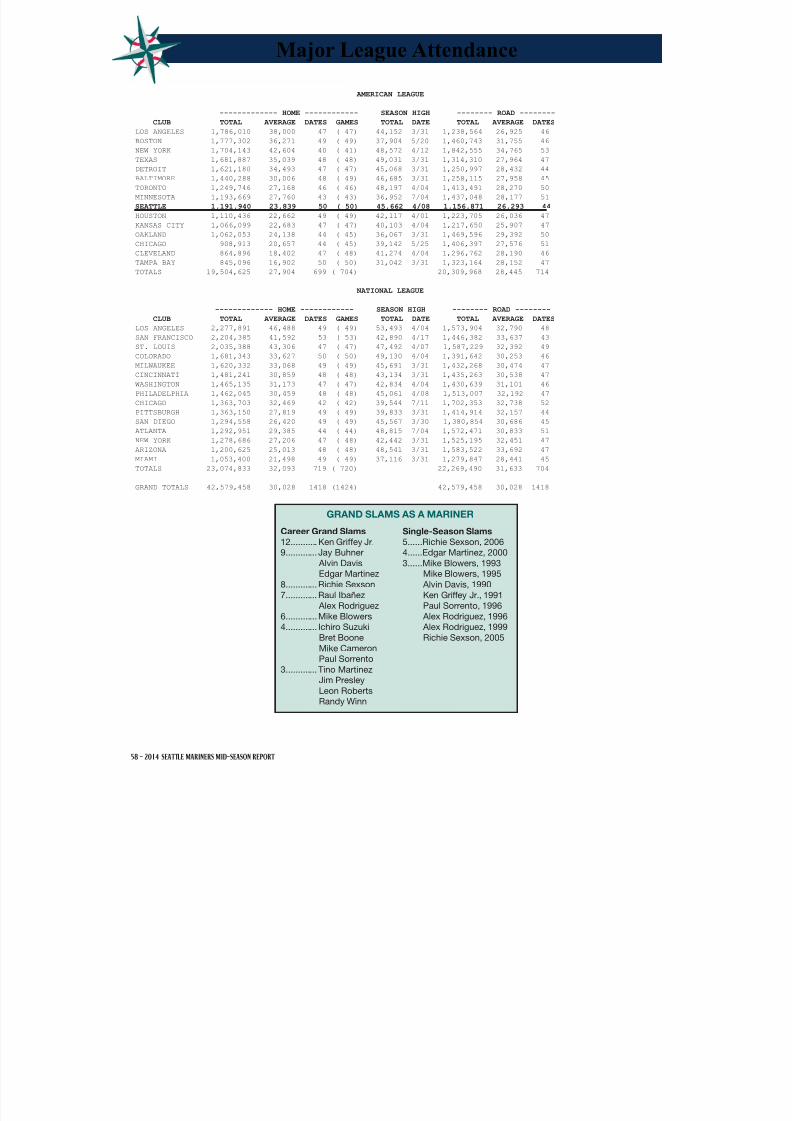
8/12/2019 2014 Mid-Season Report
http://slidepdf.com/reader/full/2014-mid-season-report 60/80
58 - 2014 SEATTLE MARINERS MID-SEASON REPORT
AMERICAN LEAGUE
------------- HOME ------------ SEASON HIGH -------- ROAD --------
CLUB TOTAL AVERAGE DATES GAMES TOTAL DATE TOTAL AVERAGE DATES
LOS ANGELES 1,786,010 38,000 47 ( 47) 44,152 3/31 1,238,564 26,925 46
BOSTON 1,777,302 36,271 49 ( 49) 37,904 5/20 1,460,743 31,755 46
NEW YORK 1,704,143 42,604 40 ( 41) 48,572 4/12 1,842,555 34,765 53 TEXAS 1,681,887 35,039 48 ( 48) 49,031 3/31 1,314,310 27,964 47
DETROIT 1,621,180 34,493 47 ( 47) 45,068 3/31 1,250,997 28,432 44
BALTIMORE 1,440,288 30,006 48 ( 49) 46,685 3/31 1,258,115 27,958 45
TORONTO 1,249,746 27,168 46 ( 46) 48,197 4/04 1,413,491 28,270 50
MINNESOTA 1,193,669 27,760 43 ( 43) 36,952 7/04 1,437,048 28,177 51
SEATTLE 1,191,940 23,839 50 ( 50) 45,662 4/08 1,156,871 26,293 44
HOUSTON 1,110,436 22,662 49 ( 49) 42,117 4/01 1,223,705 26,036 47
KANSAS CITY 1,066,099 22,683 47 ( 47) 40,103 4/04 1,217,650 25,907 47
OAKLAND 1,062,053 24,138 44 ( 45) 36,067 3/31 1,469,596 29,392 50
CHICAGO 908,913 20,657 44 ( 45) 39,142 5/25 1,406,397 27,576 51
CLEVELAND 864,896 18,402 47 ( 48) 41,274 4/04 1,296,762 28,190 46
TAMPA BAY 845,096 16,902 50 ( 50) 31,042 3/31 1,323,164 28,152 47
TOTALS 19,504,625 27,904 699 ( 704) 20,309,968 28,445 714
NATIONAL LEAGUE
------------- HOME ------------ SEASON HIGH -------- ROAD --------
CLUB TOTAL AVERAGE DATES GAMES TOTAL DATE TOTAL AVERAGE DATES
LOS ANGELES 2,277,891 46,488 49 ( 49) 53,493 4/04 1,573,904 32,790 48
SAN FRANCISCO 2,204,385 41,592 53 ( 53) 42,890 4/17 1,446,382 33,637 43
ST. LOUIS 2,035,388 43,306 47 ( 47) 47,492 4/07 1,587,229 32,392 49
COLORADO 1,681,343 33,627 50 ( 50) 49,130 4/04 1,391,642 30,253 46
MILWAUKEE 1,620,332 33,068 49 ( 49) 45,691 3/31 1,432,268 30,474 47
CINCINNATI 1,481,241 30,859 48 ( 48) 43,134 3/31 1,435,263 30,538 47
WASHINGTON 1,465,135 31,173 47 ( 47) 42,834 4/04 1,430,639 31,101 46
PHILADELPHIA 1,462,045 30,459 48 ( 48) 45,061 4/08 1,513,007 32,192 47
CHICAGO 1,363,703 32,469 42 ( 42) 39,544 7/11 1,702,353 32,738 52
PITTSBURGH 1,363,150 27,819 49 ( 49) 39,833 3/31 1,414,914 32,157 44
SAN DIEGO 1,294,558 26,420 49 ( 49) 45,567 3/30 1,380,854 30,686 45
ATLANTA 1,292,951 29,385 44 ( 44) 48,815 7/04 1,572,471 30,833 51
NEW YORK 1,278,686 27,206 47 ( 48) 42,442 3/31 1,525,195 32,451 47
ARIZONA 1,200,625 25,013 48 ( 48) 48,541 3/31 1,583,522 33,692 47 MIAMI 1,053,400 21,498 49 ( 49) 37,116 3/31 1,279,847 28,441 45
TOTALS 23,074,833 32,093 719 ( 720) 22,269,490 31,633 704
GRAND TOTALS 42,579,458 30,028 1418 (1424) 42,579,458 30,028 1418
Major League Attendance
Career Grand Slams
12........... Ken Griffey Jr.
9............. Jay Buhner
Alvin Davis
Edgar Martinez
8............. Richie Sexson
7............. Raul Ibañez
Alex Rodriguez
6............. Mike Blowers
4............. Ichiro Suzuki
Bret Boone
Mike Cameron
Paul Sorrento
3............. Tino Martinez
Jim Presley
Leon Roberts
Randy Winn
Single-Season Slams
5......Richie Sexson, 2006
4......Edgar Martinez, 2000
3......Mike Blowers, 1993
Mike Blowers, 1995
Alvin Davis, 1990
Ken Griffey Jr., 1991
Paul Sorrento, 1996
Alex Rodriguez, 1996
Alex Rodriguez, 1999
Richie Sexson, 2005
GRAND SLAMS AS A MARINER

8/12/2019 2014 Mid-Season Report
http://slidepdf.com/reader/full/2014-mid-season-report 61/80
59 - 2014 SEATTLE MARINERS MID-SEASON REPORT
GAME GAME SERIES SEASON
NO DATE DAY D/N OPPONENT ATTENDANCE TOTAL TOTAL NOTES/PROMOTIONS
1 4/8 Tue N LA Angels 45,662 * 45,662 Home Opener
2 4/9 Wed N LA Angels 16,468 62,130 62,130
3 4/11 Fri N Oakland 38,978 101,108 Supreme King’s Court
4 4/12 Sat N Oakland 22,073 123,181
5 4/13 Sun D Oakland 22,702 83,753 145,883
6 4/21 Mon N Houston 14,628 160,511 King’s Court
7 4/22 Tue N Houston 10,467 170,978
8 4/23 Wed D Houston 13,729 38,824 184,707
9 4/25 Fri N Texas 31,146 215,853 Beard Hat Night
10 4/26 Sat N Texas 30,042 245,895 King’s Court
11 4/27 Sun D Texas 26,307 87,495 272,202 Robinson Cano t-shirt
12 5/8 Thu N Kansas City 12,577 284,779
13 5/9 Fri N Kansas City 20,876 305,655 Ladies Night Out
14 5/10 Sat N Kansas City 29,373 335,028 Kyle Seager Bat Night
15 5/11 Sun D Kansas City 30,449 93,275 365,477 Mother’s Day / Little League Day
16 5/12 Mon N Tampa Bay 12,397 377,874 King’s Court
17 5/13 Tue N Tampa Bay 13,446 391,320
18 5/14 Wed D Tampa Bay 20,986 46,829 412,306
19 5/22 Thu N Houston 13,861 426,167 Sriachia Night
20 5/23 Fri N Houston 21,197 447,364 King’s Court / Guy’s Night Out
21 5/24 Sat N Houston 21,585 468,949 Turn Back the Clock (1979)
22 5/25 Sun D Houston 26,857 83,500 495,806
23 5/26 Mon D LA Angels 22,721 518,527 Memorial Day
24 5/27 Tue N LA Angels 13,064 531,591
25 5/28 Wed N LA Angels 13,904 545,495 King’s Court
26 5/29 Thu N LA Angels 11,659 61,348 557,154
27 5/30 Fri N Detroit 28,998 586,152 Fedora Night
28 5/31 Sat N Detroit 37,142 623,294 Robinson Cano Bobblehead
29 6/1 Sun D Detroit 31,405 97,545 654,699 Little League Day / Felix Poster30 6/10 Tue N NY Yankees 28,405 683,104 Jeter Presentation
31 6/11 Wed N NY Yankees 28,439 711,543
32 6/12 Thu N NY Yankees 40,595 97,439 752,138 Macklemore Bobblehead
33 6/13 Fri N Texas 22,073 774,211 King’s Court
34 6/14 Sat N Texas 27,702 801,913 King’s Court Train
35 6/15 Sun D Texas 39,215 88,990 841,128 Father’s Day
36 6/16 Mon N San Diego 17,516 858,644
37 6/17 Tue D San Diego 19,896 37,412 878,540 12:40 start
38 6/23 Mon N Boston 26,867 905,407 King’s Court
39 6/24 Tue N Boston 20,026 925,433
40 6/25 Wed N Boston 27,339 74,232 952,772 Mariners Socks
41 6/27 Fri N Cleveland 28,114 980,886 Fireworks Night
42 6/28 Sat N Cleveland 23,021 1,003,90743 6/29 Sun D Cleveland 26,174 77,309 1,030,081
44 7/7 Mon N Minnesota 18,562 1,048,643
45 7/8 Tue N Minnesota 14,158 1,062,801 Bark in the Park
46 7/9 Wed N Minnesota 16,465 1,079,266
47 7/10 Thu N Minnesota 14,530 63,715 1,093,796
48 7/11 Fri N Oakland 32,981 1,126,777 King’s Court / High Court
49 7/12 Sat N Oakland 39,204 1,165,981 Iwakuma Bobblehead
50 7/13 Sun D Oakland 25,959 98,144 1,191,940 Kid’s Run the Bases
* Sellout (1)
2014 Safeco Field Attendance

8/12/2019 2014 Mid-Season Report
http://slidepdf.com/reader/full/2014-mid-season-report 62/80
SEATTLE MARINERS2014 Minor League Mid-Season Report

8/12/2019 2014 Mid-Season Report
http://slidepdf.com/reader/full/2014-mid-season-report 63/80
2014 Minor League Mid-Season Report-- Stats & Records as of July 13, 2014 --
TEAM OVERALL STANDINGS FIRST HALF SECOND HALF
TACOMA – Pacfic Coast League 46-50, 3rd, -9.5 --JACKSON – Southern League 41-52, 4th, -15.5 31-38, 3rd, -14.5 10-14, T4th, -3.0HIGH DESERT – California League 45-49, 4th, -10.0 34-36, 3rd, -10.0 11-13, T3rd, -7.0CLINTON –
Midwest League 37-54, 7th, -24.0 30-38, 7th, -14.0 7-16, 7th, -10.0EVERETT – Northwest League 8-22, 4th, -14.0 --PULASKI – Appalachian League 13-11, T2nd, -0.5 --AZL MARINERS – Arizona League 9-10, 2nd, -5.0 --DSL MARINERS – Dominican Summer Lg. 17-20, 7th, -9.0 --VSL MARINERS – Venezuelan Summer Lg. 23-27, 3rd, -11.0 --*Division winner
BATTING TOP 10 (minimum 2.7 PA/team game)
BATTER CLUB AVG G AB R H HR RBI
Tanabe, Carlton PUL .380 20 79 13 30 0 13
Lara, Jordy HD .340 91 353 62 120 14 60
Fernandez, Rafael PUL .327 16 49 15 16 0 6
Jackson, Alex MAR .322 15 59 10 19 1 12
Peterson, D.J. JXN .319 80 335 59 107 21 80
Taylor, Chris TAC .315 67 270 57 85 5 36
Taylor, Wayne PUL .313 20 80 16 25 3 16
Wawoe, Gianfranco PUL .308 22 78 17 24 0 8
Franklin, Nick TAC .306 62 232 36 71 9 41
Henry, Jabari HD .305 72 272 53 83 18 58
PITCHING TOP 10 (minimum 0.8 IP/team game)
PITCHER CLUB W-L ERA IP H BB SO
Medina, Jeffeson EVE 0-3 3.12 26.0 27 10 19
Zokan, Jake EVE 2-2 3.12 34.2 36 7 30
Pries, Jordan TAC 7-5 3.24 105.2 86 35 81
Pereira, Ricardo PUL 1-3 3.29 27.1 26 8 17
Hobson, Cam JXN 5-7 3.53 89.1 97 33 44
Scott, Troy PUL 2-2 3.54 28.0 34 5 25
Diaz, Edwin CLI 2-5 3.58 78.0 72 34 71
Misell, Carlos CLI 7-8 4.08 86.0 99 29 63
Olson, Tyler JXN 5-6 4.21 94.0 94 24 88
Morales, Osmel MAR 1-1 4.26 19.0 20 7 23
HOME RUNS
Peterson, D.J. JXN 21
Henry, Jabari HD 18
Blash, Jabari TAC 17
Kivlehan, Patrick JXN 15
Lara,
Jordy HD 14
RBI
Peterson, D.J. JXN 80
Kivlehan, Patrick JXN 75
Guerrero, Gabby HD 60
Lara, Jordy HD 60
Kelly, Ty TAC 59
STOLEN BASES
Reinheimer, Jack CLI 28
Avery, Xavier TAC 25
Barbosa, Aaron CLI 24
Landry, Leon JXN 20
Witherspoon, Travis HD 20
TEAM BATTING AVG AB R H HR BB SO SB CS
High Desert .283 3334 579 942 112 341 757 114 43
Tacoma .281 3297 495 926 89 354 721 77 38
Jackson .263 3105 398 818 52 284 581 86 35
Pulaski .263 818 130 215 6 91 202 43 17
Clinton .253 3049 412 770 54 290 690 93 27
AZL Mariners .239 690 112 165 8 89 223 15 7
Everett .235 1033 119 243 16 119 275 31 14
WINS
Misell, Carlos CLI 7
Pries, Jordan TAC 7
Anderson, Matt JXN 6
9 others tied at 5.
SAVESPagan, Emilio CLI 9
Bawcom, Logan TAC 6
Guaipe, Mayckol JXN 6
Kohlscheen, Stephen TAC 6
Mathis, Will HD 6
STRIKEOUTS
Olson, Tyler JXN 88
Gillheeney, James TAC 84
Pries, Jordan TAC 81
Unsworth, Dylan HD 80
Kittredge, Andrew EVE 77
TEAM PITCHING W-L ERA H CG SHO SV HR BB SO
Pulaski 13-11 3.86 203 0 2 9 15 73 209
Jackson 41-52 4.12 804 1 7 21 65 302 640
Everett 8-22 4.27 272 0 0 4 13 119 233
Clinton 37-54 4.36 823 1 5 20 51 342 612
Tacoma 46-50 4.61 881 2 6 23 92 344 712
AZL Mariners 9-10 5.18 174 0 0 4 4 108 167
High Desert 45-49 5.24 916 0 4 21 105 355 764

8/12/2019 2014 Mid-Season Report
http://slidepdf.com/reader/full/2014-mid-season-report 64/80
Seattle Mariners -- 2014 Minor League Awards
MLB ALL-STAR FUTURES GAME
Seattle Mariners minor league infielder D.J. Peterson played for the U.S. squad, while outfielder Gabby Guerrero represented the Wo
team in the 16th annual SiriusXM All-Star Futures Game on Sunday, July 13 at Target Field in Minneapolis as part of All-Star weekenPeterson started at 1B and batted in the 6th position in the lineup, going 1-for-2 with a double. Guerrero hit 7th as the World team’s startiDH, going 0-for-2 at the plate.
The Mariners have had 31 selections to the Futures Game since its first began in 1999. Six players on the current 25-man roster (+DL) playin the Futures Game in the past: Robinson Cano (2003-04), Corey Hart (2002), Felix Hernandez (2004), Logan Morrison (2010), JamPaxton (2011) and Michael Saunders (2007). Brad Miller was selected to the 2013 U.S. Team, but was unable to play due to his promotito the Major League squad. Cano (All-Star: 2006, 2010-13, Futures Game: 2003 & 2004), Hart (All-Star: 2008 & 2010, Futures Game: 200and Hernandez (All-Star: 2009, 2011-13; Futures Game: 2004) are each one of 115 players to have competed in both the SiriusXM All-StFutures Game and the Major League Baseball All-Star Game.
The SiriusXM All-Star Futures Game, which is now in its 16th year, features the top Minor League prospects competing in a nine-innincontest as part of Taco Bell All-Star Sunday. The U.S. Team, which has won each of the last 5 contests, leads the all-time series, 10-6.
Major League Baseball, in conjunction with the Major League Baseball Scouting Bureau, MLB.com, Baseball America and the 30 MajLeague Clubs, selected the 25 players currently on each team. Each Major League organization is represented and players from all fuseason Minor Leagues were eligible to participate.
FUTURES GAME ALL-STARS
INF D.J. Peterson - Team USA (1x2, 2B)OF Gabby Guerrero - World Team (0x2)
PLAYERS/PITCHERS OF THE WEEK
Patrick Kivlehan, INF High Desert – California League (April 14-20)Jordy Lara, INF High Desert – California League (April 21-27)Cam Hobson, LHP Jackson – Southern League (April 28-May 4)Austin Wilson, OF Clinton – Midwest League (April 28-May 4)D.J. Peterson, INF High Desert – California League (May 26-June 1)Tyler Pike, LHP High Desert – California League (May 26-June 1)Brett Shankin, RHP High Desert – California League (June 2-8)Andrew Kittredge, RHP High Desert – California League (June 9-15)D.J. Peterson, INF High Desert – California League (June 16-22)
Dylan Unsworth, RHP High Desert – California League (June 16-22)Taijuan Walker , RHP Tacoma – PCL (June 23-29)Daniel Missaki, RHP Pulaski – Appalachian League (June 23-29)Victor Sanchez, RHP Jackson – Southern League (July 7-13)
MID-SEASON ALL-STARS
Pacific Coast League (Tacoma):SS Chris Taylor (Starter) 3B Gabriel Noriega (Starter) INF Nick FranklinRHP Logan Kensing
Southern League (Jackson):SS Ketel Marte (2x5)
RHP Mayckol Guiape (1.0,1,0,0,0,1) RHP Stephen Kohlscheen (Did not participate due to AAA promotion).
California League (High Desert):OF Gabriel Guerrero (0x2)
Midwest League (Clinton):C Marcus Littlewood (0x1, RBI, BB, SF)SS Jack Reinheimer (0x2)RHP Edwin Diaz (1.0,0,0,0,1,1)RHP Emilio Pagan (0.2,0,0,0,0,1)
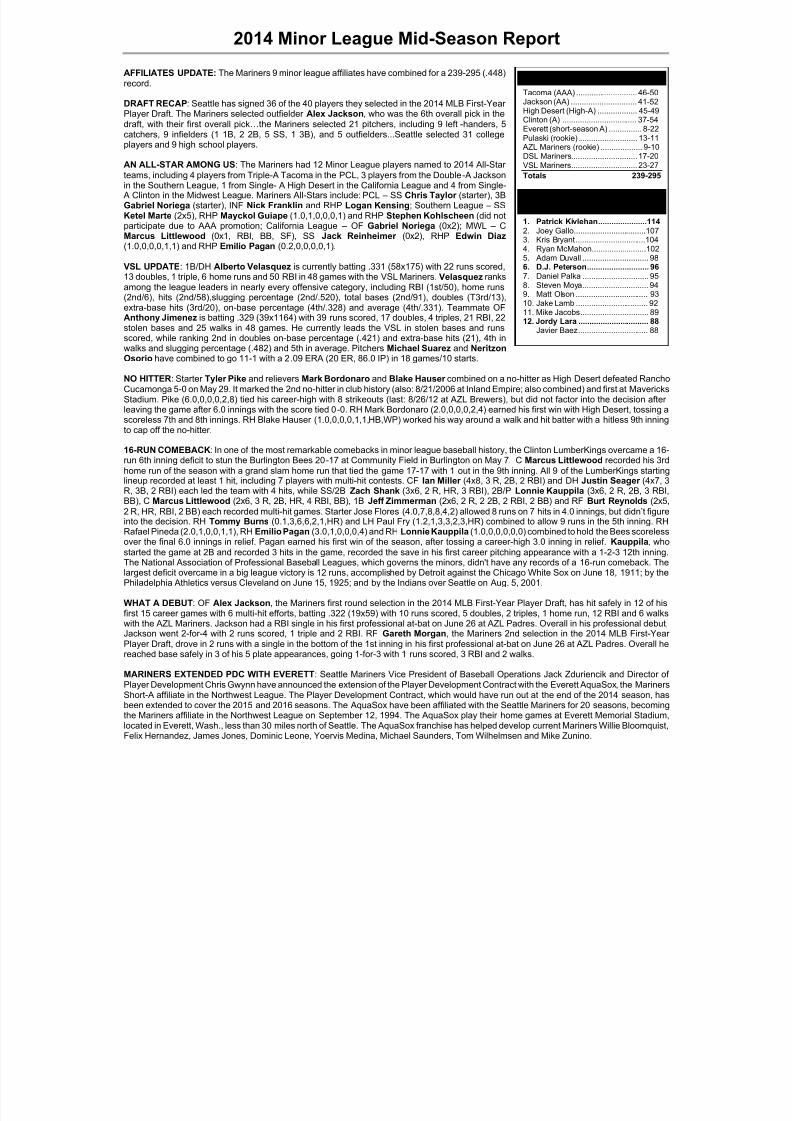
8/12/2019 2014 Mid-Season Report
http://slidepdf.com/reader/full/2014-mid-season-report 65/80
2014 Minor League Mid-Season Report
AFFILIATES UPDATE: The Mariners 9 minor league affiliates have combined for a 239-295 (.448)record.
DRAFT RECAP: Seattle has signed 36 of the 40 players they selected in the 2014 MLB First-YearPlayer Draft. The Mariners selected outfielder Alex Jackson, who was the 6th overall pick in thedraft, with their first overall pick…the Mariners selected 21 pitchers, including 9 left -handers, 5catchers, 9 infielders (1 1B, 2 2B, 5 SS, 1 3B), and 5 outfielders...Seattle selected 31 collegeplayers and 9 high school players.
AN ALL-STAR AMONG US: The Mariners had 12 Minor League players named to 2014 All-Star
teams, including 4 players from Triple-A Tacoma in the PCL, 3 players from the Double-A Jacksonin the Southern League, 1 from Single- A High Desert in the California League and 4 from Single-
A Clinton in the Midwest League. Mariners All-Stars include: PCL – SS Chris Taylor (starter), 3BGabriel Noriega (starter), INF Nick Franklin and RHP Logan Kensing; Southern League – SSKetel Marte (2x5), RHP Mayckol Guiape (1.0,1,0,0,0,1) and RHP Stephen Kohlscheen (did notparticipate due to AAA promotion; California League – OF Gabriel Noriega (0x2); MWL – CMarcus Littlewood (0x1, RBI, BB, SF), SS Jack Reinheimer (0x2), RHP Edwin Diaz (1.0,0,0,0,1,1) and RHP Emilio Pagan (0.2,0,0,0,0,1).
VSL UPDATE: 1B/DH Alberto Velasquez is currently batting .331 (58x175) with 22 runs scored,13 doubles, 1 triple, 6 home runs and 50 RBI in 48 games with the VSL Mariners. Velasquez ranksamong the league leaders in nearly every offensive category, including RBI (1st/50), home runs
(2nd/6), hits (2nd/58),slugging percentage (2nd/.520), total bases (2nd/91), doubles (T3rd/13),extra-base hits (3rd/20), on-base percentage (4th/.328) and average (4th/.331). Teammate OFAnthony Jimenez is batting .329 (39x1164) with 39 runs scored, 17 doubles, 4 triples, 21 RBI, 22stolen bases and 25 walks in 48 games. He currently leads the VSL in stolen bases and runsscored, while ranking 2nd in doubles on-base percentage (.421) and extra-base hits (21), 4th inwalks and slugging percentage (.482) and 5th in average. Pitchers Michael Suarez and NeritzonOsorio have combined to go 11-1 with a 2.09 ERA (20 ER, 86.0 IP) in 18 games/10 starts.
NO HITTER: Starter Tyler Pike and relievers Mark Bordonaro and Blake Hauser combined on a no-hitter as High Desert defeated RancCucamonga 5-0 on May 29. It marked the 2nd no-hitter in club history (also: 8/21/2006 at Inland Empire; also combined) and first at MavericStadium. Pike (6.0,0,0,0,2,8) tied his career-high with 8 strikeouts (last: 8/26/12 at AZL Brewers), but did not factor into the decision aftleaving the game after 6.0 innings with the score tied 0-0. RH Mark Bordonaro (2.0,0,0,0,2,4) earned his first win with High Desert, tossingscoreless 7th and 8th innings. RH Blake Hauser (1.0,0,0,0,1,1,HB,WP) worked his way around a walk and hit batter with a hitless 9th innito cap off the no-hitter.
16-RUN COMEBACK: In one of the most remarkable comebacks in minor league baseball history, the Clinton LumberKings overcame a 1run 6th inning deficit to stun the Burlington Bees 20-17 at Community Field in Burlington on May 7. C Marcus Littlewood recorded his 3
home run of the season with a grand slam home run that tied the game 17-17 with 1 out in the 9th inning. All 9 of the LumberKings startilineup recorded at least 1 hit, including 7 players with multi-hit contests. CF Ian Miller (4x8, 3 R, 2B, 2 RBI) and DH Justin Seager (4x7R, 3B, 2 RBI) each led the team with 4 hits, while SS/2B Zach Shank (3x6, 2 R, HR, 3 RBI), 2B/P Lonnie Kauppila (3x6, 2 R, 2B, 3 RBBB), C Marcus Littlewood (2x6, 3 R, 2B, HR, 4 RBI, BB), 1B Jeff Zimmerman (2x6, 2 R, 2 2B, 2 RBI, 2 BB) and RF Burt Reynolds (2x
2 R, HR, RBI, 2 BB) each recorded multi-hit games. Starter Jose Flores (4.0,7,8,8,4,2) allowed 8 runs on 7 hits in 4.0 innings, but didn’t figuinto the decision. RH Tommy Burns (0.1,3,6,6,2,1,HR) and LH Paul Fry (1.2,1,3,3,2,3,HR) combined to allow 9 runs in the 5th inning. RRafael Pineda (2.0,1,0,0,1,1), RH Emilio Pagan (3.0,1,0,0,0,4) and RH Lonnie Kauppila (1.0,0,0,0,0,0) combined to hold the Bees scoreleover the final 6.0 innings in relief. Pagan earned his first win of the season, after tossing a career-high 3.0 inning in relief. Kauppila, w
started the game at 2B and recorded 3 hits in the game, recorded the save in his first career pitching appearance with a 1-2-3 12th inninThe National Association of Professional Baseball Leagues, which governs the minors, didn't have any records of a 16-run comeback. Tlargest deficit overcame in a big league victory is 12 runs, accomplished by Detroit against the Chicago White Sox on June 18, 1911; by tPhiladelphia Athletics versus Cleveland on June 15, 1925; and by the Indians over Seattle on Aug. 5, 2001.
WHAT A DEBUT: OF Alex Jackson, the Mariners first round selection in the 2014 MLB First-Year Player Draft, has hit safely in 12 of hfirst 15 career games with 6 multi-hit efforts, batting .322 (19x59) with 10 runs scored, 5 doubles, 2 triples, 1 home run, 12 RBI and 6 walwith the AZL Mariners. Jackson had a RBI single in his first professional at-bat on June 26 at AZL Padres. Overall in his professional debJackson went 2-for-4 with 2 runs scored, 1 triple and 2 RBI. RF Gareth Morgan, the Mariners 2nd selection in the 2014 MLB First-YePlayer Draft, drove in 2 runs with a single in the bottom of the 1st inning in his first professional at-bat on June 26 at AZL Padres. Overall reached base safely in 3 of his 5 plate appearances, going 1-for-3 with 1 runs scored, 3 RBI and 2 walks.
MARINERS EXTENDED PDC WITH EVERETT: Seattle Mariners Vice President of Baseball Operations Jack Zduriencik and Director Player Development Chris Gwynn have announced the extension of the Player Development Contract with the Everett AquaSox, the MarineShort-A affiliate in the Northwest League. The Player Development Contract, which would have run out at the end of the 2014 season, hbeen extended to cover the 2015 and 2016 seasons. The AquaSox have been affiliated with the Seattle Mariners for 20 seasons, becomithe Mariners affiliate in the Northwest League on September 12, 1994. The AquaSox play their home games at Everett Memorial Stadiulocated in Everett, Wash., less than 30 miles north of Seattle. The AquaSox franchise has helped develop current Mariners Willie BloomquiFelix Hernandez, James Jones, Dominic Leone, Yoervis Medina, Michael Saunders, Tom Wilhelmsen and Mike Zunino.
On the Farm:
Tacoma (AAA) ............................ 46-50Jackson (AA) .............................. 41-52High Desert (High-A) .................. 45-49Clinton (A) .................................. 37-54Everett (short-season A) ............... 8-22Pulaski (rookie) ........................... 13-11
AZL Mariners (rookie) ................... 9-10DSL Mariners .............................. 17-20VSL Mariners .............................. 23-27
Totals 239-295
MOST MiLB RBISINCE 8/1/13:
1. Patrick Kivlehan ......................1142. Joey Gallo.................................1073. Kris Bryant ................................1044. Ryan McMahon.........................1025. Adam Duvall .............................. 986. D.J. Peterson ............................ 967. Daniel Palka .............................. 958. Steven Moya .............................. 949. Matt Olson ................................. 93
10. Jake Lamb ................................. 9211. Mike Jacobs............................... 8912. Jordy Lara ................................ 88
Javier Baez ................................ 88
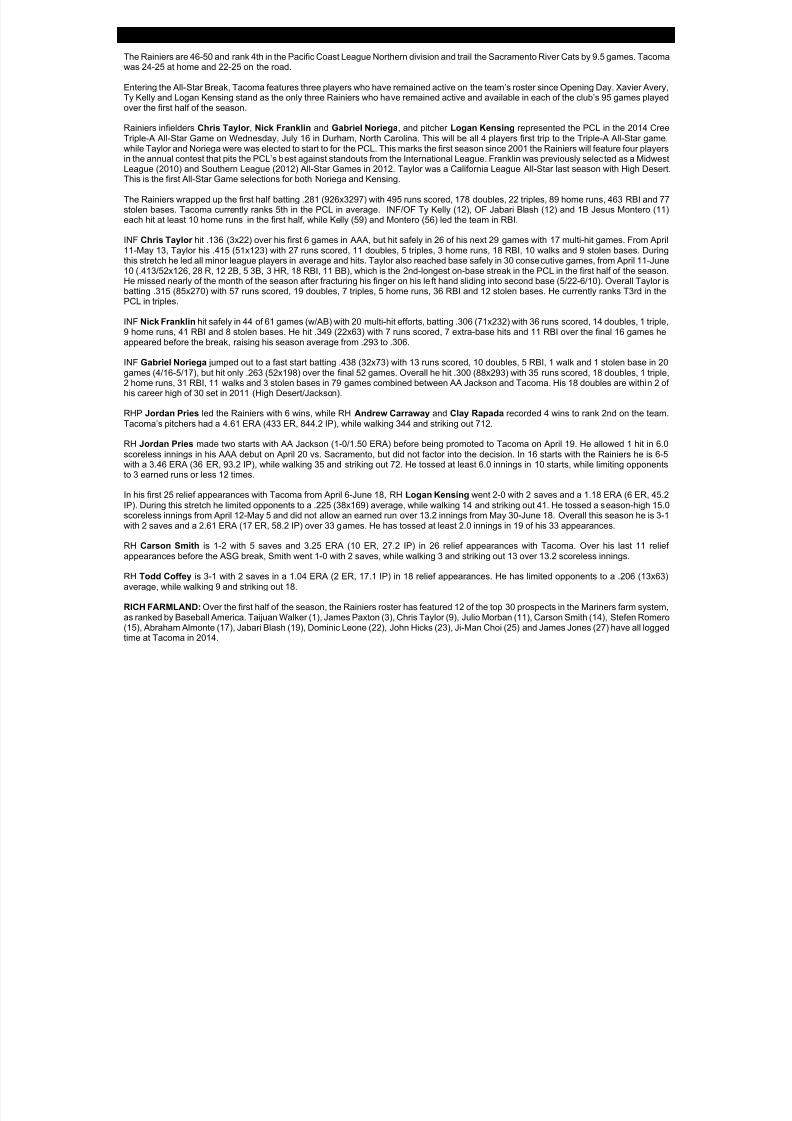
8/12/2019 2014 Mid-Season Report
http://slidepdf.com/reader/full/2014-mid-season-report 66/80
AAA TACOMA RAINIERS – PACIFIC COAST LEAGUE
The Rainiers are 46-50 and rank 4th in the Pacific Coast League Northern division and trail the Sacramento River Cats by 9.5 games. Tacomwas 24-25 at home and 22-25 on the road.
Entering the All-Star Break, Tacoma features three players who have remained active on the team’s roster since Opening Day. Xavier AveTy Kelly and Logan Kensing stand as the only three Rainiers who have remained active and available in each of the club’s 95 games playover the first half of the season.
Rainiers infielders Chris Taylor , Nick Franklin and Gabriel Noriega, and pitcher Logan Kensing represented the PCL in the 2014 CrTriple-A All-Star Game on Wednesday, July 16 in Durham, North Carolina. This will be all 4 players first trip to the Triple-A All-Star gam
while Taylor and Noriega were was elected to start to for the PCL. This marks the first season since 2001 the Rainiers will feature four playein the annual contest that pits the PCL’s best against standouts from the International League. Franklin was previously selected as a MidweLeague (2010) and Southern League (2012) All-Star Games in 2012. Taylor was a California League All-Star last season with High DeseThis is the first All-Star Game selections for both Noriega and Kensing.
The Rainiers wrapped up the first half batting .281 (926x3297) with 495 runs scored, 178 doubles, 22 triples, 89 home runs, 463 RBI and stolen bases. Tacoma currently ranks 5th in the PCL in average. INF/OF Ty Kelly (12), OF Jabari Blash (12) and 1B Jesus Montero (1each hit at least 10 home runs in the first half, while Kelly (59) and Montero (56) led the team in RBI.
INF Chris Taylor hit .136 (3x22) over his first 6 games in AAA, but hit safely in 26 of his next 29 games with 17 multi-hit games. From Ap11-May 13, Taylor his .415 (51x123) with 27 runs scored, 11 doubles, 5 triples, 3 home runs, 18 RBI, 10 walks and 9 stolen bases. Durithis stretch he led all minor league players in average and hits. Taylor also reached base safely in 30 consecutive games, from April 11-Ju10 (.413/52x126, 28 R, 12 2B, 5 3B, 3 HR, 18 RBI, 11 BB), which is the 2nd-longest on-base streak in the PCL in the first half of the seasoHe missed nearly of the month of the season after fracturing his finger on his left hand sliding into second base (5/22-6/10). Overall Taylorbatting .315 (85x270) with 57 runs scored, 19 doubles, 7 triples, 5 home runs, 36 RBI and 12 stolen bases. He currently ranks T3rd in th
PCL in triples.
INF Nick Franklin hit safely in 44 of 61 games (w/AB) with 20 multi-hit efforts, batting .306 (71x232) with 36 runs scored, 14 doubles, 1 trip9 home runs, 41 RBI and 8 stolen bases. He hit .349 (22x63) with 7 runs scored, 7 extra-base hits and 11 RBI over the final 16 games happeared before the break, raising his season average from .293 to .306.
INF Gabriel Noriega jumped out to a fast start batting .438 (32x73) with 13 runs scored, 10 doubles, 5 RBI, 1 walk and 1 stolen base in 2games (4/16-5/17), but hit only .263 (52x198) over the final 52 games. Overall he hit .300 (88x293) with 35 runs scored, 18 doubles, 1 trip2 home runs, 31 RBI, 11 walks and 3 stolen bases in 79 games combined between AA Jackson and Tacoma. His 18 doubles are within 2his career high of 30 set in 2011 (High Desert/Jackson).
RHP Jordan Pries led the Rainiers with 6 wins, while RH Andrew Carraway and Clay Rapada recorded 4 wins to rank 2nd on the teaTacoma’s pitchers had a 4.61 ERA (433 ER, 844.2 IP), while walking 344 and striking out 712.
RH Jordan Pries made two starts with AA Jackson (1-0/1.50 ERA) before being promoted to Tacoma on April 19. He allowed 1 hit in 6
scoreless innings in his AAA debut on April 20 vs. Sacramento, but did not factor into the decision. In 16 starts with the Rainiers he is 6with a 3.46 ERA (36 ER, 93.2 IP), while walking 35 and striking out 72. He tossed at least 6.0 innings in 10 starts, while limiting opponento 3 earned runs or less 12 times.
In his first 25 relief appearances with Tacoma from April 6-June 18, RH Logan Kensing went 2-0 with 2 saves and a 1.18 ERA (6 ER, 45IP). During this stretch he limited opponents to a .225 (38x169) average, while walking 14 and striking out 41. He tossed a season-high 15scoreless innings from April 12-May 5 and did not allow an earned run over 13.2 innings from May 30-June 18. Overall this season he is 3with 2 saves and a 2.61 ERA (17 ER, 58.2 IP) over 33 games. He has tossed at least 2.0 innings in 19 of his 33 appearances.
RH Carson Smith is 1-2 with 5 saves and 3.25 ERA (10 ER, 27.2 IP) in 26 relief appearances with Tacoma. Over his last 11 relappearances before the ASG break, Smith went 1-0 with 2 saves, while walking 3 and striking out 13 over 13.2 scoreless innings.
RH Todd Coffey is 3-1 with 2 saves in a 1.04 ERA (2 ER, 17.1 IP) in 18 relief appearances. He has limited opponents to a .206 (13x6average, while walking 9 and striking out 18.
RICH FARMLAND: Over the first half of the season, the Rainiers roster has featured 12 of the top 30 prospects in the Mariners farm systeas ranked by Baseball America. Taijuan Walker (1), James Paxton (3), Chris Taylor (9), Julio Morban (11), Carson Smith (14), Stefen Rome(15), Abraham Almonte (17), Jabari Blash (19), Dominic Leone (22), John Hicks (23), Ji-Man Choi (25) and James Jones (27) have all loggtime at Tacoma in 2014.

8/12/2019 2014 Mid-Season Report
http://slidepdf.com/reader/full/2014-mid-season-report 67/80
AA JACKSON GENERALS – SOUTHERN LEAGUE
The Generals went 41-52 prior to the Double-A All-Star break, including going 31-38 finishing 3rd in the Southern League Northern divisiin the first half.
SS Ketel Marte, RHP Stephen Kohlscheen (did not play due to promotion to AAA) and RHP Mayckol Guiape were selected the NoDivision All-Star team. Marte and Guiape represented Jackson at the All-Star Game in Chattanooga at AT&T Field on June 17. It marked tfirst time for each player to be named All-Star team in any level of their professional career.
The Generals pitching staff has a 4.12 ERA so far this season, while striking out 640 batters in 817.2 innings. LH Cam Hobson and RVictor Sanchez and RH Stephen Shackleford each lead the team with 5 wins, while RH Mayckol Guiape and RH Stephen Kohlsche
each recorded a team-high 6 saves.
RH Victor Sanchez, in his first season in AA, is 5-4 with a 3.79 ERA (31 ER, 73.2 IP) in 14 starts. He limited opponents to a .257 (72x280
while walking 19 and striking out 60. He held opponents to 2 earned runs or less in 9 of his 14 games started. Sanchez was named SoutheLeague Pitcher of the Week, July 7-13, after allowing 1 run on 3 hits and striking out a season-high 9 batters in 8.0 innings to earn the won July 12 vs. Birmingham.
RH Stephen Kohlscheen went 1-1 with a 2.25 ERA (8 ER, 32.0 IP) in 23 relief appearances with Jackson before being promoted to Tacom(4/3-6/13). From April 7-June 30, Kohlscheen allowed only 3 earned runs over 27.0 innings (1.00 ERA). During this stretch he limitopponents to a .220 (22x100) average, while walking 4 and striking out 27. Overall between Jackson and Tacoma, he is 3-1 with 6 saveand a 2.64 ERA (14 ER, 47.2 IP) in 33 relief appearances.
RH Mayckol Guaipe went 1-0 with 1 save, while tossing 16.0 scoreless innings over 9 games in April. Overall he has held opponenscoreless in 21 of 25 relief appearances, going 1-2 with 6 saves and a 2.52 ERA (11 ER, 39.1 IP). He has limited opponents to a .20(30x144) average, while walking 7 and striking out 34.
The Mavericks are currently batting .263 (818x3105) with 398 runs scored, 170 doubles, 33 triples, 52 home runs and 369 home runs in 9games. In the Southern League currently ranks 2nd in doubles and triple, but 8th in the league in home runs.
INF Ketel Marte hit safely in 68 of 87 games he appeared with 27 multi-hit efforts, batting .300 (106x353) with 47 runs scored, 21 double5 triple, 35 RBI, 16 walks and 18 stolen bases. He currently leads the Southern League in hits and at-bats, while ranking 8th in average. H21 doubles are already most in his career in a single season, while closing on setting career highs in at-bats, triples, RBI and stolen bases
INF Patrick Kivlehan began the season with High Desert, .282 (40x142) with 24 runs scored, 9 doubles, 2 triples, 9 home runs and 35 Rin 34 games before being promoted to Jackson on May 10. Kivlehan recorded a 17-game hit streak, which is the 2nd-longest in the SoutheLeague this season, batting .438 (28x64) with 13 runs scored, 9 doubles, 1 triple, 2 home runs, 20 RBI and 7 walks from June 3-23. He alreached base safely in 29 straight games from May 22-June 23, which was the 2nd-longest streak so far in the league (.381/40x105, 18 10 2B, 2 3B, 4 HR, 28 RBI, 14 BB). Overall is batting .306 (64x209) with 35 runs scored, 12 doubles, 3 triples, 6 home runs, 40 RBI, 26 waand 6 stolen bases in 58 games with Jackson.
INF D.J. Peterson was promoted from A High Desert to Jackson on June 24. He hit safely in 14 of his first 15 games, batting .290 (18x6with 8 runs scored, 4 doubles, 3 home runs, 7 RBI and 4 walks. Since May 8, Peterson led all minor league players with 64 RBI, while rankiT2nd with 19 home runs (.343/79x290, 44 R, 23 2B, 19 HR, 64 RBI, 21 BB, 4 SB). Overall this season he is batting .319 (107x335) with runs scored, 27 doubles, 1 triple, 21 home runs and 80 RBI in 80 games combined between High Desert and Jackson. He is one of 10 minleague players to already hit 20 home runs, while ranking 2nd in the minor leagues with 80 RBI.
In 65 games with the Mavericks, Peterson hit .326 (89x273) with 51 runs scored, 23 doubles, 1 triple, 18 home runs, 73 RBI, 23 walks andstolen bases. At the time of his promotion, he ranked among the California League leaders in nearly every offensive category, includinslugging percentage (1st/.615), total bases (1st/168), RBI (1st/71), extra-base hits (T1st/42), home runs (2nd/18), doubles (3rd/23), h(T5th/89) and average (6th/.326). Peterson hit 16 of his 18 home runs with High Desert over 37 games (5/11-6/23). He hit safely in eachhis final 10 games with 8 multi-hit efforts, batting .442 (19x43) with 11 runs scored, 7 doubles, 6 home runs, 22 RBI, 5 walks and 1 stolbase (6/9-23). He also hit safely 20 of his last 22 games, batting .424 (39x92) with 22 runs scored, 13 doubles, 9 home runs, 35 RBI, 1walks and 2 stolen bases (5/28-/623). Between May 8 and June 23 he hit .363 (61x168) with 36 runs scored, 19 doubles, 16 home runs, RBI, 17 walks and 4 stolen bases. During this stretch he has raised his season batting average from .267 to .326.
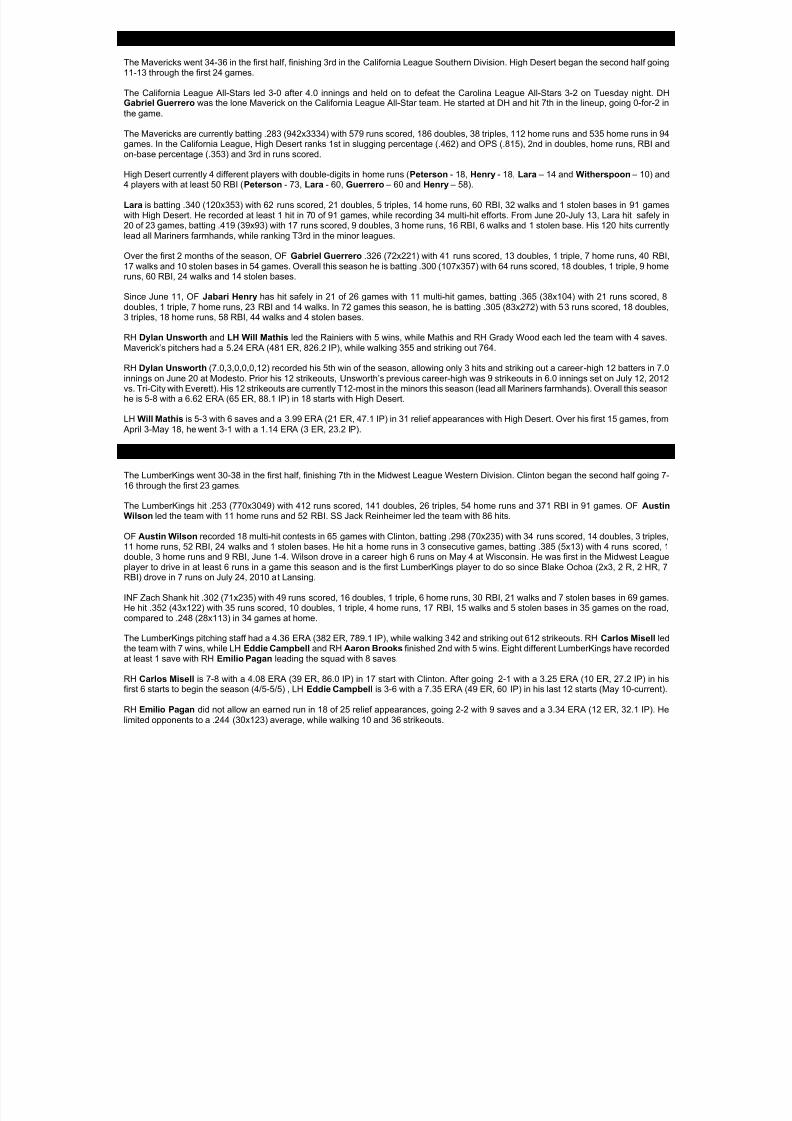
8/12/2019 2014 Mid-Season Report
http://slidepdf.com/reader/full/2014-mid-season-report 68/80
A HIGH DESERT MAVERICKS – CALIFORNIA LEAGUE
The Mavericks went 34-36 in the first half, finishing 3rd in the California League Southern Division. High Desert began the second half goi11-13 through the first 24 games.
The California League All-Stars led 3-0 after 4.0 innings and held on to defeat the Carolina League All-Stars 3-2 on Tuesday night. DGabriel Guerrero was the lone Maverick on the California League All-Star team. He started at DH and hit 7th in the lineup, going 0-for-2
the game.
The Mavericks are currently batting .283 (942x3334) with 579 runs scored, 186 doubles, 38 triples, 112 home runs and 535 home runs in games. In the California League, High Desert ranks 1st in slugging percentage (.462) and OPS (.815), 2nd in doubles, home runs, RBI aon-base percentage (.353) and 3rd in runs scored.
High Desert currently 4 different players with double-digits in home runs (Peterson - 18, Henry - 18, Lara – 14 and Witherspoon – 10) a4 players with at least 50 RBI (Peterson - 73, Lara - 60, Guerrero – 60 and Henry – 58).
Lara is batting .340 (120x353) with 62 runs scored, 21 doubles, 5 triples, 14 home runs, 60 RBI, 32 walks and 1 stolen bases in 91 gamwith High Desert. He recorded at least 1 hit in 70 of 91 games, while recording 34 multi-hit efforts. From June 20-July 13, Lara hit safely20 of 23 games, batting .419 (39x93) with 17 runs scored, 9 doubles, 3 home runs, 16 RBI, 6 walks and 1 stolen base. His 120 hits currenlead all Mariners farmhands, while ranking T3rd in the minor leagues.
Over the first 2 months of the season, OF Gabriel Guerrero .326 (72x221) with 41 runs scored, 13 doubles, 1 triple, 7 home runs, 40 RB17 walks and 10 stolen bases in 54 games. Overall this season he is batting .300 (107x357) with 64 runs scored, 18 doubles, 1 triple, 9 homruns, 60 RBI, 24 walks and 14 stolen bases.
Since June 11, OF Jabari Henry has hit safely in 21 of 26 games with 11 multi-hit games, batting .365 (38x104) with 21 runs scored,doubles, 1 triple, 7 home runs, 23 RBI and 14 walks. In 72 games this season, he is batting .305 (83x272) with 53 runs scored, 18 double3 triples, 18 home runs, 58 RBI, 44 walks and 4 stolen bases.
RH Dylan Unsworth and LH Will Mathis led the Rainiers with 5 wins, while Mathis and RH Grady Wood each led the team with 4 saveMaverick’s pitchers had a 5.24 ERA (481 ER, 826.2 IP), while walking 355 and striking out 764.
RH Dylan Unsworth (7.0,3,0,0,0,12) recorded his 5th win of the season, allowing only 3 hits and striking out a career-high 12 batters in 7innings on June 20 at Modesto. Prior his 12 strikeouts, Unsworth’s previous career -high was 9 strikeouts in 6.0 innings set on July 12, 20vs. Tri-City with Everett). His 12 strikeouts are currently T12-most in the minors this season (lead all Mariners farmhands). Overall this seashe is 5-8 with a 6.62 ERA (65 ER, 88.1 IP) in 18 starts with High Desert.
LH Will Mathis is 5-3 with 6 saves and a 3.99 ERA (21 ER, 47.1 IP) in 31 relief appearances with High Desert. Over his first 15 games, fro April 3-May 18, he went 3-1 with a 1.14 ERA (3 ER, 23.2 IP).
A CLINTON LUMBERKINGS –
MIDWEST LEAGUE
The LumberKings went 30-38 in the first half, finishing 7th in the Midwest League Western Division. Clinton began the second half going 16 through the first 23 games.
The LumberKings hit .253 (770x3049) with 412 runs scored, 141 doubles, 26 triples, 54 home runs and 371 RBI in 91 games. OF AustWilson led the team with 11 home runs and 52 RBI. SS Jack Reinheimer led the team with 86 hits.
OF Austin Wilson recorded 18 multi-hit contests in 65 games with Clinton, batting .298 (70x235) with 34 runs scored, 14 doubles, 3 triple11 home runs, 52 RBI, 24 walks and 1 stolen bases. He hit a home runs in 3 consecutive games, batting .385 (5x13) with 4 runs scoreddouble, 3 home runs and 9 RBI, June 1-4. Wilson drove in a career high 6 runs on May 4 at Wisconsin. He was first in the Midwest Leagplayer to drive in at least 6 runs in a game this season and is the first LumberKings player to do so since Blake Ochoa (2x3, 2 R, 2 HRRBI) drove in 7 runs on July 24, 2010 at Lansing.
INF Zach Shank hit .302 (71x235) with 49 runs scored, 16 doubles, 1 triple, 6 home runs, 30 RBI, 21 walks and 7 stolen bases in 69 gameHe hit .352 (43x122) with 35 runs scored, 10 doubles, 1 triple, 4 home runs, 17 RBI, 15 walks and 5 stolen bases in 35 games on the roacompared to .248 (28x113) in 34 games at home.
The LumberKings pitching staff had a 4.36 ERA (382 ER, 789.1 IP), while walking 342 and striking out 612 strikeouts. RH Carlos Misell lthe team with 7 wins, while LH Eddie Campbell and RH Aaron Brooks finished 2nd with 5 wins. Eight different LumberKings have recordat least 1 save with RH Emilio Pagan leading the squad with 8 saves.
RH Carlos Misell is 7-8 with a 4.08 ERA (39 ER, 86.0 IP) in 17 start with Clinton. After going 2-1 with a 3.25 ERA (10 ER, 27.2 IP) in hfirst 6 starts to begin the season (4/5-5/5) , LH Eddie Campbell is 3-6 with a 7.35 ERA (49 ER, 60 IP) in his last 12 starts (May 10-curren
RH Emilio Pagan did not allow an earned run in 18 of 25 relief appearances, going 2-2 with 9 saves and a 3.34 ERA (12 ER, 32.1 IP). Hlimited opponents to a .244 (30x123) average, while walking 10 and 36 strikeouts.
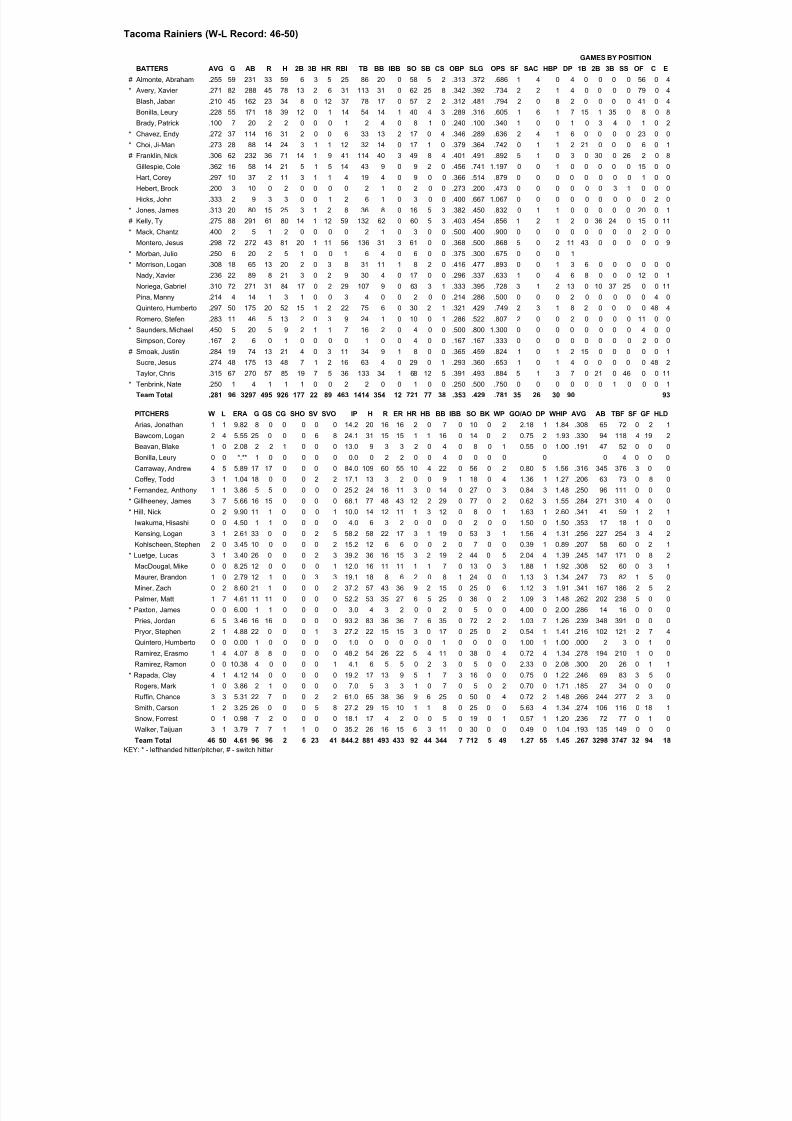
8/12/2019 2014 Mid-Season Report
http://slidepdf.com/reader/full/2014-mid-season-report 69/80
Tacoma Rainiers (W-L Record: 46-50)
GAMES BY POSITION
BATTERS AVG G AB R H 2B 3B HR RBI TB BB IBB SO SB CS OBP SLG OPS SF SAC HBP DP 1B 2B 3B SS OF C
# Almonte, Abraham .255 59 231 33 59 6 3 5 25 86 20 0 58 5 2 .313 .372 .686 1 4 0 4 0 0 0 0 56 0
* Avery, Xavier .271 82 288 45 78 13 2 6 31 113 31 0 62 25 8 .342 .392 .734 2 2 1 4 0 0 0 0 79 0
Blash, Jabari .210 45 162 23 34 8 0 12 37 78 17 0 57 2 2 .312 .481 .794 2 0 8 2 0 0 0 0 41 0
Bonilla, Leury .228 55 171 18 39 12 0 1 14 54 14 1 40 4 3 .289 .316 .605 1 6 1 7 15 1 35 0 8 0
Brady, Patrick .100 7 20 2 2 0 0 0 1 2 4 0 8 1 0 .240 .100 .340 1 0 0 1 0 3 4 0 1 0
* Chavez, Endy .272 37 114 16 31 2 0 0 6 33 13 2 17 0 4 .346 .289 .636 2 4 1 6 0 0 0 0 23 0
* Choi, Ji-Man .273 28 88 14 24 3 1 1 12 32 14 0 17 1 0 .379 .364 .742 0 1 1 2 21 0 0 0 6 0
# Franklin, Nick .306 62 232 36 71 14 1 9 41 114 40 3 49 8 4 .401 .491 .892 5 1 0 3 0 30 0 26 2 0
Gillespie, Cole .362 16 58 14 21 5 1 5 14 43 9 0 9 2 0 .456 .741 1.197 0 0 1 0 0 0 0 0 15 0
Hart, Corey .297 10 37 2 11 3 1 1 4 19 4 0 9 0 0 .366 .514 .879 0 0 0 0 0 0 0 0 1 0
Hebert, Brock .200 3 10 0 2 0 0 0 0 2 1 0 2 0 0 .273 .200 .473 0 0 0 0 0 0 3 1 0 0
Hicks, John .333 2 9 3 3 0 0 1 2 6 1 0 3 0 0 .400 .667 1.067 0 0 0 0 0 0 0 0 0 2
* Jones, James .313 20 80 15 25 3 1 2 8 36 8 0 16 5 3 .382 .450 .832 0 1 1 0 0 0 0 0 20 0
# Kelly, Ty .275 88 291 61 80 14 1 12 59 132 62 0 60 5 3 .403 .454 .856 1 2 1 2 0 36 24 0 15 0
* Mack, Chantz .400 2 5 1 2 0 0 0 0 2 1 0 3 0 0 .500 .400 .900 0 0 0 0 0 0 0 0 2 0
Montero, Jesus .298 72 272 43 81 20 1 11 56 136 31 3 61 0 0 .368 .500 .868 5 0 2 11 43 0 0 0 0 0
* Morban, Julio .250 6 20 2 5 1 0 0 1 6 4 0 6 0 0 .375 .300 .675 0 0 0 1
* Morrison, Logan .308 18 65 13 20 2 0 3 8 31 11 1 8 2 0 .416 .477 .893 0 0 1 3 6 0 0 0 0 0
Nady, Xavier .236 22 89 8 21 3 0 2 9 30 4 0 17 0 0 .296 .337 .633 1 0 4 6 8 0 0 0 12 0
Noriega, Gabriel .310 72 271 31 84 17 0 2 29 107 9 0 63 3 1 .333 .395 .728 3 1 2 13 0 10 37 25 0 0
Pina, Manny
.214 4 14 1 3 1 0 0 3 4 0 0 2 0 0 .214 .286 .500 0 0 0 2 0 0 0 0 0 4 Quintero, Humberto .297 50 175 20 52 15 1 2 22 75 6 0 30 2 1 .321 .429 .749 2 3 1 8 2 0 0 0 0 48
Romero, Stefen .283 11 46 5 13 2 0 3 9 24 1 0 10 0 1 .286 .522 .807 2 0 0 2 0 0 0 0 11 0
* Saunders, Michael .450 5 20 5 9 2 1 1 7 16 2 0 4 0 0 .500 .800 1.300 0 0 0 0 0 0 0 0 4 0
Simpson, Corey .167 2 6 0 1 0 0 0 0 1 0 0 4 0 0 .167 .167 .333 0 0 0 0 0 0 0 0 2 0
# Smoak, Justin .284 19 74 13 21 4 0 3 11 34 9 1 8 0 0 .365 .459 .824 1 0 1 2 15 0 0 0 0 0
Sucre, Jesus .274 48 175 13 48 7 1 2 16 63 4 0 29 0 1 .293 .360 .653 1 0 1 4 0 0 0 0 0 48
Taylor, Chris .315 67 270 57 85 19 7 5 36 133 34 1 68 12 5 .391 .493 .884 5 1 3 7 0 21 0 46 0 0
* Tenbrink, Nate .250 1 4 1 1 1 0 0 2 2 0 0 1 0 0 .250 .500 .750 0 0 0 0 0 0 1 0 0 0
Team Total .281 96 3297 495 926 177 22 89 463 1414 354 12 721 77 38 .353 .429 .781 35 26 30 90
PITCHERS W L ERA G GS CG SHO SV SVO IP H R ER HR HB BB IBB SO BK WP GO/AO DP WHIP AVG AB TBF SF GF H
Arias, Jonathan 1 1 9.82 8 0 0 0 0 0 14.2 20 16 16 2 0 7 0 10 0 2 2.18 1 1.84 .308 65 72 0 2
Bawcom, Logan 2 4 5.55 25 0 0 0 6 8 24.1 31 15 15 1 1 16 0 14 0 2 0.75 2 1.93 .330 94 118 4 19
Beavan, Blake 1 0 2.08 2 2 1 0 0 0 13.0 9 3 3 2 0 4 0 8 0 1 0.55 0 1.00 .191 47 52 0 0
Bonilla, Leury 0 0 *.** 1 0 0 0 0 0 0.0 0 2 2 0 0 4 0 0 0 0 0 0 4 0 0
Carraway, Andrew 4 5 5.89 17 17 0 0 0 0 84.0 109 60 55 10 4 22 0 56 0 2 0.80 5 1.56 .316 345 376 3 0
Coffey, Todd 3 1 1.04 18 0 0 0 2 2 17.1 13 3 2 0 0 9 1 18 0 4 1.36 1 1.27 .206 63 73 0 8
* Fernandez, Anthony 1 1 3.86 5 5 0 0 0 0 25.2 24 16 11 3 0 14 0 27 0 3 0.84 3 1.48 .250 96 111 0 0
* Gillheeney, James 3 7 5.66 16 15 0 0 0 0 68.1 77 48 43 12 2 29 0 77 0 2 0.62 3 1.55 .284 271 310 4 0
* Hill, Nick 0 2 9.90 11 1 0 0 0 1 10.0 14 12 11 1 3 12 0 8 0 1 1.63 1 2.60 .341 41 59 1 2
Iwakuma, Hisashi 0 0 4.50 1 1 0 0 0 0 4.0 6 3 2 0 0 0 0 2 0 0 1.50 0 1.50 .353 17 18 1 0
Kensing, Logan 3 1 2.61 33 0 0 0 2 5 58.2 58 22 17 3 1 19 0 53 3 1 1.56 4 1.31 .256 227 254 3 4
Kohlscheen, Stephen 2 0 3.45 10 0 0 0 0 2 15.2 12 6 6 0 0 2 0 7 0 0 0.39 1 0.89 .207 58 60 0 2
* Luetge, Lucas 3 1 3.40 26 0 0 0 2 3 39.2 36 16 15 3 2 19 2 44 0 5 2.04 4 1.39 .245 147 171 0 8
MacDougal, Mike 0 0 8.25 12 0 0 0 0 1 12.0 16 11 11 1 1 7 0 13 0 3 1.88 1 1.92 .308 52 60 0 3
Maurer, Brandon 1 0 2.79 12 1 0 0 3 3 19.1 18 8 6 2 0 8 1 24 0 0 1.13 3 1.34 .247 73 82 1 5
Miner, Zach 0 2 8.60 21 1 0 0 0 2 37.2 57 43 36 9 2 15 0 25 0 6 1.12 3 1.91 .341 167 186 2 5
Palmer, Matt
1 7 4.61 11 11 0 0 0 0 52.2 53 35 27 6 5 25 0 36 0 2 1.09 3 1.48 .262 202 238 5 0 * Paxton, James 0 0 6.00 1 1 0 0 0 0 3.0 4 3 2 0 0 2 0 5 0 0 4.00 0 2.00 .286 14 16 0 0
Pries, Jordan 6 5 3.46 16 16 0 0 0 0 93.2 83 36 36 7 6 35 0 72 2 2 1.03 7 1.26 .239 348 391 0 0
Pryor, Stephen 2 1 4.88 22 0 0 0 1 3 27.2 22 15 15 3 0 17 0 25 0 2 0.54 1 1.41 .216 102 121 2 7
Quintero, Humberto 0 0 0.00 1 0 0 0 0 0 1.0 0 0 0 0 0 1 0 0 0 0 1.00 1 1.00 .000 2 3 0 1
Ramirez, Erasmo 1 4 4.07 8 8 0 0 0 0 48.2 54 26 22 5 4 11 0 38 0 4 0.72 4 1.34 .278 194 210 1 0
Ramirez, Ramon 0 0 10.38 4 0 0 0 0 1 4.1 6 5 5 0 2 3 0 5 0 0 2.33 0 2.08 .300 20 26 0 1
* Rapada, Clay 4 1 4.12 14 0 0 0 0 0 19.2 17 13 9 5 1 7 3 16 0 0 0.75 0 1.22 .246 69 83 3 5
Rogers, Mark 1 0 3.86 2 1 0 0 0 0 7.0 5 3 3 1 0 7 0 5 0 2 0.70 0 1.71 .185 27 34 0 0
Ruffin, Chance 3 3 5.31 22 7 0 0 2 2 61.0 65 38 36 9 6 25 0 50 0 4 0.72 2 1.48 .266 244 277 2 3
Smith, Carson 1 2 3.25 26 0 0 0 5 8 27.2 29 15 10 1 1 8 0 25 0 0 5.63 4 1.34 .274 106 116 0 18
Snow, Forrest 0 1 0.98 7 2 0 0 0 0 18.1 17 4 2 0 0 5 0 19 0 1 0.57 1 1.20 .236 72 77 0 1
Walker, Taijuan 3 1 3.79 7 7 1 1 0 0 35.2 26 16 15 6 3 11 0 30 0 0 0.49 0 1.04 .193 135 149 0 0
Team Total 46 50 4.61 96 96 2 6 23 41 844.2 881 493 433 92 44 344 7 712 5 49 1.27 55 1.45 .267 3298 3747 32 94
KEY: * - lefthanded hitter/pitcher, # - switch hitter
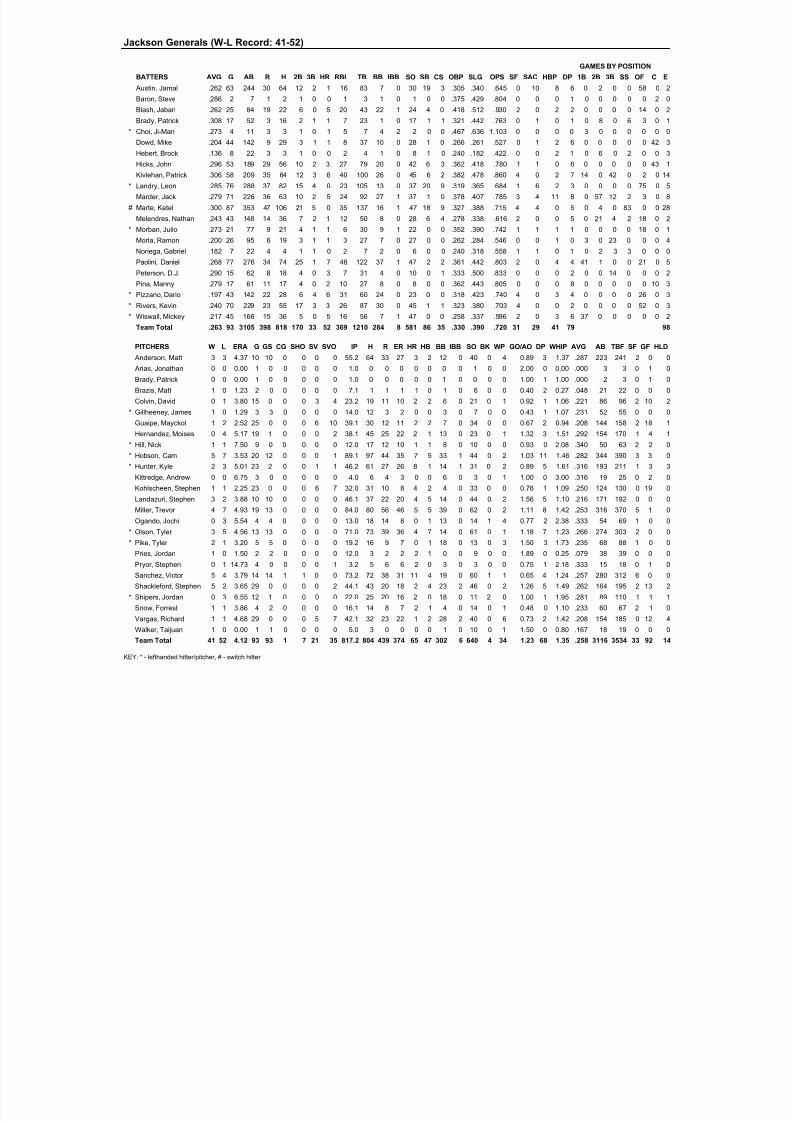
8/12/2019 2014 Mid-Season Report
http://slidepdf.com/reader/full/2014-mid-season-report 70/80
Jackson Generals (W-L Record: 41-52)
GAMES BY POSITION
BATTERS AVG G AB R H 2B 3B HR RBI TB BB IBB SO SB CS OBP SLG OPS SF SAC HBP DP 1B 2B 3B SS OF C
Austin, Jamal .262 63 244 30 64 12 2 1 16 83 7 0 30 19 3 .305 .340 .645 0 10 8 6 0 2 0 0 58 0
Baron, Steve .286 2 7 1 2 1 0 0 1 3 1 0 1 0 0 .375 .429 .804 0 0 0 1 0 0 0 0 0 2
Blash, Jabari .262 25 84 19 22 6 0 5 20 43 22 1 24 4 0 .418 .512 .930 2 0 2 2 0 0 0 0 14 0
Brady, Patrick .308 17 52 3 16 2 1 1 7 23 1 0 17 1 1 .321 .442 .763 0 1 0 1 0 8 0 6 3 0
* Choi, Ji-Man .273 4 11 3 3 1 0 1 5 7 4 2 2 0 0 .467 .636 1.103 0 0 0 0 3 0 0 0 0 0
Dowd, Mike .204 44 142 9 29 3 1 1 8 37 10 0 28 1 0 .266 .261 .527 0 1 2 6 0 0 0 0 0 42
Hebert, Brock .136 8 22 3 3 1 0 0 2 4 1 0 8 1 0 .240 .182 .422 0 0 2 1 0 6 0 2 0 0
Hicks, John .296 53 189 29 56 10 2 3 27 79 20 0 42 6 3 .362 .418 .780 1 1 0 6 0 0 0 0 0 43
Kivlehan, Patrick .306 58 209 35 64 12 3 6 40 100 26 0 45 6 2 .382 .478 .860 4 0 2 7 14 0 42 0 2 0
* Landry, Leon .285 76 288 37 82 15 4 0 23 105 13 0 37 20 9 .319 .365 .684 1 6 2 3 0 0 0 0 75 0
Marder, Jack .279 71 226 36 63 10 2 5 24 92 27 1 37 1 0 .378 .407 .785 3 4 11 8 0 57 12 2 3 0
# Marte, Ketel .300 87 353 47 106 21 5 0 35 137 16 1 47 18 9 .327 .388 .715 4 4 0 5 0 4 0 83 0 0
Melendres, Nathan .243 43 148 14 36 7 2 1 12 50 8 0 28 6 4 .278 .338 .616 2 0 0 5 0 21 4 2 18 0
* Morban, Julio .273 21 77 9 21 4 1 1 6 30 9 1 22 0 0 .352 .390 .742 1 1 1 1 0 0 0 0 18 0
Morla, Ramon .200 26 95 6 19 3 1 1 3 27 7 0 27 0 0 .262 .284 .546 0 0 1 0 3 0 23 0 0 0
Noriega, Gabriel .182 7 22 4 4 1 1 0 2 7 2 0 6 0 0 .240 .318 .558 1 1 0 1 0 2 3 3 0 0
Paolini, Daniel .268 77 276 34 74 25 1 7 48 122 37 1 47 2 2 .361 .442 .803 2 0 4 4 41 1 0 0 21 0
Peterson, D.J. .290 15 62 8 18 4 0 3 7 31 4 0 10 0 1 .333 .500 .833 0 0 0 2 0 0 14 0 0 0
Pina, Manny .279 17 61 11 17 4 0 2 10 27 8 0 8 0 0 .362 .443 .805 0 0 0 8 0 0 0 0 0 10
* Pizzano, Dario .197 43 142 22 28 6 4 6 31 60 24 0 23 0 0 .318 .423 .740 4 0 3 4 0 0 0 0 26 0
* Rivers, Kevin .240 70 229 23 55 17 3 3 26 87 30 0 45 1 1 .323 .380 .703 4 0 0 2 0 0 0 0 52 0
* Wiswall, Mickey .217 45 166 15 36 5 0 5 16 56 7 1 47 0 0 .258 .337 .596 2 0 3 6 37 0 0 0 0 0
Team Total .263 93 3105 398 818 170 33 52 369 1210 284 8 581 86 35 .330 .390 .720 31 29 41 79
PITCHERS W L ERA G GS CG SHO SV SVO IP H R ER HR HB BB IBB SO BK WP GO/AO DP WHIP AVG AB TBF SF GF H
Anderson, Matt 3 3 4.37 10 10 0 0 0 0 55.2 64 33 27 3 2 12 0 40 0 4 0.89 3 1.37 .287 223 241 2 0
Arias, Jonathan 0 0 0.00 1 0 0 0 0 0 1.0 0 0 0 0 0 0 0 1 0 0 2.00 0 0.00 .000 3 3 0 1
Brady, Patrick 0 0 0.00 1 0 0 0 0 0 1.0 0 0 0 0 0 1 0 0 0 0 1.00 1 1.00 .000 2 3 0 1
Brazis, Matt 1 0 1.23 2 0 0 0 0 0 7.1 1 1 1 1 0 1 0 6 0 0 0.40 2 0.27 .048 21 22 0 0
Colvin, David 0 1 3.80 15 0 0 0 3 4 23.2 19 11 10 2 2 6 0 21 0 1 0.92 1 1.06 .221 86 96 2 10
* Gillheeney, James 1 0 1.29 3 3 0 0 0 0 14.0 12 3 2 0 0 3 0 7 0 0 0.43 1 1.07 .231 52 55 0 0
Guaipe, Mayckol 1 2 2.52 25 0 0 0 6 10 39.1 30 12 11 2 2 7 0 34 0 0 0.67 2 0.94 .208 144 158 2 18
Hernandez, Moises 0 4 5.17 19 1 0 0 0 2 38.1 45 25 22 2 1 13 0 23 0 1 1.32 3 1.51 .292 154 170 1 4
* Hill, Nick 1 1 7.50 9 0 0 0 0 0 12.0 17 12 10 1 1 8 0 10 0 0 0.93 0 2.08 .340 50 63 2 2
* Hobson, Cam 5 7 3.53 20 12 0 0 0 1 89.1 97 44 35 7 5 33 1 44 0 2 1.03 11 1.46 .282 344 390 3 3
* Hunter, Kyle 2 3 5.01 23 2 0 0 1 1 46.2 61 27 26 8 1 14 1 31 0 2 0.89 5 1.61 .316 193 211 1 3
Kittredge, Andrew 0 0 6.75 3 0 0 0 0 0 4.0 6 4 3 0 0 6 0 3 0 1 1.00 0 3.00 .316 19 25 0 2
Kohlscheen, Stephen 1 1 2.25 23 0 0 0 6 7 32.0 31 10 8 4 2 4 0 33 0 0 0.76 1 1.09 .250 124 130 0 19
Landazuri, Stephen 3 2 3.88 10 10 0 0 0 0 46.1 37 22 20 4 5 14 0 44 0 2 1.56 5 1.10 .216 171 192 0 0
Miller, Trevor 4 7 4.93 19 13 0 0 0 0 84.0 80 56 46 5 5 39 0 62 0 2 1.11 8 1.42 .253 316 370 5 1
Ogando, Jochi 0 3 5.54 4 4 0 0 0 0 13.0 18 14 8 0 1 13 0 14 1 4 0.77 2 2.38 .333 54 69 1 0
* Olson, Tyler 3 5 4.56 13 13 0 0 0 0 71.0 73 39 36 4 7 14 0 61 0 1 1.18 7 1.23 .266 274 303 2 0
* Pike, Tyler 2 1 3.20 5 5 0 0 0 0 19.2 16 9 7 0 1 18 0 13 0 3 1.50 3 1.73 .235 68 88 1 0
Pries, Jordan 1 0 1.50 2 2 0 0 0 0 12.0 3 2 2 2 1 0 0 9 0 0 1.89 0 0.25 .079 38 39 0 0
Pryor, Stephen 0 1 14.73 4 0 0 0 0 1 3.2 5 6 6 2 0 3 0 3 0 0 0.75 1 2.18 .333 15 18 0 1
Sanchez, Victor 5 4 3.79 14 14 1 1 0 0 73.2 72 38 31 11 4 19 0 60 1 1 0.65 4 1.24 .257 280 312 6 0
Shackleford, Stephen 5 2 3.65 29 0 0 0 0 2 44.1 43 20 18 2 4 23 2 46 0 2 1.26 5 1.49 .262 164 195 2 13
* Shipers, Jordan 0 3 6.55 12 1 0 0 0 0 22.0 25 20 16 2 0 18 0 11 2 0 1.00 1 1.95 .281 89 110 1 1
Snow, Forrest 1 1 3.86 4 2 0 0 0 0 16.1 14 8 7 2 1 4 0 14 0 1 0.48 0 1.10 .233 60 67 2 1
Vargas, Richard 1 1 4.68 29 0 0 0 5 7 42.1 32 23 22 1 2 28 2 40 0 6 0.73 2 1.42 .208 154 185 0 12
Walker, Taijuan 1 0 0.00 1 1 0 0 0 0 5.0 3 0 0 0 0 1 0 10 0 1 1.50 0 0.80 .167 18 19 0 0
Team Total 41 52 4.12 93 93 1 7 21 35 817.2 804 439 374 65 47 302 6 640 4 34 1.23 68 1.35 .258 3116 3534 33 92
KEY: * - lefthanded hitter/pitcher, # - switch hitter

8/12/2019 2014 Mid-Season Report
http://slidepdf.com/reader/full/2014-mid-season-report 71/80
High Desert (W-L Record: 45-49)
GAMES BY POSITION
BATTERS AVG G AB R H 2B 3B HR RBI TB BB IBB SO SB CS OBP SLG OPS SF SAC HBP DP 1B 2B 3B SS OF C
* Barbosa, Aaron .256 34 125 26 32 1 1 0 12 35 28 0 27 10 5 .400 .280 .680 0 0 2 2 0 0 0 0 34 0
Baron, Steve .254 39 142 18 36 10 1 1 23 51 10 0 27 3 1 .308 .359 .667 4 0 3 1 0 0 0 0 0 39
Brady, Patrick .224 16 58 12 13 1 2 2 14 24 6 0 17 0 2 .308 .414 .721 0 0 1 2 0 3 7 0 6 0
Brito, Bryan .154 8 26 4 4 0 0 0 0 4 1 0 7 1 1 .185 .154 .339 0 0 0 2 0 0 2 5 0 0
Caballero, Luis .194 9 31 5 6 1 1 0 1 9 3 0 12 2 1 .265 .290 .555 0 0 0 0 0 4 4 1 0 0
DeMello, Toby .000 2 6 0 0 0 0 0 0 0 1 0 2 0 0 .143 .000 .143 0 0 0 0 0 0 0 0 0 2
Guerrero, Gabby .300 87 357 64 107 18 1 9 60 154 24 0 89 14 2 .342 .431 .773 4 1 1 7 0 0 0 0 78 0
Hebert, Brock .267 50 195 35 52 12 4 3 30 81 13 0 55 9 2 .319 .415 .735 2 1 3 2 0 10 17 17 6 0
Henry, Jabari .305 72 272 53 83 18 3 18 58 161 44 0 62 4 6 .411 .592 1.003 0 1 5 12 0 0 0 0 54 0
Kivlehan, Patrick .282 34 142 24 40 9 2 9 35 80 12 0 32 2 0 .331 .563 .895 3 0 0 8 13 0 14 0 0 0
Lara, Jordy .340 91 353 62 120 21 5 14 60 193 32 1 77 1 3 .399 .547 .946 3 1 5 9 69 0 0 0 6 0
Lopes, Tim .235 77 285 42 67 10 6 2 34 95 27 0 54 15 2 .307 .333 .640 1 3 3 2 0 73 0 0 0 0
Marlette, Tyler .290 53 207 34 60 12 0 9 25 99 19 0 41 9 1 .351 .478 .829 1 0 1 4 0 0 0 0 0 53
Peterson, D.J. .326 65 273 51 89 23 1 18 73 168 23 0 65 6 0 .381 .615 .997 1 0 2 6 10 0 45 0 0 0
* Pizzano, Dario .275 35 138 33 38 16 2 3 21 67 23 0 16 0 0 .377 .486 .862 1 0 0 1 0 0 0 0 26 0
Reynolds, Burt .278 40 144 15 40 9 3 6 26 73 8 0 50 7 6 .331 .507 .838 1 1 4 2 3 0 0 0 24 0
Shank, Zach .184 10 38 2 7 0 0 1 5 10 2 0 11 0 0 .225 .263 .488 0 1 0 1 0 0 10 0 0 0
Smith, Tyler .278 82 327 61 91 12 5 7 29 134 44 0 67 11 7 .369 .410 .778 2 0 4 8 0 6 0 72 0 0
Witherspoon, Travis .265 56 215 38 57 13 1 10 29 102 21 0 46 20 4 .336 .474 .811 0 0 2 2 0 0 0 0 54 0
Team Total .283 94 3334 579 942 186 38 112 535 1540 341 1 757 114 43 .353 .462 .815 23 9 36 71
PITCHERS W L ERA G GS CG SHO SV SVO IP H R ER HR HB BB IBB SO BK WP GO/AO DP WHIP AVG AB TBF SF GF H
Anderson, Matt 3 2 5.23 7 7 0 0 0 0 32.2 32 19 19 3 1 16 0 28 0 0 1.37 2 1.47 .258 124 141 0 0
Bordonaro, Mark 1 1 7.20 8 0 0 0 0 0 15.0 16 14 12 3 1 13 0 11 0 0 2.20 2 1.93 .271 59 73 0 2
Brady, Patrick 0 0 0.00 1 0 0 0 0 0 1.0 0 0 0 0 0 0 0 1 0 0 2.00 0 0.00 .000 3 3 0 1
Brazis, Matt 3 0 2.97 23 0 0 0 4 6 39.1 34 15 13 4 3 8 0 50 0 2 0.89 1 1.07 .230 148 161 1 13
Chen, Min-Sih 2 5 8.00 22 8 0 0 1 1 54.0 69 54 48 7 3 29 0 45 1 9 0.92 5 1.81 .308 224 261 2 5
* DeCecco, Scott 4 8 6.03 19 16 0 0 0 0 88.0 106 68 59 16 3 40 0 65 0 4 1.02 9 1.66 .308 344 396 5 0
Garcia, Oliver 0 0 2.19 12 0 0 0 1 1 24.2 17 7 6 1 2 12 0 26 0 1 0.63 2 1.18 .195 87 101 0 5
Hauser, Blake 1 1 5.45 23 0 0 0 2 3 34.2 33 26 21 7 4 22 0 34 0 12 0.92 2 1.59 .243 136 164 1 10
Herb, Tyler 0 1 4.50 1 0 0 0 0 0 2.0 3 2 1 0 0 0 0 2 0 0 3.00 0 1.50 .333 9 9 0 0
Holman, David 2 1 4.40 14 3 0 0 0 1 43.0 46 23 21 5 0 12 0 23 1 7 2.29 4 1.35 .272 169 183 2 3
Huijer, Lars 0 1 6.75 3 3 0 0 0 0 13.1 20 11 10 3 3 6 0 7 1 1 1.07 0 1.95 .351 57 67 1 0
Kim, Seon Gi 0 1 16.05 7 0 0 0 0 0 12.1 23 22 22 1 1 11 0 8 0 4 2.33 1 2.76 .390 59 73 2 1
Kittredge, Andrew 4 1 5.12 26 0 0 0 3 5 51.0 63 35 29 9 2 17 1 72 0 4 1.02 5 1.57 .292 216 237 2 10
* Mathis, Will 5 3 3.99 31 0 0 0 6 8 47.1 42 24 21 5 5 25 0 36 0 3 1.49 5 1.42 .232 181 215 2 20
Ogando, Jochi 3 2 5.11 11 11 0 0 0 0 44.0 49 30 25 4 2 23 0 36 2 2 1.62 8 1.64 .285 172 199 2 0
* Olson, Tyler 2 1 3.13 5 5 0 0 0 0 23.0 21 8 8 0 1 10 0 27 0 2 1.56 0 1.35 .236 89 100 0 0
* Pike, Tyler 2 4 5.72 14 14 0 0 0 0 61.1 56 44 39 10 7 46 0 57 0 6 0.88 4 1.66 .243 230 286 1 0
Ramirez, Erasmo 0 1 7.50 1 1 0 0 0 0 6.0 8 6 5 2 0 2 0 7 0 0 0.83 1 1.67 .308 26 28 0 0
Shankin, Brett 3 4 4.98 20 5 0 0 0 0 56.0 69 47 31 4 9 23 0 46 0 8 1.84 6 1.64 .295 234 269 1 6
* Shipers, Jordan 2 1 2.28 11 0 0 0 0 0 23.2 33 6 6 0 2 7 0 26 0 4 0.65 2 1.69 .330 100 111 1 5
Unsworth, Dylan 5 8 6.62 18 18 0 0 0 0 88.1 117 71 65 15 4 16 0 80 0 3 0.94 6 1.51 .316 370 399 4 0
Walker, Taijuan 0 0 2.08 1 1 0 0 0 0 4.1 4 2 1 0 0 1 0 7 0 0 0.50 0 1.15 .235 17 18 0 0
Wood, Grady 2 3 3.40 24 0 0 0 4 7 50.1 46 25 19 3 2 14 0 60 1 5 1.41 5 1.19 .242 190 211 0 13
* Zokan, Jake 1 0 4.76 2 2 0 0 0 0 11.1 9 7 6 3 1 2 0 10 1 2 1.18 0 0.97 .209 43 46 0 0
Team Total 45 49 5.24 94 94 0 4 21 32 826.2 916 566 481 105 56 355 1 764 7 79 1.51 70 1.54 .279 3287 3751 27 94
KEY: * - lefthanded hitter/pitcher, # - switch hitter
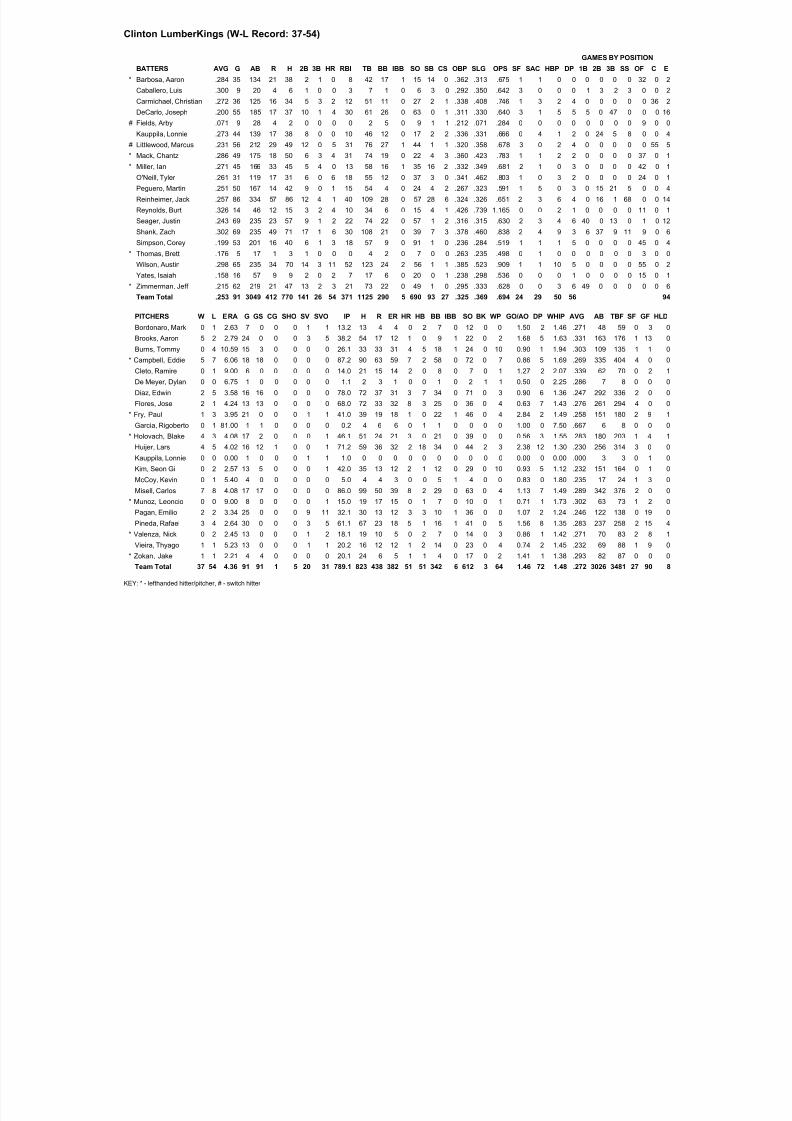
8/12/2019 2014 Mid-Season Report
http://slidepdf.com/reader/full/2014-mid-season-report 72/80
Clinton LumberKings (W-L Record: 37-54)
GAMES BY POSITION
BATTERS AVG G AB R H 2B 3B HR RBI TB BB IBB SO SB CS OBP SLG OPS SF SAC HBP DP 1B 2B 3B SS OF C
* Barbosa, Aaron .284 35 134 21 38 2 1 0 8 42 17 1 15 14 0 .362 .313 .675 1 1 0 0 0 0 0 0 32 0
Caballero, Luis .300 9 20 4 6 1 0 0 3 7 1 0 6 3 0 .292 .350 .642 3 0 0 0 1 3 2 3 0 0
Carmichael, Christian .272 36 125 16 34 5 3 2 12 51 11 0 27 2 1 .338 .408 .746 1 3 2 4 0 0 0 0 0 36
DeCarlo, Joseph .200 55 185 17 37 10 1 4 30 61 26 0 63 0 1 .311 .330 .640 3 1 5 5 5 0 47 0 0 0
# Fields, Arby .071 9 28 4 2 0 0 0 0 2 5 0 9 1 1 .212 .071 .284 0 0 0 0 0 0 0 0 9 0
Kauppila, Lonnie .273 44 139 17 38 8 0 0 10 46 12 0 17 2 2 .336 .331 .666 0 4 1 2 0 24 5 8 0 0
# Littlewood, Marcus .231 56 212 29 49 12 0 5 31 76 27 1 44 1 1 .320 .358 .678 3 0 2 4 0 0 0 0 0 55
* Mack, Chantz .286 49 175 18 50 6 3 4 31 74 19 0 22 4 3 .360 .423 .783 1 1 2 2 0 0 0 0 37 0
* Miller, Ian .271 45 166 33 45 5 4 0 13 58 16 1 35 16 2 .332 .349 .681 2 1 0 3 0 0 0 0 42 0
O'Neill, Tyler .261 31 119 17 31 6 0 6 18 55 12 0 37 3 0 .341 .462 .803 1 0 3 2 0 0 0 0 24 0
Peguero, Martin .251 50 167 14 42 9 0 1 15 54 4 0 24 4 2 .267 .323 .591 1 5 0 3 0 15 21 5 0 0
Reinheimer, Jack .257 86 334 57 86 12 4 1 40 109 28 0 57 28 6 .324 .326 .651 2 3 6 4 0 16 1 68 0 0
Reynolds, Burt .326 14 46 12 15 3 2 4 10 34 6 0 15 4 1 .426 .739 1.165 0 0 2 1 0 0 0 0 11 0
Seager, Justin .243 69 235 23 57 9 1 2 22 74 22 0 57 1 2 .316 .315 .630 2 3 4 6 40 0 13 0 1 0
Shank, Zach .302 69 235 49 71 17 1 6 30 108 21 0 39 7 3 .378 .460 .838 2 4 9 3 6 37 9 11 9 0
Simpson, Corey .199 53 201 16 40 6 1 3 18 57 9 0 91 1 0 .236 .284 .519 1 1 1 5 0 0 0 0 45 0
* Thomas, Brett .176 5 17 1 3 1 0 0 0 4 2 0 7 0 0 .263 .235 .498 0 1 0 0 0 0 0 0 3 0
Wilson, Austin .298 65 235 34 70 14 3 11 52 123 24 2 56 1 1 .385 .523 .909 1 1 10 5 0 0 0 0 55 0
Yates, Isaiah .158 16 57 9 9 2 0 2 7 17 6 0 20 0 1 .238 .298 .536 0 0 0 1 0 0 0 0 15 0
* Zimmerman, Jeff .215 62 219 21 47 13 2 3 21 73 22 0 49 1 0 .295 .333 .628 0 0 3 6 49 0 0 0 0 0
Team Total .253 91 3049 412 770 141 26 54 371 1125 290 5 690 93 27 .325 .369 .694 24 29 50 56
PITCHERS W L ERA G GS CG SHO SV SVO IP H R ER HR HB BB IBB SO BK WP GO/AO DP WHIP AVG AB TBF SF GF H
Bordonaro, Mark 0 1 2.63 7 0 0 0 1 1 13.2 13 4 4 0 2 7 0 12 0 0 1.50 2 1.46 .271 48 59 0 3
Brooks, Aaron 5 2 2.79 24 0 0 0 3 5 38.2 54 17 12 1 0 9 1 22 0 2 1.68 5 1.63 .331 163 176 1 13
Burns, Tommy 0 4 10.59 15 3 0 0 0 0 26.1 33 33 31 4 5 18 1 24 0 10 0.90 1 1.94 .303 109 135 1 1
* Campbell, Eddie 5 7 6.06 18 18 0 0 0 0 87.2 90 63 59 7 2 58 0 72 0 7 0.86 5 1.69 .269 335 404 4 0
Cleto, Ramire 0 1 9.00 6 0 0 0 0 0 14.0 21 15 14 2 0 8 0 7 0 1 1.27 2 2.07 .339 62 70 0 2
De Meyer, Dylan 0 0 6.75 1 0 0 0 0 0 1.1 2 3 1 0 0 1 0 2 1 1 0.50 0 2.25 .286 7 8 0 0
Diaz, Edwin 2 5 3.58 16 16 0 0 0 0 78.0 72 37 31 3 7 34 0 71 0 3 0.90 6 1.36 .247 292 336 2 0
Flores, Jose 2 1 4.24 13 13 0 0 0 0 68.0 72 33 32 8 3 25 0 36 0 4 0.63 7 1.43 .276 261 294 4 0
* Fry, Paul 1 3 3.95 21 0 0 0 1 1 41.0 39 19 18 1 0 22 1 46 0 4 2.84 2 1.49 .258 151 180 2 9
Garcia, Rigoberto 0 1 81.00 1 1 0 0 0 0 0.2 4 6 6 0 1 1 0 0 0 0 1.00 0 7.50 .667 6 8 0 0
* Holovach, Blake 4 3 4.08 17 2 0 0 0 1 46.1 51 24 21 3 0 21 0 39 0 0 0.56 3 1.55 .283 180 203 1 4
Huijer, Lars 4 5 4.02 16 12 1 0 0 1 71.2 59 36 32 2 18 34 0 44 2 3 2.38 12 1.30 .230 256 314 3 0
Kauppila, Lonnie 0 0 0.00 1 0 0 0 1 1 1.0 0 0 0 0 0 0 0 0 0 0 0.00 0 0.00 .000 3 3 0 1
Kim, Seon Gi 0 2 2.57 13 5 0 0 0 1 42.0 35 13 12 2 1 12 0 29 0 10 0.93 5 1.12 .232 151 164 0 1
McCoy, Kevin 0 1 5.40 4 0 0 0 0 0 5.0 4 4 3 0 0 5 1 4 0 0 0.83 0 1.80 .235 17 24 1 3
Misell, Carlos 7 8 4.08 17 17 0 0 0 0 86.0 99 50 39 8 2 29 0 63 0 4 1.13 7 1.49 .289 342 376 2 0
* Munoz, Leoncio 0 0 9.00 8 0 0 0 0 1 15.0 19 17 15 0 1 7 0 10 0 1 0.71 1 1.73 .302 63 73 1 2
Pagan, Emilio 2 2 3.34 25 0 0 0 9 11 32.1 30 13 12 3 3 10 1 36 0 0 1.07 2 1.24 .246 122 138 0 19
Pineda, Rafael 3 4 2.64 30 0 0 0 3 5 61.1 67 23 18 5 1 16 1 41 0 5 1.56 8 1.35 .283 237 258 2 15
* Valenza, Nick 0 2 2.45 13 0 0 0 1 2 18.1 19 10 5 0 2 7 0 14 0 3 0.86 1 1.42 .271 70 83 2 8
Vieira, Thyago 1 1 5.23 13 0 0 0 1 1 20.2 16 12 12 1 2 14 0 23 0 4 0.74 2 1.45 .232 69 88 1 9
* Zokan, Jake 1 1 2.21 4 4 0 0 0 0 20.1 24 6 5 1 1 4 0 17 0 2 1.41 1 1.38 .293 82 87 0 0
Team Total 37 54 4.36 91 91 1 5 20 31 789.1 823 438 382 51 51 342 6 612 3 64 1.46 72 1.48 .272 3026 3481 27 90
KEY: * - lefthanded hitter/pitcher, # - switch hitter
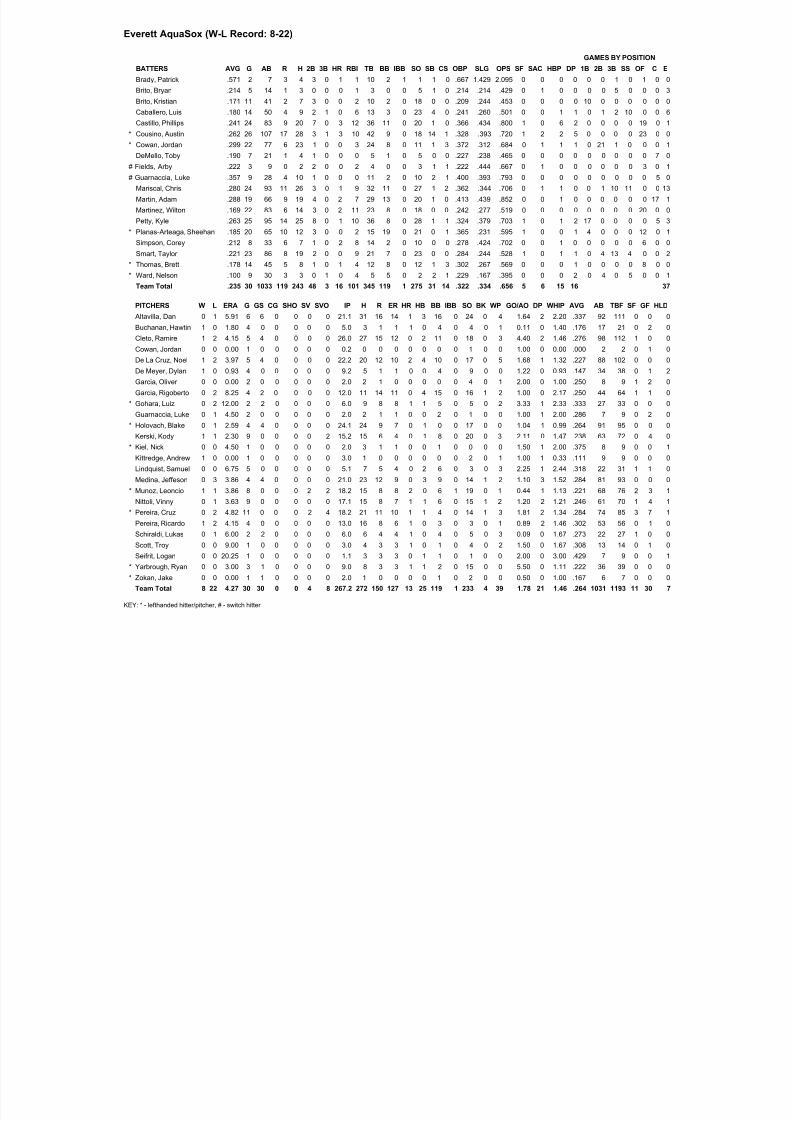
8/12/2019 2014 Mid-Season Report
http://slidepdf.com/reader/full/2014-mid-season-report 73/80
Everett AquaSox (W-L Record: 8-22)
GAMES BY POSITION
BATTERS AVG G AB R H 2B 3B HR RBI TB BB IBB SO SB CS OBP SLG OPS SF SAC HBP DP 1B 2B 3B SS OF C
Brady, Patrick .571 2 7 3 4 3 0 1 1 10 2 1 1 1 0 .667 1.429 2.095 0 0 0 0 0 0 1 0 1 0
Brito, Bryan .214 5 14 1 3 0 0 0 1 3 0 0 5 1 0 .214 .214 .429 0 1 0 0 0 0 5 0 0 0
Brito, Kristian .171 11 41 2 7 3 0 0 2 10 2 0 18 0 0 .209 .244 .453 0 0 0 0 10 0 0 0 0 0
Caballero, Luis .180 14 50 4 9 2 1 0 6 13 3 0 23 4 0 .241 .260 .501 0 0 1 1 0 1 2 10 0 0
Castillo, Phillips .241 24 83 9 20 7 0 3 12 36 11 0 20 1 0 .366 .434 .800 1 0 6 2 0 0 0 0 19 0
* Cousino, Austin .262 26 107 17 28 3 1 3 10 42 9 0 18 14 1 .328 .393 .720 1 2 2 5 0 0 0 0 23 0
* Cowan, Jordan .299 22 77 6 23 1 0 0 3 24 8 0 11 1 3 .372 .312 .684 0 1 1 1 0 21 1 0 0 0
DeMello, Toby .190 7 21 1 4 1 0 0 0 5 1 0 5 0 0 .227 .238 .465 0 0 0 0 0 0 0 0 0 7
# Fields, Arby .222 3 9 0 2 2 0 0 2 4 0 0 3 1 1 .222 .444 .667 0 1 0 0 0 0 0 0 3 0
# Guarnaccia, Luke .357 9 28 4 10 1 0 0 0 11 2 0 10 2 1 .400 .393 .793 0 0 0 0 0 0 0 0 0 5
Mariscal, Chris .280 24 93 11 26 3 0 1 9 32 11 0 27 1 2 .362 .344 .706 0 1 1 0 0 1 10 11 0 0
Martin, Adam .288 19 66 9 19 4 0 2 7 29 13 0 20 1 0 .413 .439 .852 0 0 1 0 0 0 0 0 0 17
Martinez, Wilton .169 22 83 6 14 3 0 2 11 23 8 0 18 0 0 .242 .277 .519 0 0 0 0 0 0 0 0 20 0
Petty, Kyle .263 25 95 14 25 8 0 1 10 36 8 0 28 1 1 .324 .379 .703 1 0 1 2 17 0 0 0 0 5
* Planas-Arteaga, Sheehan .185 20 65 10 12 3 0 0 2 15 19 0 21 0 1 .365 .231 .595 1 0 0 1 4 0 0 0 12 0
Simpson, Corey .212 8 33 6 7 1 0 2 8 14 2 0 10 0 0 .278 .424 .702 0 0 1 0 0 0 0 0 6 0
Smart, Taylor .221 23 86 8 19 2 0 0 9 21 7 0 23 0 0 .284 .244 .528 1 0 1 1 0 4 13 4 0 0
* Thomas, Brett .178 14 45 5 8 1 0 1 4 12 8 0 12 1 3 .302 .267 .569 0 0 0 1 0 0 0 0 8 0
* Ward, Nelson .100 9 30 3 3 0 1 0 4 5 5 0 2 2 1 .229 .167 .395 0 0 0 2 0 4 0 5 0 0
Team Total .235 30 1033 119 243 48 3 16 101 345 119 1 275 31 14 .322 .334 .656 5 6 15 16
PITCHERS W L ERA G GS CG SHO SV SVO IP H R ER HR HB BB IBB SO BK WP GO/AO DP WHIP AVG AB TBF SF GF H
Altavilla, Dan 0 1 5.91 6 6 0 0 0 0 21.1 31 16 14 1 3 16 0 24 0 4 1.64 2 2.20 .337 92 111 0 0
Buchanan, Hawtin 1 0 1.80 4 0 0 0 0 0 5.0 3 1 1 1 0 4 0 4 0 1 0.11 0 1.40 .176 17 21 0 2
Cleto, Ramire 1 2 4.15 5 4 0 0 0 0 26.0 27 15 12 0 2 11 0 18 0 3 4.40 2 1.46 .276 98 112 1 0
Cowan, Jordan 0 0 0.00 1 0 0 0 0 0 0.2 0 0 0 0 0 0 0 1 0 0 1.00 0 0.00 .000 2 2 0 1
De La Cruz, Noel 1 2 3.97 5 4 0 0 0 0 22.2 20 12 10 2 4 10 0 17 0 5 1.68 1 1.32 .227 88 102 0 0
De Meyer, Dylan 1 0 0.93 4 0 0 0 0 0 9.2 5 1 1 0 0 4 0 9 0 0 1.22 0 0.93 .147 34 38 0 1
Garcia, Oliver 0 0 0.00 2 0 0 0 0 0 2.0 2 1 0 0 0 0 0 4 0 1 2.00 0 1.00 .250 8 9 1 2
Garcia, Rigoberto 0 2 8.25 4 2 0 0 0 0 12.0 11 14 11 0 4 15 0 16 1 2 1.00 0 2.17 .250 44 64 1 1
* Gohara, Luiz 0 2 12.00 2 2 0 0 0 0 6.0 9 8 8 1 1 5 0 5 0 2 3.33 1 2.33 .333 27 33 0 0
Guarnaccia, Luke 0 1 4.50 2 0 0 0 0 0 2.0 2 1 1 0 0 2 0 1 0 0 1.00 1 2.00 .286 7 9 0 2
* Holovach, Blake 0 1 2.59 4 4 0 0 0 0 24.1 24 9 7 0 1 0 0 17 0 0 1.04 1 0.99 .264 91 95 0 0
Kerski, Kody 1 1 2.30 9 0 0 0 0 2 15.2 15 6 4 0 1 8 0 20 0 3 2.11 0 1.47 .238 63 72 0 4
* Kiel, Nick 0 0 4.50 1 0 0 0 0 0 2.0 3 1 1 0 0 1 0 0 0 0 1.50 1 2.00 .375 8 9 0 0
Kittredge, Andrew 1 0 0.00 1 0 0 0 0 0 3.0 1 0 0 0 0 0 0 2 0 1 1.00 1 0.33 .111 9 9 0 0
Lindquist, Samuel 0 0 6.75 5 0 0 0 0 0 5.1 7 5 4 0 2 6 0 3 0 3 2.25 1 2.44 .318 22 31 1 1
Medina, Jeffeson 0 3 3.86 4 4 0 0 0 0 21.0 23 12 9 0 3 9 0 14 1 2 1.10 3 1.52 .284 81 93 0 0
* Munoz, Leoncio 1 1 3.86 8 0 0 0 2 2 18.2 15 8 8 2 0 6 1 19 0 1 0.44 1 1.13 .221 68 76 2 3
Nittoli, Vinny 0 1 3.63 9 0 0 0 0 0 17.1 15 8 7 1 1 6 0 15 1 2 1.20 2 1.21 .246 61 70 1 4
* Pereira, Cruz 0 2 4.82 11 0 0 0 2 4 18.2 21 11 10 1 1 4 0 14 1 3 1.81 2 1.34 .284 74 85 3 7
Pereira, Ricardo 1 2 4.15 4 0 0 0 0 0 13.0 16 8 6 1 0 3 0 3 0 1 0.89 2 1.46 .302 53 56 0 1
Schiraldi, Lukas 0 1 6.00 2 2 0 0 0 0 6.0 6 4 4 1 0 4 0 5 0 3 0.09 0 1.67 .273 22 27 1 0
Scott, Troy 0 0 9.00 1 0 0 0 0 0 3.0 4 3 3 1 0 1 0 4 0 2 1.50 0 1.67 .308 13 14 0 1
Seifrit, Logan 0 0 20.25 1 0 0 0 0 0 1.1 3 3 3 0 1 1 0 1 0 0 2.00 0 3.00 .429 7 9 0 0
* Yarbrough, Ryan 0 0 3.00 3 1 0 0 0 0 9.0 8 3 3 1 1 2 0 15 0 0 5.50 0 1.11 .222 36 39 0 0
* Zokan, Jake 0 0 0.00 1 1 0 0 0 0 2.0 1 0 0 0 0 1 0 2 0 0 0.50 0 1.00 .167 6 7 0 0
Team Total 8 22 4.27 30 30 0 0 4 8 267.2 272 150 127 13 25 119 1 233 4 39 1.78 21 1.46 .264 1031 1193 11 30
KEY: * - lefthanded hitter/pitcher, # - switch hitter

8/12/2019 2014 Mid-Season Report
http://slidepdf.com/reader/full/2014-mid-season-report 74/80
Pulaski Mariners (W-L Record: 13-11)
GAMES BY POSITION
BATTERS AVG G AB R H 2B 3B HR RBI TB BB IBB SO SB CS OBP SLG OPS SF SAC HBP DP 1B 2B 3B SS OF C
Baum, Jay .279 19 68 4 19 3 0 0 17 22 8 0 5 4 3 .351 .324 .674 1 2 0 1 0 5 7 5 1 0
Calderon, Yordi .235 22 81 13 19 2 1 1 6 26 7 0 24 6 0 .337 .321 .658 1 1 6 2 7 0 14 0 0 0
# Fernandez, Rafael .400 9 30 11 12 3 0 0 5 15 9 0 3 4 1 .550 .500 1.050 0 5 1 2 0 3 0 6 0 0
# Fields, Arby .307 20 75 14 23 4 1 0 2 29 15 0 22 10 4 .429 .387 .815 0 5 1 0 0 0 0 0 20 0
Morales, Estarlyn .228 21 79 15 18 5 0 1 9 26 9 0 25 4 1 .315 .329 .644 2 0 2 3 0 0 0 0 21 0
* Nyman, Chase .137 14 51 6 7 0 0 0 3 7 6 0 24 0 0 .228 .137 .365 0 0 0 1 7 4 1 0 0 0
Palma, Alexy .050 14 40 2 2 0 0 0 0 2 5 0 17 1 2 .174 .050 .224 0 0 1 1 0 0 0 0 7 0
# Perez, Georvic .121 9 33 4 4 1 0 0 4 5 2 0 8 0 0 .194 .152 .346 0 1 1 1 0 0 0 0 0 7
Tanabe, Carlton .380 20 79 13 30 8 1 0 13 40 4 0 8 2 1 .419 .506 .925 1 1 2 1 11 0 0 0 0 8
* Taylor, Wayne .313 20 80 16 25 7 0 3 16 41 7 0 23 1 1 .367 .513 .879 2 0 1 2 0 0 0 0 12 7
Torres, Daniel .400 8 25 4 10 1 1 0 2 13 3 0 6 1 0 .448 .520 .968 1 0 0 1 0 0 0 0 0 4
* Ward, Nelson .350 11 40 6 14 3 1 1 8 22 4 1 7 5 1 .409 .550 .959 0 1 0 1 0 7 0 2 0 0
# Wawoe, Gianfranco .308 22 78 17 24 3 1 0 8 29 6 0 9 4 3 .357 .372 .729 0 3 0 1 0 6 2 12 0 0
* Zeutenhorst, Taylor .136 18 59 5 8 3 0 0 5 11 6 0 21 1 0 .212 .186 .399 1 0 0 1 0 0 0 0 15 0
Team Total .263 24 818 130 215 43 6 6 98 288 91 1 202 43 17 .344 .352 .696 9 19 15 18
PITCHERS W L ERA G GS CG SHO SV SVO IP H R ER HR HB BB IBB SO BK WP GO/AO DP WHIP AVG AB TBF SF GF H
* Brown, Jarrett 1 1 8.68 8 0 0 0 1 2 9.1 11 14 9 2 3 8 0 5 0 0 1.75 3 2.04 .306 36 49 1 4
* Byrd, Taylor 0 1 5.93 5 3 0 0 0 0 13.2 15 12 9 1 1 5 0 9 0 2 3.71 1 1.46 .268 56 63 0 0
Cochran-Gill, Trey 1 0 0.00 8 0 0 0 4 4 12.0 2 0 0 0 0 2 0 15 0 1 2.14 0 0.33 .051 39 41 0 8
Garcia, Rigoberto 0 0 60.75 2 2 0 0 0 0 1.1 6 9 9 0 0 6 0 1 0 1 0.00 0 9.00 .750 8 15 1 0
Littell, Zack 2 2 5.27 5 5 0 0 0 0 27.1 27 16 16 1 4 2 0 30 0 1 1.26 2 1.06 .250 108 115 1 0
Medina, Jeffeson 0 0 0.00 1 1 0 0 0 0 5.0 4 2 0 0 0 1 0 5 0 0 10.00 0 1.00 .200 20 21 0 0
Miller, Peter 0 1 1.17 9 0 0 0 2 3 15.1 10 5 2 1 3 3 0 17 0 5 2.22 0 0.85 .179 56 62 0 5
Missaki, Daniel 2 0 0.00 3 3 0 0 0 0 17.0 6 0 0 0 1 3 0 19 0 0 1.00 2 0.53 .109 55 59 0 0
Pereira, Ricardo 0 1 2.51 4 0 0 0 0 1 14.1 10 5 4 2 0 5 0 14 0 1 0.73 3 1.05 .200 50 55 0 1
* Peterson, Pat 0 1 1.29 4 4 0 0 0 0 14.0 10 2 2 0 1 4 0 19 0 0 1.33 1 1.00 .200 50 55 0 0
Pierce, Rohn 2 0 3.77 6 0 0 0 0 1 14.1 10 7 6 2 1 4 0 14 0 0 0.59 0 0.98 .204 49 57 1 1
* Pina, Luis 1 0 3.78 7 0 0 0 0 0 16.2 20 11 7 1 0 6 0 12 0 3 3.20 0 1.56 .278 72 81 0 2
* Ratliff, Lane 0 0 15.00 2 1 0 0 0 0 3.0 7 6 5 0 0 1 0 4 0 0 4.00 1 2.67 .438 16 17 0 0
Scott, Troy 2 2 2.88 5 5 0 0 0 0 25.0 30 17 8 4 2 4 0 21 0 0 0.90 1 1.36 .283 106 112 0 0
Thieben, Daniel 1 0 5.25 7 0 0 0 0 1 12.0 14 10 7 0 1 11 0 5 1 2 0.94 1 2.08 .292 48 62 1 0
Urbina, Ugueth 1 2 6.39 8 0 0 0 1 1 12.2 20 12 9 1 2 7 0 14 0 6 1.50 2 2.13 .339 59 68 0 2
* Yarbrough, Ryan 0 0 0.00 2 0 0 0 1 1 4.0 1 0 0 0 0 1 0 5 0 0 1.67 0 0.50 .071 14 15 0 1
Team Total 13 11 3.86 24 24 0 2 9 14 217.0 203 128 93 15 19 73 0 209 1 22 1.84 17 1.27 .241 842 947 5 24
KEY: * - lefthanded hitter/pitcher, # - switch hitter
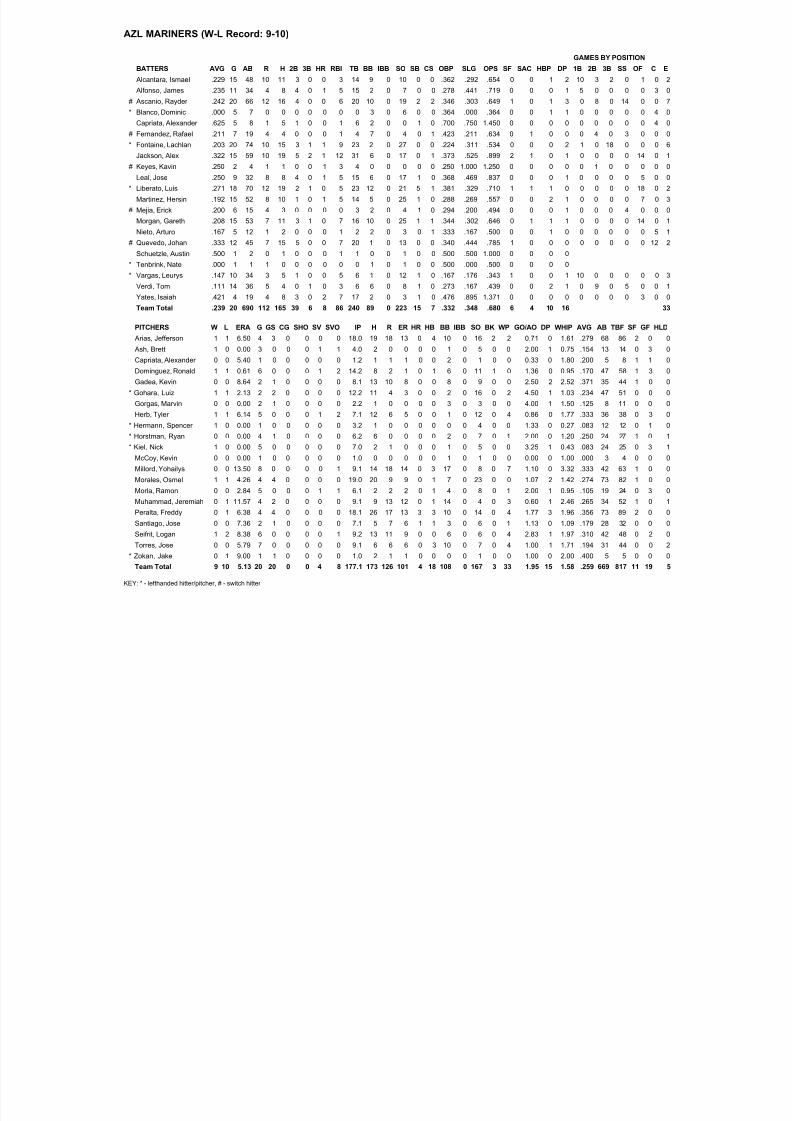
8/12/2019 2014 Mid-Season Report
http://slidepdf.com/reader/full/2014-mid-season-report 75/80
AZL MARINERS (W-L Record: 9-10)
GAMES BY POSITION
BATTERS AVG G AB R H 2B 3B HR RBI TB BB IBB SO SB CS OBP SLG OPS SF SAC HBP DP 1B 2B 3B SS OF C
Alcantara, Ismael .229 15 48 10 11 3 0 0 3 14 9 0 10 0 0 .362 .292 .654 0 0 1 2 10 3 2 0 1 0
Alfonso, James .235 11 34 4 8 4 0 1 5 15 2 0 7 0 0 .278 .441 .719 0 0 0 1 5 0 0 0 0 3
# Ascanio, Rayder .242 20 66 12 16 4 0 0 6 20 10 0 19 2 2 .346 .303 .649 1 0 1 3 0 8 0 14 0 0
* Blanco, Dominic .000 5 7 0 0 0 0 0 0 0 3 0 6 0 0 .364 .000 .364 0 0 1 1 0 0 0 0 0 4
Capriata, Alexander .625 5 8 1 5 1 0 0 1 6 2 0 0 1 0 .700 .750 1.450 0 0 0 0 0 0 0 0 0 4
# Fernandez, Rafael .211 7 19 4 4 0 0 0 1 4 7 0 4 0 1 .423 .211 .634 0 1 0 0 0 4 0 3 0 0
* Fontaine, Lachlan .203 20 74 10 15 3 1 1 9 23 2 0 27 0 0 .224 .311 .534 0 0 0 2 1 0 18 0 0 0
Jackson, Alex .322 15 59 10 19 5 2 1 12 31 6 0 17 0 1 .373 .525 .899 2 1 0 1 0 0 0 0 14 0
# Keyes, Kavin .250 2 4 1 1 0 0 1 3 4 0 0 0 0 0 .250 1.000 1.250 0 0 0 0 0 1 0 0 0 0
Leal, Jose .250 9 32 8 8 4 0 1 5 15 6 0 17 1 0 .368 .469 .837 0 0 0 1 0 0 0 0 5 0
* Liberato, Luis .271 18 70 12 19 2 1 0 5 23 12 0 21 5 1 .381 .329 .710 1 1 1 0 0 0 0 0 18 0
Martinez, Hersin .192 15 52 8 10 1 0 1 5 14 5 0 25 1 0 .288 .269 .557 0 0 2 1 0 0 0 0 7 0
# Mejia, Erick .200 6 15 4 3 0 0 0 0 3 2 0 4 1 0 .294 .200 .494 0 0 0 1 0 0 0 4 0 0
Morgan, Gareth .208 15 53 7 11 3 1 0 7 16 10 0 25 1 1 .344 .302 .646 0 1 1 1 0 0 0 0 14 0
Nieto, Arturo .167 5 12 1 2 0 0 0 1 2 2 0 3 0 1 .333 .167 .500 0 0 1 0 0 0 0 0 0 5
# Quevedo, Johan .333 12 45 7 15 5 0 0 7 20 1 0 13 0 0 .340 .444 .785 1 0 0 0 0 0 0 0 0 12
Schuetzle, Austin .500 1 2 0 1 0 0 0 1 1 0 0 1 0 0 .500 .500 1.000 0 0 0 0
* Tenbrink, Nate .000 1 1 1 0 0 0 0 0 0 1 0 1 0 0 .500 .000 .500 0 0 0 0
* Vargas, Leurys .147 10 34 3 5 1 0 0 5 6 1 0 12 1 0 .167 .176 .343 1 0 0 1 10 0 0 0 0 0
Verdi, Tom .111 14 36 5 4 0 1 0 3 6 6 0 8 1 0 .273 .167 .439 0 0 2 1 0 9 0 5 0 0
Yates, Isaiah
.421 4 19 4 8 3 0 2 7 17 2 0 3 1 0 .476 .895 1.371 0 0 0 0 0 0 0 0 3 0 Team Total .239 20 690 112 165 39 6 8 86 240 89 0 223 15 7 .332 .348 .680 6 4 10 16
PITCHERS W L ERA G GS CG SHO SV SVO IP H R ER HR HB BB IBB SO BK WP GO/AO DP WHIP AVG AB TBF SF GF H
Arias, Jefferson 1 1 6.50 4 3 0 0 0 0 18.0 19 18 13 0 4 10 0 16 2 2 0.71 0 1.61 .279 68 86 2 0
Ash, Brett 1 0 0.00 3 0 0 0 1 1 4.0 2 0 0 0 0 1 0 5 0 0 2.00 1 0.75 .154 13 14 0 3
Capriata, Alexander 0 0 5.40 1 0 0 0 0 0 1.2 1 1 1 0 0 2 0 1 0 0 0.33 0 1.80 .200 5 8 1 1
Dominguez, Ronald 1 1 0.61 6 0 0 0 1 2 14.2 8 2 1 0 1 6 0 11 1 0 1.36 0 0.95 .170 47 58 1 3
Gadea, Kevin 0 0 8.64 2 1 0 0 0 0 8.1 13 10 8 0 0 8 0 9 0 0 2.50 2 2.52 .371 35 44 1 0
* Gohara, Luiz 1 1 2.13 2 2 0 0 0 0 12.2 11 4 3 0 0 2 0 16 0 2 4.50 1 1.03 .234 47 51 0 0
Gorgas, Marvin 0 0 0.00 2 1 0 0 0 0 2.2 1 0 0 0 0 3 0 3 0 0 4.00 1 1.50 .125 8 11 0 0
Herb, Tyler 1 1 6.14 5 0 0 0 1 2 7.1 12 6 5 0 0 1 0 12 0 4 0.86 0 1.77 .333 36 38 0 3
* Hermann, Spencer 1 0 0.00 1 0 0 0 0 0 3.2 1 0 0 0 0 0 0 4 0 0 1.33 0 0.27 .083 12 12 0 1
* Horstman, Ryan 0 0 0.00 4 1 0 0 0 0 6.2 6 0 0 0 0 2 0 7 0 1 2.00 0 1.20 .250 24 27 1 0
* Kiel, Nick 1 0 0.00 5 0 0 0 0 0 7.0 2 1 0 0 0 1 0 5 0 0 3.25 1 0.43 .083 24 25 0 3
McCoy, Kevin 0 0 0.00 1 0 0 0 0 0 1.0 0 0 0 0 0 1 0 1 0 0 0.00 0 1.00 .000 3 4 0 0
Millord, Yohailys 0 0 13.50 8 0 0 0 0 1 9.1 14 18 14 0 3 17 0 8 0 7 1.10 0 3.32 .333 42 63 1 0
Morales, Osmel 1 1 4.26 4 4 0 0 0 0 19.0 20 9 9 0 1 7 0 23 0 0 1.07 2 1.42 .274 73 82 1 0
Morla, Ramon 0 0 2.84 5 0 0 0 1 1 6.1 2 2 2 0 1 4 0 8 0 1 2.00 1 0.95 .105 19 24 0 3
Muhammad, Jeremiah 0 1 11.57 4 2 0 0 0 0 9.1 9 13 12 0 1 14 0 4 0 3 0.60 1 2.46 .265 34 52 1 0
Peralta, Freddy 0 1 6.38 4 4 0 0 0 0 18.1 26 17 13 3 3 10 0 14 0 4 1.77 3 1.96 .356 73 89 2 0
Santiago, Jose 0 0 7.36 2 1 0 0 0 0 7.1 5 7 6 1 1 3 0 6 0 1 1.13 0 1.09 .179 28 32 0 0
Seifrit, Logan 1 2 8.38 6 0 0 0 0 1 9.2 13 11 9 0 0 6 0 6 0 4 2.83 1 1.97 .310 42 48 0 2
Torres, Jose 0 0 5.79 7 0 0 0 0 0 9.1 6 6 6 0 3 10 0 7 0 4 1.00 1 1.71 .194 31 44 0 0
* Zokan, Jake 0 1 9.00 1 1 0 0 0 0 1.0 2 1 1 0 0 0 0 1 0 0 1.00 0 2.00 .400 5 5 0 0
Team Total 9 10 5.13 20 20 0 0 4 8 177.1 173 126 101 4 18 108 0 167 3 33 1.95 15 1.58 .259 669 817 11 19
KEY: * - lefthanded hitter/pitcher, # - switch hitter

8/12/2019 2014 Mid-Season Report
http://slidepdf.com/reader/full/2014-mid-season-report 76/80
DSL Mariners (W-L Record: 17-20)
GAMES BY POSITION
BATTERS AVG G AB R H 2B 3B HR RBI TB BB IBB SO SB CS OBP SLG OPS SF SAC HBP DP 1B 2B 3B SS OF C
Almonte, Adalfi .245 31 110 23 27 8 0 4 12 47 17 0 22 6 4 .370 .427 .798 2 1 6 3 0 0 0 0 30 0
Almonte, Miguel .190 9 21 2 4 0 0 1 3 7 3 0 8 1 0 .292 .333 .625 0 0 0 0 1 0 0 0 0 5
* Baez, Cesar .279 29 86 20 24 1 4 0 14 33 17 0 21 9 4 .417 .384 .800 1 4 4 0 0 7 0 3 15 0
De la Cruz, Adonis .211 17 57 8 12 4 0 2 11 22 8 0 11 1 3 .328 .386 .714 0 1 2 1 0 0 0 0 10 0
Dominguez, Anthony .211 33 90 15 19 0 2 0 9 23 15 0 16 2 3 .336 .256 .592 0 4 2 0 2 0 12 19 2 0
Franco, Joshua .212 25 85 7 18 5 0 0 9 23 7 0 26 2 2 .287 .271 .558 0 1 2 0 15 0 0 0 0 0
Gonzalez, Ivan .320 27 103 23 33 5 1 1 15 43 7 0 12 4 3 .365 .417 .783 3 1 2 1 6 13 6 0 0 0
Jimenez, Angel .298 28 104 16 31 6 1 2 22 45 14 0 22 4 2 .407 .433 .839 0 0 5 2 7 0 19 1 0 0
# Joseph, Luis .256 24 86 12 22 7 1 0 6 31 3 0 18 1 4 .289 .360 .649 0 1 1 0 0 22 0 1 0 0
Morales, Johmbeyker .296 32 125 21 37 9 1 3 20 57 10 0 26 6 2 .362 .456 .818 2 3 4 3 2 0 8 18 0 0
Pena, Onil .319 28 113 15 36 7 1 2 18 51 5 0 19 6 2 .376 .451 .827 1 2 6 3 0 0 0 0 0 24
Perez, Yeison .000 1 4 0 0 0 0 0 0 0 0 0 1 0 0 .000 .000 .000 0 0 0 0 0 0 0 0 0 1
Ramirez, Gregory .135 26 74 9 10 0 0 0 2 10 6 0 27 1 2 .229 .135 .364 0 1 3 2 0 0 1 0 20 0
Rojas, Brayan .288 32 132 26 38 4 2 0 16 46 16 0 32 9 3 .377 .348 .725 2 2 4 1 0 0 0 0 31 0
Rosa, Jose .230 23 74 11 17 2 0 2 9 25 6 0 18 2 0 .352 .338 .690 0 1 8 2 11 0 1 0 1 11
* Rosario, Ronald .205 14 44 5 9 0 1 0 3 11 8 0 15 1 1 .327 .250 .577 0 0 0 1 1 0 0 0 14 0
Team Total .258 37 1308 213 337 58 14 17 169 474 142 0 294 55 35 .350 .362 .712 11 22 49 19
PITCHERS W L ERA G GS CG SHO SV SVO IP H R ER HR HB BB IBB SO BK WP GO/AO DP WHIP AVG AB TBF SF GF H
Almonte, Miguel 0 0 4.50 1 0 0 0 0 0 2.0 4 1 1 0 0 2 0 0 0 0 0.25 0 3.00 .444 9 11 0 1
* Asencio, Oliver 2 1 3.27 6 1 0 0 0 0 22.0 24 10 8 0 0 6 0 24 0 1 1.77 2 1.36 .289 83 90 1 1
Brito, Frankely 0 1 10.13 4 2 0 0 0 0 8.0 6 10 9 0 0 16 0 7 0 4 3.00 0 2.75 .207 29 45 0 1
Encarnacion, Frank 0 1 9.82 6 1 0 0 0 0 11.0 11 18 12 0 1 22 0 10 0 10 1.00 0 3.00 .268 41 66 1 0
Feliz, Jose 1 1 3.14 7 1 0 0 1 1 28.2 32 10 10 2 3 8 0 19 1 2 0.81 2 1.40 .274 117 129 0 2
* Guzman, Carlos 0 0 17.18 3 0 0 0 1 1 3.2 6 7 7 0 0 4 0 2 0 1 1.33 0 2.73 .400 15 19 0 2
Jimenez, Luis 1 1 3.56 12 0 0 0 0 0 30.1 32 17 12 2 1 12 1 28 0 11 1.00 3 1.45 .274 117 137 3 4
* Manzueta, Romulo 2 1 2.67 7 7 0 0 0 0 27.0 20 11 8 0 2 15 0 31 1 4 1.00 2 1.30 .208 96 114 1 0
Martinez, Edwin 0 0 1.01 11 2 0 0 2 2 26.2 19 6 3 0 4 7 0 21 0 3 2.56 3 0.97 .204 93 108 0 5
Paulino, Roberto 0 0 6.46 12 0 0 0 0 0 15.1 14 15 11 2 4 15 0 12 1 7 0.75 1 1.89 .237 59 81 1 5
Pedie, Raul 3 2 1.71 12 0 0 0 1 4 26.1 16 8 5 4 3 13 0 32 0 2 0.80 1 1.10 .180 89 109 2 9
Reyes, Ricardo 1 2 13.14 6 1 0 0 0 1 12.1 22 24 18 1 1 10 0 12 0 5 0.56 0 2.59 .407 54 70 5 0
Sanchez, Miguel 2 1 2.66 11 0 0 0 2 2 23.2 25 10 7 0 1 9 0 22 0 4 0.92 3 1.44 .275 91 103 0 3
Santiago, Jose 2 2 3.51 6 6 0 0 0 0 25.2 19 13 10 0 2 13 0 31 0 4 1.65 1 1.25 .202 94 110 0 0
Severino, Robert 2 1 2.79 10 0 0 0 1 1 19.1 13 10 6 0 4 17 1 25 0 1 0.62 0 1.55 .194 67 93 2 4
Tamarez, Albert 0 2 7.85 7 5 0 0 0 0 18.1 27 26 16 3 2 19 0 12 0 4 1.63 3 2.51 .342 79 102 2 0
* Urquides, Melchor 0 2 7.36 6 6 0 0 0 0 14.2 19 16 12 0 2 18 0 12 0 4 1.00 4 2.52 .328 58 79 1 0
Zabala, Aneurys 1 2 3.09 7 5 0 0 0 0 23.1 18 14 8 0 0 20 0 11 0 4 1.39 5 1.63 .220 82 104 0 0
Team Total 17 20 4.28 37 37 0 1 8 12 338.1 327 226 161 14 30 226 2 311 3 71 1.70 30 1.63 .257 1273 1570 19 37
KEY: * - lefthanded hitter/pitcher, # - switch hitter
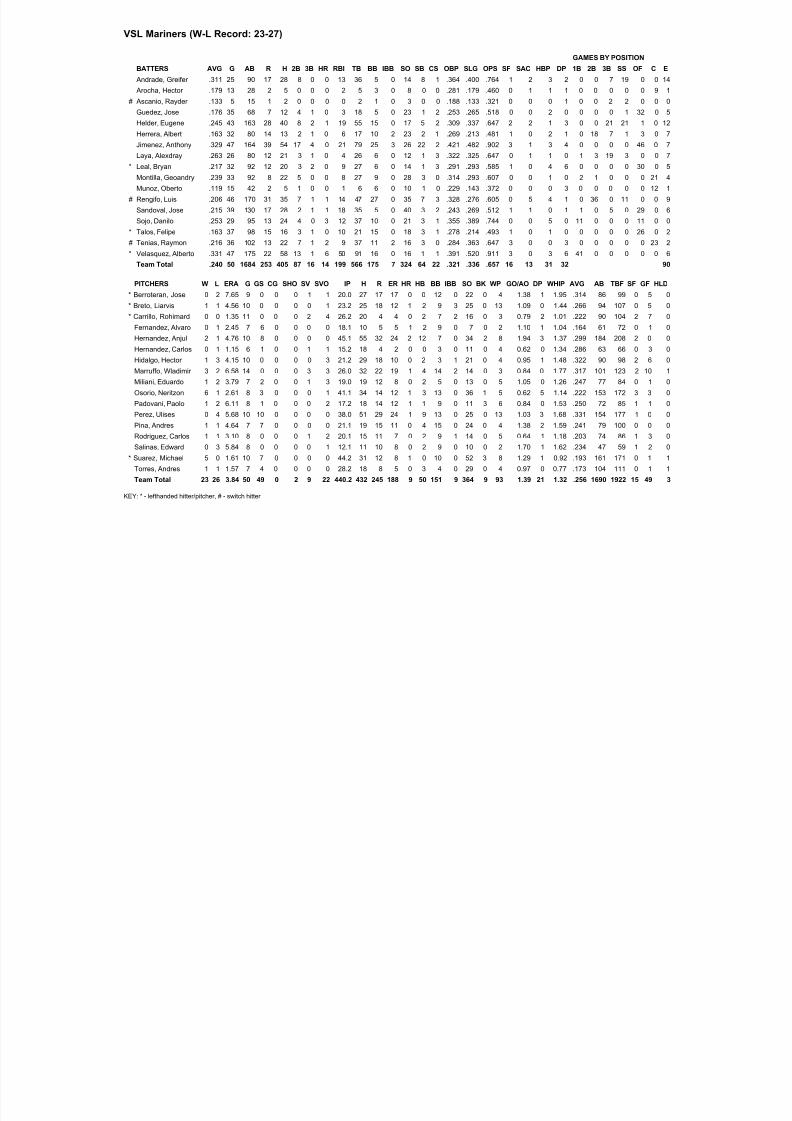
8/12/2019 2014 Mid-Season Report
http://slidepdf.com/reader/full/2014-mid-season-report 77/80
VSL Mariners (W-L Record: 23-27)
GAMES BY POSITION
BATTERS AVG G AB R H 2B 3B HR RBI TB BB IBB SO SB CS OBP SLG OPS SF SAC HBP DP 1B 2B 3B SS OF C
Andrade, Greifer .311 25 90 17 28 8 0 0 13 36 5 0 14 8 1 .364 .400 .764 1 2 3 2 0 0 7 19 0 0
Arocha, Hector .179 13 28 2 5 0 0 0 2 5 3 0 8 0 0 .281 .179 .460 0 1 1 1 0 0 0 0 0 9
# Ascanio, Rayder .133 5 15 1 2 0 0 0 0 2 1 0 3 0 0 .188 .133 .321 0 0 0 1 0 0 2 2 0 0
Guedez, Jose .176 35 68 7 12 4 1 0 3 18 5 0 23 1 2 .253 .265 .518 0 0 2 0 0 0 0 1 32 0
Helder, Eugene .245 43 163 28 40 8 2 1 19 55 15 0 17 5 2 .309 .337 .647 2 2 1 3 0 0 21 21 1 0
Herrera, Albert .163 32 80 14 13 2 1 0 6 17 10 2 23 2 1 .269 .213 .481 1 0 2 1 0 18 7 1 3 0
Jimenez, Anthony .329 47 164 39 54 17 4 0 21 79 25 3 26 22 2 .421 .482 .902 3 1 3 4 0 0 0 0 46 0
Laya, Alexdray .263 26 80 12 21 3 1 0 4 26 6 0 12 1 3 .322 .325 .647 0 1 1 0 1 3 19 3 0 0
* Leal, Bryan .217 32 92 12 20 3 2 0 9 27 6 0 14 1 3 .291 .293 .585 1 0 4 6 0 0 0 0 30 0
Montilla, Geoandry .239 33 92 8 22 5 0 0 8 27 9 0 28 3 0 .314 .293 .607 0 0 1 0 2 1 0 0 0 21
Munoz, Oberto .119 15 42 2 5 1 0 0 1 6 6 0 10 1 0 .229 .143 .372 0 0 0 3 0 0 0 0 0 12
# Rengifo, Luis .206 46 170 31 35 7 1 1 14 47 27 0 35 7 3 .328 .276 .605 0 5 4 1 0 36 0 11 0 0
Sandoval, Jose .215 39 130 17 28 2 1 1 18 35 5 0 40 3 2 .243 .269 .512 1 1 0 1 1 0 5 0 29 0
Sojo, Danilo .253 29 95 13 24 4 0 3 12 37 10 0 21 3 1 .355 .389 .744 0 0 5 0 11 0 0 0 11 0
* Talos, Felipe .163 37 98 15 16 3 1 0 10 21 15 0 18 3 1 .278 .214 .493 1 0 1 0 0 0 0 0 26 0
# Tenias, Raymon .216 36 102 13 22 7 1 2 9 37 11 2 16 3 0 .284 .363 .647 3 0 0 3 0 0 0 0 0 23
* Velasquez, Alberto .331 47 175 22 58 13 1 6 50 91 16 0 16 1 1 .391 .520 .911 3 0 3 6 41 0 0 0 0 0
Team Total .240 50 1684 253 405 87 16 14 199 566 175 7 324 64 22 .321 .336 .657 16 13 31 32
PITCHERS W L ERA G GS CG SHO SV SVO IP H R ER HR HB BB IBB SO BK WP GO/AO DP WHIP AVG AB TBF SF GF H
* Berroteran, Jose 0 2 7.65 9 0 0 0 1 1 20.0 27 17 17 0 0 12 0 22 0 4 1.38 1 1.95 .314 86 99 0 5
* Breto, Liarvis 1 1 4.56 10 0 0 0 0 1 23.2 25 18 12 1 2 9 3 25 0 13 1.09 0 1.44 .266 94 107 0 5
* Carrillo, Rohimard 0 0 1.35 11 0 0 0 2 4 26.2 20 4 4 0 2 7 2 16 0 3 0.79 2 1.01 .222 90 104 2 7
Fernandez, Alvaro 0 1 2.45 7 6 0 0 0 0 18.1 10 5 5 1 2 9 0 7 0 2 1.10 1 1.04 .164 61 72 0 1
Hernandez, Anjul 2 1 4.76 10 8 0 0 0 0 45.1 55 32 24 2 12 7 0 34 2 8 1.94 3 1.37 .299 184 208 2 0
Hernandez, Carlos 0 1 1.15 6 1 0 0 1 1 15.2 18 4 2 0 0 3 0 11 0 4 0.62 0 1.34 .286 63 66 0 3
Hidalgo, Hector 1 3 4.15 10 0 0 0 0 3 21.2 29 18 10 0 2 3 1 21 0 4 0.95 1 1.48 .322 90 98 2 6
Marruffo, Wladimir 3 2 6.58 14 0 0 0 3 3 26.0 32 22 19 1 4 14 2 14 0 3 0.84 0 1.77 .317 101 123 2 10
Miliani, Eduardo 1 2 3.79 7 2 0 0 1 3 19.0 19 12 8 0 2 5 0 13 0 5 1.05 0 1.26 .247 77 84 0 1
Osorio, Neritzon 6 1 2.61 8 3 0 0 0 1 41.1 34 14 12 1 3 13 0 36 1 5 0.62 5 1.14 .222 153 172 3 3
Padovani, Paolo 1 2 6.11 8 1 0 0 0 2 17.2 18 14 12 1 1 9 0 11 3 6 0.84 0 1.53 .250 72 85 1 1
Perez, Ulises 0 4 5.68 10 10 0 0 0 0 38.0 51 29 24 1 9 13 0 25 0 13 1.03 3 1.68 .331 154 177 1 0
Pina, Andres 1 1 4.64 7 7 0 0 0 0 21.1 19 15 11 0 4 15 0 24 0 4 1.38 2 1.59 .241 79 100 0 0
Rodriguez, Carlos 1 1 3.10 8 0 0 0 1 2 20.1 15 11 7 0 2 9 1 14 0 5 0.64 1 1.18 .203 74 86 1 3
Salinas, Edward 0 3 5.84 8 0 0 0 0 1 12.1 11 10 8 0 2 9 0 10 0 2 1.70 1 1.62 .234 47 59 1 2
* Suarez, Michael 5 0 1.61 10 7 0 0 0 0 44.2 31 12 8 1 0 10 0 52 3 8 1.29 1 0.92 .193 161 171 0 1
Torres, Andres 1 1 1.57 7 4 0 0 0 0 28.2 18 8 5 0 3 4 0 29 0 4 0.97 0 0.77 .173 104 111 0 1
Team Total 23 26 3.84 50 49 0 2 9 22 440.2 432 245 188 9 50 151 9 364 9 93 1.39 21 1.32 .256 1690 1922 15 49
KEY: * - lefthanded hitter/pitcher, # - switch hitter
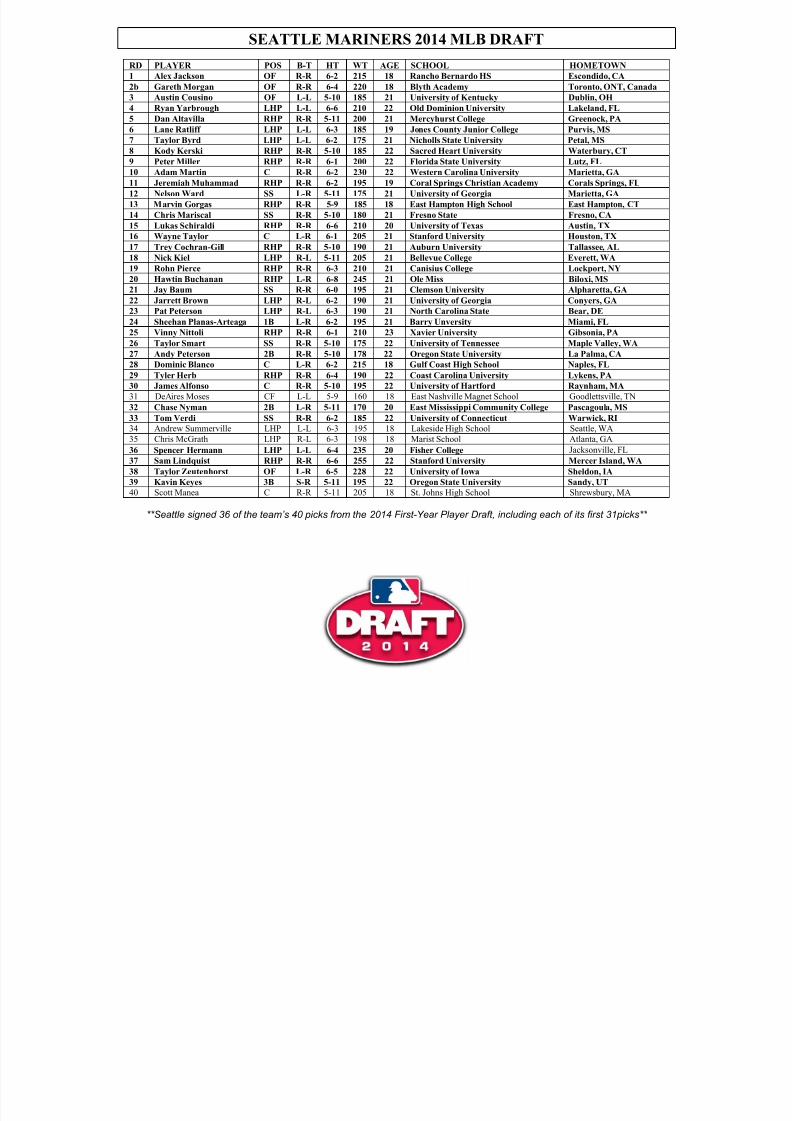
8/12/2019 2014 Mid-Season Report
http://slidepdf.com/reader/full/2014-mid-season-report 78/80
SEATTLE MARINERS 2014 MLB DRAFT
RD PLAYER POS B-T HT WT AGE SCHOOL HOMETOWN
1 Alex Jackson OF R-R 6-2 215 18 Rancho Bernardo HS Escondido, CA
2b Gareth Morgan OF R-R 6-4 220 18 Blyth Academy Toronto, ONT, Canada
3 Austin Cousino OF L-L 5-10 185 21 University of Kentucky Dublin, OH
4 Ryan Yarbrough LHP L-L 6-6 210 22 Old Dominion University Lakeland, FL
5 Dan Altavilla RHP R-R 5-11 200 21 Mercyhurst College Greenock, PA
6 Lane Ratliff LHP L-L 6-3 185 19 Jones County Junior College Purvis, MS
7 Taylor Byrd LHP L-L 6-2 175 21 Nicholls State University Petal, MS
8 Kody Kerski RHP R-R 5-10 185 22 Sacred Heart University Waterbury, CT9 Peter Miller RHP R-R 6-1 200 22 Florida State University Lutz, FL
10 Adam Martin C R-R 6-2 230 22 Western Carolina University Marietta, GA
11 Jeremiah Muhammad RHP R-R 6-2 195 19 Coral Springs Christian Academy Corals Springs, FL
12 Nelson Ward SS L-R 5-11 175 21 University of Georgia Marietta, GA
13 Marvin Gorgas RHP R-R 5-9 185 18 East Hampton High School East Hampton, CT
14 Chris Mariscal SS R-R 5-10 180 21 Fresno State Fresno, CA
15 Lukas Schiraldi RHP R-R 6-6 210 20 University of Texas Austin, TX
16 Wayne Taylor C L-R 6-1 205 21 Stanford University Houston, TX
17 Trey Cochran-Gill RHP R-R 5-10 190 21 Auburn University Tallassee, AL
18 Nick Kiel LHP R-L 5-11 205 21 Bellevue College Everett, WA
19 Rohn Pierce RHP R-R 6-3 210 21 Canisius College Lockport, NY
20 Hawtin Buchanan RHP L-R 6-8 245 21 Ole Miss Biloxi, MS
21 Jay Baum SS R-R 6-0 195 21 Clemson University Alpharetta, GA
22 Jarrett Brown LHP R-L 6-2 190 21 University of Georgia Conyers, GA23 Pat Peterson LHP R-L 6-3 190 21 North Carolina State Bear, DE
24 Sheehan Planas-Arteaga 1B L-R 6-2 195 21 Barry Unversity Miami, FL
25 Vinny Nittoli RHP R-R 6-1 210 23 Xavier University Gibsonia, PA
26 Taylor Smart SS R-R 5-10 175 22 University of Tennessee Maple Valley, WA
27 Andy Peterson 2B R-R 5-10 178 22 Oregon State University La Palma, CA
28 Dominic Blanco C L-R 6-2 215 18 Gulf Coast High School Naples, FL
29 Tyler Herb RHP R-R 6-4 190 22 Coast Carolina University Lykens, PA
30 James Alfonso C R-R 5-10 195 22 University of Hartford Raynham, MA
31 DeAires Moses CF L-L 5-9 160 18 East Nashville Magnet School Goodlettsville, TN
32 Chase Nyman 2B L-R 5-11 170 20 East Mississippi Community College Pascagoula, MS
33 Tom Verdi SS R-R 6-2 185 22 University of Connecticut Warwick, RI
34 Andrew Summerville LHP L-L 6-3 195 18 Lakeside High School Seattle, WA
35 Chris McGrath LHP R-L 6-3 198 18 Marist School Atlanta, GA
36 Spencer Hermann LHP L-L 6-4 235 20 Fisher College Jacksonville, FL37 Sam Lindquist RHP R-R 6-6 255 22 Stanford University Mercer Island, WA
38 Taylor Zeutenhorst OF L-R 6-5 228 22 University of Iowa Sheldon, IA
39 Kavin Keyes 3B S-R 5-11 195 22 Oregon State University Sandy, UT
40 Scott Manea C R-R 5-11 205 18 St. Johns High School Shrewsbury, MA
**Seattle signed 36 of the team’s 40 picks from the 2014 First-Year Player Draft, including each of its first 31picks**

8/12/2019 2014 Mid-Season Report
http://slidepdf.com/reader/full/2014-mid-season-report 79/80
2014 Record Breakdown
Record Breakdown W L Pct. By Month/Day: W L Pct.
Overall 51 44 .537 Monday 11 1 .917
Safeco Field 24 26 .480 Tuesday 9 6 .600
Road 27 18 .600 Wednesday 6 9 .400
Day Games 20 12 .625 Thursday 3 6 .333
Night Games 31 32 .492 Friday 6 8 .429Seattle Scores in 1st 15 7 .682 Saturday 8 7 .533
Opponent Scores in 1st 9 15 .375 Sunday 8 7 .533
Scoring First 31 12 .721 March 1 0 1.000
Opponent Scores First 20 32 .385 April 10 14 .417
Made 0 Errors 35 26 .574 May 16 14 .533
Made 1 Error 14 12 .538 June 18 10 .643
Made 2+ Errors 2 6 .250 July 6 6 .500
Starter Works 6+ 39 20 .661 August #DIV/0!
Quality Start 36 13 .735 September #DIV/0!
1st Game of Series 21 11 .656 Pre ASG 51 44 .537
2nd Game of Series 15 16 .484 Post ASG 0 0 #DIV/0!
3rd Game of Series 14 11 .560
4th Game of Series 1 6 .143 Scoring/Hitting W L Pct.
Rubber Games 4 4 .500 Outhit Opponent 44 9 .830
Travel Day 14 8 .636 Outhit by Opponent 6 32 .158
Before Off Day 5 5 .500 Hits are Tied 1 3 .250
After Off Day 9 3 .750 10+ hits 29 6 .829
Record SB 21 11 .656 Opp. 10+ hits 7 18 .280
1-Run Games 11 14 .440 Scores 4-or-more 36 9 .800
2-Run Games 14 11 .560 Scores 3-or-less 15 35 .300
3-Run Games 5 9 .357 Score 3+ Innings 27 7 .794
Extra Innings 2 2 .500 Shutouts 7 11 .389
vs. RHP (Starter) 30 32 .484
vs. LHP (Starter) 21 12 .636 Lead/Trail/Tied W L Pct.
After 4 - Lead 30 10 .750
W L Pct. After 4 - Trail 10 23 .303
Hit HR 33 14 .702 After 4 - Tied 11 11 .500
No HR 18 30 .375 After 5 - Lead 36 9 .800
Opponent HR 28 30 .483 After 5 - Trail 5 31 .139Opponent No HR 23 14 .622 After 5 - Tied 10 4 .714
Seattle More HR 26 7 .788 After 6 - Lead 38 7 .844
Opponent More HR 13 22 .371 After 6 - Trail 5 33 .132
Equal HR 12 15 .444 After 6 - Tied 8 4 .667
After 7 - Lead 43 5 .896
W L Pct. After 7 - Trail 4 32 .111
14 21 .400 After 7 - Tied 4 7 .364
10 4 .714 After 8 - Lead 45 2 .957
20 14 .588 After 8 - Trail 2 37 .051
7 4 .636 After 8 - Tied 4 5 .444
0 1 .000 .500 or Better 25 14 .641
Less than .500 26 30 .464
Record as Leadoff: W L Pct. CFB/Blown 22 17 --
10 13 .435
9 5 .643 W L Pct.
13 13 .500 AL West 26 21 .553
15 11 .577 AL Central 12 11 .522
4 2 .667 AL East 9 7 .563
National League 4 5 .444
Series Record W L T
Series Record 15 12 5 Record as Catcher: W L Pct.
42 33 .560
Safeco Field Roof W L Pct. 8 11 .421
Open 20 19 .513 1 0 1.000
Closed 3 1 .750
Moved 1 6 .143
Sucre
Zunino
Buck
By Division
Home Runs:
By Uniform / Hats
Almonte
Saunders
Jones
Chavez
Bloomquist
White
Northwest Green
Gray - Road
Astro Navy - Road
Throwback
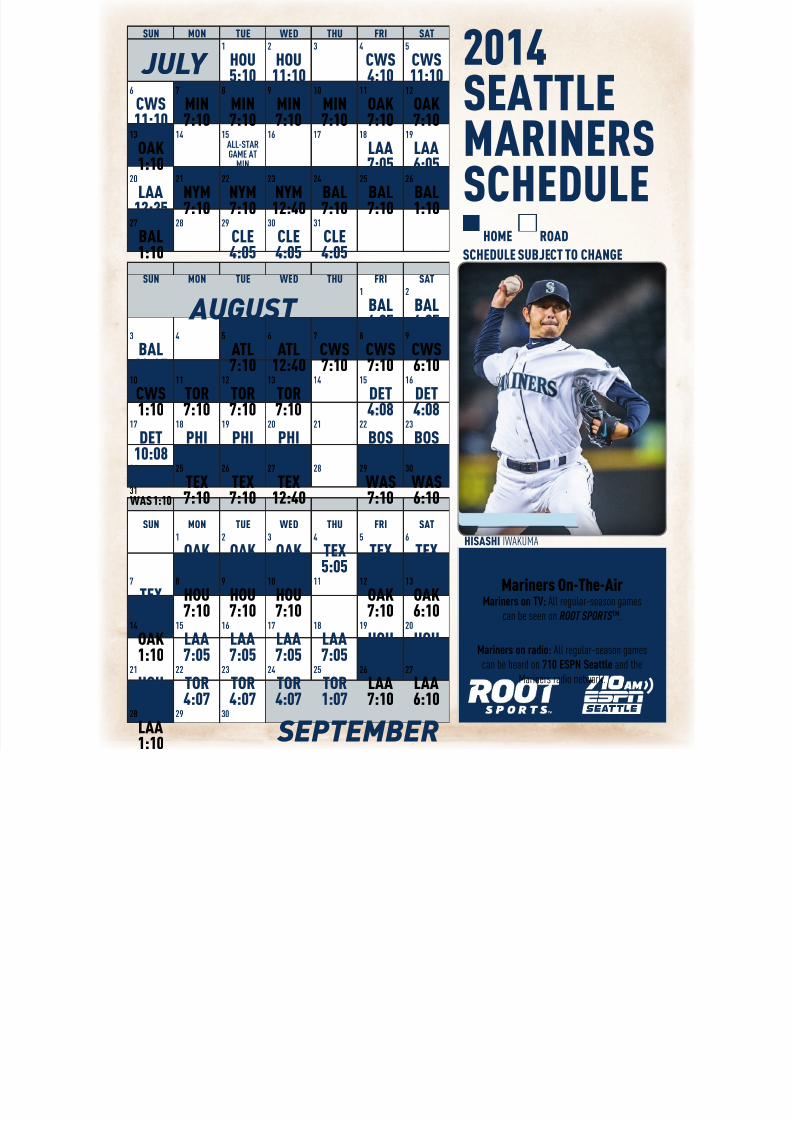
8/12/2019 2014 Mid-Season Report
http://slidepdf.com/reader/full/2014-mid-season-report 80/80
HISASHI IWAKUMA
Mariners On-The-Air
HOME ROAD
SCHEDULE SUBJECT TO CHANGE
2014
SEATTLE
MARINERSSCHEDULE
SUN MON TUE WED THU FRI SAT
JULY 1
HOU
5:10
2
HOU
11:10
3 4
CWS
4:10
5
CWS
11:106
CWS
11:10
7
MIN
7:10
8
MIN
7:10
9
MIN
7:10
10
MIN
7:10
11
OAK
7:10
12
OAK
7:1013
OAK
1:10
14 15
ALL-STAR
GAME AT
MIN
16 17 18
LAA
7:05
19
LAA
6:0520
LAA
12:35
21
NYM
7:10
22
NYM
7:10
23
NYM
12:40
24
BAL
7:10
25
BAL
7:10
26
BAL
1:1027
BAL
1:10
28 29
CLE
4:05
30
CLE
4:05
31
CLE
4:05
SUN MON TUE WED THU FRI SAT
AUGUST
1
BAL
4:05
2
BAL
4:053
BAL
10:35
4 5
ATL
7:10
6
ATL
12:40
7
CWS
7:10
8
CWS
7:10
9
CWS
6:1010
CWS
1:10
11
TOR
7:10
12
TOR
7:10
13
TOR
7:10
14 15
DET
4:08
16
DET
4:0817
DET
10:08
18
PHI
4:05
19
PHI
4:05
20
PHI
10:05
21 22
BOS
4:10
23
BOS
10:3524
BOS 10:3525
TEX
7:10
26
TEX
7:10
27
TEX
12:40
28 29
WAS
7:10
30
WAS
6:1031
WAS 1:10
SUN MON TUE WED THU FRI SAT
1
OAK
1:05
2
OAK
7:05
3
OAK
12:35
4
TEX
5:05
5
TEX
5:05
6
TEX
5:057 8 9 10 11 12 13
Related Documents