The 2012 Social Election Survey January 2013 Exploring the Role of Social Media in Influencing Perceptions and Voter Behavior in the 2012 Presidential Election #socialelection

2012 Social Election Survey Report Presentation Slides
Aug 23, 2014
Welcome message from author
This document is posted to help you gain knowledge. Please leave a comment to let me know what you think about it! Share it to your friends and learn new things together.
Transcript
The 2012 Social Election Survey
January 2013
Exploring the Role of Social Media in Influencing Perceptions and Voter Behavior in the 2012 Presidential Election
#socialelection
2
Objectives of the 2012 Social Election Survey
To understand:
– How the public was using social media to learn about and
engage in discussions about the election
– The perceived credibility of social media relative to other
sources of information
– The influence of social media in shaping perceptions about the
candidates and issues
– How effectively the candidates used social media to engage the
electorate
– Demographic differences in perception and behavior
Demographics
#socialelection
4
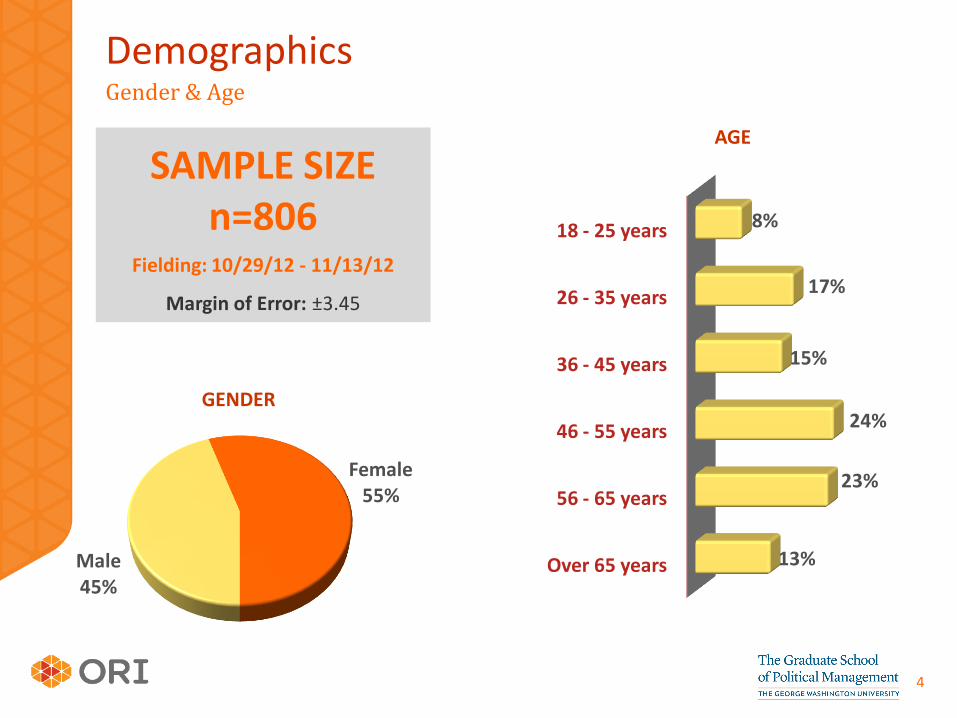
Male 45%
Female 55%
GENDER
Demographics Gender & Age
18 - 25 years
26 - 35 years
36 - 45 years
46 - 55 years
56 - 65 years
Over 65 years
8%
17%
15%
24%
23%
13%
SAMPLE SIZE n=806
Fielding: 10/29/12 - 11/13/12
Margin of Error: ±3.45
AGE
5
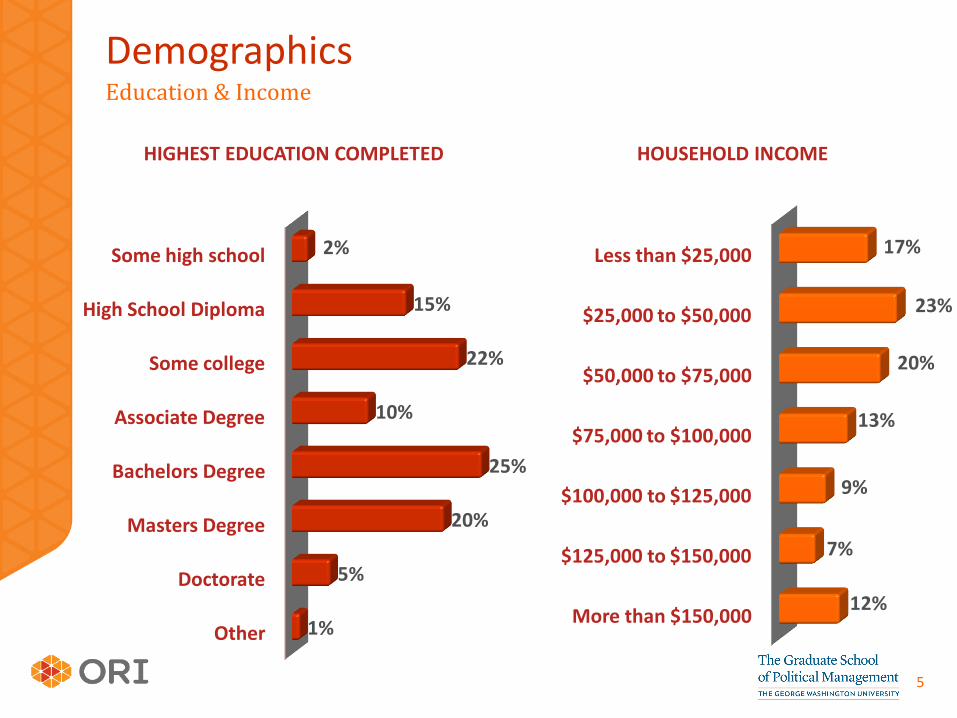
Less than $25,000
$25,000 to $50,000
$50,000 to $75,000
$75,000 to $100,000
$100,000 to $125,000
$125,000 to $150,000
More than $150,000
17%
23%
20%
13%
9%
7%
12%
Some high school
High School Diploma
Some college
Associate Degree
Bachelors Degree
Masters Degree
Doctorate
Other
2%
15%
22%
10%
25%
20%
5%
1%
Demographics Education & Income
HIGHEST EDUCATION COMPLETED HOUSEHOLD INCOME
6
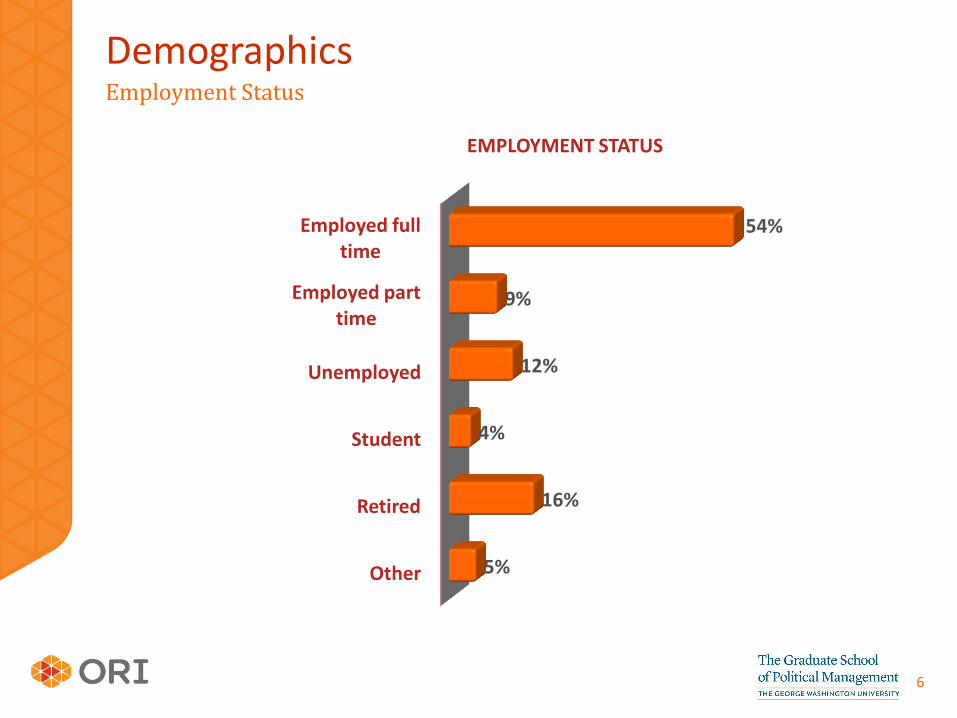
Demographics Employment Status
EMPLOYMENT STATUS
Employed full time
Employed part time
Unemployed
Student
Retired
Other
54%
9%
12%
4%
16%
5%
7
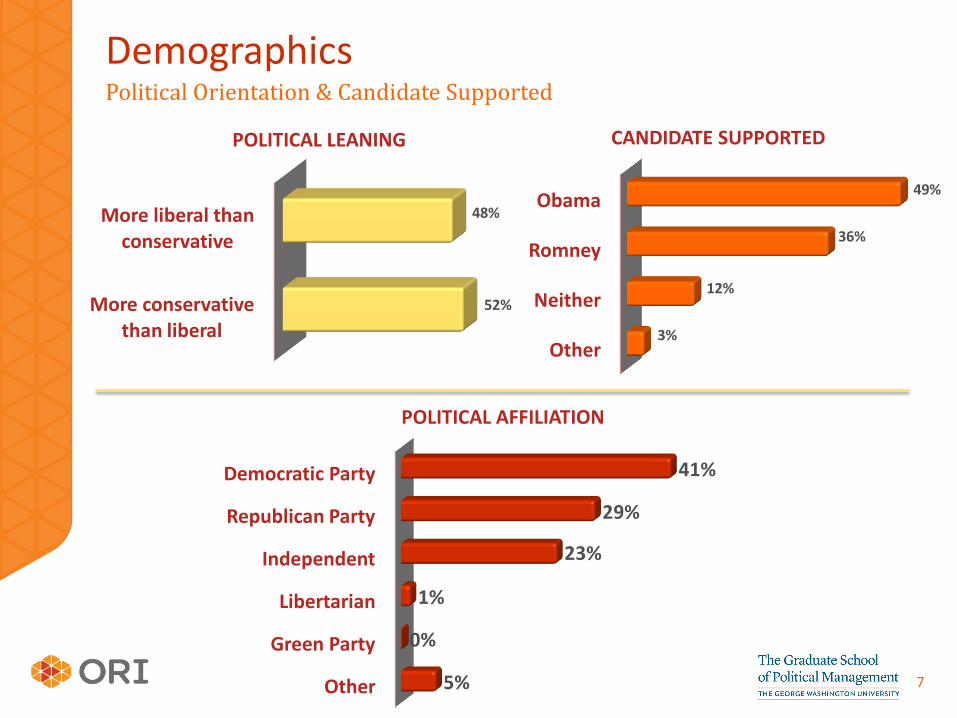
Demographics Political Orientation & Candidate Supported
CANDIDATE SUPPORTED
More liberal than conservative
More conservative than liberal
48%
52%
Obama
Romney
Neither
Other
49%
36%
12%
3%
POLITICAL LEANING
Democratic Party
Republican Party
Independent
Libertarian
Green Party
Other
41%
29%
23%
1%
0%
5%
POLITICAL AFFILIATION

Election Interest and Vote Influencers
#socialelection
9
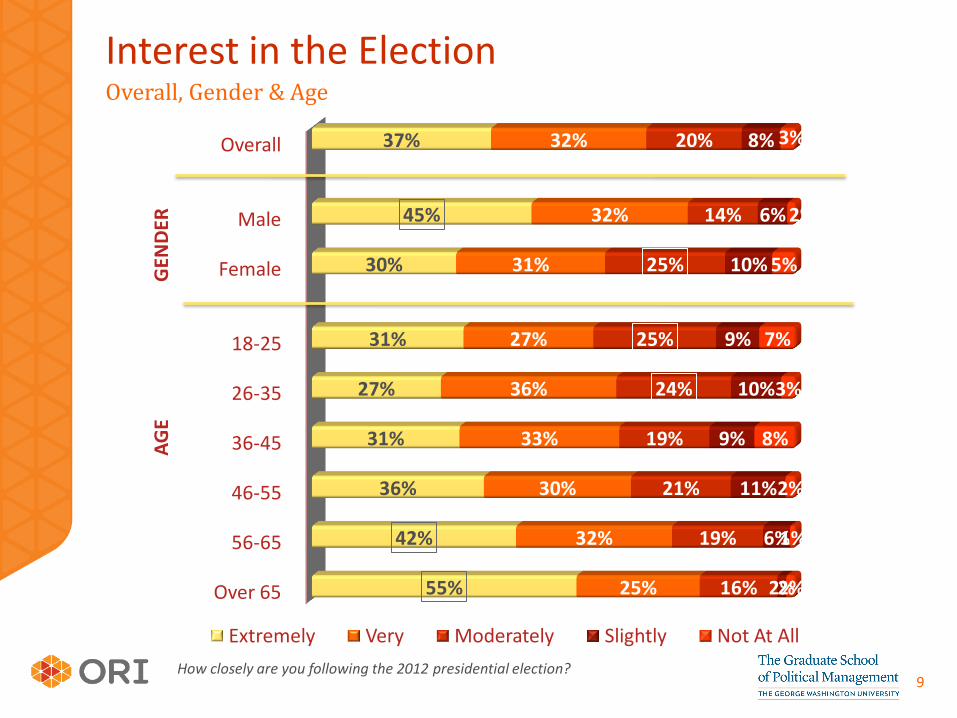
Overall
Male
Female
18-25
26-35
36-45
46-55
56-65
Over 65
37%
45%
30%
31%
27%
31%
36%
42%
55%
32%
32%
31%
27%
36%
33%
30%
32%
25%
20%
14%
25%
25%
24%
19%
21%
19%
16%
8%
6%
10%
9%
10%
9%
11%
6%
2%
3%
2%
5%
7%
3%
8%
2%
1%
2%
Extremely Very Moderately Slightly Not At All
Interest in the Election Overall, Gender & Age
How closely are you following the 2012 presidential election?
GEN
DER
A
GE
10
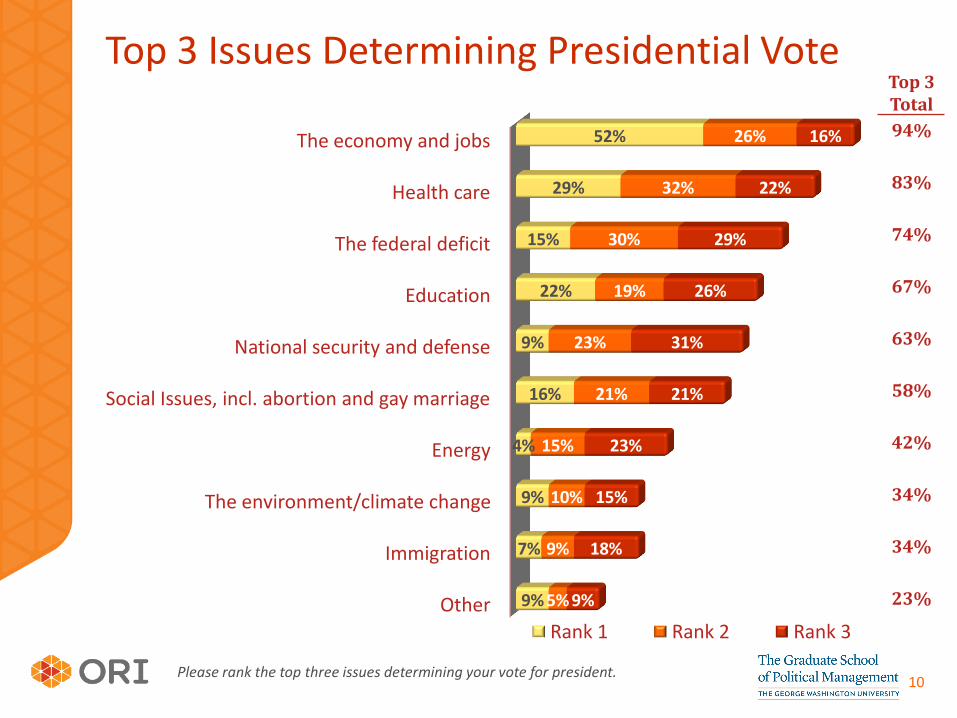
Top 3 Issues Determining Presidential Vote
The economy and jobs
Health care
The federal deficit
Education
National security and defense
Social Issues, incl. abortion and gay marriage
Energy
The environment/climate change
Immigration
Other
52%
29%
15%
22%
9%
16%
4%
9%
7%
9%
26%
32%
30%
19%
23%
21%
15%
10%
9%
5%
16%
22%
29%
26%
31%
21%
23%
15%
18%
9%
Rank 1 Rank 2 Rank 3
Please rank the top three issues determining your vote for president.
Top 3 Total
94%
83%
74%
67%
63%
58%
42%
34%
34%
23%
11
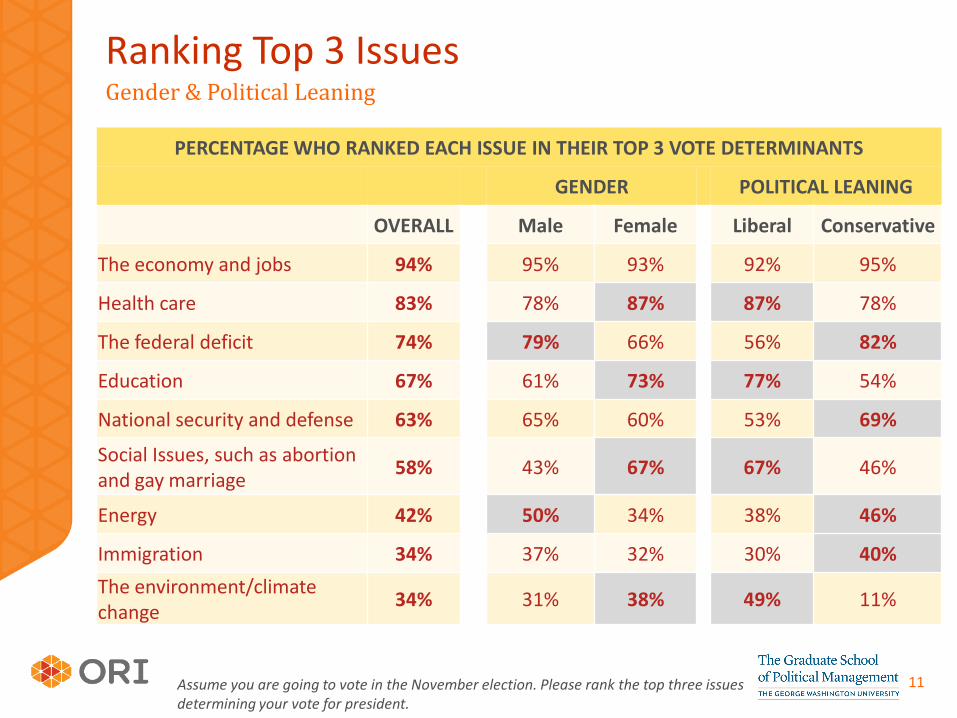
Ranking Top 3 Issues Gender & Political Leaning
Assume you are going to vote in the November election. Please rank the top three issues determining your vote for president.
PERCENTAGE WHO RANKED EACH ISSUE IN THEIR TOP 3 VOTE DETERMINANTS
GENDER POLITICAL LEANING
OVERALL Male Female Liberal Conservative
The economy and jobs 94% 95% 93% 92% 95%
Health care 83% 78% 87% 87% 78%
The federal deficit 74% 79% 66% 56% 82%
Education 67% 61% 73% 77% 54%
National security and defense 63% 65% 60% 53% 69%
Social Issues, such as abortion and gay marriage
58% 43% 67% 67% 46%
Energy 42% 50% 34% 38% 46%
Immigration 34% 37% 32% 30% 40%
The environment/climate change
34% 31% 38% 49% 11%
Participation in the 2012 Election
#socialelection
13
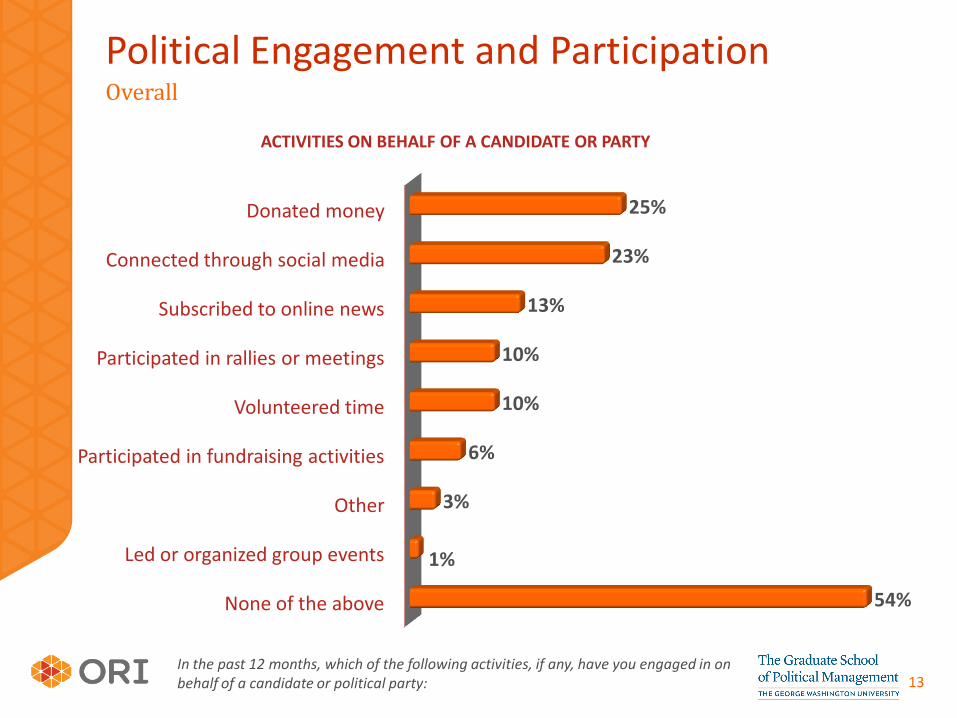
Political Engagement and Participation Overall
None of the above
Led or organized group events
Other
Participated in fundraising activities
Volunteered time
Participated in rallies or meetings
Subscribed to online news
Connected through social media
Donated money
54%
1%
3%
6%
10%
10%
13%
23%
25%
ACTIVITIES ON BEHALF OF A CANDIDATE OR PARTY
In the past 12 months, which of the following activities, if any, have you engaged in on behalf of a candidate or political party:
14
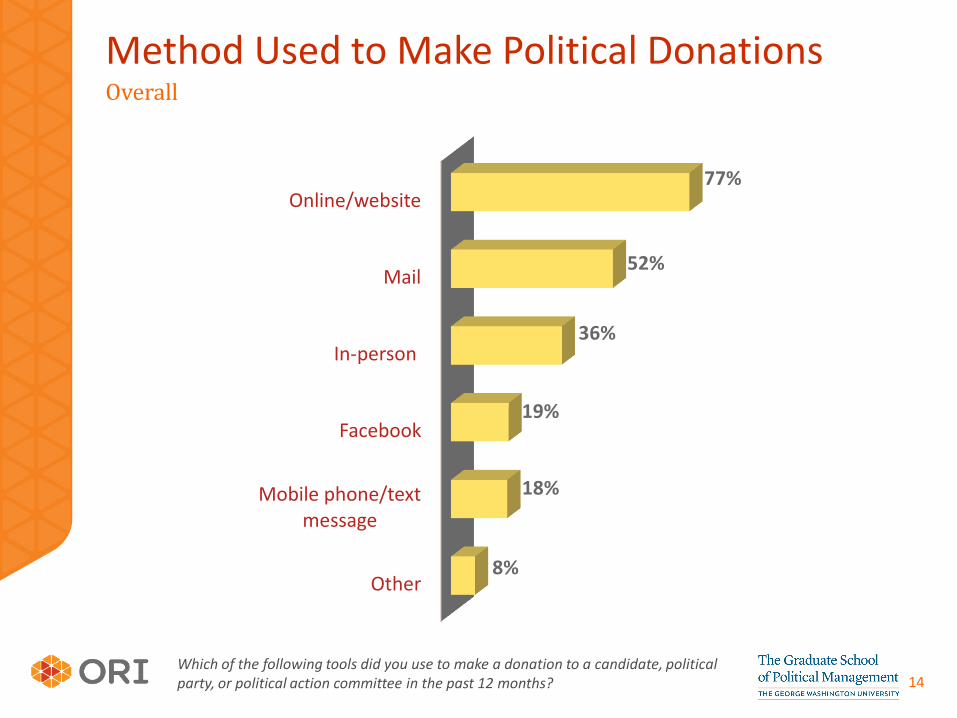
Method Used to Make Political Donations
Other
Mobile phone/text message
In-person
Online/website
8%
18%
19%
36%
52%
77%
Which of the following tools did you use to make a donation to a candidate, political party, or political action committee in the past 12 months?
Overall

Learning About and Discussing the Election
#socialelection
16
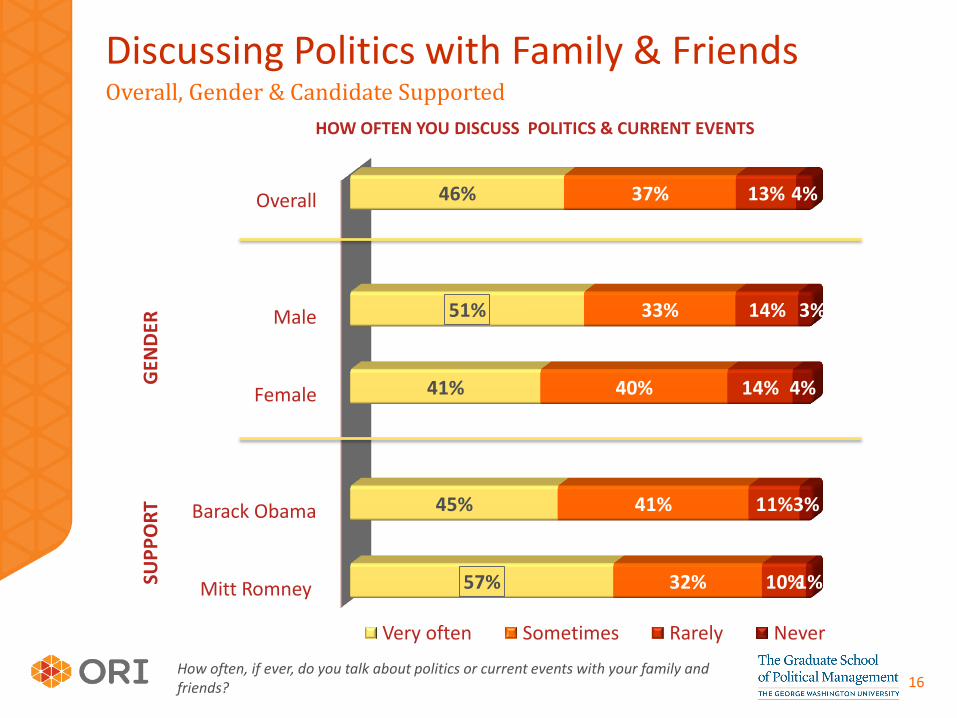
Discussing Politics with Family & Friends Overall, Gender & Candidate Supported
Overall
Male
Female
Barack Obama
Mitt Romney
46%
51%
41%
45%
57%
37%
33%
40%
41%
32%
13%
14%
14%
11%
10%
4%
3%
4%
3%
1%
HOW OFTEN YOU DISCUSS POLITICS & CURRENT EVENTS
Very often Sometimes Rarely Never
How often, if ever, do you talk about politics or current events with your family and friends?
SUP
PO
RT
G
END
ER
17
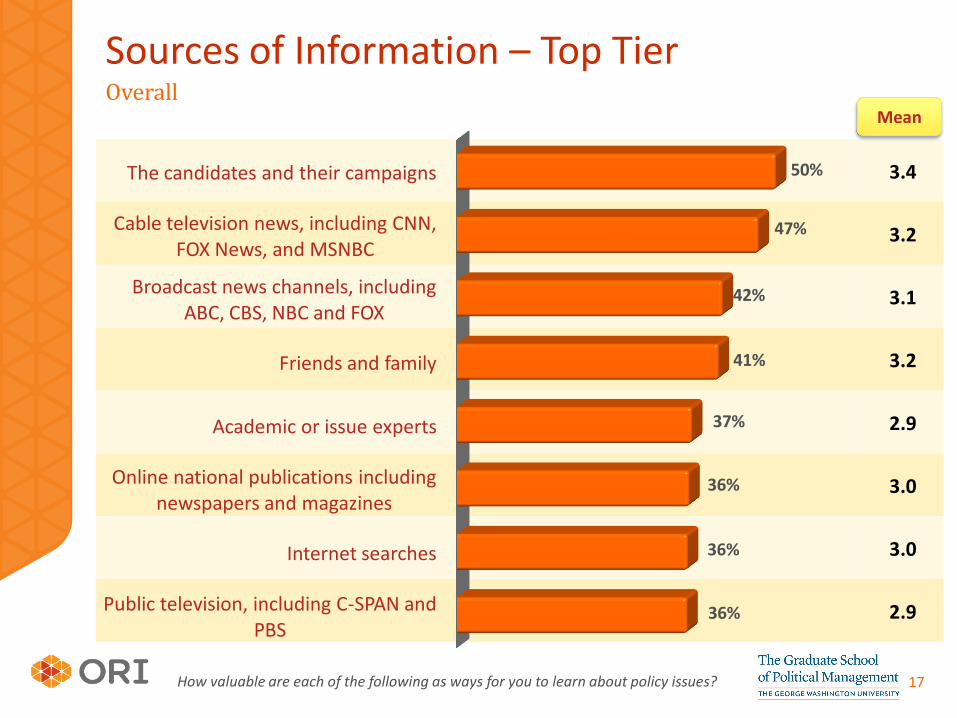
3.4
3.2
3.1
3.2
2.9
3.0
3.0
2.9
Sources of Information – Top Tier
The candidates and their campaigns
Cable television news, including CNN, FOX News, and MSNBC
Broadcast news channels, including ABC, CBS, NBC and FOX
Friends and family
Academic or issue experts
Online national publications including newspapers and magazines
Internet searches
Public television, including C-SPAN and PBS
50%
47%
42%
41%
37%
36%
36%
36%
How valuable are each of the following as ways for you to learn about policy issues?
Overall Mean
18
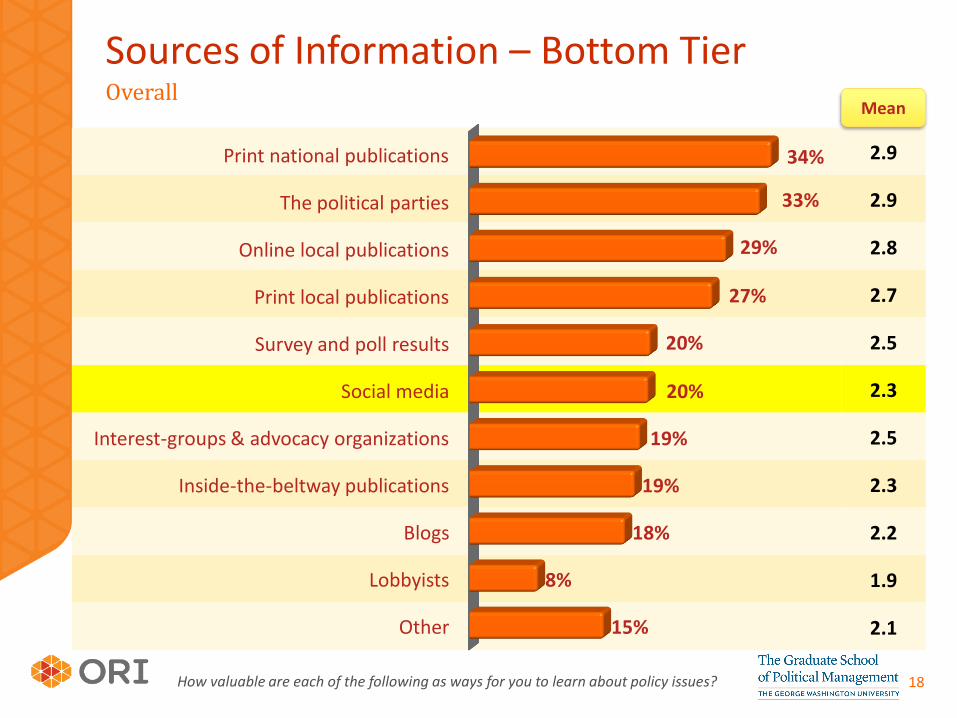
2.9
2.9
2.8
2.7
2.5
2.3
2.5
2.3
2.2
1.9
2.1
Print national publications
The political parties
Online local publications
Print local publications
Survey and poll results
Social media
Interest-groups & advocacy organizations
Inside-the-beltway publications
Blogs
Lobbyists
Other
34%
33%
29%
27%
20%
20%
19%
19%
18%
8%
15%
Sources of Information – Bottom Tier Overall
How valuable are each of the following as ways for you to learn about policy issues?
Mean

General Use of Social Media
#socialelection
20
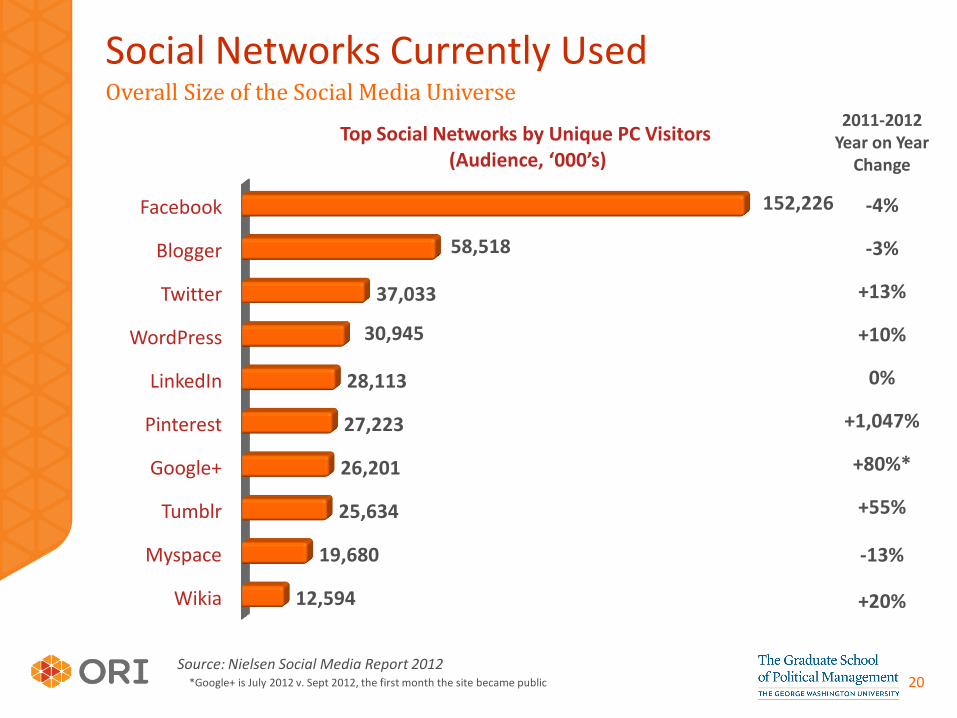
Social Networks Currently Used Overall Size of the Social Media Universe
Source: Nielsen Social Media Report 2012 *Google+ is July 2012 v. Sept 2012, the first month the site became public
Blogger
WordPress
Google+
Tumblr
Myspace
Wikia
152,226
58,518
37,033
30,945
28,113
27,223
26,201
25,634
19,680
12,594
Top Social Networks by Unique PC Visitors (Audience, ‘000’s)
2011-2012 Year on Year
Change
-4%
-3%
+13%
+10%
0%
+1,047%
+80%*
+55%
-13%
+20%
21
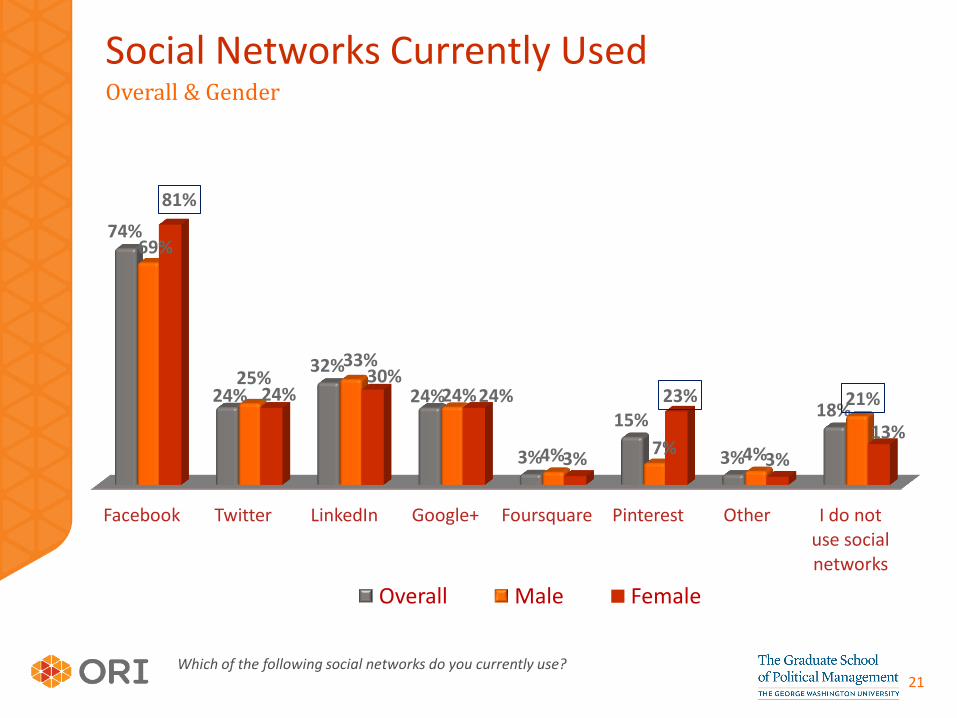
Facebook Twitter LinkedIn Google+ Foursquare Pinterest Other I do not use social networks
74%
24%
32%
24%
3%
15%
3%
18%
69%
25% 33%
24%
4% 7% 4%
21%
81%
24% 30%
24%
3%
23%
3%
13%
Overall Male Female
Social Networks Currently Used Overall & Gender
Which of the following social networks do you currently use?
22
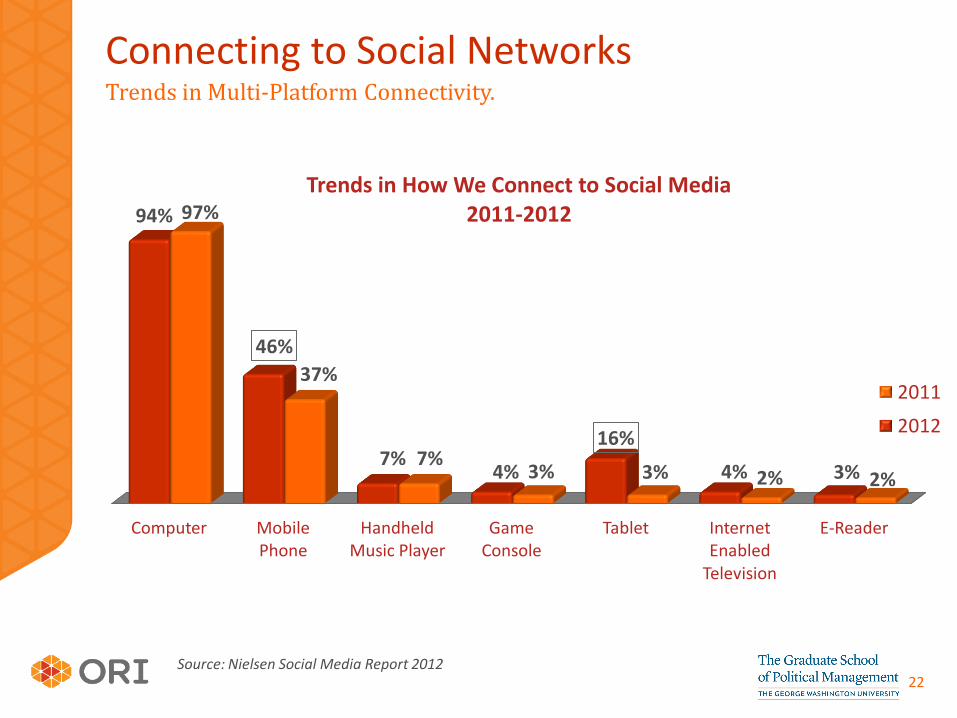
Connecting to Social Networks Trends in Multi-Platform Connectivity.
Source: Nielsen Social Media Report 2012
E-Reader Internet Enabled
Television
Tablet Game Console
Handheld Music Player
Mobile Phone
Computer
2% 2% 3% 3% 7%
37%
97%
3% 4%
16%
4% 7%
46%
94%
Trends in How We Connect to Social Media 2011-2012
2011
2012
Comparing the Quality and Credibility of Traditional and Social Media
#socialelection
24
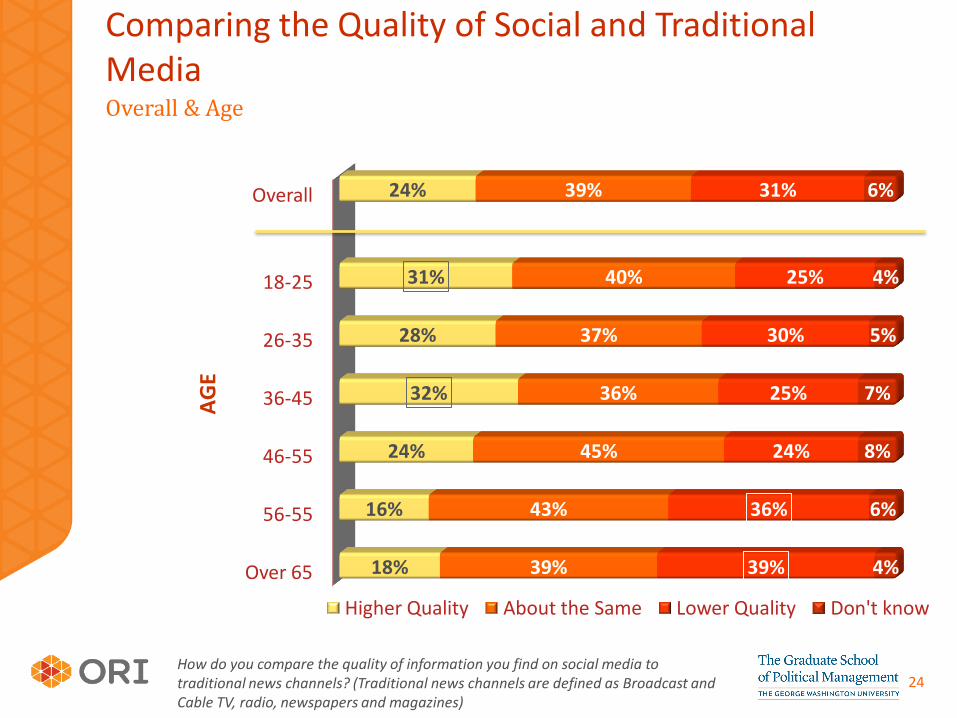
Comparing the Quality of Social and Traditional Media Overall & Age
How do you compare the quality of information you find on social media to traditional news channels? (Traditional news channels are defined as Broadcast and Cable TV, radio, newspapers and magazines)
Overall
18-25
26-35
36-45
46-55
56-55
Over 65
24%
31%
28%
32%
24%
16%
18%
39%
40%
37%
36%
45%
43%
39%
31%
25%
30%
25%
24%
36%
39%
6%
4%
5%
7%
8%
6%
4%
Higher Quality About the Same Lower Quality Don't know
AG
E
Using Social Media to Follow the Election
#socialelection
26
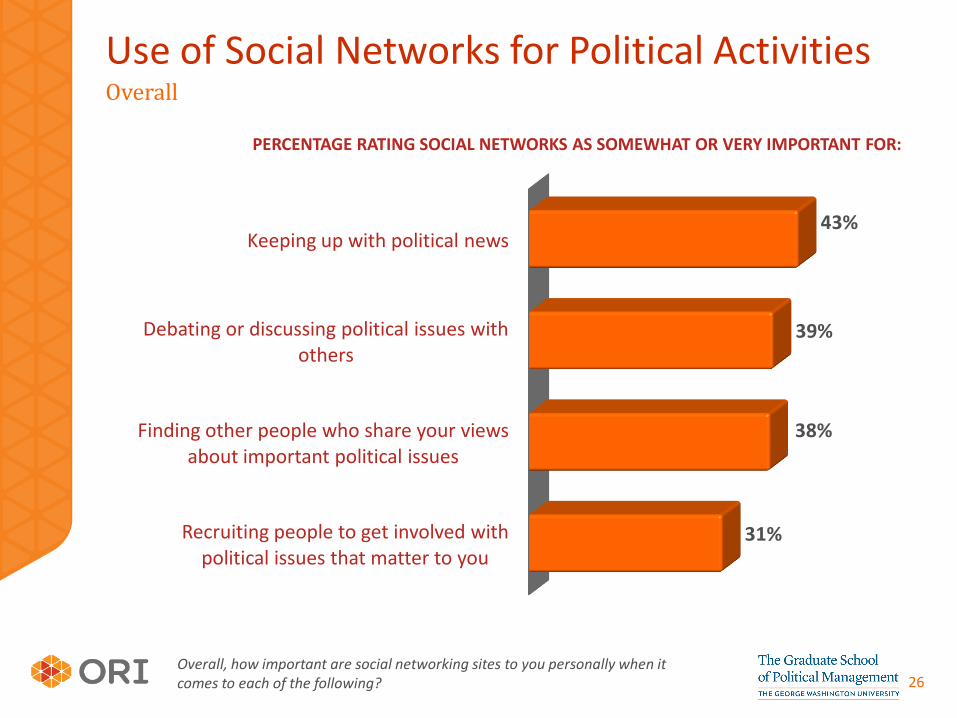
Overall
Overall, how important are social networking sites to you personally when it comes to each of the following?
Use of Social Networks for Political Activities
Keeping up with political news
Debating or discussing political issues with others
Finding other people who share your views about important political issues
Recruiting people to get involved with political issues that matter to you
43%
39%
38%
31%
PERCENTAGE RATING SOCIAL NETWORKS AS SOMEWHAT OR VERY IMPORTANT FOR:
27
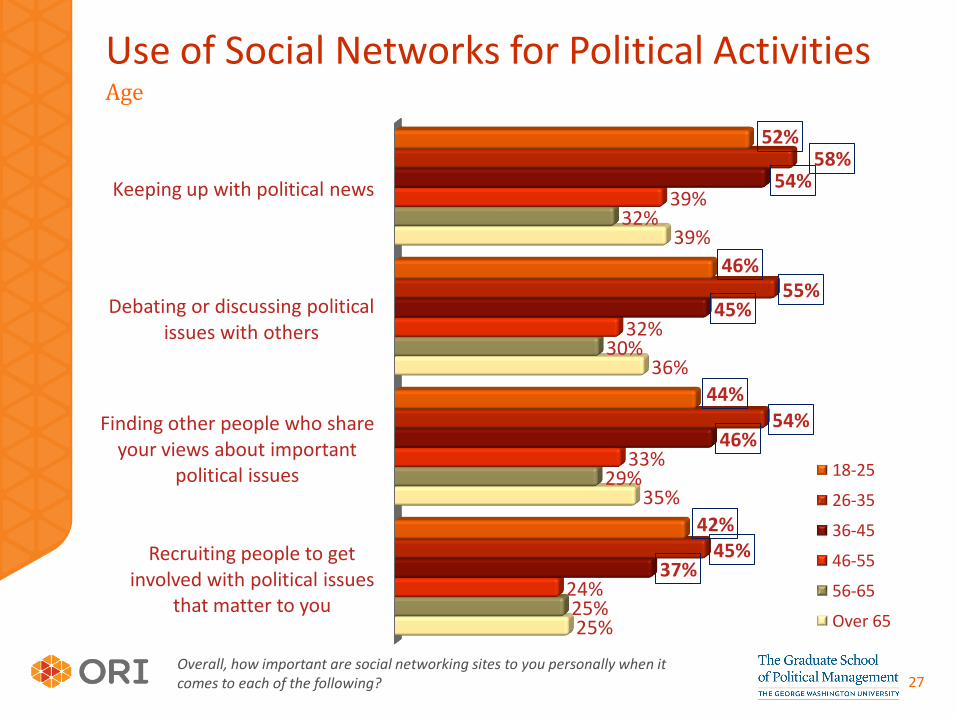
Age
Overall, how important are social networking sites to you personally when it comes to each of the following?
Use of Social Networks for Political Activities
Keeping up with political news
Debating or discussing political issues with others
Finding other people who share your views about important
political issues
Recruiting people to get involved with political issues
that matter to you
52%
46%
44%
42%
58%
55%
54%
45%
54%
45%
46%
37%
39%
32%
33%
24%
32%
30%
29%
25%
39%
36%
35%
25%
18-25
26-35
36-45
46-55
56-65
Over 65
28
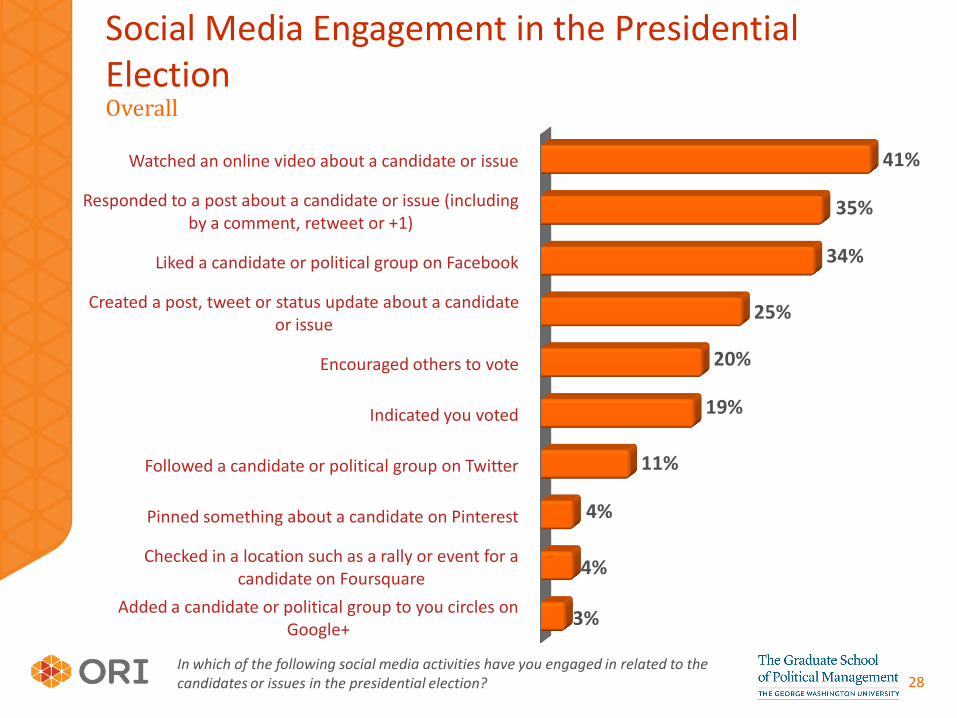
Social Media Engagement in the Presidential Election Overall
In which of the following social media activities have you engaged in related to the candidates or issues in the presidential election?
Watched an online video about a candidate or issue
Responded to a post about a candidate or issue (including by a comment, retweet or +1)
Liked a candidate or political group on Facebook
Created a post, tweet or status update about a candidate or issue
Encouraged others to vote
Indicated you voted
Followed a candidate or political group on Twitter
Pinned something about a candidate on Pinterest
Checked in a location such as a rally or event for a candidate on Foursquare
Added a candidate or political group to you circles on Google+
41%
35%
34%
25%
20%
19%
11%
4%
4%
3%

Sharing Political Views on Social Media
#socialelection
30
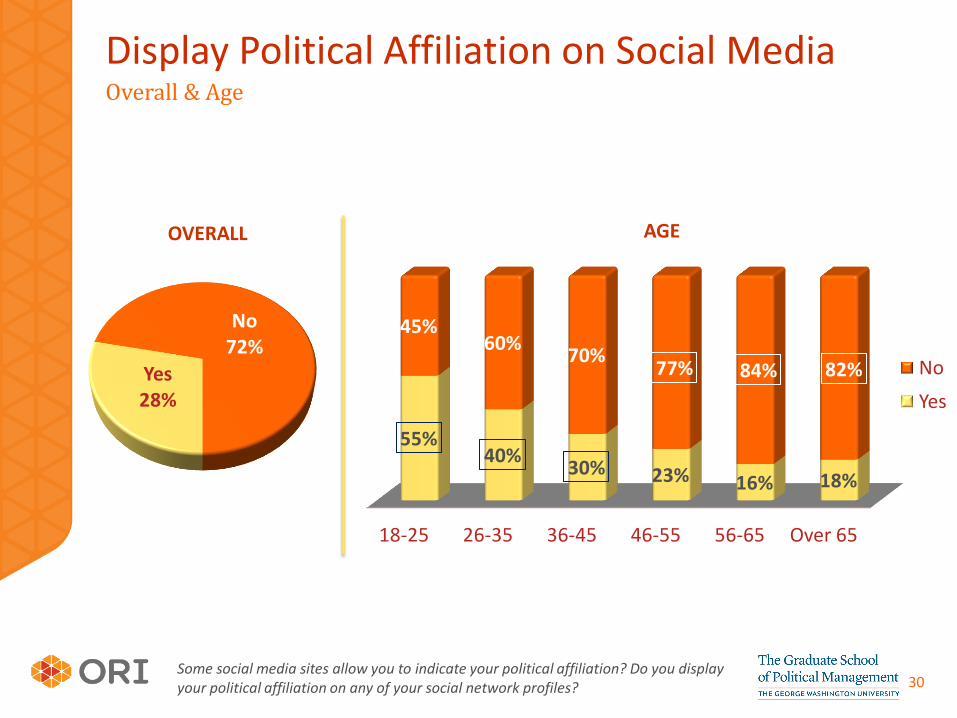
18-25
26-35
36-45
46-55
56-65
Over 65
55% 40%
30% 23% 16% 18%
45% 60%
70% 77% 84% 82% No
Yes
Display Political Affiliation on Social Media Overall & Age
Some social media sites allow you to indicate your political affiliation? Do you display your political affiliation on any of your social network profiles?
Yes 28%
No 72%
AGE OVERALL
31
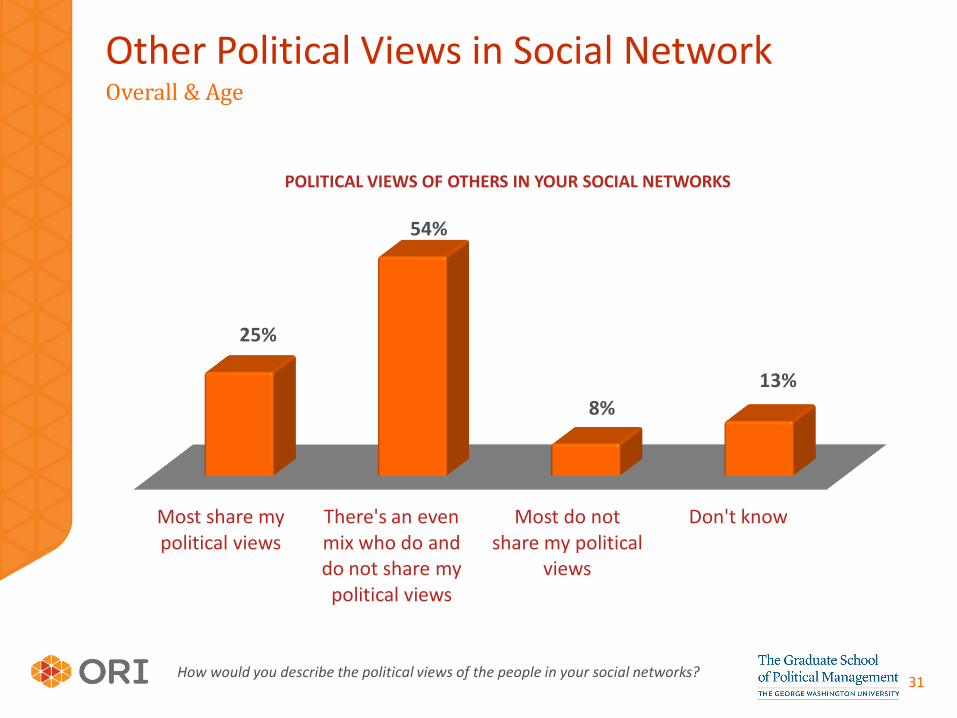
Other Political Views in Social Network Overall & Age
How would you describe the political views of the people in your social networks?
Most share my political views
There's an even mix who do and do not share my political views
Most do not share my political
views
Don't know
25%
54%
8%
13%
POLITICAL VIEWS OF OTHERS IN YOUR SOCIAL NETWORKS
32
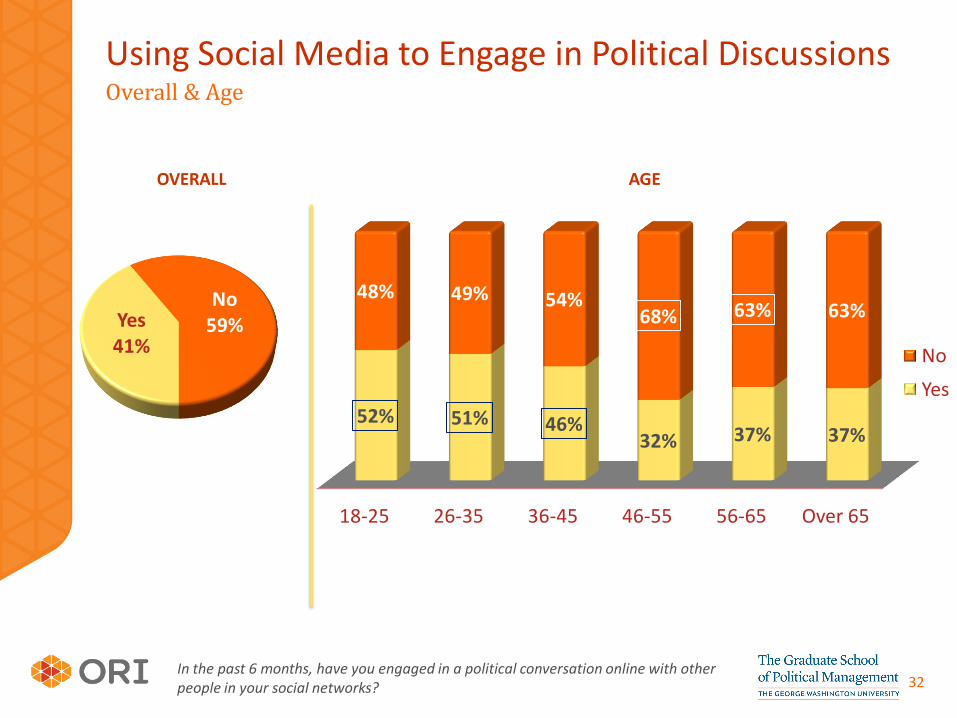
18-25 26-35 36-45 46-55 56-65 Over 65
52% 51% 46% 32% 37% 37%
48% 49% 54% 68% 63% 63%
No
Yes
Using Social Media to Engage in Political Discussions Overall & Age
In the past 6 months, have you engaged in a political conversation online with other people in your social networks?
Yes 41%
No 59%
OVERALL AGE
33
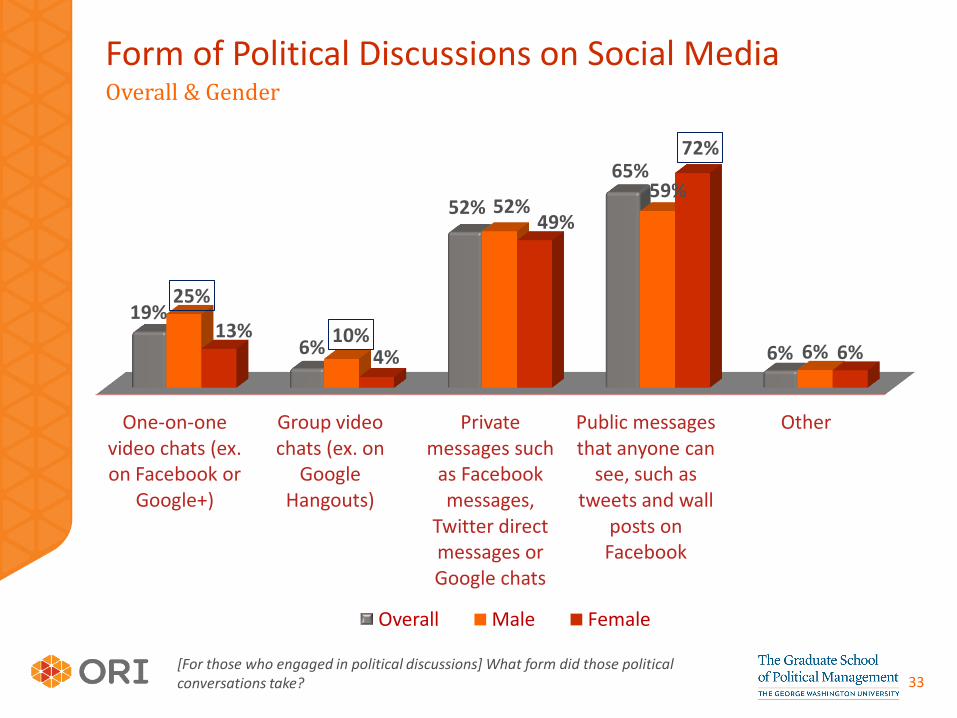
One-on-one video chats (ex. on Facebook or
Google+)
Group video chats (ex. on
Google Hangouts)
Private messages such
as Facebook messages,
Twitter direct messages or Google chats
Public messages that anyone can
see, such as tweets and wall
posts on Facebook
Other
19%
6%
52%
65%
6%
25%
10%
52% 59%
6% 13%
4%
49%
72%
6%
Overall Male Female
Form of Political Discussions on Social Media Overall & Gender
[For those who engaged in political discussions] What form did those political conversations take?
34
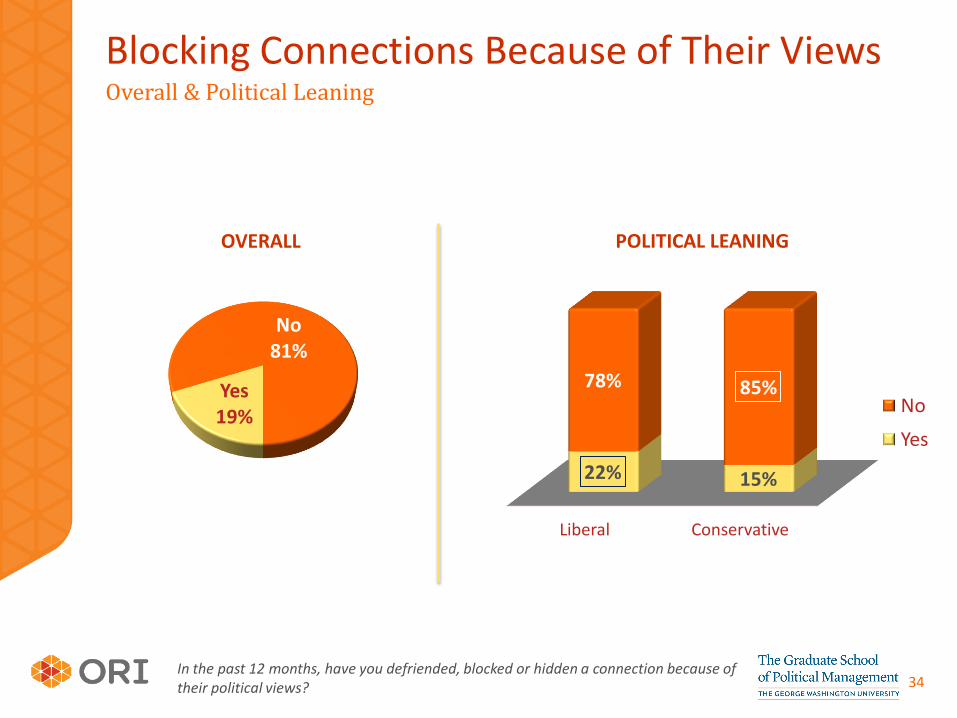
Liberal Conservative
22% 15%
78% 85% No
Yes
Blocking Connections Because of Their Views Overall & Political Leaning
In the past 12 months, have you defriended, blocked or hidden a connection because of their political views?
Yes 19%
No 81%
POLITICAL LEANING OVERALL

The Influence of Social Media
#socialelection
36
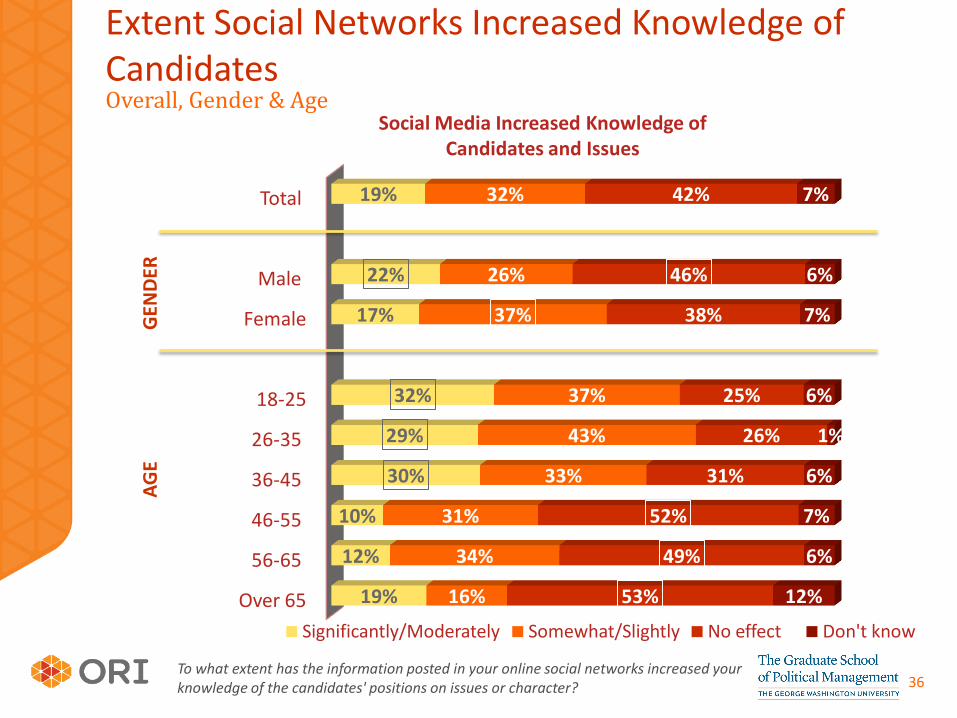
Total
Male
Female
18-25
26-35
36-45
46-55
56-65
Over 65
19%
22%
17%
32%
29%
30%
10%
12%
19%
32%
26%
37%
37%
43%
33%
31%
34%
16%
42%
46%
38%
25%
26%
31%
52%
49%
53%
7%
6%
7%
6%
1%
6%
7%
6%
12%
Significantly/Moderately Somewhat/Slightly No effect Don't know
Extent Social Networks Increased Knowledge of Candidates Overall, Gender & Age
Social Media Increased Knowledge of Candidates and Issues
AG
E G
END
ER
To what extent has the information posted in your online social networks increased your knowledge of the candidates' positions on issues or character?
37
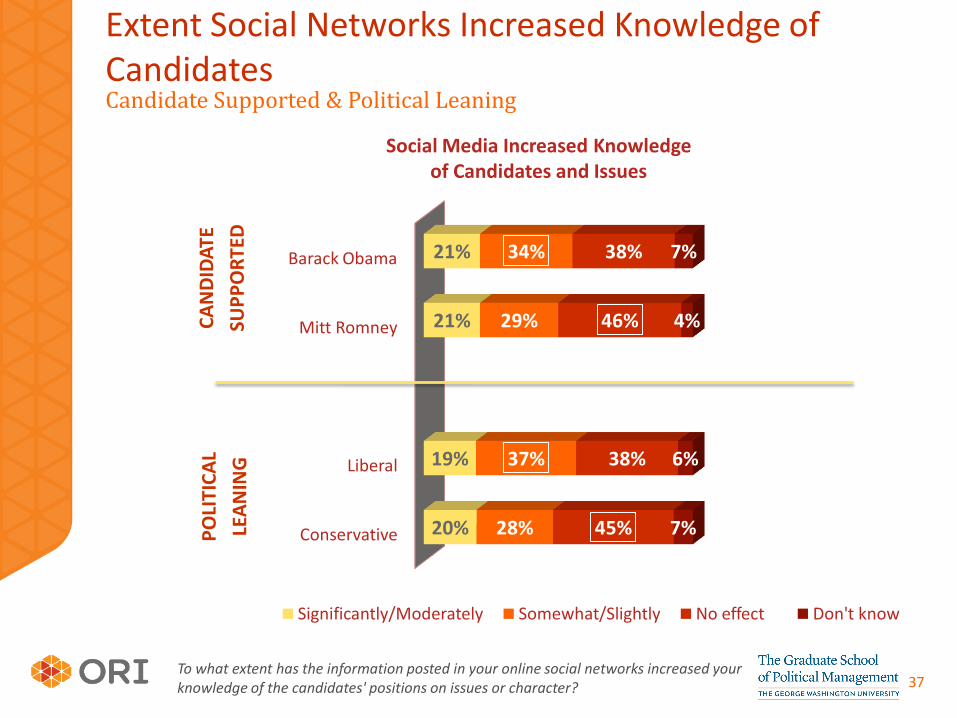
Barack Obama
Mitt Romney
Liberal
Conservative
21%
21%
19%
20%
34%
29%
37%
28%
38%
46%
38%
45%
7%
4%
6%
7%
Significantly/Moderately Somewhat/Slightly No effect Don't know
Extent Social Networks Increased Knowledge of Candidates Candidate Supported & Political Leaning
Social Media Increased Knowledge of Candidates and Issues
CA
ND
IDA
TE
SUP
PO
RTE
D
PO
LITI
CA
L
LEA
NIN
G
To what extent has the information posted in your online social networks increased your knowledge of the candidates' positions on issues or character?
38
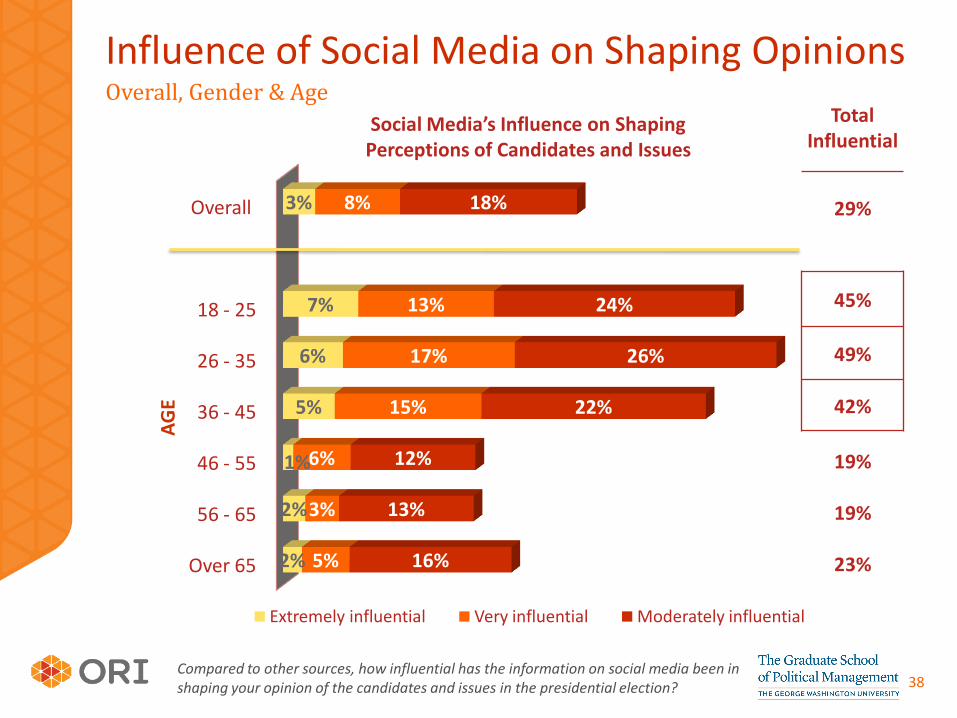
Overall
18 - 25
26 - 35
36 - 45
46 - 55
56 - 65
Over 65
3%
7%
6%
5%
1%
2%
2%
8%
13%
17%
15%
6%
3%
5%
18%
24%
26%
22%
12%
13%
16%
Extremely influential Very influential Moderately influential
Influence of Social Media on Shaping Opinions Overall, Gender & Age
Social Media’s Influence on Shaping Perceptions of Candidates and Issues
AG
E
Total Influential
29%
45%
49%
42%
19%
19%
23%
Compared to other sources, how influential has the information on social media been in shaping your opinion of the candidates and issues in the presidential election?
39
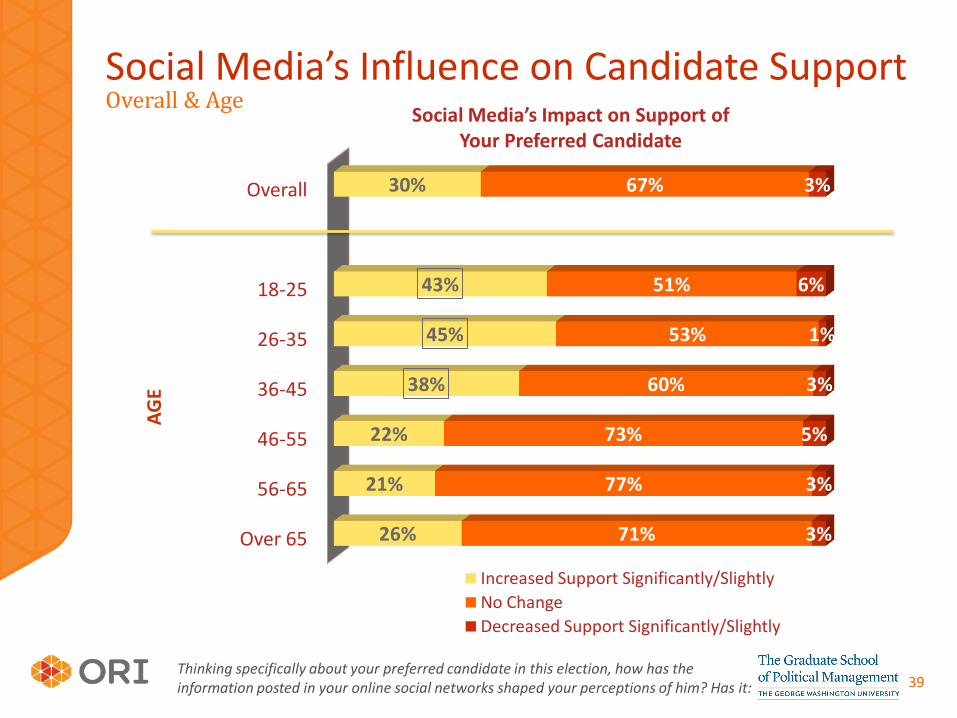
Overall
18-25
26-35
36-45
46-55
56-65
Over 65
30%
43%
45%
38%
22%
21%
26%
67%
51%
53%
60%
73%
77%
71%
3%
6%
1%
3%
5%
3%
3%
Increased Support Significantly/Slightly
No Change
Decreased Support Significantly/Slightly
Social Media’s Influence on Candidate Support Overall & Age
Social Media’s Impact on Support of Your Preferred Candidate
AG
E
Thinking specifically about your preferred candidate in this election, how has the information posted in your online social networks shaped your perceptions of him? Has it:
40
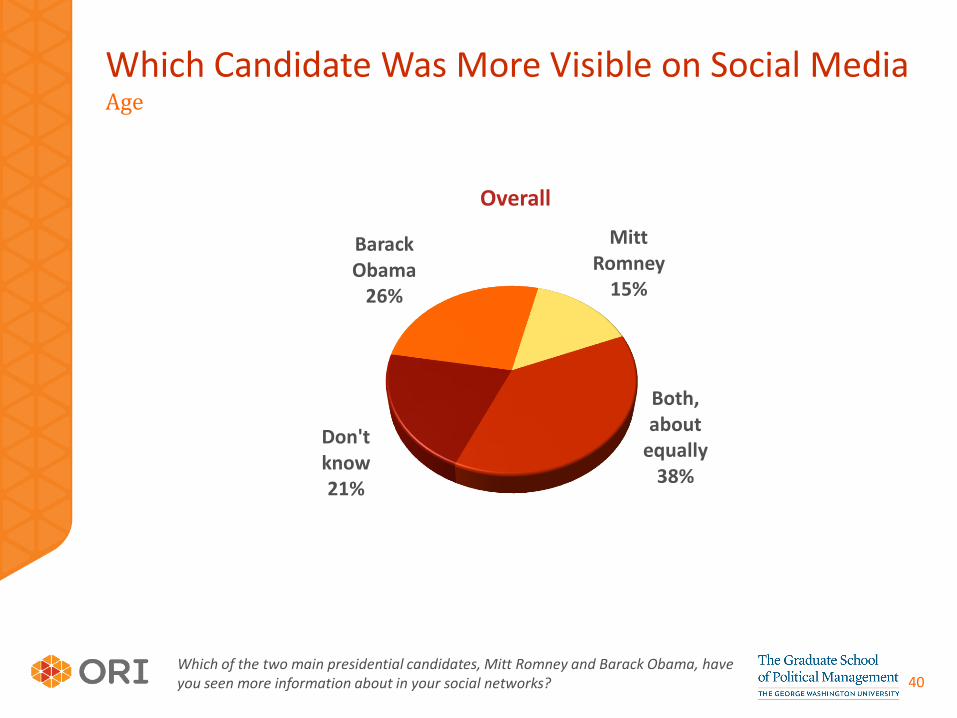
Age
Which of the two main presidential candidates, Mitt Romney and Barack Obama, have you seen more information about in your social networks?
Which Candidate Was More Visible on Social Media
Barack Obama
26%
Mitt Romney
15%
Both, about
equally 38%
Don't know 21%
Overall
41
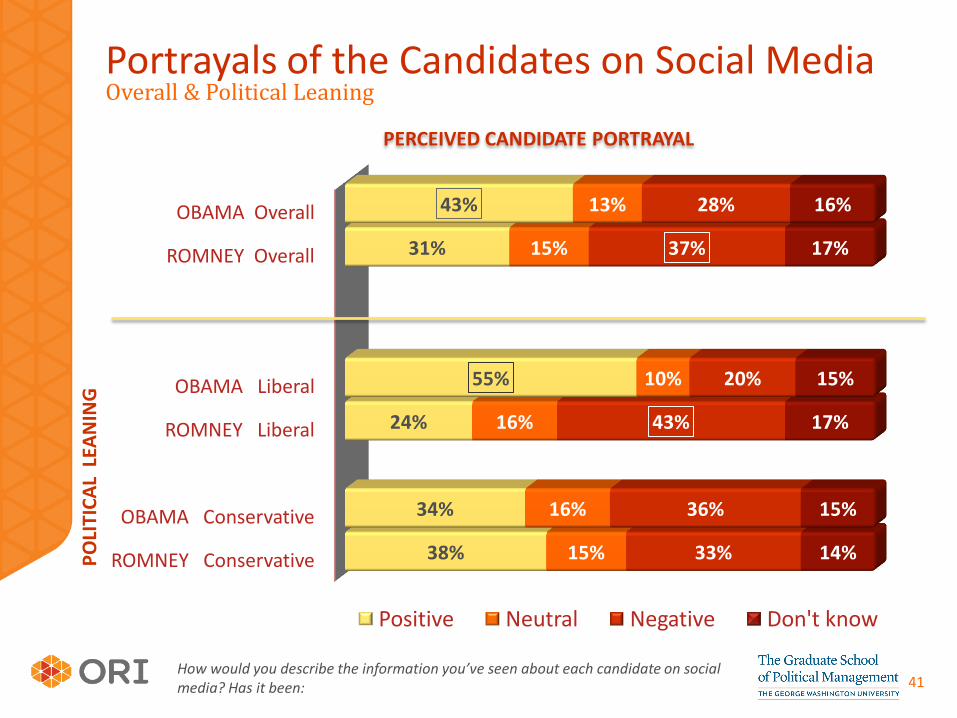
OBAMA Overall
ROMNEY Overall
OBAMA Liberal
ROMNEY Liberal
OBAMA Conservative
ROMNEY Conservative
43%
31%
55%
24%
34%
38%
13%
15%
10%
16%
16%
15%
28%
37%
20%
43%
36%
33%
16%
17%
15%
17%
15%
14%
Positive Neutral Negative Don't know
Portrayals of the Candidates on Social Media Overall & Political Leaning
How would you describe the information you’ve seen about each candidate on social media? Has it been:
PERCEIVED CANDIDATE PORTRAYAL
PO
LITI
CA
L L
EAN
ING
Grading the Candidates Use of Social Media
#socialelection
43
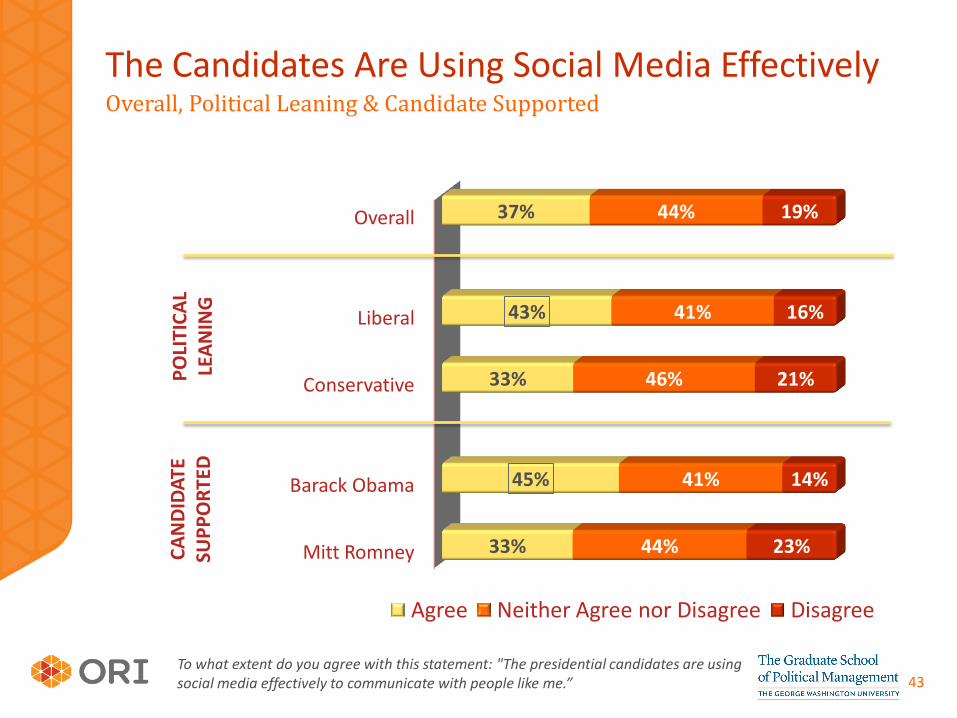
The Candidates Are Using Social Media Effectively Overall, Political Leaning & Candidate Supported
To what extent do you agree with this statement: "The presidential candidates are using social media effectively to communicate with people like me.”
Overall
Liberal
Conservative
Barack Obama
Mitt Romney
37%
43%
33%
45%
33%
44%
41%
46%
41%
44%
19%
16%
21%
14%
23%
Agree Neither Agree nor Disagree Disagree
PO
LITI
CA
L LE
AN
ING
CA
ND
IDA
TE
SUP
PO
RTE
D
Tone of the Presidential Election
#socialelection
45
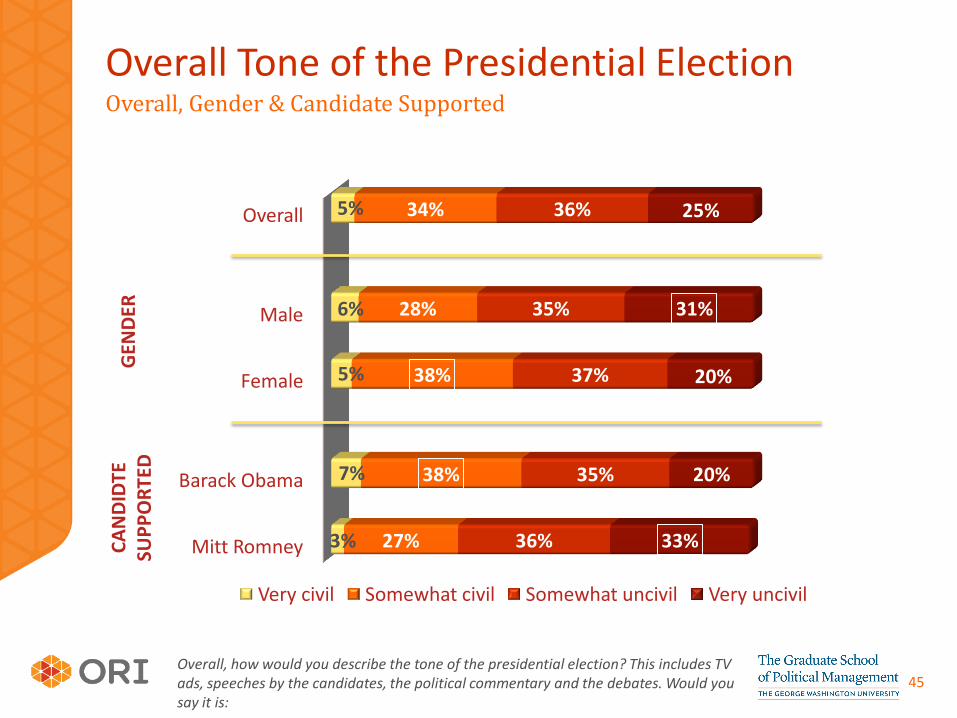
Overall Tone of the Presidential Election Overall, Gender & Candidate Supported
Overall, how would you describe the tone of the presidential election? This includes TV ads, speeches by the candidates, the political commentary and the debates. Would you say it is:
Overall
Male
Female
Barack Obama
Mitt Romney
5%
6%
5%
7%
3%
34%
28%
38%
38%
27%
36%
35%
37%
35%
36%
25%
31%
20%
20%
33%
Very civil Somewhat civil Somewhat uncivil Very uncivil
CA
ND
IDTE
SU
PP
OR
TED
G
END
ER
46
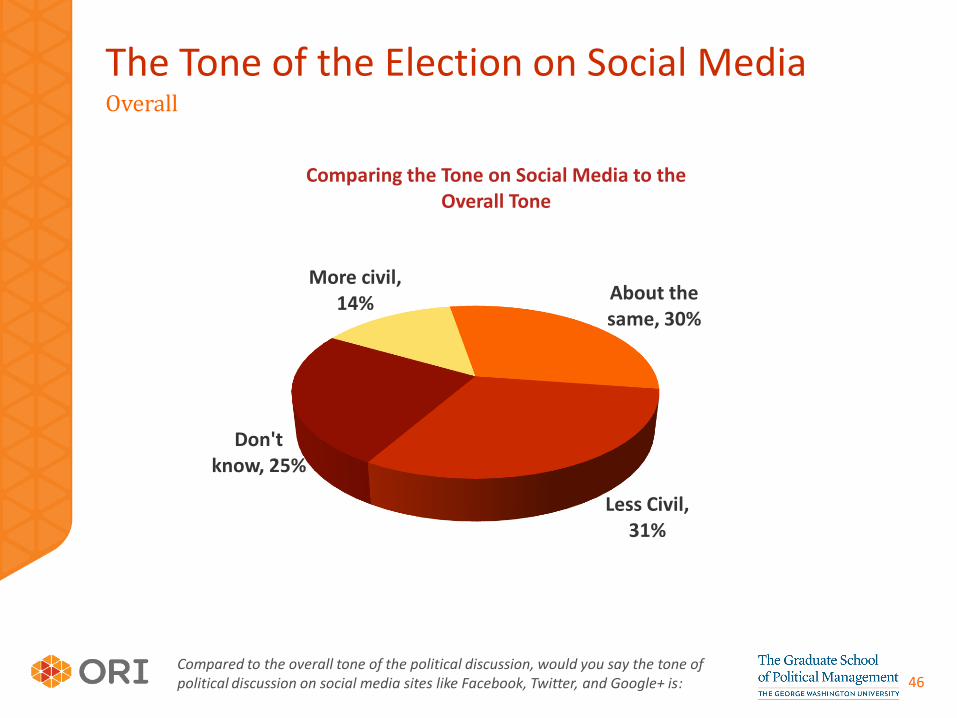
The Tone of the Election on Social Media Overall
Compared to the overall tone of the political discussion, would you say the tone of political discussion on social media sites like Facebook, Twitter, and Google+ is:
More civil, 14% About the
same, 30%
Less Civil, 31%
Don't know, 25%
Comparing the Tone on Social Media to the Overall Tone

Bias in Social Media
#socialelection
48
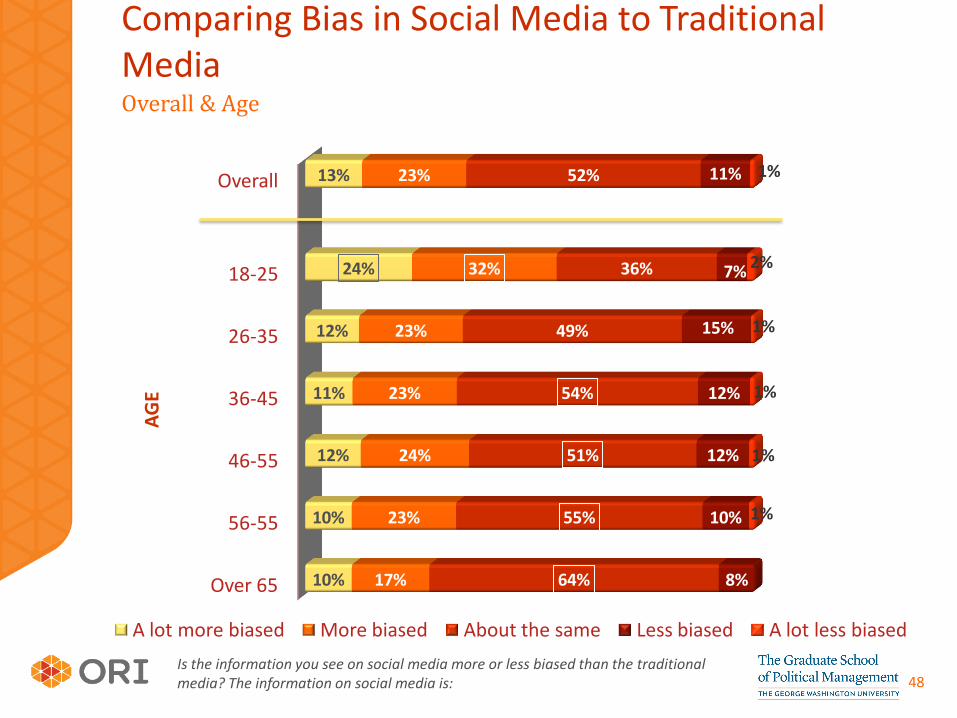
Comparing Bias in Social Media to Traditional Media Overall & Age
Overall
18-25
26-35
36-45
46-55
56-55
Over 65
13%
24%
12%
11%
12%
10%
10%
23%
32%
23%
23%
24%
23%
17%
52%
36%
49%
54%
51%
55%
64%
11%
7%
15%
12%
12%
10%
8%
1%
2%
1%
1%
1%
1%
A lot more biased More biased About the same Less biased A lot less biased
AG
E
Is the information you see on social media more or less biased than the traditional media? The information on social media is:
Conclusions & Implications
#socialelection
50
Conclusions & Implications
It may not be the first place people turn to learn about candidates or issues,
but social media is critical forum to share and shape opinions.
Social media has closed the credibility gap as a news and information
source, driving the imperative to monitor discussion of your brand.
The accelerating rise of second- and third-tier networks creates new
opportunities for customized content and engagement strategies
across different platforms.
Build your social networks before you need to use them, for the
strength of your connections will determine the amplification of your
message.
Organizing on social media, younger voters are turning into a powerful
voting block on social issues.
51
Conclusions & Implications
Political orientation is no longer a private affair but social media bumper
stickers can never be removed.
Your political statements can cost you some of your social media
relationships.
On social media, great visuals can be worth far more than a thousand
words.
Social analytics will become as important as polling in political science
and advocacy.
Are you using social media to gain insight into what energizes your
audience, and tailoring your messages accordingly?
52
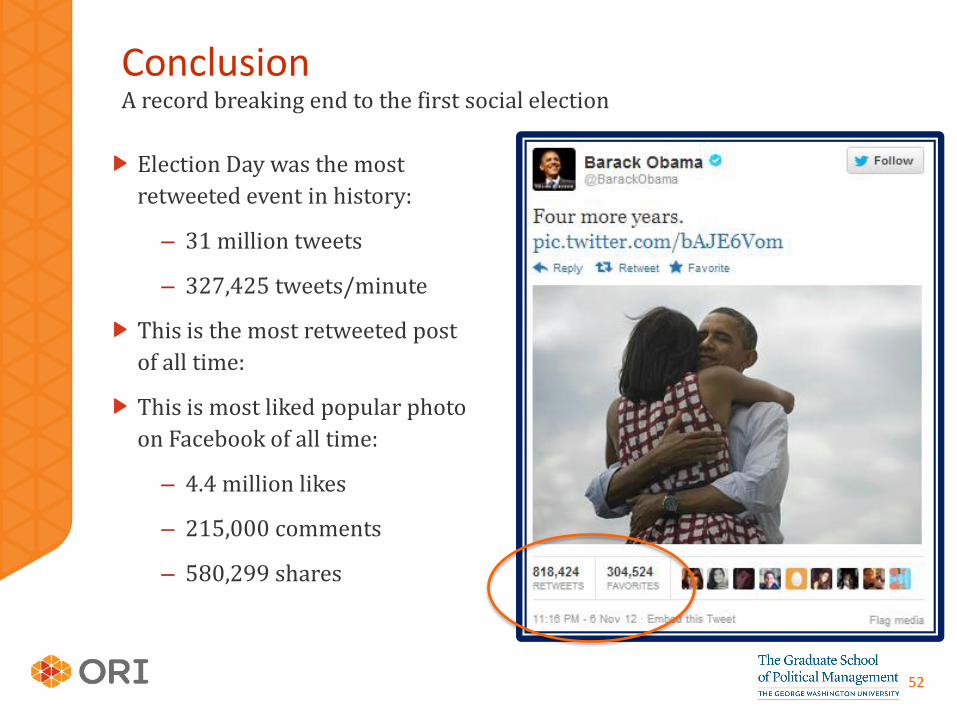
Conclusion A record breaking end to the first social election
Election Day was the most
retweeted event in history:
– 31 million tweets
– 327,425 tweets/minute
This is the most retweeted post
of all time:
This is most liked popular photo
on Facebook of all time:
– 4.4 million likes
– 215,000 comments
– 580,299 shares
QUESTIONS? For additional information go to: www.ORIresults.com/socialelectionsurvey
#socialelection
Related Documents