Date/reference/classification 2005 Interim Results 2005 Interim Results 7 September 2005 7 September 2005

Welcome message from author
This document is posted to help you gain knowledge. Please leave a comment to let me know what you think about it! Share it to your friends and learn new things together.
Transcript
Date/reference/classification
2005 Interim Results2005 Interim Results
7 September 20057 September 2005
Date/reference/classification
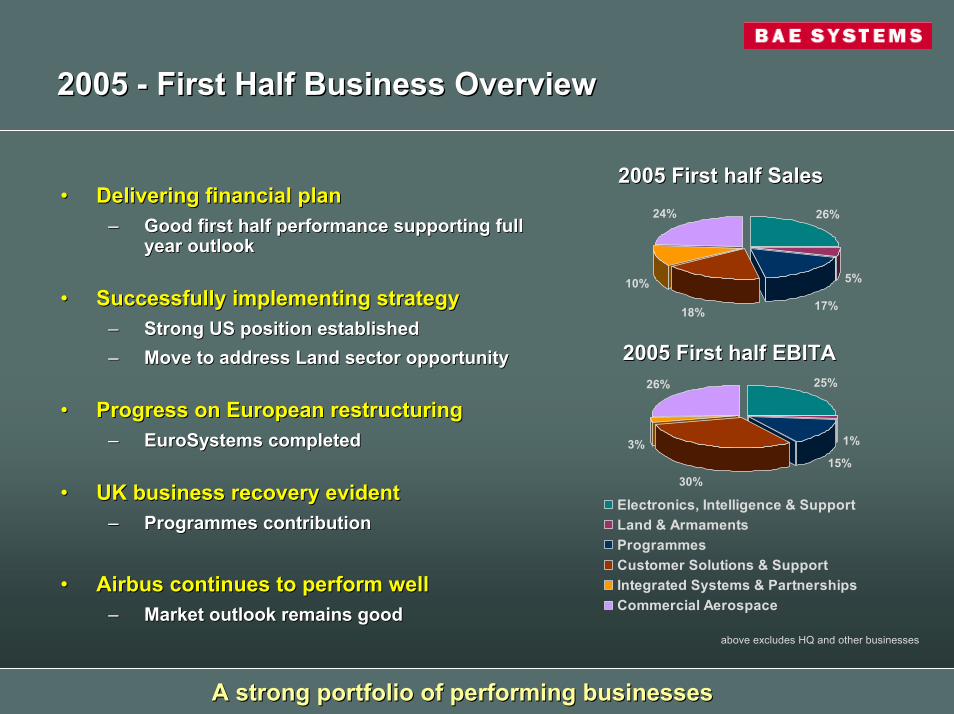
2005 2005 -- First Half Business OverviewFirst Half Business Overview
17%18%
10%
24% 26%
5%
2005 First half EBITA2005 First half EBITA
15%30%
3%
26% 25%
1%
Electronics, Intelligence & SupportLand & ArmamentsProgrammesCustomer Solutions & SupportIntegrated Systems & PartnershipsCommercial Aerospace
2005 First half Sales2005 First half Sales
above excludes HQ and other businesses
•• Delivering financial planDelivering financial plan–– Good first half performance supporting full Good first half performance supporting full
year outlookyear outlook
•• Successfully implementing strategySuccessfully implementing strategy–– Strong US position establishedStrong US position established–– Move to address Land sector opportunityMove to address Land sector opportunity
•• Progress on European restructuringProgress on European restructuring–– EuroSystemsEuroSystems completedcompleted
•• UK business recovery evidentUK business recovery evident–– Programmes contributionProgrammes contribution
•• Airbus continues to perform wellAirbus continues to perform well–– Market outlook remains goodMarket outlook remains good
A strong portfolio of performing businesses A strong portfolio of performing businesses
Date/reference/classification
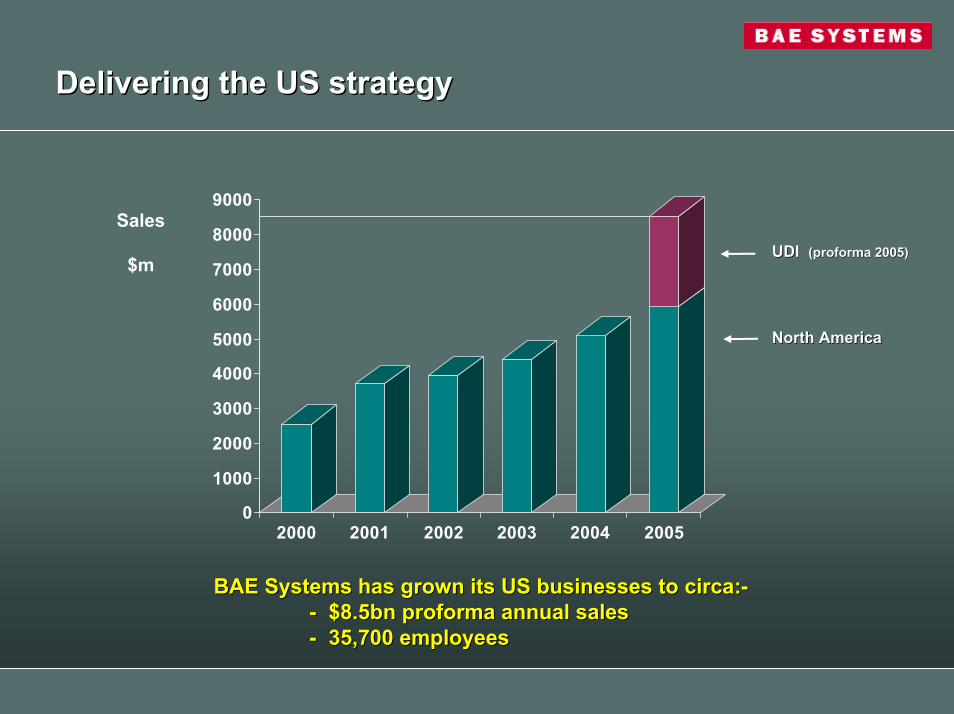
Delivering the US strategyDelivering the US strategy
0
1000
2000
3000
4000
5000
6000
7000
8000
9000
2000 2001 2002 2003 2004 2005
UDI UDI ((proformaproforma 2005)2005)
North AmericaNorth America
Sales
$m
BAE Systems has grown its US businesses to circa:BAE Systems has grown its US businesses to circa:---- $8.5bn $8.5bn proformaproforma annual sales annual sales -- 35,700 employees35,700 employees
Date/reference/classification
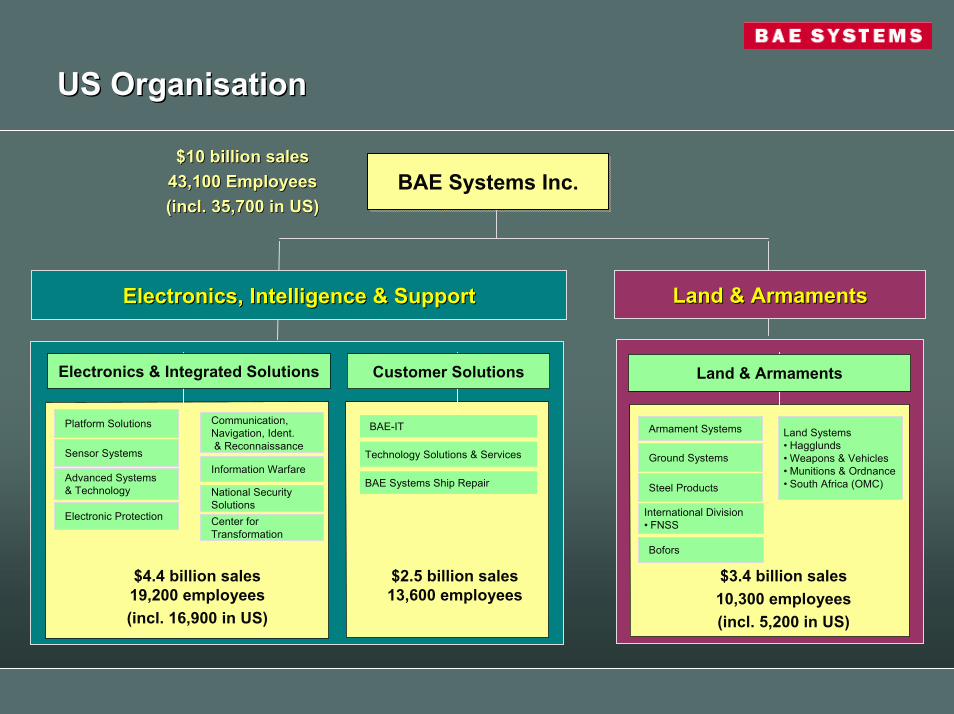
US US OrganisationOrganisation
$10 billion sales$10 billion sales43,100 Employees43,100 Employees(incl. 35,700 in US)(incl. 35,700 in US)
BAE Systems Inc.BAE Systems Inc.
Land & ArmamentsLand & ArmamentsElectronics, Intelligence & SupportElectronics, Intelligence & Support
Center for Transformation
Communication, Navigation, Ident. & Reconnaissance
BAE-IT
National SecuritySolutions
Armament Systems
Ground Systems
Steel Products
Bofors
BAE Systems Ship Repair
Platform Solutions
Sensor Systems
Electronic Protection
Information Warfare
Electronics & Integrated Solutions Customer Solutions Land & Armaments
Advanced Systems& Technology
Technology Solutions & Services
International Division• FNSS
Land Systems• Hagglunds• Weapons & Vehicles• Munitions & Ordnance• South Africa (OMC)
$4.4 billion sales 19,200 employees(incl. 16,900 in US)
$2.5 billion sales 13,600 employees
$3.4 billion sales10,300 employees(incl. 5,200 in US)
Date/reference/classification
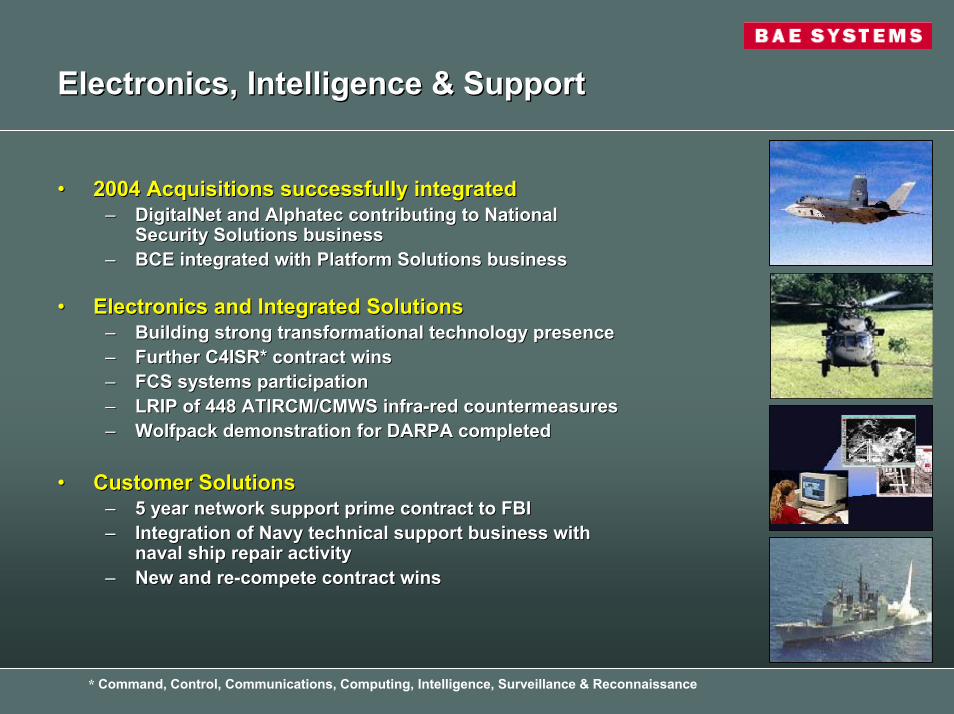
Electronics, Intelligence & SupportElectronics, Intelligence & Support
•• 2004 Acquisitions successfully integrated2004 Acquisitions successfully integrated–– DigitalNetDigitalNet and and AlphatecAlphatec contributing to National contributing to National
Security Solutions businessSecurity Solutions business–– BCE integrated with Platform Solutions businessBCE integrated with Platform Solutions business
•• Electronics and Integrated SolutionsElectronics and Integrated Solutions–– Building strong transformational technology presence Building strong transformational technology presence –– Further C4ISR* contract winsFurther C4ISR* contract wins–– FCS systems participation FCS systems participation –– LRIP of 448 ATIRCM/CMWS infraLRIP of 448 ATIRCM/CMWS infra--red countermeasuresred countermeasures–– WolfpackWolfpack demonstration for DARPA completeddemonstration for DARPA completed
•• Customer SolutionsCustomer Solutions–– 5 year network support prime contract to FBI5 year network support prime contract to FBI–– Integration of Navy technical support business with Integration of Navy technical support business with
naval ship repair activitynaval ship repair activity–– New and reNew and re--compete contract winscompete contract wins
* Command, Control, Communications, Computing, Intelligence, Surveillance & Reconnaissance
Date/reference/classification
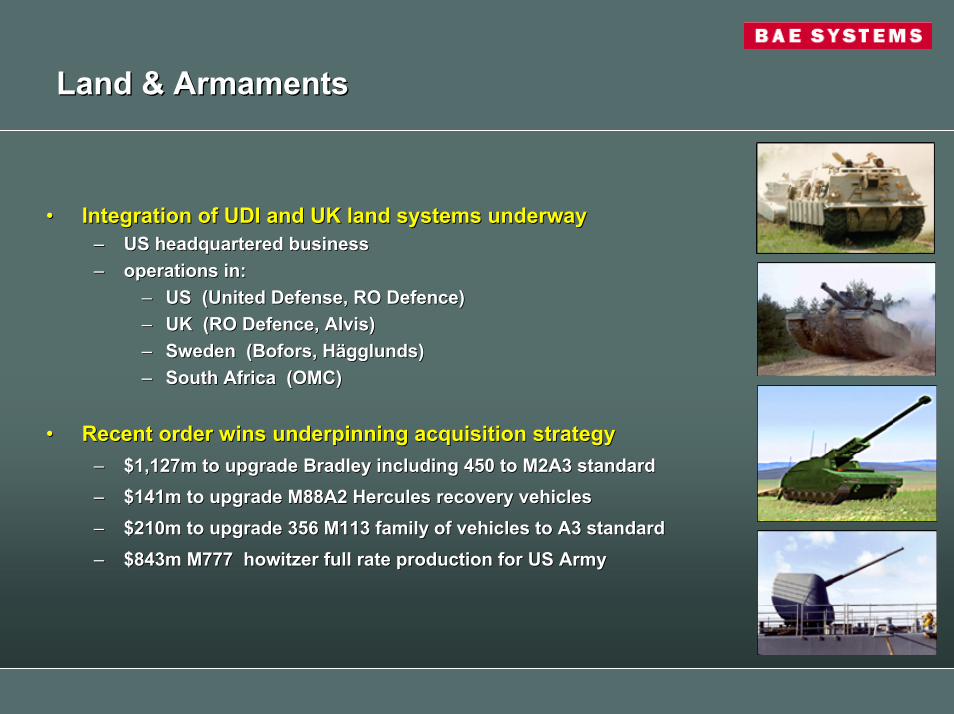
Land & ArmamentsLand & Armaments
•• Integration of UDI and UK land systems underwayIntegration of UDI and UK land systems underway–– US headquartered businessUS headquartered business–– operations in:operations in:
–– US (United US (United DefenseDefense, RO Defence), RO Defence)–– UK (RO Defence, UK (RO Defence, AlvisAlvis))–– Sweden (Sweden (BoforsBofors, , HHäägglundsgglunds))–– South Africa (OMC)South Africa (OMC)
•• Recent order wins underpinning acquisition strategyRecent order wins underpinning acquisition strategy–– $1,127m to upgrade Bradley including 450 to M2A3 standard$1,127m to upgrade Bradley including 450 to M2A3 standard–– $141m to upgrade M88A2 Hercules recovery vehicles $141m to upgrade M88A2 Hercules recovery vehicles –– $210m to upgrade 356 M113 family of vehicles to A3 standard$210m to upgrade 356 M113 family of vehicles to A3 standard–– $843m M777 howitzer full rate production for US Army$843m M777 howitzer full rate production for US Army
Date/reference/classification
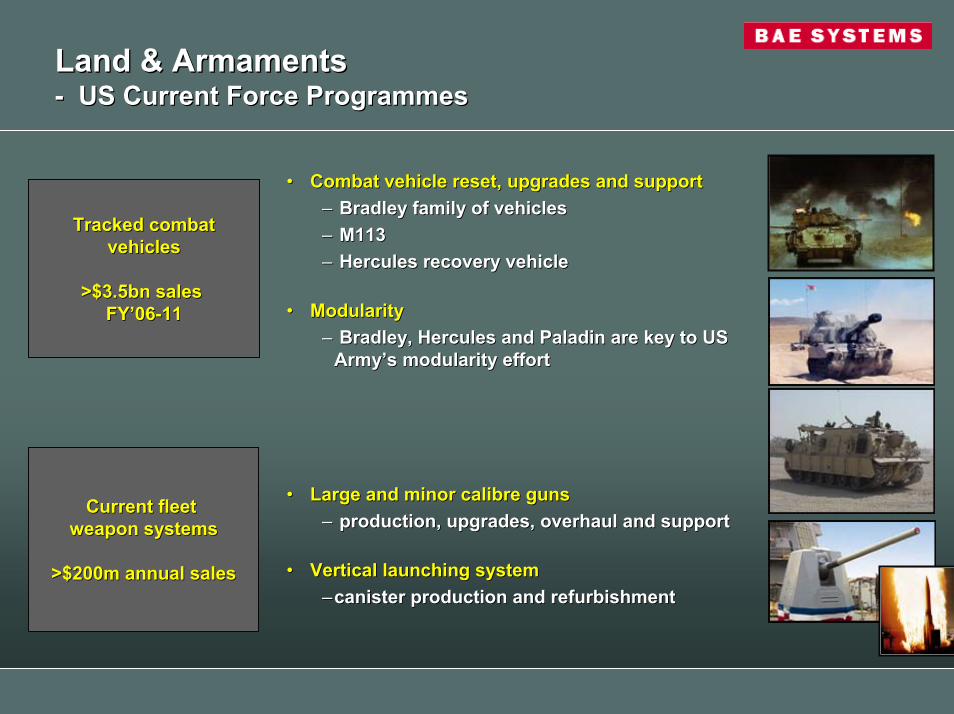
Land & ArmamentsLand & Armaments-- US Current Force US Current Force ProgrammesProgrammes
•• Combat vehicle reset, upgrades and supportCombat vehicle reset, upgrades and support–– Bradley family of vehiclesBradley family of vehicles–– M113 M113 –– Hercules recovery vehicle Hercules recovery vehicle
•• ModularityModularity–– Bradley, Hercules and Paladin are key to US Bradley, Hercules and Paladin are key to US
ArmyArmy’’s modularity effort
Tracked combatTracked combatvehiclesvehicles
>$3.5bn sales >$3.5bn sales FYFY’’0606--1111
s modularity effort
Current fleet Current fleet weapon systemsweapon systems
>$200m annual sales>$200m annual sales
•• Large and minor Large and minor calibrecalibre gunsguns–– production, upgrades, overhaul and support production, upgrades, overhaul and support
•• Vertical launching systemVertical launching system––canister production and refurbishmentcanister production and refurbishment
Date/reference/classification
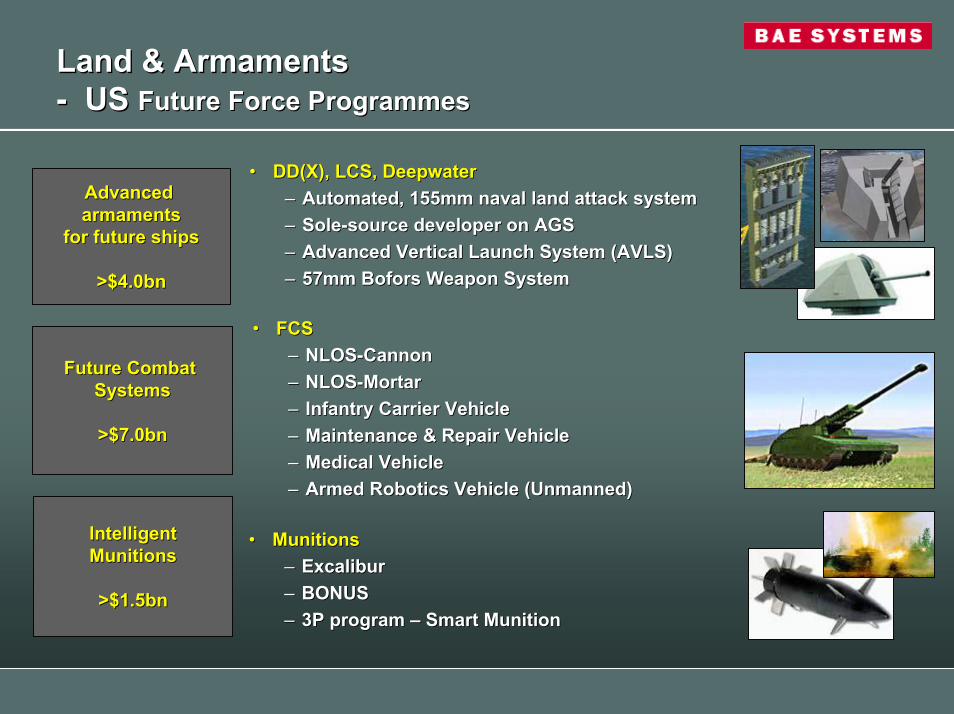
Land & ArmamentsLand & Armaments-- US US Future Force Future Force ProgrammesProgrammes
•• DD(X), LCS, DeepwaterDD(X), LCS, Deepwater–– Automated, 155mm naval land attack systemAutomated, 155mm naval land attack system–– SoleSole--source developer on AGSsource developer on AGS–– Advanced Vertical Launch System (AVLS)Advanced Vertical Launch System (AVLS)–– 57mm 57mm BoforsBofors Weapon System
Advanced Advanced armamentsarmaments
for future shipsfor future ships
>$4.0bn>$4.0bn Weapon System
•• FCSFCS–– NLOSNLOS--CannonCannon–– NLOSNLOS--MortarMortar–– Infantry Carrier VehicleInfantry Carrier Vehicle–– Maintenance & Repair VehicleMaintenance & Repair Vehicle–– Medical VehicleMedical Vehicle–– Armed Robotics Vehicle (Unmanned)
Future Combat Future Combat SystemsSystems
>$7.0bn>$7.0bn
Armed Robotics Vehicle (Unmanned)
IntelligentIntelligentMunitionsMunitions
>$1.5bn
•• MunitionsMunitions–– ExcaliburExcalibur–– BONUS BONUS –– 3P program 3P program –– Smart Smart Munition
>$1.5bnMunition
Date/reference/classification
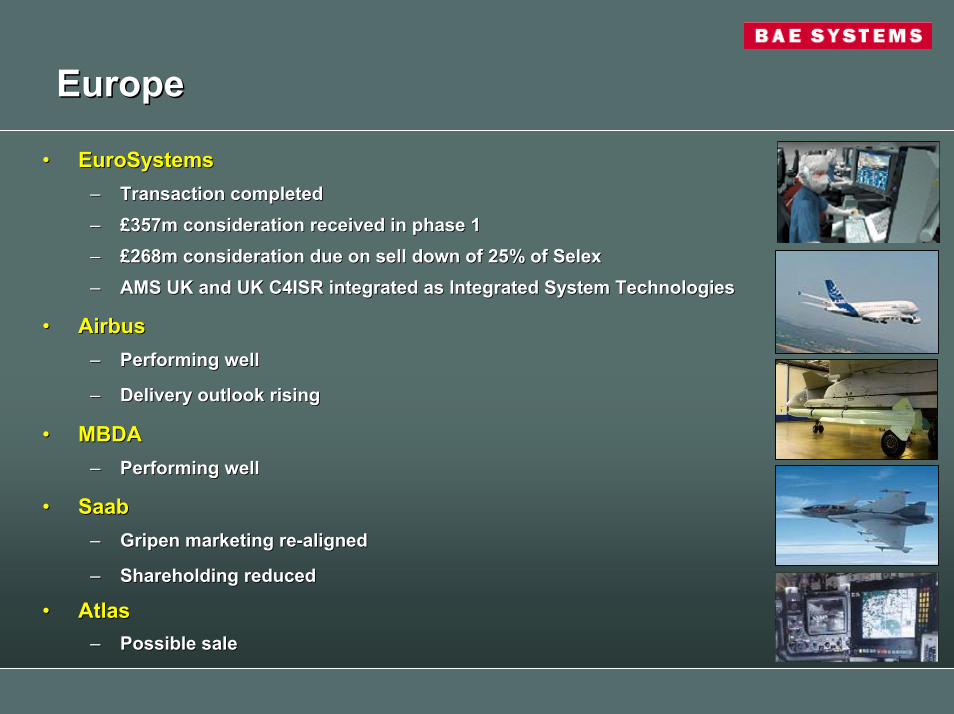
EuropeEurope
•• EuroSystemsEuroSystems–– Transaction completedTransaction completed–– ££357m consideration received in phase 1357m consideration received in phase 1–– ££268m consideration due on sell down of 25% of 268m consideration due on sell down of 25% of SelexSelex–– AMS UK and UK C4ISR integrated as Integrated System TechnologiesAMS UK and UK C4ISR integrated as Integrated System Technologies
•• Airbus Airbus –– Performing well Performing well
–– Delivery outlook risingDelivery outlook rising
•• MBDA MBDA –– Performing wellPerforming well
•• SaabSaab–– GripenGripen marketing remarketing re--alignedaligned
–– Shareholding reducedShareholding reduced
•• AtlasAtlas–– Possible salePossible sale
Date/reference/classification
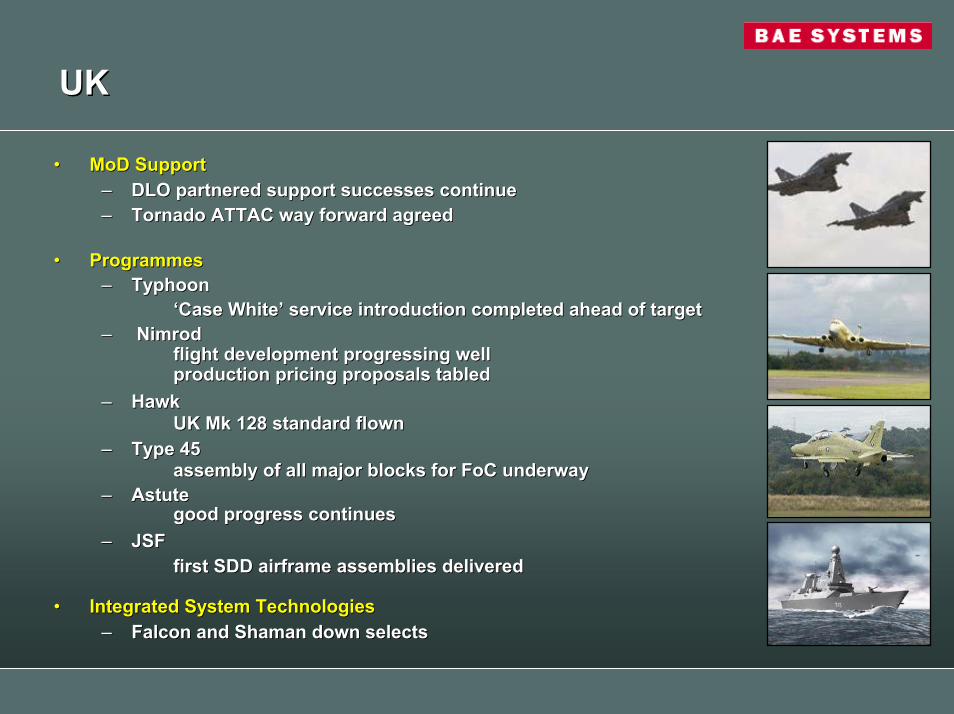
UKUK
•• MoD SupportMoD Support–– DLO partnered support successes continueDLO partnered support successes continue–– Tornado ATTAC way forward agreedTornado ATTAC way forward agreed
•• ProgrammesProgrammes–– Typhoon Typhoon
‘‘Case WhiteCase White’’ service introduction completed ahead of targetservice introduction completed ahead of target–– NimrodNimrod
flight development progressing wellflight development progressing wellproduction pricing proposals tabledproduction pricing proposals tabled
–– Hawk Hawk UK Mk 128 standard flownUK Mk 128 standard flown
–– Type 45Type 45assembly of all major blocks for assembly of all major blocks for FoCFoC underwayunderway
–– Astute Astute good progress continues good progress continues
–– JSFJSFfirst SDD airframe assemblies deliveredfirst SDD airframe assemblies delivered
•• Integrated System TechnologiesIntegrated System Technologies–– Falcon and Shaman down selectsFalcon and Shaman down selects
Date/reference/classification
2005 Interim Results2005 Interim Results
Date/reference/classification
2005 Interim Results2005 Interim Results
George RoseGeorge RoseGroup Finance DirectorGroup Finance Director
Date/reference/classification
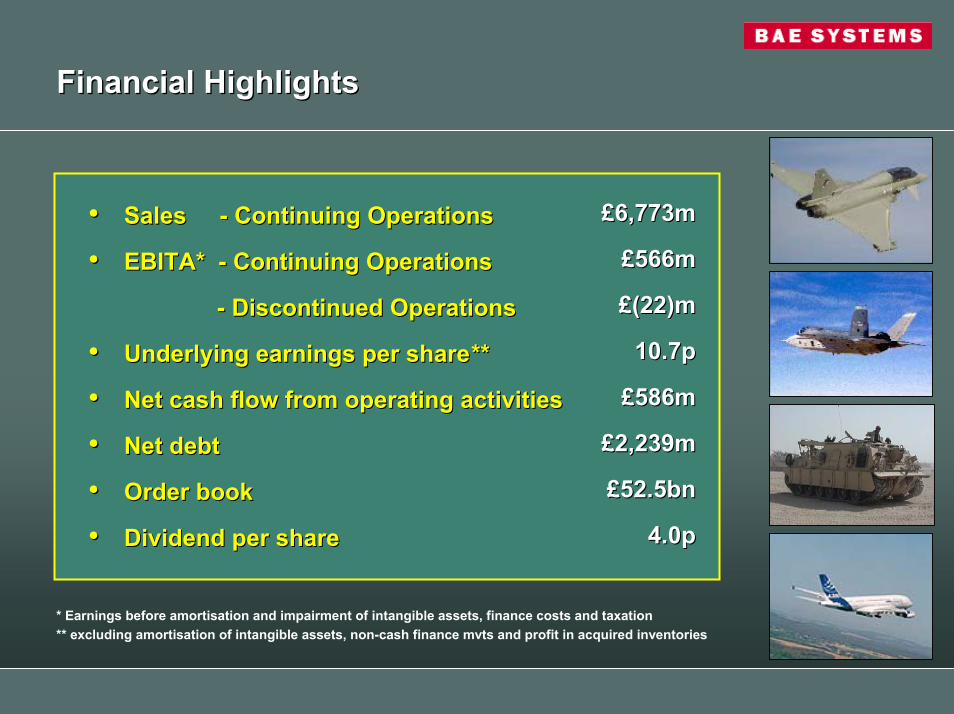
Financial HighlightsFinancial Highlights
•• Sales Sales -- Continuing OperationsContinuing Operations
•• EBITA* EBITA* -- Continuing OperationsContinuing Operations
-- Discontinued Operations Discontinued Operations
•• Underlying earnings per shareUnderlying earnings per share****
•• Net cash flow from operating activities Net cash flow from operating activities
•• Net debt Net debt
•• Order bookOrder book
•• Dividend per shareDividend per share
££6,773m6,773m
££566m566m
££(22)m(22)m
10.7p10.7p
££586m586m
££2,239m 2,239m
££52.5bn 52.5bn
4.0p4.0p
* Earnings before amortisation and impairment of intangible assets, finance costs and taxation** excluding amortisation of intangible assets, non-cash finance mvts and profit in acquired inventories
Date/reference/classification
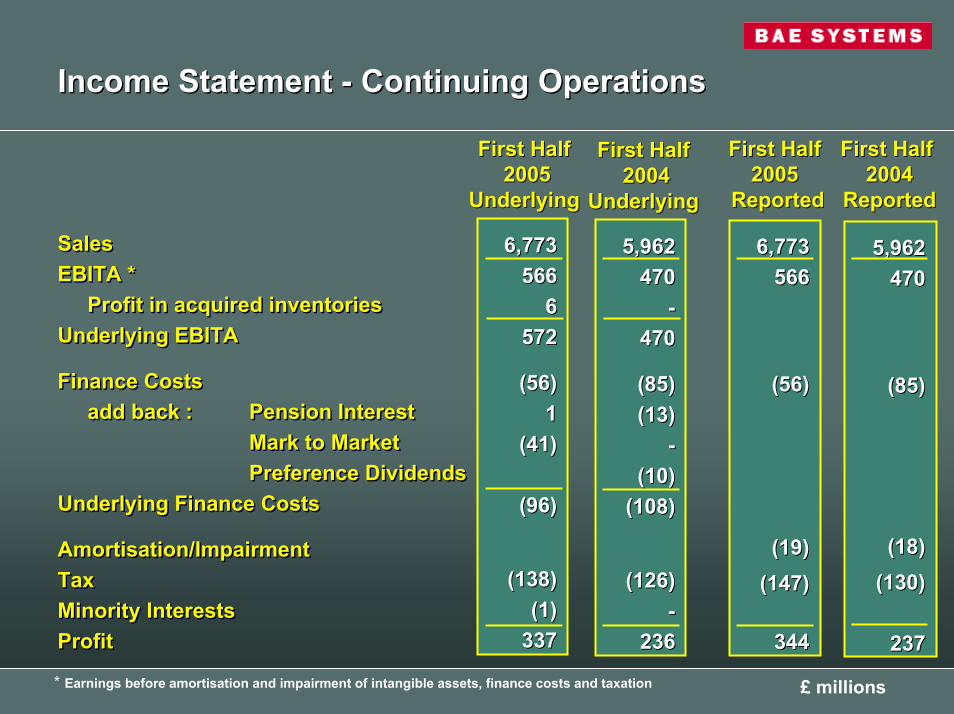
Income Statement Income Statement -- Continuing OperationsContinuing Operations
First Half First Half 20042004
Reported
5,9625,962470470
(85)(85)
(18)(18)(130)(130)
237237
Reported
First Half First Half 2005 2005
Reported
First HalfFirst Half20052005
Underlying Underlying ReportedUnderlying
First HalfFirst Half20042004
SalesEBITA *
Profit in acquired inventoriesUnderlying EBITA
Finance Costsadd back : Pension Interest
Mark to MarketPreference Dividends
Underlying Finance Costs
Amortisation/ImpairmentTaxMinority InterestsProfit
SalesSalesEBITA *EBITA *
Profit in acquired inventoriesProfit in acquired inventoriesUnderlying EBITAUnderlying EBITA
Finance CostsFinance Costsadd back : add back : Pension InterestPension Interest
Mark to MarketMark to MarketPreference DividendsPreference Dividends
Underlying Finance Costs Underlying Finance Costs
Amortisation/ImpairmentAmortisation/ImpairmentTaxTaxMinority InterestsMinority InterestsProfitProfit
6,7736,773566566
66572572
(56)(56)11
(41)(41)
(96)(96)
(138)(138)(1)(1)
337337
5,9625,962470470
--470470
(85)(85)(13)(13)
--(10)(10)
(108)(108)
(126)(126)--
236236
6,7736,773566566
(56)(56)
(19)(19)(147)(147)
344344
Underlying
* Earnings before amortisation and impairment of intangible assets, finance costs and taxation £ millions
Date/reference/classification
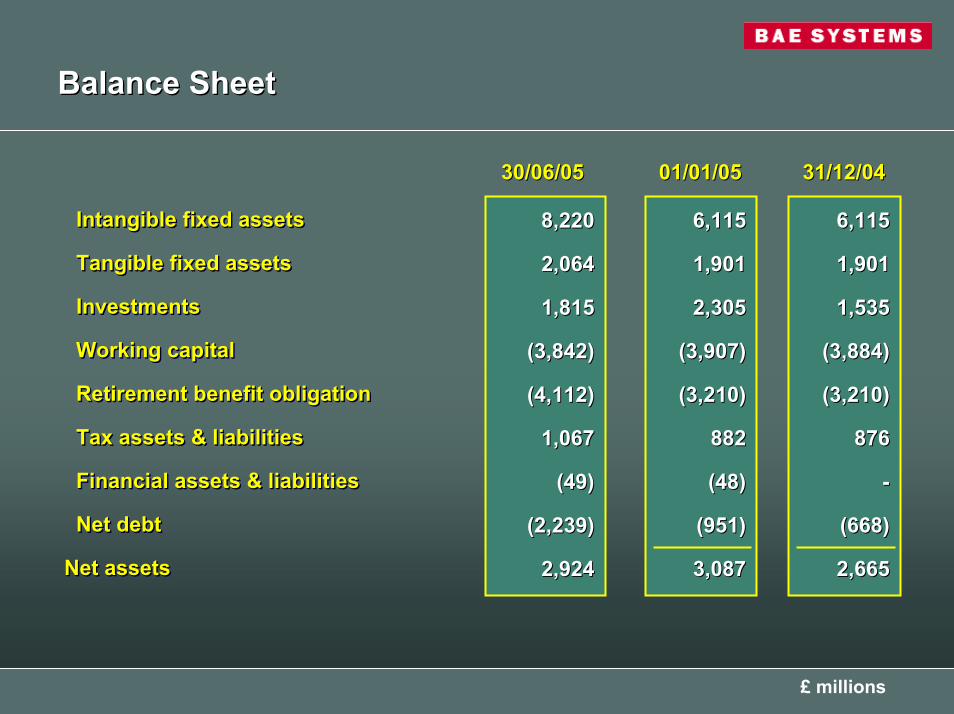
Balance SheetBalance Sheet
6,115 6,115
1,9011,901
1,5351,535
(3,884)(3,884)
(3,210)(3,210)
876 876
--
(668)(668)
2,6652,665
6,115 6,115
1,9011,901
2,3052,305
(3,907)(3,907)
(3,210)(3,210)
882 882
(48)(48)
(951)(951)
3,0873,087
£ millions
Intangible fixed assets
Tangible fixed assets
Investments
Working capital
Retirement benefit obligation
Tax assets & liabilities
Financial assets & liabilities
Net debt
Net assets
Intangible fixed assetsIntangible fixed assets
Tangible fixed assetsTangible fixed assets
Investments Investments
Working capitalWorking capital
Retirement benefit obligationRetirement benefit obligation
Tax assets & liabilitiesTax assets & liabilities
Financial assets & liabilitiesFinancial assets & liabilities
Net debtNet debt
Net assetsNet assets
31/12/0431/12/0430/06/0530/06/05 01/01/0501/01/05
8,220 8,220
2,0642,064
1,8151,815
(3,842)(3,842)
(4,112)(4,112)
1,0671,067
(49)(49)
(2,239)(2,239)
2,9242,924
Date/reference/classification
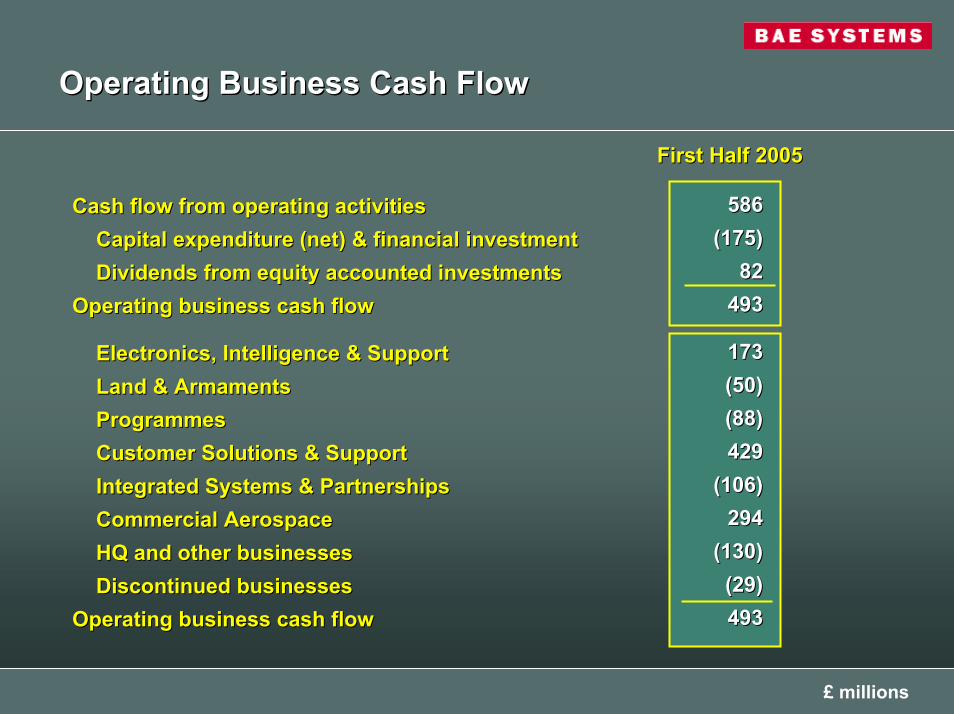
Operating Business Cash FlowOperating Business Cash Flow
First Half 2005 First Half 2005
586586(175)(175)
8282493493
173173(50)(50)(88)(88)429429
(106)(106)294294
(130)(130)(29)(29)493493
Cash flow from operating activitiesCash flow from operating activitiesCapital expenditure (net) & financial investmentCapital expenditure (net) & financial investmentDividends from equity accounted investmentsDividends from equity accounted investments
Operating business cash flowOperating business cash flow
Electronics, Intelligence & SupportElectronics, Intelligence & SupportLand & ArmamentsLand & ArmamentsProgrammesProgrammesCustomer Solutions & SupportCustomer Solutions & SupportIntegrated Systems & PartnershipsIntegrated Systems & PartnershipsCommercial AerospaceCommercial AerospaceHQ and other businessesHQ and other businessesDiscontinued businessesDiscontinued businesses
Operating business cash flowOperating business cash flow
£ millions
Date/reference/classification
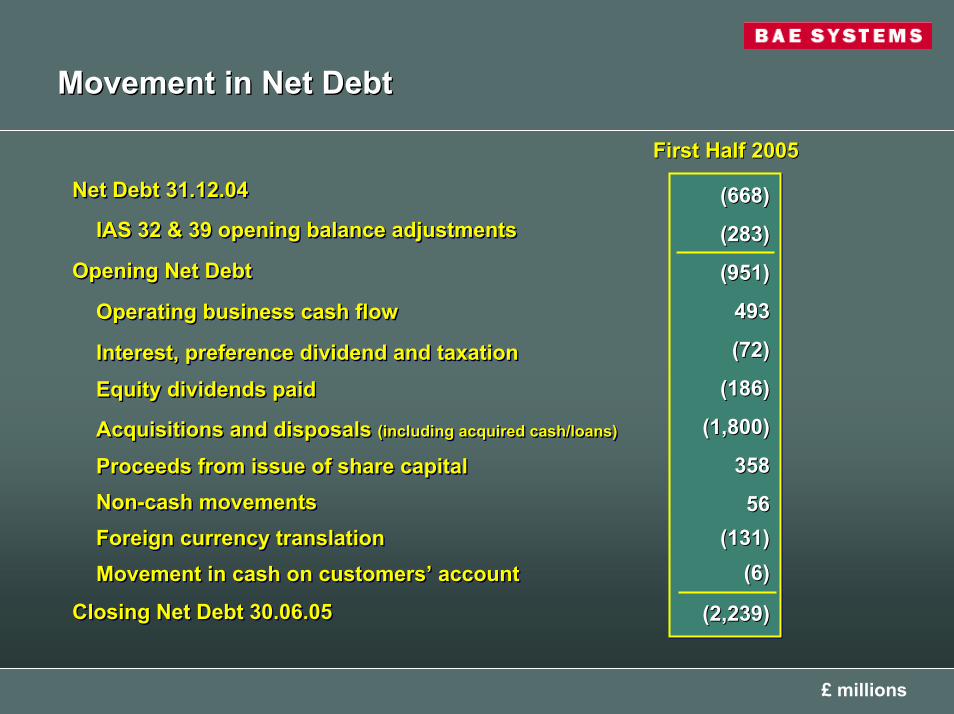
Movement in Net DebtMovement in Net Debt
First Half 2005First Half 2005
(668)
(283)
(951)
493
(72)
(186)
(1,800)
358
56(131)
(6)
(2,239)
(668)(668)
(283)(283)
(951)(951)
493493
(72)(72)
(186)(186)
(1,800)(1,800)
358358
5656(131)(131)
(6)(6)
(2,239)(2,239)
Net Debt 31.12.04
IAS 32 & 39 opening balance adjustments
Opening Net Debt
Operating business cash flow
Interest, preference dividend and taxationEquity dividends paid
Acquisitions and disposals (including acquired cash/loans)
Proceeds from issue of share capitalNon-cash movementsForeign currency translationMovement in cash on customers’ account
Closing Net Debt 30.06.05
Net Debt 31.12.04Net Debt 31.12.04
IAS 32 & 39 opening balance adjustmentsIAS 32 & 39 opening balance adjustments
Opening Net DebtOpening Net Debt
Operating business cash flowOperating business cash flow
Interest, preference dividend and taxationInterest, preference dividend and taxation
Equity dividends paidEquity dividends paid
Acquisitions and disposals Acquisitions and disposals (including acquired cash/loans)(including acquired cash/loans)
Proceeds from issue of share capitalProceeds from issue of share capitalNonNon--cash movementscash movementsForeign currency translationForeign currency translationMovement in cash on customersMovement in cash on customers’’ accountaccount
Closing Net Debt 30.06.05Closing Net Debt 30.06.05
£ millions
Date/reference/classification
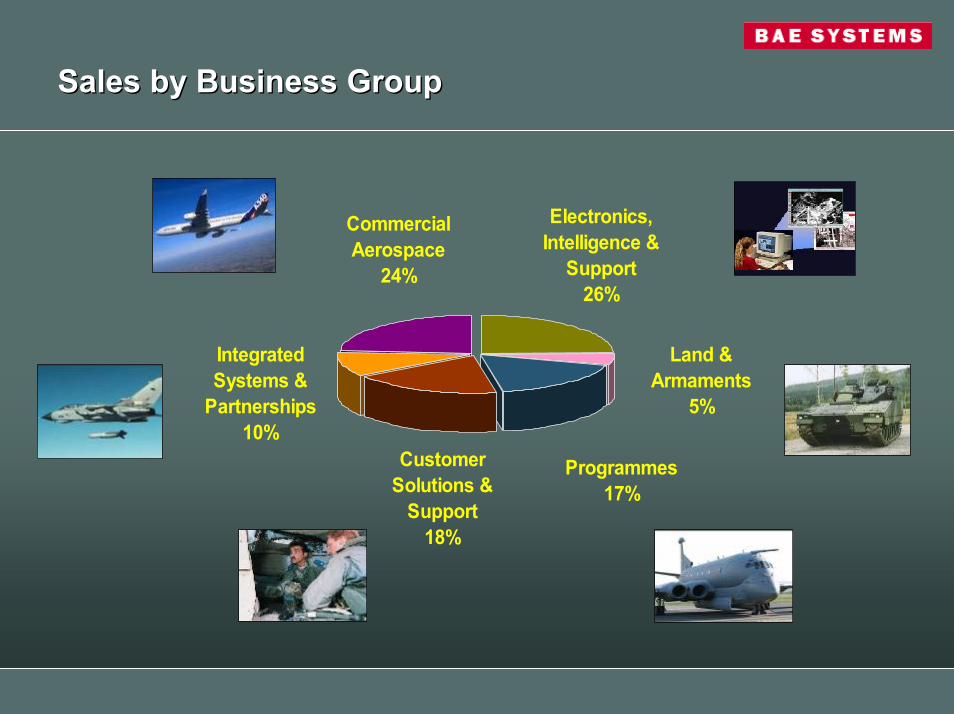
Sales by Business GroupSales by Business Group
Integrated Systems &
Partnerships10%
Customer Solutions &
Support18%
Programmes17%
Commercial Aerospace
24%
Land & Armaments
5%
Electronics, Intelligence &
Support26%

Date/reference/classification
Electronics, Intelligence & SupportElectronics, Intelligence & Support
SalesSales
EBITA EBITA
Margin Margin
Order book Order book
Cash flow Cash flow
First HalfFirst Half20052005
££1,715m1,715m
££151m151m
8.8%8.8%
££3.4bn3.4bn
££173m173m
First HalfFirst Half20042004
££1,468m1,468m
££117m117m
8.0%8.0%
££3.2bn3.2bn
££118m118m
Date/reference/classification
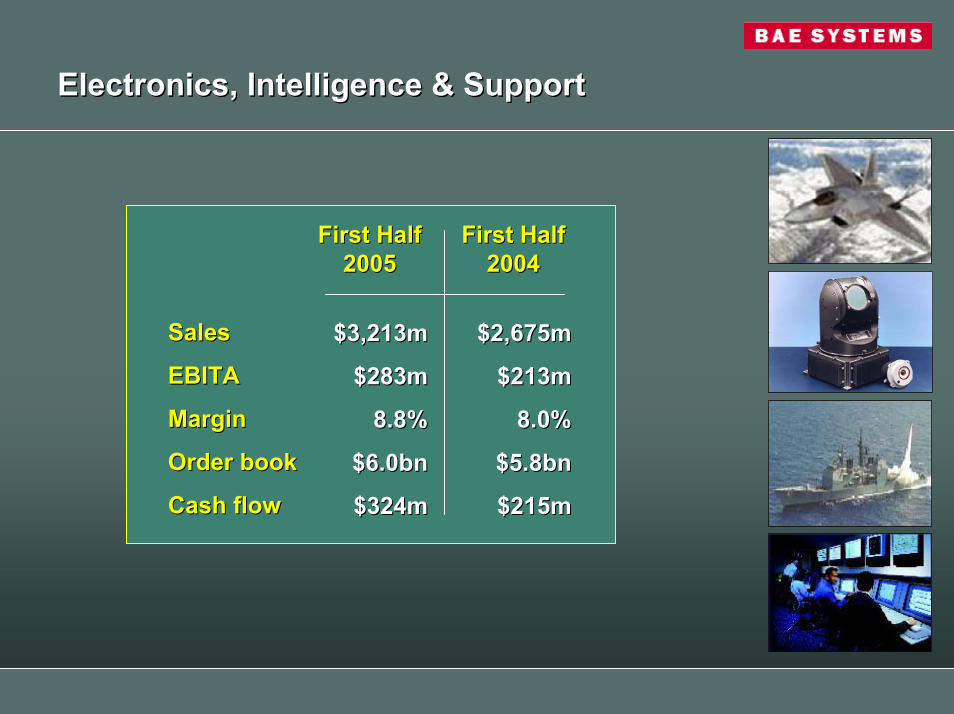
Electronics, Intelligence & SupportElectronics, Intelligence & Support
SalesSales
EBITA EBITA
Margin Margin
Order book Order book
Cash flow Cash flow
First HalfFirst Half20052005
$3,213m$3,213m
$283m$283m
8.8%8.8%
$6.0bn$6.0bn
$324m$324m
First HalfFirst Half20042004
$2,675m$2,675m
$213m$213m
8.0%8.0%
$5.8bn$5.8bn
$215m$215m
Date/reference/classification
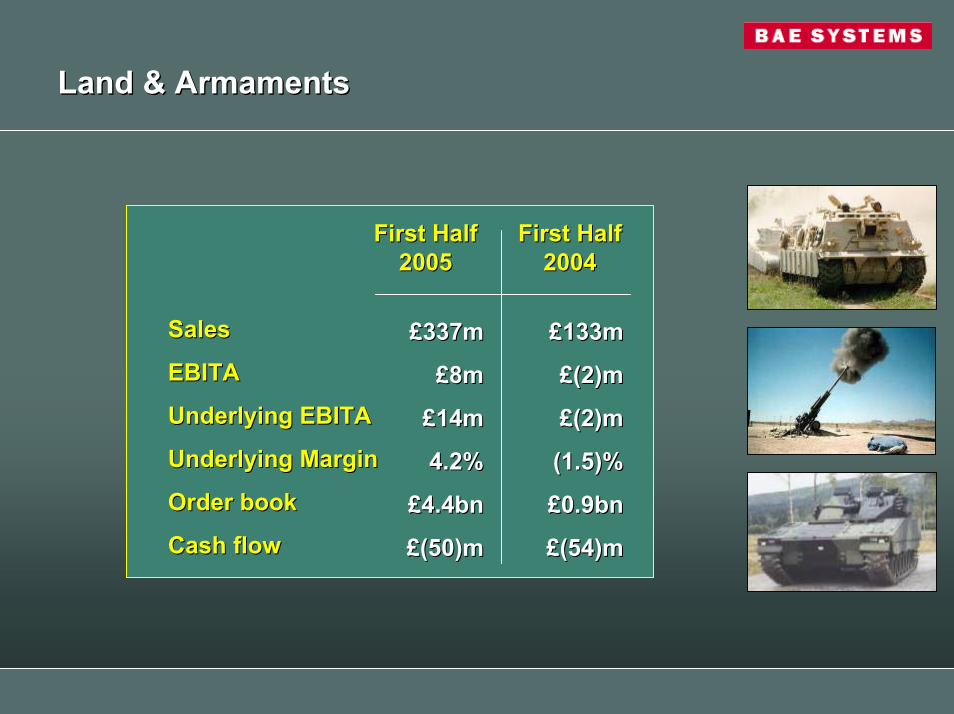
Land & ArmamentsLand & Armaments
SalesSales
EBITAEBITA
Underlying EBITAUnderlying EBITA
Underlying Margin Underlying Margin
Order book Order book
Cash flow Cash flow
First HalfFirst Half20052005
££337m337m
££8m8m
££14m14m
4.2%4.2%
££4.4bn4.4bn
££(50)m(50)m
First HalfFirst Half20042004
££133m133m
££(2)m(2)m
££(2)m(2)m
(1.5)%(1.5)%
££0.9bn0.9bn
££(54)m(54)m
Date/reference/classification
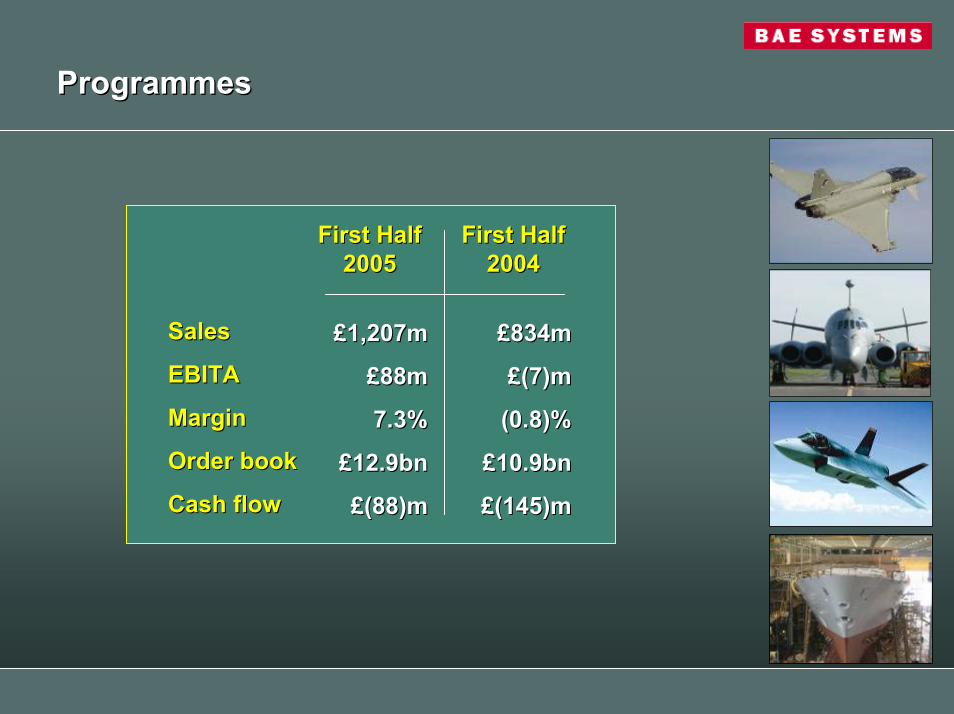
ProgrammesProgrammes
SalesSales
EBITA EBITA
Margin Margin
Order book Order book
Cash flow Cash flow
First HalfFirst Half20052005
££1,207m1,207m
££88m88m
7.3%7.3%
££12.9bn12.9bn
££(88)m(88)m
First HalfFirst Half20042004
££834m834m
££(7)m(7)m
(0.8)%(0.8)%
££10.9bn10.9bn
££(145)m(145)m
Date/reference/classification
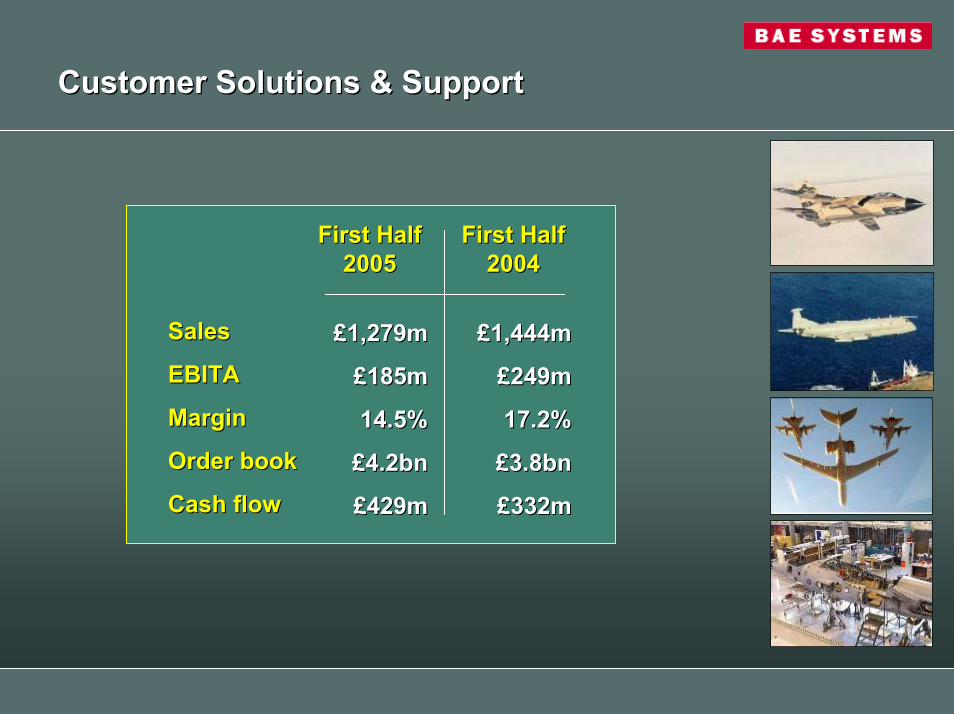
Customer Solutions & SupportCustomer Solutions & Support
SalesSales
EBITA EBITA
Margin Margin
Order book Order book
Cash flow Cash flow
First HalfFirst Half20052005
££1,279m1,279m
££185m185m
14.5%14.5%
££4.2bn4.2bn
££429m429m
First HalfFirst Half20042004
££1,444m1,444m
££249m249m
17.2%17.2%
££3.8bn3.8bn
££332m332m
Date/reference/classification
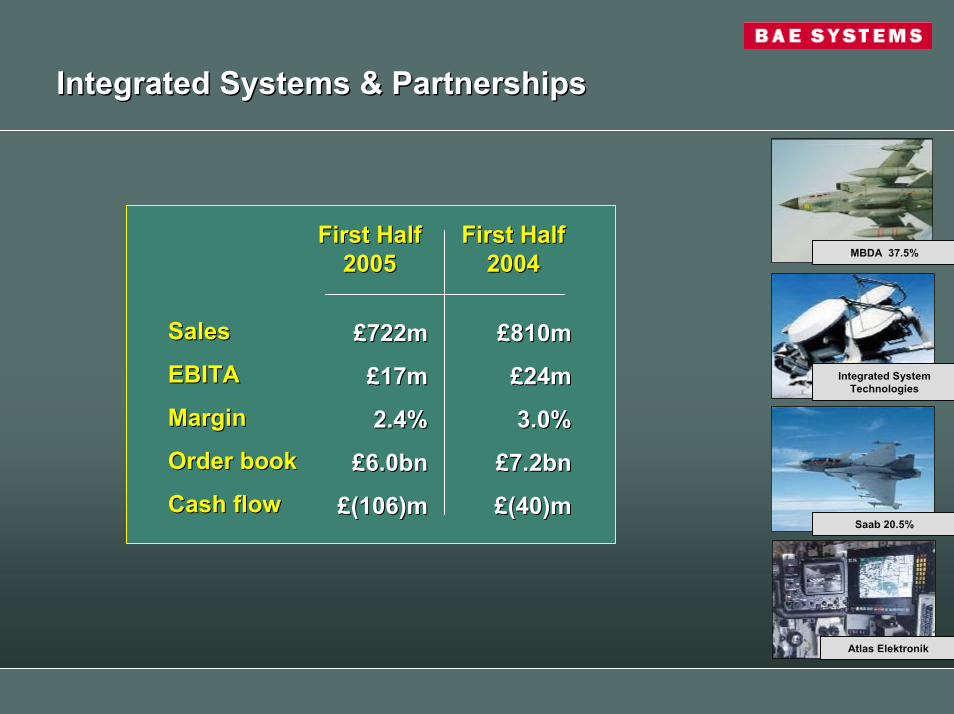
Integrated Systems & PartnershipsIntegrated Systems & Partnerships
MBDA 37.5%
SalesSales
EBITA EBITA
Margin Margin
Order book Order book
Cash flow Cash flow
First HalfFirst Half20052005
££722m722m
££17m17m
2.4%2.4%
££6.0bn6.0bn
££(106)m(106)m
First HalfFirst Half20042004
££810m810m
££24m24m
3.0%3.0%
££7.2bn7.2bn
££(40)m(40)m
Integrated System Technologies
Saab 20.5%
Atlas Elektronik
Date/reference/classification
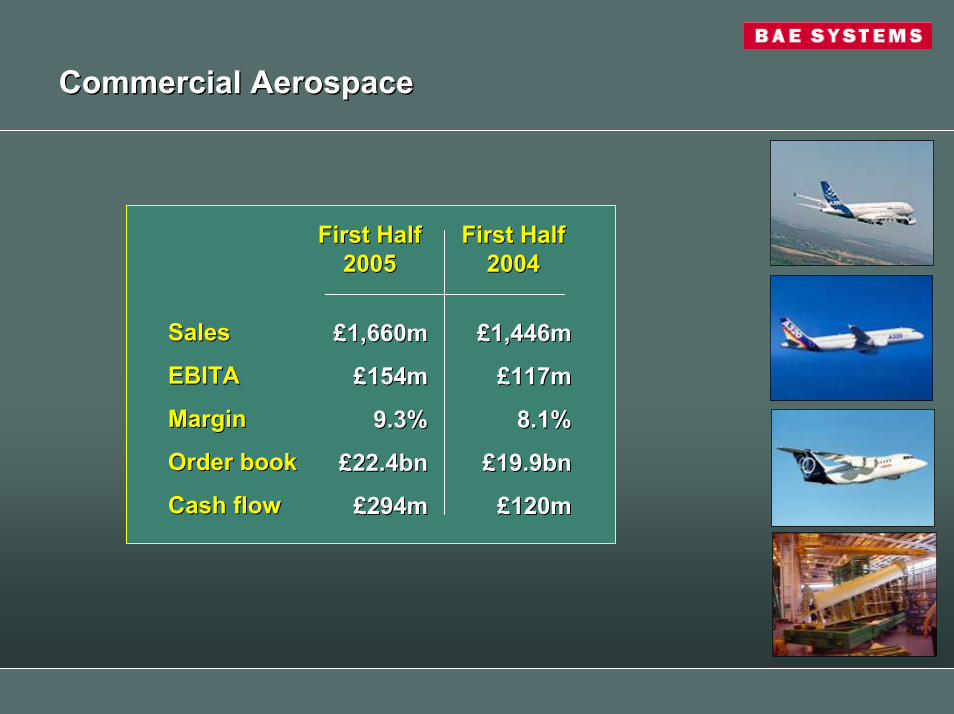
Commercial AerospaceCommercial Aerospace
SalesSales
EBITA EBITA
Margin Margin
Order book Order book
Cash flow Cash flow
First HalfFirst Half20052005
££1,660m1,660m
££154m154m
9.3%9.3%
££22.4bn22.4bn
££294m294m
First HalfFirst Half20042004
££1,446m1,446m
££117m117m
8.1%8.1%
££19.9bn19.9bn
££120m120m
Date/reference/classification
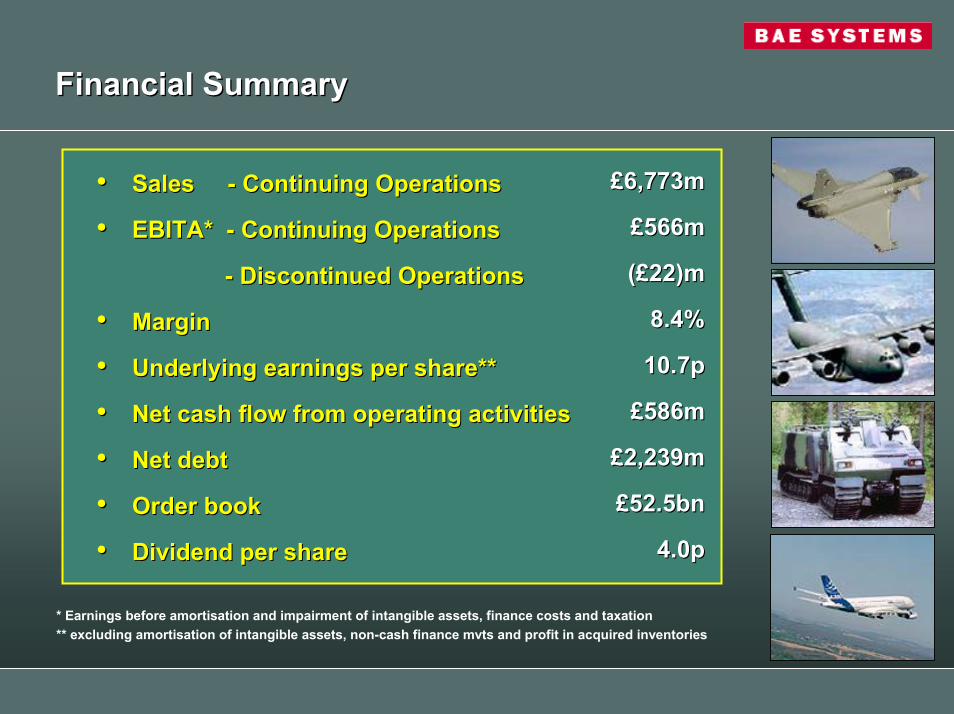
Financial SummaryFinancial Summary
•• Sales Sales -- Continuing OperationsContinuing Operations
•• EBITA* EBITA* -- Continuing OperationsContinuing Operations
-- Discontinued Operations Discontinued Operations
•• MarginMargin
•• Underlying earnings per share**Underlying earnings per share**
•• Net cash flow from operating activitiesNet cash flow from operating activities
•• Net debt Net debt
•• Order bookOrder book
•• Dividend per share Dividend per share
££6,773m6,773m
££566m566m
((££22)m22)m
8.4%8.4%
10.7p10.7p
££586m586m
££2,239m2,239m
££52.5bn 52.5bn
4.0p 4.0p
* Earnings before amortisation and impairment of intangible assets, finance costs and taxation** excluding amortisation of intangible assets, non-cash finance mvts and profit in acquired inventories
Date/reference/classification
2005 Interim Results2005 Interim Results
Mike TurnerMike TurnerChief ExecutiveChief Executive
Date/reference/classification
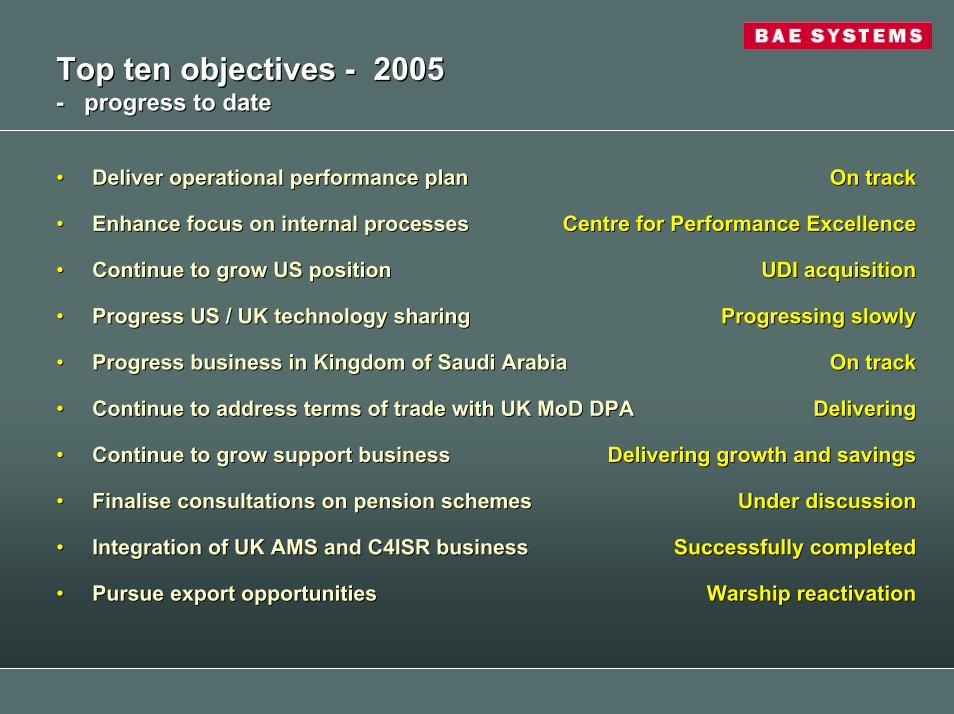
Top ten objectives Top ten objectives -- 2005 2005 -- progress to dateprogress to date
•• Deliver operational performance planDeliver operational performance plan
•• Enhance focus on internal processesEnhance focus on internal processes
•• Continue to grow US positionContinue to grow US position
•• Progress US / UK technology sharing Progress US / UK technology sharing
•• Progress business in Kingdom of Saudi Arabia Progress business in Kingdom of Saudi Arabia
•• Continue to address terms of trade with UK MoD DPAContinue to address terms of trade with UK MoD DPA
•• Continue to grow support business Continue to grow support business
•• Finalise consultations on pension schemesFinalise consultations on pension schemes
•• Integration of UK AMS and C4ISR businessIntegration of UK AMS and C4ISR business
•• Pursue export opportunities
On trackOn track
Centre for Performance ExcellenceCentre for Performance Excellence
UDI acquisitionUDI acquisition
Progressing slowlyProgressing slowly
On trackOn track
DeliveringDelivering
Delivering growth and savingsDelivering growth and savings
Under discussionUnder discussion
Successfully completedSuccessfully completed
Warship reactivationWarship reactivationPursue export opportunities
Date/reference/classification
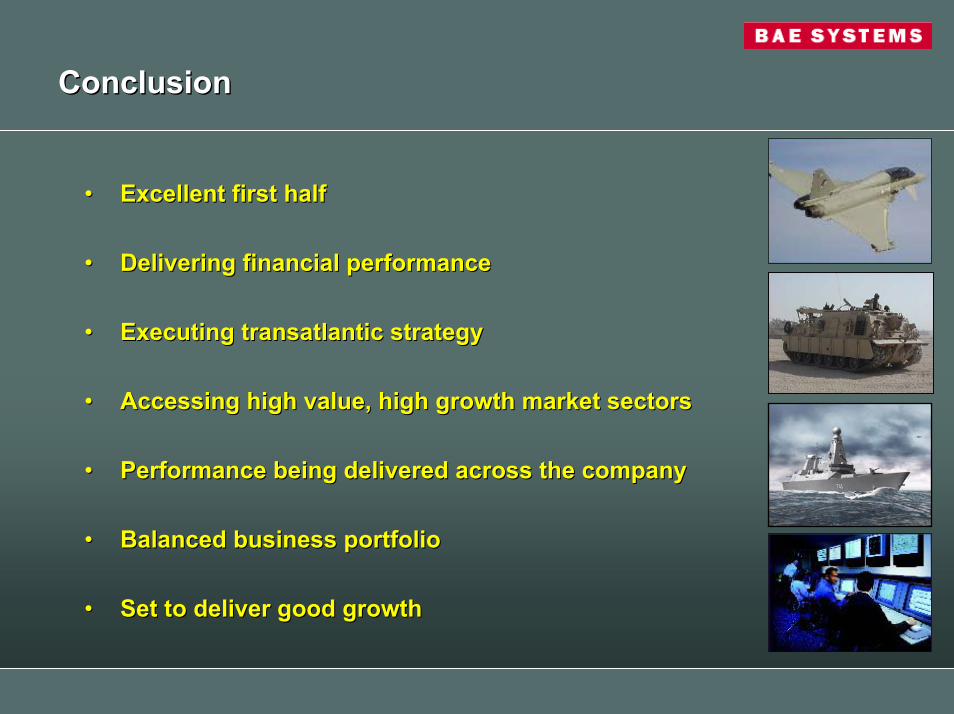
ConclusionConclusion
•• Excellent first halfExcellent first half
•• Delivering financial performanceDelivering financial performance
•• Executing transatlantic strategyExecuting transatlantic strategy
•• Accessing high value, high growth market sectorsAccessing high value, high growth market sectors
•• Performance being delivered across the companyPerformance being delivered across the company
•• Balanced business portfolioBalanced business portfolio
•• Set to deliver good growthSet to deliver good growth

Date/reference/classification
Handouts
Date/reference/classification
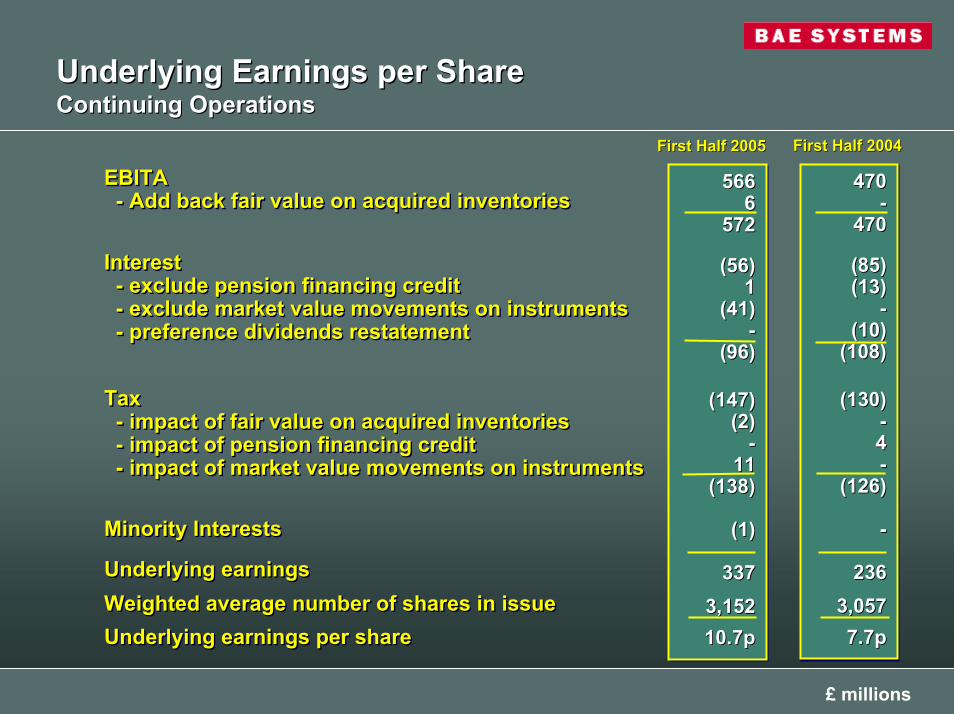
Underlying Earnings per ShareUnderlying Earnings per ShareContinuing OperationsContinuing Operations
First Half 2005First Half 2005 First Half 2004
470-
470
(85)(13)
-(10)
(108)
(130)-4-
(126)
-
2363,0577.7p
470470--
470470
(85)(85)(13)(13)
--(10)(10)
(108)(108)
(130)(130)--44--
(126)(126)
--
2362363,0573,0577.7p7.7p
EBITA- Add back fair value on acquired inventories
Interest- exclude pension financing credit- exclude market value movements on instruments- preference dividends restatement
Tax - impact of fair value on acquired inventories- impact of pension financing credit- impact of market value movements on instruments
Minority Interests
Underlying earningsWeighted average number of shares in issueUnderlying earnings per share
EBITAEBITA-- Add back fair value on acquired inventoriesAdd back fair value on acquired inventories
InterestInterest-- exclude pension financing creditexclude pension financing credit-- exclude market value movements on instrumentsexclude market value movements on instruments-- preference dividends restatementpreference dividends restatement
Tax Tax -- impact of fair value on acquired inventoriesimpact of fair value on acquired inventories-- impact of pension financing creditimpact of pension financing credit-- impact of market value movements on instrumentsimpact of market value movements on instruments
Minority InterestsMinority Interests
Underlying earningsUnderlying earningsWeighted average number of shares in issueWeighted average number of shares in issueUnderlying earnings per shareUnderlying earnings per share
5666
572
(56)1
(41)-
(96)
(147)(2)
-11
(138)
(1)
3373,15210.7p
56656666
572572
(56)(56)11
(41)(41)--
(96)(96)
(147)(147)(2)(2)
--1111
(138)(138)
(1)(1)
3373373,1523,15210.7p10.7p
First Half 2004
£ millions
Date/reference/classification
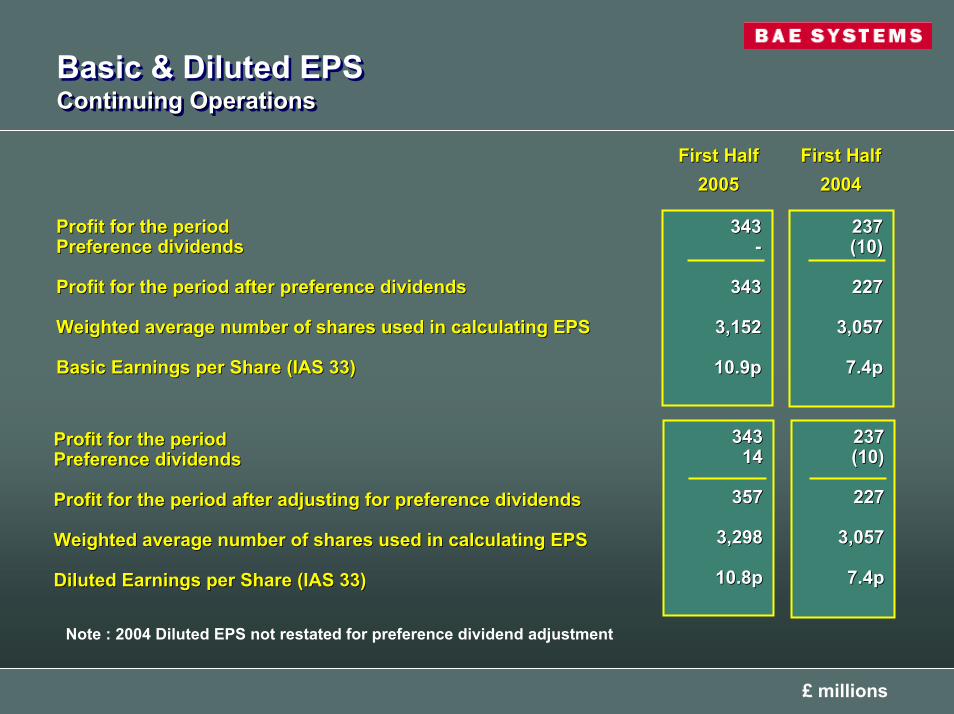
Basic & Diluted EPSContinuing OperationsBasic & Diluted EPSContinuing OperationsContinuing Operations
First HalfFirst Half2005
First HalfFirst Half200420042005
343343--
343343
3,1523,152
10.9p10.9p
237237(10)(10)
227227
3,0573,057
7.4p7.4p
Profit for the period Profit for the period Preference dividendsPreference dividends
Profit for the period after preference dividendsProfit for the period after preference dividends
Weighted average number of shares used in calculating EPSWeighted average number of shares used in calculating EPS
Basic Earnings per Share (IAS 33)Basic Earnings per Share (IAS 33)
3433431414
357357
3,2983,298
10.8p10.8p
237237(10)(10)
227227
3,0573,057
7.4p7.4p
Profit for the period Profit for the period Preference dividendsPreference dividends
Profit for the period after adjusting for preference dividendsProfit for the period after adjusting for preference dividends
Weighted average number of shares used in calculating EPSWeighted average number of shares used in calculating EPS
Diluted Earnings per Share (IAS 33)Diluted Earnings per Share (IAS 33)
Note : 2004 Diluted EPS not restated for preference dividend adjustment
£ millions
Date/reference/classification
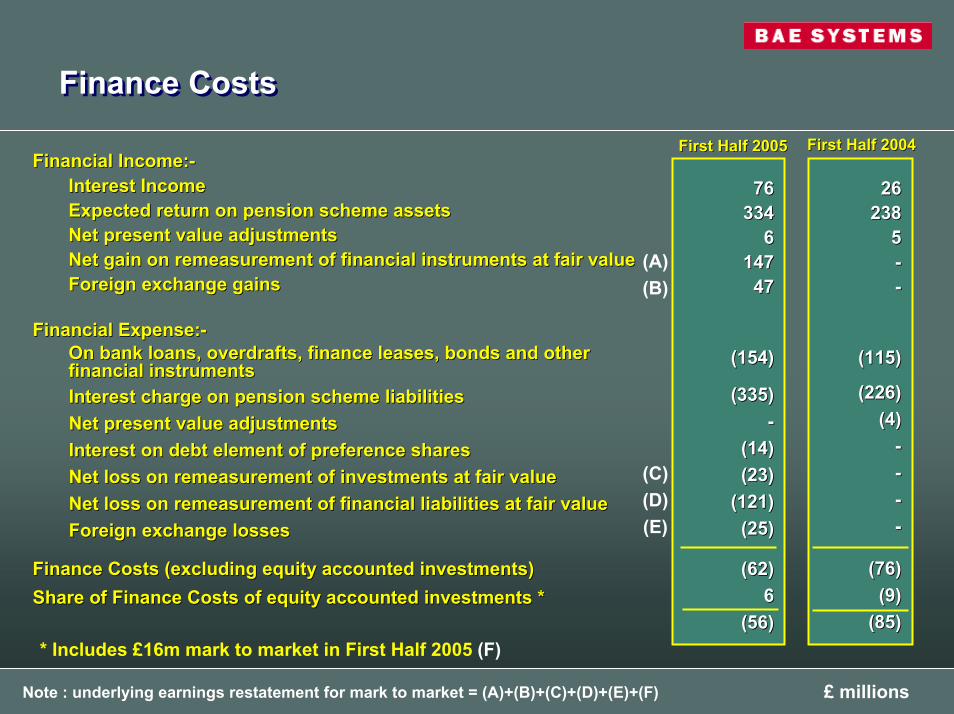
Finance CostsFinance Costs
First Half 2004First Half 2004Financial Income:Financial Income:--
Interest IncomeInterest IncomeExpected return on pension scheme assetsExpected return on pension scheme assetsNet present value adjustmentsNet present value adjustmentsNet gain on Net gain on remeasurementremeasurement of financial instruments at fair value of financial instruments at fair value Foreign exchange gainsForeign exchange gains
Financial Expense:Financial Expense:--On bank loans, overdrafts, finance leases, bonds and other On bank loans, overdrafts, finance leases, bonds and other financial instrumentsfinancial instrumentsInterest charge on pension scheme liabilitiesInterest charge on pension scheme liabilitiesNet present value adjustmentsNet present value adjustmentsInterest on debt element of preference sharesInterest on debt element of preference sharesNet loss on Net loss on remeasurementremeasurement of investments at fair valueof investments at fair valueNet loss on Net loss on remeasurementremeasurement of financial liabilities at fair valueof financial liabilities at fair valueForeign exchange lossesForeign exchange losses
Finance Costs (excluding equity accounted investments)Finance Costs (excluding equity accounted investments)Share of Finance Costs of equity accounted investments *Share of Finance Costs of equity accounted investments *
76 76 334334
66147147
4747
(154)(154)
(335)(335)--
(14)(14)(23)(23)
(121)(121)(25)(25)
(62)(62)66
(56)(56)* Includes £16m mark to market in First Half 2005 (F)
(A)(B)
(C)(D)(E)
First Half 2005First Half 2005
2626238238
55----
(115)(115)
(226)(226)(4)(4)
--------
(76)(76)(9)(9)
(85)(85)
£ millionsNote : underlying earnings restatement for mark to market = (A)+(B)+(C)+(D)+(E)+(F)
Date/reference/classification
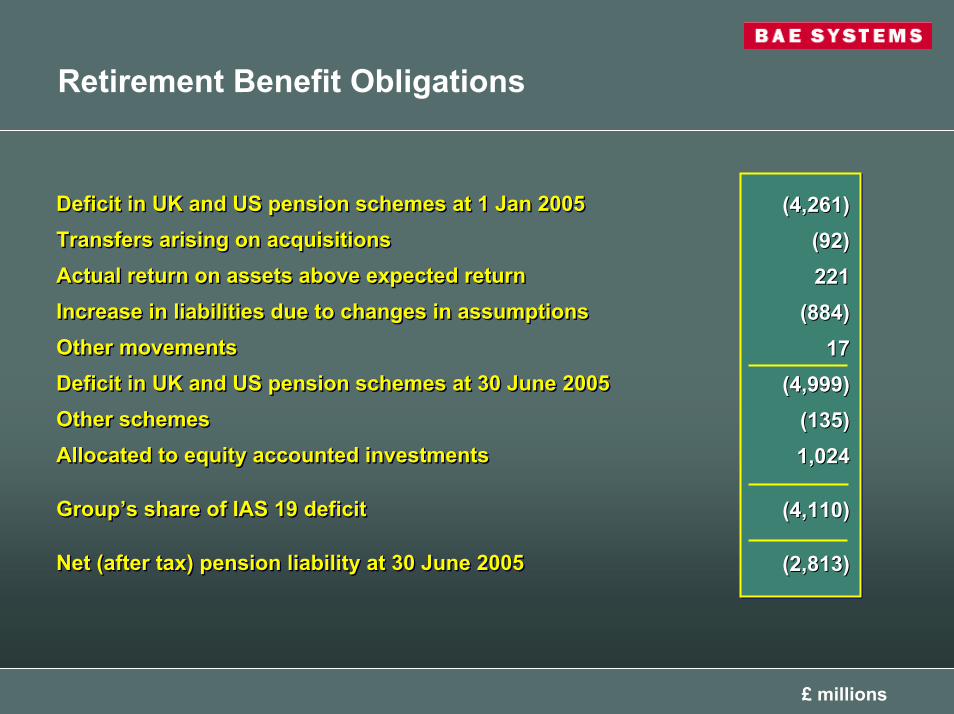
Retirement Benefit Obligations
(4,261)(92)221
(884)17
(4,999)(135)1,024
(4,110)
(2,813)
(4,261)(4,261)(92)(92)221221
(884)(884)1717
(4,999)(4,999)(135)(135)1,0241,024
(4,110)(4,110)
(2,813)(2,813)
Deficit in UK and US pension schemes at 1 Jan 2005Transfers arising on acquisitionsActual return on assets above expected returnIncrease in liabilities due to changes in assumptionsOther movementsDeficit in UK and US pension schemes at 30 June 2005 Other schemesAllocated to equity accounted investments
Group’s share of IAS 19 deficit
Net (after tax) pension liability at 30 June 2005
Deficit in UK and US pension schemes at 1 Jan 2005Deficit in UK and US pension schemes at 1 Jan 2005Transfers arising on acquisitionsTransfers arising on acquisitionsActual return on assets above expected returnActual return on assets above expected returnIncrease in liabilities due to changes in assumptionsIncrease in liabilities due to changes in assumptionsOther movementsOther movementsDeficit in UK and US pension schemes at 30 June 2005 Deficit in UK and US pension schemes at 30 June 2005 Other schemesOther schemesAllocated to equity accounted investmentsAllocated to equity accounted investments
GroupGroup’’s share of IAS 19 deficits share of IAS 19 deficit
Net (after tax) pension liability at 30 June 2005Net (after tax) pension liability at 30 June 2005
£ millions
Date/reference/classification
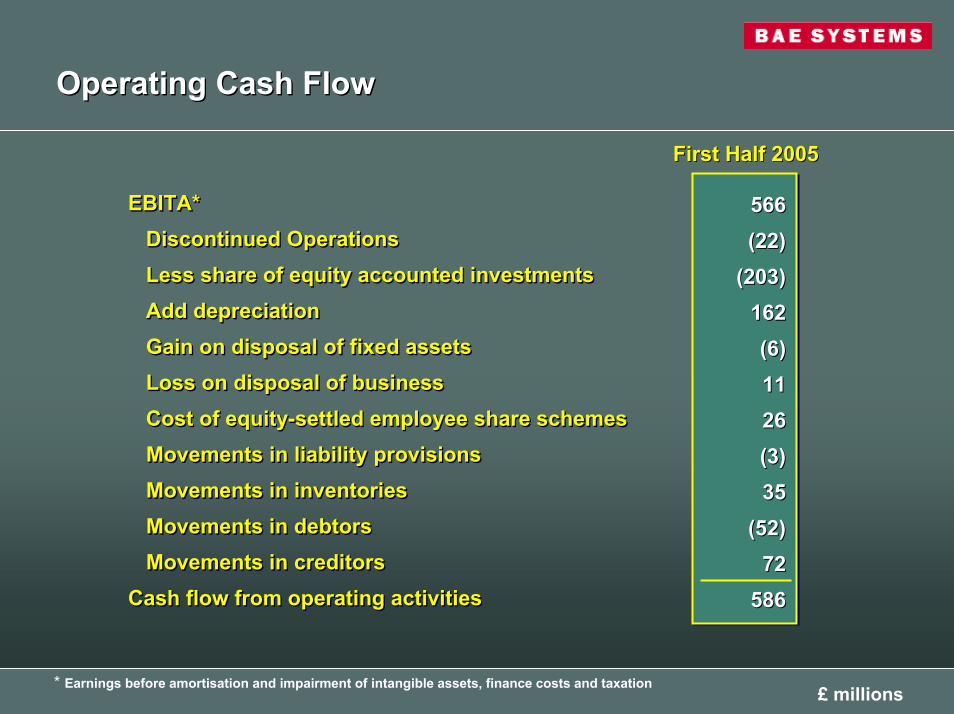
Operating Cash FlowOperating Cash Flow
First Half 2005 First Half 2005
566(22)
(203)162(6) 1126(3)35
(52)72
586
566566(22)(22)
(203)(203)162162(6) (6) 11112626(3)(3)3535
(52)(52)7272
586586
EBITA*Discontinued OperationsLess share of equity accounted investmentsAdd depreciationGain on disposal of fixed assetsLoss on disposal of businessCost of equity-settled employee share schemesMovements in liability provisionsMovements in inventoriesMovements in debtorsMovements in creditors
Cash flow from operating activities
EBITA*EBITA*Discontinued OperationsDiscontinued OperationsLess share of equity accounted investmentsLess share of equity accounted investmentsAdd depreciationAdd depreciationGain on disposal of fixed assetsGain on disposal of fixed assetsLoss on disposal of businessLoss on disposal of businessCost of equityCost of equity--settled employee share schemessettled employee share schemesMovements in liability provisionsMovements in liability provisionsMovements in inventoriesMovements in inventoriesMovements in debtorsMovements in debtorsMovements in creditorsMovements in creditors
Cash flow from operating activitiesCash flow from operating activities
* Earnings before amortisation and impairment of intangible assets, finance costs and taxation £ millions
Date/reference/classification
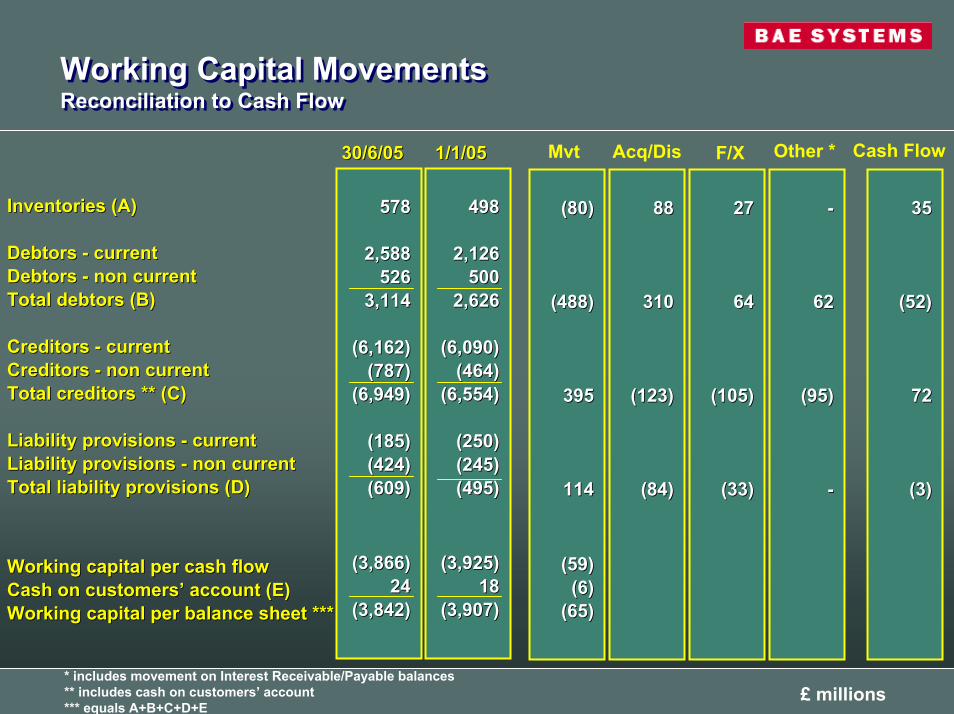
Working Capital MovementsReconciliation to Cash FlowWorking Capital MovementsReconciliation to Cash Flow
Cash FlowOther *Mvt Acq/Dis
Inventories (A)Inventories (A)
Debtors Debtors -- currentcurrentDebtors Debtors -- non currentnon currentTotal debtors (B)Total debtors (B)
Creditors Creditors -- currentcurrentCreditors Creditors -- non currentnon currentTotal creditors ** (C)Total creditors ** (C)
Liability provisions Liability provisions -- currentcurrentLiability provisions Liability provisions -- non currentnon currentTotal liability provisions (D)Total liability provisions (D)
Working capital per cash flowWorking capital per cash flowCash on customersCash on customers’’ account (E)account (E)Working capital per balance sheet ***Working capital per balance sheet ***
£ millions
578578
2,5882,588526526
3,1143,114
(6,162)(6,162)(787)(787)
(6,949)(6,949)
(185)(185)(424)(424)(609)(609)
(3,866)(3,866)2424
(3,842)(3,842)
1/1/051/1/0530/6/0530/6/05
498498
2,1262,126500500
2,6262,626
(6,090)(6,090)(464)(464)
(6,554)(6,554)
(250)(250)(245)(245)(495)(495)
(3,925)(3,925)1818
(3,907)(3,907)
(80)(80)
(488)(488)
395395
114114
(59)(59)(6)(6)
(65)(65)
8888
310310
(123)(123)
(84)(84)
F/X
--
6262
(95)(95)
--
2727
6464
(105)(105)
(33)
3535
(52)(52)
7272
(3)(33) (3)
* includes movement on Interest Receivable/Payable balances** includes cash on customers’ account*** equals A+B+C+D+E
Date/reference/classification
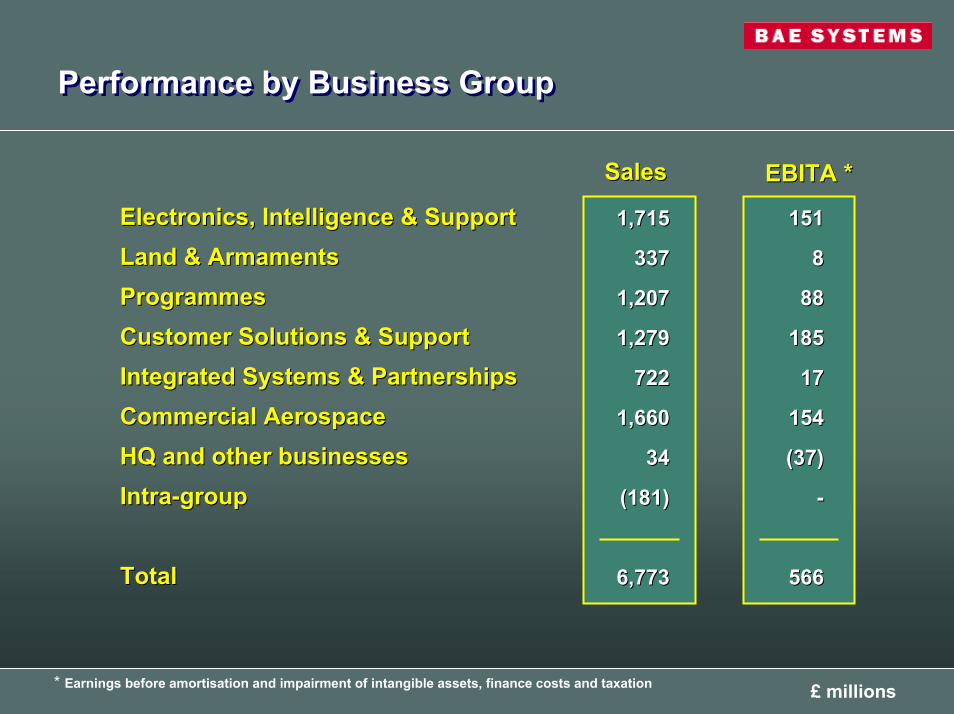
Performance by Business GroupPerformance by Business Group
SalesSales EBITA *
1,7151,715
337337
1,2071,207
1,2791,279
722722
1,6601,660
3434
(181)(181)
6,7736,773
151151
8 8
88 88
185185
1717
154154
(37)(37)
--
566566
EBITA *
Electronics, Intelligence & SupportElectronics, Intelligence & SupportLand & ArmamentsLand & ArmamentsProgrammesProgrammesCustomer Solutions & SupportCustomer Solutions & SupportIntegrated Systems & PartnershipsIntegrated Systems & PartnershipsCommercial AerospaceCommercial AerospaceHQ and other businessesHQ and other businessesIntraIntra--groupgroup
TotalTotal
* Earnings before amortisation and impairment of intangible assets, finance costs and taxation £ millions
Related Documents