2016 | UGANDA UPR FACTSHEET POVERTY AND FISCAL POLICY DESPITE DECLINING ABSOLUTE POVERTY, 2 OUT OF 3 UGANDANS REMAIN POOR OR AT RISK OF POVERTY. The number of people living below the official poverty line, which is equivalent to 1 USD per day, decreased significantly over the past decade (MFPED, 2014). However, the most recent government data shows that almost two thirds of the country, 21.4 million people, remain either poor or ‘at risk’ of poverty—meaning they live on less than USD 2 per day, a closer benchmark to the World Bank’s revised poverty line of USD 1.90 (World Bank, 2015). Naonal Trends in Poverty Status, 2002/3 - 2012/13 Source: MFPED, 2014 AGGREGATE PROGRESS MASKS PERSISTENT REGIONAL INEQUALITIES. Despite rapid urbanizaon, three quarters of the populaon sll lives in rural areas; of the rural populaon, 70.2% remain poor or at risk, compared to 38.5% in urban areas (MFPED, 2014). As shown below, consumpon rates, which measure monthly household expenditure, highlight significant disparies across the country. Average monthly consumpon (in UGX), by district, 2012/13 GAINS IN POVERTY REDUCTION REMAIN EXTREMELY PRECARIOUS. Just under three quarters of the rural populaon are engaged in subsistence agriculture (UBOS, 2014). As Uganda’s economic structure changes through the commercializaon of agriculture and growth of the extracve industry, their vulnerability to economic shocks will be exacerbated by increasing pressure on land, fluctuang commodity prices, and shiſting labour markets. FEW HAVE ACCCESS TO SOCIAL PROTECTION TO WITHSTAND ECONOMIC SHOCKS. Given the large informal sector, it is unsurprising only 2.3% of workers are covered by the Naonal Social Security Fund. Less than 4.3% of the populaon in need receives any kind of income support, which, to date, has been limited to small scale pilot schemes for the elderly (MGLSD, 2015). Spending on direct income support is only 0.33% of GDP— significantly lower than the 1.1% average among other low income African countries (GoU, 2015). Plans to scale up social protecon are undermined by heavy reliance on donors and a growing funding gap. Sources of funding for the Programme Plan of Intervenons for the Naonal Social Protecon Policy, 2015/16 – 2019/29, UGX Billion Government contribuon Development Partners Funding Gap Source: MGLSD, 2015 INVESTMENT IN ECONOMIC, SOCIAL AND CULTURAL RIGHTS IS LOW. In line with the second Naonal Development Plan (NDP II) strategy of fiscal expansion, the naonal budget grew to 22.4% of GDP in 2016/17. However, the bulk of it is earmarked for the development of large scale infrastructure projects. The World Bank has quesoned the economic benefit of this approach to date, nong corrupon and polical interference has contributed to a “huge backlog” of incomplete projects (World Bank, 2016). Further, it has squeezed fiscal space for the sectors crucial for economic, social and cultural rights, funding to which remains low and has largely stagnated since 2011/12. In its last Universal Periodic Review in 2011, Uganda made a voluntary commitment to mainstream human rights in all aspects of governance and accepted a number of recommendaons related to development. It was also one of the first countries to align its naonal planning processes to the Sustainable Development Goals. Nevertheless, its plans to fast- track the country’s economic transformaon and aain upper middle income status by 2040 pay inadequate aenon to the economic, social and cultural rights of Uganda’s most vulnerable, which risks exacerbang poverty and inequality. 100% 80% 60% 40% 20% 39.9% 38.8% 40.2% 42.9% 31.1% 24.5% 43.3% 19.7% Source: MFPED, 2014 Ugandan Shillings (billions) Lives on USD 1 - USD 2 per day Lives on less than USD 1 per day UGX >200 UGX < 60

Welcome message from author
This document is posted to help you gain knowledge. Please leave a comment to let me know what you think about it! Share it to your friends and learn new things together.
Transcript
2016 | UGANDA UPR FACTSHEET
POVERTY AND FISCAL POLICY
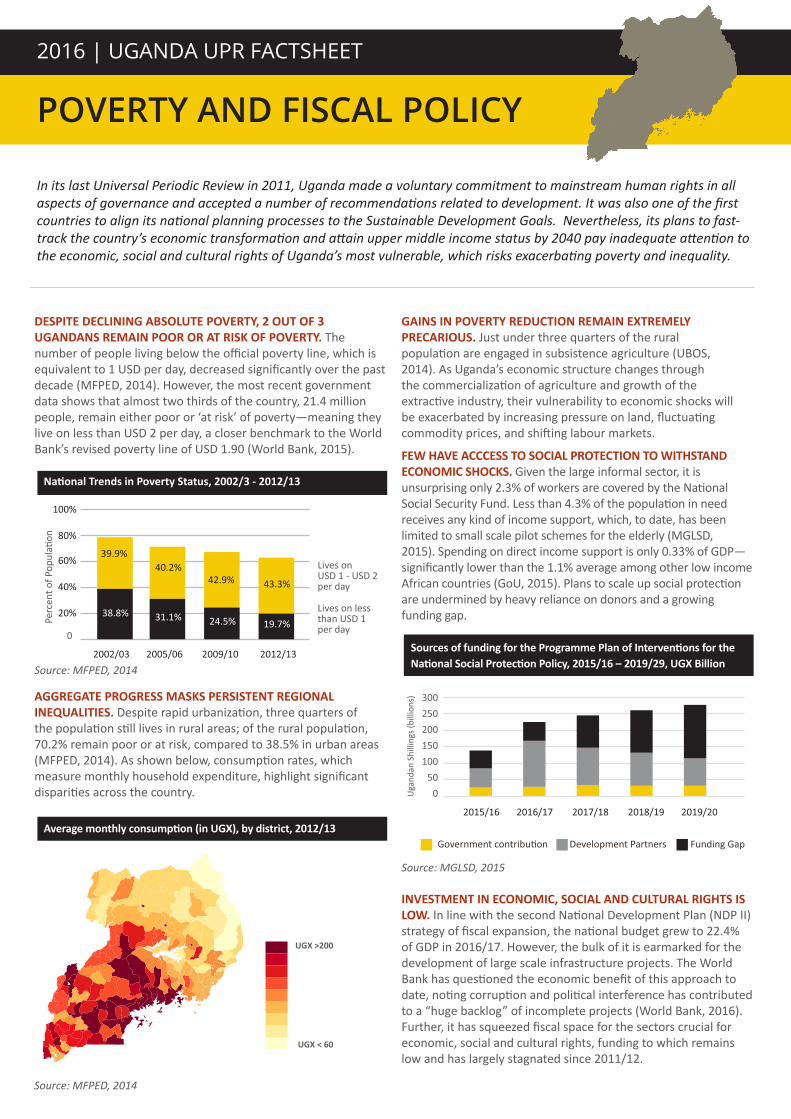
DESPITE DECLINING ABSOLUTE POVERTY, 2 OUT OF 3 UGANDANS REMAIN POOR OR AT RISK OF POVERTY. The number of people living below the official poverty line, which is equivalent to 1 USD per day, decreased significantly over the past decade (MFPED, 2014). However, the most recent government data shows that almost two thirds of the country, 21.4 million people, remain either poor or ‘at risk’ of poverty—meaning they live on less than USD 2 per day, a closer benchmark to the World Bank’s revised poverty line of USD 1.90 (World Bank, 2015).
National Trends in Poverty Status, 2002/3 - 2012/13
Source: MFPED, 2014
AGGREGATE PROGRESS MASKS PERSISTENT REGIONAL INEQUALITIES. Despite rapid urbanization, three quarters of the population still lives in rural areas; of the rural population, 70.2% remain poor or at risk, compared to 38.5% in urban areas (MFPED, 2014). As shown below, consumption rates, which measure monthly household expenditure, highlight significant disparities across the country.
Average monthly consumption (in UGX), by district, 2012/13
GAINS IN POVERTY REDUCTION REMAIN EXTREMELY PRECARIOUS. Just under three quarters of the rural population are engaged in subsistence agriculture (UBOS, 2014). As Uganda’s economic structure changes through the commercialization of agriculture and growth of the extractive industry, their vulnerability to economic shocks will be exacerbated by increasing pressure on land, fluctuating commodity prices, and shifting labour markets.
FEW HAVE ACCCESS TO SOCIAL PROTECTION TO WITHSTAND ECONOMIC SHOCKS. Given the large informal sector, it is unsurprising only 2.3% of workers are covered by the National Social Security Fund. Less than 4.3% of the population in need receives any kind of income support, which, to date, has been limited to small scale pilot schemes for the elderly (MGLSD, 2015). Spending on direct income support is only 0.33% of GDP—significantly lower than the 1.1% average among other low income African countries (GoU, 2015). Plans to scale up social protection are undermined by heavy reliance on donors and a growing funding gap.
Sources of funding for the Programme Plan of Interventions for the National Social Protection Policy, 2015/16 – 2019/29, UGX Billion
Government contribution Development Partners Funding Gap
Source: MGLSD, 2015
INVESTMENT IN ECONOMIC, SOCIAL AND CULTURAL RIGHTS IS LOW. In line with the second National Development Plan (NDP II) strategy of fiscal expansion, the national budget grew to 22.4% of GDP in 2016/17. However, the bulk of it is earmarked for the development of large scale infrastructure projects. The World Bank has questioned the economic benefit of this approach to date, noting corruption and political interference has contributed to a “huge backlog” of incomplete projects (World Bank, 2016). Further, it has squeezed fiscal space for the sectors crucial for economic, social and cultural rights, funding to which remains low and has largely stagnated since 2011/12.
In its last Universal Periodic Review in 2011, Uganda made a voluntary commitment to mainstream human rights in all aspects of governance and accepted a number of recommendations related to development. It was also one of the first countries to align its national planning processes to the Sustainable Development Goals. Nevertheless, its plans to fast-track the country’s economic transformation and attain upper middle income status by 2040 pay inadequate attention to the economic, social and cultural rights of Uganda’s most vulnerable, which risks exacerbating poverty and inequality.
100%
80%
60%
40%
20%
39.9%
38.8%
40.2%42.9%
31.1% 24.5%
43.3%
19.7%
Source: MFPED, 2014
Uga
ndan
Shi
lling
s (bi
llion
s)
Lives onUSD 1 - USD 2per day
Lives on lessthan USD 1per day
UGX >200
UGX < 60
2016 | UGANDA – UPR FACTSHEET
FACTSHEET 6
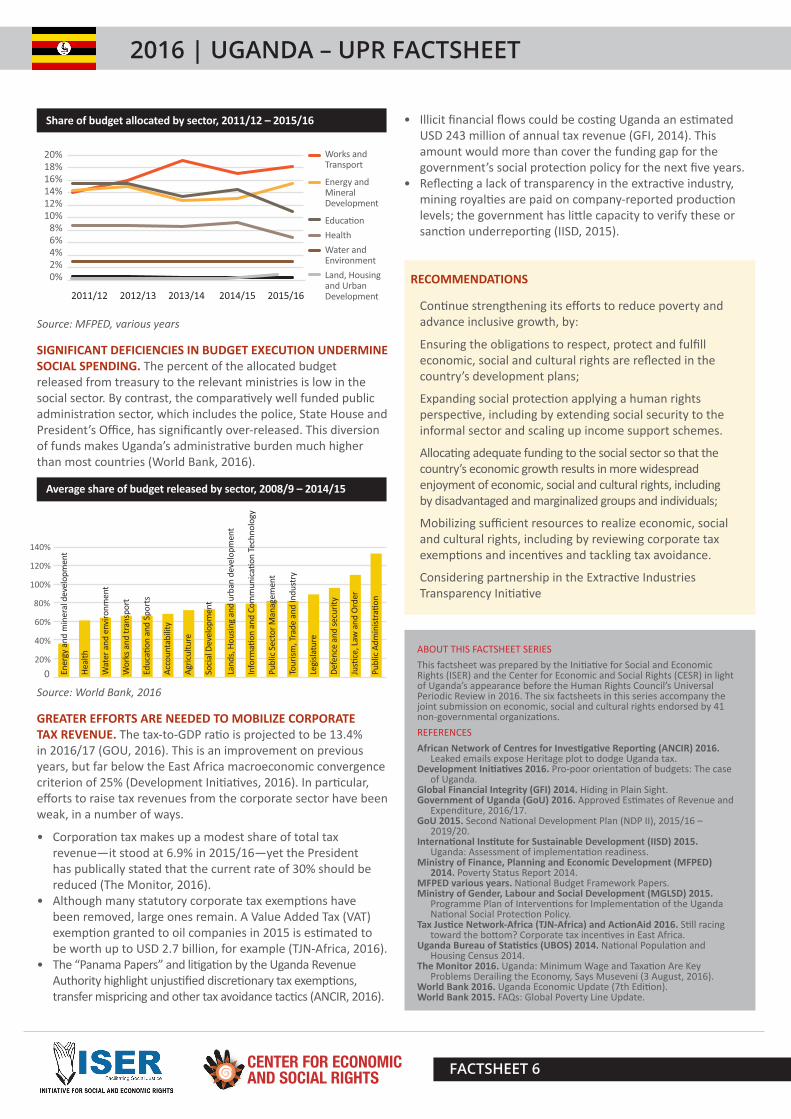
Share of budget allocated by sector, 2011/12 – 2015/16
Source: MFPED, various years
SIGNIFICANT DEFICIENCIES IN BUDGET EXECUTION UNDERMINE SOCIAL SPENDING. The percent of the allocated budget released from treasury to the relevant ministries is low in the social sector. By contrast, the comparatively well funded public administration sector, which includes the police, State House and President’s Office, has significantly over-released. This diversion of funds makes Uganda’s administrative burden much higher than most countries (World Bank, 2016).
Average share of budget released by sector, 2008/9 – 2014/15
Source: World Bank, 2016
GREATER EFFORTS ARE NEEDED TO MOBILIZE CORPORATE TAX REVENUE. The tax-to-GDP ratio is projected to be 13.4% in 2016/17 (GOU, 2016). This is an improvement on previous years, but far below the East Africa macroeconomic convergence criterion of 25% (Development Initiatives, 2016). In particular, efforts to raise tax revenues from the corporate sector have been weak, in a number of ways.
• Corporation tax makes up a modest share of total tax revenue—it stood at 6.9% in 2015/16—yet the President has publically stated that the current rate of 30% should be reduced (The Monitor, 2016).
• Although many statutory corporate tax exemptions have been removed, large ones remain. A Value Added Tax (VAT) exemption granted to oil companies in 2015 is estimated to be worth up to USD 2.7 billion, for example (TJN-Africa, 2016).
• The “Panama Papers” and litigation by the Uganda Revenue Authority highlight unjustified discretionary tax exemptions, transfer mispricing and other tax avoidance tactics (ANCIR, 2016).
• Illicit financial flows could be costing Uganda an estimated USD 243 million of annual tax revenue (GFI, 2014). This amount would more than cover the funding gap for the government’s social protection policy for the next five years.
• Reflecting a lack of transparency in the extractive industry, mining royalties are paid on company-reported production levels; the government has little capacity to verify these or sanction underreporting (IISD, 2015).
RECOMMENDATIONS
Continue strengthening its efforts to reduce poverty and advance inclusive growth, by:
Ensuring the obligations to respect, protect and fulfill economic, social and cultural rights are reflected in the country’s development plans;
Expanding social protection applying a human rights perspective, including by extending social security to the informal sector and scaling up income support schemes.
Allocating adequate funding to the social sector so that the country’s economic growth results in more widespread enjoyment of economic, social and cultural rights, including by disadvantaged and marginalized groups and individuals;
Mobilizing sufficient resources to realize economic, social and cultural rights, including by reviewing corporate tax exemptions and incentives and tackling tax avoidance.
Considering partnership in the Extractive Industries Transparency Initiative
ABOUT THIS FACTSHEET SERIESThis factsheet was prepared by the Initiative for Social and Economic Rights (ISER) and the Center for Economic and Social Rights (CESR) in light of Uganda’s appearance before the Human Rights Council’s Universal Periodic Review in 2016. The six factsheets in this series accompany the joint submission on economic, social and cultural rights endorsed by 41 non-governmental organizations.REFERENCESAfrican Network of Centres for Investigative Reporting (ANCIR) 2016.
Leaked emails expose Heritage plot to dodge Uganda tax.Development Initiatives 2016. Pro-poor orientation of budgets: The case
of Uganda.Global Financial Integrity (GFI) 2014. Hiding in Plain Sight.Government of Uganda (GoU) 2016. Approved Estimates of Revenue and
Expenditure, 2016/17.GoU 2015. Second National Development Plan (NDP II), 2015/16 –
2019/20. International Institute for Sustainable Development (IISD) 2015.
Uganda: Assessment of implementation readiness. Ministry of Finance, Planning and Economic Development (MFPED)
2014. Poverty Status Report 2014.MFPED various years. National Budget Framework Papers.Ministry of Gender, Labour and Social Development (MGLSD) 2015.
Programme Plan of Interventions for Implementation of the Uganda National Social Protection Policy.
Tax Justice Network-Africa (TJN-Africa) and ActionAid 2016. Still racing toward the bottom? Corporate tax incentives in East Africa.
Uganda Bureau of Statistics (UBOS) 2014. National Population and Housing Census 2014.
The Monitor 2016. Uganda: Minimum Wage and Taxation Are Key Problems Derailing the Economy, Says Museveni (3 August, 2016).
World Bank 2016. Uganda Economic Update (7th Edition).World Bank 2015. FAQs: Global Poverty Line Update.
140%
120%
100%
80%
60%
40%
20%
Related Documents

![UPR Info · 2017. 9. 29. · UPR Trax [No. 77] UPR Info Newsletter September 2017 In-country Pre-sessions: preparing for the UPR UPR Info in a nutshell Similarly to our work in September,](https://static.cupdf.com/doc/110x72/60c5a26cc561015c8d0d3503/upr-info-2017-9-29-upr-trax-no-77-upr-info-newsletter-september-2017-in-country.jpg)