Mechanical Behavior, Testing, and Manufacturing Properties of Materials 2 • This chapter examines the effects of external forces on the behavior of materials, and the test methods employed in determining various mechanical properties. • The tension test is described first. This test is commonly used for quantifying a number of material parameters, including elastic modulus, yield stress, ultimate strength, ductility, and toughness. • Compression tests are then described. These tests are useful because they more closely simulate manufacturing processes; nonetheless, they have the unavoid- able drawback of contributing friction to the testing. • Bending tests are particularly useful for brittle materials; three- and four-point tests are in common use. • Hardness and the variety of hardness tests and their applicability are then explored. • Fatigue involves the failure of material due to cyclic or repeating loads, whereas creep is deformation due to the application of a constant load over an extended period. • The chapter ends with descriptions of the types of, and factors involved in, failure and fracture of materials. 56 2.1 Introduction In manufacturing operations, numerous parts and components are formed into dif- ferent shapes by applying external forces to the workpiece, typically by means of var- ious tools and dies. Common examples of such operations are forging turbine disks, extruding various components of aluminum ladders, drawing wire for making nails, and rolling metal to make sheets for car bodies. Forming operations may be carried out at room temperature or at elevated temperatures, and at a low or a high rate of deformation. These operations are also used in forming and shaping nonmetallic materials such as plastics and ceramics, as described throughout this book. As indicated in Fig. 1.2, a wide variety of metallic and nonmetallic materials is now available, with an equally wide range of properties, as shown qualitatively in Table 2.1. This chapter covers those aspects of mechanical properties and behavior of metals that are relevant to the design and manufacturing of products and includes commonly used test methods employed in assessing various properties. CHAPTER 2.1 Introduction 56 2.2 Tension 57 2.3 Compression 66 2.4 Torsion 67 2.5 Bending (Flexure) 68 2.6 Hardness 68 2.7 Fatigue 74 2.8 Creep 75 2.9 Impact 75 2.10 Failure and Fracture of Materials in Manufacturing and in Service 76 2.11 Residual Stresses 81 2.12 Work, Heat, and Temperature 82 EXAMPLES: 2.1 Calculation of Ultimate Tensile Strength 63 2.2 Calculation of Modulus of Resilience from Hardness 72 M02_KALP1681_06_SE_C02.QXD 1/12/09 7:46 PM Page 56

Welcome message from author
This document is posted to help you gain knowledge. Please leave a comment to let me know what you think about it! Share it to your friends and learn new things together.
Transcript

Mechanical Behavior, Testing,and ManufacturingProperties ofMaterials2
• This chapter examines the effects of external forces on the behavior of materials,and the test methods employed in determining various mechanical properties.
• The tension test is described first. This test is commonly used for quantifying anumber of material parameters, including elastic modulus, yield stress, ultimatestrength, ductility, and toughness.
• Compression tests are then described. These tests are useful because they moreclosely simulate manufacturing processes; nonetheless, they have the unavoid-able drawback of contributing friction to the testing.
• Bending tests are particularly useful for brittle materials; three- and four-pointtests are in common use.
• Hardness and the variety of hardness tests and their applicability are thenexplored.
• Fatigue involves the failure of material due to cyclic or repeating loads, whereascreep is deformation due to the application of a constant load over an extendedperiod.
• The chapter ends with descriptions of the types of, and factors involved in, failureand fracture of materials.
56
2.1 Introduction
In manufacturing operations, numerous parts and components are formed into dif-ferent shapes by applying external forces to the workpiece, typically by means of var-ious tools and dies. Common examples of such operations are forging turbine disks,extruding various components of aluminum ladders, drawing wire for making nails,and rolling metal to make sheets for car bodies. Forming operations may be carriedout at room temperature or at elevated temperatures, and at a low or a high rate ofdeformation. These operations are also used in forming and shaping nonmetallicmaterials such as plastics and ceramics, as described throughout this book.
As indicated in Fig. 1.2, a wide variety of metallic and nonmetallic materials isnow available, with an equally wide range of properties, as shown qualitatively inTable 2.1. This chapter covers those aspects of mechanical properties and behaviorof metals that are relevant to the design and manufacturing of products and includescommonly used test methods employed in assessing various properties.
CH
AP
TE
R
2.1 Introduction 562.2 Tension 572.3 Compression 662.4 Torsion 672.5 Bending (Flexure) 682.6 Hardness 682.7 Fatigue 742.8 Creep 752.9 Impact 752.10 Failure and Fracture
of Materials inManufacturing and in Service 76
2.11 Residual Stresses 812.12 Work, Heat, and
Temperature 82
EXAMPLES:
2.1 Calculation of UltimateTensile Strength 63
2.2 Calculation of Modulus of Resilience fromHardness 72
M02_KALP1681_06_SE_C02.QXD 1/12/09 7:46 PM Page 56
Section 2.2 Tension 57
TABLE 2.1
Relative Mechanical Properties of Various Materials at Room Temperature, in Decreasing Order. Metals are inTheir Alloy Form.
Strength Hardness Toughness Stiffness Strength/DensityGlass fibers Diamond Ductile metals Diamond Reinforced plasticsCarbon fibers Cubic boron nitride Reinforced plastics Carbides TitaniumKevlar fibers Carbides Thermoplastics Tungsten SteelCarbides Hardened steels Wood Steel AluminumMolybdenum Titanium Thermosets Copper MagnesiumSteels Cast irons Ceramics Titanium BerylliumTantalum Copper Glass Aluminum CopperTitanium Thermosets Ceramics TantalumCopper Magnesium Reinforced plasticsReinforced thermosets Thermoplastics WoodReinforced thermoplastics Tin ThermosetsThermoplastics Lead ThermoplasticsLead Rubbers
2.2 Tension
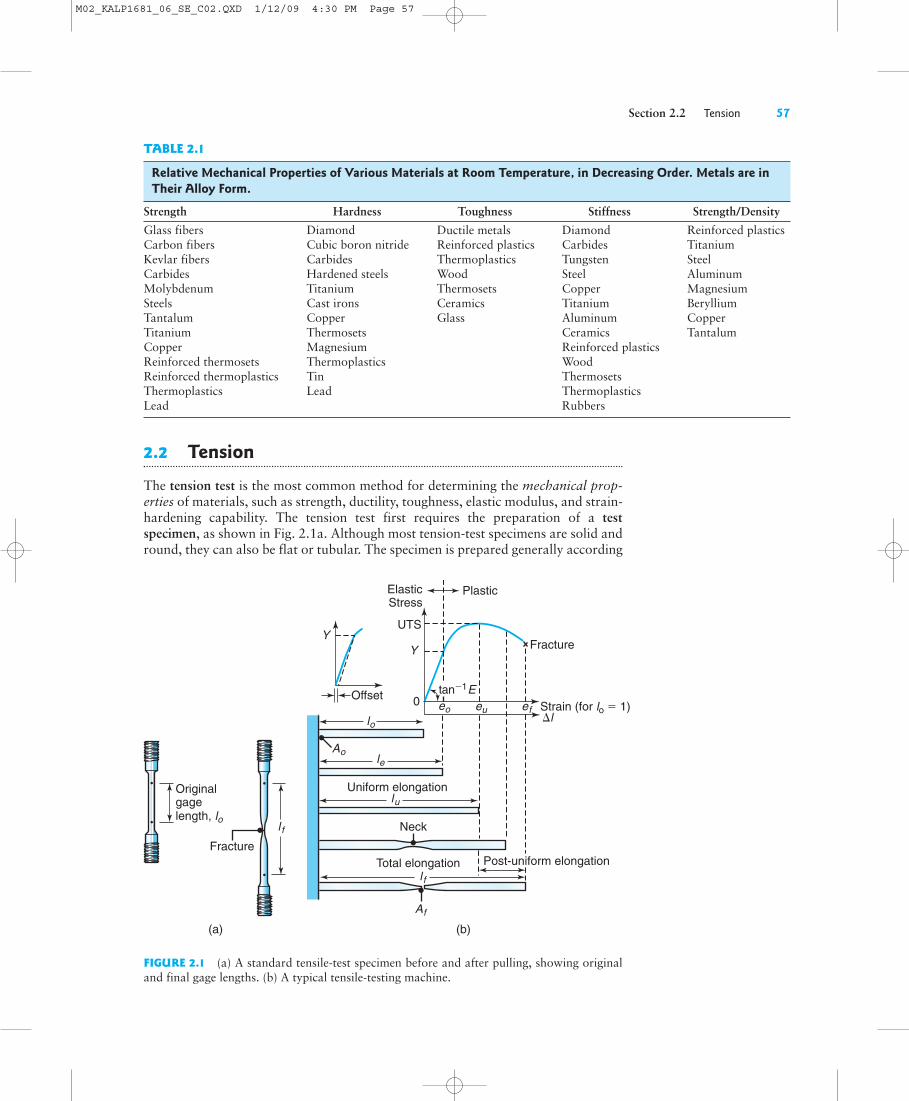
The tension test is the most common method for determining the mechanical prop-erties of materials, such as strength, ductility, toughness, elastic modulus, and strain-hardening capability. The tension test first requires the preparation of a testspecimen, as shown in Fig. 2.1a. Although most tension-test specimens are solid andround, they can also be flat or tubular. The specimen is prepared generally according
(a) (b)
Originalgagelength, lo
Fracture
l f
tan!1 E
PlasticElasticStress
UTS
Y Fracture
Strain (for lo " 1)#l
eueo ef0Offset
Af
Ao
Uniform elongation
Neck
Total elongation
Y
Post-uniform elongation
lo
le
lu
l f
FIGURE 2.1 (a) A standard tensile-test specimen before and after pulling, showing originaland final gage lengths. (b) A typical tensile-testing machine.
M02_KALP1681_06_SE_C02.QXD 1/12/09 4:30 PM Page 57
58 Chapter 2 Mechanical Behavior, Testing, and Manufacturing Properties of Materials
to ASTM specifications; various other specificationsare also available from corresponding organizationsaround the world.
Typically, the specimen has an original gagelength, lo, generally 50 mm (2 in.), and a cross-sectionalarea, Ao, usually with a diameter of 12.5 mm (0.5 in.).It is mounted in the jaws of a tension-testing machine(Fig. 2.1b) equipped with various accessories and con-trols so that the specimen can be tested at differenttemperatures and rates of deformation.
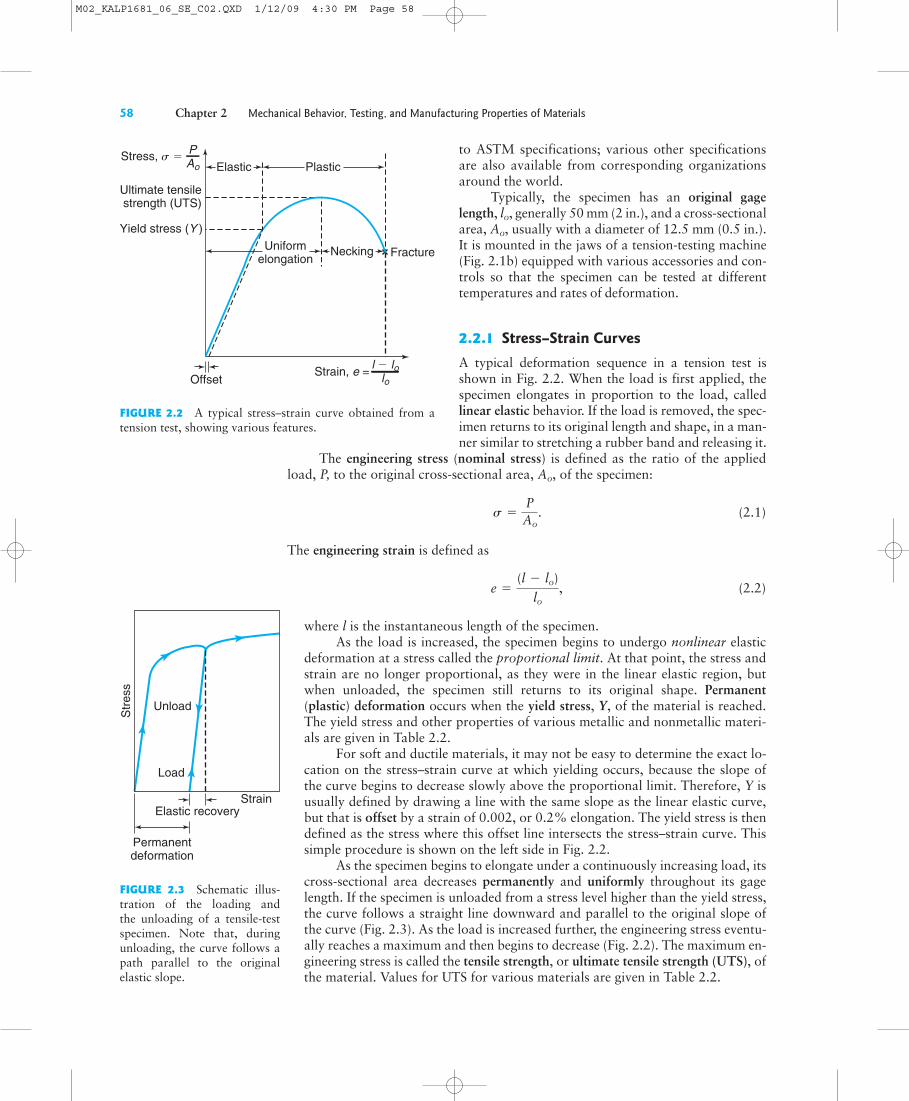
2.2.1 Stress–Strain CurvesA typical deformation sequence in a tension test isshown in Fig. 2.2. When the load is first applied, thespecimen elongates in proportion to the load, calledlinear elastic behavior. If the load is removed, the spec-imen returns to its original length and shape, in a man-ner similar to stretching a rubber band and releasing it.
The engineering stress (nominal stress) is defined as the ratio of the appliedload, P, to the original cross-sectional area, Ao, of the specimen:
(2.1)
The engineering strain is defined as
(2.2)
where l is the instantaneous length of the specimen.As the load is increased, the specimen begins to undergo nonlinear elastic
deformation at a stress called the proportional limit. At that point, the stress andstrain are no longer proportional, as they were in the linear elastic region, butwhen unloaded, the specimen still returns to its original shape. Permanent(plastic) deformation occurs when the yield stress, Y, of the material is reached.The yield stress and other properties of various metallic and nonmetallic materi-als are given in Table 2.2.
For soft and ductile materials, it may not be easy to determine the exact lo-cation on the stress–strain curve at which yielding occurs, because the slope ofthe curve begins to decrease slowly above the proportional limit. Therefore, Y isusually defined by drawing a line with the same slope as the linear elastic curve,but that is offset by a strain of 0.002, or 0.2% elongation. The yield stress is thendefined as the stress where this offset line intersects the stress–strain curve. Thissimple procedure is shown on the left side in Fig. 2.2.
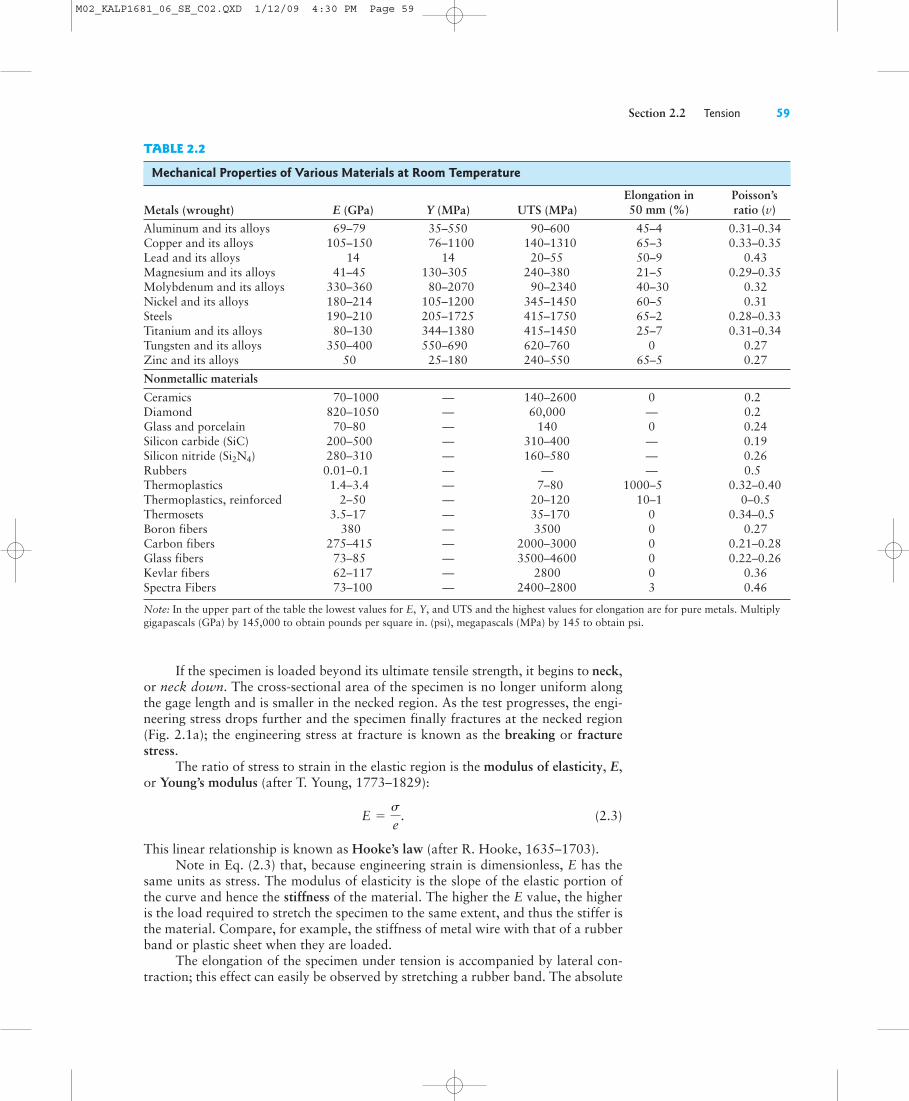
As the specimen begins to elongate under a continuously increasing load, itscross-sectional area decreases permanently and uniformly throughout its gagelength. If the specimen is unloaded from a stress level higher than the yield stress,the curve follows a straight line downward and parallel to the original slope ofthe curve (Fig. 2.3). As the load is increased further, the engineering stress eventu-ally reaches a maximum and then begins to decrease (Fig. 2.2). The maximum en-gineering stress is called the tensile strength, or ultimate tensile strength (UTS), ofthe material. Values for UTS for various materials are given in Table 2.2.
e =(l - lo)
lo,
s = PAo
.
Strain, e = l ! lo lo
PAo
Fracture
Yield stress (Y )
Offset
Ultimate tensilestrength (UTS)
Stress, s "
Uniformelongation
PlasticElastic
Necking
FIGURE 2.2 A typical stress–strain curve obtained from atension test, showing various features.
Elastic recovery
Permanentdeformation
Strain
Unload
Load
Str
ess
FIGURE 2.3 Schematic illus-tration of the loading andthe unloading of a tensile-testspecimen. Note that, duringunloading, the curve follows apath parallel to the originalelastic slope.
M02_KALP1681_06_SE_C02.QXD 1/12/09 4:30 PM Page 58
Section 2.2 Tension 59
TABLE 2.2
Mechanical Properties of Various Materials at Room Temperature
Metals (wrought) E (GPa) Y (MPa) UTS (MPa)
If the specimen is loaded beyond its ultimate tensile strength, it begins to neck,or neck down. The cross-sectional area of the specimen is no longer uniform alongthe gage length and is smaller in the necked region. As the test progresses, the engi-neering stress drops further and the specimen finally fractures at the necked region(Fig. 2.1a); the engineering stress at fracture is known as the breaking or fracturestress.
The ratio of stress to strain in the elastic region is the modulus of elasticity, E,or Young’s modulus (after T. Young, 1773–1829):
(2.3)
This linear relationship is known as Hooke’s law (after R. Hooke, 1635–1703).Note in Eq. (2.3) that, because engineering strain is dimensionless, E has the
same units as stress. The modulus of elasticity is the slope of the elastic portion ofthe curve and hence the stiffness of the material. The higher the E value, the higheris the load required to stretch the specimen to the same extent, and thus the stiffer isthe material. Compare, for example, the stiffness of metal wire with that of a rubberband or plastic sheet when they are loaded.
The elongation of the specimen under tension is accompanied by lateral con-traction; this effect can easily be observed by stretching a rubber band. The absolute
E = se
.
Elongation in 50 mm (%)
Poisson’s ratio ( )v
Aluminum and its alloys 69–79 35–550 90–600 45–4 0.31–0.34Copper and its alloys 105–150 76–1100 140–1310 65–3 0.33–0.35Lead and its alloys 14 14 20–55 50–9 0.43Magnesium and its alloys 41–45 130–305 240–380 21–5 0.29–0.35Molybdenum and its alloys 330–360 80–2070 90–2340 40–30 0.32Nickel and its alloys 180–214 105–1200 345–1450 60–5 0.31Steels 190–210 205–1725 415–1750 65–2 0.28–0.33Titanium and its alloys 80–130 344–1380 415–1450 25–7 0.31–0.34Tungsten and its alloys 350–400 550–690 620–760 0 0.27Zinc and its alloys 50 25–180 240–550 65–5 0.27
Nonmetallic materialsCeramics 70–1000 — 140–2600 0 0.2Diamond 820–1050 — 60,000 — 0.2Glass and porcelain 70–80 — 140 0 0.24Silicon carbide (SiC) 200–500 — 310–400 — 0.19Silicon nitride (Si2N4) 280–310 — 160–580 — 0.26Rubbers 0.01–0.1 — — — 0.5Thermoplastics 1.4–3.4 — 7–80 1000–5 0.32–0.40Thermoplastics, reinforced 2–50 — 20–120 10–1 0–0.5Thermosets 3.5–17 — 35–170 0 0.34–0.5Boron fibers 380 — 3500 0 0.27Carbon fibers 275–415 — 2000–3000 0 0.21–0.28Glass fibers 73–85 — 3500–4600 0 0.22–0.26Kevlar fibers 62–117 — 2800 0 0.36Spectra Fibers 73–100 — 2400–2800 3 0.46
Note: In the upper part of the table the lowest values for E, Y, and UTS and the highest values for elongation are for pure metals. Multiplygigapascals (GPa) by 145,000 to obtain pounds per square in. (psi), megapascals (MPa) by 145 to obtain psi.
M02_KALP1681_06_SE_C02.QXD 1/12/09 4:30 PM Page 59

60 Chapter 2 Mechanical Behavior, Testing, and Manufacturing Properties of Materials
value of the ratio of the lateral strain to the lon-gitudinal strain is known as Poisson’s ratio (afterS. D. Poisson, 1781–1840) and is denoted by thesymbol .
2.2.2 DuctilityAn important behavior observed during a ten-sion test is ductility—the extent of plastic defor-mation that the material undergoes beforefracture. There are two common measures ofductility. The first is the total elongation of thespecimen, given by
(2.4)
where lf and lo are measured as shown inFig. 2.1a. Note that the elongation is based onthe original gage length of the specimen and that
it is calculated as a percentage.The second measure of ductility is the reduction of area, given by
(2.5)
where Ao and Af are, respectively, the original and final (fracture) cross-sectionalareas of the test specimen. Reduction of area and elongation are generally interrelat-ed, as shown in Fig. 2.4 for some typical metals. Thus, the ductility of a piece ofchalk is zero, because it does not stretch at all or reduce in cross section; by contrast,a ductile specimen, such as putty or chewing gum, stretches and necks considerablybefore it fails.
2.2.3 True Stress and True StrainEngineering stress is based on the original cross-sectional area, Ao, of the specimen.However, the instantaneous cross-sectional area of the specimen becomes smaller asit elongates, just as the area of a rubber band does; thus, engineering stress does notrepresent the actual stress to which the specimen is subjected.
True stress is defined as the ratio of the load, P, to the actual (instantaneous,hence true) cross-sectional area, A, of the specimen:
(2.6)
For true strain, first consider the elongation of the specimen as consisting ofincrements of instantaneous change in length. Then, using calculus, it can be shownthat the true strain (natural or logarithmic strain) is calculated as
. (2.7)
Note from Eqs. (2.2) and (2.7) that, for small values of strain, the engineeringand true strains are approximately equal. However, they diverge rapidly as the strainincreases. For example, when e " 0.1, " 0.095, and when e " 1, " 0.69.
Unlike engineering strains, true strains are consistent with actual physical phe-nomena in the deformation of materials. Let’s assume, for example, a hypothetical
P = ln a ll0b
s = PA.
Reduction of area =(Ao - Af)
Ao* 100,
Elongation =(lf - lo)
lo* 100,
n
0 10 20 30 40 50 60 70 80 90
60
50
40
30
20
10
0
Reduction of area (%)
Copper and itsalloys, annealed
Stainless steels,annealed
Aluminumalloys, annealed
Low-carbon steels,cold rolled
Elo
ngat
ion
in 2
in. (
50 m
m)
(%)
FIGURE 2.4 Approximate relationship between elongation andtensile reduction of area for various groups of metals.
M02_KALP1681_06_SE_C02.QXD 1/12/09 4:30 PM Page 60
Section 2.2 Tension 61
situation: A specimen 50 mm (2 in.) in height is compressed between flat platens toa final height of zero; in other words, we have deformed the specimen infinitely.According to their definitions, the engineering strain that the specimen undergoes is(0 ! 50)/50 " !1, but the true strain is . Note that the answer will be the sameregardless of the original height of the specimen. Clearly, then, true strain describesthe extent of deformation correctly, since the deformation is indeed infinite.
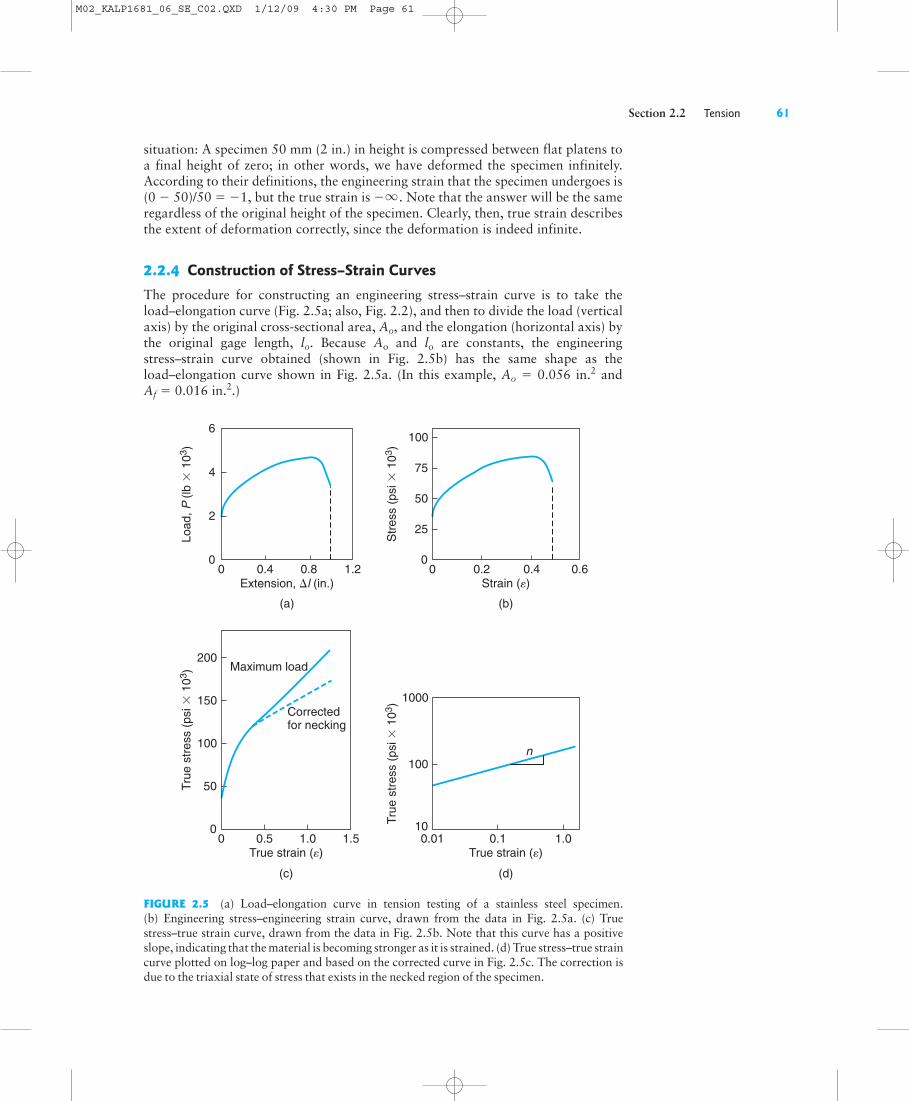
2.2.4 Construction of Stress–Strain CurvesThe procedure for constructing an engineering stress–strain curve is to take theload–elongation curve (Fig. 2.5a; also, Fig. 2.2), and then to divide the load (verticalaxis) by the original cross-sectional area, Ao, and the elongation (horizontal axis) bythe original gage length, lo. Because Ao and lo are constants, the engineeringstress–strain curve obtained (shown in Fig. 2.5b) has the same shape as theload–elongation curve shown in Fig. 2.5a. (In this example, Ao " 0.056 in.2 and Af " 0.016 in.2.)
-q
00
2
4
6
0.4 0.8 1.2
(a)
Load
, P (
lb $
103
)
Extension, #l (in.)0
0
25
0
50
100
150
200
50
75
100
0.2 0.4 0.6
(b)
Str
ess
(psi
$ 1
03)
Strain (e)
0.01 0.10.50 1.0 1.5 1.010
100
1000
(d)(c)
True
str
ess
(psi
$ 1
03)
True
str
ess
(psi
$ 1
03)
True strain (e)
n
Correctedfor necking
Maximum load
True strain (e)
FIGURE 2.5 (a) Load–elongation curve in tension testing of a stainless steel specimen.(b) Engineering stress–engineering strain curve, drawn from the data in Fig. 2.5a. (c) Truestress–true strain curve, drawn from the data in Fig. 2.5b. Note that this curve has a positiveslope, indicating that the material is becoming stronger as it is strained. (d) True stress–true straincurve plotted on log–log paper and based on the corrected curve in Fig. 2.5c. The correction isdue to the triaxial state of stress that exists in the necked region of the specimen.
M02_KALP1681_06_SE_C02.QXD 1/12/09 4:30 PM Page 61

62 Chapter 2 Mechanical Behavior, Testing, and Manufacturing Properties of Materials
True stress–true strain curves are obtained similarly, by dividing the load bythe instantaneous cross-sectional area, with the true strain calculated from Eq. (2.7).The result is shown in Fig. 2.5c. Note the correction to the curve, reflecting the factthat the specimen’s necked region is subjected to three-dimensional tensile stresses,as described in more advanced texts. This state gives higher stress values than theactual true stress; hence, to compensate, the curve must be corrected downward.
The true stress–true strain curve in Fig. 2.5c can be represented by the equation
(2.8)
where K is the strength coefficient and n is the strain-hardening (or work-hardening)exponent. Typical values for K and n for several metals are given in Table 2.3.
When the curve shown in Fig. 2.5c is plotted on a log–log graph, it is found thatthe curve is approximately a straight line (Fig. 2.5d). The slope of the curve is equalto the exponent n. Thus, the higher the slope, the greater is the strain-hardeningcapacity of the material—that is, the stronger and harder it becomes as it is strained.
True stress–true strain curves for a variety of metals are given in Fig. 2.6. Whenthey are reviewed in detail, some differences between Table 2.3 and Fig. 2.6 will benoted; these discrepancies result from the fact that different sources of data anddifferent specimens are involved. Note that the elastic regions have been deleted, be-cause the slope in this region is very high. As a result, the point of intersection ofeach curve with the vertical axis in this figure can be considered to be the yield stress,Y, of the material.
The area under the true stress–true strain curve at a particular strain is theenergy per unit volume (specific energy) of the material deformed and indicates thework required to plastically deform a unit volume of the material to that strain. Thearea under the true stress–true strain curve up to fracture is known as the material’stoughness, that is, the amount of energy per unit volume that the material dissipatesprior to fracture. Note that toughness involves both the height and width of thestress–strain curve of the material, whereas strength is related only to the height ofthe curve and ductility is related only to the width of the curve.
s = KPn,
TABLE 2.3
Typical Values for Kand n for Metals at Room Temperature
K (MPa) nAluminum
1100–O 180 0.202024–T4 690 0.166061–O 205 0.206061–T6 410 0.057075–O 400 0.17
Brass70–30, annealed 900 0.4985–15, cold-rolled 580 0.34
Cobalt-base alloy, heat-treated 2,070 0.50Copper, annealed 315 0.54Steel
Low-C, annealed 530 0.264135, annealed 1,015 0.174135 cold-rolled 1,100 0.144340, annealed 640 0.15304 stainless, annealed 1,275 0.45410 stainless, annealed 960 0.10
M02_KALP1681_06_SE_C02.QXD 1/12/09 4:30 PM Page 62

Section 2.2 Tension 63
Copper, annealed2024–T36 Al
0 0.2 0.4 0.6 0.8 1.0 1.2 1.4 1.6 1.8 2.00
40
60
80
100
120
140
160
1801200
1000
800
600
400
0
True strain (e)
True
str
ess
(psi
# 1
03 )
MP
a
304 Stainless steel
70–30 Brass, as received
70–30 Brass, annealed
1020 Steel
1100–O Al
1100–H14 Al
6061–O Al
2024–O Al
8650 Steel
1112 CR Steel
4130 Steel
20020
FIGURE 2.6 True stress–true strain curves in tension at room temperature for variousmetals. The curves start at a finite level of stress: The elastic regions have too steep a slope tobe shown in this figure; thus, each curve starts at the yield stress, Y, of the material.
2.2.5 Strain at Necking in a Tension TestAs noted earlier, the onset of necking in a tension-test specimen corresponds to theultimate tensile strength of the material. Note that the slope of the load–elongationcurve at this point is zero, and it is there that the specimen begins to neck. The speci-men cannot support the load because the cross-sectional area of the neck is becomingsmaller at a rate that is higher than the rate at which the material becomes stronger(strain-hardens).
The true strain at the onset of necking is numerically equal to the strain-hardening exponent, n, of the material. Thus, the higher the value of n, the higherthe strain that a piece of material can experience before it begins to neck. Thisobservation is important, particularly in regard to sheet-metal-forming operationsthat involve the stretching of the workpiece material (Chapter 16). It can be seen inTable 2.3 that annealed copper, brass, and stainless steel have high n values; thismeans that they can be stretched uniformly to a greater extent than can the othermetals listed.
This example shows that the UTS of a material can becalculated from its K and n values. Assume that amaterial has a true stress–true strain curve given by
Calculate the true ultimate tensile strength and theengineering UTS of this material.
Solution Because the necking strain corresponds tothe maximum load, the necking strain for this mate-rial is
the true ultimate tensile strength is
s = Knn = 100,000(0.5)0.5 = 70,710 psi .
P = n = 0.5,s = 100,000P0.5 psi .
EXAMPLE 2.1 Calculation of Ultimate Tensile Strength
M02_KALP1681_06_SE_C02.QXD 1/12/09 4:30 PM Page 63
64 Chapter 2 Mechanical Behavior, Testing, and Manufacturing Properties of Materials
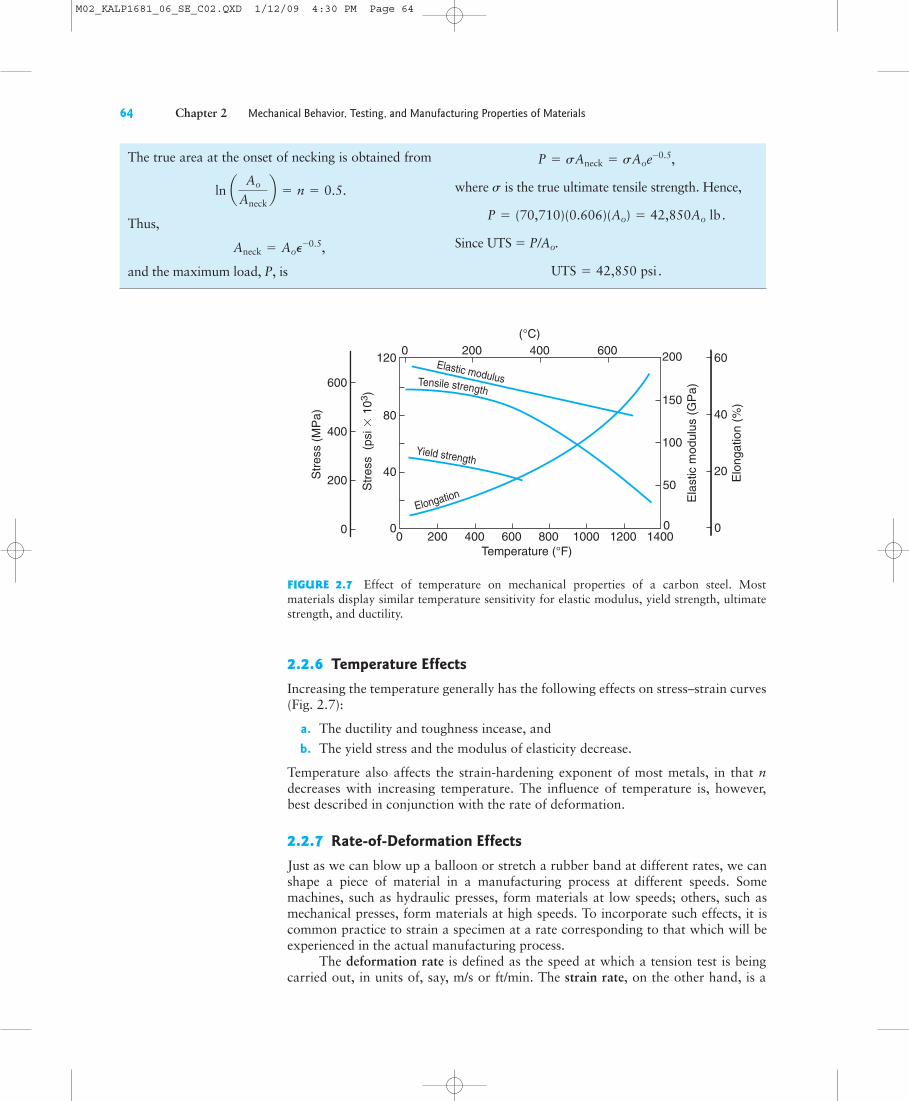
2.2.6 Temperature EffectsIncreasing the temperature generally has the following effects on stress–strain curves(Fig. 2.7):
a. The ductility and toughness incease, andb. The yield stress and the modulus of elasticity decrease.
Temperature also affects the strain-hardening exponent of most metals, in that ndecreases with increasing temperature. The influence of temperature is, however,best described in conjunction with the rate of deformation.
2.2.7 Rate-of-Deformation EffectsJust as we can blow up a balloon or stretch a rubber band at different rates, we canshape a piece of material in a manufacturing process at different speeds. Somemachines, such as hydraulic presses, form materials at low speeds; others, such asmechanical presses, form materials at high speeds. To incorporate such effects, it iscommon practice to strain a specimen at a rate corresponding to that which will beexperienced in the actual manufacturing process.
The deformation rate is defined as the speed at which a tension test is beingcarried out, in units of, say, m/s or ft/min. The strain rate, on the other hand, is a
0 200 400 600(°C)
0 200 400 600 800 1000 1200 1400Temperature (°F)
Str
ess
(ps
i # 1
03)
120
80
40
0
Str
ess
(MP
a)
600
400
200
0
Elongation
Elastic modulus
200
150
100
50
0
Ela
stic
mod
ulus
(G
Pa)
Elo
ngat
ion
(%)
0
20
40
60
Tensile strength
Yield strength
FIGURE 2.7 Effect of temperature on mechanical properties of a carbon steel. Mostmaterials display similar temperature sensitivity for elastic modulus, yield strength, ultimatestrength, and ductility.
The true area at the onset of necking is obtained from
Thus,
and the maximum load, P, is
where is the true ultimate tensile strength. Hence,
Since UTS " P/Ao.
UTS = 42,850 psi .
P = (70,710)(0.606)(Ao) = 42,850Ao lb.
s
P = sAneck = sAoe-0.5,
Aneck = AoP-0.5,
ln a Ao
Aneckb = n = 0.5.
M02_KALP1681_06_SE_C02.QXD 1/12/09 4:30 PM Page 64
Section 2.2 Tension 65
function of the specimen’s length. A short specimen elongates proportionately moreduring the same period than does a long specimen. For example, let’s take two rub-ber bands, one 20 mm and the other 100 mm long, respectively, and elongate themboth by 10 mm within a period of 1 second. The engineering strain in the shorterspecimen is that in the longer is Thus, the strain rates are 0.5 s-1
and 0.1 s-1, respectively, with the short band being subjected to a strain rate five timeshigher than that for the long band, although they are both being stretched at the samedeformation rate.
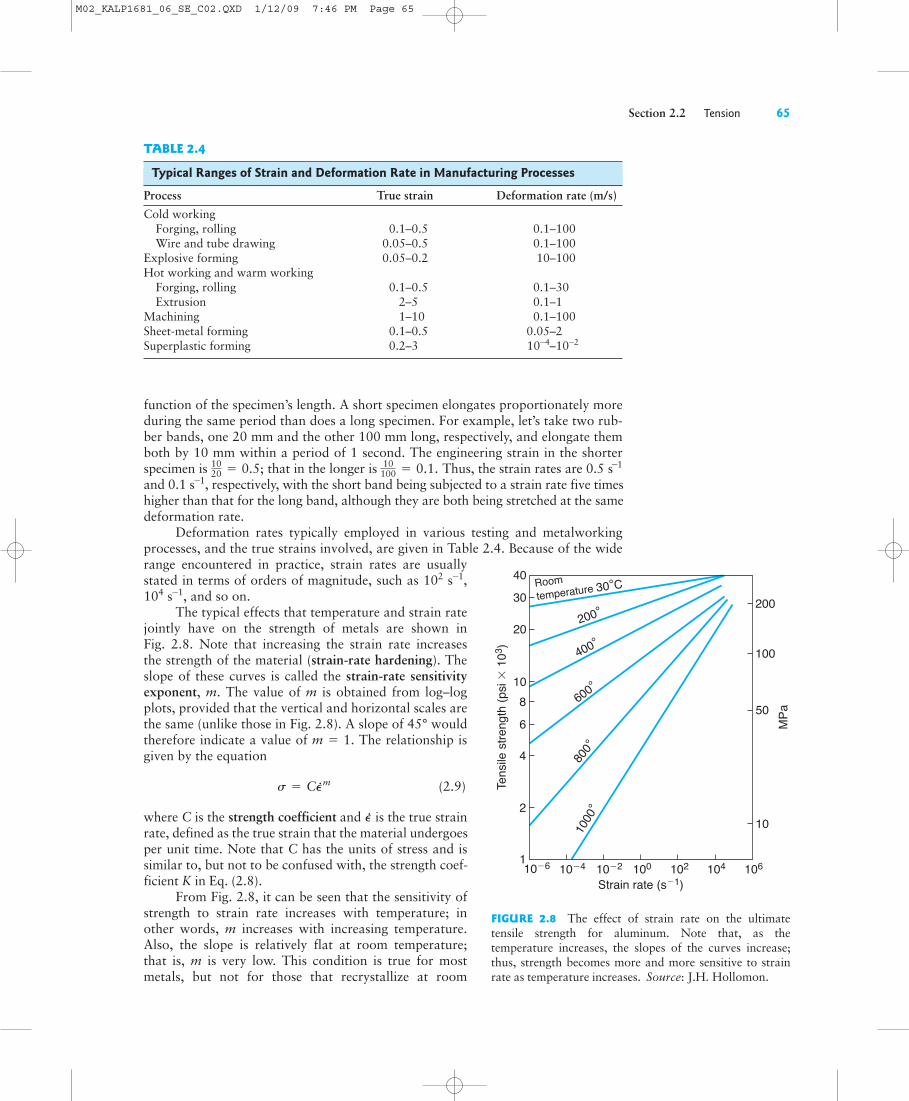
Deformation rates typically employed in various testing and metalworkingprocesses, and the true strains involved, are given in Table 2.4. Because of the widerange encountered in practice, strain rates are usuallystated in terms of orders of magnitude, such as 102 s-1,104 s-1, and so on.
The typical effects that temperature and strain ratejointly have on the strength of metals are shown inFig. 2.8. Note that increasing the strain rate increasesthe strength of the material (strain-rate hardening). Theslope of these curves is called the strain-rate sensitivityexponent, m. The value of m is obtained from log–logplots, provided that the vertical and horizontal scales arethe same (unlike those in Fig. 2.8). A slope of 45° wouldtherefore indicate a value of m ! 1. The relationship isgiven by the equation
(2.9)
where C is the strength coefficient and is the true strainrate, defined as the true strain that the material undergoesper unit time. Note that C has the units of stress and issimilar to, but not to be confused with, the strength coef-ficient K in Eq. (2.8).
From Fig. 2.8, it can be seen that the sensitivity ofstrength to strain rate increases with temperature; inother words, m increases with increasing temperature.Also, the slope is relatively flat at room temperature;that is, m is very low. This condition is true for mostmetals, but not for those that recrystallize at room
P.
s = CP.m
10100 = 0.1.10
20 = 0.5;
TABLE 2.4
Typical Ranges of Strain and Deformation Rate in Manufacturing Processes
Process True strain Deformation rate (m/s)Cold working
Forging, rolling 0.1–0.5 0.1–100Wire and tube drawing 0.05–0.5 0.1–100
Explosive forming 0.05–0.2 10–100Hot working and warm working
Forging, rolling 0.1–0.5 0.1–30Extrusion 2–5 0.1–1
Machining 1–10 0.1–100Sheet-metal forming 0.1–0.5 0.05–2Superplastic forming 0.2–3 10-4–10-2
200
100
50
10
1
2
4
6
810
20
30
40
10!6 10!4 10!2 100 102 104 106
Strain rate (s!1)
Tens
ile s
treng
th (p
si "
103
)
800°
600°
400°
200°
Roomtemperature 30°C
MPa
1000
°
FIGURE 2.8 The effect of strain rate on the ultimatetensile strength for aluminum. Note that, as thetemperature increases, the slopes of the curves increase;thus, strength becomes more and more sensitive to strainrate as temperature increases. Source: J.H. Hollomon.
M02_KALP1681_06_SE_C02.QXD 1/12/09 7:46 PM Page 65
66 Chapter 2 Mechanical Behavior, Testing, and Manufacturing Properties of Materials
temperature, such as lead and tin. Typical ranges of m for metals are up to 0.05 forcold-working, 0.05 to 0.4 for hot-working, and 0.3 to 0.85 for superplastic materi-als (see below).
The magnitude of the strain-rate sensitivity exponent significantly influencesnecking in a tension test. With increasing m, the material stretches farther before itfails; thus, increasing m delays necking. Ductility enhancement caused by the highstrain-rate sensitivity of some materials has been exploited in superplastic formingof sheet metal (Section 16.12).
Superplasticity. The term superplasticity refers to the capability of some materialsto undergo large uniform elongation prior to necking and fracture in tension. Theelongation ranges from a few hundred percent to as much as 2000%. Common non-metallic materials exhibiting superplastic behavior are bubble gum and glass (at ele-vated temperatures) and thermoplastics. As a result, glass and thermoplastics cansuccessfully be formed into complex shapes such as beverage bottles and lighted adver-tising signs. Among metals exhibiting superplastic behavior are very fine grained(10 to 15 µm) titanium alloys and alloys of zinc–aluminum; when heated, they canelongate to many times their original length.
2.2.8 Hydrostatic Pressure EffectsVarious tests have been performed to determine the effect of hydrostatic pressure onmechanical properties of materials. Test results at pressures up to 3.5 GPa (500 ksi)indicate that increasing the hydrostatic pressure substantially increases the strain atfracture, both for ductile and for brittle materials. This beneficial effect of hydrostaticpressure has been exploited in metalworking processes, particularly in hydrostaticextrusion (Section 15.7), and in compaction of metal powders (Section 17.3).
2.2.9 Radiation EffectsIn view of the use of many metals and alloys in nuclear applications, extensive stud-ies have been conducted on the effects of radiation on mechanical properties.Typical changes in the properties of steels and other metals exposed to high-energyradiation are increased yield stress, tensile strength, and hardness, and decreasedductility and toughness. Radiation has similar detrimental effects on the behavior ofplastics.
2.3 Compression
Many operations in manufacturing, particularly processes such as forging, rolling,and extrusion (Part III), are performed with the workpiece subjected to compressivestresses. The compression test, in which the specimen is subjected to a compressiveload, gives information that is useful for estimating forces and power requirementsin these processes. This test is usually carried out by compressing a solid cylindricalspecimen between two well-lubricated flat dies (platens). Because of friction betweenthe specimen and the platens, the specimen’s cylindrical surface bulges, an effect iscalled barreling (see Fig. 14.3). Note that slender specimens can buckle during thistest; thus, the height-to-diameter ratio of the solid cylindrical specimen is typicallyless than 3:1. (See also Section 14.4.1 on heading.)
Because of barreling, the cross-sectional area of the specimen changes along itsheight, and obtaining the stress–strain curves in compression can be difficult.
M02_KALP1681_06_SE_C02.QXD 1/12/09 4:30 PM Page 66
Section 2.4 Torsion 67
Furthermore, friction dissipates energy, so the compressive force is higher than itotherwise would be in order to supply the work required to overcome friction. Witheffective lubrication, friction can be minimized, and a reasonably constant cross-sectional area can be maintained during the test.
When the results of compression and tension tests on ductile metals are com-pared, it can be seen that the true stress–true strain curves coincide. This behaviordoes not hold true for brittle materials, which are generally stronger and more duc-tile in compression than in tension. (See Table 8.1.)
When a metal is subjected to tension into the plastic range, and then the load isreleased and a compressive load is applied, the yield stress in compression is found tobe lower than that in tension. This phenomenon is known as the Bauschinger effect(after J. Bauschinger, who reported it in 1881), and it is exhibited in varying degreesby all metals and alloys. Because of the lowered yield stress in the direction oppositethat of the original load application, the phenomenon is also called strain softeningor work softening.
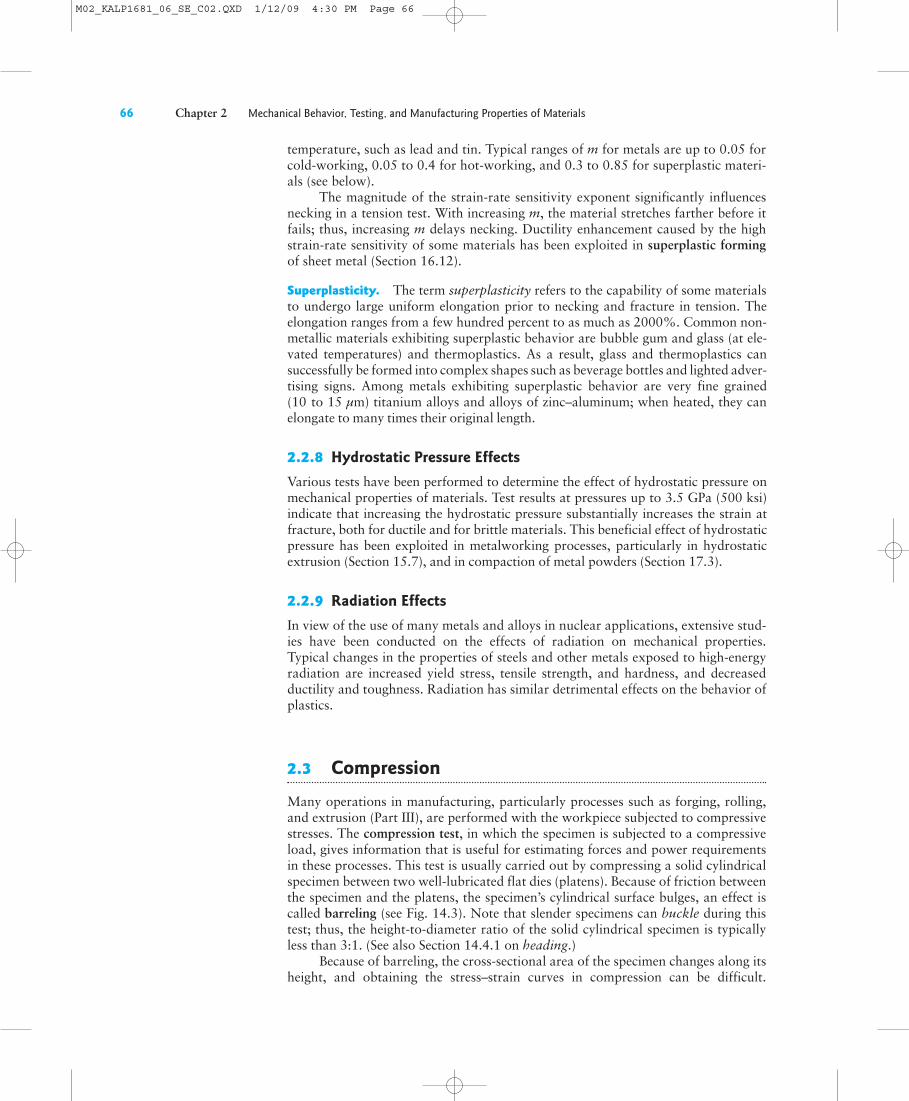
Disk Test. For brittle materials such as ceramics and glasses (Chapter 8), a disk testhas been developed, in which the disk is subjected to compression between two hard-ened flat platens (Fig. 2.9). When the material is loaded as shown, tensile stressesdevelop perpendicular to the vertical centerline along the disk; fracture begins andthe disk splits in half vertically. The tensile stress, , in the disk is uniform along thecenterline and can be calculated from the formula
(2.10)
where P is the load at fracture, d is the diameter of the disk, and t is its thickness. Inorder to avoid premature failure at the contact points, thin strips of soft metal areplaced between the disk and the platens. These strips also protect the platens frombeing damaged during the test. The fracture at the center of the specimen has beenutilized in the manufacture of seamless tubing (Section 13.6).
2.4 Torsion
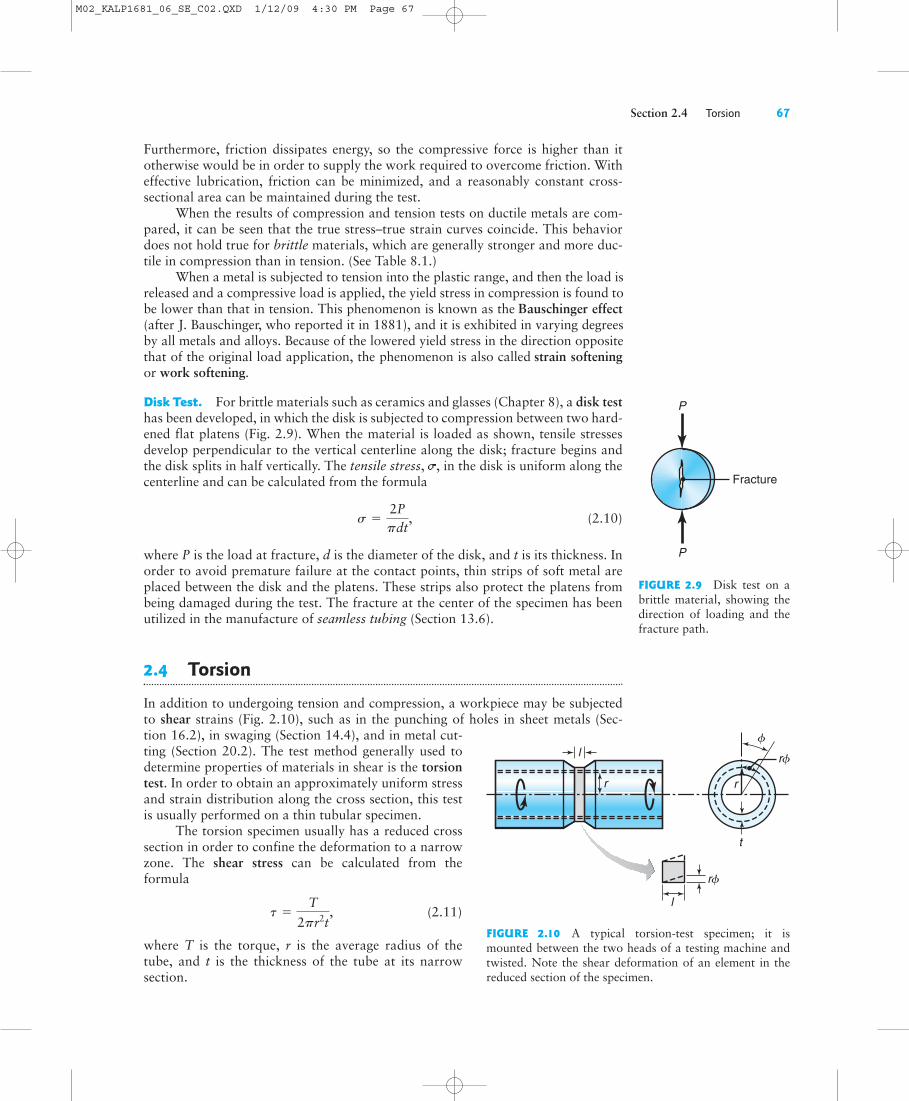
In addition to undergoing tension and compression, a workpiece may be subjectedto shear strains (Fig. 2.10), such as in the punching of holes in sheet metals (Sec-tion 16.2), in swaging (Section 14.4), and in metal cut-ting (Section 20.2). The test method generally used todetermine properties of materials in shear is the torsiontest. In order to obtain an approximately uniform stressand strain distribution along the cross section, this testis usually performed on a thin tubular specimen.
The torsion specimen usually has a reduced crosssection in order to confine the deformation to a narrowzone. The shear stress can be calculated from theformula
(2.11)
where T is the torque, r is the average radius of thetube, and t is the thickness of the tube at its narrowsection.
t = T2pr2t
,
s = 2Ppdt
,
Fracture
P
P
FIGURE 2.9 Disk test on abrittle material, showing thedirection of loading and thefracture path.
l
l
rf
rf
r r
t
f
FIGURE 2.10 A typical torsion-test specimen; it ismounted between the two heads of a testing machine andtwisted. Note the shear deformation of an element in thereduced section of the specimen.
M02_KALP1681_06_SE_C02.QXD 1/12/09 4:30 PM Page 67
68 Chapter 2 Mechanical Behavior, Testing, and Manufacturing Properties of Materials
The shear strain can be calculated from the formula
(2.12)
where l is the length of tube subjected to torsion and the angle of twist in radians.The ratio of the shear stress to the shear strain in the elastic range is known as the
shear modulus, or modulus of rigidity, G, a quantity related to the modulus of elastic-ity, E. The angle of twist, , to fracture in the torsion of solid round bars at elevatedtemperatures is also useful in estimating the forgeability of metals. The greater thenumber of twists prior to failure, the better is the forgeability (Section 14.8).
2.5 Bending (Flexure)
Preparing specimens from brittle materials, such as ceramics and carbides, is difficultbecause of the problems involved in shaping and machining them to proper dimen-sions. Furthermore, such specimens are sensitive to surface defects and notches, andclamping brittle test specimens for testing is difficult. Also, improper alignment of thetest specimen may result in a nonuniform stress distribution along the cross section.
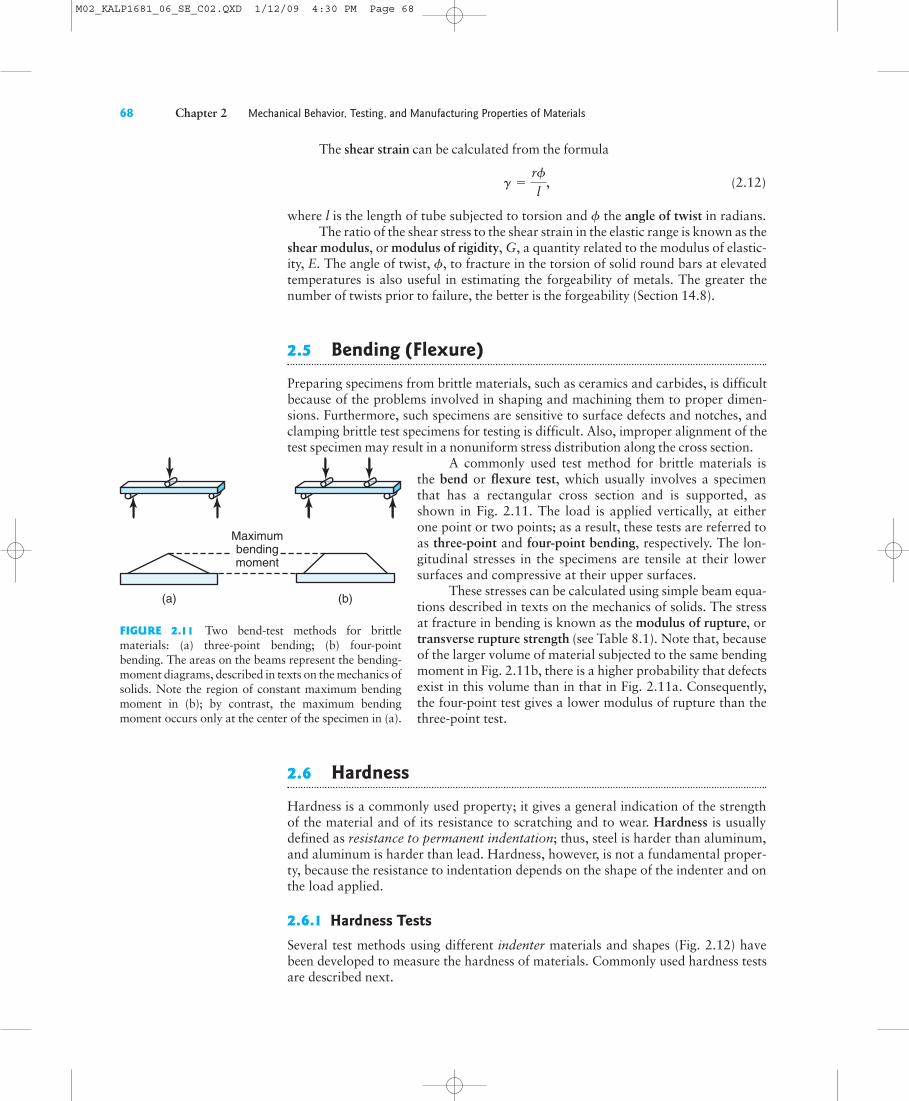
A commonly used test method for brittle materials isthe bend or flexure test, which usually involves a specimenthat has a rectangular cross section and is supported, asshown in Fig. 2.11. The load is applied vertically, at eitherone point or two points; as a result, these tests are referred toas three-point and four-point bending, respectively. The lon-gitudinal stresses in the specimens are tensile at their lowersurfaces and compressive at their upper surfaces.
These stresses can be calculated using simple beam equa-tions described in texts on the mechanics of solids. The stressat fracture in bending is known as the modulus of rupture, ortransverse rupture strength (see Table 8.1). Note that, becauseof the larger volume of material subjected to the same bendingmoment in Fig. 2.11b, there is a higher probability that defectsexist in this volume than in that in Fig. 2.11a. Consequently,the four-point test gives a lower modulus of rupture than thethree-point test.
2.6 Hardness
Hardness is a commonly used property; it gives a general indication of the strengthof the material and of its resistance to scratching and to wear. Hardness is usuallydefined as resistance to permanent indentation; thus, steel is harder than aluminum,and aluminum is harder than lead. Hardness, however, is not a fundamental proper-ty, because the resistance to indentation depends on the shape of the indenter and onthe load applied.
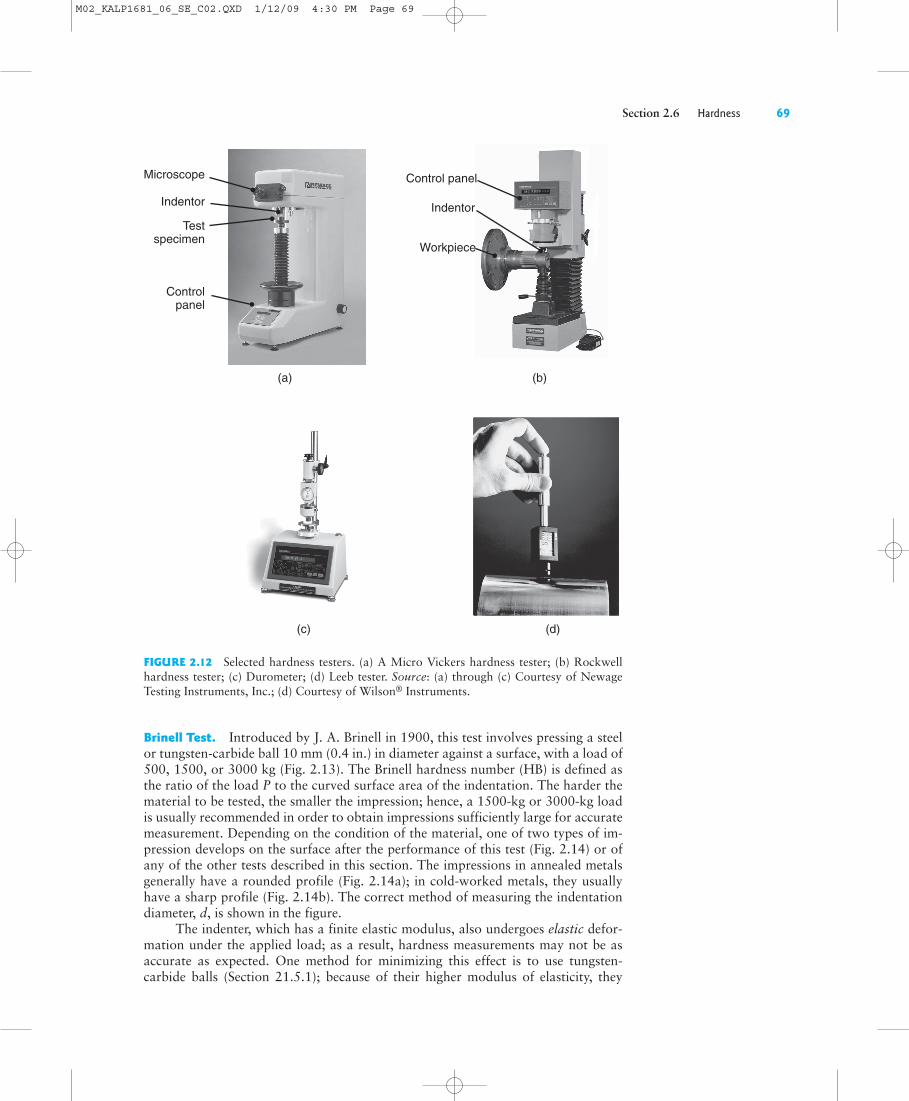
2.6.1 Hardness TestsSeveral test methods using different indenter materials and shapes (Fig. 2.12) havebeen developed to measure the hardness of materials. Commonly used hardness testsare described next.
f
f
g =rfl
,
FIGURE 2.11 Two bend-test methods for brittlematerials: (a) three-point bending; (b) four-pointbending. The areas on the beams represent the bending-moment diagrams, described in texts on the mechanics ofsolids. Note the region of constant maximum bendingmoment in (b); by contrast, the maximum bendingmoment occurs only at the center of the specimen in (a).
(a) (b)
Maximumbendingmoment
M02_KALP1681_06_SE_C02.QXD 1/12/09 4:30 PM Page 68
Section 2.6 Hardness 69
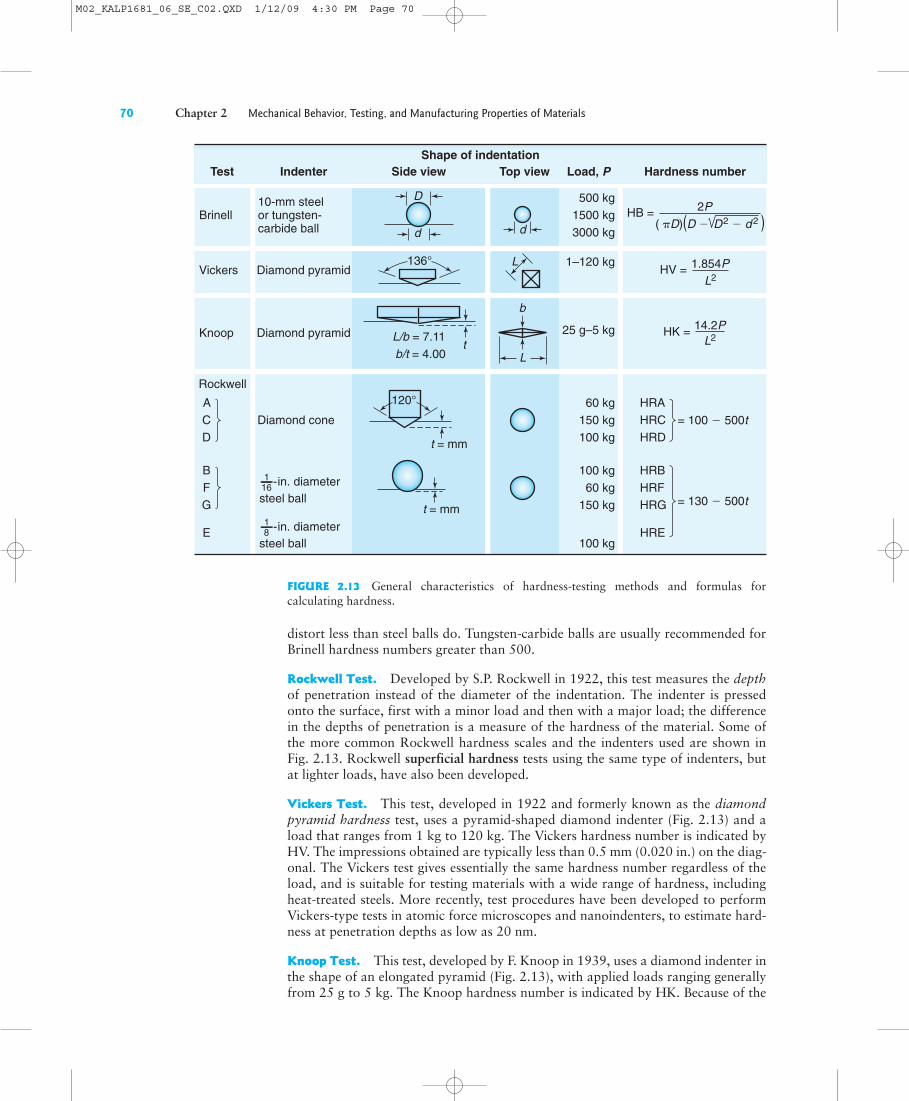
Brinell Test. Introduced by J. A. Brinell in 1900, this test involves pressing a steelor tungsten-carbide ball 10 mm (0.4 in.) in diameter against a surface, with a load of500, 1500, or 3000 kg (Fig. 2.13). The Brinell hardness number (HB) is defined asthe ratio of the load P to the curved surface area of the indentation. The harder thematerial to be tested, the smaller the impression; hence, a 1500-kg or 3000-kg loadis usually recommended in order to obtain impressions sufficiently large for accuratemeasurement. Depending on the condition of the material, one of two types of im-pression develops on the surface after the performance of this test (Fig. 2.14) or ofany of the other tests described in this section. The impressions in annealed metalsgenerally have a rounded profile (Fig. 2.14a); in cold-worked metals, they usuallyhave a sharp profile (Fig. 2.14b). The correct method of measuring the indentationdiameter, d, is shown in the figure.
The indenter, which has a finite elastic modulus, also undergoes elastic defor-mation under the applied load; as a result, hardness measurements may not be asaccurate as expected. One method for minimizing this effect is to use tungsten-carbide balls (Section 21.5.1); because of their higher modulus of elasticity, they
(a)
Indentor
Microscope
Controlpanel
Testspecimen
Workpiece
Indentor
Control panel
(b)
(c) (d)
FIGURE 2.12 Selected hardness testers. (a) A Micro Vickers hardness tester; (b) Rockwellhardness tester; (c) Durometer; (d) Leeb tester. Source: (a) through (c) Courtesy of NewageTesting Instruments, Inc.; (d) Courtesy of Wilson® Instruments.
M02_KALP1681_06_SE_C02.QXD 1/12/09 4:30 PM Page 69
70 Chapter 2 Mechanical Behavior, Testing, and Manufacturing Properties of Materials
distort less than steel balls do. Tungsten-carbide balls are usually recommended forBrinell hardness numbers greater than 500.
Rockwell Test. Developed by S.P. Rockwell in 1922, this test measures the depthof penetration instead of the diameter of the indentation. The indenter is pressedonto the surface, first with a minor load and then with a major load; the differencein the depths of penetration is a measure of the hardness of the material. Some ofthe more common Rockwell hardness scales and the indenters used are shown inFig. 2.13. Rockwell superficial hardness tests using the same type of indenters, butat lighter loads, have also been developed.
Vickers Test. This test, developed in 1922 and formerly known as the diamondpyramid hardness test, uses a pyramid-shaped diamond indenter (Fig. 2.13) and aload that ranges from 1 kg to 120 kg. The Vickers hardness number is indicated byHV. The impressions obtained are typically less than 0.5 mm (0.020 in.) on the diag-onal. The Vickers test gives essentially the same hardness number regardless of theload, and is suitable for testing materials with a wide range of hardness, includingheat-treated steels. More recently, test procedures have been developed to performVickers-type tests in atomic force microscopes and nanoindenters, to estimate hard-ness at penetration depths as low as 20 nm.
Knoop Test. This test, developed by F. Knoop in 1939, uses a diamond indenter inthe shape of an elongated pyramid (Fig. 2.13), with applied loads ranging generallyfrom 25 g to 5 kg. The Knoop hardness number is indicated by HK. Because of the
Load, P Hardness numberShape of indentation
Side view Top viewTest Indenter
60 kg150 kg100 kg
100 kg60 kg
150 kg
100 kg
500 kg1500 kg3000 kg
25 g–5 kg
1–120 kgL136°
HK = 14.2PL2
HV = 1.854PL2
HB = ( %D)(D ! D2 ! d2 )
2P
t = mm
t = mm
120°
L
b
t L/b = 7.11 b/t = 4.00
dd
D
= 100 ! 500tHRAHRCHRD
E
Rockwell
Knoop
Brinell
Vickers
ACD
BFG
HRE
= 130 ! 500t
HRBHRFHRG
Diamond cone
10-mm steelor tungsten-carbide ball
Diamond pyramid
Diamond pyramid
-in. diameter161
steel ball
-in. diameter81
steel ball
FIGURE 2.13 General characteristics of hardness-testing methods and formulas forcalculating hardness.
M02_KALP1681_06_SE_C02.QXD 1/12/09 4:30 PM Page 70

Section 2.6 Hardness 71
light loads that are applied, the Knoop test is amicrohardness test; therefore, it is suitable for verysmall or very thin specimens, and for brittle mate-rials such as carbides, ceramics, and glass.
This test is also used for measuring the hard-ness of the individual grains and components in ametal alloy. The size of the indentation is general-ly in the range from 0.01 to 0.10 mm (0.0004 to0.004 in.); consequently, surface preparation isvery important. Because the hardness number ob-tained depends on the applied load, Knoop testresults should always cite the load used.
Scleroscope and Leeb Test. The scleroscope(from the Greek skleros, meaning “hard”) is an in-strument in which a diamond-tipped indenter(hammer) enclosed in a glass tube is dropped ontothe specimen from a certain height. The hardness isrelated to the rebound of the indenter: the higherthe rebound, the harder the material. The impres-sion made by a scleroscope is very small. Becauseobtaining reliable results with a scleroscope is diffi-cult, a modern electronic version, called a Leeb, orEquotip, test, has been developed (see Fig. 2.12d).In this test, a carbide hammer impacts the surface,and incident and rebound velocities are electroni-cally measured. A Leeb number is then calculatedand usually converted to Rockwell or Vickershardness.
Mohs Hardness. Developed in 1822 by F. Mohs, this test is based on the capabilityof one material to scratch another. The Mohs hardness is based on a scale from 1 to10, with 1 being the measure for talc and 10 that for diamond (the hardest substanceknown). A material with a higher Mohs hardness number always scratches one witha lower number. Soft metals have a Mohs hardness of 2 to 3, hardened steels about 6,and aluminum oxide (used for cutting tools and as an abrasive in grinding wheels)of 9. Although the Mohs scale is qualitative and is used mainly by mineralogists, itcorrelates well with Knoop hardness.
Shore Test and Durometer. The hardness of materials such as rubbers, plastics,and similar soft and elastic nonmetallic materials is generally measured by a Shoretest with an instrument called a durometer (from the Latin durus, meaning “hard”).An indenter is pressed against the surface and then a constant load is rapidlyapplied. The depth of penetration is measured after 1 second; the hardness is in-versely related to the penetration. There are two different scales for this test. Type Ahas a blunt indenter and a load of 1 kg; it is used for softer materials. Type D has asharper indenter and a load of 5 kg, and is used for harder materials. The hardnessnumbers in these tests range from 0 to 100.
Hot Hardness. The hardness of materials at elevated temperatures (see Fig. 21.1) isimportant in applications such as cutting tools in machining and dies in hot-workingand casting operations. Hardness tests can be performed at elevated temperatureswith conventional testers, with some modifications such as enclosing the specimenand indenter in a small electric furnace.
(c)
(a) (b)
d
d
FIGURE 2.14 Indentation geometry in Brinell hardness testing:(a) annealed metal; (b) work-hardened metal; (c) deformation ofmild steel under a spherical indenter. Note that the depth ofthe permanently deformed zone is about one order of magnitudelarger than the depth of indentation. For a hardness test to bevalid, this zone should be fully developed in the material.Source: Courtesy of M.C. Shaw and C.T. Yang.
M02_KALP1681_06_SE_C02.QXD 1/12/09 7:46 PM Page 71
72 Chapter 2 Mechanical Behavior, Testing, and Manufacturing Properties of Materials
2.6.2 Hardness and StrengthBecause hardness is the resistance to permanent indentation, it can be likened toperforming a compression test on a small volume on the surface of a material(Fig. 2.14c). Studies have shown that (in the same units) the hardness of a cold-worked metal is about three times its yield stress, Y; for annealed metals, the hard-ness is about five times Y.
A relationship has been established between the ultimate tensile strength (UTS)and the Brinell hardness (HB) for steels measured for a load of 3000 kg. In SI units,the relationship is
(2.13)where UTS is in MPa. In traditional units,
(2.14)where UTS is in psi.
2.6.3 Hardness-testing ProceduresFor a hardness test to be meaningful and reliable, the zone of deformation under theindenter (see Fig. 2.14c) must be allowed to develop freely. Consequently, thelocation of the indenter (with respect to the edges of the specimen to be tested) andthe thickness of the specimen are important considerations. Generally, the locationshould be at least two diameters of the indenter from the edge of the specimen, andthe thickness of the specimen should be at least 10 times the depth of penetration ofthe indenter. Successive indentations on the same surface of the workpiece should befar enough apart so as not to interfere with each other.
Moreover, the indentation should be sufficiently large to give a representativehardness value for the bulk material. If hardness variations need to be detected in asmall area, or if the hardness of individual constituents in a matrix or an alloy is tobe determined, the indentations should be very small, such as those obtained inKnoop or Vickers tests using light loads. While surface preparation is not critical forthe Brinell test, it is important for the Rockwell test and even more important for theother hardness tests, because of the small sizes of the indentations. Surfaces mayhave to be polished to allow correct measurement of the impression’s dimensions.
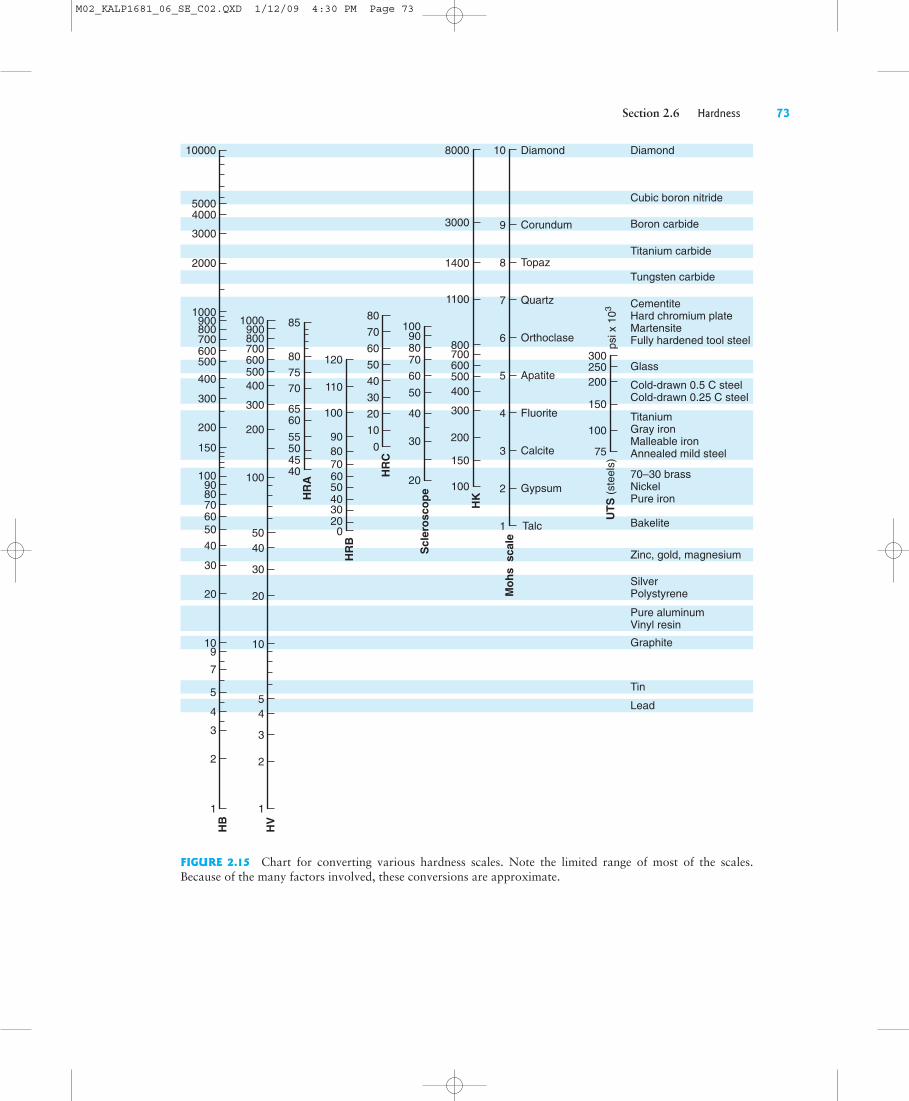
The values obtained from different hardness tests, on different scales, can beinterrelated, and can be converted using Fig. 2.15. Care should be exercised in usingthese charts because of the many variables in material characteristics and in theshape of the indentation.
UTS = 500(HB),
UTS = 3.5(HB),
A piece of steel is highly deformed at room tempera-ture. Its hardness is found to be 300 HB. Estimate thearea under the stress–strain curve up to the yield point(that is, the resilience) for this material if the yieldstrength is one-third the Brinell hardness.
Solution Since the steel has been subjected to largestrains at room temperature, it may be assumed that itsstress–strain curve has flattened considerably, thus ap-proaching the shape of a perfectly plastic curve. Sincethe yield strength is one-third the Brinell hardness,
The area under the stress–strain curve is
From Table 2.2, E ! 210 GPa ! 30 " 106 psi for steel.Hence,
1142,25022
2130 * 1062 = 337 in.-lb/in3.
Modulus of Resilience =
Modulus of Resilience = Y2
2E.
Y = 3003
= 100 kg/mm2 = 142,250 psi.
EXAMPLE 2.2 Calculation of Modulus of Resilience from Hardness
M02_KALP1681_06_SE_C02.QXD 1/12/09 7:46 PM Page 72
Section 2.6 Hardness 73
DiamondDiamond
Corundum
Topaz
Quartz
Orthoclase
Apatite
Fluorite
Calcite
Gypsum
Talc
Cubic boron nitride
Boron carbide
Titanium carbide
Tungsten carbide
Glass
Bakelite
Graphite
Tin
Lead
Zinc, gold, magnesium
SilverPolystyrene
Pure aluminumVinyl resin
Cold-drawn 0.5 C steelCold-drawn 0.25 C steel
TitaniumGray ironMalleable ironAnnealed mild steel
70–30 brassNickelPure iron
CementiteHard chromium plateMartensiteFully hardened tool steel
Moh
s s
cale
psi x
103
Scl
eros
cope
HB
HV
HR
A
HR
C
109
7
5
4
3
2 2
3
45
10
20
30
4050
100 40
HR
B
02030405060 20
30
40
5060708090
100
708090
100
110
120
4550556065
707580
85
200
300
400500600700800900
1000
30
405060708090
100
150
200
300
400
500600700800900
1000
2000
3000
40005000
10000
20
1 1
01020304050607080
1
2
3
4
5
6
7
8
9
10
300250200
150
100
75
HK
100
150
200
300
400500600700800
1100
1400
3000
8000
UTS
(st
eels
)
FIGURE 2.15 Chart for converting various hardness scales. Note the limited range of most of the scales.Because of the many factors involved, these conversions are approximate.
M02_KALP1681_06_SE_C02.QXD 1/12/09 4:30 PM Page 73

74 Chapter 2 Mechanical Behavior, Testing, and Manufacturing Properties of Materials
2.7 Fatigue
Various components in manufacturing equipment, such as tools, dies, gears, cams,shafts, and springs, are subjected to rapidly fluctuating (cyclic or periodic) loads, inaddition to static loads. Cyclic stresses may be caused by fluctuating mechanicalloads, such as (a) on gear teeth or reciprocating sliders, (b) by rotating machineelements under constant bending stresses, as is commonly encountered by shafts, or(c) by thermal stresses, as when a die comes into repeated contact with hot work-pieces and cools between successive contacts. Under these conditions, the part failsat a stress level below that at which failure would occur under static loading. Uponinspection, failure is found to be associated with cracks that grow with every stresscycle and that propagate through the material until a critical crack length is reached,when the material fractures. Known as fatigue failure, this phenomenon is responsi-ble for the majority of failures in mechanical components.
Fatigue test methods involve testing specimens under various states of stress,usually in a combination of tension and bending. The test is carried out at variousstress amplitudes (S); the number of cycles (N) it takes to cause total failure of thespecimen or part is recorded. Stress amplitude is defined as the maximum stress, intension and compression, to which the specimen is subjected. Typical plots, calledS–N curves, are shown in Fig. 2.16. These curves are based on complete reversal ofthe stress—that is, maximum tension, then maximum compression, then maximumtension, and so on—such as that imposed by bending a rectangular eraser or a pieceof wire alternately in one direction and then the other. The test can also be per-formed on a rotating shaft in four-point bending. (See Fig. 2.11b.) With some mate-rials, the S–N curve becomes horizontal at low stresses, indicating that the materialwill not fail at stresses below this limit. The maximum stress to which the materialcan be subjected without fatigue failure, regardless of the number of cycles, isknown as the endurance limit or fatigue limit.
Although many materials, especially steels, have a definite endurance limit, oth-ers, such as aluminum alloys, do not have one, and the S–N curve continues its down-ward trend. For metals exhibiting such behavior, the fatigue strength is specified at acertain number of cycles, such as 107. In this way, the useful service life of the compo-nent can be specified. The endurance limit for metals can be approximately related totheir ultimate tensile strength (Fig. 2.17). For carbon steels, the endurance limit isusually 0.4–0.5 times the tensile strength, although particular values can vary.
0
500
400
300
200
100
0
80
60
40
20
1045 Steel Endurance limit
Number of cycles, N
(a) (b)
psi
# 103
Number of cycles, N
Str
ess
ampl
itude
, S (
MP
a)
0 0
2
4
6
psi #
103
8
10
20
30
40
50
60
Diallyl-phthalate
Nylon (dry)
Polycarbonate
PolysulfonePTFE
103 104 105 107106 108 109 1010 103 104 105 106 107
2014-T6 Aluminum alloy
Phenolic
Epoxy
Str
ess
ampl
itude
, S (
MP
a)
FIGURE 2.16 (a) Typical S–N curves for two metals. Note that, unlike steel, aluminum doesnot have an endurance limit. (b) S–N curves for common polymers.
M02_KALP1681_06_SE_C02.QXD 1/12/09 4:30 PM Page 74
Section 2.9 Impact 75
2.8 Creep
Creep is the permanent elongation of a component under a staticload maintained for a period of time. This phenomenon occurs inmetals and certain nonmetallic materials, such as thermoplasticsand rubbers, and it can occur at any temperature; lead, for exam-ple, creeps under a constant tensile load at room temperature.However, for metals and their alloys, creep of any significanceoccurs at elevated temperatures, beginning at about 200°C(400°F) for aluminum alloys and at about 1500°C (2800°F) forrefractory alloys. The mechanism of creep at elevated tempera-ture in metals is generally attributed to grain-boundary sliding(Section 1.4).
Creep is especially important in high-temperature applica-tions, such as gas-turbine blades and similar components in jetengines and rocket motors; high-pressure steam lines, nuclear-fuel elements, and furnace components are also subject to creep.Creep can also occur in tools and dies that are subjected to highstresses at elevated temperatures during hot-working operationssuch as forging and extrusion.
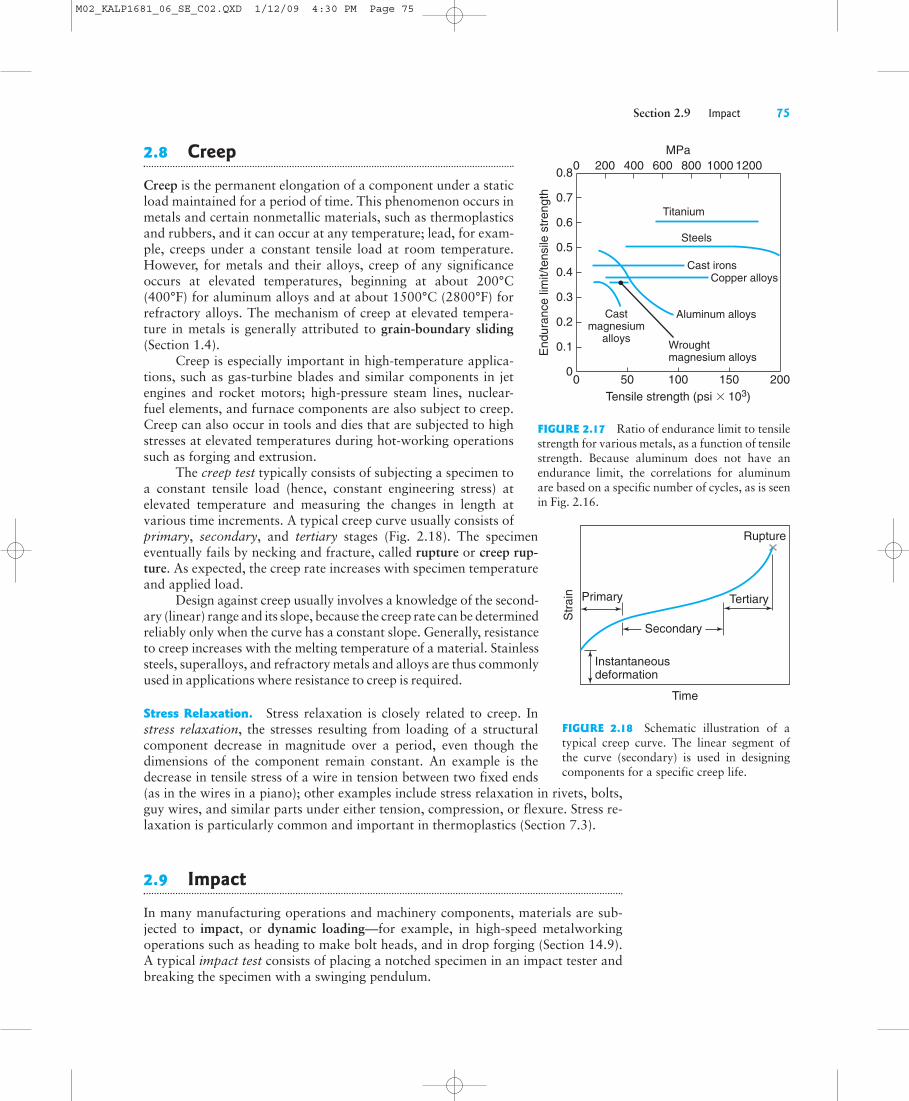
The creep test typically consists of subjecting a specimen toa constant tensile load (hence, constant engineering stress) atelevated temperature and measuring the changes in length atvarious time increments. A typical creep curve usually consists ofprimary, secondary, and tertiary stages (Fig. 2.18). The specimeneventually fails by necking and fracture, called rupture or creep rup-ture. As expected, the creep rate increases with specimen temperatureand applied load.
Design against creep usually involves a knowledge of the second-ary (linear) range and its slope, because the creep rate can be determinedreliably only when the curve has a constant slope. Generally, resistanceto creep increases with the melting temperature of a material. Stainlesssteels, superalloys, and refractory metals and alloys are thus commonlyused in applications where resistance to creep is required.
Stress Relaxation. Stress relaxation is closely related to creep. Instress relaxation, the stresses resulting from loading of a structuralcomponent decrease in magnitude over a period, even though thedimensions of the component remain constant. An example is thedecrease in tensile stress of a wire in tension between two fixed ends(as in the wires in a piano); other examples include stress relaxation in rivets, bolts,guy wires, and similar parts under either tension, compression, or flexure. Stress re-laxation is particularly common and important in thermoplastics (Section 7.3).
2.9 Impact
In many manufacturing operations and machinery components, materials are sub-jected to impact, or dynamic loading—for example, in high-speed metalworkingoperations such as heading to make bolt heads, and in drop forging (Section 14.9).A typical impact test consists of placing a notched specimen in an impact tester andbreaking the specimen with a swinging pendulum.
Primary
Time
Tertiary
Str
ain
Instantaneousdeformation
Rupture
Secondary
FIGURE 2.18 Schematic illustration of atypical creep curve. The linear segment ofthe curve (secondary) is used in designingcomponents for a specific creep life.
0.2
0.3
0.4
0.5
0.6
0.7
0.8
0 50 200
0 200 400 600 800 1000 1200MPa
End
uran
ce li
mit/
tens
ile s
tren
gth
Titanium
Steels
Cast ironsCopper alloys
Aluminum alloys
Wroughtmagnesium alloys
Castmagnesium
alloys
Tensile strength (psi # 103)100 150
0.1
0
FIGURE 2.17 Ratio of endurance limit to tensilestrength for various metals, as a function of tensilestrength. Because aluminum does not have anendurance limit, the correlations for aluminumare based on a specific number of cycles, as is seenin Fig. 2.16.
M02_KALP1681_06_SE_C02.QXD 1/12/09 4:30 PM Page 75
76 Chapter 2 Mechanical Behavior, Testing, and Manufacturing Properties of Materials
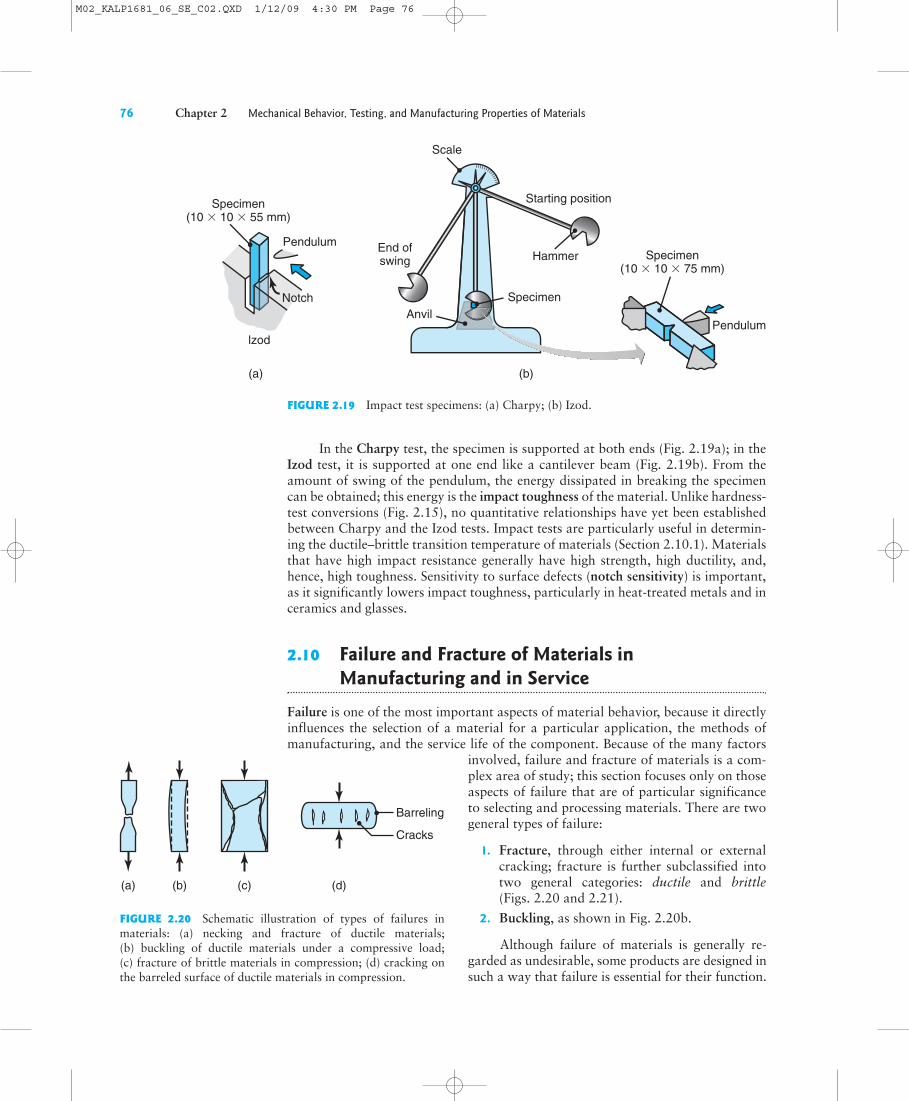
In the Charpy test, the specimen is supported at both ends (Fig. 2.19a); in theIzod test, it is supported at one end like a cantilever beam (Fig. 2.19b). From theamount of swing of the pendulum, the energy dissipated in breaking the specimencan be obtained; this energy is the impact toughness of the material. Unlike hardness-test conversions (Fig. 2.15), no quantitative relationships have yet been establishedbetween Charpy and the Izod tests. Impact tests are particularly useful in determin-ing the ductile–brittle transition temperature of materials (Section 2.10.1). Materialsthat have high impact resistance generally have high strength, high ductility, and,hence, high toughness. Sensitivity to surface defects (notch sensitivity) is important,as it significantly lowers impact toughness, particularly in heat-treated metals and inceramics and glasses.
2.10 Failure and Fracture of Materials in Manufacturing and in Service
Failure is one of the most important aspects of material behavior, because it directlyinfluences the selection of a material for a particular application, the methods ofmanufacturing, and the service life of the component. Because of the many factors
involved, failure and fracture of materials is a com-plex area of study; this section focuses only on thoseaspects of failure that are of particular significanceto selecting and processing materials. There are twogeneral types of failure:
1. Fracture, through either internal or externalcracking; fracture is further subclassified intotwo general categories: ductile and brittle(Figs. 2.20 and 2.21).
2. Buckling, as shown in Fig. 2.20b.
Although failure of materials is generally re-garded as undesirable, some products are designed insuch a way that failure is essential for their function.
End ofswing
(b)(a)
Starting position
Pendulum
Scale
Hammer Specimen(10 $ 10 $ 75 mm)
SpecimenAnvil
Pendulum
lzod
Notch
Specimen(10 $ 10 $ 55 mm)
FIGURE 2.19 Impact test specimens: (a) Charpy; (b) Izod.
Barreling
Cracks
(a) (b) (c) (d)
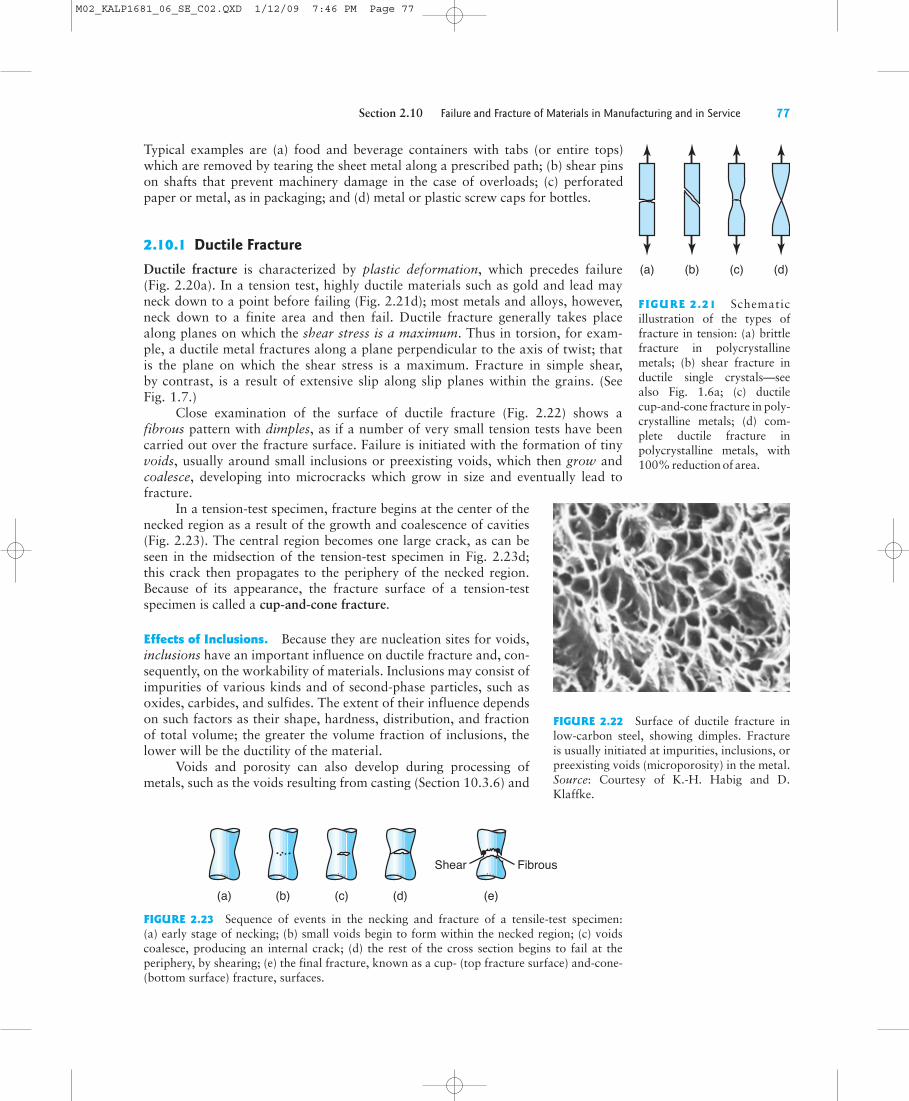
FIGURE 2.20 Schematic illustration of types of failures inmaterials: (a) necking and fracture of ductile materials;(b) buckling of ductile materials under a compressive load;(c) fracture of brittle materials in compression; (d) cracking onthe barreled surface of ductile materials in compression.
M02_KALP1681_06_SE_C02.QXD 1/12/09 4:30 PM Page 76
Section 2.10 Failure and Fracture of Materials in Manufacturing and in Service 77
Typical examples are (a) food and beverage containers with tabs (or entire tops)which are removed by tearing the sheet metal along a prescribed path; (b) shear pinson shafts that prevent machinery damage in the case of overloads; (c) perforatedpaper or metal, as in packaging; and (d) metal or plastic screw caps for bottles.
2.10.1 Ductile FractureDuctile fracture is characterized by plastic deformation, which precedes failure(Fig. 2.20a). In a tension test, highly ductile materials such as gold and lead mayneck down to a point before failing (Fig. 2.21d); most metals and alloys, however,neck down to a finite area and then fail. Ductile fracture generally takes placealong planes on which the shear stress is a maximum. Thus in torsion, for exam-ple, a ductile metal fractures along a plane perpendicular to the axis of twist; thatis the plane on which the shear stress is a maximum. Fracture in simple shear,by contrast, is a result of extensive slip along slip planes within the grains. (SeeFig. 1.7.)
Close examination of the surface of ductile fracture (Fig. 2.22) shows afibrous pattern with dimples, as if a number of very small tension tests have beencarried out over the fracture surface. Failure is initiated with the formation of tinyvoids, usually around small inclusions or preexisting voids, which then grow andcoalesce, developing into microcracks which grow in size and eventually lead tofracture.
In a tension-test specimen, fracture begins at the center of thenecked region as a result of the growth and coalescence of cavities(Fig. 2.23). The central region becomes one large crack, as can beseen in the midsection of the tension-test specimen in Fig. 2.23d;this crack then propagates to the periphery of the necked region.Because of its appearance, the fracture surface of a tension-testspecimen is called a cup-and-cone fracture.
Effects of Inclusions. Because they are nucleation sites for voids,inclusions have an important influence on ductile fracture and, con-sequently, on the workability of materials. Inclusions may consist ofimpurities of various kinds and of second-phase particles, such asoxides, carbides, and sulfides. The extent of their influence dependson such factors as their shape, hardness, distribution, and fractionof total volume; the greater the volume fraction of inclusions, thelower will be the ductility of the material.
Voids and porosity can also develop during processing ofmetals, such as the voids resulting from casting (Section 10.3.6) and
(a) (b) (c) (d)
FIGURE 2.21 Schematicillustration of the types offracture in tension: (a) brittlefracture in polycrystallinemetals; (b) shear fracture inductile single crystals—seealso Fig. 1.6a; (c) ductilecup-and-cone fracture in poly-crystalline metals; (d) com-plete ductile fracture inpolycrystalline metals, with100% reduction of area.
FIGURE 2.22 Surface of ductile fracture inlow-carbon steel, showing dimples. Fractureis usually initiated at impurities, inclusions, orpreexisting voids (microporosity) in the metal.Source: Courtesy of K.-H. Habig and D.Klaffke.
FIGURE 2.23 Sequence of events in the necking and fracture of a tensile-test specimen:(a) early stage of necking; (b) small voids begin to form within the necked region; (c) voidscoalesce, producing an internal crack; (d) the rest of the cross section begins to fail at theperiphery, by shearing; (e) the final fracture, known as a cup- (top fracture surface) and-cone-(bottom surface) fracture, surfaces.
Shear Fibrous
(a) (b) (c) (d) (e)
M02_KALP1681_06_SE_C02.QXD 1/12/09 7:46 PM Page 77
78 Chapter 2 Mechanical Behavior, Testing, and Manufacturing Properties of Materials
metalworking processes such as drawing and extrusion (Section 15.8). Two factorsaffect void formation:
a. The strength of the bond at the interface between an inclusion and the matrix.If the bond is strong, there is less tendency for void formation during plasticdeformation.
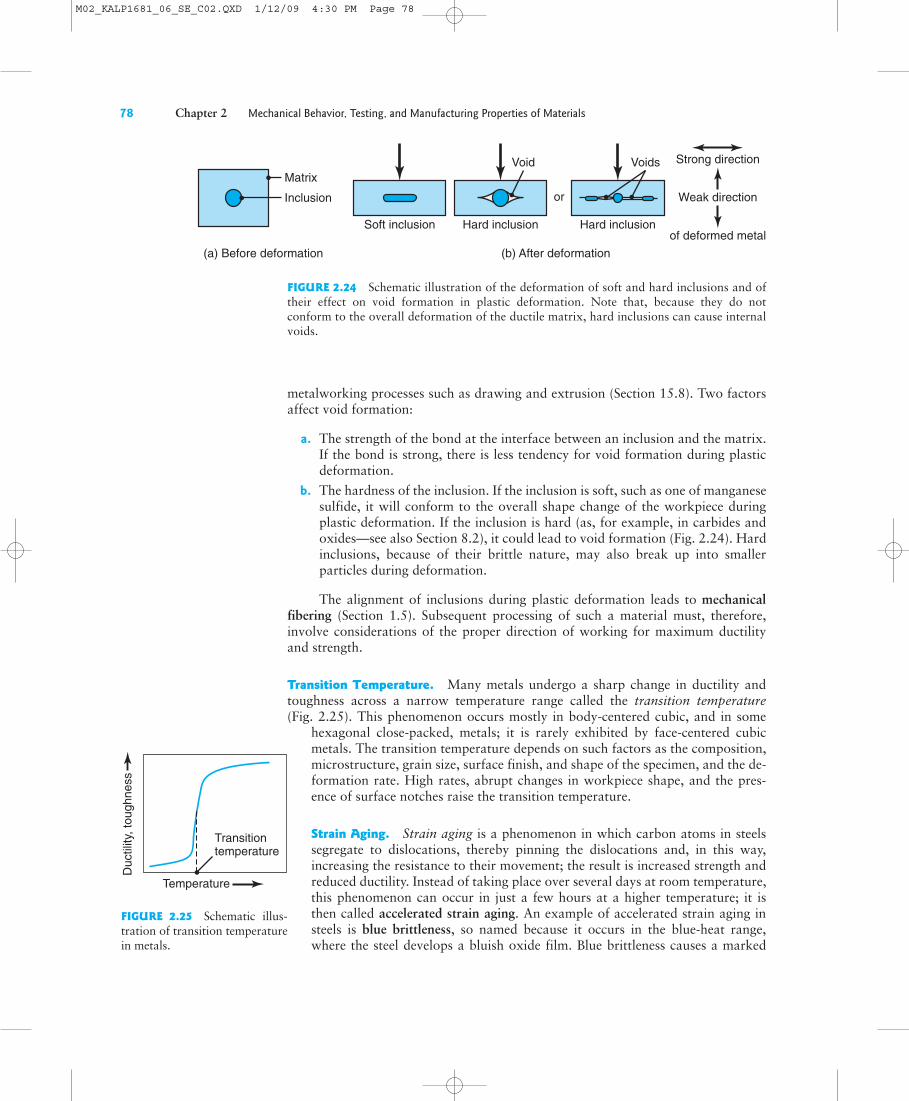
b. The hardness of the inclusion. If the inclusion is soft, such as one of manganesesulfide, it will conform to the overall shape change of the workpiece duringplastic deformation. If the inclusion is hard (as, for example, in carbides andoxides—see also Section 8.2), it could lead to void formation (Fig. 2.24). Hardinclusions, because of their brittle nature, may also break up into smallerparticles during deformation.
The alignment of inclusions during plastic deformation leads to mechanicalfibering (Section 1.5). Subsequent processing of such a material must, therefore,involve considerations of the proper direction of working for maximum ductilityand strength.
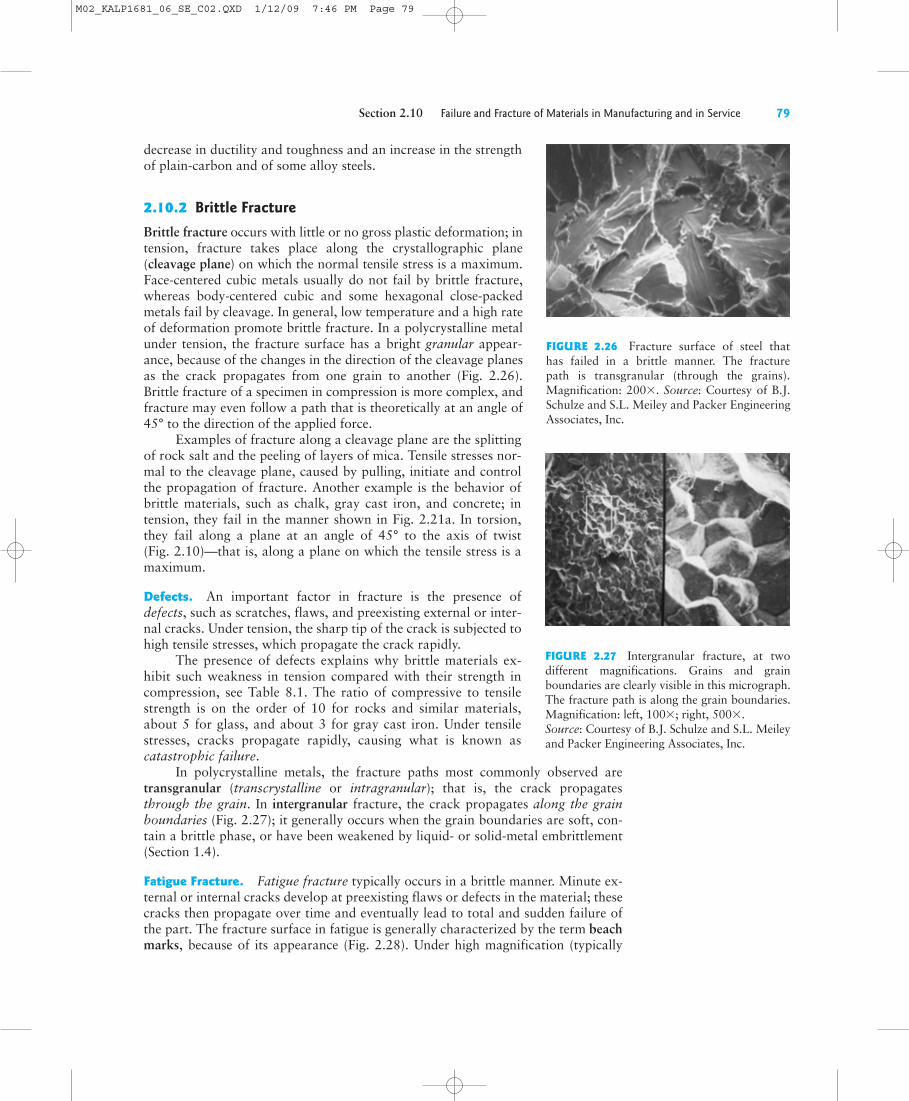
Transition Temperature. Many metals undergo a sharp change in ductility andtoughness across a narrow temperature range called the transition temperature(Fig. 2.25). This phenomenon occurs mostly in body-centered cubic, and in some
hexagonal close-packed, metals; it is rarely exhibited by face-centered cubicmetals. The transition temperature depends on such factors as the composition,microstructure, grain size, surface finish, and shape of the specimen, and the de-formation rate. High rates, abrupt changes in workpiece shape, and the pres-ence of surface notches raise the transition temperature.
Strain Aging. Strain aging is a phenomenon in which carbon atoms in steelssegregate to dislocations, thereby pinning the dislocations and, in this way,increasing the resistance to their movement; the result is increased strength andreduced ductility. Instead of taking place over several days at room temperature,this phenomenon can occur in just a few hours at a higher temperature; it isthen called accelerated strain aging. An example of accelerated strain aging insteels is blue brittleness, so named because it occurs in the blue-heat range,where the steel develops a bluish oxide film. Blue brittleness causes a marked
FIGURE 2.24 Schematic illustration of the deformation of soft and hard inclusions and oftheir effect on void formation in plastic deformation. Note that, because they do notconform to the overall deformation of the ductile matrix, hard inclusions can cause internalvoids.
(a) Before deformation (b) After deformation
Matrix
Inclusion
Soft inclusion Hard inclusion
Void Strong direction
of deformed metalHard inclusion
Voids
or Weak direction
Duc
tility
, tou
ghne
ss
Transitiontemperature
Temperature
FIGURE 2.25 Schematic illus-tration of transition temperaturein metals.
M02_KALP1681_06_SE_C02.QXD 1/12/09 4:30 PM Page 78
Section 2.10 Failure and Fracture of Materials in Manufacturing and in Service 79
decrease in ductility and toughness and an increase in the strengthof plain-carbon and of some alloy steels.
2.10.2 Brittle FractureBrittle fracture occurs with little or no gross plastic deformation; intension, fracture takes place along the crystallographic plane(cleavage plane) on which the normal tensile stress is a maximum.Face-centered cubic metals usually do not fail by brittle fracture,whereas body-centered cubic and some hexagonal close-packedmetals fail by cleavage. In general, low temperature and a high rateof deformation promote brittle fracture. In a polycrystalline metalunder tension, the fracture surface has a bright granular appear-ance, because of the changes in the direction of the cleavage planesas the crack propagates from one grain to another (Fig. 2.26).Brittle fracture of a specimen in compression is more complex, andfracture may even follow a path that is theoretically at an angle of45° to the direction of the applied force.
Examples of fracture along a cleavage plane are the splittingof rock salt and the peeling of layers of mica. Tensile stresses nor-mal to the cleavage plane, caused by pulling, initiate and controlthe propagation of fracture. Another example is the behavior ofbrittle materials, such as chalk, gray cast iron, and concrete; intension, they fail in the manner shown in Fig. 2.21a. In torsion,they fail along a plane at an angle of 45° to the axis of twist(Fig. 2.10)—that is, along a plane on which the tensile stress is amaximum.
Defects. An important factor in fracture is the presence ofdefects, such as scratches, flaws, and preexisting external or inter-nal cracks. Under tension, the sharp tip of the crack is subjected tohigh tensile stresses, which propagate the crack rapidly.
The presence of defects explains why brittle materials ex-hibit such weakness in tension compared with their strength incompression, see Table 8.1. The ratio of compressive to tensilestrength is on the order of 10 for rocks and similar materials,about 5 for glass, and about 3 for gray cast iron. Under tensilestresses, cracks propagate rapidly, causing what is known ascatastrophic failure.
In polycrystalline metals, the fracture paths most commonly observed aretransgranular (transcrystalline or intragranular); that is, the crack propagatesthrough the grain. In intergranular fracture, the crack propagates along the grainboundaries (Fig. 2.27); it generally occurs when the grain boundaries are soft, con-tain a brittle phase, or have been weakened by liquid- or solid-metal embrittlement(Section 1.4).
Fatigue Fracture. Fatigue fracture typically occurs in a brittle manner. Minute ex-ternal or internal cracks develop at preexisting flaws or defects in the material; thesecracks then propagate over time and eventually lead to total and sudden failure ofthe part. The fracture surface in fatigue is generally characterized by the term beachmarks, because of its appearance (Fig. 2.28). Under high magnification (typically
FIGURE 2.26 Fracture surface of steel thathas failed in a brittle manner. The fracturepath is transgranular (through the grains).Magnification: 200!. Source: Courtesy of B.J.Schulze and S.L. Meiley and Packer EngineeringAssociates, Inc.
FIGURE 2.27 Intergranular fracture, at twodifferent magnifications. Grains and grainboundaries are clearly visible in this micrograph.The fracture path is along the grain boundaries.Magnification: left, 100!; right, 500!.Source: Courtesy of B.J. Schulze and S.L. Meileyand Packer Engineering Associates, Inc.
M02_KALP1681_06_SE_C02.QXD 1/12/09 7:46 PM Page 79

80 Chapter 2 Mechanical Behavior, Testing, and Manufacturing Properties of Materials
more than 1000!), a series of striations can be seen on fracturesurfaces, each beach mark consisting of several striations.
Improving Fatigue Strength. Fatigue life is greatly influencedby the method of preparation of the surfaces of the part or speci-men (Fig. 2.29). The fatigue strength of manufactured productscan be improved overall by the following methods:
a. Inducing compressive residual stresses on surfaces—forexample, by shot peening or by roller burnishing (Sec-tion 33.2);
b. Case hardening (surface hardening) by various means(Section 4.10);
c. Providing a fine surface finish and thereby reducing theeffects of notches and other surface imperfections; and
d. Selecting appropriate materials and ensuring that they arefree from significant amounts of inclusions, voids, andimpurities.
Conversely, the following factors and processes canreduce fatigue strength: tensile residual stresses on thesurface (see Section 2.11), decarburization; surfacepits (due to corrosion) that act as stress raisers; hydro-gen embrittlement; galvanizing; and electroplating.
Stress–corrosion Cracking. An otherwise ductilemetal can fail in a brittle manner by stress–corrosioncracking (also called stress cracking or seasoncracking). Parts free from defects may develop cracks,either over time or soon after being manufactured intoa product. Crack propagation may be either intergran-ular or transgranular. The susceptibility of metals tostress–corrosion cracking depends mainly on the mate-rial, on the presence and magnitude of tensile residualstresses, and on the environment. Brass and austeniticstainless steels are among metals that are highly sus-ceptible to stress cracking; the environment includescorrosive media such as salt water or other chemicals.The usual procedure to avoid stress–corrosion crack-ing is to stress relieve the part just after it is formed.Full annealing (Section 4.11) may also be done, butthis treatment reduces the strength of cold-workedparts.
Hydrogen Embrittlement. The presence of hydro-gen can reduce ductility and can cause severe embrit-
tlement and premature failure in many metals, alloys, and nonmetallic materials.Known as hydrogen embrittlement, this phenomenon is especially severe in high-strength steels. Possible sources of hydrogen arise during melting of the metal, pick-ling (removing of surface oxides by chemical or electrochemical reaction), andelectrolysis in electroplating; other sources are water vapor in the atmosphere andmoist electrodes and fluxes used during welding. Oxygen can also cause embrittle-ment, particularly in copper alloys.
FIGURE 2.28 Typical fatigue-fracture surfaceon metals, showing beach marks. Magnification:left, 500!; right, 1000!. Source: Courtesy ofB.J. Schulze and S.L. Meiley and PackerEngineering Associates, Inc.
Redu
ctio
n in
fatig
ue s
treng
th (%
)
Ultimate tensile strength (psi ! 103)100 15050 200
500 800 1000 1300MPa
Fine polishingPolishingGrindingFine turning
Rough turning
As cast
60
70
50
40
30
20
10
0
FIGURE 2.29 Reductions in the fatigue strength of caststeels subjected to various surface-finishing operations. Notethat the reduction becomes greater as the surface roughnessand the strength of the steel increase. Source: M.R. Mitchell.
M02_KALP1681_06_SE_C02.QXD 1/12/09 7:46 PM Page 80
Section 2.11 Residual Stresses 81
2.11 Residual Stresses
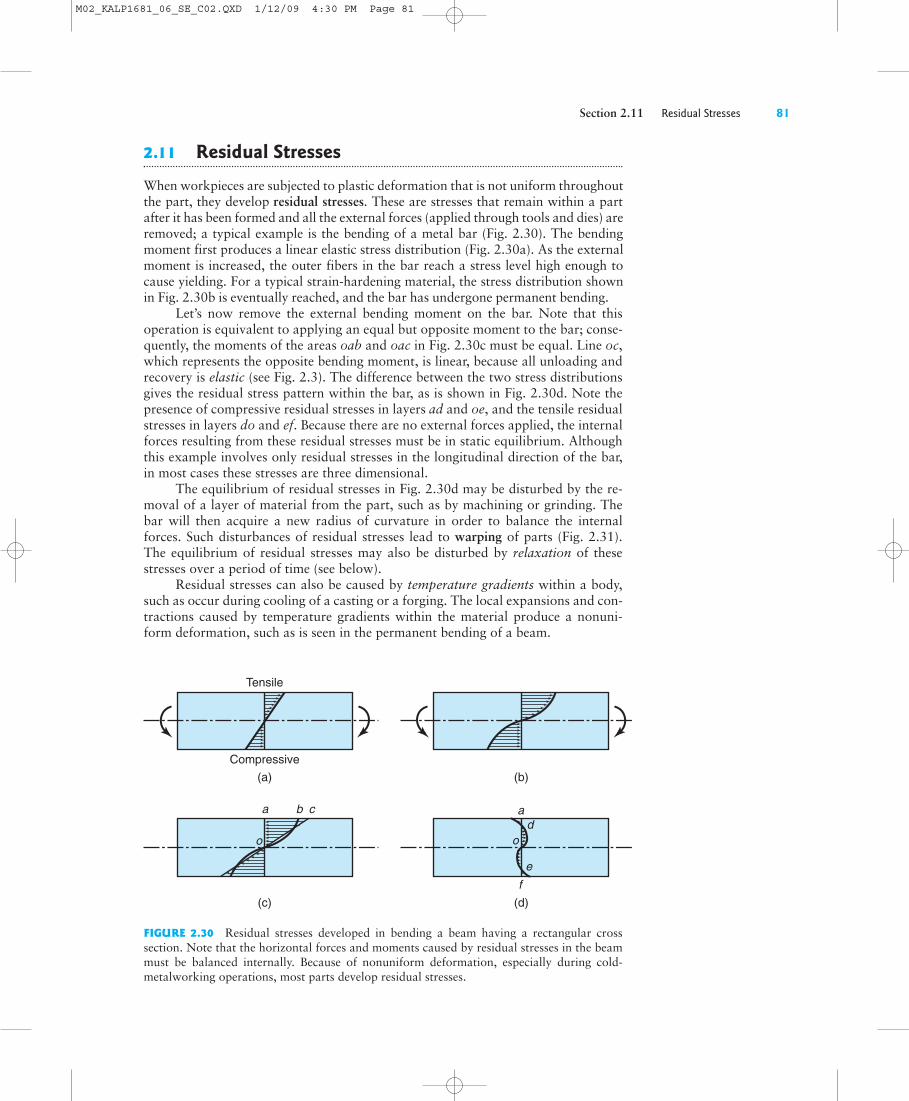
When workpieces are subjected to plastic deformation that is not uniform throughoutthe part, they develop residual stresses. These are stresses that remain within a partafter it has been formed and all the external forces (applied through tools and dies) areremoved; a typical example is the bending of a metal bar (Fig. 2.30). The bendingmoment first produces a linear elastic stress distribution (Fig. 2.30a). As the externalmoment is increased, the outer fibers in the bar reach a stress level high enough tocause yielding. For a typical strain-hardening material, the stress distribution shownin Fig. 2.30b is eventually reached, and the bar has undergone permanent bending.
Let’s now remove the external bending moment on the bar. Note that thisoperation is equivalent to applying an equal but opposite moment to the bar; conse-quently, the moments of the areas oab and oac in Fig. 2.30c must be equal. Line oc,which represents the opposite bending moment, is linear, because all unloading andrecovery is elastic (see Fig. 2.3). The difference between the two stress distributionsgives the residual stress pattern within the bar, as is shown in Fig. 2.30d. Note thepresence of compressive residual stresses in layers ad and oe, and the tensile residualstresses in layers do and ef. Because there are no external forces applied, the internalforces resulting from these residual stresses must be in static equilibrium. Althoughthis example involves only residual stresses in the longitudinal direction of the bar,in most cases these stresses are three dimensional.
The equilibrium of residual stresses in Fig. 2.30d may be disturbed by the re-moval of a layer of material from the part, such as by machining or grinding. Thebar will then acquire a new radius of curvature in order to balance the internalforces. Such disturbances of residual stresses lead to warping of parts (Fig. 2.31).The equilibrium of residual stresses may also be disturbed by relaxation of thesestresses over a period of time (see below).
Residual stresses can also be caused by temperature gradients within a body,such as occur during cooling of a casting or a forging. The local expansions and con-tractions caused by temperature gradients within the material produce a nonuni-form deformation, such as is seen in the permanent bending of a beam.
Tensile
Compressive(a)
(c) (d)
a b c
o
ad
o
ef
(b)
FIGURE 2.30 Residual stresses developed in bending a beam having a rectangular crosssection. Note that the horizontal forces and moments caused by residual stresses in the beammust be balanced internally. Because of nonuniform deformation, especially during cold-metalworking operations, most parts develop residual stresses.
M02_KALP1681_06_SE_C02.QXD 1/12/09 4:30 PM Page 81
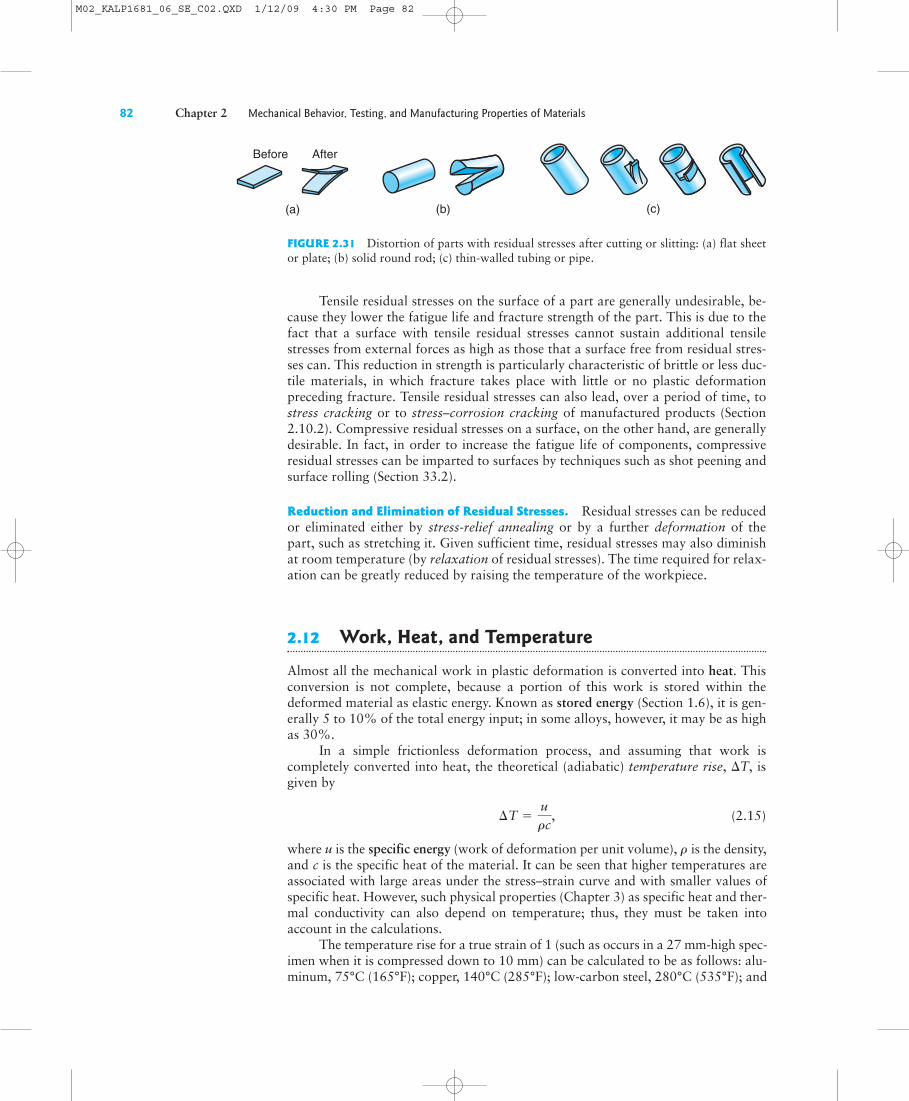
82 Chapter 2 Mechanical Behavior, Testing, and Manufacturing Properties of Materials
Tensile residual stresses on the surface of a part are generally undesirable, be-cause they lower the fatigue life and fracture strength of the part. This is due to thefact that a surface with tensile residual stresses cannot sustain additional tensilestresses from external forces as high as those that a surface free from residual stres-ses can. This reduction in strength is particularly characteristic of brittle or less duc-tile materials, in which fracture takes place with little or no plastic deformationpreceding fracture. Tensile residual stresses can also lead, over a period of time, tostress cracking or to stress–corrosion cracking of manufactured products (Section2.10.2). Compressive residual stresses on a surface, on the other hand, are generallydesirable. In fact, in order to increase the fatigue life of components, compressiveresidual stresses can be imparted to surfaces by techniques such as shot peening andsurface rolling (Section 33.2).
Reduction and Elimination of Residual Stresses. Residual stresses can be reducedor eliminated either by stress-relief annealing or by a further deformation of thepart, such as stretching it. Given sufficient time, residual stresses may also diminishat room temperature (by relaxation of residual stresses). The time required for relax-ation can be greatly reduced by raising the temperature of the workpiece.
2.12 Work, Heat, and Temperature
Almost all the mechanical work in plastic deformation is converted into heat. Thisconversion is not complete, because a portion of this work is stored within thedeformed material as elastic energy. Known as stored energy (Section 1.6), it is gen-erally 5 to 10% of the total energy input; in some alloys, however, it may be as highas 30%.
In a simple frictionless deformation process, and assuming that work iscompletely converted into heat, the theoretical (adiabatic) temperature rise, $T, isgiven by
(2.15)
where u is the specific energy (work of deformation per unit volume), is the density,and c is the specific heat of the material. It can be seen that higher temperatures areassociated with large areas under the stress–strain curve and with smaller values ofspecific heat. However, such physical properties (Chapter 3) as specific heat and ther-mal conductivity can also depend on temperature; thus, they must be taken intoaccount in the calculations.
The temperature rise for a true strain of 1 (such as occurs in a 27 mm-high spec-imen when it is compressed down to 10 mm) can be calculated to be as follows: alu-minum, 75°C (165°F); copper, 140°C (285°F); low-carbon steel, 280°C (535°F); and
r
¢T = urc
,
(c)(a)
Before After
(b)
FIGURE 2.31 Distortion of parts with residual stresses after cutting or slitting: (a) flat sheetor plate; (b) solid round rod; (c) thin-walled tubing or pipe.
M02_KALP1681_06_SE_C02.QXD 1/12/09 4:30 PM Page 82
Summary 83
titanium 570°C (1060°F). In actual operations, heat is lost to the environment, totools and dies, and to lubricants or coolants used, if any. If the deformation process isperformed rapidly, the heat losses will be relatively small over that brief period. If theprocess is carried out slowly, the actual temperature rise will be only a fraction of thecalculated value.
SUMMARY
• Many manufacturing processes involve shaping materials by plastic deformation;consequently, such mechanical properties as strength (yield strength, Y, and ulti-mate tensile strength, UTS); modulus of elasticity, E; ductility (total elongationand reduction of area); hardness; and the energy required for plastic deformationare important factors. These properties, in turn, depend, to various extents, onthe particular material and on its condition, temperature, deformation rate, sur-face condition, and environment.
• The tensile test is the most commonly used test to determine mechanical proper-ties; from these tests, true stress–true strain curves are constructed that are neededto determine the strength coefficient (K), the strain-hardening exponent (n), thestrain-rate sensitivity exponent (m), and the toughness of materials.
• Compression tests are subject to inaccuracy due to the presence of friction and to re-sultant barreling of the specimen. Torsion tests are conducted on tubular specimenssubjected to twisting. Bending or flexure tests are commonly used for brittle mate-rials to determine their modulus of rupture or the transverse rupture strength.
• Several hardness tests are used to determine the resistance of a material to perma-nent indentation or scratching. Hardness is related to strength and wear resist-ance of a material, but it is, itself, not a fundamental property.
• Fatigue tests indicate the endurance limit or fatigue limit of materials—that is, themaximum stress to which a material can be subjected without fatigue failure,regardless of the number of cycles. Some materials have no endurance limit; andinstead, their allowable stress must be reported with respect to the number ofloading cycles.
• Creep is the permanent elongation of a component under a static load maintainedfor a period of time. The specimen eventually fails by rupture (necking andfracturing).
• Impact tests determine the energy required to completely break a specimen. Thisenergy is called the impact toughness of the material. Impact tests are also usefulfor determining the transition temperatures of materials.
• Failure and fracture constitute an important aspect of a material’s behavior whenit is subjected to deformation in manufacturing operations. Ductile fracture ischaracterized by plastic deformation preceding fracture, and it requires a consid-erable amount of energy. Brittle fracture can be catastrophic, because it is notpreceded by plastic deformation; it requires much less energy than ductile frac-ture. Impurities, inclusions, and voids play a major role in the fracture of metalsand alloys.
• Residual stresses are those that remain in a workpiece after it has been plasticallydeformed and then has had all external forces removed. Surface tensile residualstresses are generally undesirable; they may be reduced or eliminated by stress-reliefannealing, further plastic deformation, or by relaxation over a period of time.
M02_KALP1681_06_SE_C02.QXD 1/12/09 4:30 PM Page 83
84 Chapter 2 Mechanical Behavior, Testing, and Manufacturing Properties of Materials
KEY TERMSBauschinger effectBlue brittlenessBrittle fractureBucklingCharpy testCompressionCreepDefectsDeformation rateDisk testDuctile fractureDuctilityDurometerElongation
Engineering strainEngineering stressFatigueFatigue failureFlexural strengthFractureHardnessImpact loadingInclusionsIzod testLeeb testMicrohardnessModulus of elasticityModulus of rigidity
Modulus of rupturePoisson’s ratioReduction of areaResidual stressesRuptureShearShear modulusShore testStrain agingStrain-hardening exponentStrain rateStrain-rate sensitivityexponentStrain softening
Strength coefficientStress–corrosion crackingStress relaxationSuperplasticityTensionTorsion testToughnessTransition temperatureTrue strainTrue stressUltimate tensile strengthYield stress
BIBLIOGRAPHYAshby, M.F., Materials Selection in Mechanical Design,
3rd ed. Pergamon, 2005.Ashby, M.F., and Jones, D.R.H., Engineering Materials,
Vol. 1, An Introduction to Their Properties andApplications,3rd ed., 2005; Vol. 2, An Introductionto Microstructures, Processing and Design, 3rd ed.,2005.
ASM Handbook, Vol. 8: Mechanical Testing and Evaluation.ASM International, 2000.
Budinski, K.G., and Budinski, M.K., Engineering Materials:Properties and Selection, 8th ed., Prentice Hall, 2004.
Cardelli, F., Materials Handbook: A Concise Desk Reference,2nd ed., Springer, 2008.
Chandler, H., Hardness Testing, 2nd ed., ASM International,1999.
Courtney, T.H., Mechanical Behavior of Materials, 2nd ed.,Waveland Press, 2005.
Davis, J.R. (ed.), Tensile Testing, 2nd ed., ASM International,2004.
Dowling, N.E., Mechanical Behavior of Materials:Engineering Methods for Deformation, Fracture, andFatigue, 3rd ed., Prentice Hall, 2006.
Hosford, W.F., Mechanical Behavior of Materials, Cambridge,2005.
Wulpi, D.J., Understanding How Components Fail, 2nd ed.,ASM International, 1999.
REVIEW QUESTIONS2.1. Distinguish between engineering stress and true stress.2.2. Describe the events that occur when a specimen under-goes a tension test. Sketch a plausible stress–strain curve, andidentify all significant regions and points between them.Assume that loading continues up to fracture.2.3. What is ductility, and how is it measured?2.4. In the equation , which represents thestress–strain curve for a material, what is the significance ofthe exponent n?2.5. What is strain-rate sensitivity, and how is it measured?2.6. What test can measure the properties of a material un-dergoing shear strain?2.7. What testing procedures can be used to measure theproperties of brittle materials, such as ceramics and carbides?2.8. Describe the differences between brittle and ductilefracture.2.9. Differentiate between stress relaxation and creep.2.10. Describe the difference between elastic and plasticbehavior.
s = KPn
2.11. Explain what uniform elongation means in tensiontesting.
2.12. Describe the difference between deformation rate andstrain rate. What unit does each one have?
2.13. Describe the difficulties involved in making a com-pression test.
2.14. What is Hooke’s law? Young’s modulus? Poisson’sratio?
2.15. Describe the difference between transgranular andintergranular fracture.
2.16. What is the reason that yield strength is generallydefined as a 0.2% offset strength?
2.17. Why does the fatigue strength of a specimen or partdepend on its surface finish?
2.18. If striations are observed under microscopic examina-tion of a fracture surface, what do they suggest regarding themode of fracture?
M02_KALP1681_06_SE_C02.QXD 1/12/09 4:30 PM Page 84
QUALITATIVE PROBLEMS
Quantitative Problems 85
2.19. On the same scale for stress, the tensile truestress–true strain curve is higher than the engineeringstress–engineering strain curve. Explain whether this condi-tion also holds for a compression test.2.20. With a simple sketch, explain whether it is necessaryto use the offset method to determine the yield stress, Y, of amaterial that has been highly cold worked.2.21. Explain why the difference between engineering strainand true strain becomes larger as strain increases. Does this dif-ference occur for both tensile and compressive strains? Explain.2.22. If a material (such as aluminum) does not have anendurance limit, how then would you estimate its fatigue life?2.23. Which hardness tests and scales would you use forvery thin strips of metal, such as aluminum foil? Explain.2.24. Which of the two tests, tension or compression,would require a higher capacity of testing machine, and why?2.25. List and explain briefly the conditions that inducebrittle fracture in an otherwise ductile metal.2.26. List the factors that you would consider in selecting ahardness test. Explain why.2.27. On the basis of Fig. 2.6, can you calculate the percentelongation of the materials listed? Explain.2.28. If a metal tension-test specimen is pulled and brokenrapidly, where would the temperature be highest, and why?2.29. Comment on your observations regarding the con-tents of Table 2.2.2.30. Will the disk test be applicable to a ductile material?Why or why not?2.31. What hardness test is suitable for determining thehardness of a thin ceramic coating on a piece of metal?
2.32. Wire rope consists of many wires that bend andunbend as the rope is run over a sheave. A wire-rope failure isinvestigated, and it is found that some of the wires, whenexamined under a scanning electron microscope, display dim-ples, while others display transgranular fracture surfaces.Explain these observations.2.33. A statistical sampling of Rockwell C hardness testsare conducted on a material, and it is determined that thematerial is defective because of insufficient hardness. Thesupplier claims that the tests are flawed because the diamond-cone indenter was probably dull. Is this a valid claim?Explain.2.34. In a Brinell hardness test, the resulting impression isfound to be elliptical. Give possible explanations for thisresult.2.35. Some coatings are extremely thin—some as thin as afew nanometers. Explain why even the Knoop test is not ableto obtain reliable results for such coatings. Recent investiga-tions have attempted to use highly polished diamonds (with atip radius around 5 nanometers) to indent such coatings inatomic force microscopes. What concerns would you haveregarding the appropriateness of the results?2.36. Select an appropriate hardness test for each of thefollowing materials, and justify your answer:
a. Cubic boron nitrideb. Leadc. Cold-drawn 0.5%C steeld. Diamonde. Caramel candyf. Granite
QUANTITATIVE PROBLEMS2.37. A paper clip is made of wire 0.7 mm in diameter. If theoriginal material from which the wire is made is a rod 25 mmin diameter, calculate the longitudinal engineering and truestrains that the wire has undergone during processing.2.38. A 200-mm-long strip of metal is stretched in twosteps, first to 300 mm and then to 400 mm. Show that thetotal true strain is the sum of the true strains in each step; inother words, the true strains are additive. Show that, in thecase of engineering strains, the strains cannot be added toobtain the total strain.2.39. Identify the two materials in Fig. 2.6 that have thelowest and the highest uniform elongations. Calculate thesequantities as percentages of the original gage lengths.2.40. Plot the ultimate strength vs. stiffness for the materialslisted in Table 2.2, and prepare a three-dimensional plot forthese materials where the third axis is their maximum elonga-tion in 50 mm.
2.41. If you remove the layer of material ad from the partshown in Fig. 2.30d—for instance, by machining or grinding—which way will the specimen curve? (Hint: Assume that thepart shown in sketch d in the figure is composed of fourhorizontal springs held at the ends. Thus, from the top down,you have compression, tension, compression, and tensionsprings.)2.42. Percent elongation is always defined in terms of theoriginal gage length, such as 50 mm or 2 in. Explain howpercent elongation would vary as the gage length of thetensile-test specimen increases. (Hint: Recall that necking is alocal phenomenon.)2.43. Make a sketch showing the nature and distribution ofresidual stresses in Fig. 2.31a and b, prior to the material’sbeing cut. (Hint: Assume that the split parts are free from anystresses; then force these parts back to the shape they origi-nally had.)
M02_KALP1681_06_SE_C02.QXD 1/12/09 4:30 PM Page 85
86 Chapter 2 Mechanical Behavior, Testing, and Manufacturing Properties of Materials
2.44. You are given the K and n values of two differentmetals. Is this information sufficient to determine whichmetal is tougher? If not, what additional information do youneed?
2.45. A cable is made of two strands of different materi-als, A and B, and cross sections as follows:
Calculate the maximum tensile force that this cable can with-stand prior to necking.
2.46. On the basis of the information given in Fig. 2.6,calculate the ultimate tensile strength (engineering) of 304stainless steel.2.47. In a disk test performed on a specimen 1.50 in. indiameter and 1/2 in. thick, the specimen fractures at a stressof 40,000 psi. What was the load on it?
2.48. A piece of steel has a hardness of 330 HB.Calculate its tensile strength, in MPa and in psi.2.49. A metal has the following properties: UTS " 70,000psi and n " 0.25. Calculate its strength coefficient, K.2.50. Using only Fig. 2.6, calculate the maximum load intension testing of an annealed copper specimen with an origi-nal diameter of 5 mm.
2.51. Estimate the modulus of resilience for a highly coldworked piece of steel having a hardness of 300 HB; for a piece
For material B, K = 30,000, n = 0.5, Ao = 0.3 in2.
For material A, K = 60,000 psi, n = 0.5, Ao = 0.6 in2.
of highly cold worked copper with a hardness of 100 HRB.2.52. A metal has a strength coefficient K " 100,000 psiand n " 0.2. Assuming that a tensile-test specimen madefrom this metal begins to neck at a true strain of 0.2, showthat the ultimate tensile strength is 59,340 psi.2.53. Plot the true stress–true strain curves for the materialslisted in Table 2.3.
2.54. The design specification for a metal requires a min-imum hardness of 80 HRA. If a Rockwell test is performedand the depth of penetration is 60 m, is the material ac-ceptable?
2.55. Calculate the major and minor pyramid angles fora Knoop indenter, and compare your results with thoseobtained from Vickers and Rockwell A indenters.
2.56. If a material has a target hardness of 300 HB, whatis the expected indentation diameter?
2.57. A Rockwell A test was conducted on a materialand a penetration depth of 0.15 mm was recorded. What isthe hardness of the material? What material would typicallyhave such a hardness value? If a Brinell hardness test were tobe conducted on this material, give an estimate of the inden-tation diameter if the load used was 1500 kg.2.58. A material is tested in tension. Over a 1-in. gagelength, the engineering strain measurements are 0.01, 0.02,0.03, 0.04, 0.05, 0.1, 0.15, 0.2, 0.5, and 1.0. Plot the truestrain versus engineering strain for these readings.
SYNTHESIS, DESIGN, AND PROJECTS2.59. List and explain the desirable mechanical propertiesof (a) an elevator cable, (b) a paper clip, (c) a leaf spring for atruck, (d) a bracket for a bookshelf, (e) piano wire, (f) a wirecoat hanger, (g) the clip for a pen, and (h) a staple.
2.60. When making a hamburger, you may have observedthe type of cracks shown in Fig. 2.20d. What would you doto avoid such cracks? [Note: Test hamburger patties by com-pressing them at different temperatures, and observe thecrack path (i.e., the path through the fat particles, the meatparticles, or their interface).]
2.61. An inexpensive claylike material called Silly Putty® isgenerally available in stores that sell toys and games. Obtain asample and perform the following experiments: (a) Shape itinto a ball, and drop it onto a flat surface. (b) Reround the balland place a heavy book on it for 1 minute. (c) Shape the puttyinto a long rod, and pull on it—first slowly, then very quickly.Describe your observations, referring to the specific sections inthis chapter where each particular observation is relevant.
2.62. Make individual sketches of the mechanisms of test-ing machines that, in your opinion, would be appropriate fortension, for torsion, and for compression testing of specimensat different rates of deformation. What modifications would
you make on these machines to include the effects of temper-ature on material properties?2.63. In tension testing of specimens, mechanical and elec-tronic instruments are typically used to measure elongation.Make sketches of instruments that would be suitable for thispurpose, commenting on their accuracy. What modificationswould you make to these instruments to include the use ofspecimens at elevated temperatures?2.64. Obtain small pieces of different metallic and non-metallic materials, including stones. Rub them against eachother, observe the scratches made, and order them in a man-ner similar to the Mohs hardness numbering system.2.65. Demonstrate the stress-relaxation phenomenon bytightly stretching thin plastic strings between two nails placedat the ends of a long piece of wood. Pluck the strings fre-quently, to test the tension as a function of time. Repeat thetest at a higher temperature by placing the fixture in an ovenset on low.2.66. Demonstrate the impact toughness of a piece of roundchalk by first using a triangular file to produce a V-notch onthe cylindrical surface (as shown in Fig. 2.19a) and thenbending the chalk to break it.
M02_KALP1681_06_SE_C02.QXD 1/12/09 4:30 PM Page 86

Synthesis, Design, and Projects 87
2.67. Using a large rubber band and a set of weights, obtainthe force–displacement curve for the rubber band. Is the re-sult different from the stress–strain curves shown in Figure2.5? Comment.2.68. Figure 2.4 shows the ductility of only four metals.Search the technical literature, and add other metals and al-loys to this chart, including their different conditions, such ashot worked, cold worked, annealed, etc.2.69. Find or prepare some solid circular pieces of brittlematerials, such as chalk, ceramics, etc. and subject them tothe type of test shown in Fig. 2.9 by using the jaws of a sim-ple vise. Describe your observations as to how the materialsfracture. Repeat the tests, using ductile materials, such asclay, soft metals, etc., and describe your observations.2.70. Take several rubber bands and pull them at differenttemperatures, including from a frozen state. Comment ontheir behavior such as ductile or brittle.2.71. Devise a simple fixture for conducting the bend testsshown in Fig. 2.11. Test sticks of various brittle materials byloading them with dead weights until they break. Verifythe statement in the text that the specimens on the right in thefigure will fracture sooner than the ones on the left.
2.72. By pushing a small ball bearing against the top sur-faces of various materials, such as clay and dough, observethe shape of the indentation with a magnifier, referring tothose shapes shown in Fig. 2.14a and b.2.73. Describe your observations regarding Fig. 2.14c.2.74. Embed a small steel ball in a soft block of materialsuch as clay, and compress the clay as shown in Fig. 2.24a.Then cut the clay carefully along the center plane and observethe deformation of the material. Repeat the experiment byembedding a small round jelly bean in the clay and deformingthe material. Comment on your observations.2.75. Devise a simple experiment, and perform tests on ma-terials commonly found around the house by bending them atdifferent temperatures for a qualitative assessment of theirtransition temperature, as shown in Fig. 2.25.2.76. Obtain some solid and some tubular metal pieces, andslit them as shown in Fig. 2.31. Comment on whether thereare any residual stresses in the parts prior to slitting them.2.77. Explain how you would obtain an estimate of thehardness for a carbon nanotube. (See Section 8.6.)
M02_KALP1681_06_SE_C02.QXD 1/12/09 4:30 PM Page 87
Related Documents