14-1 14 14 Organic Organic Chemistry Chemistry William H. Brown & William H. Brown & Christopher S. Christopher S. Foote Foote

14-1 14 Organic Chemistry William H. Brown & Christopher S. Foote.
Dec 26, 2015
Welcome message from author
This document is posted to help you gain knowledge. Please leave a comment to let me know what you think about it! Share it to your friends and learn new things together.
Transcript
14-1
1414
Organic Organic ChemistryChemistry
William H. Brown & William H. Brown & Christopher S. FooteChristopher S. FooteWilliam H. Brown & William H. Brown & Christopher S. FooteChristopher S. Foote
14-2
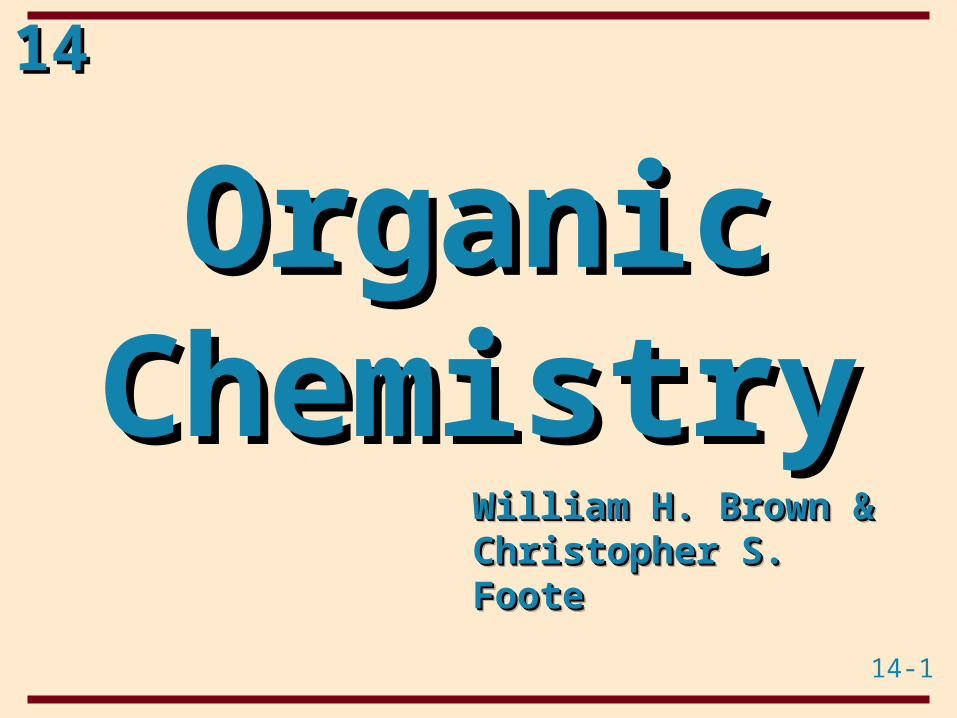
1414
Mass Mass SpectrometrySpectrometry
Chapter 12
Chapter 14Chapter 14
14-3
1414 Mass Spectrometry (MS)Mass Spectrometry (MS) An analytical technique for measuring the mass-
to-charge ratio (m/z) of ions, most commonly positive ions, in the gas phase• mass spectrometry is our most valuable analytical tool
for determining accurate molecular weights• also can give information about structure• proteins can now be sequenced by MS
14-4
1414 Mass Spectrometry (MS)Mass Spectrometry (MS)
QuickTime™ and aPhoto - JPEG decompressor
are needed to see this picture.
14-5
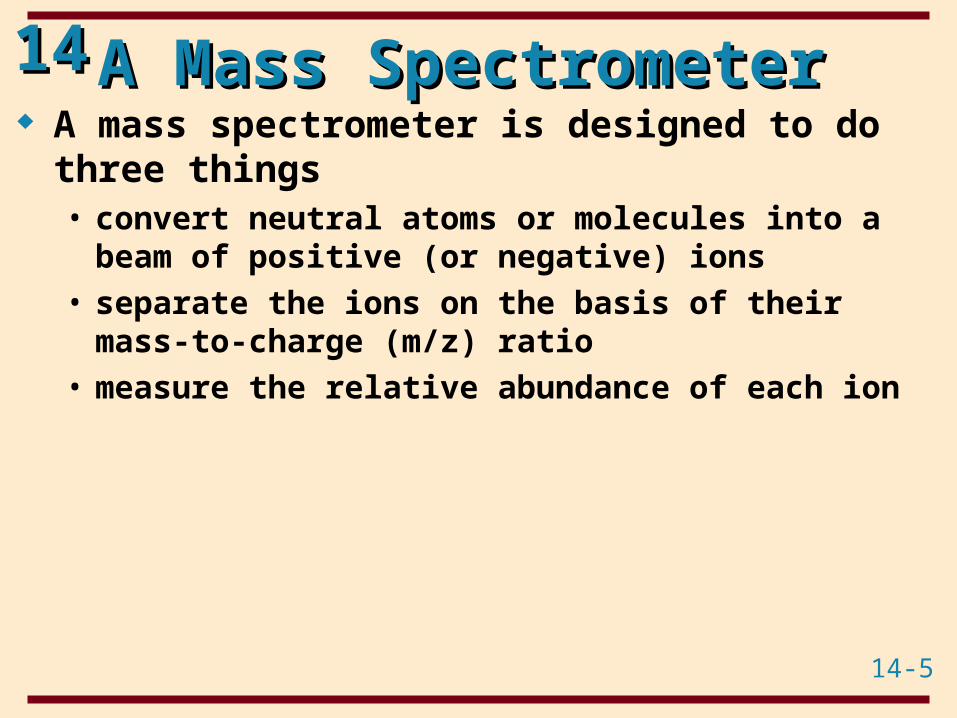
1414 A Mass SpectrometerA Mass Spectrometer A mass spectrometer is designed to do three
things• convert neutral atoms or molecules into a beam of
positive (or negative) ions• separate the ions on the basis of their mass-to-charge
(m/z) ratio• measure the relative abundance of each ion
14-6
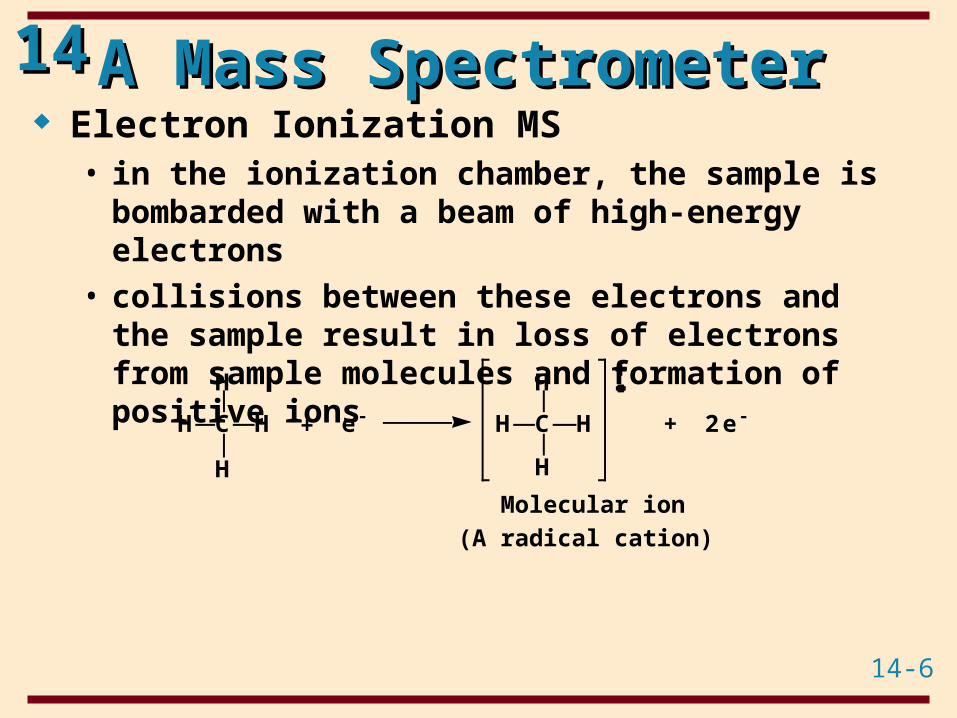
1414 A Mass SpectrometerA Mass Spectrometer Electron Ionization MS• in the ionization chamber, the sample is
bombarded with a beam of high-energy electrons• collisions between these electrons and the sample
result in loss of electrons from sample molecules and formation of positive ions
Molecular ion(A radical cation)
++
+
C HH
H
H
C
H
H
He- 2e-H
14-7
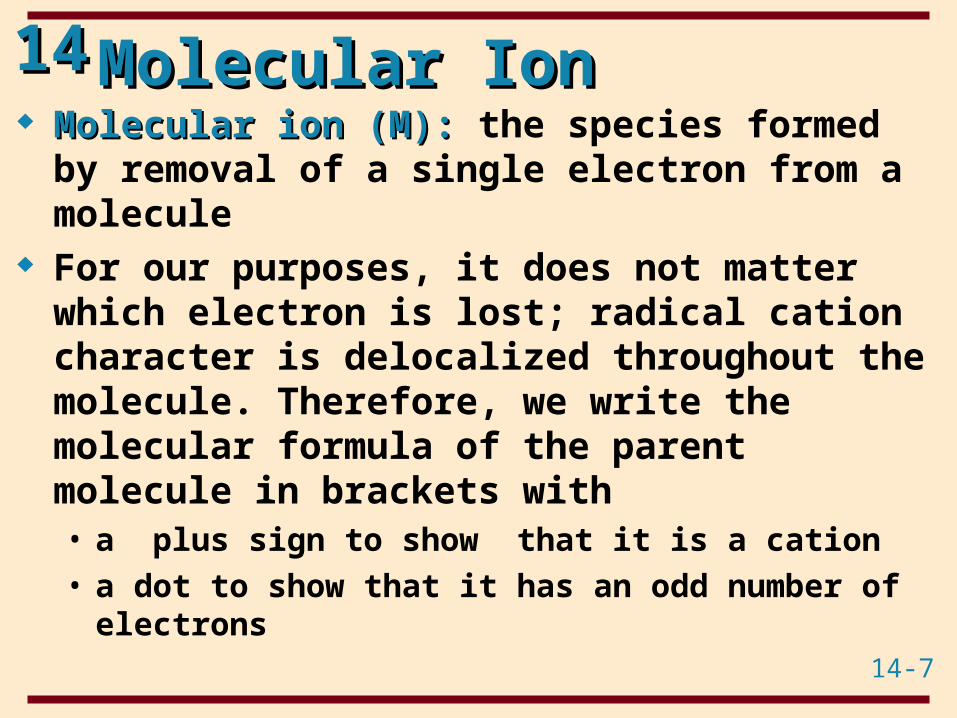
1414 Molecular IonMolecular Ion Molecular ion (M):Molecular ion (M): the species formed by removal
of a single electron from a molecule For our purposes, it does not matter which
electron is lost; radical cation character is delocalized throughout the molecule. Therefore, we write the molecular formula of the parent molecule in brackets with• a plus sign to show that it is a cation• a dot to show that it has an odd number of electrons
14-8
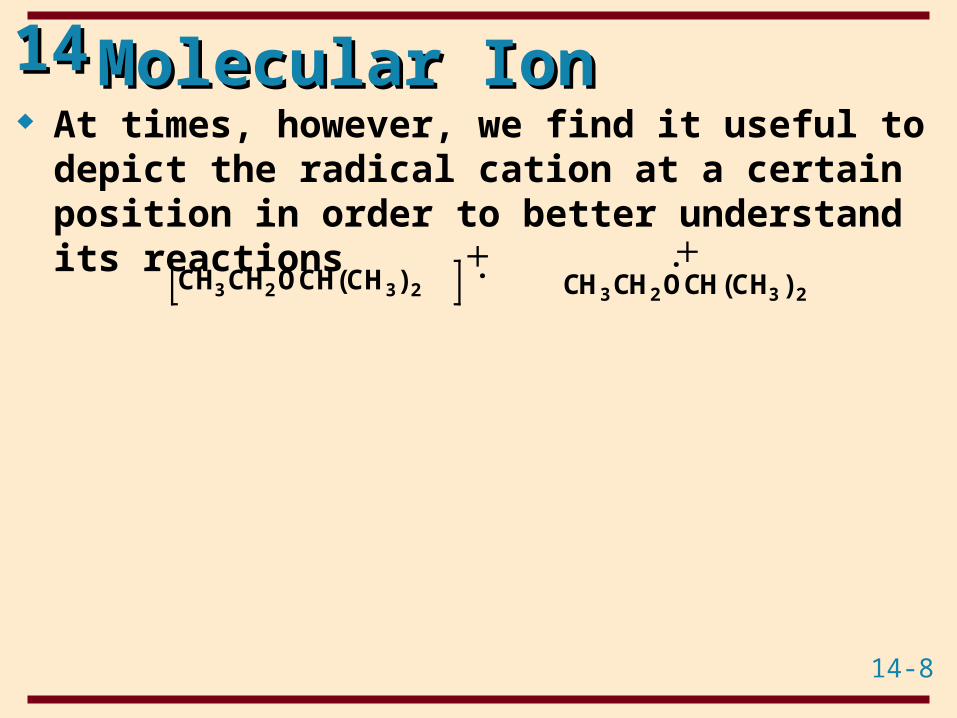
1414 Molecular IonMolecular Ion At times, however, we find it useful to depict the
radical cation at a certain position in order to better understand its reactions
CH3CH2OCH(CH3)2CH3CH2OCH(CH3)2
. .
14-9
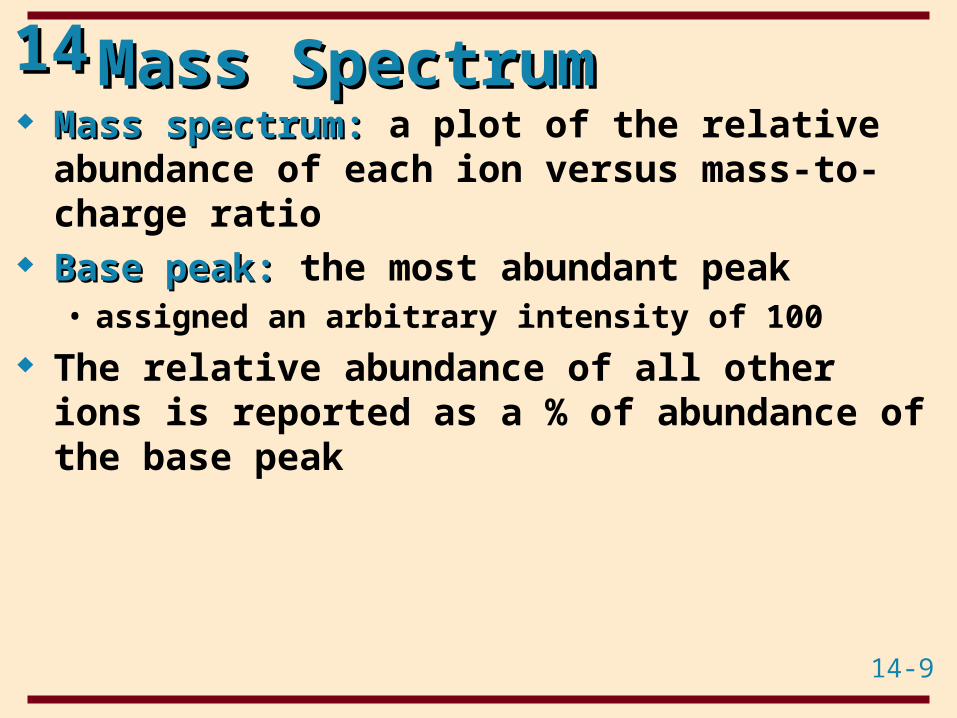
1414 Mass SpectrumMass Spectrum Mass spectrum:Mass spectrum: a plot of the relative abundance
of each ion versus mass-to-charge ratio Base peak:Base peak: the most abundant peak• assigned an arbitrary intensity of 100
The relative abundance of all other ions is reported as a % of abundance of the base peak
14-10
1414 MS of dopamineMS of dopamine• a partial MS of dopamine showing all peaks with
intensity equal to or greater than 0.5% of base peak
QuickTime™ and aPhoto - JPEG decompressor
are needed to see this picture.
14-11
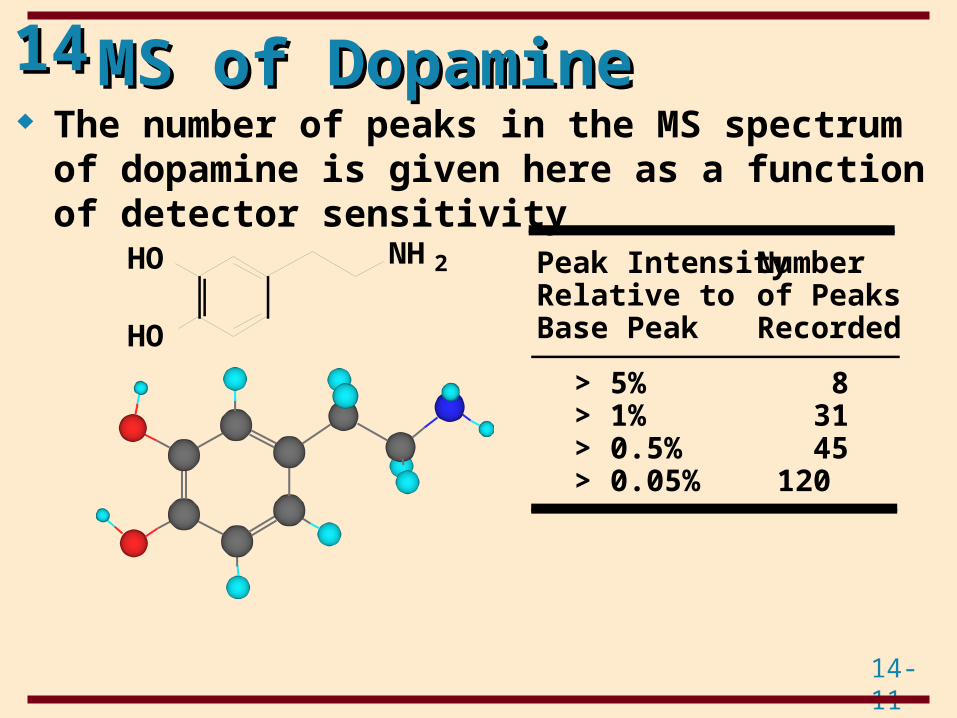
1414 MS of DopamineMS of Dopamine The number of peaks in the MS spectrum of
dopamine is given here as a function of detector sensitivity
HO
HO
NH2 Number of PeaksRecorded
Peak IntensityRelative to Base Peak
> 5%> 1%> 0.5%> 0.05%
8 31 45120
14-12
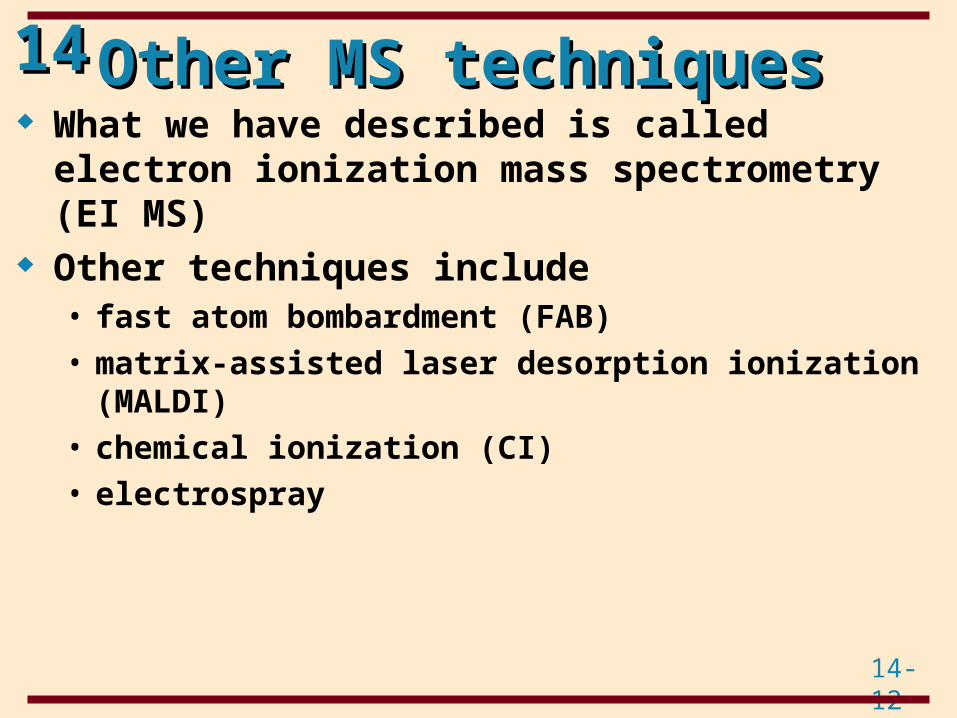
1414 Other MS techniquesOther MS techniques What we have described is called electron
ionization mass spectrometry (EI MS) Other techniques include• fast atom bombardment (FAB)• matrix-assisted laser desorption ionization (MALDI)• chemical ionization (CI)• electrospray
14-13
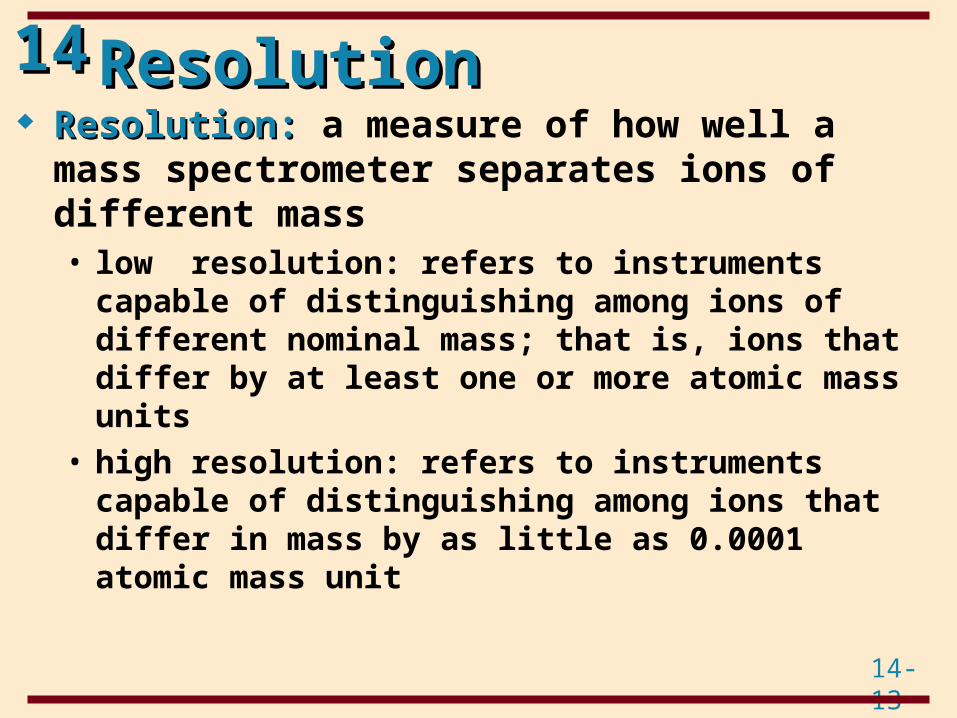
1414 ResolutionResolution Resolution:Resolution: a measure of how well a mass
spectrometer separates ions of different mass• low resolution: refers to instruments capable of
distinguishing among ions of different nominal mass; that is, ions that differ by at least one or more atomic mass units
• high resolution: refers to instruments capable of distinguishing among ions that differ in mass by as little as 0.0001 atomic mass unit
14-14
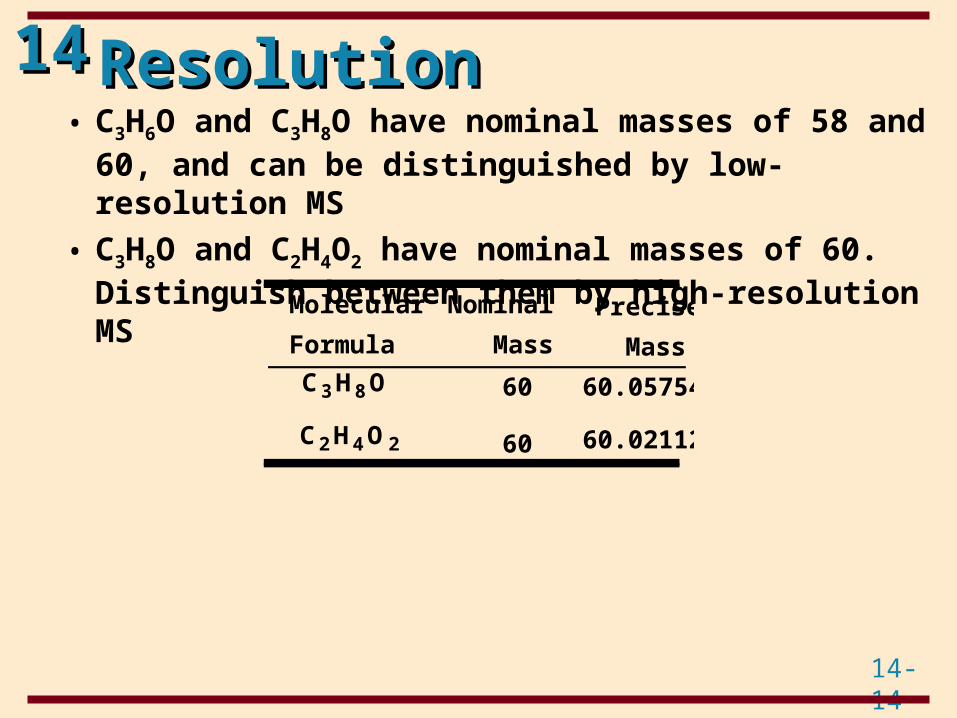
1414 ResolutionResolution• C3H6O and C3H8O have nominal masses of 58 and 60,
and can be distinguished by low-resolution MS
• C3H8O and C2H4O2 have nominal masses of 60. Distinguish between them by high-resolution MS
C2H4O2
C3H8O
Molecular
Formula
60.02112
60.05754
60
60
Precise
Mass
Nominal
Mass
14-15
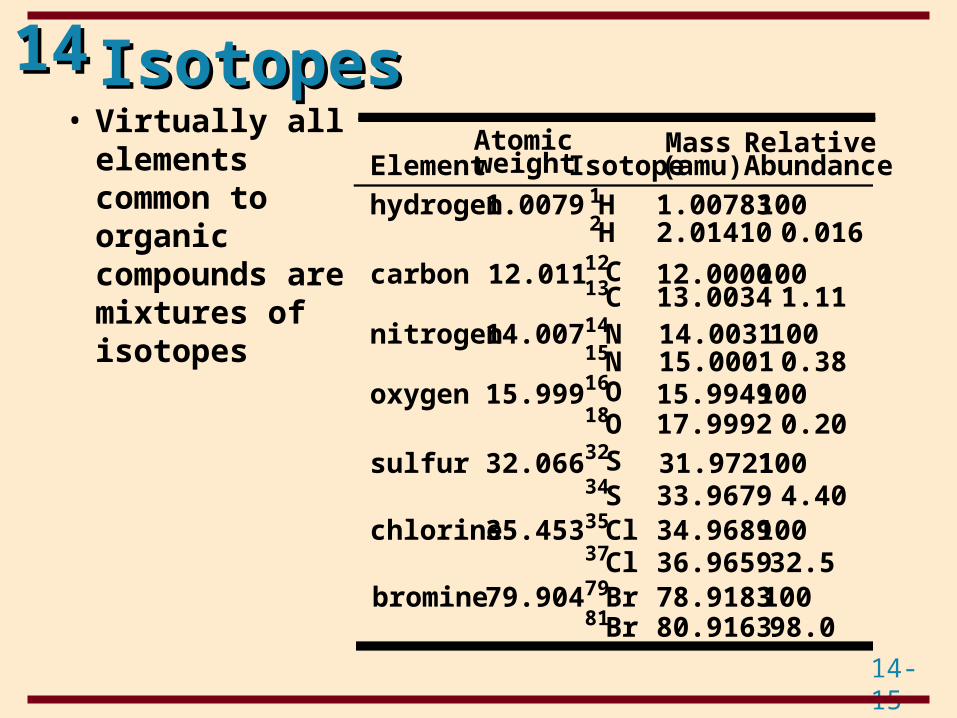
1414 IsotopesIsotopes• Virtually all
elements common to organic compounds are mixtures of isotopes 0.3815.0001
10014.00311.1113.0034
10012.0000
0.016100
2.014101.00783
Mass(amu)
15N14N
12C13C
2H1H
14.007
12.011
1.0079
nitrogen
carbon
hydrogen
Relative AbundanceIsotopeElement
Atomicweight
98.080.916310078.918332.536.9659
10034.96894.4033.9679
10031.97210.2017.9992
10015.9949
35Cl
81Br
37Cl79Br
32S34S
16O18O
79.904
35.453
32.066
15.999
bromine
chlorine
sulfur
oxygen
14-16
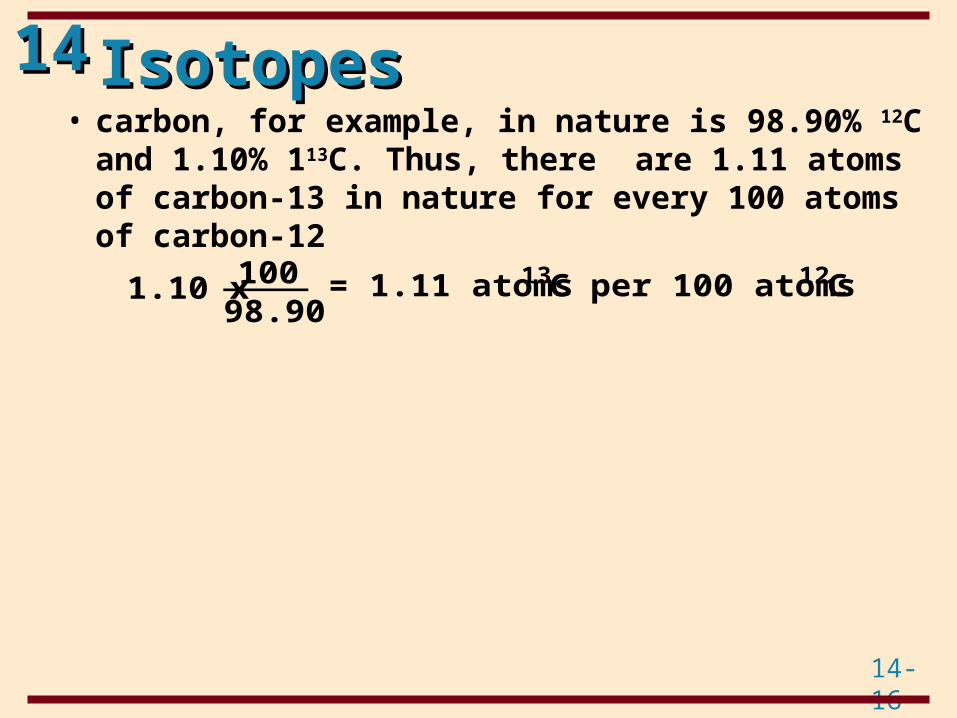
1414 IsotopesIsotopes• carbon, for example, in nature is 98.90% 12C and 1.10%
113C. Thus, there are 1.11 atoms of carbon-13 in nature for every 100 atoms of carbon-12
1.10 x 10098.90
= 1.11 atoms 13C per 100 atoms 12C
14-17
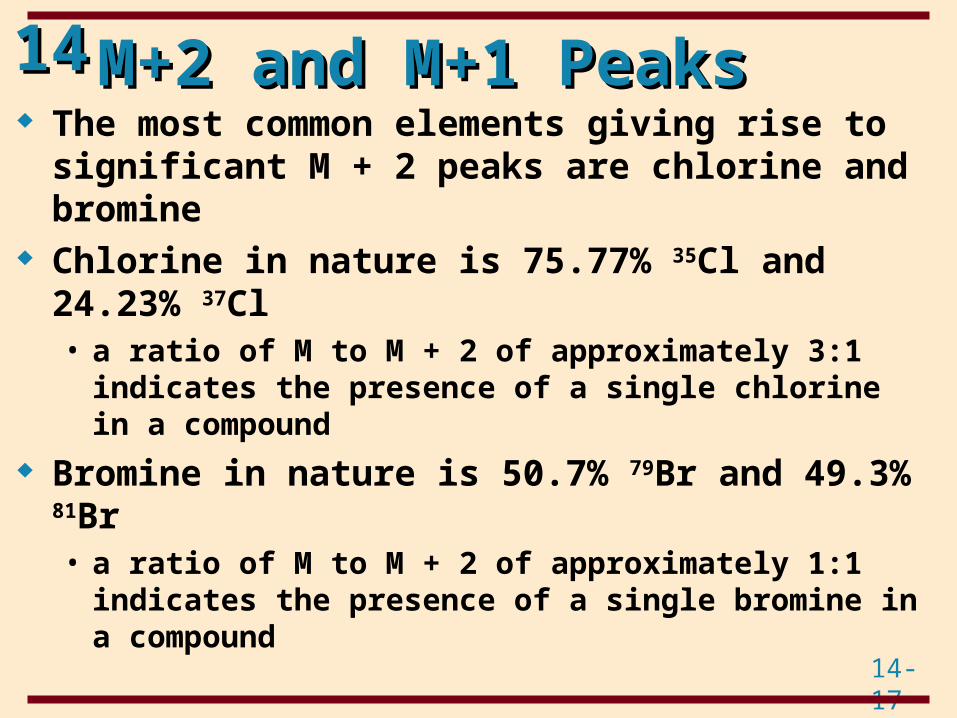
1414 M+2 and M+1 PeaksM+2 and M+1 Peaks The most common elements giving rise to
significant M + 2 peaks are chlorine and bromine Chlorine in nature is 75.77% 35Cl and 24.23% 37Cl • a ratio of M to M + 2 of approximately 3:1 indicates the
presence of a single chlorine in a compound
Bromine in nature is 50.7% 79Br and 49.3% 81Br• a ratio of M to M + 2 of approximately 1:1 indicates the
presence of a single bromine in a compound
14-18
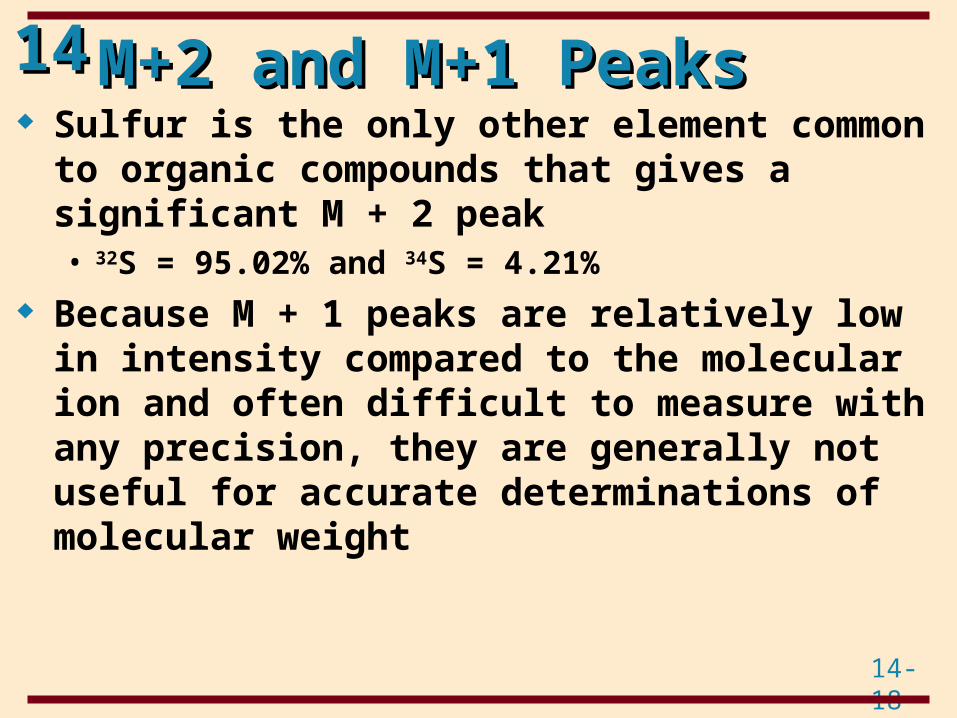
1414 M+2 and M+1 PeaksM+2 and M+1 Peaks Sulfur is the only other element common to
organic compounds that gives a significant M + 2 peak• 32S = 95.02% and 34S = 4.21%
Because M + 1 peaks are relatively low in intensity compared to the molecular ion and often difficult to measure with any precision, they are generally not useful for accurate determinations of molecular weight
14-19
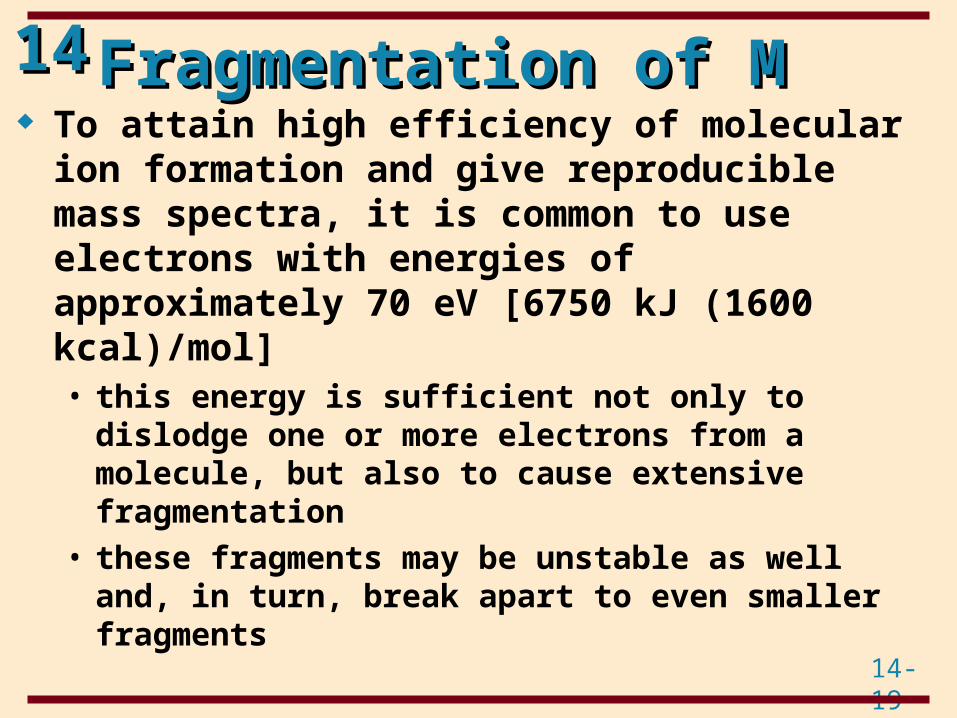
1414 Fragmentation of MFragmentation of M To attain high efficiency of molecular ion
formation and give reproducible mass spectra, it is common to use electrons with energies of approximately 70 eV [6750 kJ (1600 kcal)/mol]• this energy is sufficient not only to dislodge one or
more electrons from a molecule, but also to cause extensive fragmentation
• these fragments may be unstable as well and, in turn, break apart to even smaller fragments
14-20
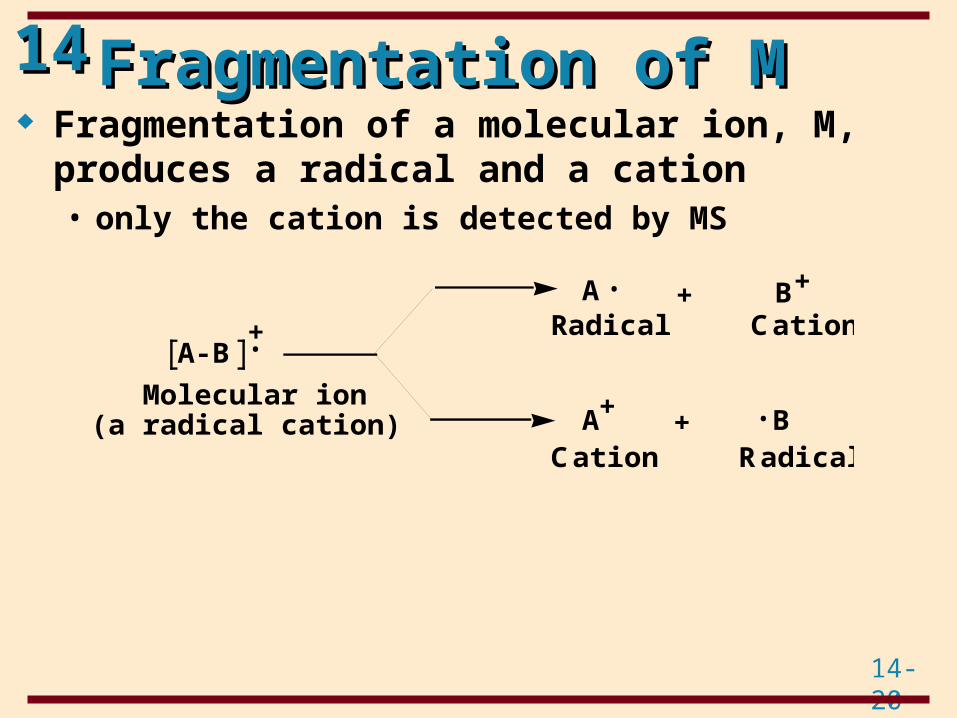
1414 Fragmentation of MFragmentation of M Fragmentation of a molecular ion, M, produces a
radical and a cation• only the cation is detected by MS
•+
Molecular ion(a radical cation)
+ B•A
A •B+
+
+
Cation Radical
Radical CationA-B
14-21
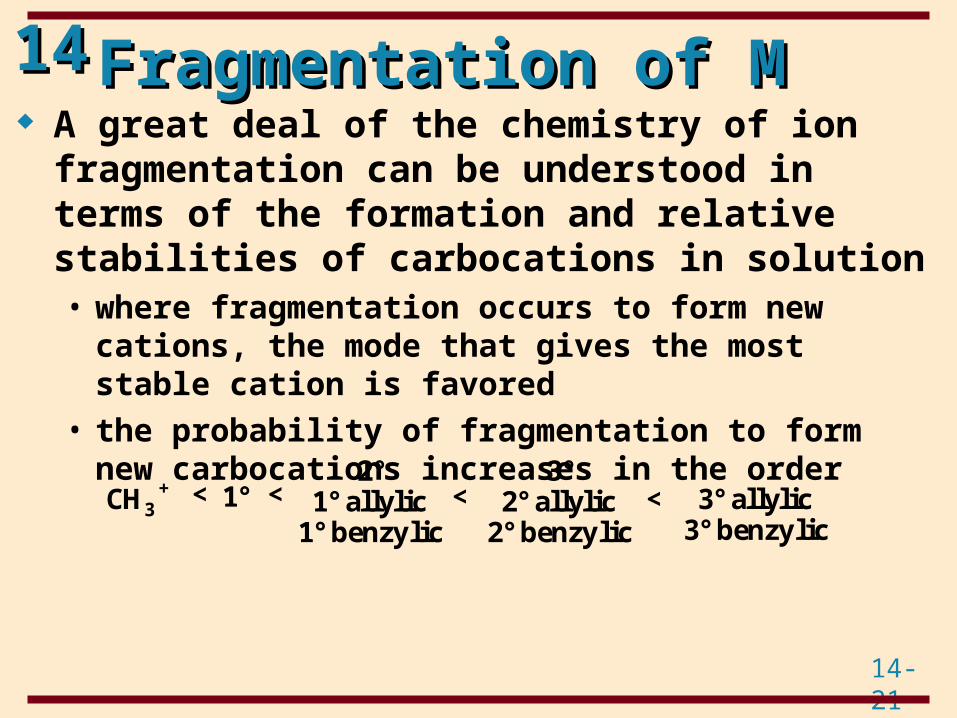
1414 Fragmentation of MFragmentation of M A great deal of the chemistry of ion
fragmentation can be understood in terms of the formation and relative stabilities of carbocations in solution• where fragmentation occurs to form new cations, the
mode that gives the most stable cation is favored• the probability of fragmentation to form new
carbocations increases in the order
CH3+ 1°
2°1° allylic
1° benzylic< < <
3°2° allylic
2° benzylic< 3° allylic
3° benzylic
14-22
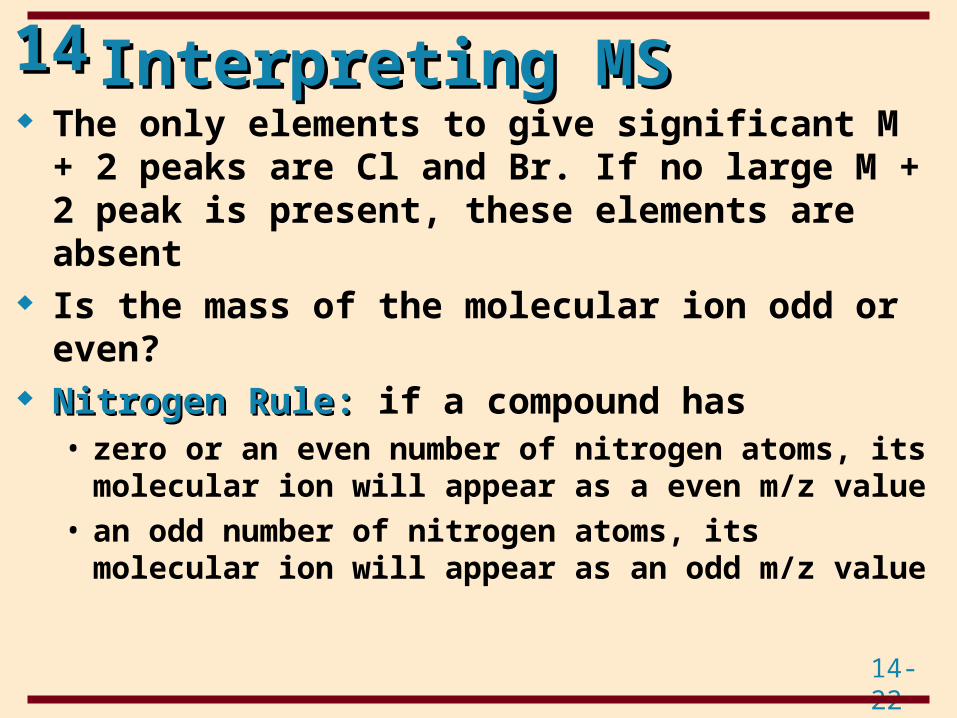
1414 Interpreting MSInterpreting MS The only elements to give significant M + 2 peaks
are Cl and Br. If no large M + 2 peak is present, these elements are absent
Is the mass of the molecular ion odd or even? Nitrogen Rule:Nitrogen Rule: if a compound has• zero or an even number of nitrogen atoms, its
molecular ion will appear as a even m/z value• an odd number of nitrogen atoms, its molecular ion
will appear as an odd m/z value
14-23
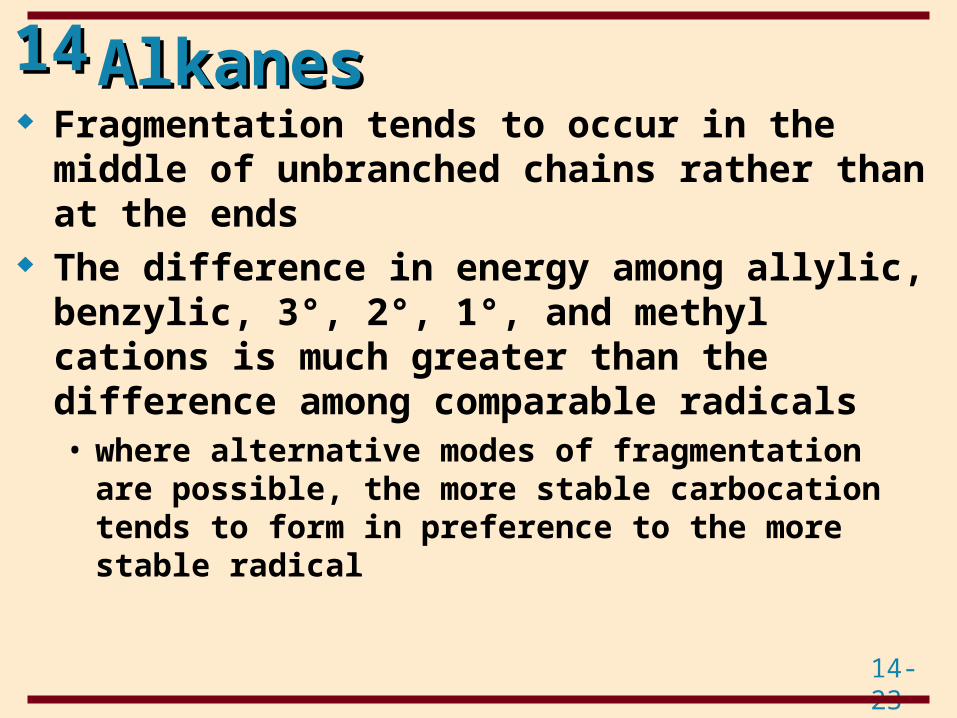
1414 AlkanesAlkanes Fragmentation tends to occur in the middle of
unbranched chains rather than at the ends The difference in energy among allylic, benzylic,
3°, 2°, 1°, and methyl cations is much greater than the difference among comparable radicals• where alternative modes of fragmentation are
possible, the more stable carbocation tends to form in preference to the more stable radical
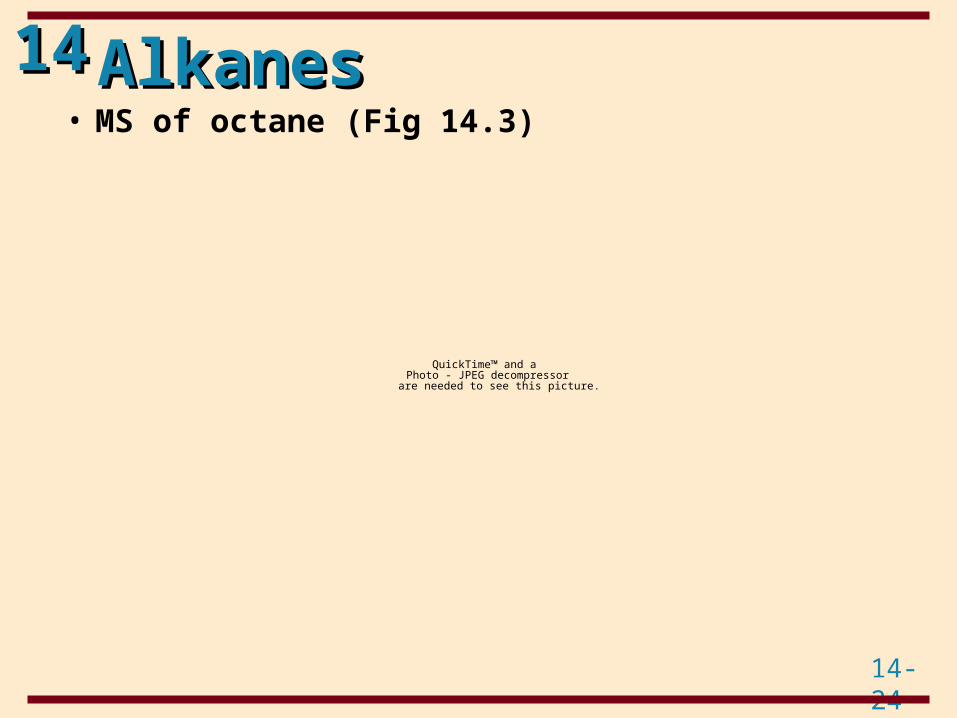
14-24
1414 AlkanesAlkanes• MS of octane (Fig 14.3)
QuickTime™ and aPhoto - JPEG decompressor
are needed to see this picture.
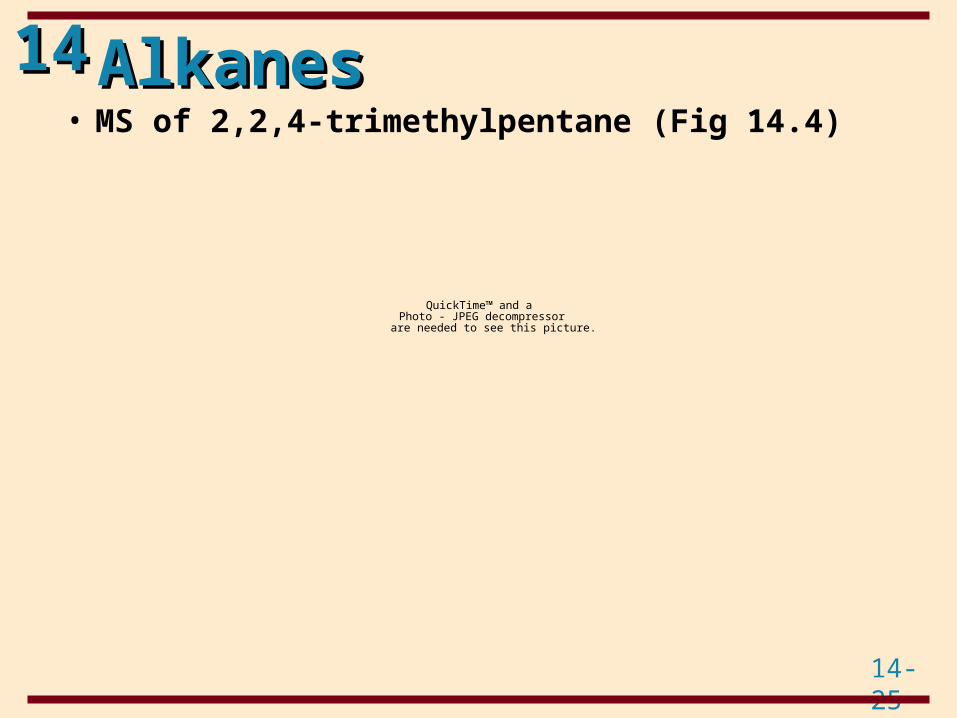
14-25
1414 AlkanesAlkanes• MS of 2,2,4-trimethylpentane (Fig 14.4)
QuickTime™ and aPhoto - JPEG decompressor
are needed to see this picture.
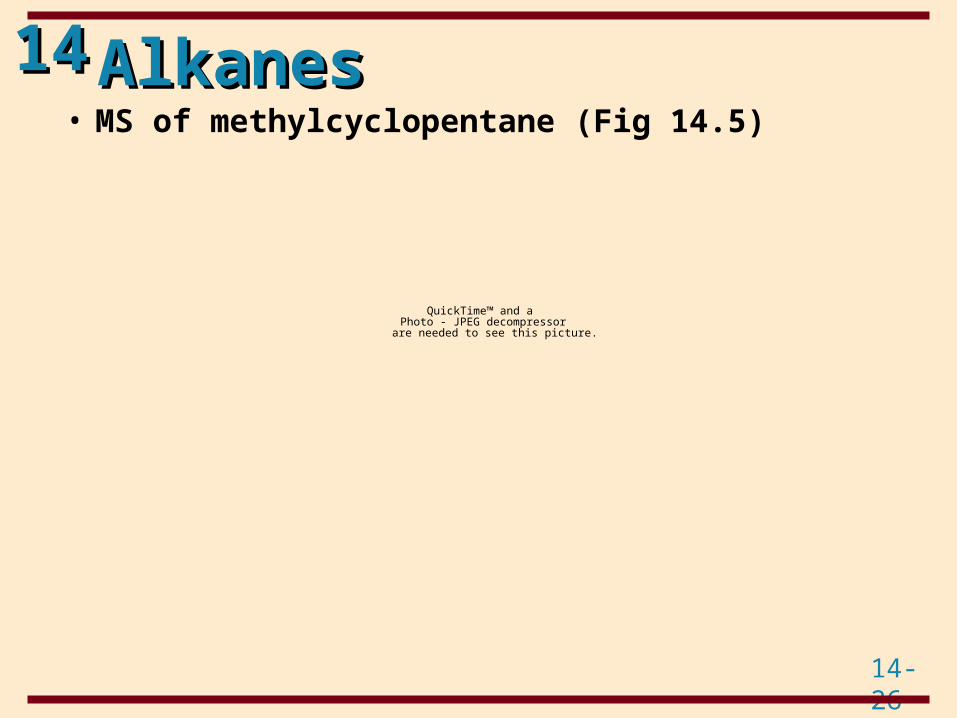
14-26
1414 AlkanesAlkanes• MS of methylcyclopentane (Fig 14.5)
QuickTime™ and aPhoto - JPEG decompressor
are needed to see this picture.
14-27
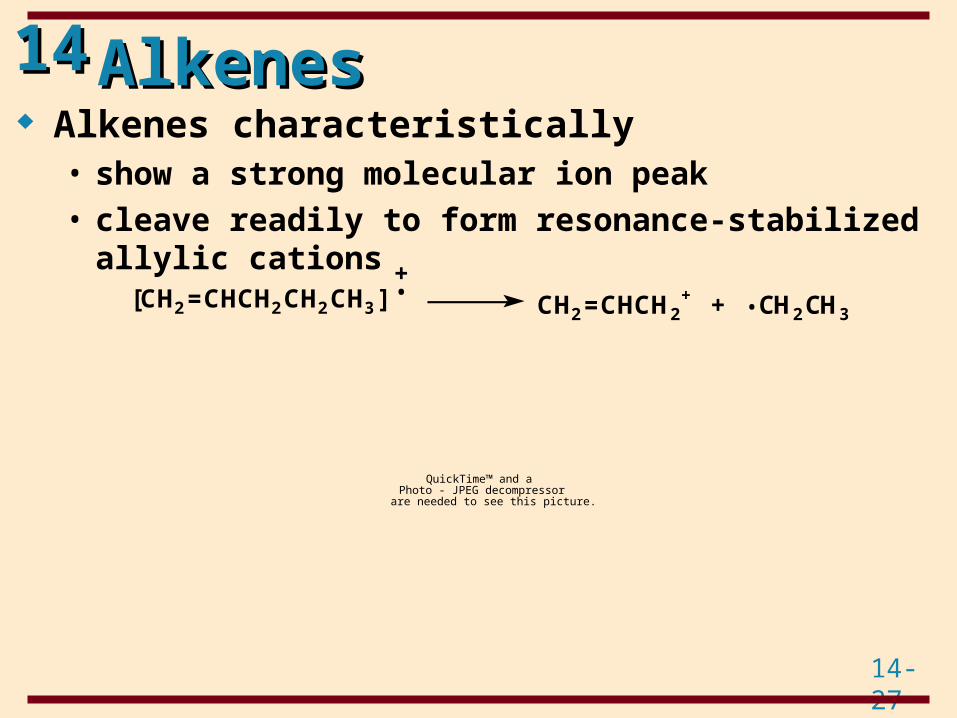
1414 AlkenesAlkenes Alkenes characteristically • show a strong molecular ion peak• cleave readily to form resonance-stabilized allylic
cations[CH2=CHCH2CH2CH3] CH2=CHCH2
+ + •CH2CH3
+•
QuickTime™ and aPhoto - JPEG decompressor
are needed to see this picture.
14-28
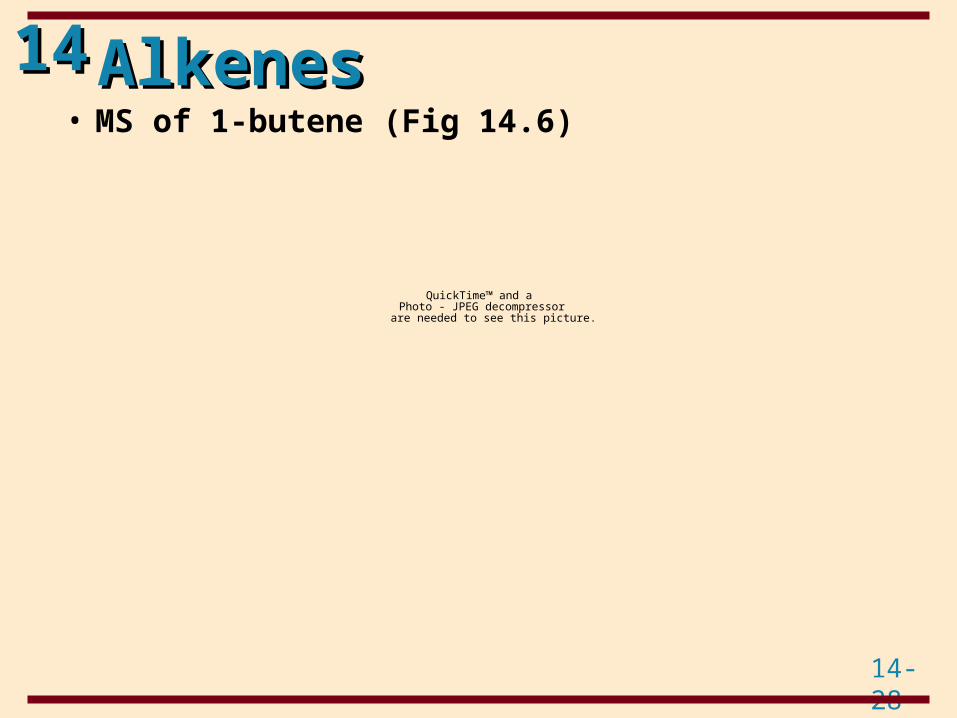
1414 AlkenesAlkenes• MS of 1-butene (Fig 14.6)
QuickTime™ and aPhoto - JPEG decompressor
are needed to see this picture.
14-29
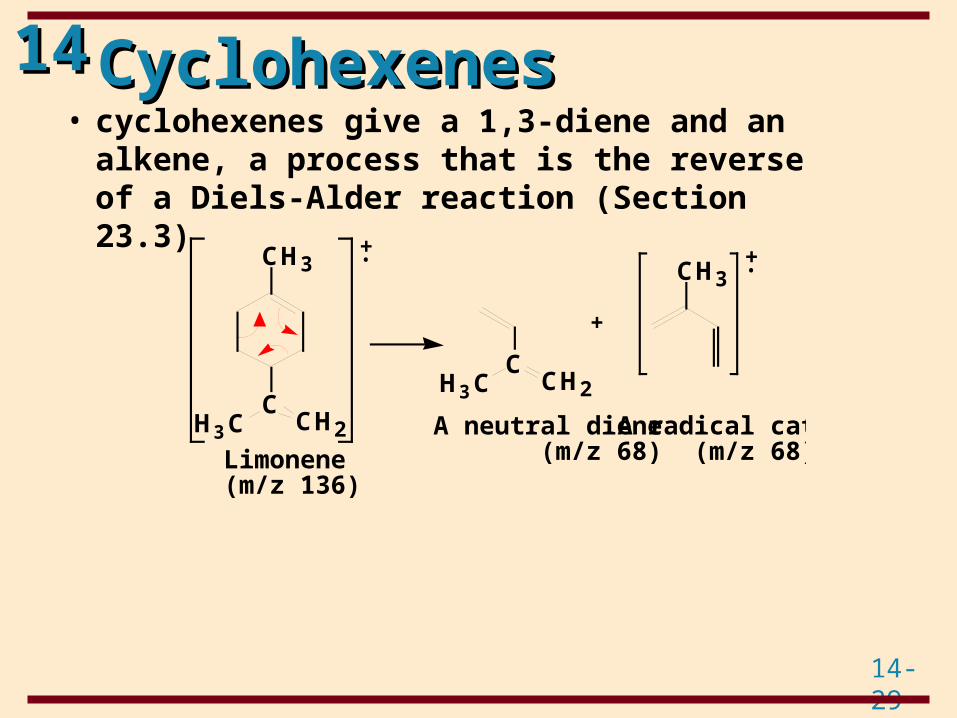
1414 CyclohexenesCyclohexenes• cyclohexenes give a 1,3-diene and an alkene, a
process that is the reverse of a Diels-Alder reaction (Section 23.3)
A radical cation (m/z 68)
A neutral diene (m/z 68)Limonene
(m/z 136)
+•
•+
+
CH3
CH3C CH2
CCH2H3C
CH3
14-30
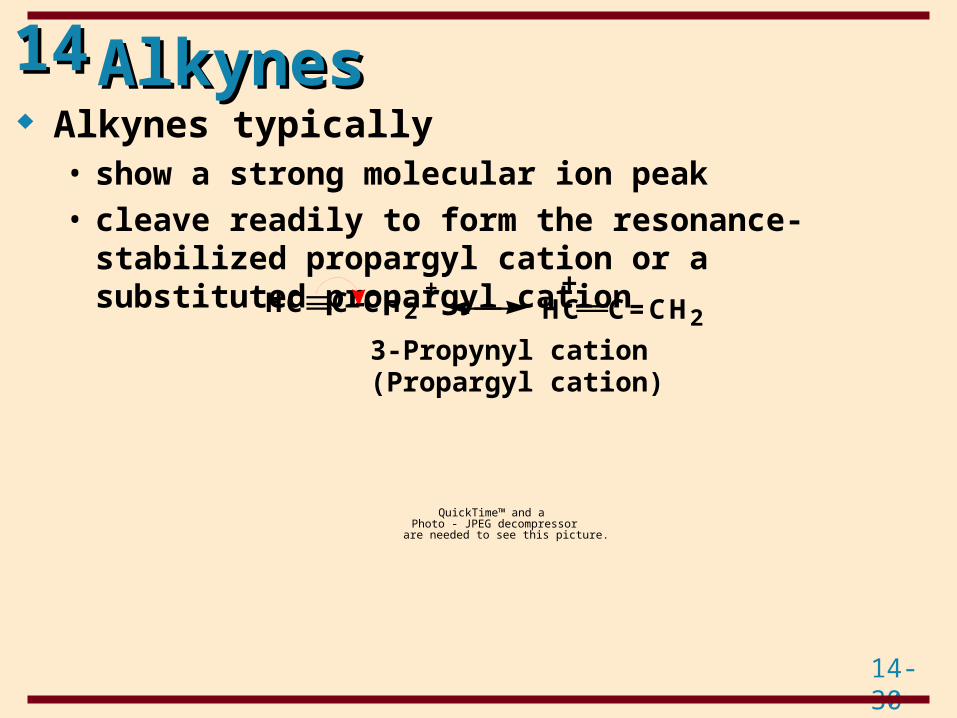
1414 AlkynesAlkynes Alkynes typically • show a strong molecular ion peak• cleave readily to form the resonance-stabilized
propargyl cation or a substituted propargyl cation+
3-Propynyl cation(Propargyl cation)
HC C-CH2+
HC C=CH2
QuickTime™ and aPhoto - JPEG decompressor
are needed to see this picture.
14-31
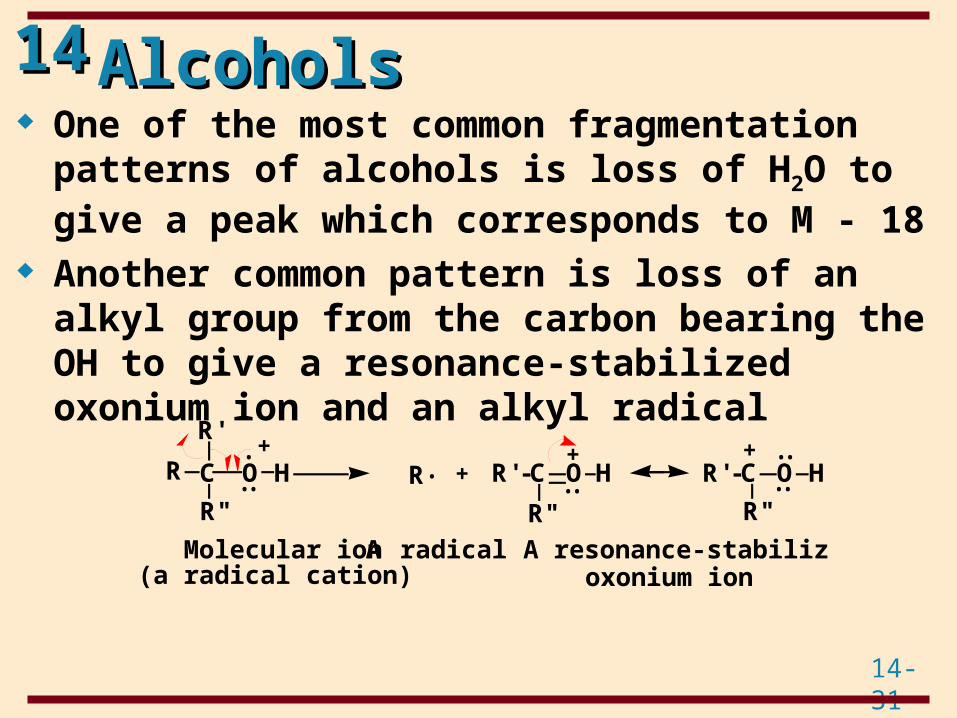
1414 AlcoholsAlcohols One of the most common fragmentation patterns
of alcohols is loss of H2O to give a peak which corresponds to M - 18
Another common pattern is loss of an alkyl group from the carbon bearing the OH to give a resonance-stabilized oxonium ion and an alkyl radical
•
Molecular ion(a radical cation)
A radical
••
•++O HC R
••
••
+
••
+R'-C O HO HR'-C
A resonance-stabilized oxonium ion
R
R" R"
R'
R"
14-32
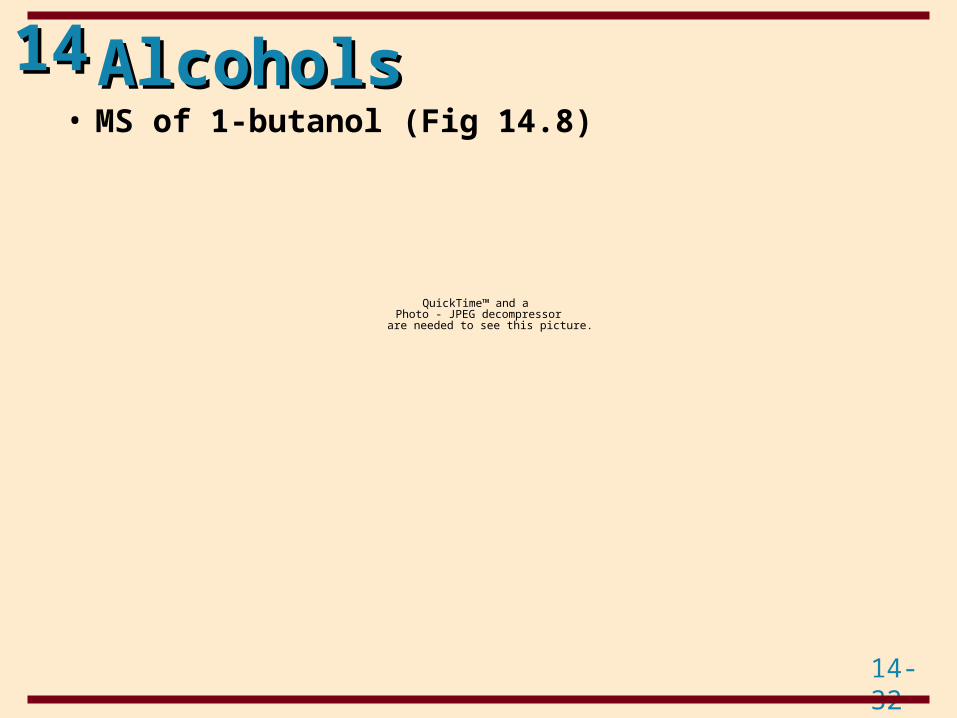
1414 AlcoholsAlcohols• MS of 1-butanol (Fig 14.8)
QuickTime™ and aPhoto - JPEG decompressor
are needed to see this picture.
14-33
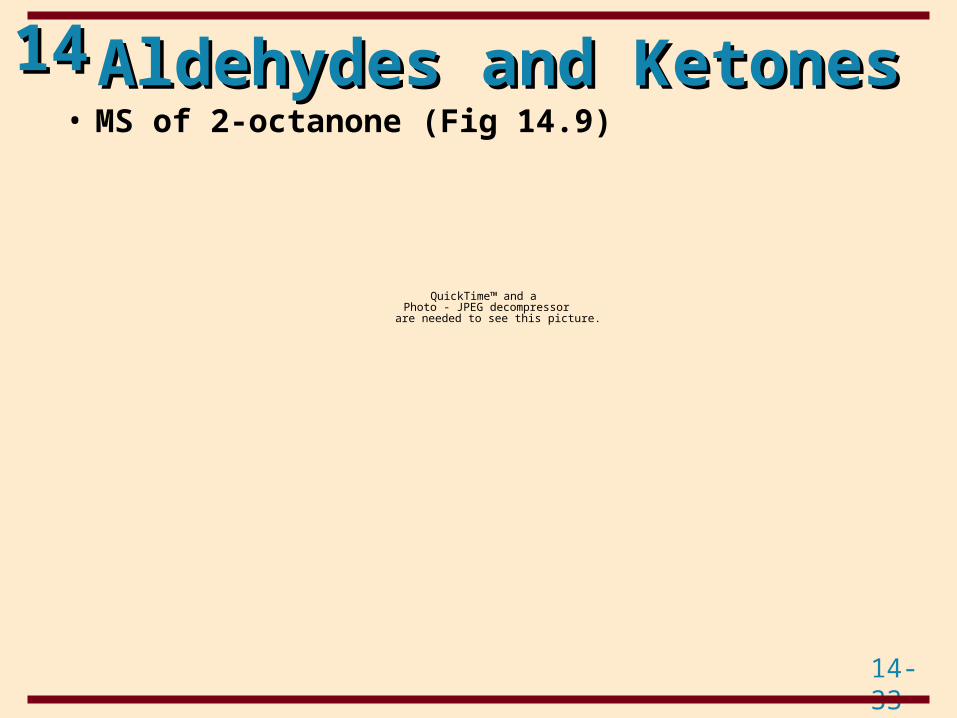
1414 Aldehydes and KetonesAldehydes and Ketones• MS of 2-octanone (Fig 14.9)
QuickTime™ and aPhoto - JPEG decompressor
are needed to see this picture.
14-34
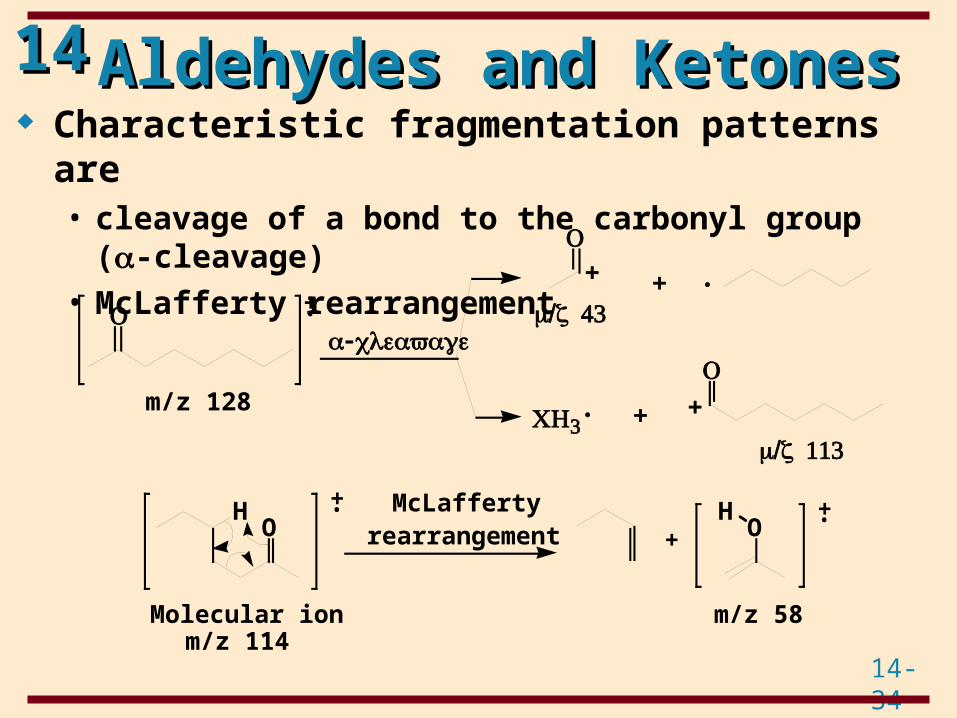
1414 Aldehydes and KetonesAldehydes and Ketones Characteristic fragmentation patterns are • cleavage of a bond to the carbonyl group (-cleavage)• McLafferty rearrangement
m/z 128
+•-cleavage
/ 43m z+
•
+
+
/ 113m zCH3
O
O
•
O
+
•+
m/z 58
McLaffertyrearrangement
Molecular ionm/z 114
•+O
HO
H+
14-35
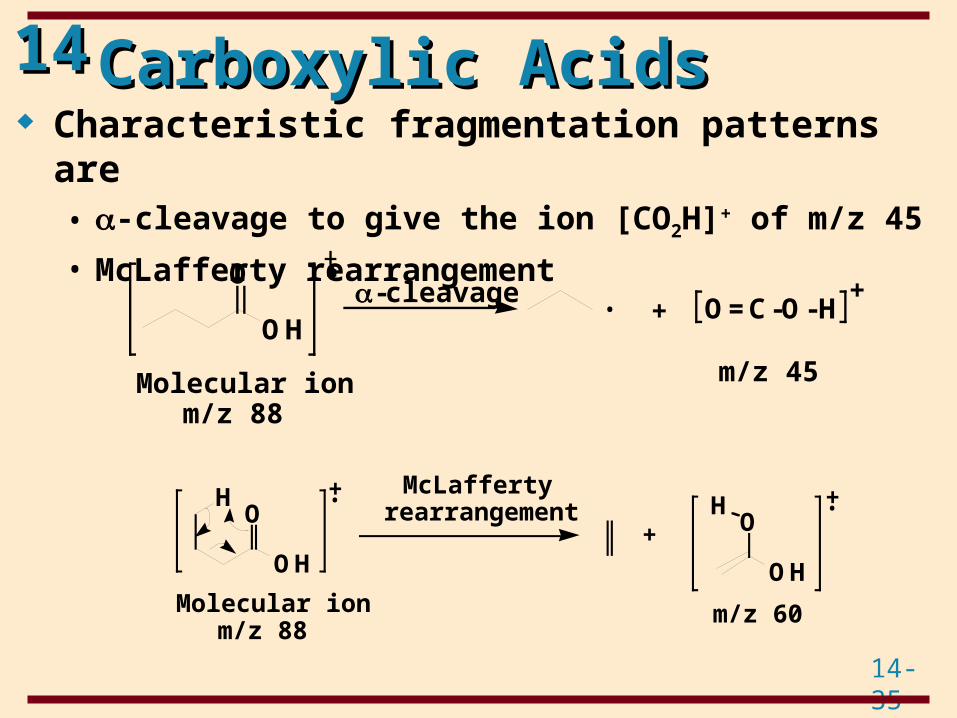
1414 Carboxylic AcidsCarboxylic Acids Characteristic fragmentation patterns are • -cleavage to give the ion [CO2H]+ of m/z 45
• McLafferty rearrangement
-cleavage• +
m/z 45
O=C-O-HOH
O
Molecular ionm/z 88
+
•+•+
+
McLaffertyrearrangement
m/z 60
OH
OH
OH
OHMolecular ion
m/z 88
14-36
1414 Carboxylic AcidsCarboxylic Acids• MS of butanoic acid (Fig 14.10)
QuickTime™ and aPhoto - JPEG decompressor
are needed to see this picture.
14-37
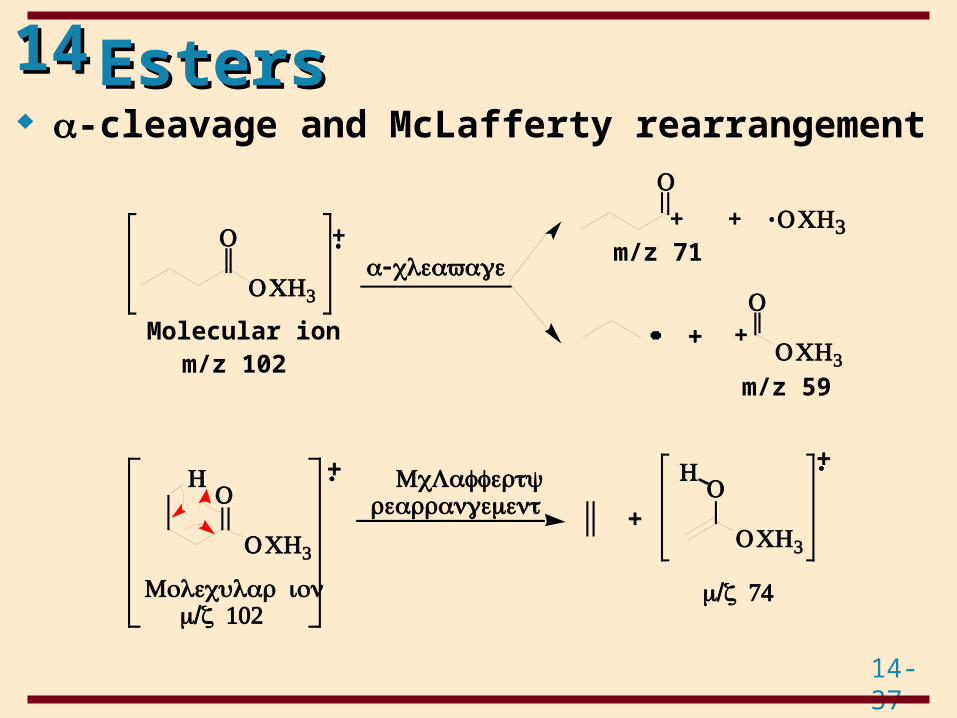
1414 EstersEsters -cleavage and McLafferty rearrangement
+
+
•+•+ m/z 71
m/z 59
Molecular ionm/z 102
-cleavage
OCH3
OCH3
O
O
OCH3
O+
/ 74m z
McLaffertyrearrangement +
+•+•
O
OCH3
H OH
OCH3
Molecular ion/ 102m z
14-38
1414 EstersEsters• MS of methyl butanoate (Fig 14.11)
QuickTime™ and aPhoto - JPEG decompressor
are needed to see this picture.
14-39
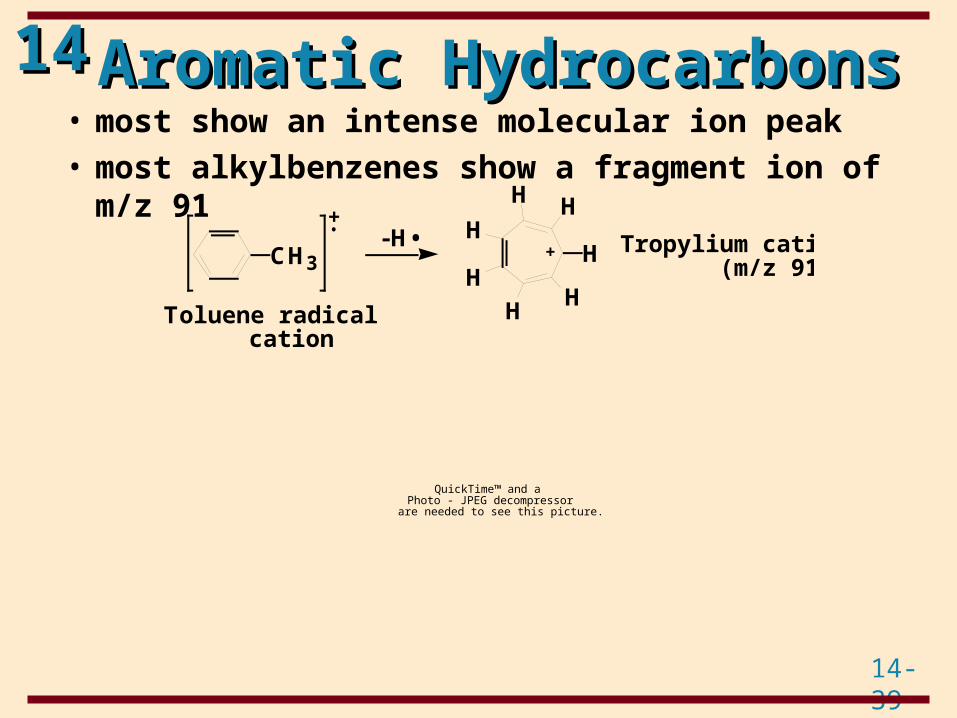
1414 Aromatic HydrocarbonsAromatic Hydrocarbons• most show an intense molecular ion peak• most alkylbenzenes show a fragment ion of m/z 91
QuickTime™ and aPhoto - JPEG decompressor
are needed to see this picture.
+•
+ Tropylium cation (m/z 91)
Toluene radical cation
CH3 H
HH
H
HH H
-H•
14-40
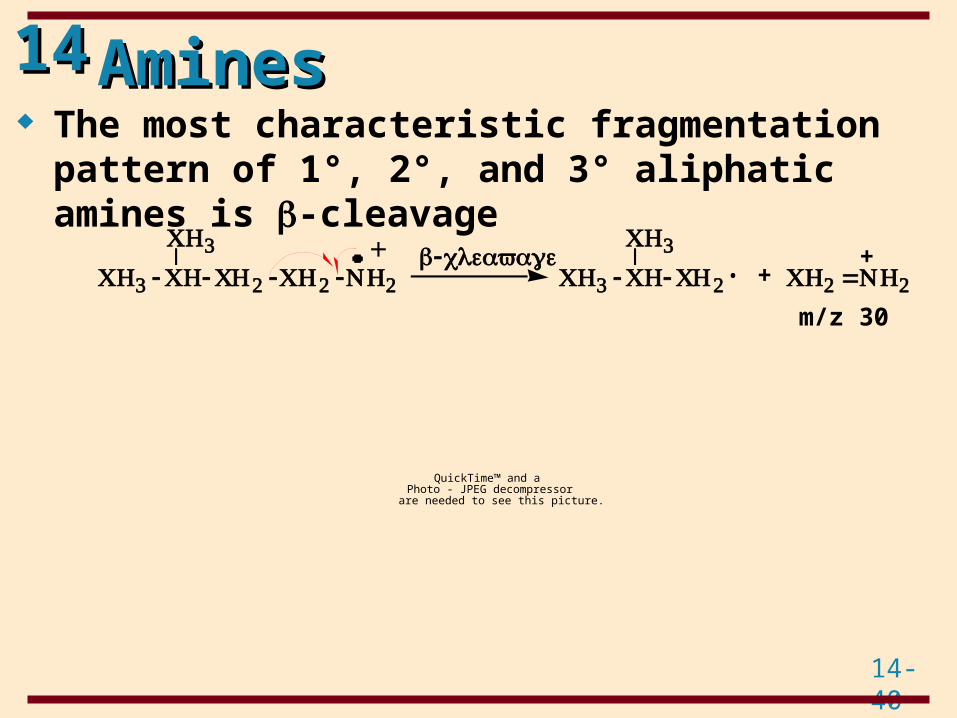
1414 AminesAmines The most characteristic fragmentation pattern of
1°, 2°, and 3° aliphatic amines is -cleavage
QuickTime™ and aPhoto - JPEG decompressor
are needed to see this picture.
m/z 30
++•
-cleavageCH3 CH3
CH3 -CH-CH2 -CH2 -NH2 CH3 -CH-CH2 CH2 =NH2
14-41
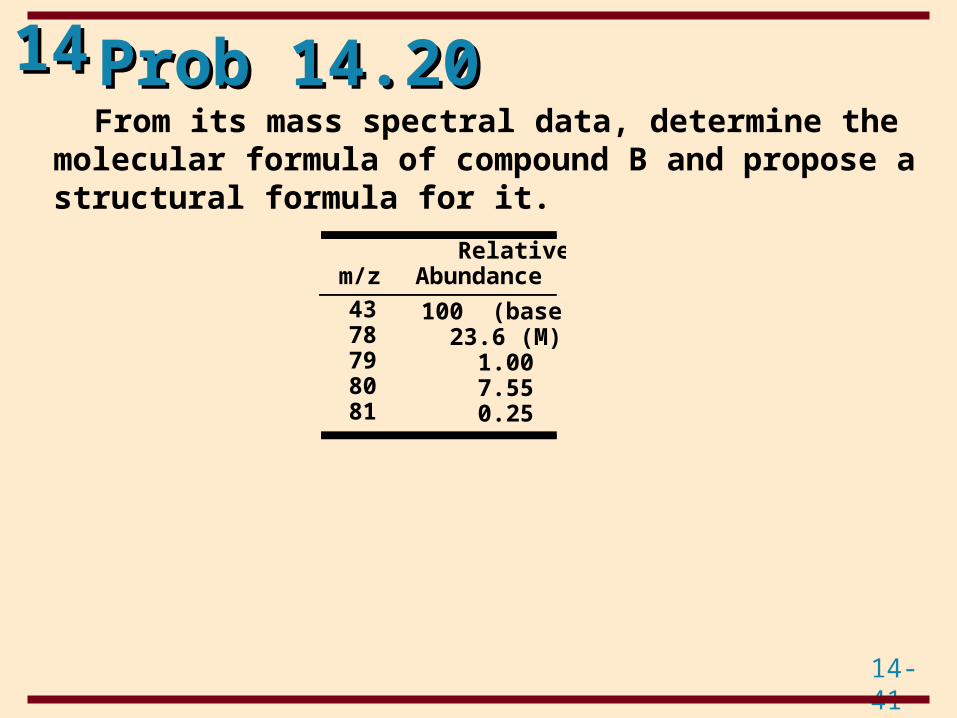
1414 Prob 14.20Prob 14.20 From its mass spectral data, determine the molecular
formula of compound B and propose a structural formula for it.
43 78798081
m/z RelativeAbundance
100 (base) 23.6 (M) 1.00 7.55 0.25
14-42
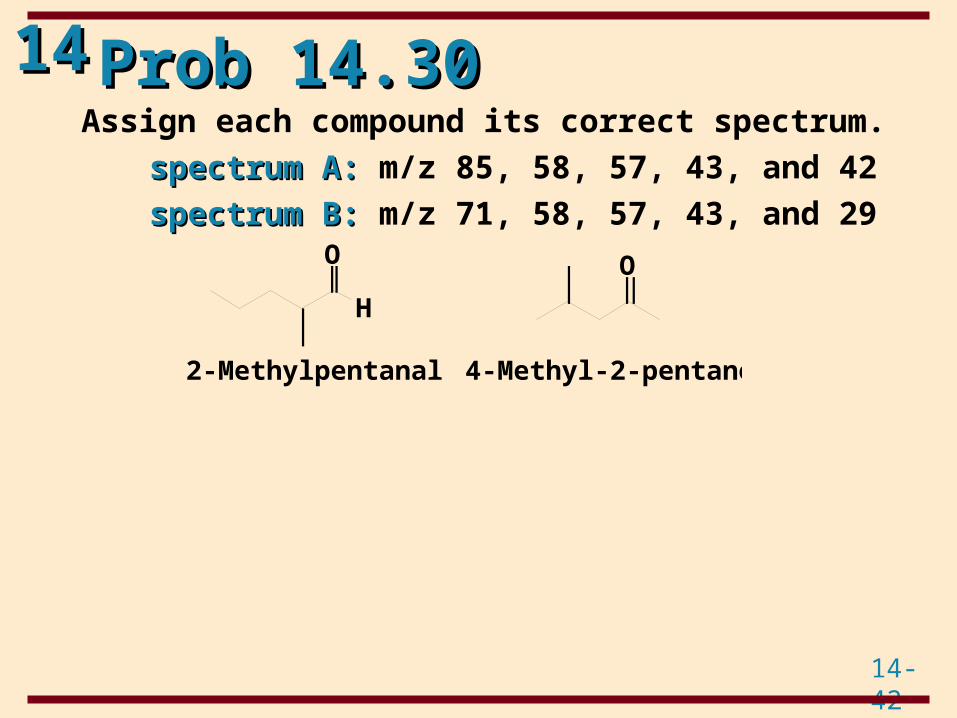
1414 Prob 14.30Prob 14.30 Assign each compound its correct spectrum.
spectrum A:spectrum A: m/z 85, 58, 57, 43, and 42
spectrum B:spectrum B: m/z 71, 58, 57, 43, and 29
H
O
2-Methylpentanal
O
4-Methyl-2-pentanone
14-43
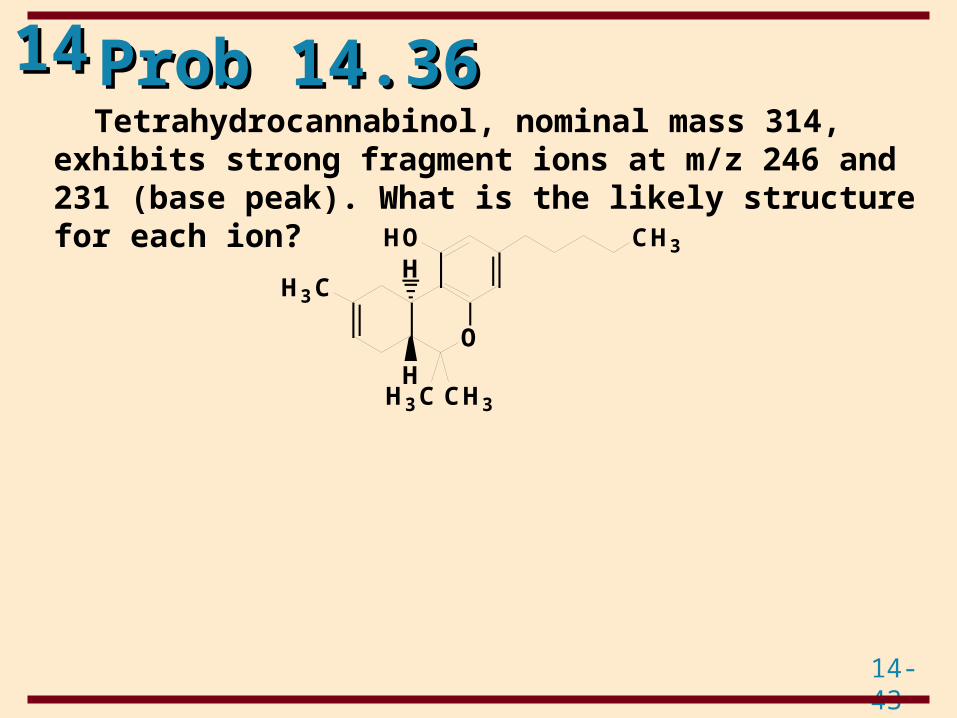
1414 Prob 14.36Prob 14.36 Tetrahydrocannabinol, nominal mass 314, exhibits strong
fragment ions at m/z 246 and 231 (base peak). What is the likely structure for each ion?
O
CH3
H3CH
HH3C CH3
HO
14-44
1414
Mass Mass SpectrometrySpectrometry
End Chapter 14End Chapter 14
Related Documents