1 TRENDLINES AND MOVING AVERAGES TRENDLINES MOVING AVERAGES

1 TRENDLINES AND MOVING AVERAGES TRENDLINES MOVING AVERAGES.
Jan 04, 2016
Welcome message from author
This document is posted to help you gain knowledge. Please leave a comment to let me know what you think about it! Share it to your friends and learn new things together.
Transcript
1
TRENDLINES AND MOVING AVERAGES
TRENDLINES
MOVING AVERAGES
2
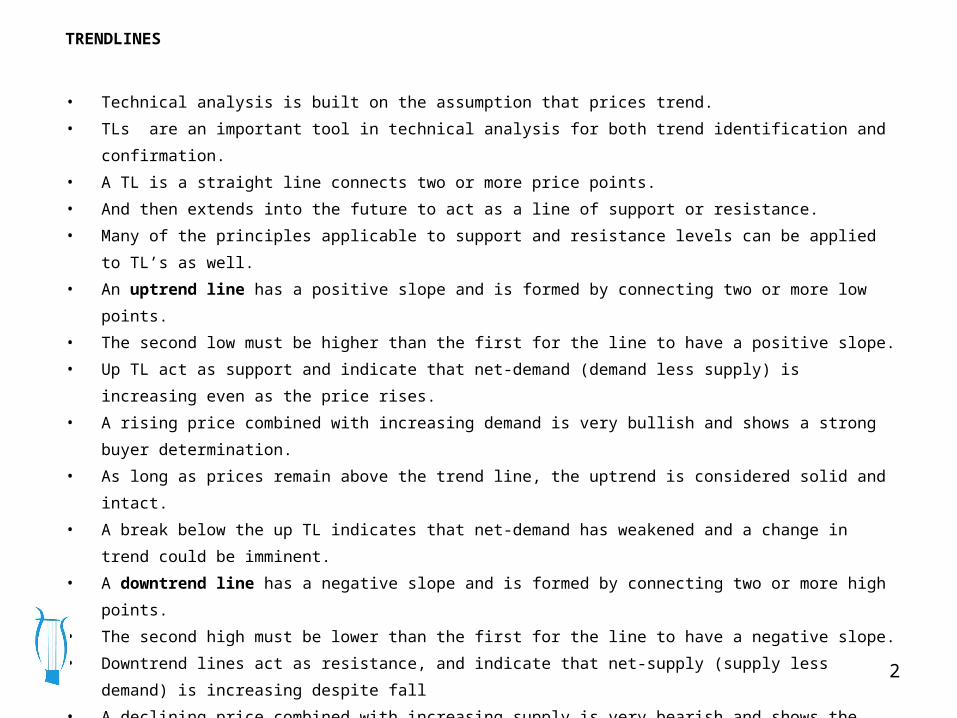
TRENDLINES
• Technical analysis is built on the assumption that prices trend.
• TLs are an important tool in technical analysis for both trend identification and confirmation.
• A TL is a straight line connects two or more price points.
• And then extends into the future to act as a line of support or resistance.
• Many of the principles applicable to support and resistance levels can be applied to TL’s as well.
• An uptrend line has a positive slope and is formed by connecting two or more low points.
• The second low must be higher than the first for the line to have a positive slope.
• Up TL act as support and indicate that net-demand (demand less supply) is increasing even as the
price rises.
• A rising price combined with increasing demand is very bullish and shows a strong buyer
determination.
• As long as prices remain above the trend line, the uptrend is considered solid and intact.
• A break below the up TL indicates that net-demand has weakened and a change in trend could be
imminent.
• A downtrend line has a negative slope and is formed by connecting two or more high points.
• The second high must be lower than the first for the line to have a negative slope.
• Downtrend lines act as resistance, and indicate that net-supply (supply less demand) is increasing
despite fall
• A declining price combined with increasing supply is very bearish and shows the strong resolve of
the sellers.
• As long as prices remain below the downtrend line, the downtrend is considered solid and intact.
• A break above the down TL indicates that net-supply is decreasing and a change of trend could be
imminent.
• The more points used to draw the trend line, the more validity attached to the support or
resistance levels.
• Sometimes the lows or highs just don't match up, and it is best not to force the issue.
• Two point confirm and the third point confirms the validity.
3
TRENDLINES
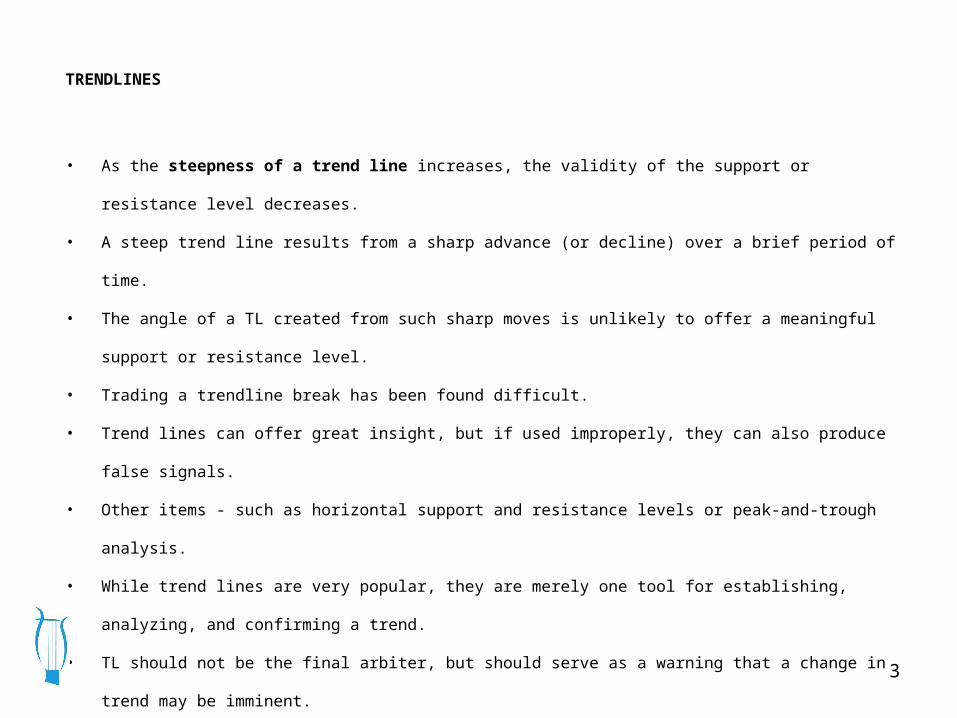
• As the steepness of a trend line increases, the validity of the support or resistance level
decreases.
• A steep trend line results from a sharp advance (or decline) over a brief period of time.
• The angle of a TL created from such sharp moves is unlikely to offer a meaningful support or
resistance level.
• Trading a trendline break has been found difficult.
• Trend lines can offer great insight, but if used improperly, they can also produce false signals.
• Other items - such as horizontal support and resistance levels or peak-and-trough analysis.
• While trend lines are very popular, they are merely one tool for establishing, analyzing, and
confirming a trend.
• TL should not be the final arbiter, but should serve as a warning that a change in trend may be
imminent.
• By using TL breaks for warnings, traders can pay closer attention to other signals for a potential
change.
4
Dec Mar Jun Sep Dec Mar Jun Sep Dec Mar Jun Sep2004 2005 2006
PriceRON
8000
12000
14000
16000
18000
22000
24000
26000
28000
32000
34000
36000
38000
42000
44000
46000
48000
52000
10000
20000
30000
40000
50000
Q.BETFI, Last Trade, HiLoCl Bar
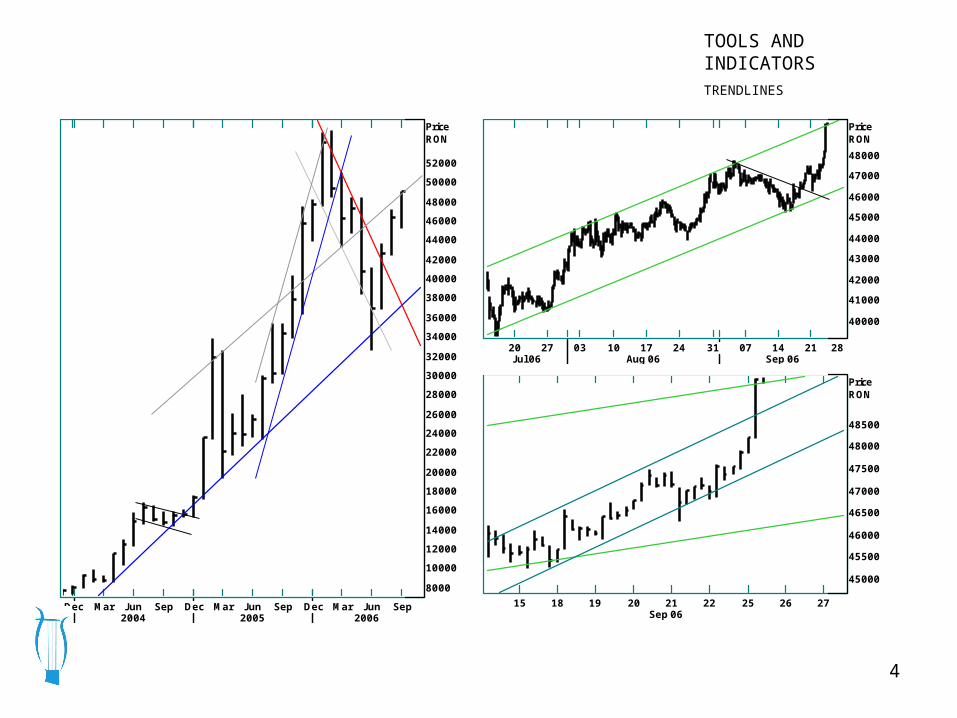
TOOLS AND INDICATORSTRENDLINES
20 27 03 10 17 24 31 07 14 21 28Jul 06 Aug 06 Sep 06
PriceRON
41000
42000
43000
44000
45000
46000
47000
48000
40000
Q.BETFI, Last Trade, HiLoCl Bar
15 18 19 20 21 22 25 26 27Sep 06
PriceRON
45500
46500
47500
48500
45000
46000
47000
48000
Q.BETFI, Last Trade, HiLoCl Bar
5
04 05 06 07 08 11 12 13 14 15 18 19Sep 06
PriceRON
45400
45600
45800
46200
46400
46600
46800
47200
47400
46000
47000
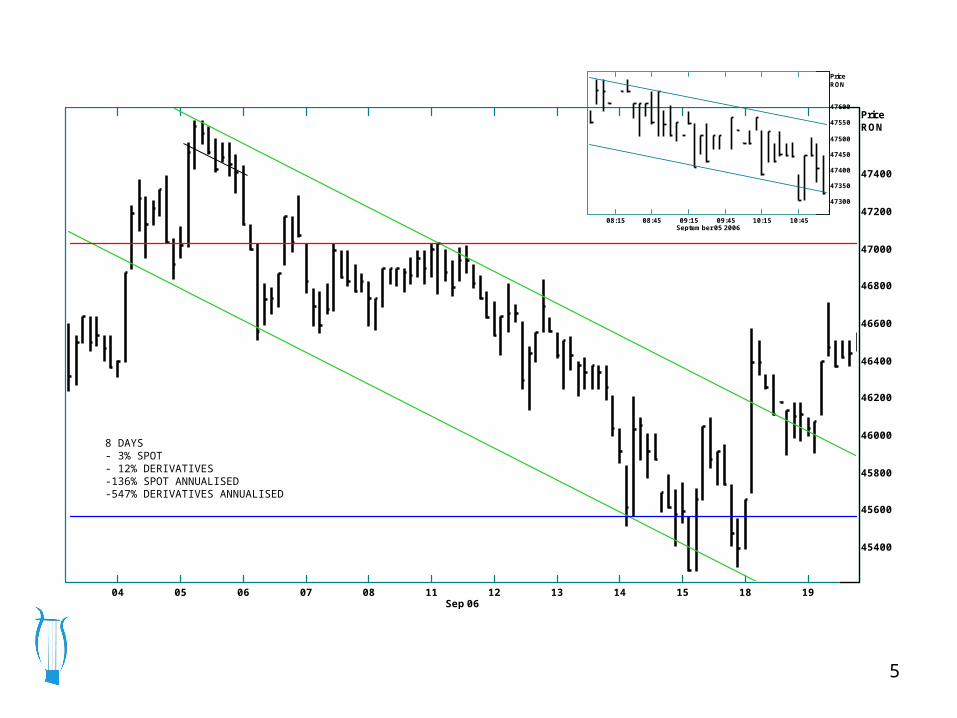
8 DAYS - 3% SPOT- 12% DERIVATIVES-136% SPOT ANNUALISED-547% DERIVATIVES ANNUALISED
08:15 08:45 09:15 09:45 10:15 10:45September 05 2006
PriceRON
47350
47450
47550
47300
47400
47500
47600
6
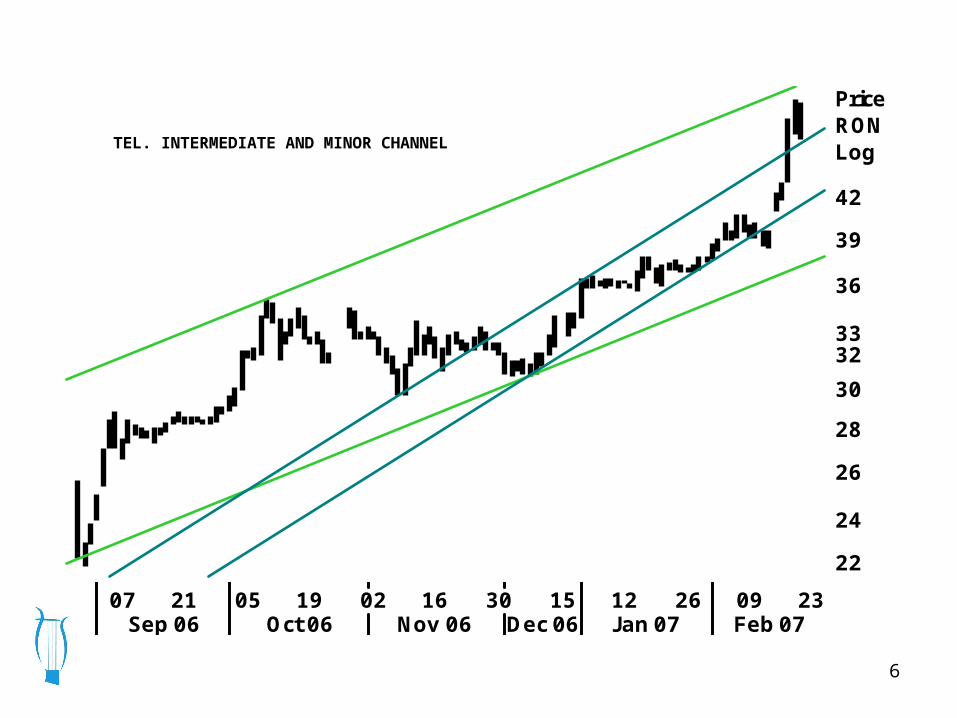
07 21 05 19 02 16 30 15 12 26 09 23Sep 06 Oct 06 Nov 06 Dec 06 Jan 07 Feb 07
PriceRONLog
33
36
39
42
22
24
26
28
32
30
TEL. INTERMEDIATE AND MINOR CHANNEL
7
8
9
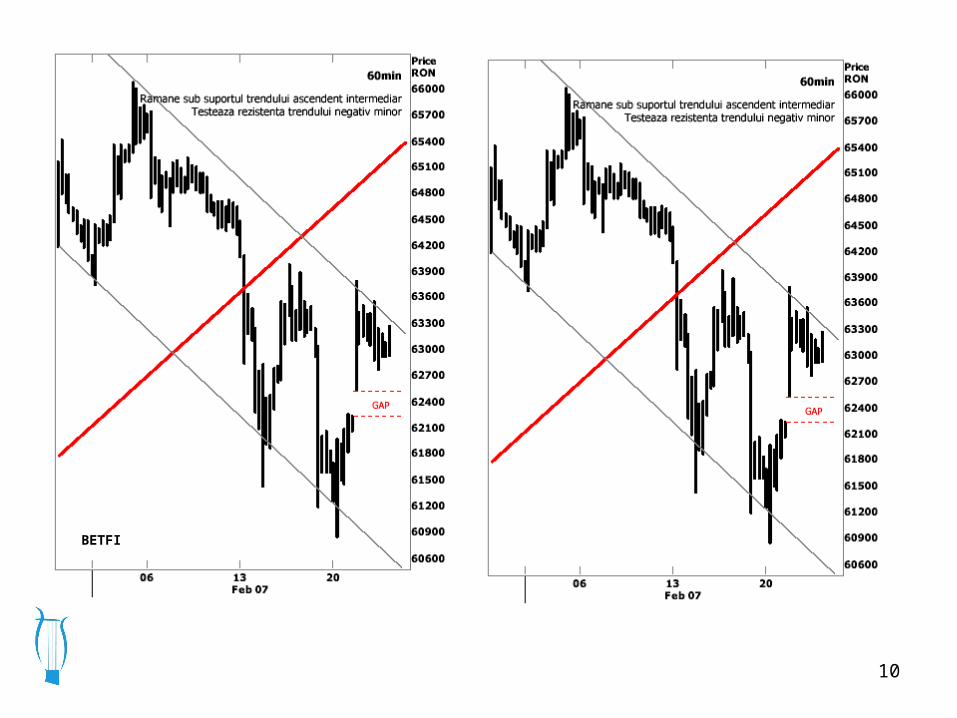
10
BETFI
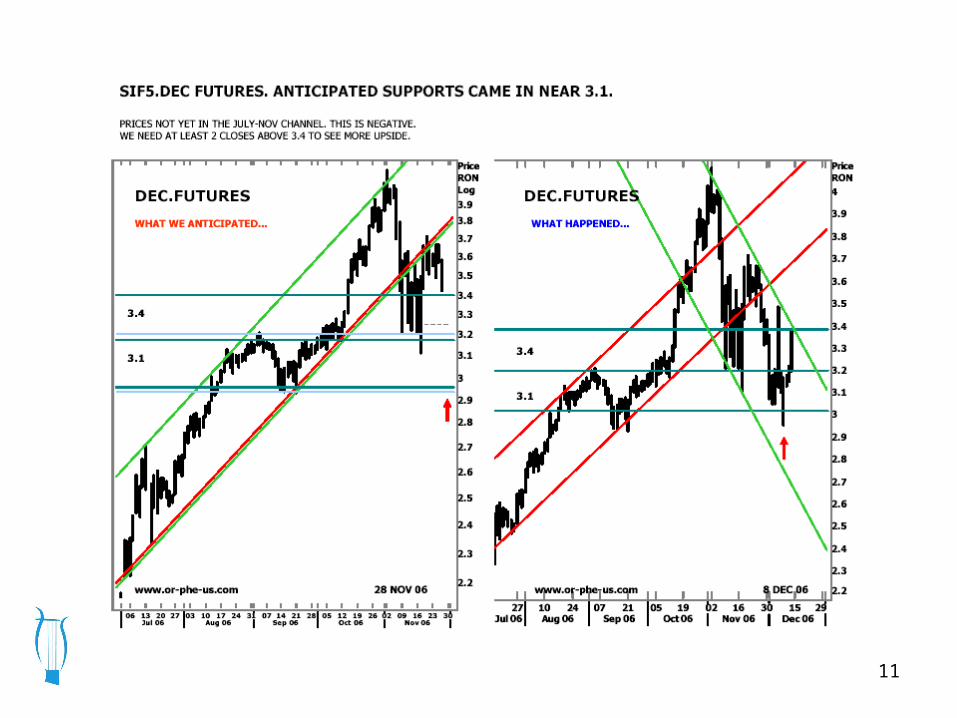
11
1292 93 94 95 96 97 98 99 2000 01 02 03 04 05 06 07
PriceUSDBblLog
30
40
50
60
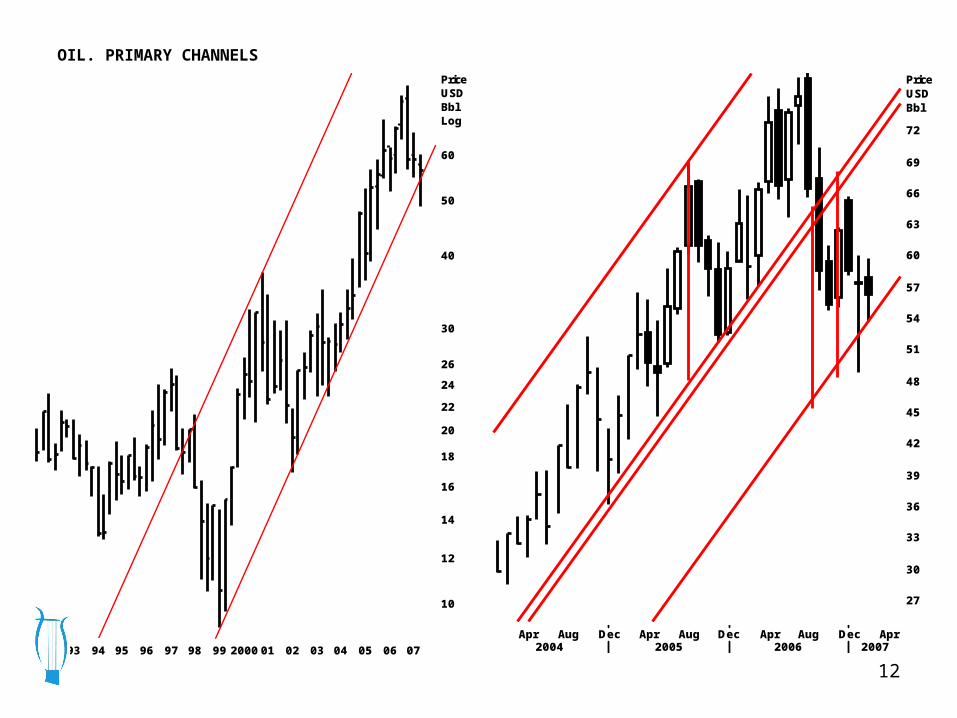
12
14
16
18
22
24
26
10
20
OIL. PRIMARY CHANNELS
Apr Aug Dec Apr Aug Dec Apr Aug Dec Apr2004 2005 2006 2007
PriceUSDBbl
27
33
36
39
42
45
48
51
54
57
63
66
69
72
30
60
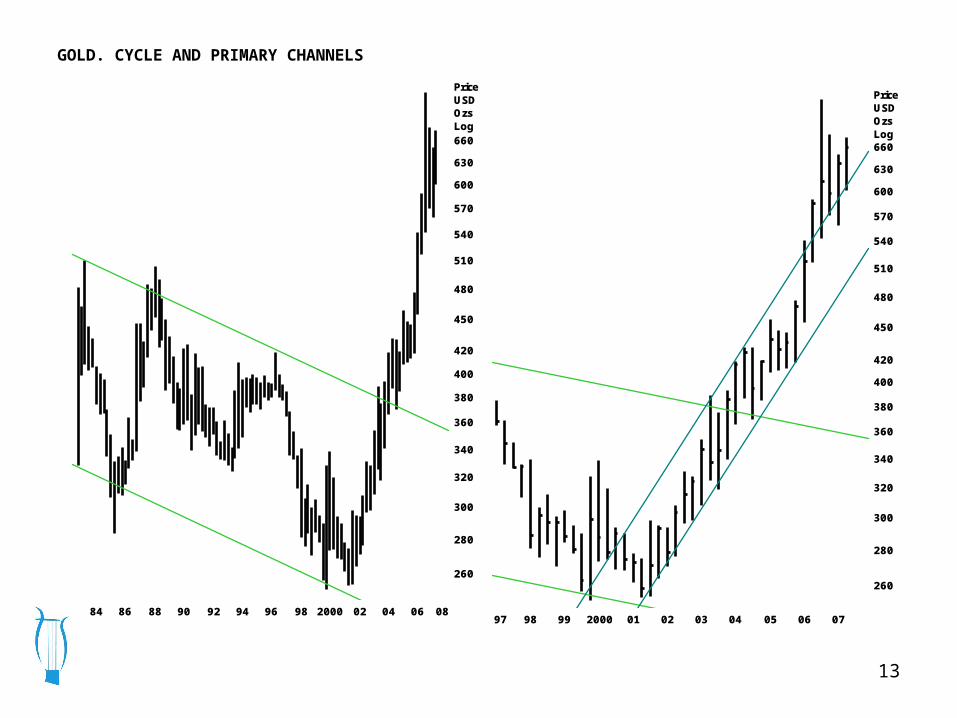
13
97 98 99 2000 01 02 03 04 05 06 07
PriceUSDOzsLog
450
480
510
540
570
630
660
260
280
320
340
360
380
420
600
300
400
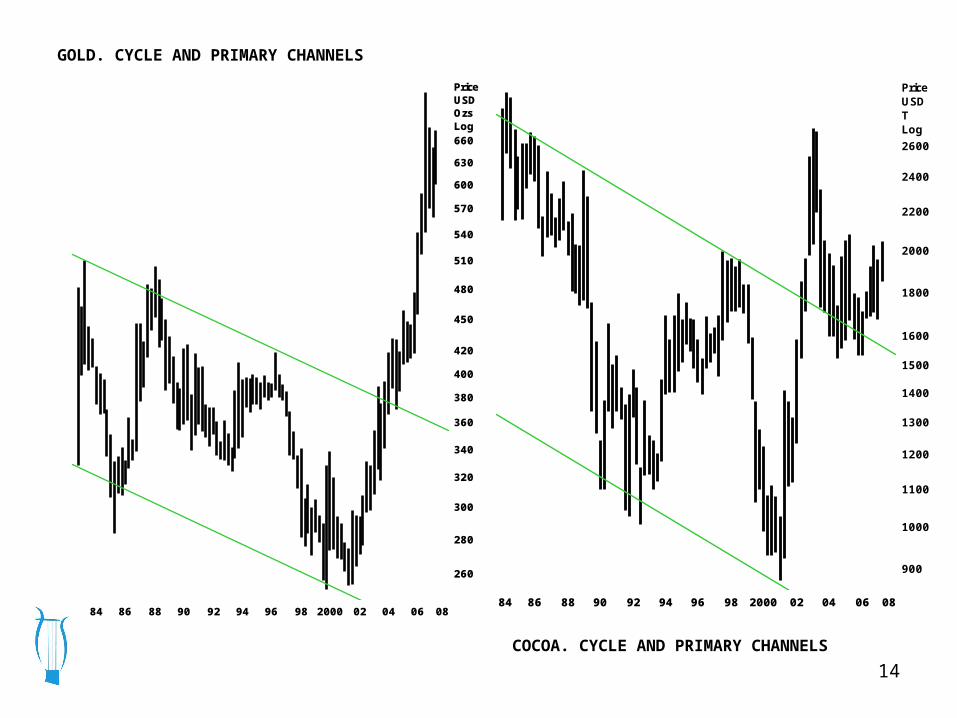
GOLD. CYCLE AND PRIMARY CHANNELS
84 86 88 90 92 94 96 98 2000 02 04 06 08
PriceUSDOzsLog
450
480
510
540
570
630
660
260
280
320
340
360
380
420
600
300
400
14
GOLD. CYCLE AND PRIMARY CHANNELS
84 86 88 90 92 94 96 98 2000 02 04 06 08
PriceUSDOzsLog
450
480
510
540
570
630
660
260
280
320
340
360
380
420
600
300
400
84 86 88 90 92 94 96 98 2000 02 04 06 08
PriceUSDTLog
1600
1800
2200
2400
2600
900
1100
1200
1300
1400
1500
2000
1000
COCOA. CYCLE AND PRIMARY CHANNELS
15
96 97 98 99 2000 01 02 03 04 05 06 07 08 09
PriceUSDBsh
2.4
2.7
3.3
3.6
3.9
4.2
4.5
4.8
5.1
5.4
5.7
6.3
6.6
6.9
7.2
3
6
(a)
(b)
a
b
i
ii
iii
c
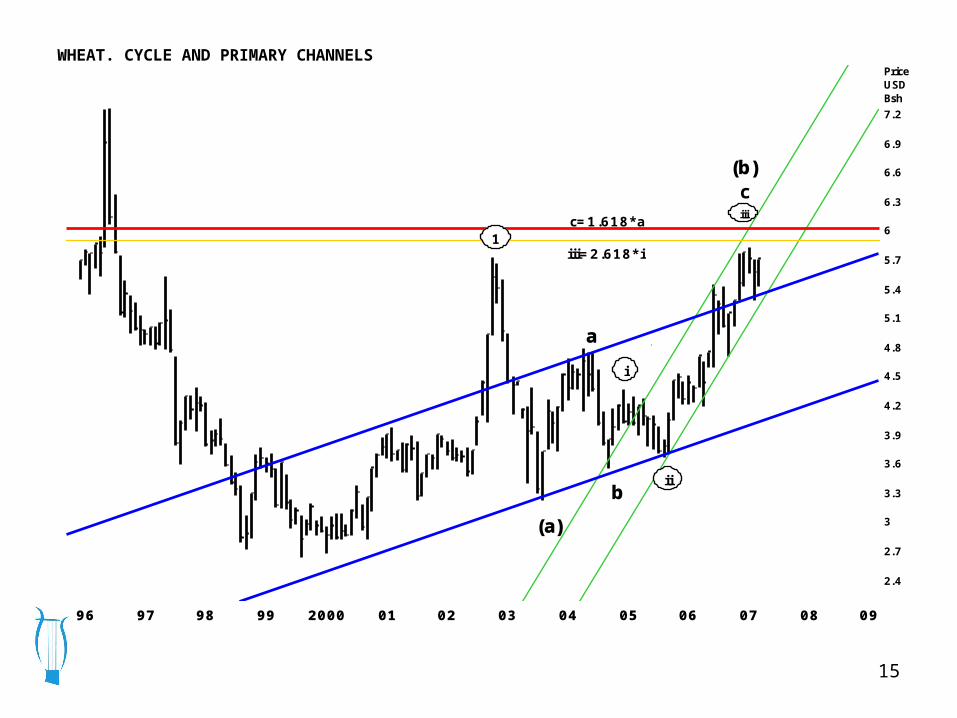
1c=1.618*a
iii=2.618*i
WHEAT. CYCLE AND PRIMARY CHANNELS
16
01 02 03 04 05 06 07
PriceUSDTLog
1600
1700
1800
1900
2100
2200
2300
2400
950
1050
1150
1250
1350
1450
2000
1000
1100
1200
1300
1400
1500
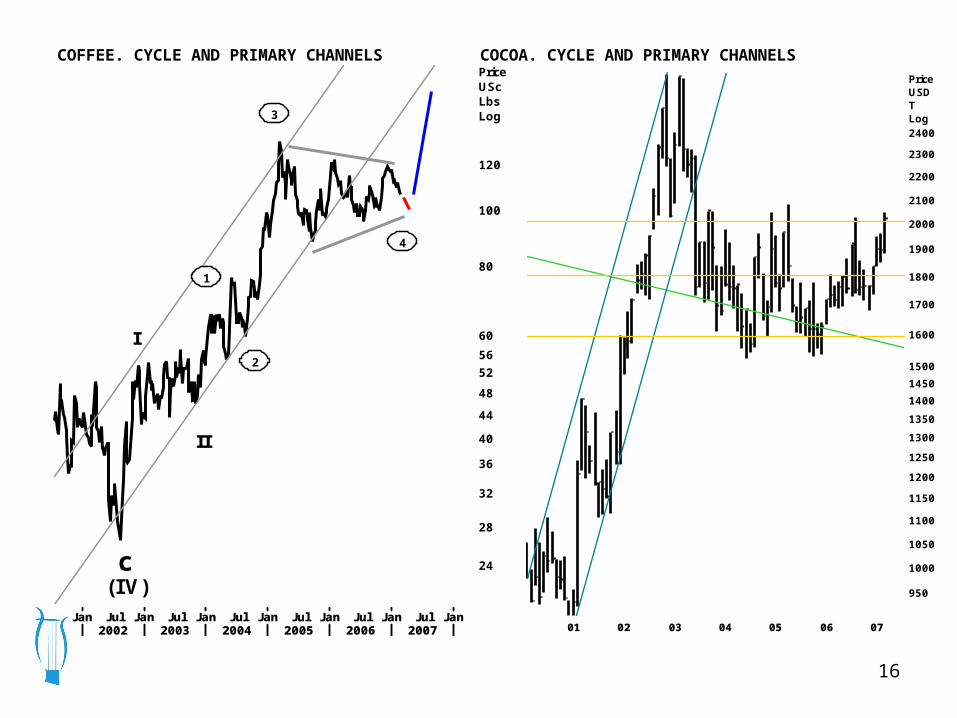
COFFEE. CYCLE AND PRIMARY CHANNELS
Jan Jul Jan Jul Jan Jul Jan Jul Jan Jul Jan Jul Jan2002 2003 2004 2005 2006 2007
PriceUScLbsLog
60
80
120
24
28
32
36
44
48
52
56
100
40
c(IV)
I
II
1
2
3
4
COCOA. CYCLE AND PRIMARY CHANNELS
17
Feb Apr Jun Aug Oct Dec Feb Apr Jun Aug Oct Dec Feb Apr Jun Aug Oct Dec Feb2004 2005 2006 2007
PriceUSDLog
1500
1600
1700
1800
1900
2100
1040
1080
1120
1160
1240
1280
1320
1360
1440
1480
2000
1000
1200
1400
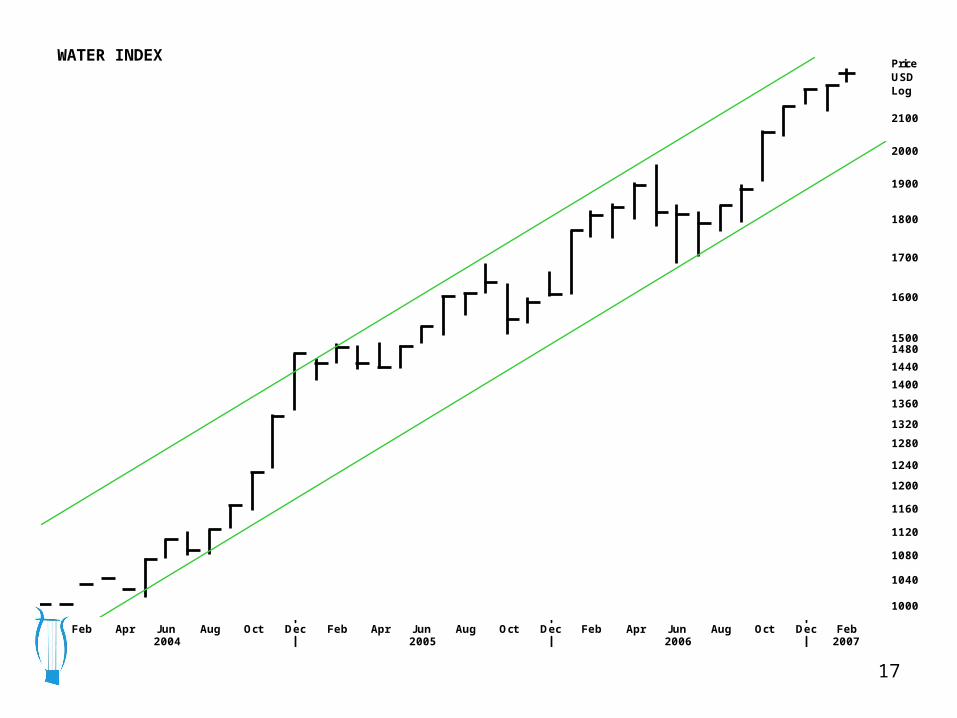
WATER INDEX
18
TRENDLINE
SIGNIFICANCE.
LONGER TIME. VOLUME VALIDATION. RECENT PRICE ACTION
EVIDENCE OF A TREND P/I/M. 2 REACTION LOWWS - 3 TOUCH VALIDATES
UP TLINE. SUPPORT USED AS DIPS TO LONG
DOWN TLINE. RESISTANCE USED AS DIPS TO SHORT
BREAK OF TLINE EARLY WARNING. ALL PRICE ACTION SHOULD BE ENCOMPASSED
PENETRATIONS – MEANS PROPER CLOSE NOT A SPIKE.
FILTER TIME 2 DAYS
FILTER PRICE - 3%/1% - DEPENDING ON STRATEGY
ROLE REVERSAL – CHANGING FROM A SUPPORT TO RESISTANCE
HOW TO UNDERSTAND THE STEEPNESS OF A TLINE
BEHAVIOUR AT RETURN LINE IS A WARNING
ROUND NUMBERS/ AVOID PLACING ORDERS NEAR ROUND NUMBERS 3/900
19
MOVING AVERAGE
• Moving averages are one of the most popular and easy to use tools available.
• They offer a trade off between sensitivity and reliability. The less
• Shorter moving averages will be more sensitive and generate more signals.
• There will also be an increase in the number of false signals and whipsaws.
• Longer moving averages will move slower and generate fewer
• signals. These signals will likely prove more reliable, but they also may come late.
• Each trader should experiment with different moving average lengths and types to examine the
trade-off
• Moving averages smooth out a data series and make it easier to identify the direction of the trend.
• Because past price data is used to form MA, they are considered lagging, or trend following,
indicators.
• Moving averages will not predict a change in trend, but rather follow behind the current trend.
• Therefore, they are best suited for trend identification and trend following purposes, not for
prediction.
• Because moving averages follow the trend, they work best when a security is trending and not
sideways.
• Hence first identify securities that display some trending characteristics before attempting to use
MA’s.
• An uptrend is established when a security forms a series of higher highs and higher lows.
• A downtrend is established when a security forms a series of lower lows and lower highs.
• Or an uptrend is started when the upper boundary of the range is broken and vice versa.
20
USES
• There are many uses for moving averages, mainly Trend identification/confirmation
• Support and Resistance level identification/confirmation
• Trading Systems
• Trend Identification/Confirmation
• Disadvantages of using moving averages need to be weighed against the disadvantages.
• Moving averages are trend following, or lagging, indicators that will always be a step behind.
• This is not necessarily a bad thing though. After all, the trend is your friend and it is best to trade
• Markets, stocks and securities spend a great deal of time in trading ranges, which render moving
averages ineffective.
• Once in a trend, moving averages will keep you in, but also give late signals.
• Don't expect to get out at the top and in at the bottom using moving averages.
• As with most tools of technical analysis, moving averages should not be used on their own, but in
conjunction
• Using moving averages to confirm other indicators and analysis can greatly enhance technical analysis.
21
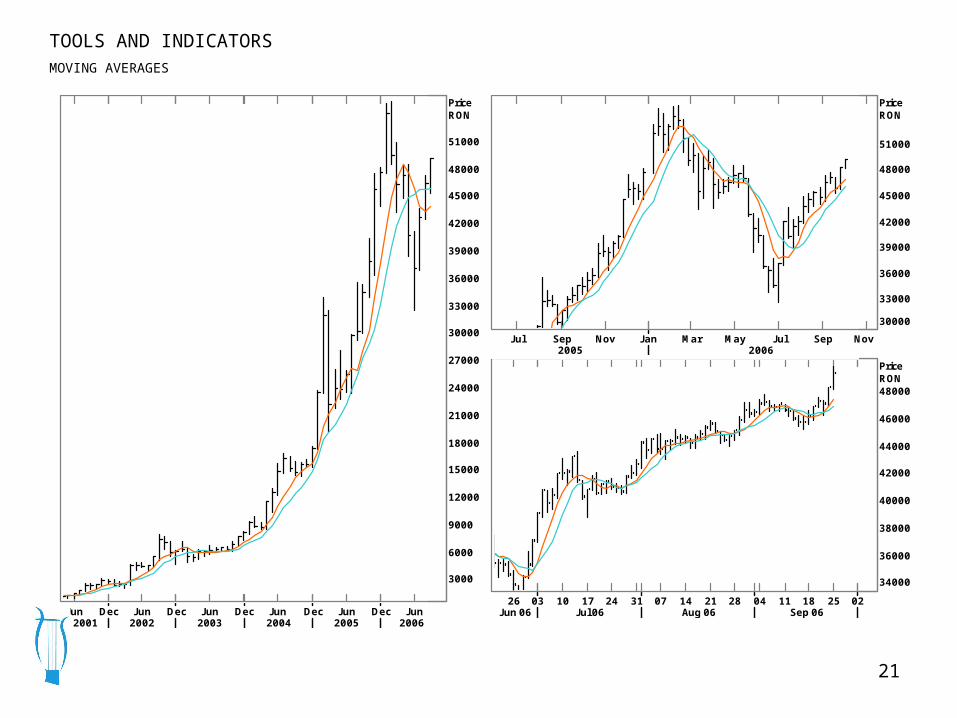
TOOLS AND INDICATORSMOVING AVERAGES
Jun Dec Jun Dec Jun Dec Jun Dec Jun Dec Jun2001 2002 2003 2004 2005 2006
PriceRON
3000
6000
9000
12000
15000
18000
21000
24000
27000
33000
36000
39000
42000
45000
48000
51000
30000Jul Sep Nov Jan Mar May Jul Sep Nov
2005 2006
PriceRON
33000
36000
39000
42000
45000
48000
51000
30000
26 03 10 17 24 31 07 14 21 28 04 11 18 25 02Jun 06 Jul 06 Aug 06 Sep 06
PriceRON
34000
36000
38000
42000
44000
46000
48000
40000

22
TOOLS AND INDICATORSMOVING AVERAGES CASE
CONSTRUCTION
INTERPRETATION
SIGNALS
WHIPSAWS AND COMPLEMENTING WITH OTHER TOOLS
TIME FRAME REDUCTION. ADVANTAGES AND DISADVANTAGES
NO OF SIGNALS AND QUALITY OF SIGNALS
CROSSOVER. WHAT IS A CROSSOVER? WHY TO USE A CROSSOVER?
INTERPRETATION
SIGNALS
23
SUMMARY
TREND FOLLOWING
MECHANICAL SYSTEM
CHOICE OF TOOL FOR AN INVESTOR
NOT TO SAY EXTREMELY VALUABLE FOR A TRADER
UNEQUIVOCAL. CLEAR SIGNAL.
TIME LAG
TREND FOLLOWING
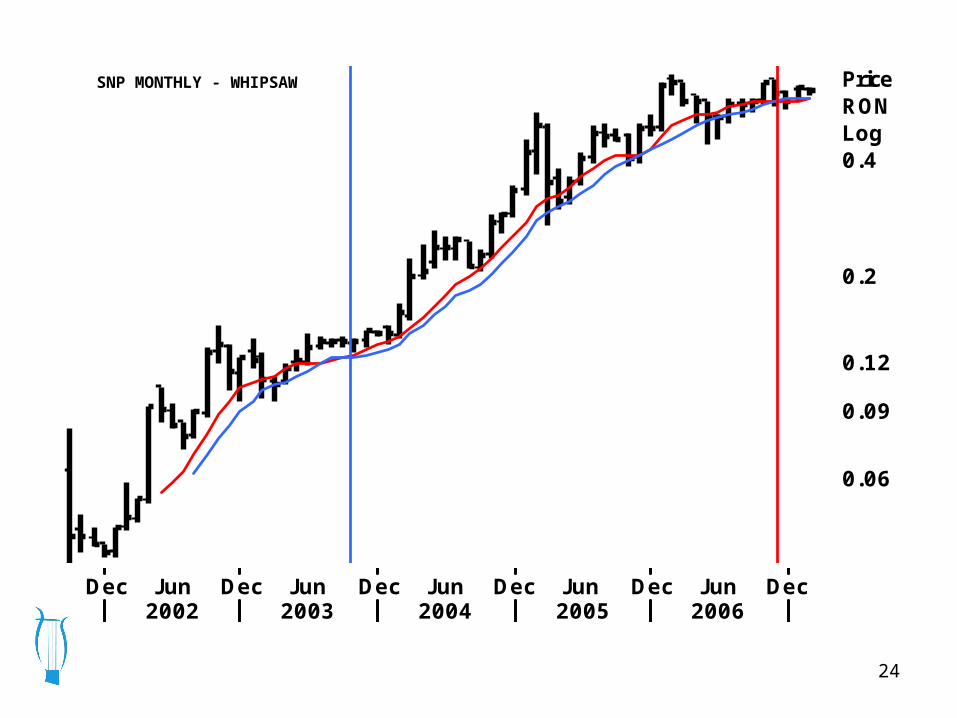
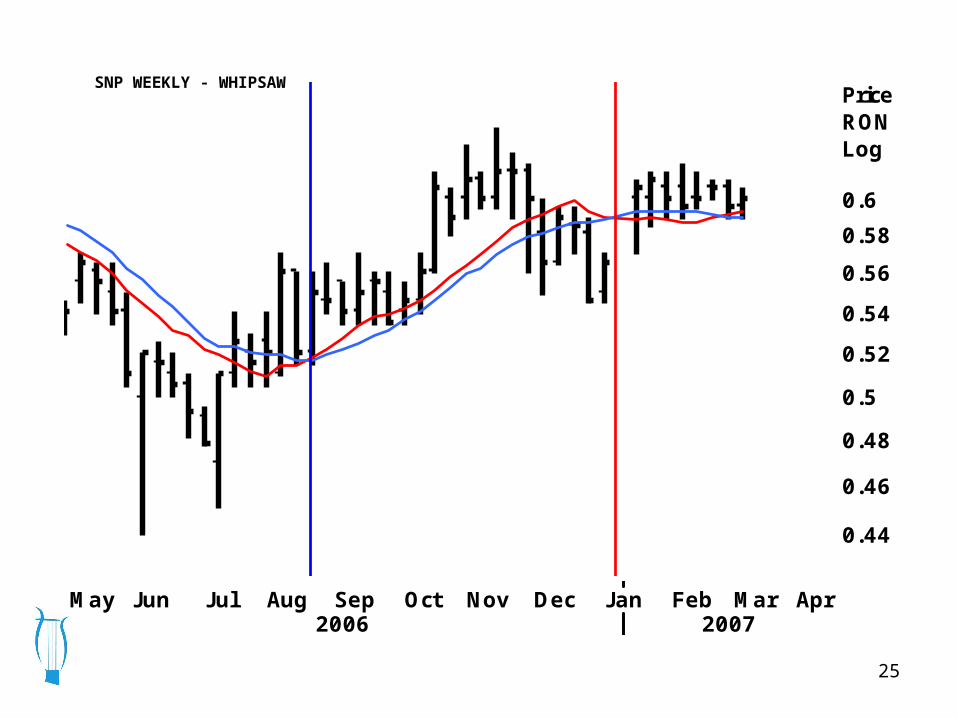
WHEN TREND CHANGES PRICE START MOVING SIDEWAYS AND THEN
SYSTEM STARTS WHIPSAWING
24
Dec Jun Dec Jun Dec Jun Dec Jun Dec Jun Dec2002 2003 2004 2005 2006
PriceRONLog
0.2
0.4
0.06
0.09
0.12
SNP MONTHLY - WHIPSAW
25
May Jun Jul Aug Sep Oct Nov Dec Jan Feb Mar Apr2006 2007
PriceRONLog
0.54
0.56
0.58
0.44
0.46
0.48
0.52
0.6
0.5
SNP WEEKLY - WHIPSAW
26
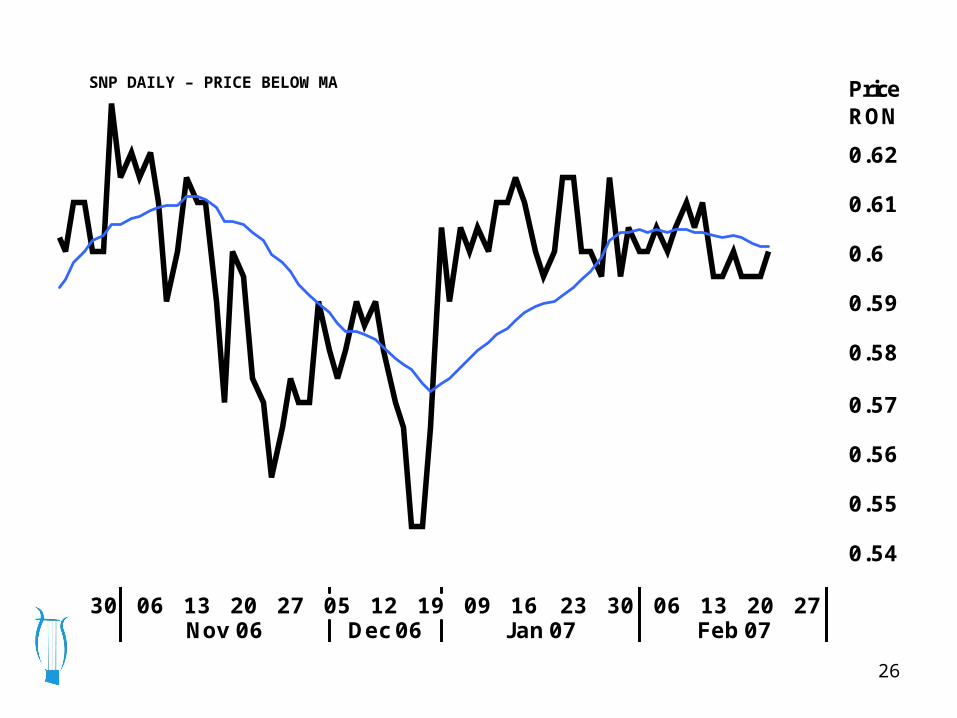
30 06 13 20 27 05 12 19 09 16 23 30 06 13 20 27Nov 06 Dec 06 Jan 07 Feb 07
PriceRON
0.54
0.55
0.56
0.57
0.58
0.59
0.61
0.62
0.6
SNP DAILY – PRICE BELOW MA
27
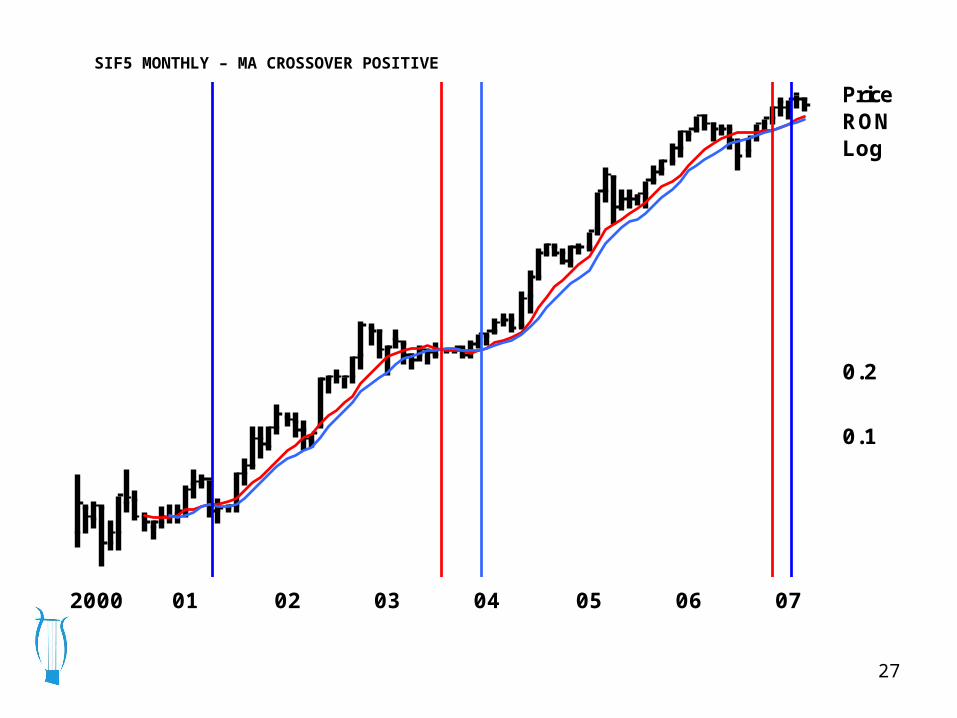
2000 01 02 03 04 05 06 07
PriceRONLog
0.1
0.2
SIF5 MONTHLY – MA CROSSOVER POSITIVE
28
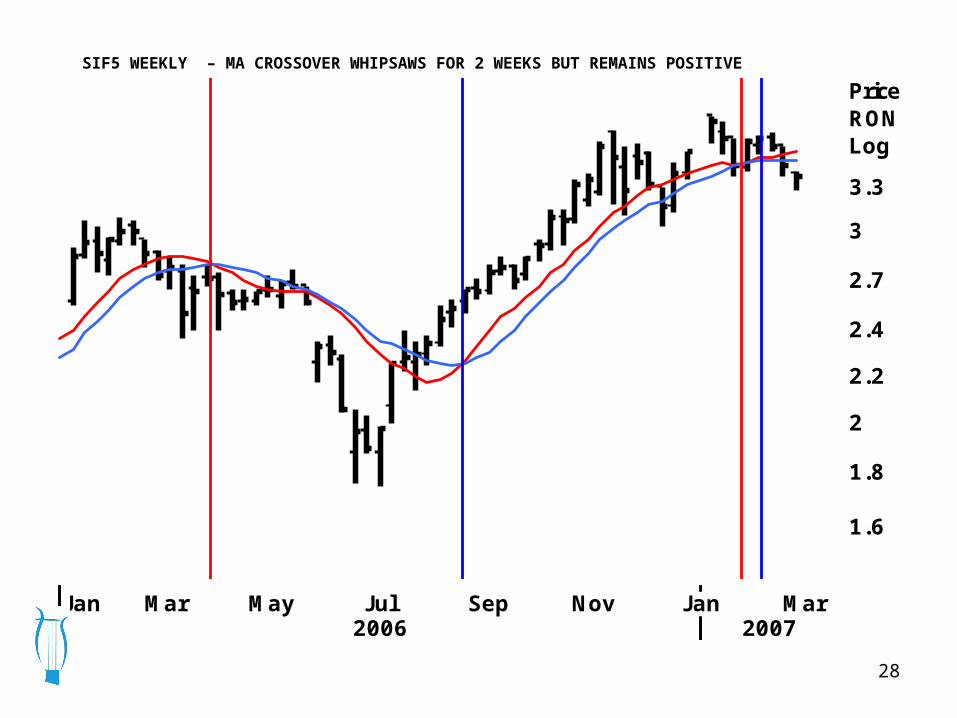
Jan Mar May Jul Sep Nov Jan Mar2006 2007
PriceRONLog
2.4
2.7
3.3
1.6
1.8
2.2
3
2
SIF5 WEEKLY – MA CROSSOVER WHIPSAWS FOR 2 WEEKS BUT REMAINS POSITIVE
29
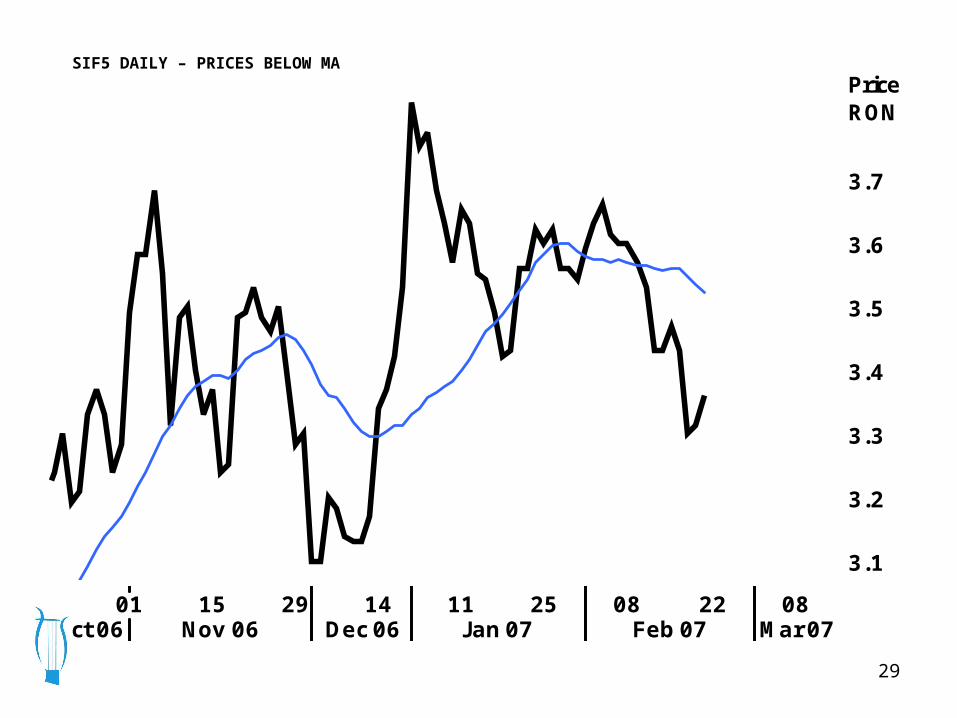
01 15 29 14 11 25 08 22 08Oct 06 Nov 06 Dec 06 Jan 07 Feb 07 Mar 07
PriceRON
3.1
3.2
3.3
3.4
3.5
3.6
3.7
SIF5 DAILY – PRICES BELOW MA
30
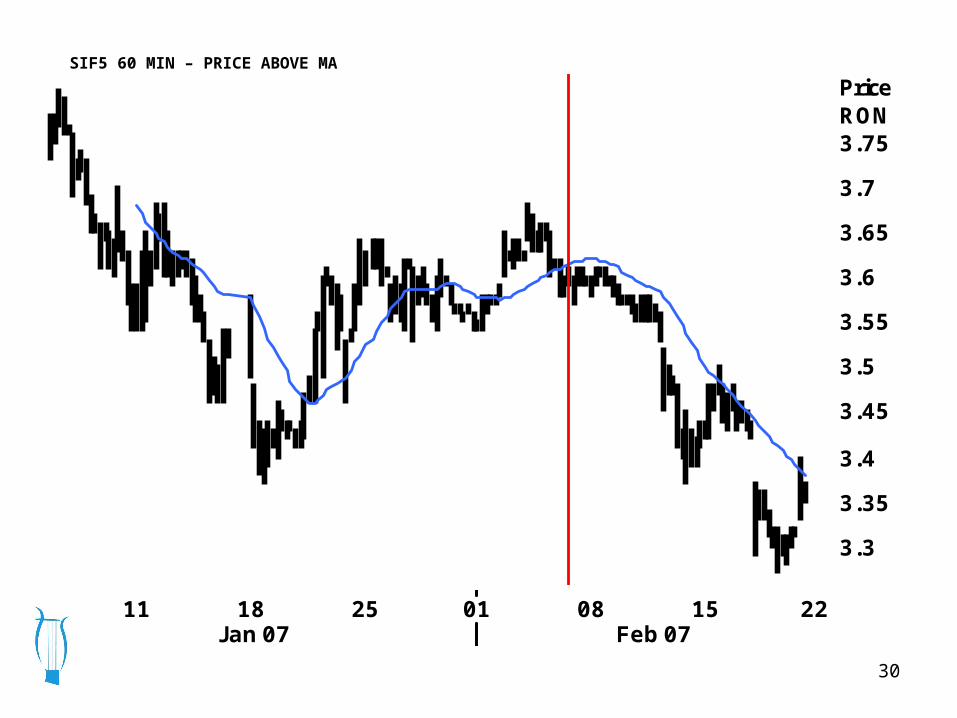
11 18 25 01 08 15 22Jan 07 Feb 07
PriceRON
3.35
3.45
3.55
3.65
3.75
3.3
3.4
3.5
3.6
3.7
SIF5 60 MIN – PRICE ABOVE MA
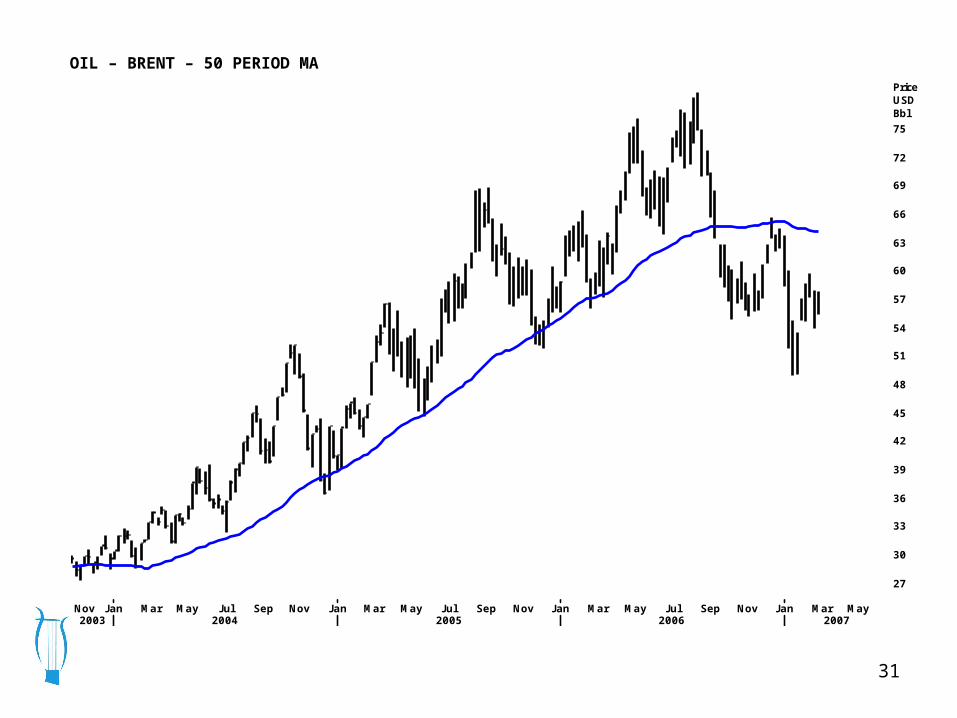
31
Nov Jan Mar May Jul Sep Nov Jan Mar May Jul Sep Nov Jan Mar May Jul Sep Nov Jan Mar May2003 2004 2005 2006 2007
PriceUSDBbl
27
33
36
39
42
45
48
51
54
57
63
66
69
72
75
30
60
OIL – BRENT – 50 PERIOD MA
32
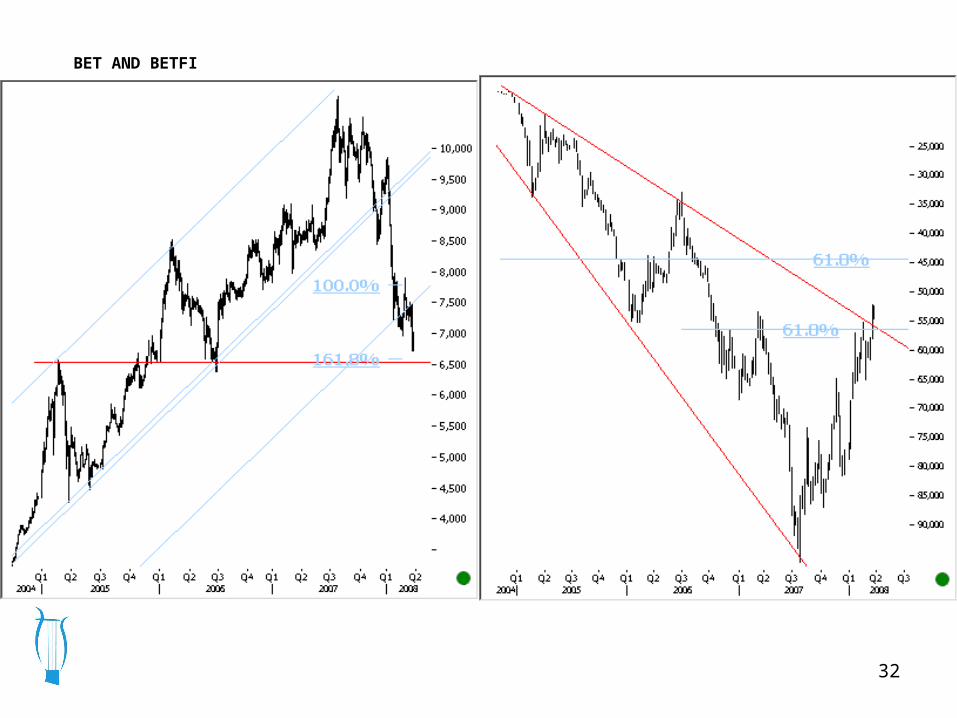
BET AND BETFI
33
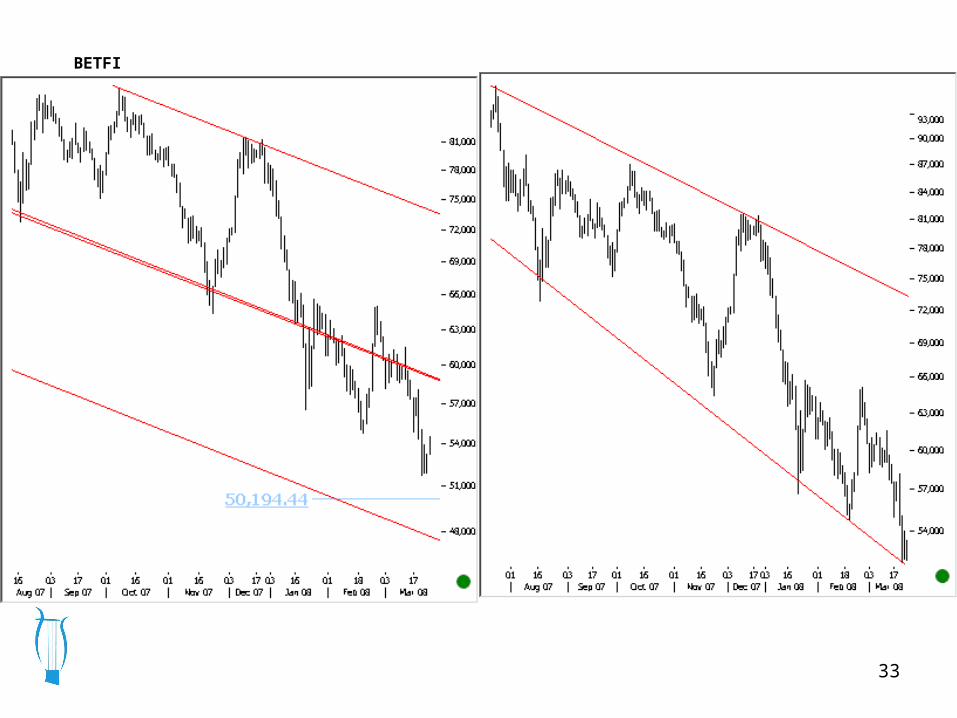
BETFI
34
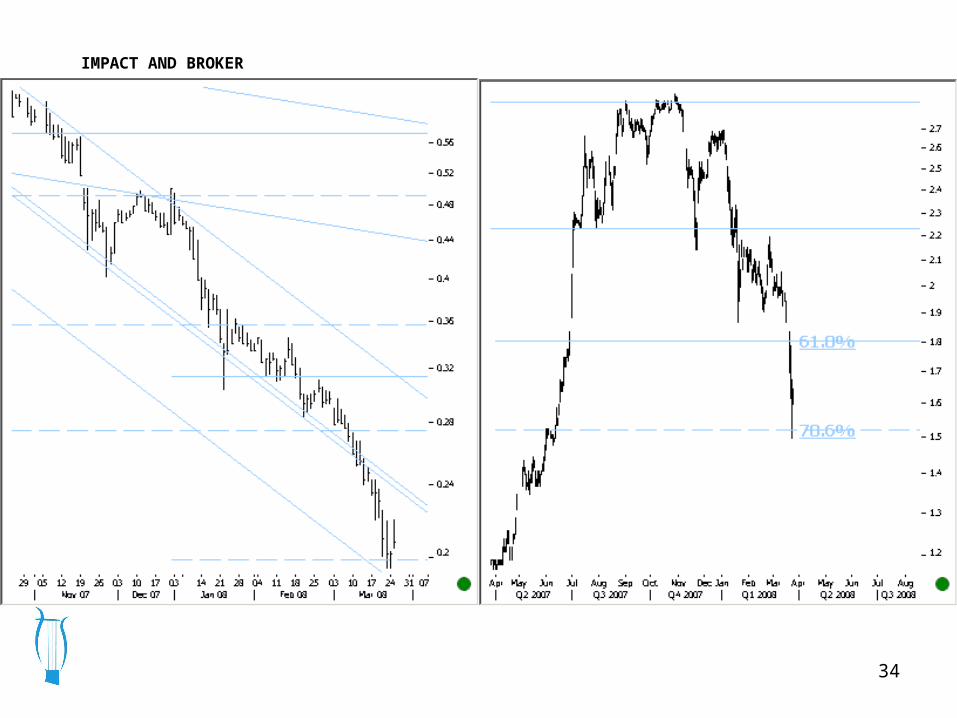
IMPACT AND BROKER
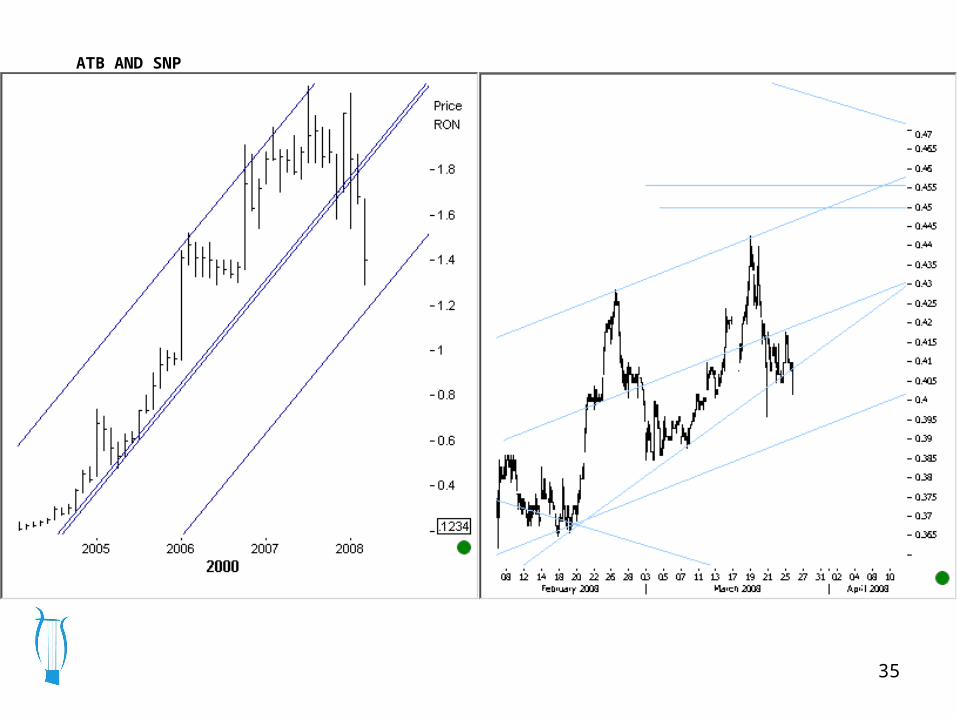
35
ATB AND SNP
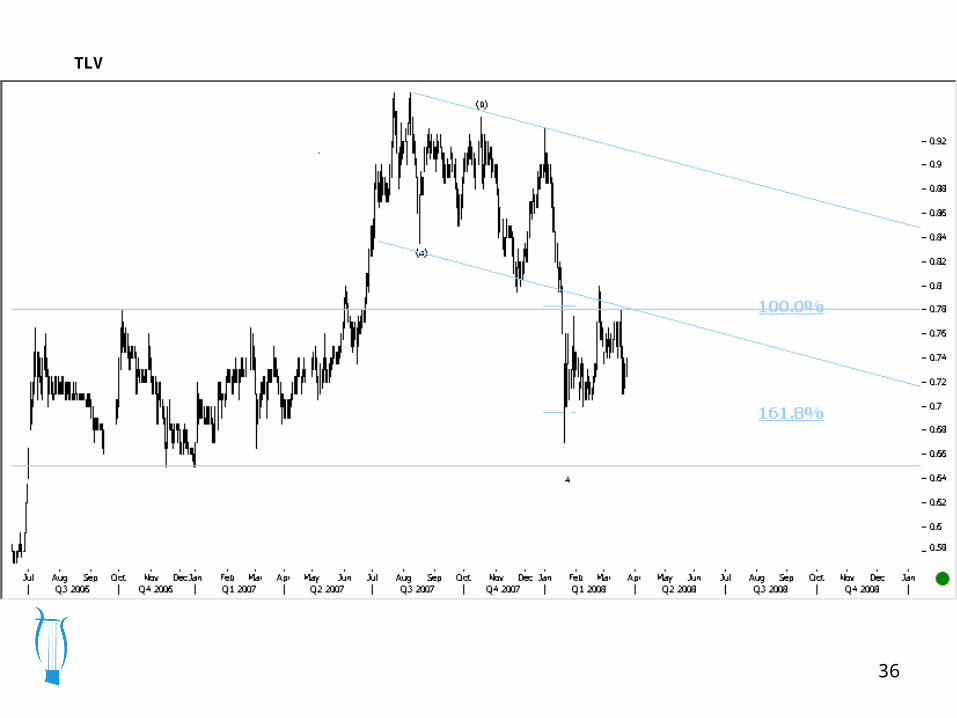
36
TLV
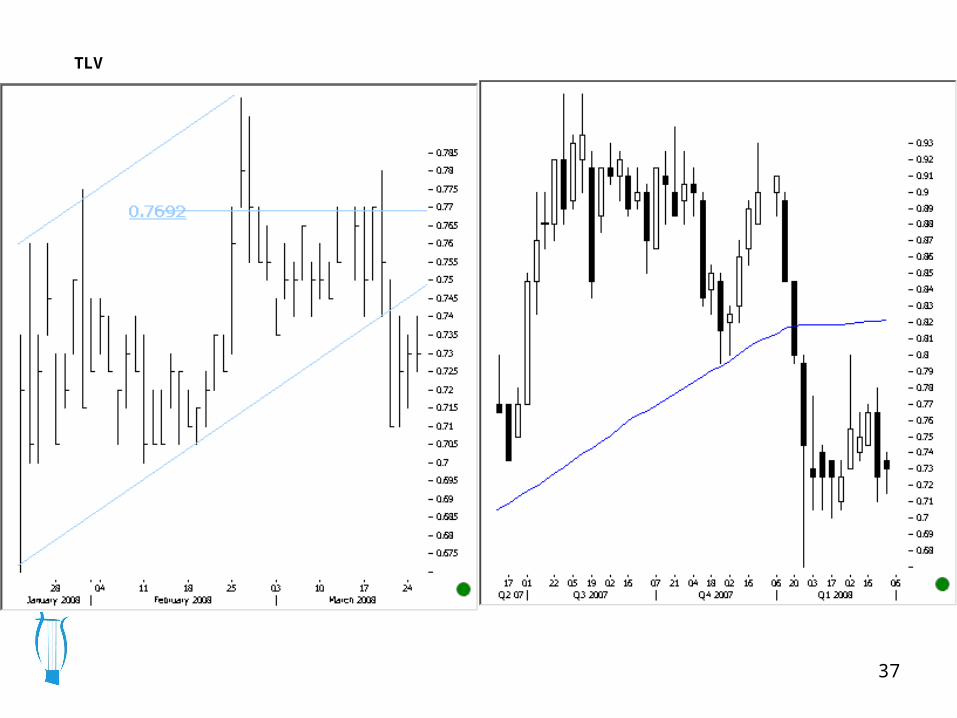
37
TLV
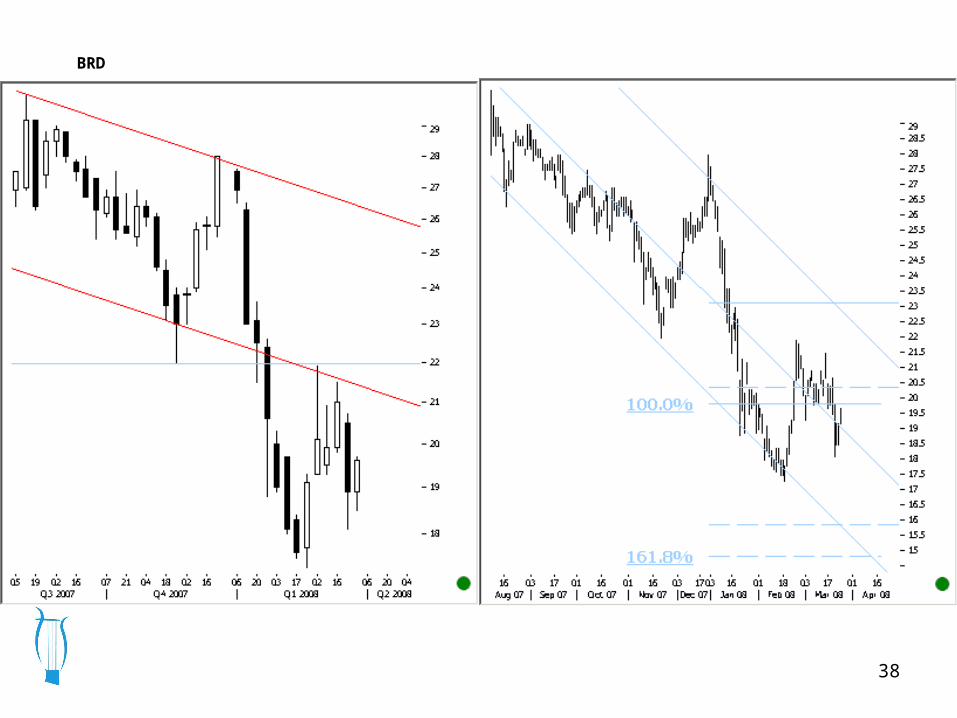
38
BRD
39
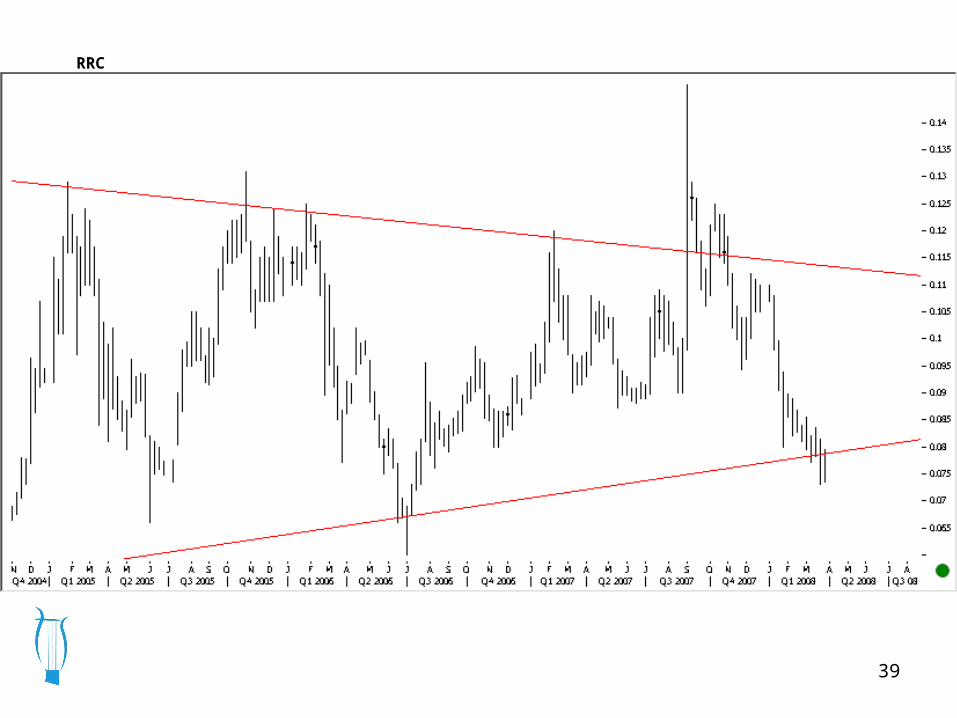
RRC
40
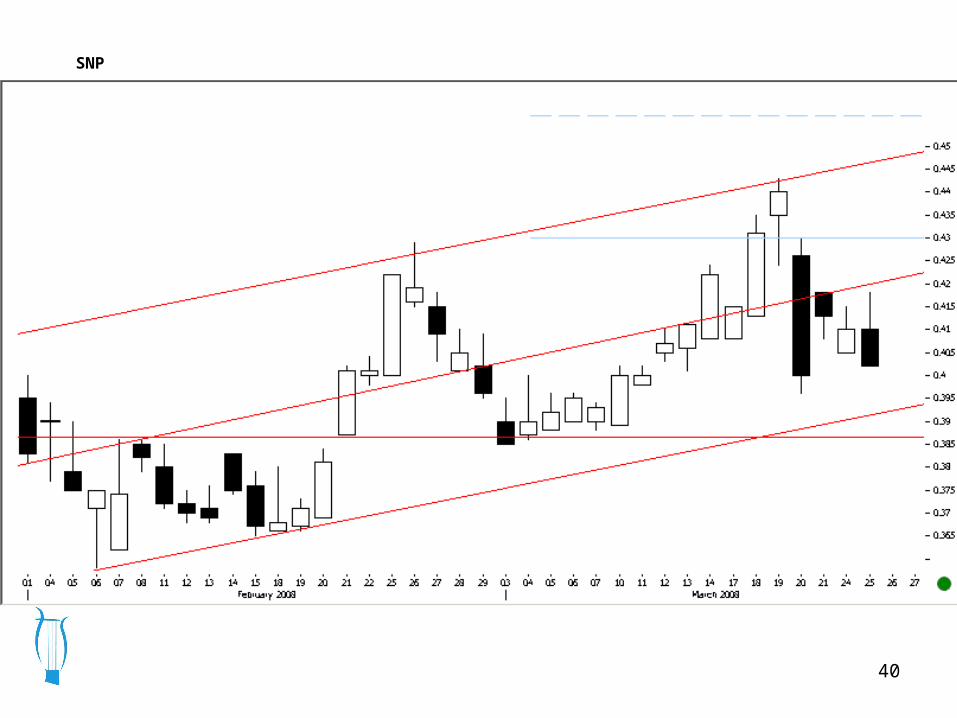
SNP
41
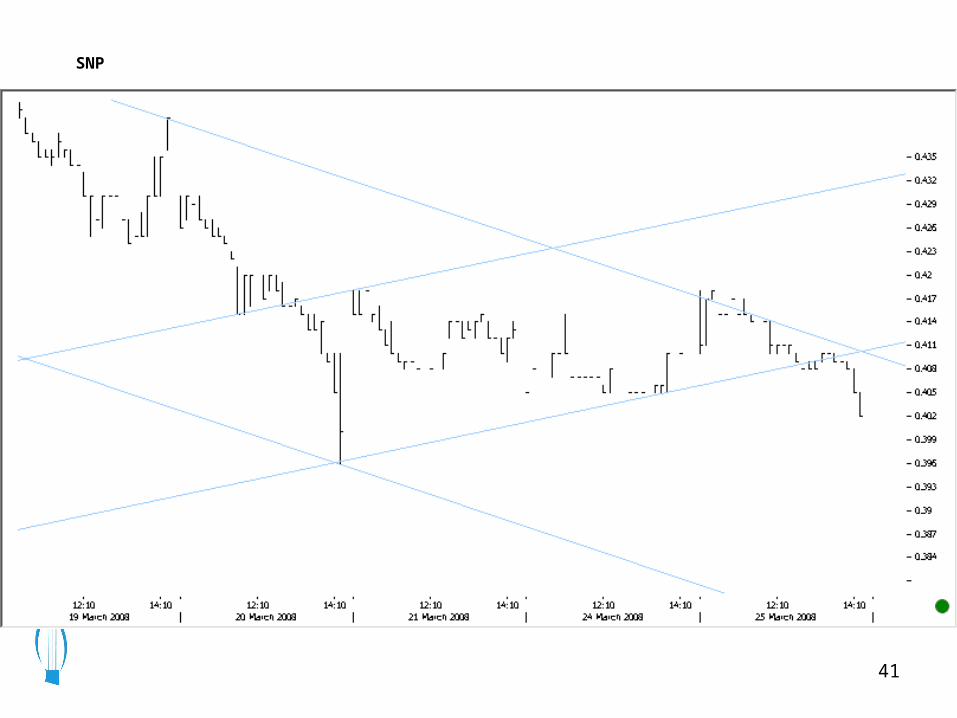
SNP
42
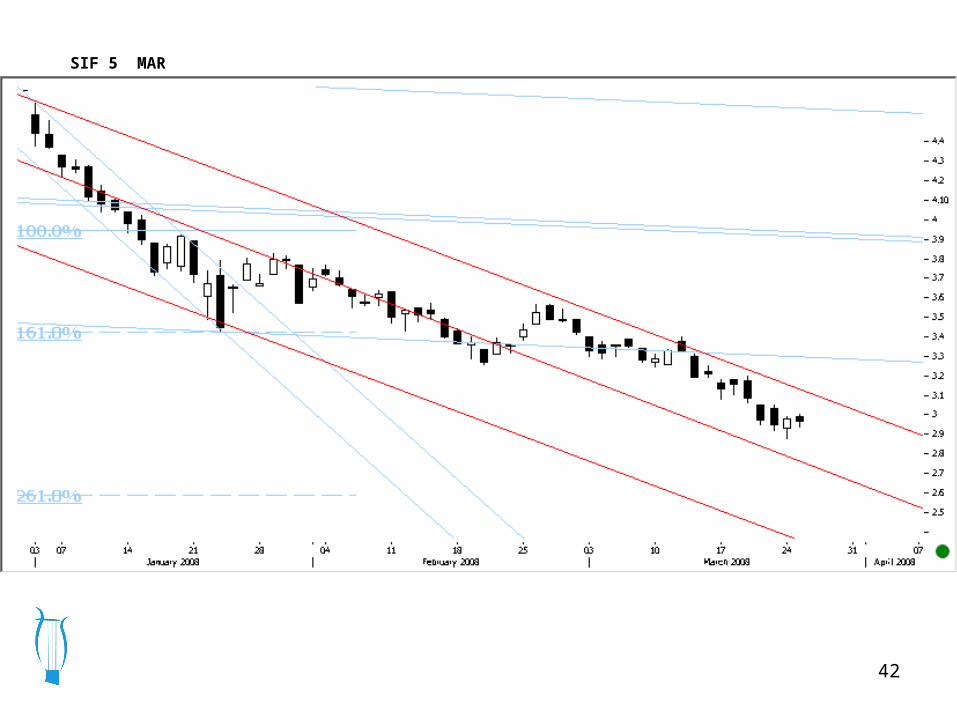
SIF 5 MAR
43
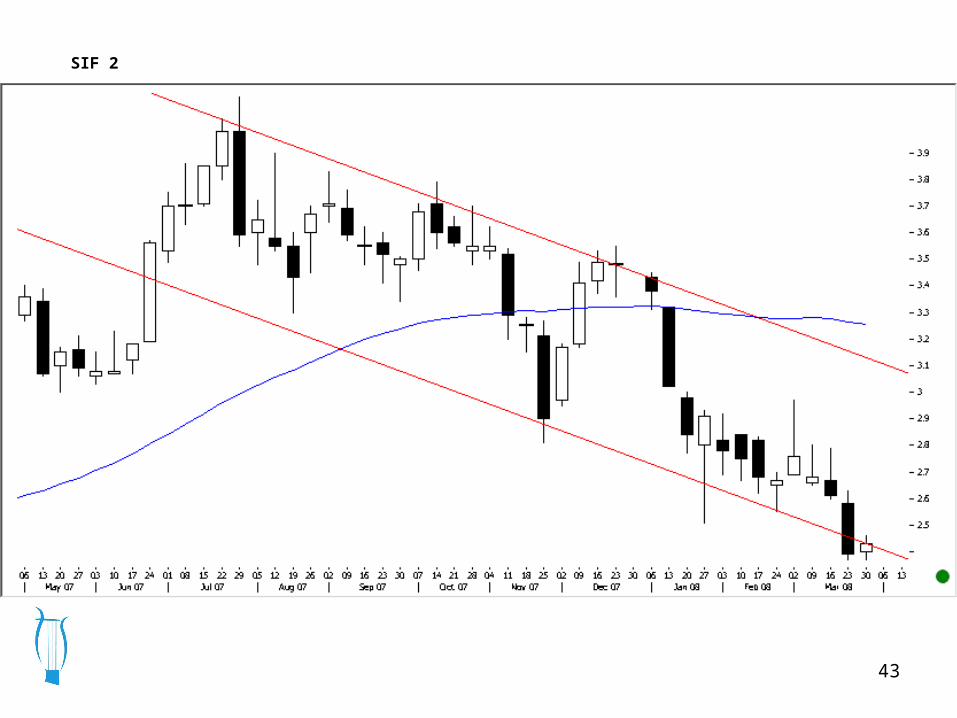
SIF 2
44
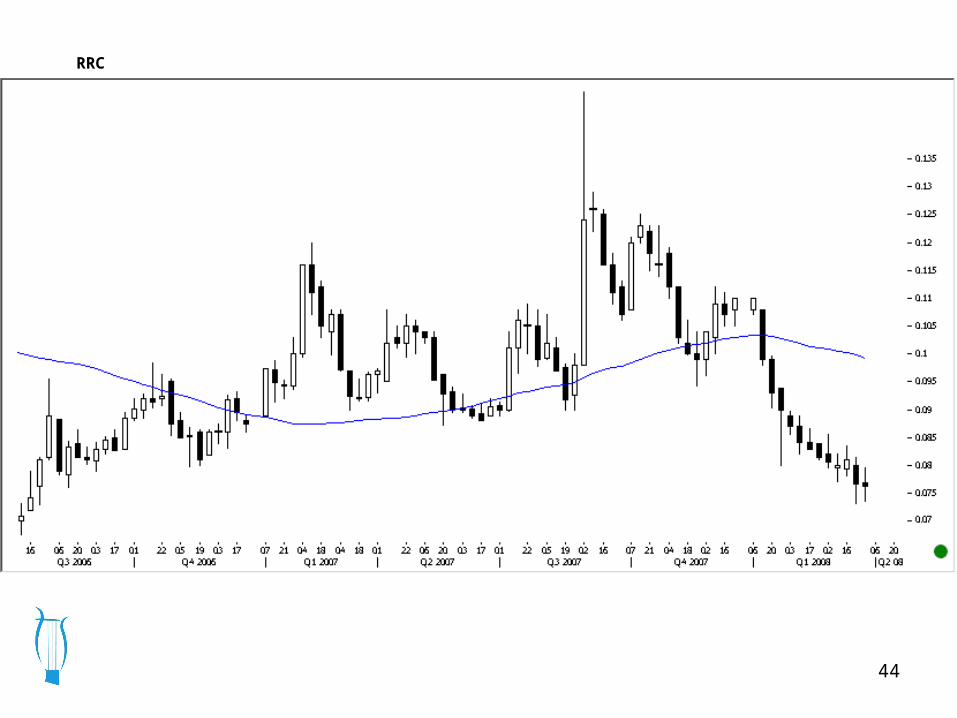
RRC
45
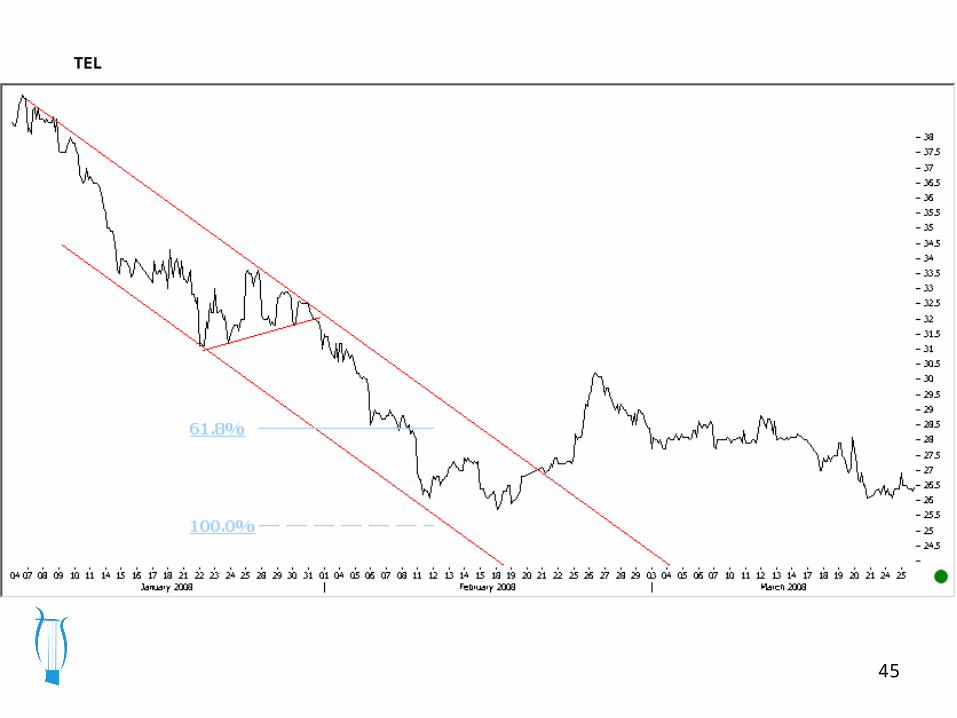
TEL
46
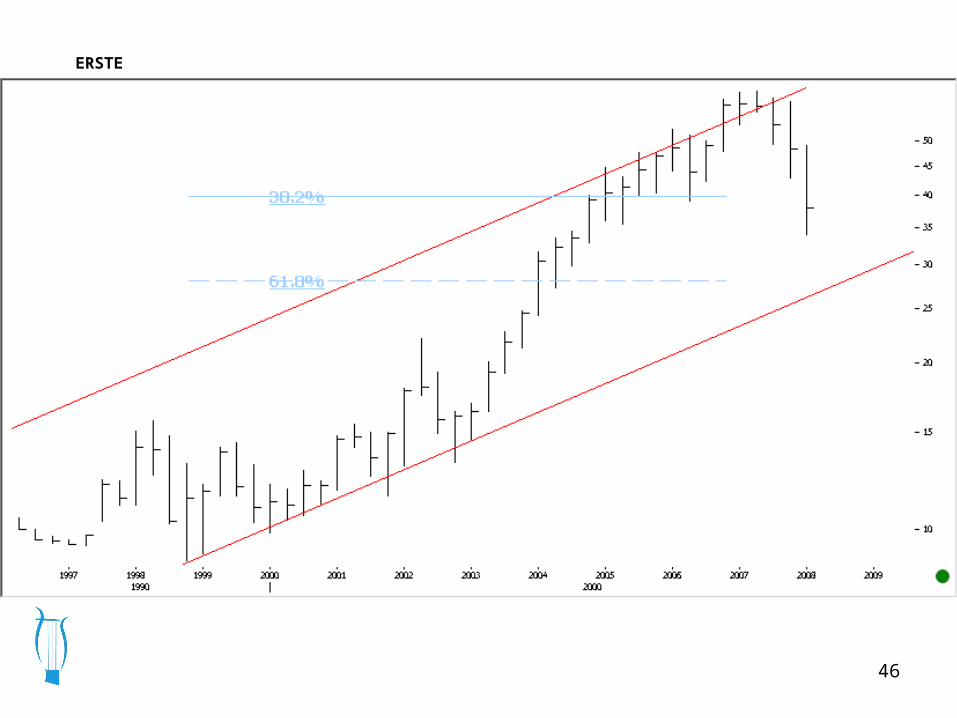
ERSTE
47
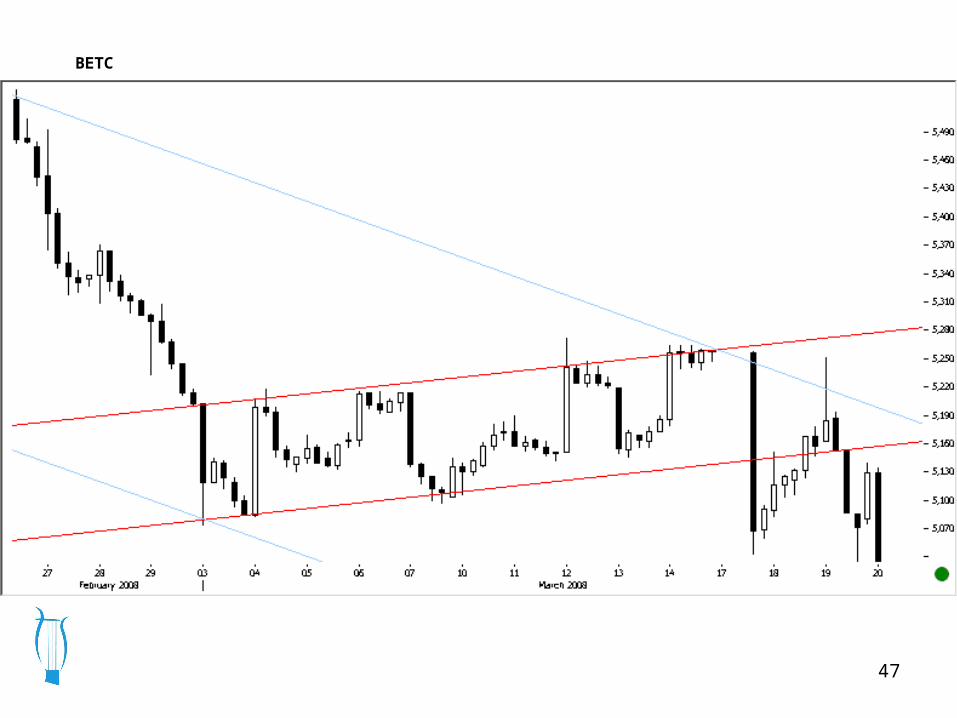
BETC
48
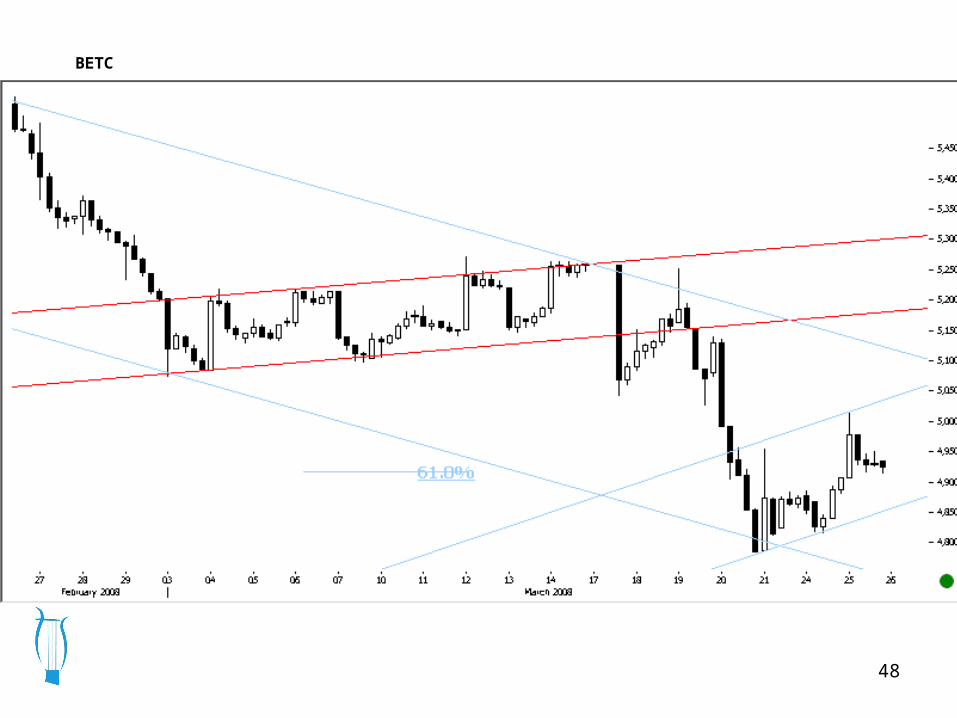
BETC
49
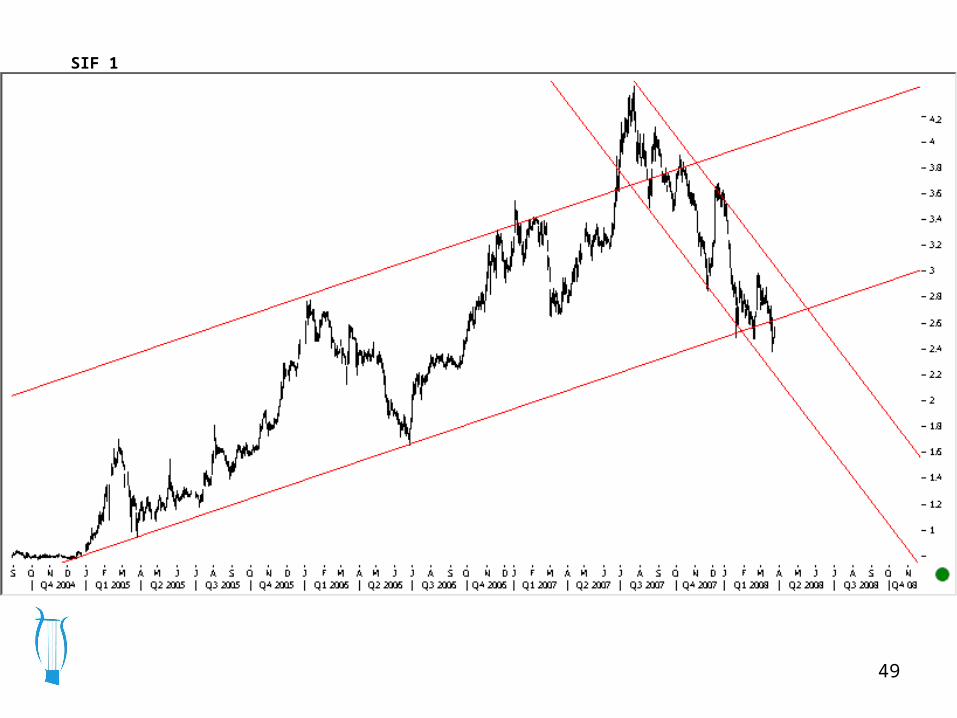
SIF 1
50
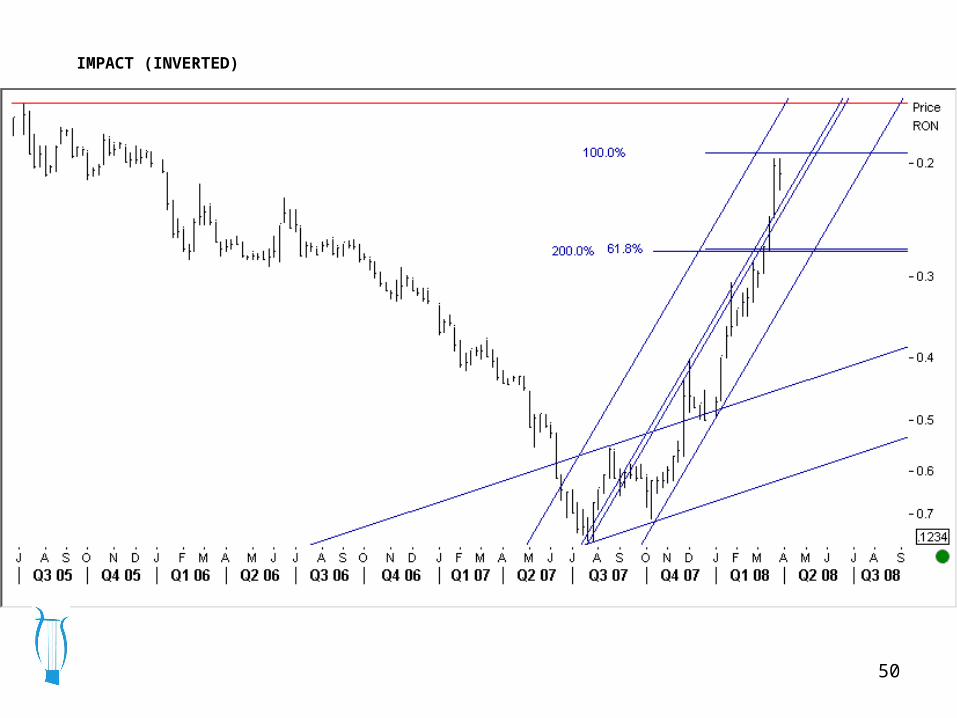
IMPACT (INVERTED)
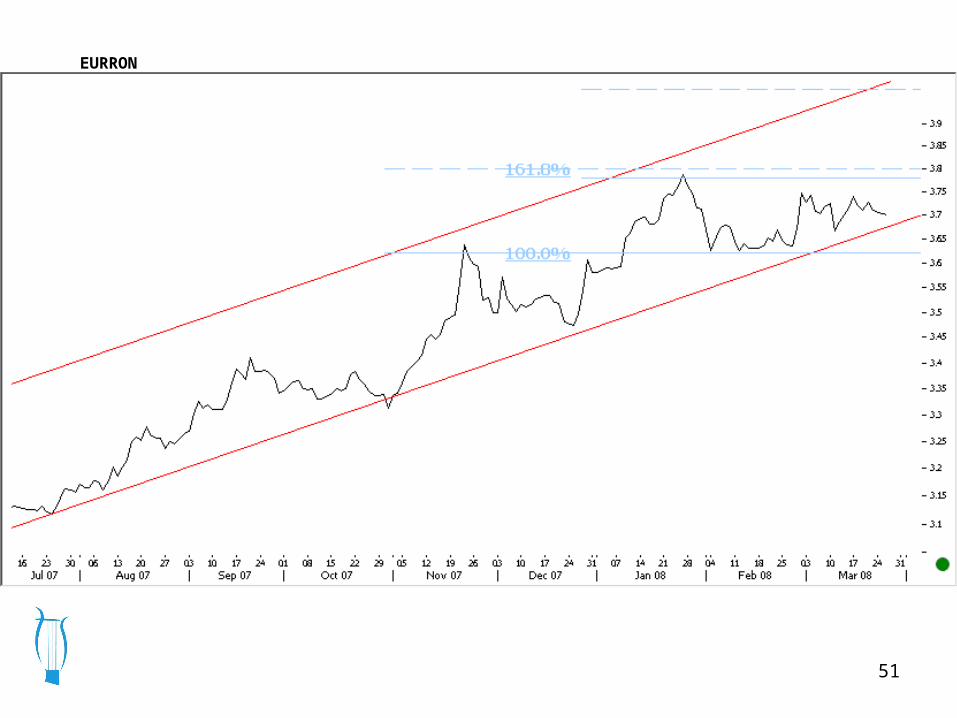
51
EURRON
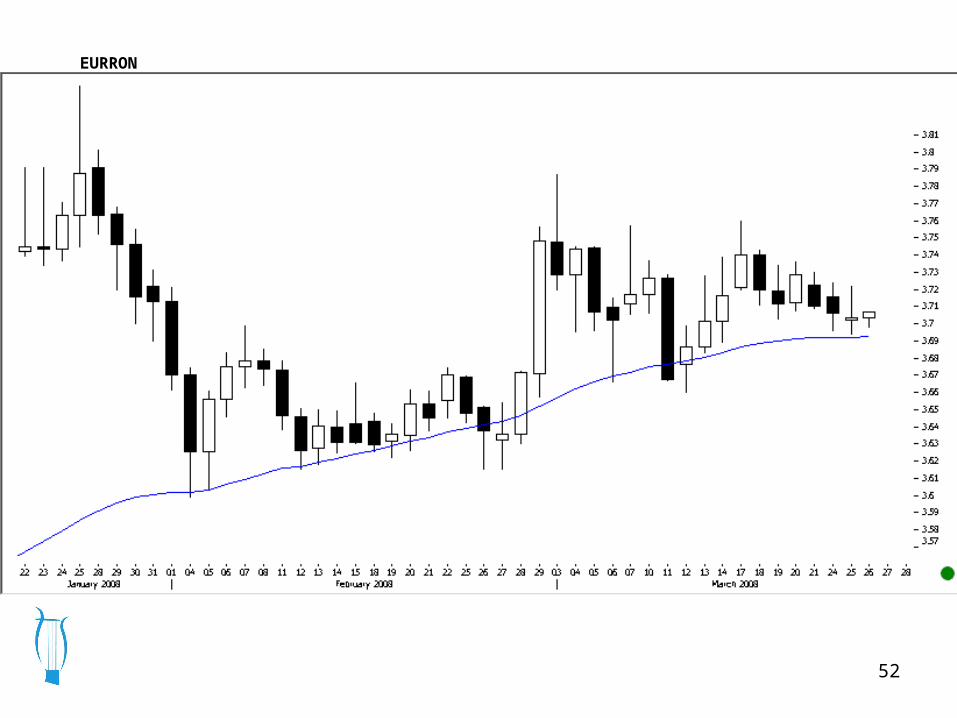
52
EURRON
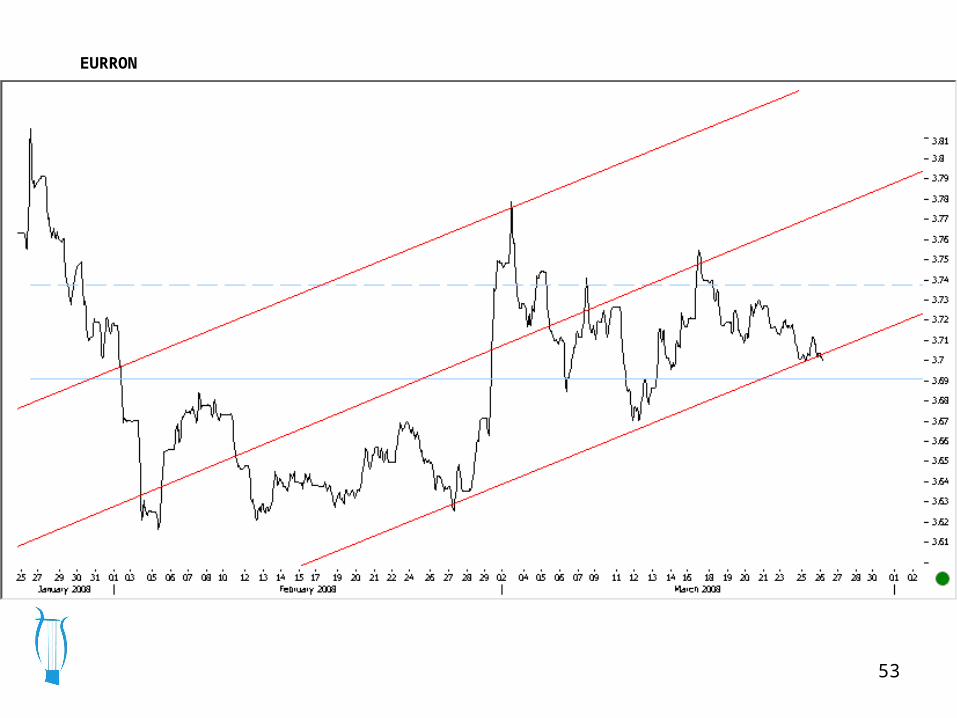
53
EURRON
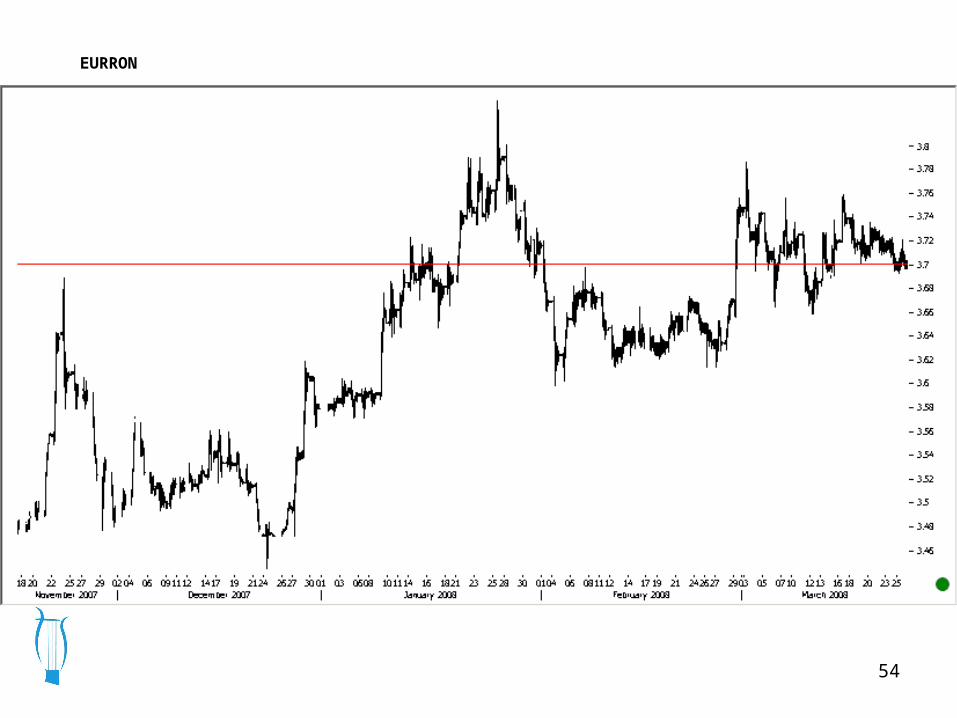
54
EURRON
55
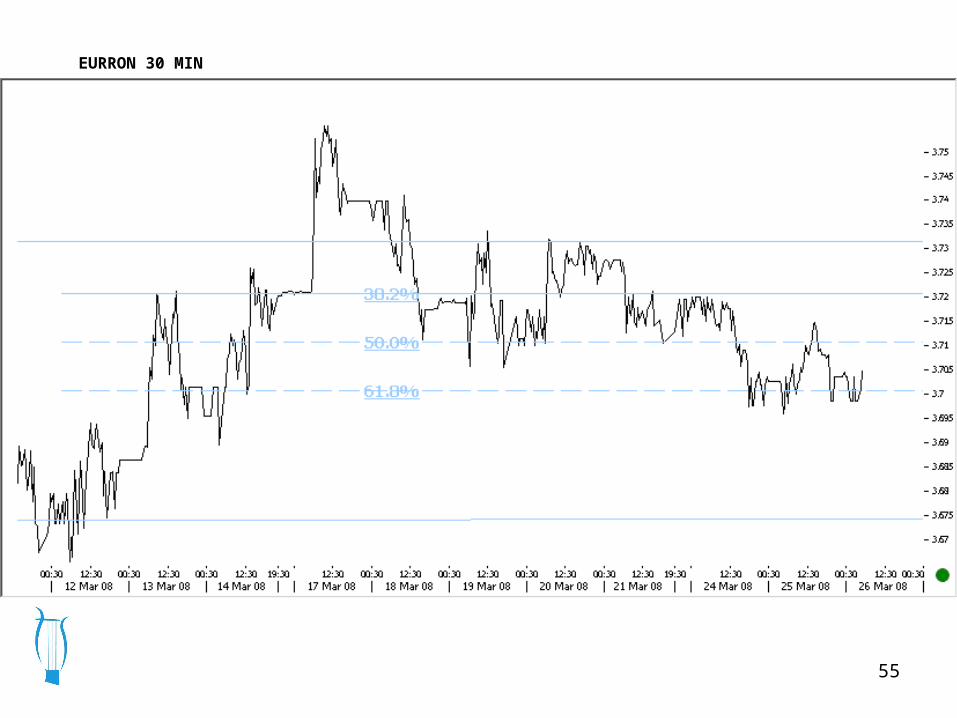
EURRON 30 MIN
56
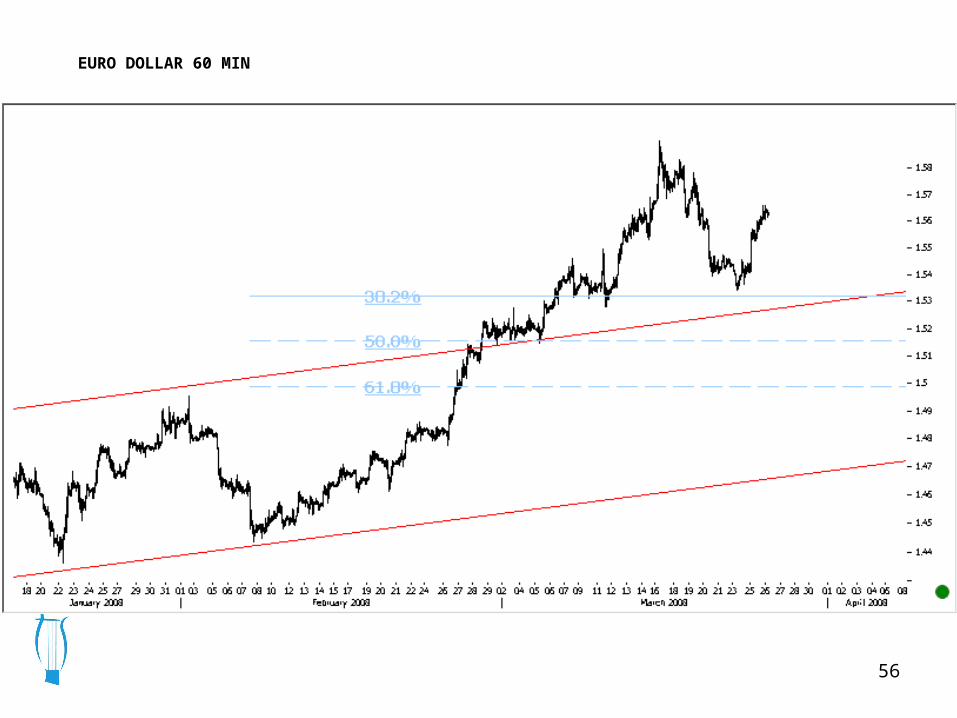
EURO DOLLAR 60 MIN
57
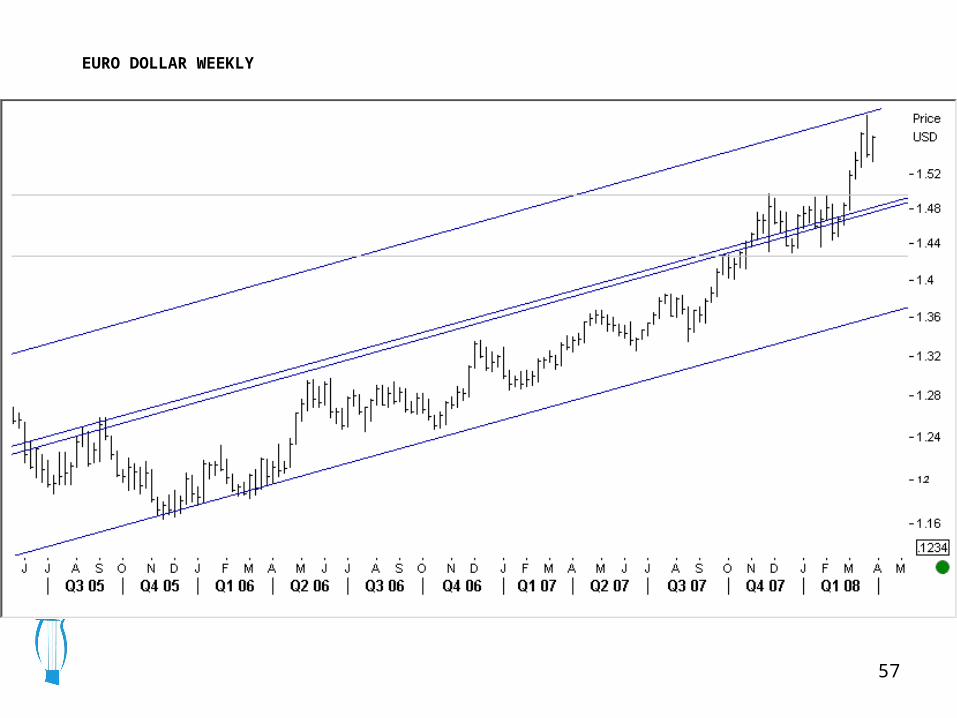
EURO DOLLAR WEEKLY
58
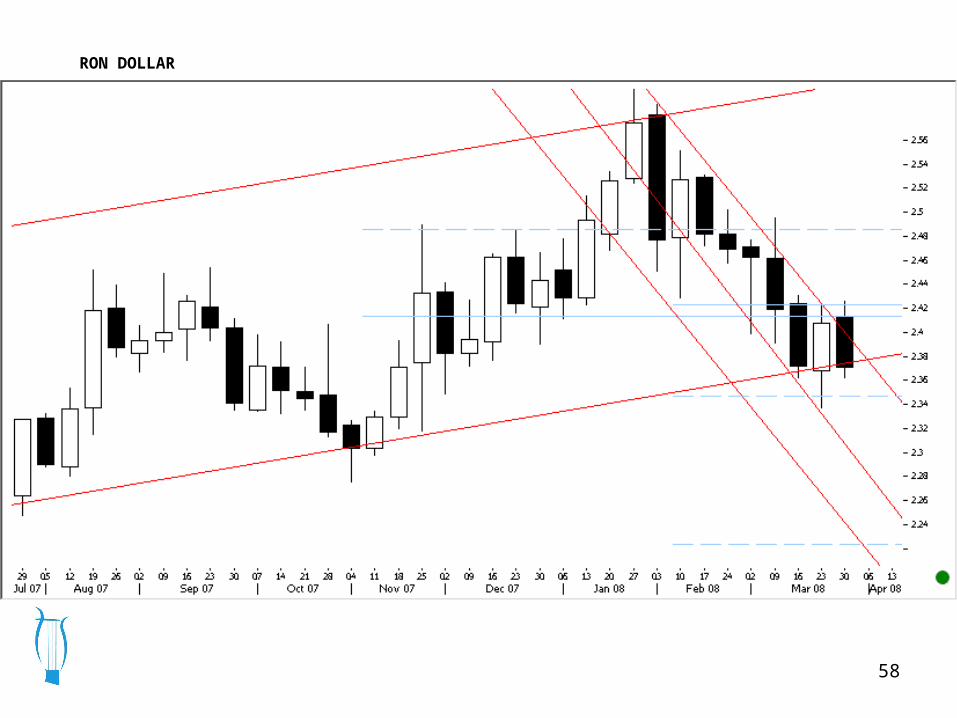
RON DOLLAR
59
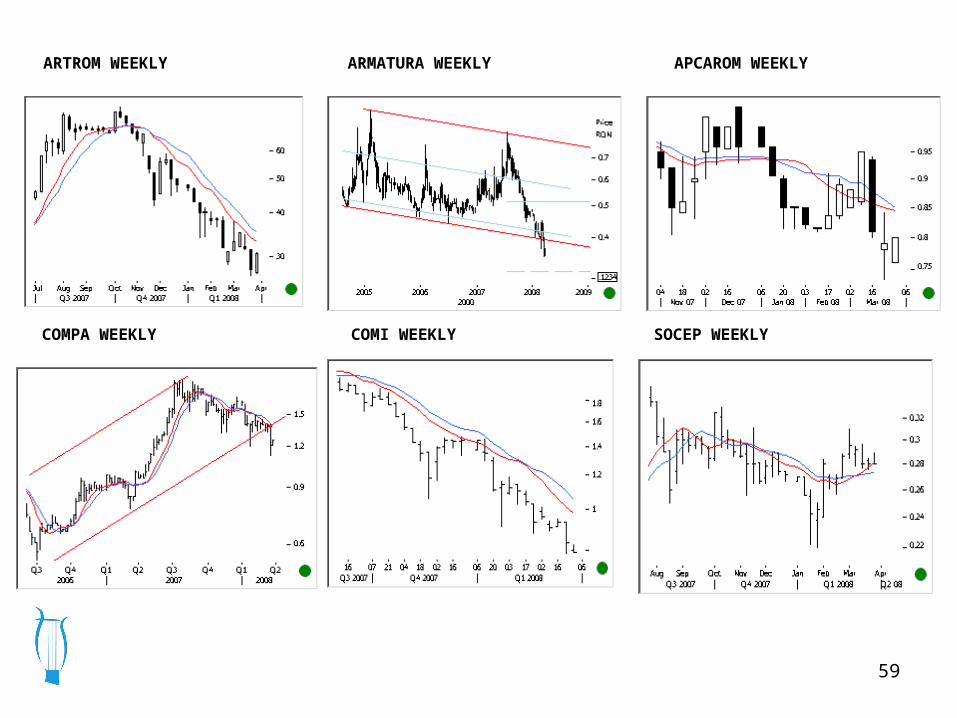
ARTROM WEEKLY ARMATURA WEEKLY APCAROM WEEKLY
COMPA WEEKLY COMI WEEKLY SOCEP WEEKLY
60
This document is not for public distribution and has been furnished to you solely for your information and may not be reproduced or redistributed to any other person. The manner of circulation and distribution of this document may be restricted by law or regulation in certain countries, including the United States, UK and India. Persons into whose possession this document may come are required to inform themselves of, and to observe, such restrictions. This material is for the personal information of the authorized recipient, and we are not soliciting any action based upon it. This report is not to be construed as an offer to sell or the solicitation of an offer to buy any security in any jurisdiction where such an offer or solicitation would be illegal. No person associated with Orpheus Capitals is obligated to call or initiate contact with you for the purposes of elaborating or following up on the information contained in this document. The material is based upon information that we consider reliable, but we do not represent that it is accurate or complete, and it should not be relied upon as such. Neither Orpheus Capitals, nor any person connected with it, accepts any liability arising from the use of this document. The recipient of this material should rely on their own investigations and take their own professional advice. Opinions expressed are our current opinions as of the date appearing on this material only. While we endeavor to update on a reasonable basis the information discussed in this material, there may be regulatory, compliance, or other reasons that prevent us from doing so. Prospective investors and others are cautioned that any forward-looking statements are not predictions and may be subject to change without notice. We and our affiliates, officers, directors, and employees world wide, including persons involved in the preparation or issuance of this material may; (a) from time to time, have long or short positions in, and buy or sell the securities thereof, of company (ies) mentioned herein or (b) be engaged in any other transaction involving such securities and earn brokerage or other compensation or act as a market maker in the financial instruments of the company (ies) discussed herein or may perform or seek to perform investment banking services for such Company (ies) or act as advisor or lender / borrower to such company (ies) or have other potential conflict of interest with respect to any recommendation and related information and opinions. The same persons may have acted upon the information contained here. No part of this material may be duplicated in any form and/or redistributed without Orpheus Capitals' prior written consent. In so far as this report includes current or historical information, it is believed to be reliable, although its accuracy and completeness cannot be guaranteed.Orpheus RESEARCH
Related Documents