Tectonic Landforms and Hazards 1. Introduction 2. Folding and faulting 3. Reverse faults 4. Normal faults 5. Transform (strike-slip) faults 6. Tectonic hazards

Welcome message from author
This document is posted to help you gain knowledge. Please leave a comment to let me know what you think about it! Share it to your friends and learn new things together.
Transcript
Tectonic Landforms and Hazards
1. Introduction
2. Folding and faulting
3. Reverse faults
4. Normal faults
5. Transform (strike-slip) faults
6. Tectonic hazards
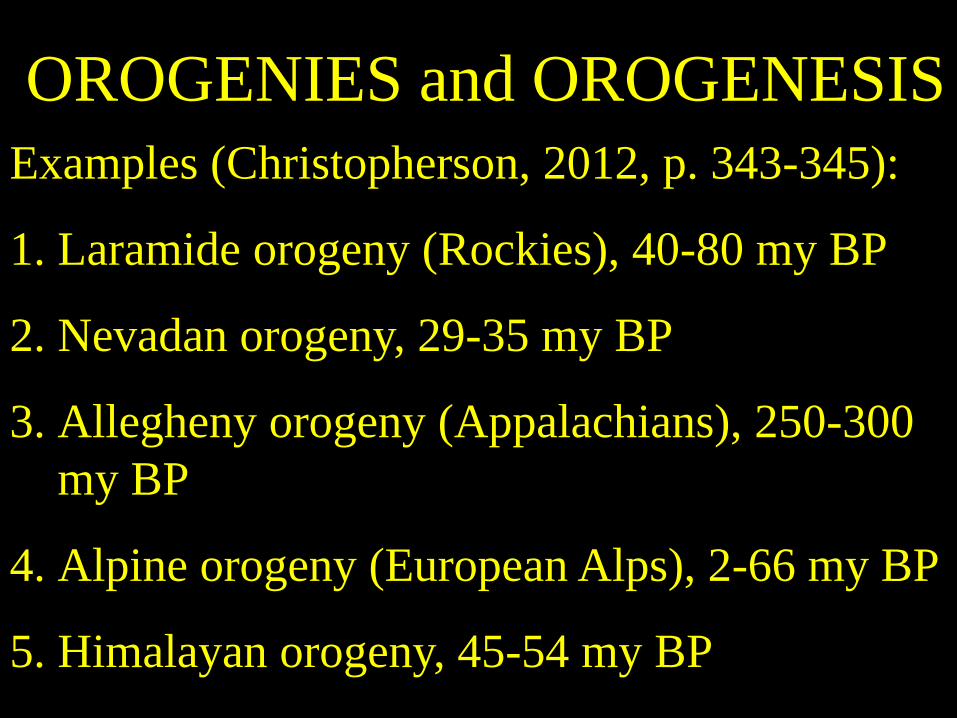
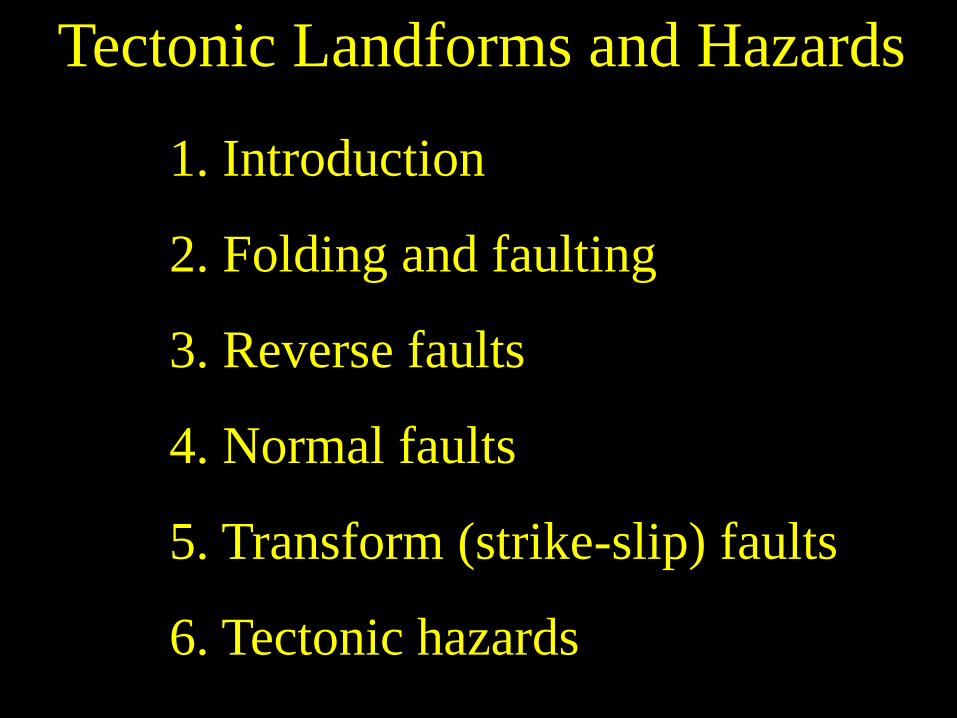
OROGENIES and OROGENESIS
Examples (Christopherson, 2012, p. 343-345):
1. Laramide orogeny (Rockies), 40-80 my BP
2. Nevadan orogeny, 29-35 my BP
3. Allegheny orogeny (Appalachians), 250-300
my BP
4. Alpine orogeny (European Alps), 2-66 my BP
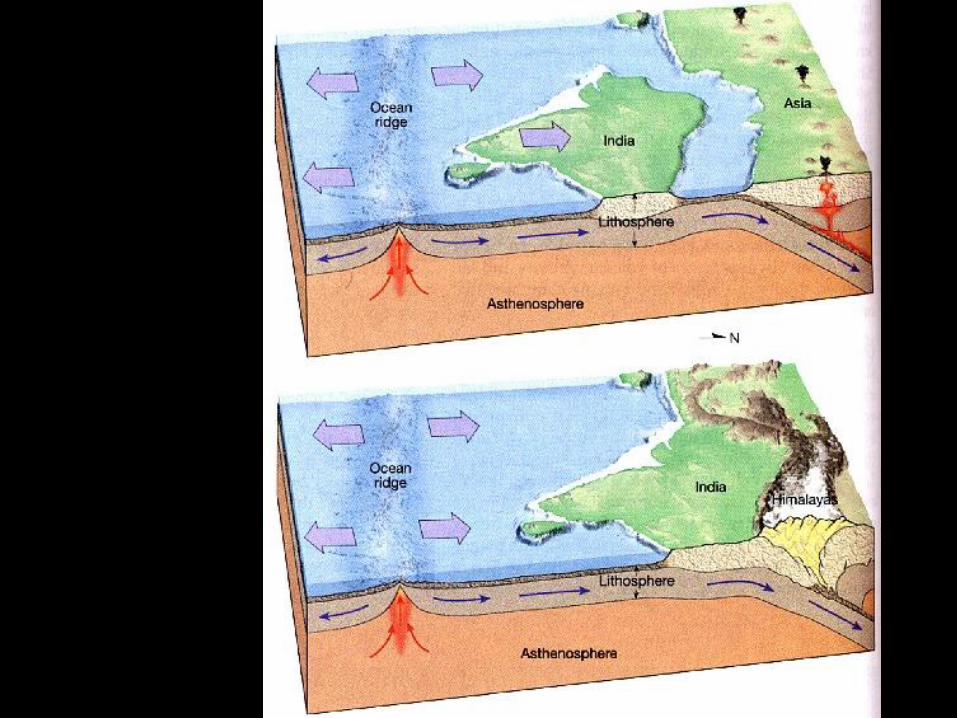
5. Himalayan orogeny, 45-54 my BP
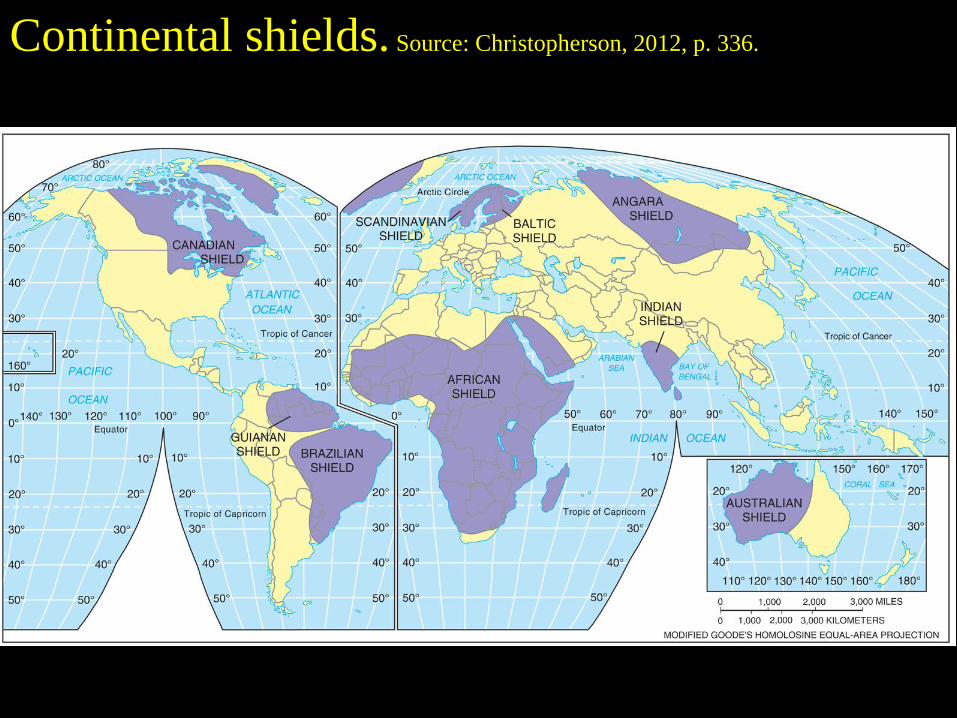
Continental shields. Source: Christopherson, 2012, p. 336.
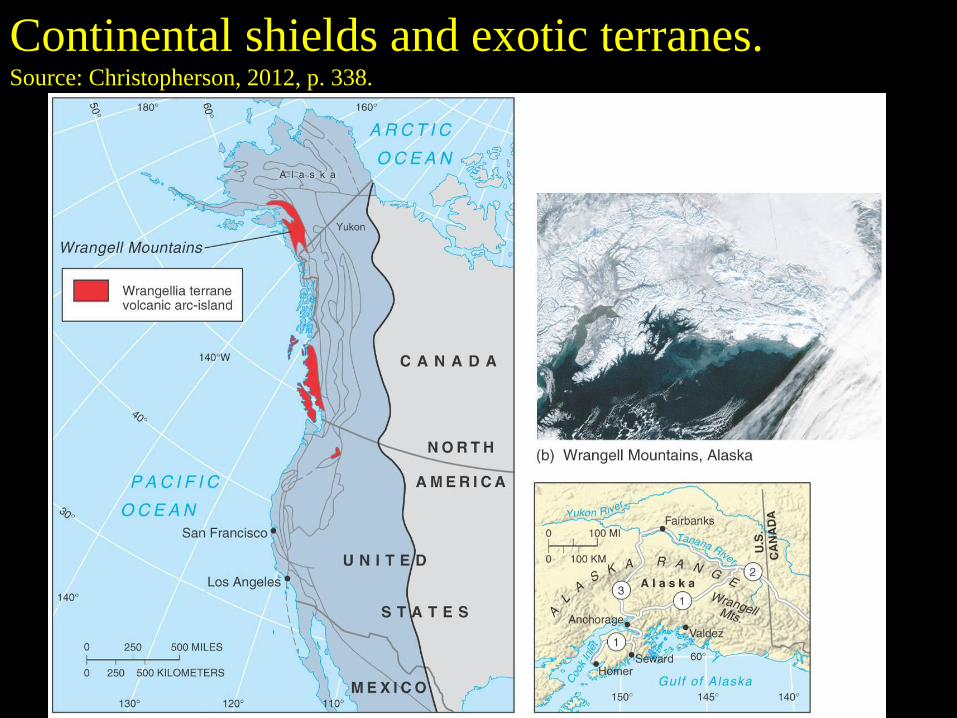
Continental shields and exotic terranes.
Source: Christopherson, 2012, p. 338.
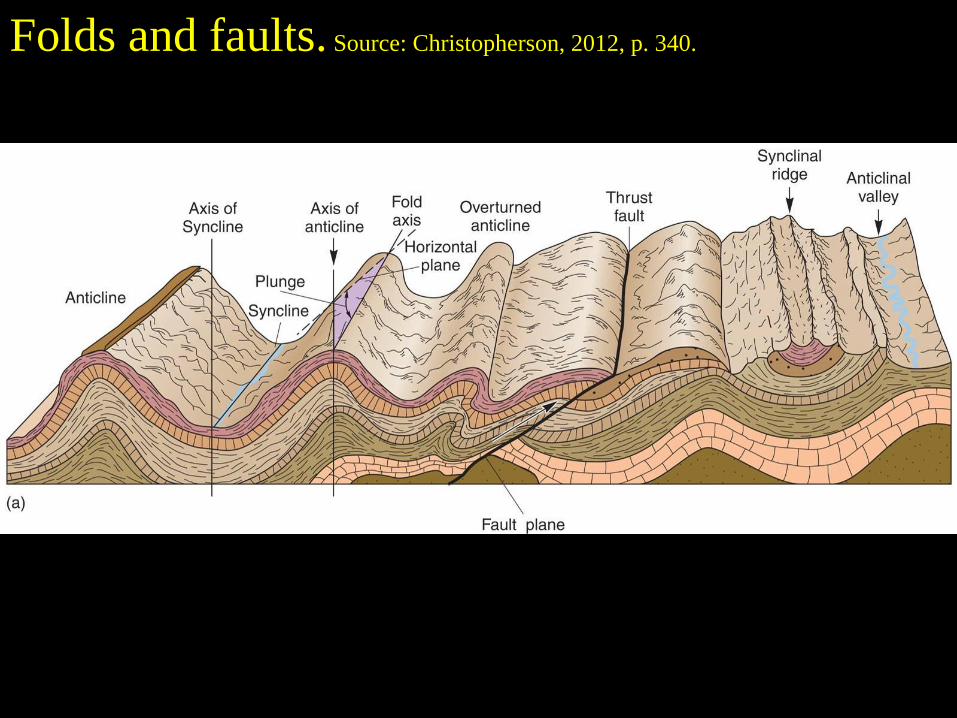
Folds and faults. Source: Christopherson, 2012, p. 340.
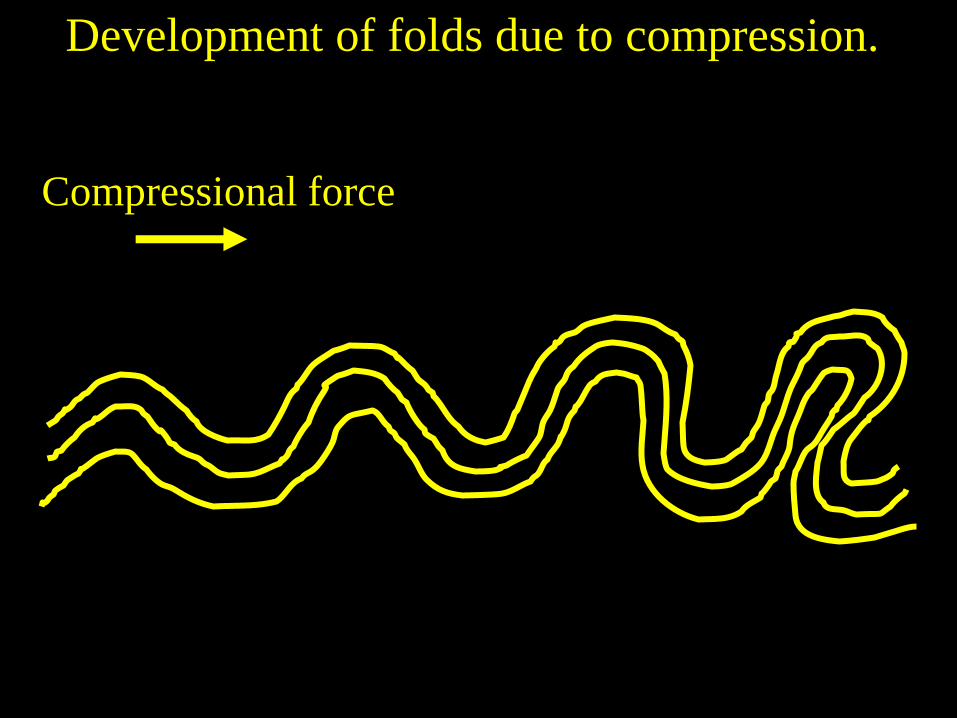
Compressional force
Development of folds due to compression.
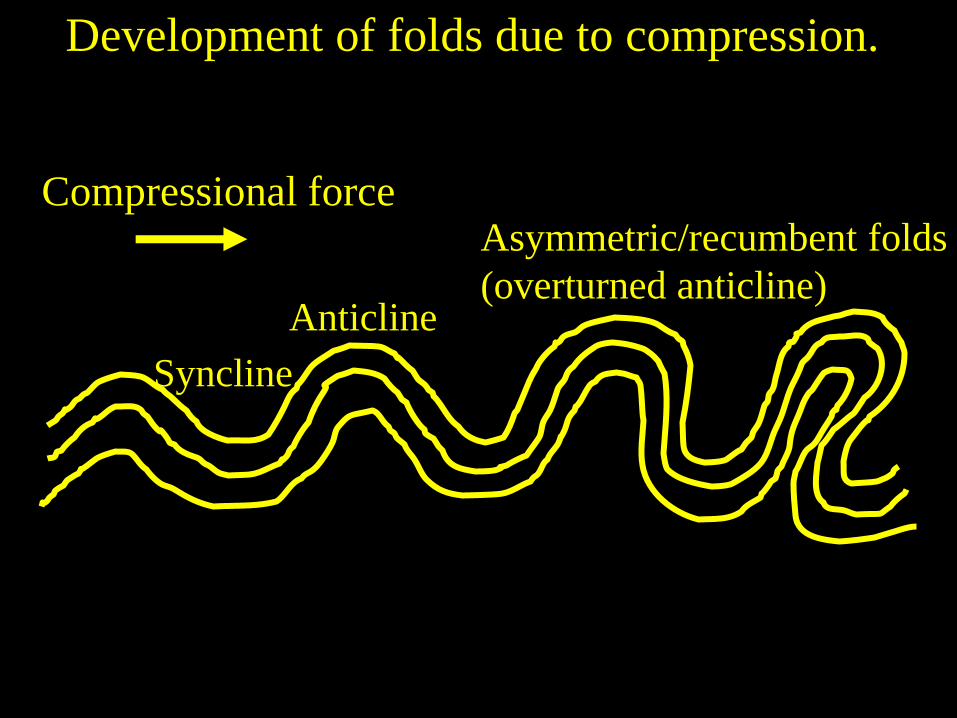
Compressional force
Anticline
Syncline
Asymmetric/recumbent folds
(overturned anticline)
Development of folds due to compression.
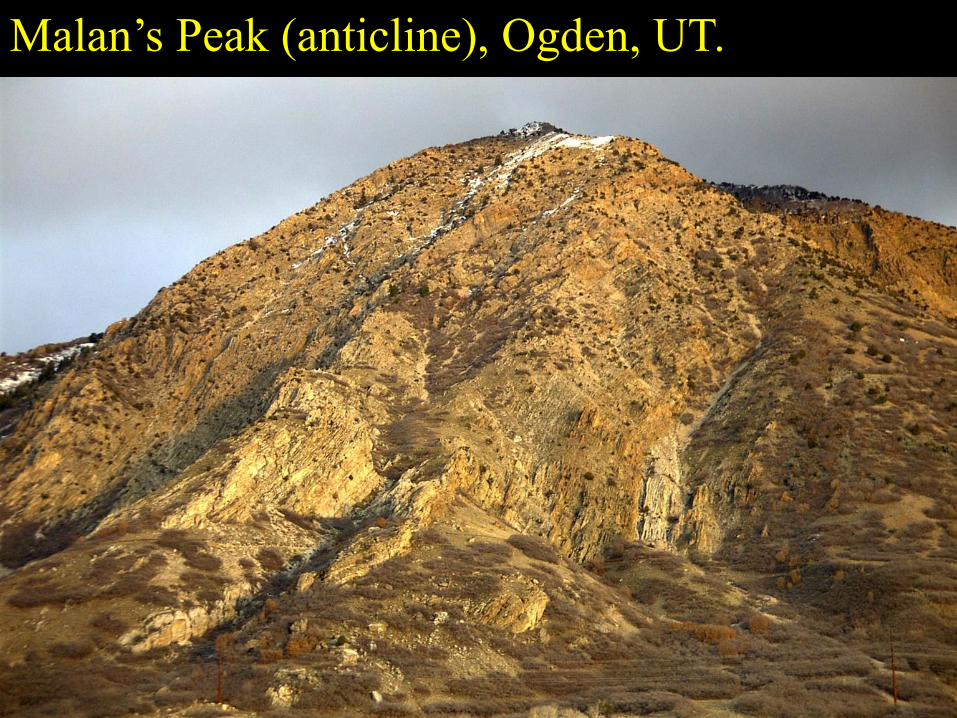
Malan’s Peak (anticline), Ogden, UT.
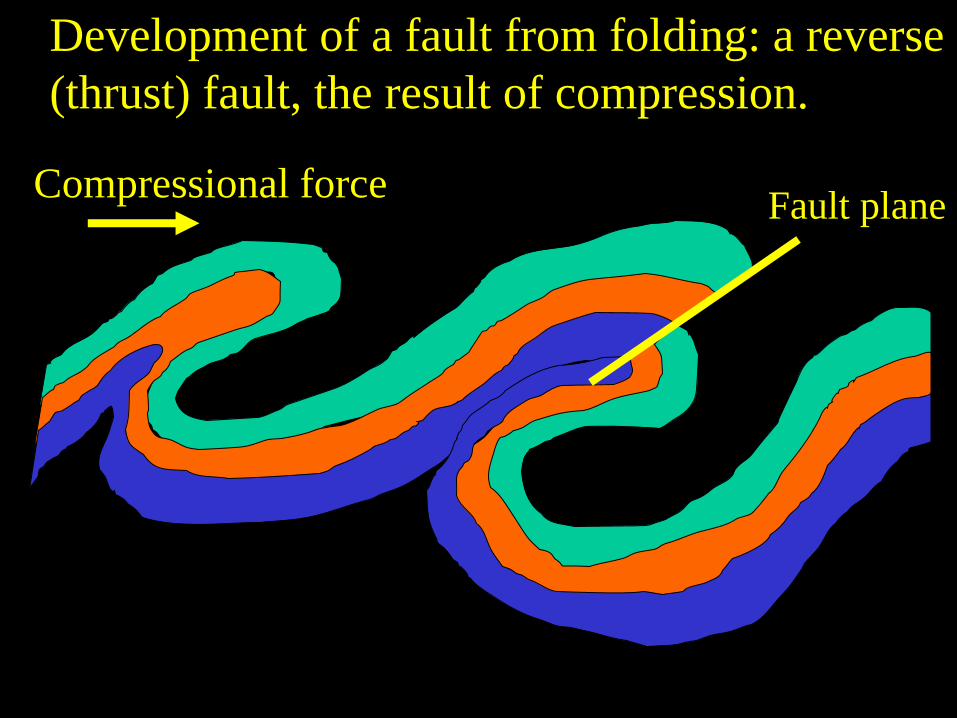
Compressional force Fault plane
Development of a fault from folding: a reverse
(thrust) fault, the result of compression.

Fault plane
Reverse (thrust) fault: result
of compressional stress. Source: Christopherson, 2012, p.342.
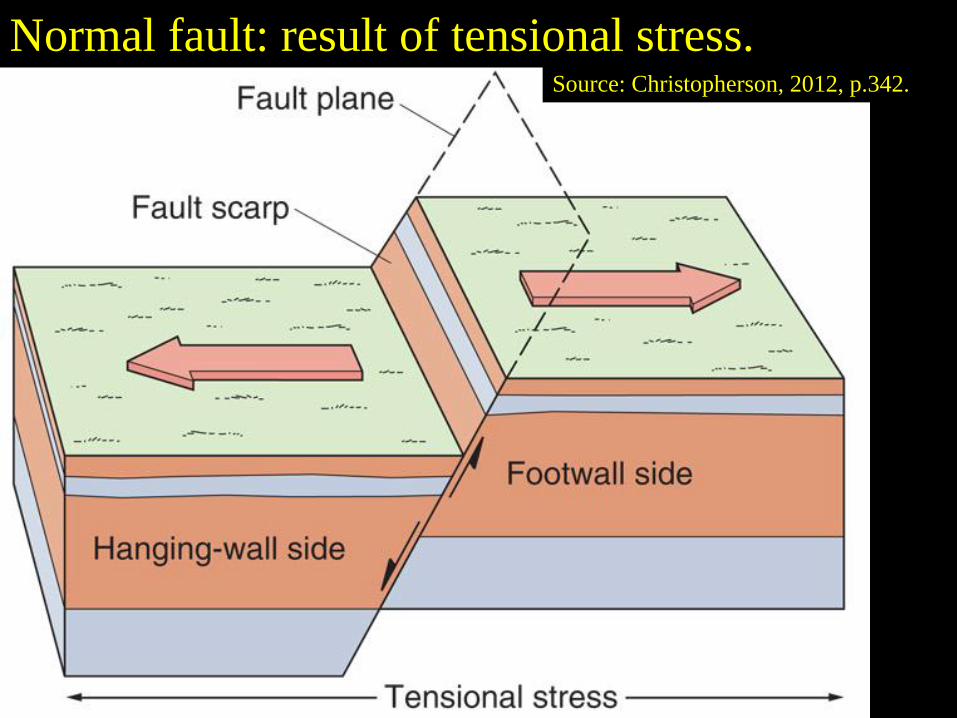
Normal fault: result of tensional stress. Source: Christopherson, 2012, p.342.
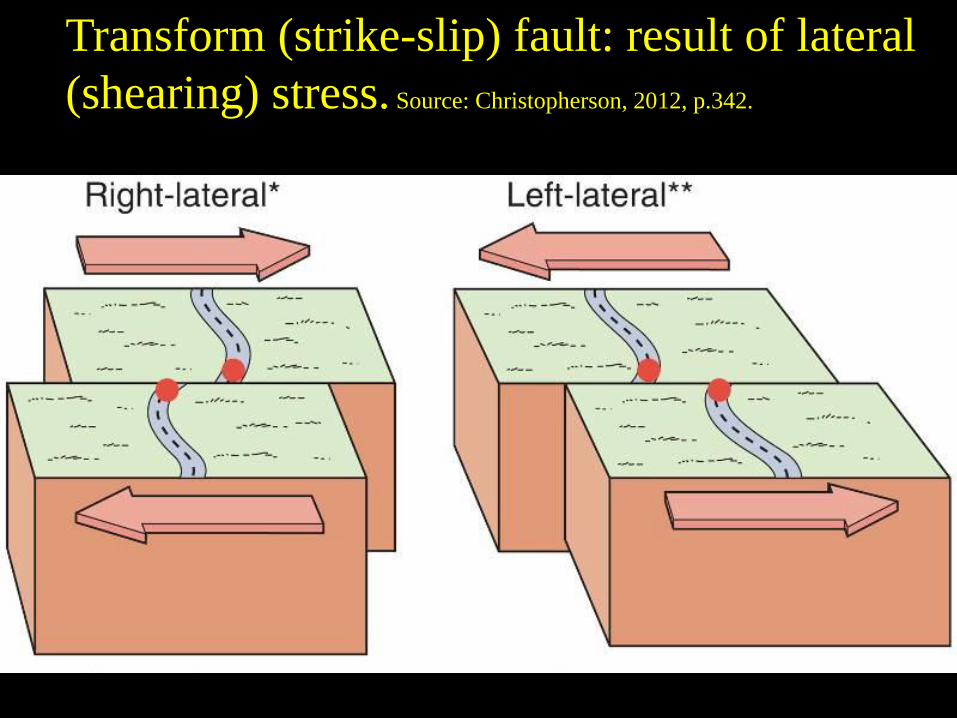
Transform (strike-slip) fault: result of lateral
(shearing) stress. Source: Christopherson, 2012, p.342.
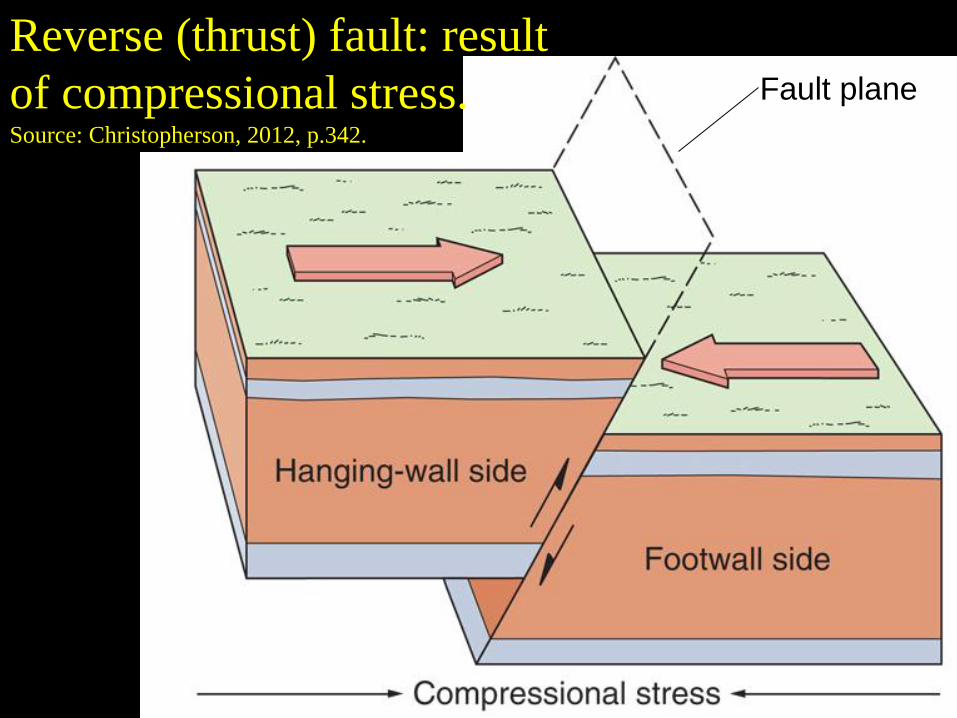
Fault plane
Reverse (thrust) fault: result
of compressional stress. Source: Christopherson, 2012, p.342.
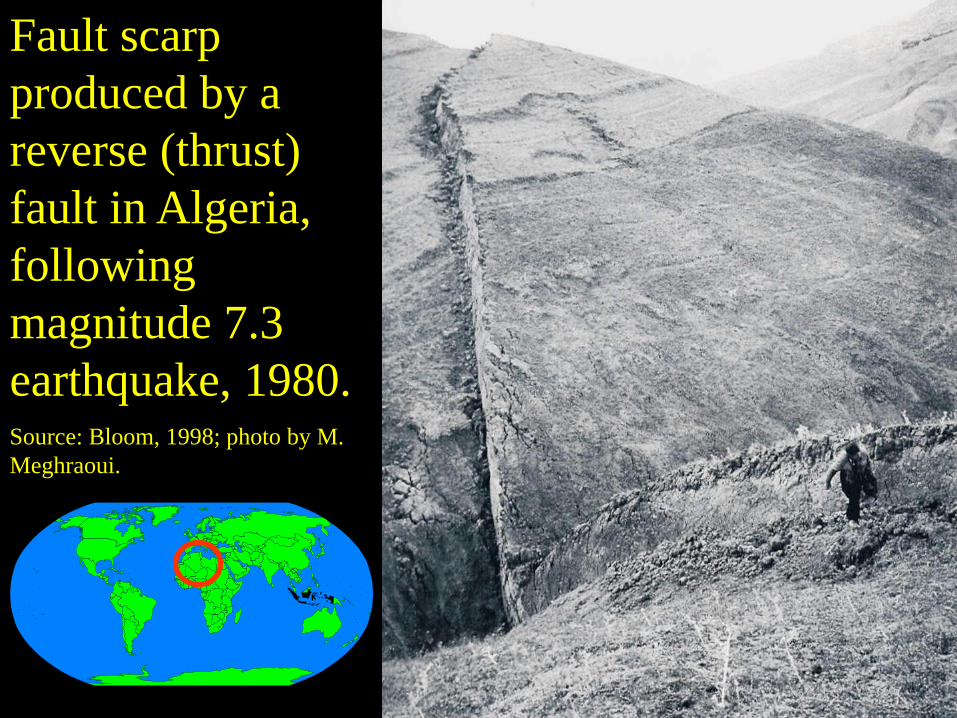
Fault scarp
produced by a
reverse (thrust)
fault in Algeria,
following
magnitude 7.3
earthquake, 1980. Source: Bloom, 1998; photo by M.
Meghraoui.

Normal fault: result of tensional stress. Source: Christopherson, 2012, p.342.
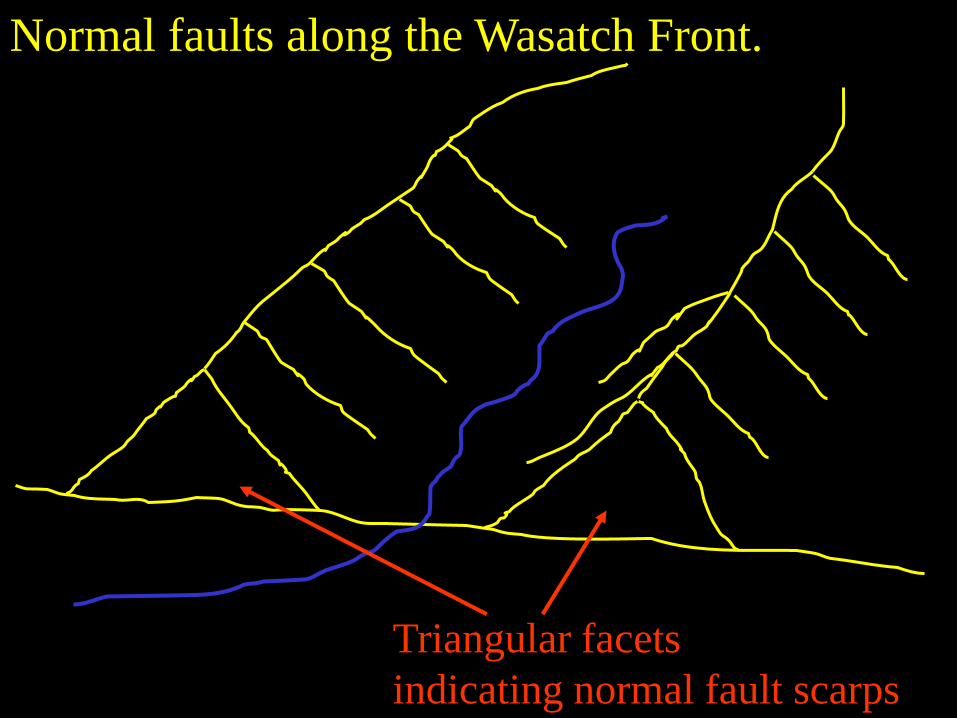
Triangular facets
indicating normal fault scarps
Normal faults along the Wasatch Front.
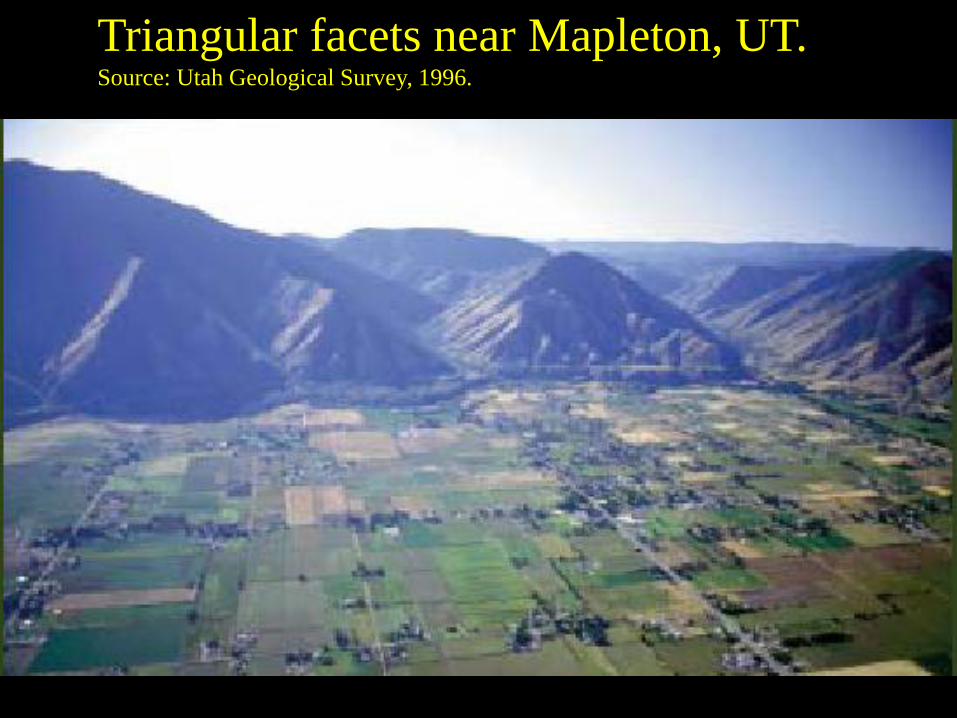
Triangular facets near Mapleton, UT.
Source: Utah Geological Survey, 1996.
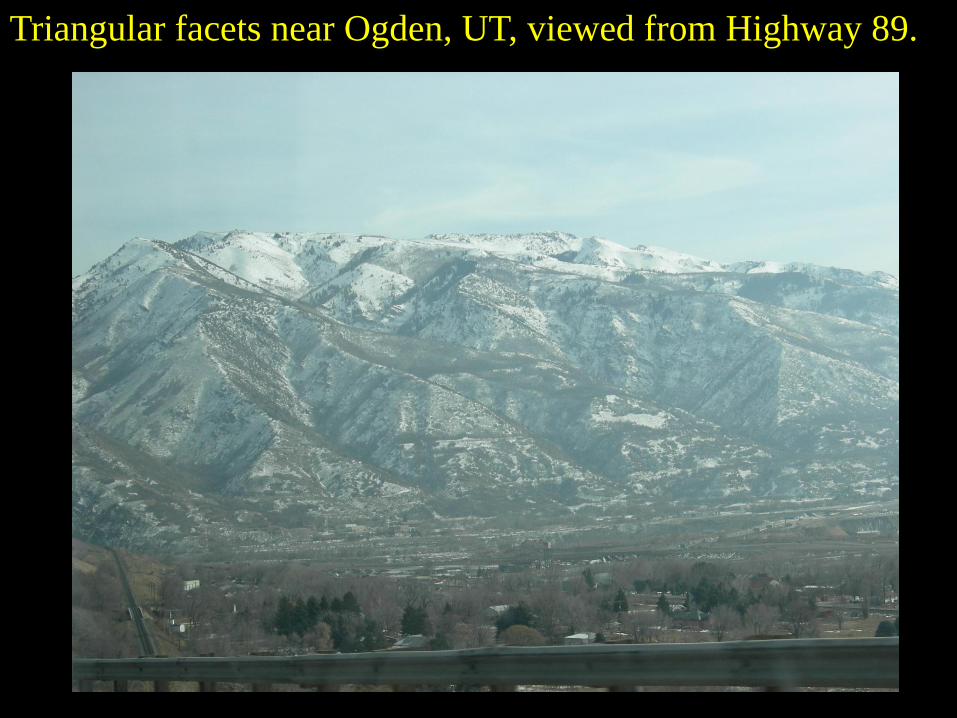
Triangular facets near Ogden, UT, viewed from Highway 89.
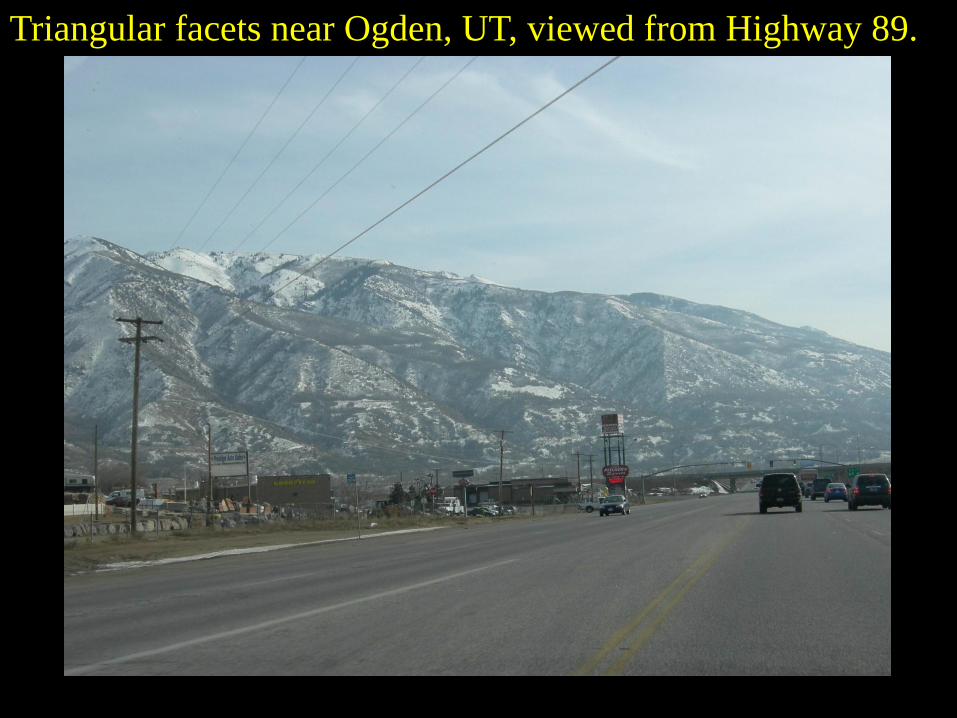
Triangular facets near Ogden, UT, viewed from Highway 89.
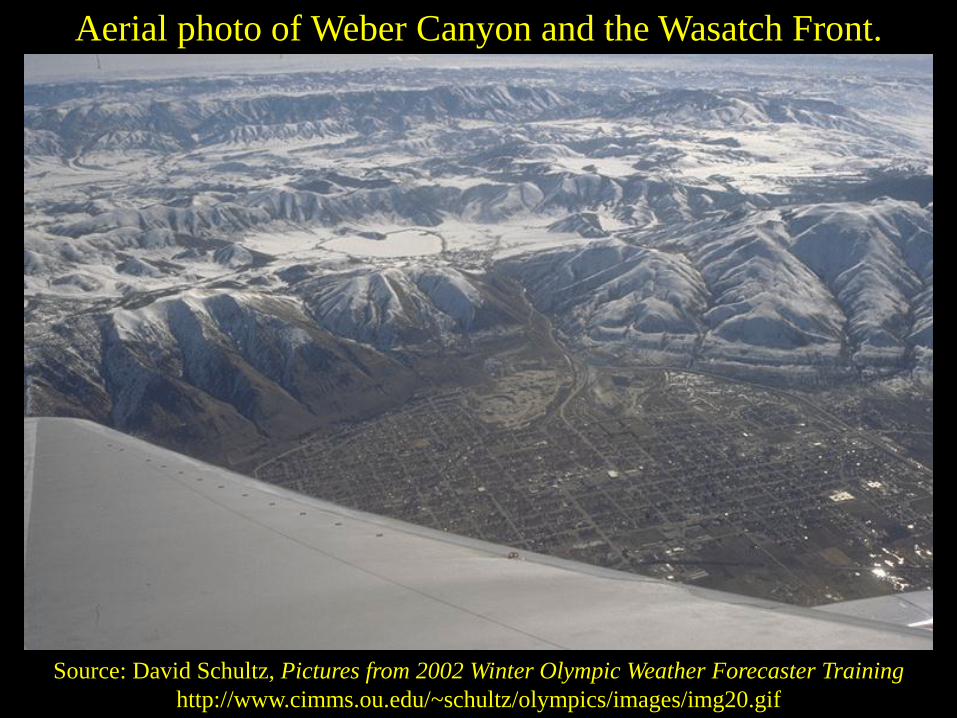
Source: David Schultz, Pictures from 2002 Winter Olympic Weather Forecaster Training
http://www.cimms.ou.edu/~schultz/olympics/images/img20.gif
Aerial photo of Weber Canyon and the Wasatch Front.
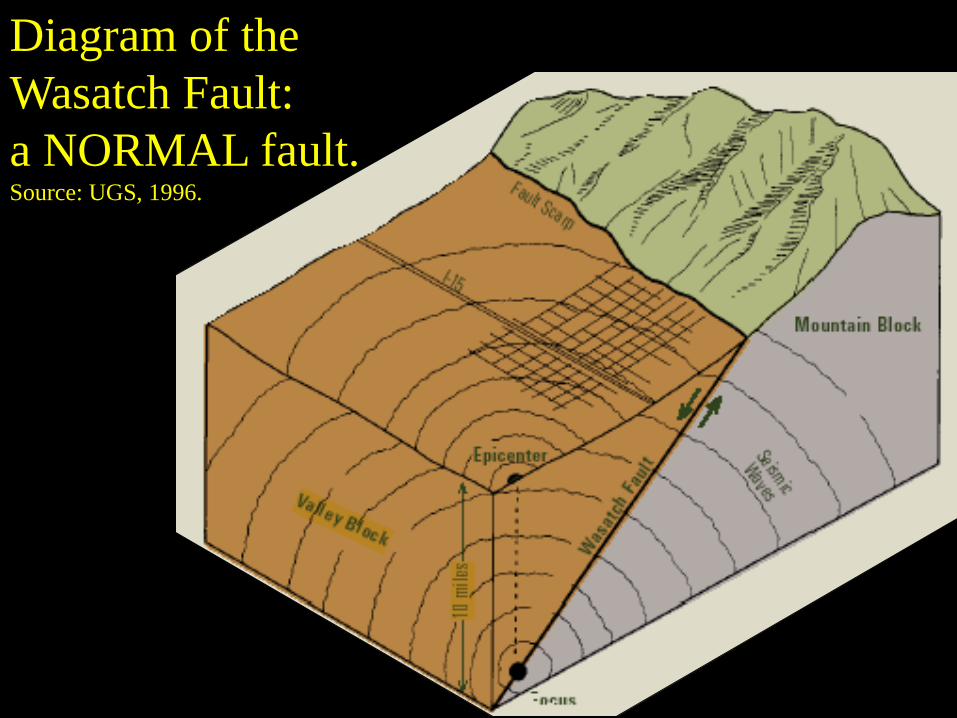
Diagram of the
Wasatch Fault:
a NORMAL fault.
Source: UGS, 1996.
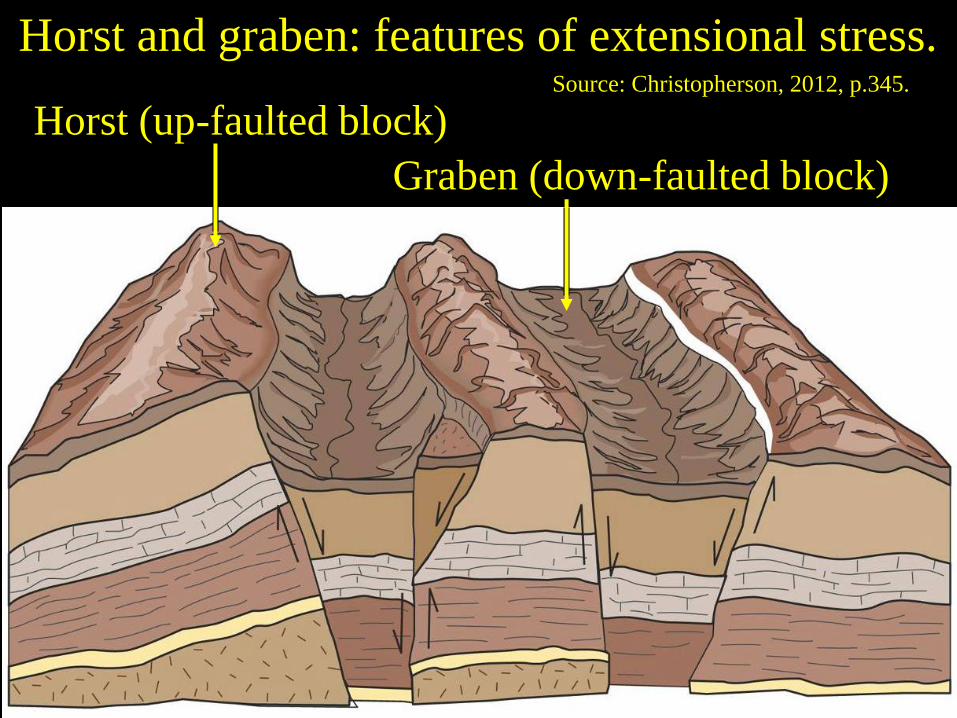
Graben (down-faulted block)
Horst (up-faulted block)
Horst and graben: features of extensional stress. Source: Christopherson, 2012, p.345.
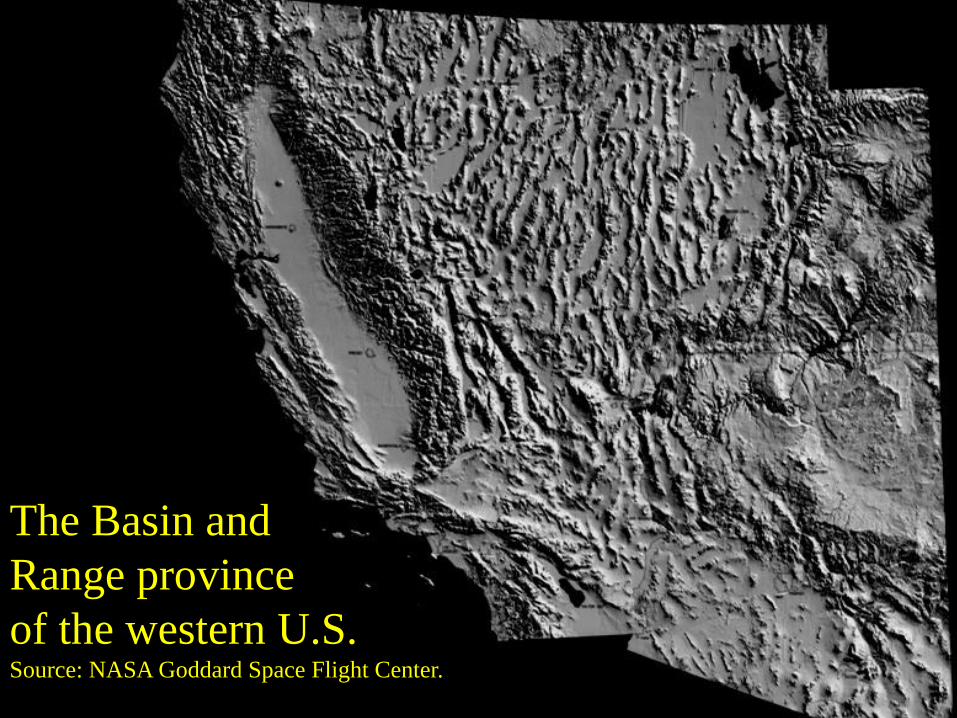
The Basin and
Range province
of the western U.S. Source: NASA Goddard Space Flight Center.

Transform (strike-slip) fault: result of lateral
(shearing) stress. Source: Christopherson, 2012, p.342.
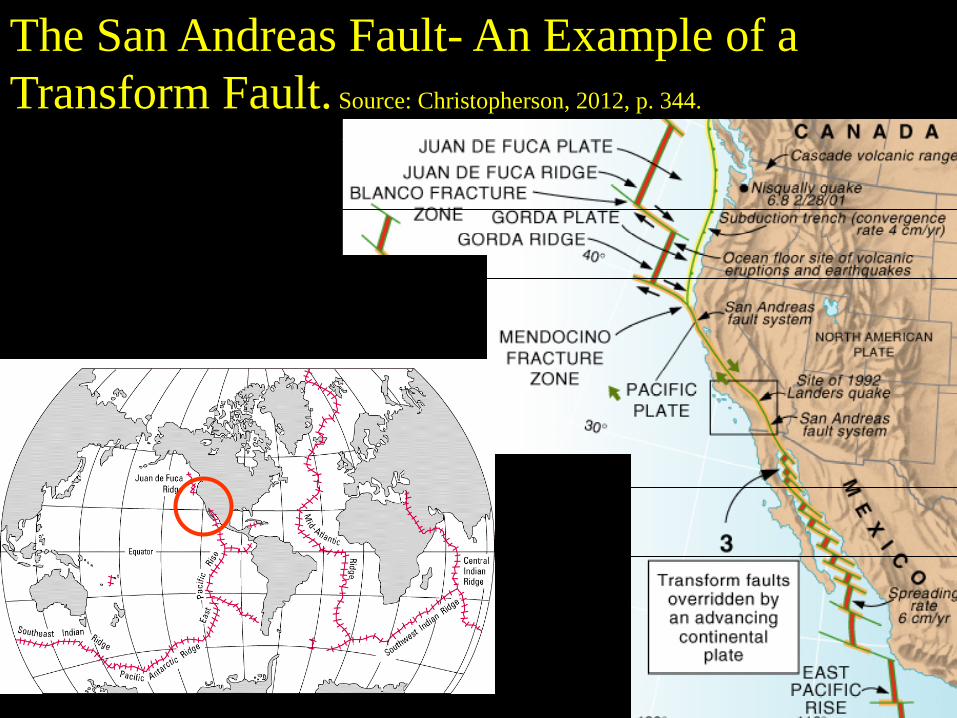
The San Andreas Fault- An Example of a
Transform Fault. Source: Christopherson, 2012, p. 344.
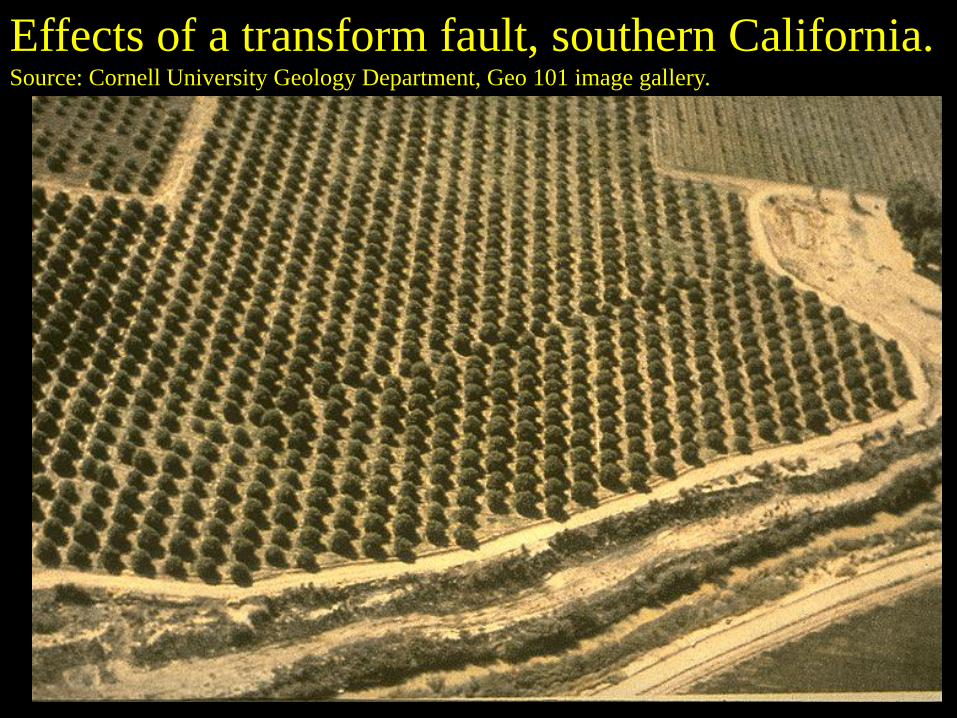
Effects of a transform fault, southern California.
Source: Cornell University Geology Department, Geo 101 image gallery.
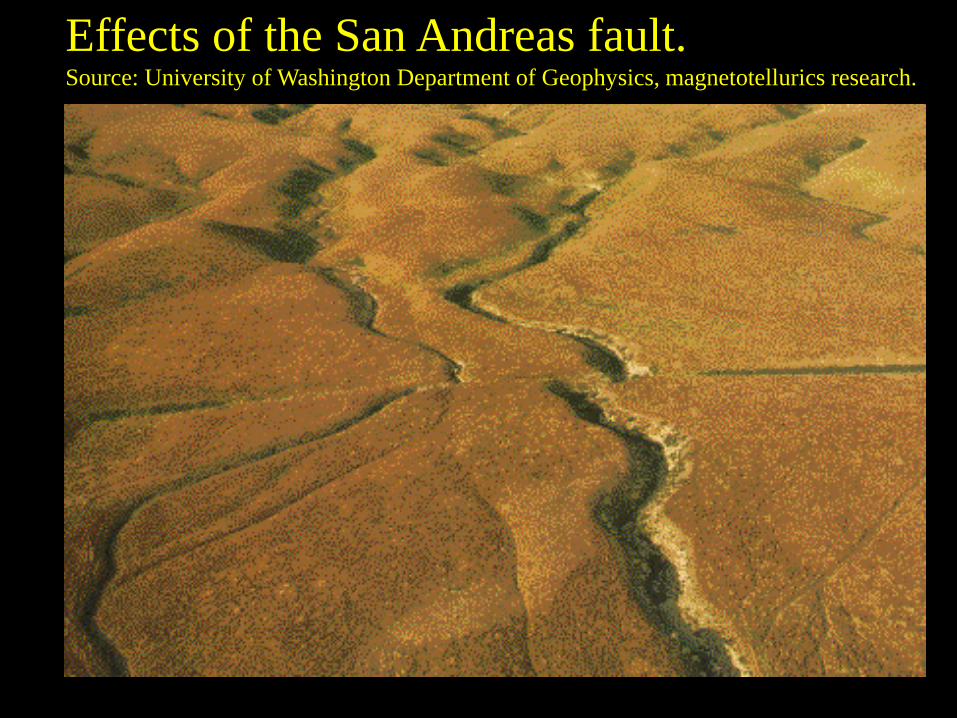
Effects of the San Andreas fault.
Source: University of Washington Department of Geophysics, magnetotellurics research.
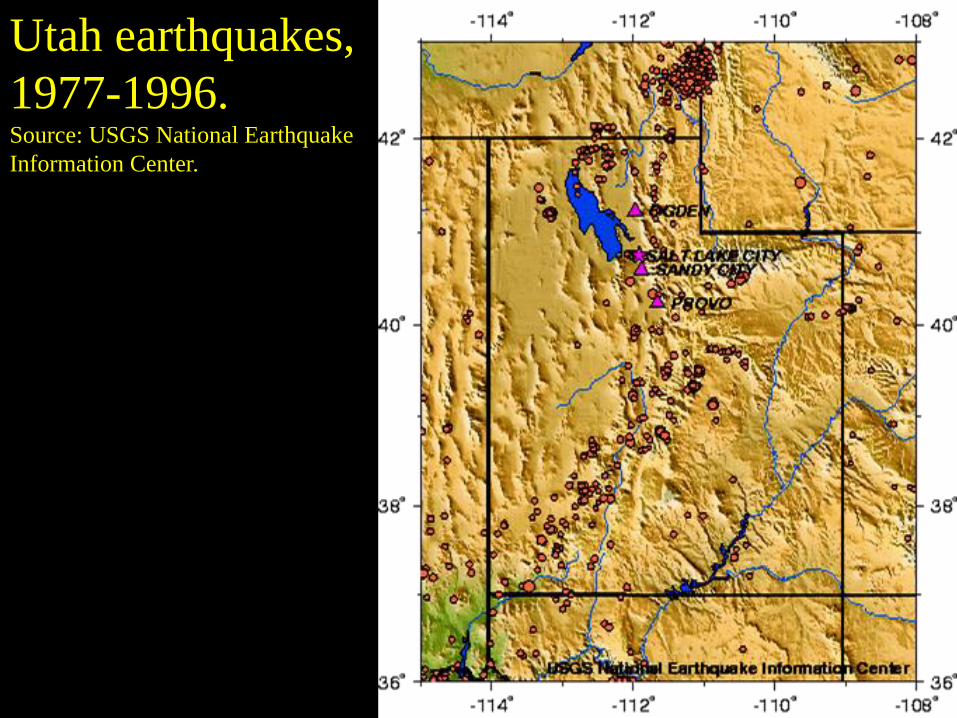
Utah earthquakes,
1977-1996. Source: USGS National Earthquake
Information Center.
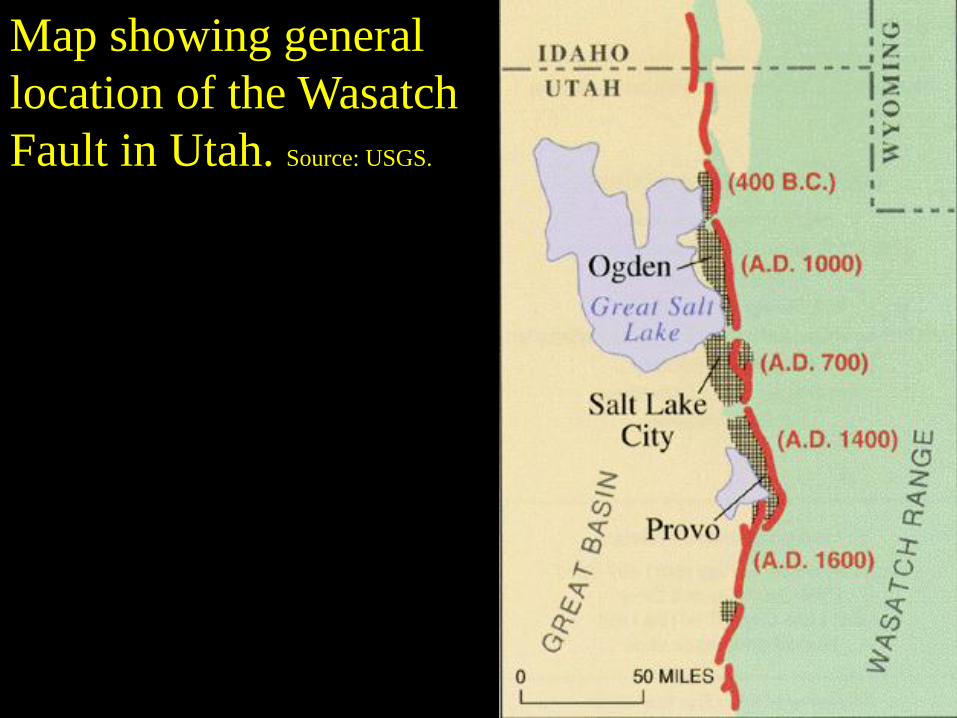
Map showing general
location of the Wasatch
Fault in Utah. Source: USGS.
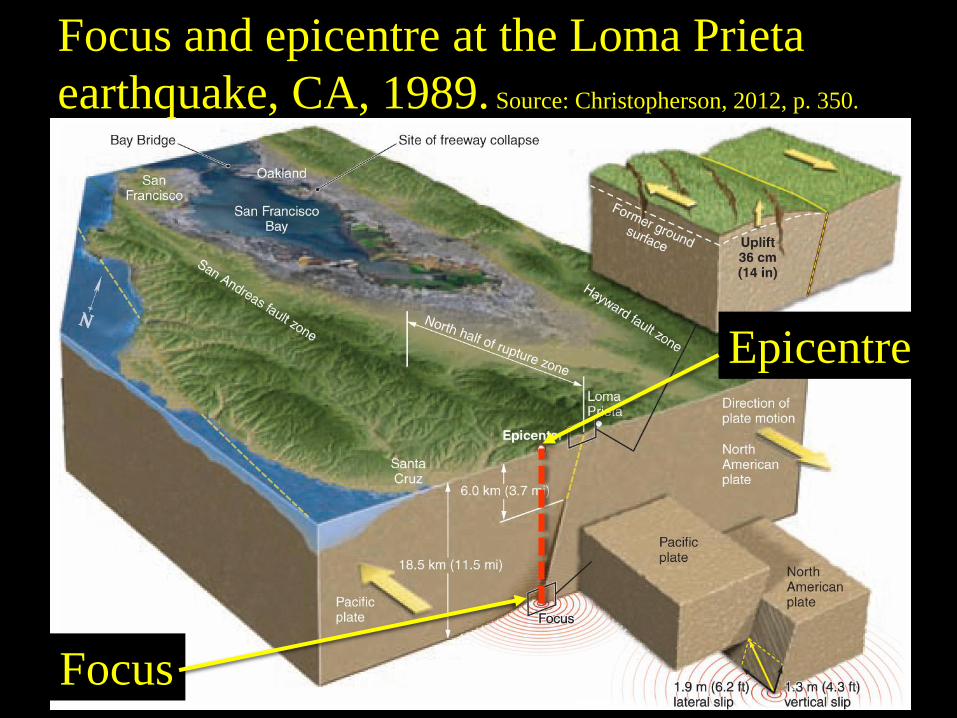
Focus
Epicentre
Focus and epicentre at the Loma Prieta
earthquake, CA, 1989. Source: Christopherson, 2012, p. 350.

Diagram of the
Wasatch Fault:
a NORMAL fault.
Source: UGS, 1996.
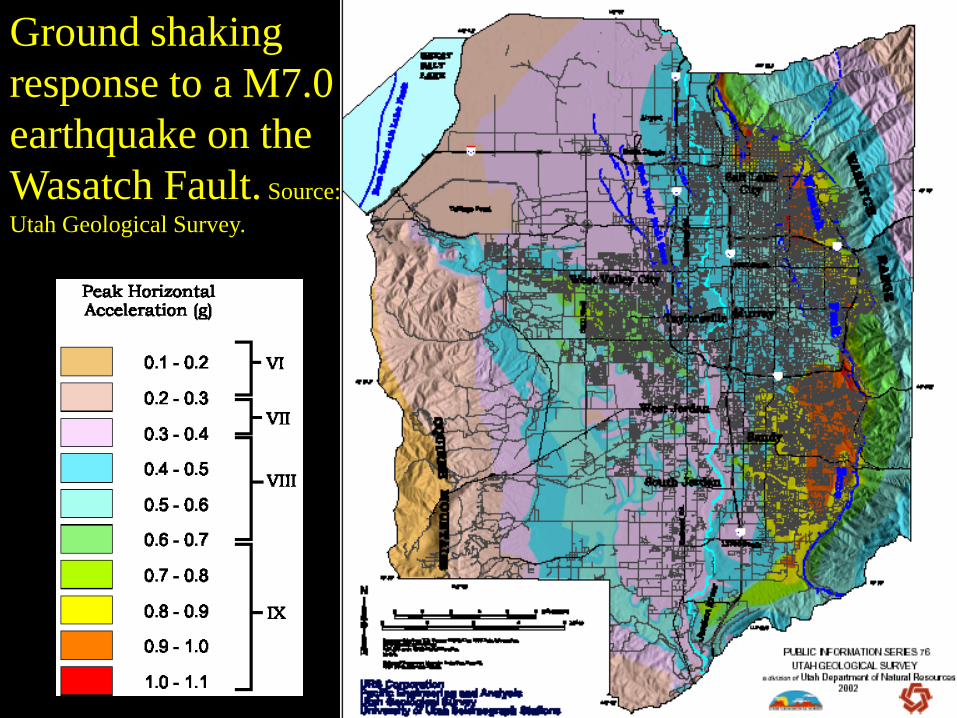
Ground shaking
response to a M7.0
earthquake on the
Wasatch Fault. Source:
Utah Geological Survey.
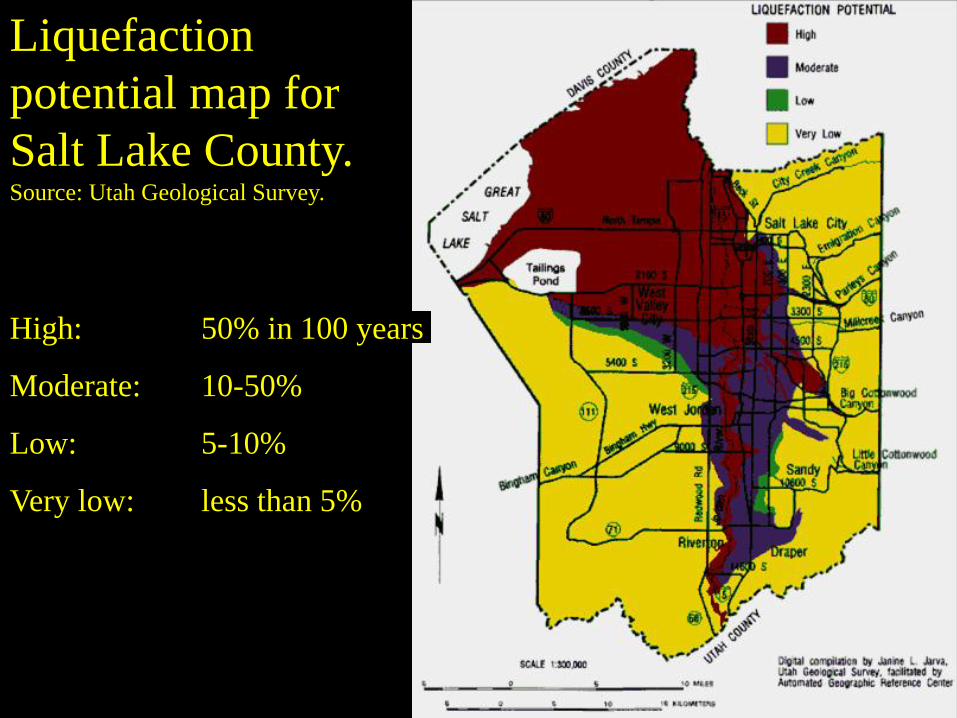
Liquefaction
potential map for
Salt Lake County.
Source: Utah Geological Survey.
High: 50% in 100 years
Moderate: 10-50%
Low: 5-10%
Very low: less than 5%
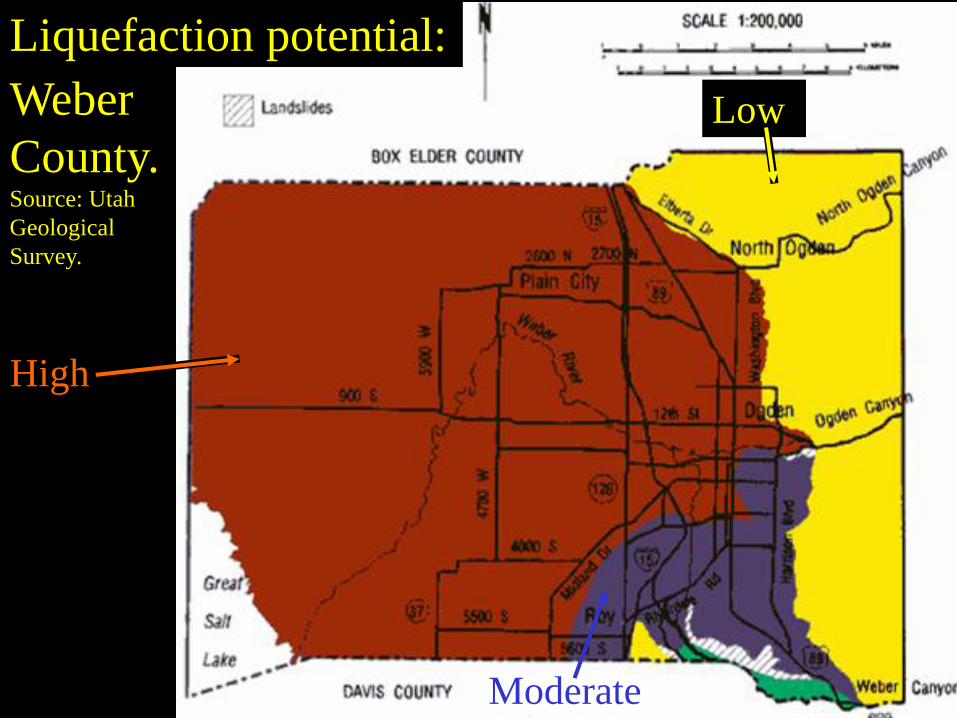
Liquefaction potential:
Weber
County.Source: Utah
Geological
Survey.
High
Moderate
Low
Related Documents